synthesis, structure, spectroscopic properties, and theoretical studies of alkaline earth metal...
TRANSCRIPT

Journal of Molecular Structure 984 (2010) 39–50
Contents lists available at ScienceDirect
Journal of Molecular Structure
journal homepage: www.elsevier .com/ locate /molst ruc
Synthesis, structure, spectroscopic properties, and theoretical studiesof alkaline earth metal complexes of 1,3-bis(carboxymethyl)benzimidazolium
Ling Huang ⇑, Ai-Guo Zhong, Ding-Ben Chen, Duan Qiu, Hua-Ding LiangCollege of Pharmaceutical and Chemical Engineering, Taizhou University, Linhai, Zhejiang 317000, PR China
a r t i c l e i n f o a b s t r a c t
Article history:Received 20 June 2010Received in revised form 13 August 2010Accepted 6 September 2010Available online 24 September 2010
Keywords:Alkaline earth metal1,3-Bis(carboxymethyl)benzimidazoliumCrystal structureLuminescenceTime-dependent density functional theorycalculation
0022-2860/$ - see front matter Crown Copyright � 2doi:10.1016/j.molstruc.2010.09.005
⇑ Corresponding author.E-mail address: [email protected] (L. Huang).
Alkaline earth metal complexes of 1,3-bis(carboxymethyl)benzimidazolium (HL) including [Mg(L)2
(H2O)4]�2H2O (1), [Ca(L)2(H2O)4]�2H2O (2) and [Ba(L)2(H2O)2�2H2O]n (3) have been synthesized by ahydrothermal procedure and characterized by X-ray crystallography, spectroscopy and thermoanalysis.The results of X-ray crystallography revealed that complexes 1 and 2 are neutral monomers, while com-plex 3 is a polymeric species, and the carboxymethyl moiety of the deprotonated ligand (L�) acts as abridge between metal ions. The spectroscopic properties of the complexes were evaluated through den-sity functional theory (DFT) and time-dependent density functional theory (TD DFT) calculations. Theresults revealed that the absorption peaks in UV–Vis spectra were derived from ligand to ligandcharge-transfer transitions (LLCT) and/or (p, p) ? (r*, p*) intraligand charge-transfer (ILCT). HL and HL-based complexes displayed similar emission peaks in the near-UV region due to ligand-based LLCT.The results of the Fukui index of the complexes supported LLCT and ILCT mechanisms. In addition, thecalculated value of the luminescence oscillator strength displayed a linear relationship with the chargedistribution, and the DFT chemical reactivity index, and correlation coefficients (R2) of 0.999 and 0.996were obtained, respectively. Thus, the results revealed that the emission strength of the complex canbe controlled by coordinating the ligand to different metal ions.
Crown Copyright � 2010 Published by Elsevier B.V. All rights reserved.
1. Introduction
The study of the alkaline earth metals has gained recognition asan important field in coordination chemistry and the life sciences.Complexes of alkaline earth metals can provide information on theorganization of molecules and their effect on biological activity [1–7]. For instance, both magnesium and calcium play an essentialrole in biological systems. Magnesium exists solely as the solvatedor complexed dication in a wide range of magnesium complexes;however, calcium is larger than magnesium and is often coordi-nated by more than six ligating atoms [8]. Moreover, barium, atoxic heavy metal, is an antagonist for potassium [9–11]. Thechemistry, structure and biology of metal complexes are depen-dent on the charge and size of the cations [12]. Thus, by studyingthe coordination of metals with various ligands, the binding abili-ties and the roles of the metals in biological systems can be iden-tified. Previous studies on alkaline earth metal complexes havefocused on a-amino acids derivatives, including aspartate, gluta-mate, orontate, pyroglutamate, salicylic acid, 2-aminobenzoic acidor 2-substituted benzoic acids [13–21,8]. Alternatively, the studyof the complexation of other important N-heterocyclic amino acids
010 Published by Elsevier B.V. All r
derived from benzimidazole or imidazole is relatively rare. How-ever, Fei and coworkers have recently investigated alkaline earthmetal complexes of bis(1,3-carboxymethyl)imidazole [22–24].
Bis(1,3-carboxymethyl)imidazole can be synthesized by con-densing formaldehyde, glyoxal and glycine. This reaction may alsooccur in nature and in the browning reactions of food [25,26]. Thedeprotonated monoanion of bis(1,3-carboxymethyl)imidazole pos-sesses two –CH2CO2– moieties that can ligate to a metal [27] andform polymeric frameworks. X-ray studies on the structure ofbis(1,3-carboxymethyl)imidazole complexes revealed that thesecompounds are hydrates that can polymerize in the presence ofwater. In the resultant polymers, the coordination number ofCa2+ and Sr2+ is six and nine, respectively; however, the coordina-tion number of Ba2+ complexes is seven or eight [23]. Strontiumderivatives of bis(1,3-carboxymethyl)imidazole also exist as a hy-drate. In these complexes, water molecules linked by hydrogenbonds form hexagonal sheets, which separate the layers of thecoordinating polymer [24]. Although structural information isnow available for some alkaline earth metals, their spectroscopicproperties have not yet been studied.
To further probe the spectroscopic and chemical behaviour ofalkaline earth metal derivatives, complexes of 1,3-bis(carboxy-methyl)benzimidazolium (HL) and Mg2+, Ca2+ and Ba2+ were syn-thesized, and the crystal structure, spectroscopic properties and
ights reserved.

40 L. Huang et al. / Journal of Molecular Structure 984 (2010) 39–50
thermal properties of the complexes were determined. Further-more, the electronic structure of the complexes and the mecha-nism of spectroscopic absorption and photoluminescence wereexplored by employing quantum mechanical computational toolsfrom density functional theory (DFT) and time-dependent densityfunctional theory (TD DFT).
2. Experimental
2.1. Materials and measurements
Except for 1,3-bis(carboxymethyl)benzimidazolium (HL), whichwas synthesized in the laboratory, all chemicals and solvents usedin the spectroscopic measurements and the preparation of thecomplexes were of analytical grade and were used as received. IRspectra were recorded between 4000 and 500 cm�1 on a Perkin–Elmer FTIR-8400 spectrophotometer, and KBr pellets were usedto analyze solid materials. UV–Vis spectra were recorded on aShimaduzu UV-2401PC spectrometer, and elemental analyses wereperformed on a Perkin–Elmer 2400/II automatic analyzer. Fluores-cence spectra were measured on a F-4500 fluorescence spectro-photometer in the solid state. Differential scanning calorimetrymeasurements and thermogravimetric analyses (DSC-TGA) wereconducted with a TA SDT Q800 analyzer.
2.2. Syntheses of complexes 1–3
2.2.1. Preparation of [Mg(L)2(H2O)4]�2H2O (1)A mixture of Mg(OH)2 (0.2284 g, 1 mmol), HL (0.2342 g,
1 mmol) and 16 mL of H2O was sealed in a Parr Teflon-lined stain-less steel vessel (25 mL) and heated to 130 �C for 1 week. Theresulting solution was filtered, and the filtrate was allowed tostand in air. After 1 day, colourless crystals suitable for X-ray anal-ysis were obtained (yield 30% based on Mg). Elemental analysis ofC22H30MgN4O14: Calcd. (%): C, 44.12; H, 5.06; N, 9.35. Found: C,
Table 1Crystal data and structure refinement parameters for the complexes 1–3.
Code 1
Chemical formula C22H30MgN4O14
Formula weight 598.81Temperature (K) 173(2)Crystal system MonoclinicSpace group P21/n
a (ÅA0
) 5.4051(5)
b (ÅA0
) 11.6483(10)
c (ÅA0
) 20.7607(18)
b (�) 95.3850(10)
V (ÅA0
3) 1301.3(2)
Z 2Dcalc. (g mL�3) 1.528Absorption coefficient (mm�1) 0.149F(0 0 0) 628Crystal size (mm) 0.45 � 0.40 � 0.40Theta range for data collection (�) 1.97–28.37Index ranges �7 6 h 6 7
�13 6 k 6 15�27 6 l 6 27
Reflections collected 11787Independent reflections (Rint) 3237(0.0537)Absorption correction Semi-empirical from equivalentsMax. and min. transmission 0.9428 and 0.9359Refinement method Full-matrix least-squares on F2
Data/restraints/parameters 3237/0/247Goodness-of-fit on F2 1.053R1, wR2 [I > 2r(I)] 0.0349, 0.0909R1, wR2 (all data) 0.0401, 0.0940Largest diff. peak and hole (e �3) 0.351 and �0.262
44.13; H, 5.21; N, 9.49. IR (KBr, cm�1) 3429 br; 3309 br; 3078 br;1647 s; 1610 vs; 441 w, 1396 s; 1367 m; 1352 m; 1330 s; 1184s; 1130 w; 980 w; 781 m; 758 m; 681 m; 615 m; 565 1 m; 422w. UV–Vis (H2O): kmax 1 = 256 nm (e = 150,600 M�1 cm�1); kmax
2 = 263 nm (e = 159,800 M�1 cm�1); kmax 3 = 270 nm (e = 179,700M�1 cm�1), kmax 4 = 277 nm (e = 150,300 M�1 cm�1).
2.2.2. Preparation of [Ca(L)2(H2O)4]�2H2O (2)Complex 2 was prepared according to a procedure that was
similar to the synthesis of 1. The combined filtrates were evapo-rated to dryness to produce colourless crystals suitable for X-rayanalysis (32% yield based on Ca). Elemental analysis of C22H30-CaN4O14: Calcd. (%): C, 42.99; H, 4.93; N, 9.11. Found: C, 43.03;H, 5.04; N, 9.23. IR (KBr, cm�1): 3433 br; 3300 br, 3136 s; 1649s; 1610 vs; 1566 m; 1396 s; 1354 m; 781 m; 758 m; 673 m;617 m; 567 m, 413 w. UV–Vis (H2O): kmax 1 = 256 nm(e = 140,500 M�1 cm�1); kmax 2 = 263 nm (e = 149,400 M�1 cm�1);kmax 3 = 270 nm (e = 168,100 M�1 cm�1), kmax 4 = 277 nm(e = 140,500 M�1 cm�1).
2.2.3. Preparation of {[Ba(L)2(H2O)2]�2H2O}n (3)Complex 3 was also synthesized by the hydrothermal method
under conditions identical to those of 1 and 2, except that Ba(OH)2
(0.4732 g, 1.5 mmol), HL (0.3514 g, 1.5 mmol) and water (12 mL)were employed. The filtrate was allowed to stand in air, and paleyellow crystals suitable for X-ray analysis were obtained after1 month (38% yield based on Ba). Elemental analysis of C44H70Ba2-
N8O31: Calcd. (%): C, 35.66; H, 4.77; N, 7.56. Found: C, 35.68; H,4.92; N, 7.61. IR (KBr, cm�1) 3392 br; 3022 br; 1618 s; 1595s;1388 s; 1362 m; 1302 m; 1282 m; 1192 m; 1035 w; 976 m;746 m; 507 m; 423 w. UV–Vis (H2O): kmax 1 = 255 nm(e = 115,100 M�1 cm�1); kmax 2 = 263 nm (e = 120,400 M�1 cm�1);kmax 3 = 270 nm (e = 135,100 M�1 cm�1), kmax 4 = 277 nm (e =115,200 M�1 cm�1).
2 3
C22H30CaN4O14 C44H66Ba2N8O31
614.58 1481.76173(2) 296(2)Monoclinic MonoclinicP21/n C2/c5.4871(5) 19.2991(15)
11.5926(11) 19.1066(15)
21.428(2) 8.9257(7)
93.1860(10) 106.990(3)1360.9(2) 3147.6(4)
2 21.500 1.5630.308 1.335644 15000.50 � 0.40 � 0.35 0.45 � 0.35 � 0.301.90–26.00 1.53–25.00�6 6 h 6 6 �22 6 h 6 22�14 6 k 6 14 �22 6 k 6 21�26 6 l 6 26 �10 6 l 6 1010457 112332683(0.0762) 2778(0.0244)Semi-empirical from equivalents Semi-empirical from equivalents0.8999 and 0.8613 0.6721 and 0.5749Full-matrix least-squares on F2 Full-matrix least-squares on F2
2683/0/247 2778/1/2001.057 1.0990.0312, 0.0792 0.0485, 0.13500.0339, 0.0806 0.0502, 0.13580.322 and �0.402 1.194 and �0.877

Table 3The bond distances and angles (Å, �) of the complexes (1–3).
Complex 1Mg1–O5 2.060(8) Mg1–O1 2.096(7) Mg1–O6 2.085(8)O5–Mg1–O1 91.2(3) O5–Mg1–O6i 87.75(4) O5–Mg1–O6 92.3(4)O6–Mg1–O1 93.9(3) O5i–Mg1–O1 88.8 (3) O6–Mg1–O1i 86.1(3)
Complex 2Ca1–O1 2.327(9) Ca1–O5 2.333(1) Ca1–O6 2.347(1)O1–Ca1–O6i 85.9(3) O1i–Ca1–O5 90.5(4) O5–Ca–O6 97.1(4)O1–Ca1–O6 94.1(3) O5i–Ca1–O6 82.9(4) O1–Ca1–O5 89.5(4)
Complex 3Ba1–O1 2.881(4) Ba1–O2 2.815(4) Ba1–O5 2.793(6)Ba1–O6 2.832(1) Ba1–Oi 2.713(4)O1i–Ba1–O1ii 152.7(2) O1i–Ba1–O5 75.1(2) O1ii–Ba1–O5 82.3(2)O5iii–Ba1–O5 68.5(3) O1i–Ba1–O2 118.9(1) O1ii–Ba1–O2 71.1(1)O5iii–Ba1–O2 136.3(2) O5–Ba1–O2 80.3(2) O2–Ba1–O2iii 140.8 (2)O1i–Ba1–O6 95.2(2) O1ii–Ba1–O6 112.1(3) O5iii–Ba1–O6 149.0(3)O5–Ba1–O6 140.8(3) O2–Ba1–O6 71.5(3) O2i–Ba1–O6 69.9(3)
L. Huang et al. / Journal of Molecular Structure 984 (2010) 39–50 41
2.3. Determination of the X-ray crystal structure
All X-ray crystallographic data were collected on a Bruker AXSSMART APEX II CCD diffractometer with graphite monochromatedMo Ka (k = 0.71073 Å) radiation by employing the u/x scan tech-nique. The structures were solved by a direct method and refinedby a full-matrix least-squares procedure based on F2 using SHEL-XTL software [28,29]. To obtain the structure of 3, SADABS soft-ware was used to apply an empirical absorption correction to theX-ray data [30]. Anisotropic thermal parameters were assigned toall non-hydrogen atoms. All hydrogen atoms in 1 and 2 were gen-erated geometrically. In 3, oxygen atom O(6) was disordered; thus,one hydrogen atom in the water molecule was not generated. Allother hydrogen atoms were included in calculated positions andrefined under riding mode. Crystallographic data and experimentaldetails of the structures are provided in Table 1.
O1ii–Ba1–O1 114.9(1) O6–Ba1–O6iii 18.1(4) O1i–Ba1–O1 74.0(1)O2–Ba1–O1 45.6(1) O1i–Ba1–O1ii 114.9(1) O6–Ba1–O1 66.1(3)O5–Ba1–O1 74.8(2) O5iii–Ba1–O1 140.3(2) O2iii–Ba1–O1 119.6(1)O1–Ba1–O1 144.3(2) O6iii–Ba1–O1 78.5(3)
Symmetry codes: (i) –x, –y + 2, –z for 1 and 2; (i) –x, –y + 1, –z + 1; (ii) x, –y + 1, z + 1/2; (iii) –x + 1, y, –z + 3/2 for 3.
2.4. Computational method
Optimized calculations of HL and compounds 1–3 in the groundstate (S0) were conducted at the DFT B3LYP/6-311++G(d, p) level[31,32] within Gaussian 03W software [33]. Frequency calculationswere performed to verify the optimized structures (Fig. 1), and theresults indicated that the obtained structures were an energy min-imum, and imaginary frequencies were not observed. Absorptionspectra of the above structures were obtained by applying time-dependent density functional theory (TD-DFT B3LYP) [34–38]and the 6-311+G(d) basis set. The molecular structures of the firstsinglet excited state (S1) of HL and 1–3 were optimized by HF CIS/6-31+G(d) [39]. The electroluminescent (EL) peaks and correspond-ing emission spectra were obtained by applying TD DFT/6-311++G(d, p) [40]. The DFT-optimized structures (Table 2)concurred with the experimental X-ray structure (Table 3), imply-
Fig. 1. Structures of the ligand (left) and the complexes
Table 2Partially optimized geometric structural parameters (bond distances R (ÅA
0
), band angles A
States Compounds R(1, 6) R(2, 3) A(1, 2, 3)
S0 HL 1.382 1.399 121.91 1.377 1.392 121.92 1.384 1.394 122.33 1.38 1.393 121.9
S1 HL 1.552 1.355 122.81 1.561 1.345 121.92 1.572 1.343 122.53 1.581 1.357 121.9
S0 at the DFT B3LYP/6-311++G(d, p) level and S1 by HF CIS/6-31+G* level.a DD is the difference of imidazole-phenyl ring dihedral angles between of the S0 and
ing that the theoretical method employed for the geometric opti-mizations of the system were adequate.
To understand the differences between the photoluminescentemission spectra of the complexes and the ligand (HL), conceptualDFT reactivity indices were employed. In DFT [41–44], the chemi-cal potential (l) and hardness (g) are defined as l = �v = (oE/oN)tand g = (@2E/oN2)t = (ol/oN)t, where E is the total energy of thesystem, N is the number of electrons in the system and t is theexternal potential, respectively [41–48]. According to Mulliken,l = �v = �(1/2) (I + A) and g = I � A, where I and A are the first
(right). Hydrogen atoms are omitted for clarified.
and dihedral angles D (�) of the compouds).
A(2, 1, 7) D(4, 3, 2, 1) D(2, 1, 6, 7) DDa
106.5 177.8 179.4 –105.9 179.6 179.4 –106.6 178 179.2 –106.1 178.4 179.1 –
106.5 170.4 177.9 1.5105.9 172.5 178.5 0.8106.7 173.6 178.8 0.4106.2 175.8 179 0.1
S1 state.

42 L. Huang et al. / Journal of Molecular Structure 984 (2010) 39–50
ionization potential and electron affinity, respectively. Recently,Ayers and co-workers [43,49–52] proposed two new reactivityindices to quantify the nucleophilic and electrophilic capabilitiesof a leaving group (nucleofugality: DEn � �A + x = (l + g)2/2g,electrofugality: DEe � I + x = (l � g)2/2g) [53–55]. To explain thedifference between the charge densities of states, differentiatinga global reactivity indicator with respect to v(r) to obtain a localreactivity indicator. Differentiating the chemical potential (l) withrespect to v(r) to obtain the Fukui functions, f(r) [56]. Differentiat-ing the chemical hardness (g) with respect to v(r) to obtain the Fu-kui functions, f(2)(r) [57,58]. These local reactivity indicators canthen be condensed to atomic sites. To obtain the condensed naturalorbital charge distribution of the complexes, a natural bond orderanalysis (NBO) was conducted. Along with the results of the NBO,reactivity indices from the DFT framework, including l, g, x,DEn, and DEe, were used to appraise the luminescent emissionspectra of HL and 1–3.
3. Results and discussion
3.1. The crystal structure of the complexes
3.1.1. Mg(L)2(H2O)4�2H2O (1)As shown in Fig. 2, 1 is mononuclear and contains discrete neu-
tral [Mg(L)2(H2O)4] entities. The central Mg2+ ion lies on a crystal-lographic inversion centre and is coordinated by one carboxylate Oatom from each deprotonated ligand (L�), as well as four O atomsfrom different water molecules. The deprotonated ligands of com-plex 1 occupy the trans position of the metal ion complex. The[MgO2O4] octahedron is slightly distorted, and the Mg–Oaqua bondlengths are shorter than the Mg–Ocarboxylate bonds (Table 3). Thebond angles around the central Mg2+ ion vary from 87.8(4)� to180�. The observed deviation from 90�/180� is indicative of aslightly distorted octahedral configuration. The Mg–O bond dis-tances in 1 agree with the values found in octahedral Mg2+ com-plexes containing monodentate carboxylic acid and aqua ligands[14,59–62]. In the ligand system, the bond lengths of the imidazo-lium ring range from 1.332(1) to 1.400(1) Å, which is comparableto a conjugated double bond [63], indicating that the zwitterionicstructure of the ligand remained intact [64]. This phenomenonwas also found in the free ligand (HL).
As shown in Fig. 3, the lattice waters are clathrated in the inter-space and are involved in hydrogen bonds via O1W–H1B� � �O4 andO1W–H1A� � �O2. Moreover, the aqua ligands act as intermolecularhydrogen-bond donors to carboxylate O atoms. The benzimidazo-lium rings between adjacent ligands are separated with a face-to-face distance of ca. 3.31 ÅA
0
, suggesting the presence of p–p stack-ing interactions. These supramolecular interactions extend themolecules into a three-dimensional network and play a critical rolein the stability of the crystal lattice.
Fig. 2. Perspective view of coordination structure in 1 and 2 (M stands for Mg1 in
3.1.2. Ca(L)2(H2O)4�2H2O (2)The structure of 2 is similar to that of 1 (Fig. 2). The Ca2+ ion lies
on a crystallographic inversion centre and is coordinated by twocarboxylate O atoms and four aqua O atoms in a slightly distortedoctahedral geometry. The bond angles of O(1)–Ca(1)–O(5), O(1)–Ca(1)–O(6) and O(5)–Ca(1)–O(6) deviate from 90� by 0.46�, 4.12�and 7.06�, respectively, implying that the molecule is slightly dis-torted from an ideal octahedron. The length of the Ca–Ocarboxylate
bonds (2.327(9) ÅA0
) is slightly shorter than the Ca–Oaqua bonds(2.333(1)/2.346(1) ÅA
0
), indicating that the carboxylate–metal bondis stronger than the water–metal bond. However, in 1, the ligatingcapacity of the carboxylate oxygens was lower than that of theaqua O atoms. Moreover, all Ca–O bond lengths in the complexwere typical of Ca–O bonds (2.308–2.413) [8,12,65,66]. Diversesupermolecular interactions such as hydrogen bonding and p–pstacking interactions (3.323 ÅA
0
) played an important role in the for-mation of a three-dimensional supramolecule (Fig. 3).
3.1.3. [Ba(L)2(H2O)2�2H2O]n (3)The asymmetric part of the unit cell contains two barium atoms,
four L� ligands, eight coordinated water molecules and seven lat-tice water molecules. The contents of the asymmetric part of theunit cell and the complete coordination environment around Ba2+
are shown in Fig. 4. As shown in the figure, the structure of 3 differsfrom that of 1 and 2. Each barium atom is 10-coordinate and is li-gated by two carboxylate oxygen atoms (O(1) and O(2)), two aquaoxygen atoms (O(5) and O(6)), and their centrosymmetric counter-parts. Alternatively, in the magnesium and calcium complexes,only one of the carboxyl groups of the ligand is coordinated tothe central metal ion. Moreover, the coordination mode of the car-boxyl group in 3 is significantly different from those observed in 1and 2. Besides chelating to the central metal ion, the coordinatedcarboxyl acts as a bridge to neighbouring barium ions throughone of its oxygen atoms (O(1)). Two four-membered chelate ringswere observed around each barium atom; the first was a Ba(1)/O(1)/C(1)/O(2) ring formed by the carboxylate group and the cen-tral ion, while the second was a Ba(1)/O(1)/Ba(2)/O(1a) ringformed by two bridging carboxyl atoms (O(1)) and two adjacentcentral metal ions. Thus, the latter ring results in a one-dimen-sional polymeric zigzag chain along the c axis. Although the lengthof the Ba–O bonds vary over a narrow range (2.713(4)–2.881(4) Å),the bond angles around the 10-coordinate barium atom vary sig-nificantly (18.1(4)–149.0(3)�). The smallest bond angle (18.1(4)�)is associated with the coordinated water molecule, and the short-est bond length (2.713(4) Å) is related to the carboxyl oxygen atomO(1), which is coordinated to two barium atoms in a bridgingfashion. A notable feature in the structure of 3 is the relativelyshort distance between Ba atoms (4.469 ÅA
0
). In general, the coordi-nation geometry, Ba–O bond lengths and O–Ba–O angles in 3 are
1 or Ca1 in 2). The thermal ellipsoids are plotted at the 30% probability level.

Fig. 3. The packing diagram of 1 (above) and 2 (below), viewed down the a axis. Dashed lines indicate hydrogen bonds.
Fig. 4. Perspective views showing the structure of 1D chain in 3. The hydrogenatoms and water molecules have been omitted for clarity.
Fig. 5. The packing diagram of 3, viewed down the c axis. Dashed lines indicatehydrogen bonds.
L. Huang et al. / Journal of Molecular Structure 984 (2010) 39–50 43
comparable to those found in carboxylate complexes of barium[8,12,67,68].
As shown in Fig. 5, a lattice water molecule is located between apair of carboxyl groups from L� by forming two donor hydrogenbonds [O(1w)–H(1A)� � �O(3) and O(1w)–H(1B)� � �O(2)], and theintrachain aromatic rings are positioned in a parallel fashion alongthe direction of the c axis. Moreover, the oxygen atoms of the aqualigands form donor hydrogen bonds with the carboxylate or latticewater oxygen atoms of adjacent molecules [O4–H4A� � �O2W2.81(1) Å, O5–H5A� � �O1W Å, O5–H5B� � �O2W 2.939(1) Å, O6–H6A� � �O4 2.802(1) Å], forming two-dimensional sheets in the bcplane. The sheets are further extended into a three-dimensional
supramolecular array via hydrogen bonds, which are formed be-tween donor water molecules [O1W–H1B� � �O2 2.715(7) Å, O1W–H1A� � �O3 2.70(8) Å] and acceptor oxygen atoms from the C–Hgroup [O2W–H2A� � �O3W 2.887(1) Å, O2W–H2B� � �O4W 2.42(2)Å,O2W–H2B� � �O4W 3.09(2) Å].
3.2. Frontier molecular orbitals
To investigate the electronic and luminescent properties of thecompounds, molecular orbital calculations based on the optimizedground state geometries were performed. Frontier orbitals play animportant role in these complexes because they control the elec-tronic excitations and transitions of the complexes [69]. Thus, onlythe most important calculated ground state frontier molecularorbitals are shown in Fig. 6, and the partial molecular orbital

Fig. 6. Frontier molecular orbital diagrams for 1–3, obtained according to the DFT-B3LYP/6-31++G(d, p) method.
44 L. Huang et al. / Journal of Molecular Structure 984 (2010) 39–50
components of the HOMOs and LUMOs are listed in Table 4. Molec-ular orbital compositions of 1–3 were expressed by the orbitalcoefficient of various atoms or molecular fragments joined in com-bination. To facilitate the study of the molecular orbitals of thecomplexes, the elements of 1–3 were divided into five parts: (1)imidazole N atoms; (2) C atoms in the benzene ring (C(I)); (3) Catoms in the imidazole ring (C(II)); (4) metal ions; (5) O atoms.Using complex 1 as an example, the HOMO consists primarily ofbenzene ring orbitals (with orbital compositions of C(I) = 63.2%);however, the imidazole orbitals also contribute to the HOMO(C(II) 8.9% and N 4.6%, respectively). Alternatively, the LUMO isdominated by the imidazole ring, and the C(II) and N atoms ofimidazole account for 54.9% and 21.3% of the LUMO, respectively.Moreover, the C(I) atoms of the benzene ring account for only12.0% of the LUMO. These results suggest that the HOMOs are con-centrated on the phenyl unit and the LUMOs are located primarilyon the imidazolium ring, implying that electronic transitions fromthe ground state (S0) to the excited state (S1) involve an electronicshift from the phenyl unit to the imidazole ring. A similar phenom-enon was observed in complexes 2 and 3.
As shown in Fig. 6, the HOMO-2, HOMO-1 and HOMO of 1 con-sist primarily of the p bonding orbitals of the benzimidazoliumring, with little contribution of the O p orbitals of the coordinatingcarboxyl group. HOMO-1 is located on ligand L� (A), while HOMO-2 and HOMO are located on ligand L� (B) (In order to distinguishbetween identical ligands, the left ligand was labelled L� (A) andthe right ligand was labelled L� (B).). As the energy level of thecomplex increases, the contribution of O p orbitals decreases and
Table 4Molecular orbital components in the ground state (S0) for the complexes 1–3 (%).
Orbitals 1 2
N C(I) C(II) O Mg N C(I)
LUMO 21.3 12.0 54.9 1.6 3.2 19.0 13.2HOMO 4.6 63.2 8.9 0.3 2.8 5.2 65.1
the contribution of the benzimidazolium ring of L� increases.LUMO and LUMO + 1 consist primarily of uncoordinated carbo-xylmethyl r* and p* antibonding orbitals, which are equal in en-ergy. However, similar to HOMO and HOMO-1, LUMO andLUMO + 1 are concentrated on L� (B) and L� (A), respectively. Thehigher-energy orbitals (LUMO + 2 to LUMO + 7) consist of phenylp* antibonding orbitals and r* or p* antibonding orbitals of the car-boxylmethyl group from one of the ligands. However, LUMO + 2,LUMO + 4, LUMO + 5 and LUMO + 7 are located on L� (A), whilethe other LUMOs are located on L� (B).
In 2, HOMO-2 and HOMO-1 contain significant contributionsfrom the p orbital of the coordinated carboxylmethyl group andminor contributions from the phenyl ring; thus, the HOMOs are lo-cated predominantly on the benzimidazolium rings. LUMO andLUMO + 1 are also located predominantly on ligand L� (A); how-ever, the LUMO is concentrated on the uncoordinated carboxylm-ethyl group and LUMO + 1 is concentrated on the methylene ofthe coordinated carboxylmethyl group and the benzimidazoliumring. LUMO + 2, which is higher in energy than LUMO + 1, is locatedprimarily on the benzimidazolium rings.
In 3, HOMO-3 is located primarily on the O atoms of the coordi-nated carboxylmethyl group and the phenyl ring of the ligand, andthe coordinated O p orbitals from the other ligand provide onlyminor contributions. HOMO-2 and HOMO-1 are located predomi-nantly on the coordinated carboxylmethyl group and benzimidazo-lium ring of each ligand. Although the first three HOMOs possessdifferent characteristics, they are nearly equal in energy. Whilethe HOMOs are concentrated almost entirely on the benzimidazo-
3
C(II) O Ca N C(I) C(II) O Ba
55.8 2.0 0.5 18.3 13.8 56.2 2.5 0.29.2 1.2 0.7 4.8 67.0 7.9 1.8 1.7

L. Huang et al. / Journal of Molecular Structure 984 (2010) 39–50 45
lium rings of the complex, the LUMO is located primarily on theuncoordinated carboxylmethyl group and benzimidazolium ringof each ligand. LUMO + 1 is located predominantly on the threeaqua ligands, and each benzimidazolium ring provides only minorcontributions. LUMO + 2 and LUMO + 3 are located predominantlyon one carboxylmethyl group, and the benzimidazolium ring fromthe same ligand provides a negligible contribution. LUMO + 4 is lo-cated predominantly on the aqua ligands, while the coordinatedcarboxyl O atoms and the benzimidazolium ring on the same li-gand provide minor and negligible contributions, respectively.
The contribution of the metal atoms (Mg, Ca, or Ba) and the Oatoms to the complex were less than 4% and 2%, respectively, indi-cating that the metal atoms do not significantly participate in thelight-emitting process. Although these complexes have differentcentral metals and crystal structures, the relative ordering andcharacteristics of each orbital are identical. The calculated groundstate frontier molecular orbitals illustrate the characteristics ofthe UV–Vis absorption spectra and the low levels of participationby the metal ions (Table 4).
3.3. Spectroscopic properties
To better understand the absorption spectra of the complexes,the UV–Vis spectra of compounds 1–3 were simulated. Except forthe ligand (HL) and compound 1, the complexes failed to providesatisfactory results when the basic sets and functions of 1 were ap-plied to a variety of different methods and solvents. Thus, only thesimulated UV–Vis spectrum and electronic transition data of 1 wasobtained by TD-DFT/6-311+G(d, p) (Table 5 and Fig. 7).
According to the TD-DFT calculations, the lowest energyabsorption maxima in the UV–Vis spectra does not correspond tothe HOMO to LUMO transition because the oscillator strength ofthe HOMO to LUMO transition is lower than the observed wave-
Table 5Electronic transition data for HL and complex 1.
Species Transitions DEad (eV) kcal (nm)
HLa S0 ? S1 3.81 325.3S0 ? S2 4.41 281.3S0 ? S3 4.76 260.6
1b S0 ? S1 3.54 350.5S0 ? S2 3.93 315.6S0 ? S3 4.73 262.2
a TD DFT B3LYP/6-311+g(d), solvent in water//DFT B3LYP/6-311++g(d, pb TD DFT PBEPBE/6-311+g(d), solvent in water//DFT B3LYP/6-311++g(d,
200 250 300 350 400 4500
3000
6000
9000
12000
15000
18000
Mol
ar a
bsor
plan
ce
Wavelength / nm
1
HL
(a)
Fig. 7. (a) Simulated UV–Vis absorption spectra with gaussian curve and origin 7.5 basedp) method for the compounds (HL, 1); (b) difference charge density for states S0–S1 on U
length [70,71]. Thus, the first absorption peak of 1 at 265.5 nm(Fig. 7a) was correlated to the 256 nm peak in the experimentalUV–Vis spectra and was attributed to the electronic transition fromHOMO to LUMO + 7, with a maximum configuration interactioncoefficient of 0.78. Due to the large contribution of the (p, p) orbi-tals of the ligand to the HOMO and the (r*, p*) antibonding orbitalof the other ligand to LUMO + 7, the transition can be described as(p, p) ? (r*, p*) ligand to ligand charge-transfer (LLCT). The secondabsorption maximum at 285.6 nm was correlated with the 263 nmband in the experimental UV–Vis spectrum. This peak was attrib-uted to the transition from the HOMO to LUMO + 5, with a maxi-mum configuration interaction coefficient of 0.75; thus, the peakwas ascribed to a (p, p) ? (r*, p*) ligand to ligand charge-transfertransition (LLCT) similar to that of the first peak. The third simu-lated absorption maximum at 310.4 nm was readily correlatedwith the 270 nm band in the experimental spectrum. The peakwas attributed to the electronic transition from the HOMO toLUMO + 3, and a maximum configuration interaction coefficientof 0.86 was obtained. Because HOMO and LUMO + 3 are locatedprimarily on L� (B), this transition was ascribed to an intraligandcharge-transfer transition (ILCT). The largest absorption maximumat 315.6 nm was correlated with the 277 nm band in the experi-mental UV–Vis spectrum. HOMO-1 possesses significant (p, p)orbital character from L� (A), and LUMO + 2 possesses (r*, p*) anti-bonding orbital character from the same ligand; thus, the transi-tion was attributed to an (p, p) ? (r*, p*) intraligand charge-transfer transition (ILCT). A comparison of the theoretical andexperimental absorption spectrum of 1 indicates that the calcu-lated and experimental results are in agreement (Fig. 7a). Fig. 7bshows the difference between the charge density of states S0–S1
in L�, providing further support for a LLCT or ILCT mechanism. Itis noted that, the charge-transfer excitation energies in DFT areusually too low (Table 5), which is consistent with our results.
Oscillator strength (a.u.) Main configurations (%)
0.0083 HOMO ? LUMO (76)0.1437 HOMO ? LUMO + 2 (83)0.1304 HOMO ? LUMO + 3 (85)0.0019 HOMO-1 ? LUMO + 1 (97)0.1713 HOMO-1 ? LUMO + 2 (86)0.1164 HOMO-1 ? LUMO + 5 (95)
).p).
e-
(b)
on the data calculated under the TD-DFT B3LYP/6-311+G(d)//DFT B3LYP/6-311+G(d,V–Vis absorption for HL from its Fukui fuction.
46 L. Huang et al. / Journal of Molecular Structure 984 (2010) 39–50
Present studies showed many charge-transfer excitations arepoorly described by GGA and hybrid functionals, while can beaccurately reproduced by other functionals. The phenomenonmay be related to the importance of a distance-dependent contri-bution of exchange in TD-DFT for investigating excited-state prop-erties [72–76].
3.4. Luminescence properties and emission spectra
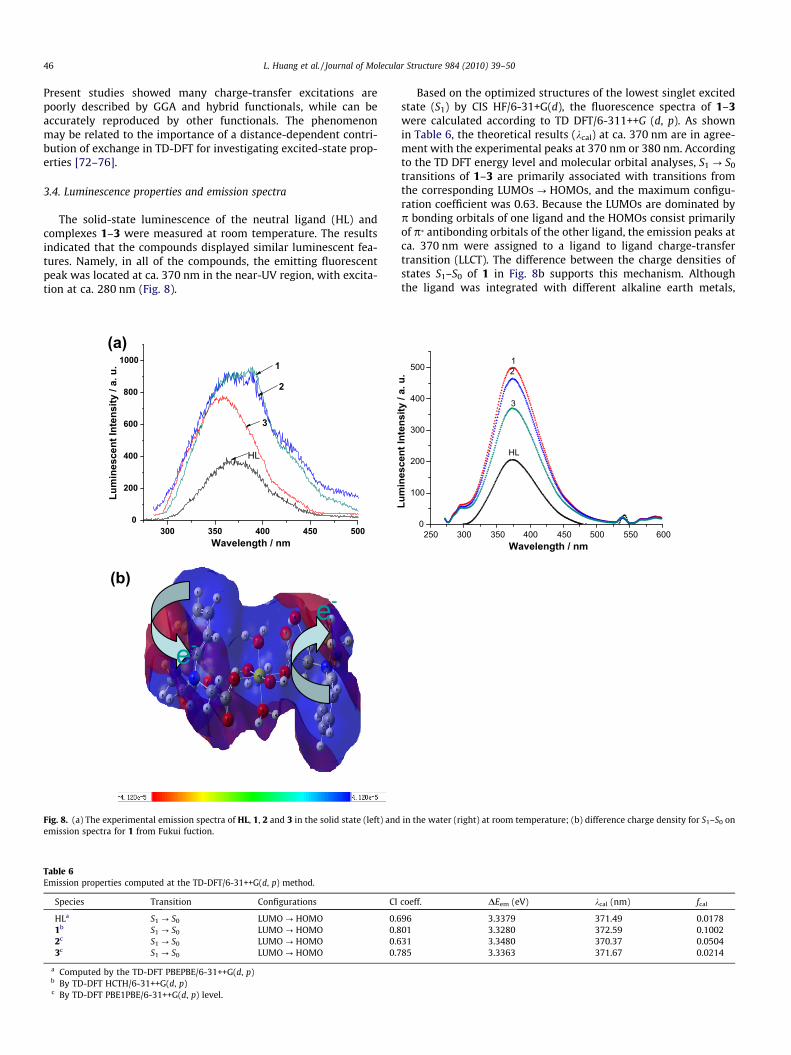
The solid-state luminescence of the neutral ligand (HL) andcomplexes 1–3 were measured at room temperature. The resultsindicated that the compounds displayed similar luminescent fea-tures. Namely, in all of the compounds, the emitting fluorescentpeak was located at ca. 370 nm in the near-UV region, with excita-tion at ca. 280 nm (Fig. 8).
0
200
400
600
800
1000
Lum
ines
cent
Inte
nsity
/ a.
u.
Wavelength / nm
1
2
3
HL
300 350 400 450 500
(a)
e-
(b)
e-
Fig. 8. (a) The experimental emission spectra of HL, 1, 2 and 3 in the solid state (left) andemission spectra for 1 from Fukui fuction.
Table 6Emission properties computed at the TD-DFT/6-31++G(d, p) method.
Species Transition Configurations CI
HLa S1 ? S0 LUMO ? HOMO 0.61b S1 ? S0 LUMO ? HOMO 0.82c S1 ? S0 LUMO ? HOMO 0.63c S1 ? S0 LUMO ? HOMO 0.7
a Computed by the TD-DFT PBEPBE/6-31++G(d, p)b By TD-DFT HCTH/6-31++G(d, p)c By TD-DFT PBE1PBE/6-31++G(d, p) level.
Based on the optimized structures of the lowest singlet excitedstate (S1) by CIS HF/6-31+G(d), the fluorescence spectra of 1–3were calculated according to TD DFT/6-311++G (d, p). As shownin Table 6, the theoretical results (kcal) at ca. 370 nm are in agree-ment with the experimental peaks at 370 nm or 380 nm. Accordingto the TD DFT energy level and molecular orbital analyses, S1 ? S0
transitions of 1–3 are primarily associated with transitions fromthe corresponding LUMOs ? HOMOs, and the maximum configu-ration coefficient was 0.63. Because the LUMOs are dominated byp bonding orbitals of one ligand and the HOMOs consist primarilyof p* antibonding orbitals of the other ligand, the emission peaks atca. 370 nm were assigned to a ligand to ligand charge-transfertransition (LLCT). The difference between the charge densities ofstates S1–S0 of 1 in Fig. 8b supports this mechanism. Althoughthe ligand was integrated with different alkaline earth metals,
250 300 350 400 450 500 550 6000
100
200
300
400
500
Lum
ines
cent
Inte
nsity
/ a.
u.
Wavelength / nm
12
3
HL
in the water (right) at room temperature; (b) difference charge density for S1–S0 on
coeff. DEem (eV) kcal (nm) fcal
96 3.3379 371.49 0.017801 3.3280 372.59 0.100231 3.3480 370.37 0.050485 3.3363 371.67 0.0214

L. Huang et al. / Journal of Molecular Structure 984 (2010) 39–50 47
the values of the energy gap (DEL–H) were essentially the same;therefore, apparent shifts in the emission peaks were not observed.On the other hand, the molecular rigidity of the deprotonatedligand (L�) was strengthened by coordination to the metal(Table 2), which increased the intensity of fluorescence. Moreover,the calculated oscillator strengths of the fluorescent intensities(fcal) match the experimental results (Fig. 8a).
The accurate prediction of the luminescent emission spectra ofsolid compounds using ab initio and density functional theory is adaunting task. Using the electronic properties and reactivity of thecompound, the spectra of the complexes were quantitatively esti-mated. To understand the differences between the luminescentemission spectra of compounds 1–3 and the precursor ligand, con-ceptual DFT reactivity indices were employed, and the results areshown in Table 7. Moreover, quantitative relationships obtainedfrom the DFT indices and the NBO charge analysis of compounds1–3 are shown in Fig. 9. The calculated luminescent oscillatorstrength (fcal) and the electrofugality indices (DEe) displayed a po-sitive linear relationship (Fig. 9a); however, fcal and NBO charges onthe metal ions showed a negative linear relationship (Fig. 9b) (thecorrelation coefficient (R2) of each line was greater than 0.99).These results indicated that the calculated oscillator strength (fcal)of the complex decreases as the charge on the metal ion increases.On the other hand, the molecular plane of L� is easier to deform asthe electrophilicity of the metal decreases. As shown in Table 2 andFig. 1, the molecular planar variability (DD) of L� was the greatestin HL, followed by complex 3, 2 and 1. As a result, the electronicexcitation energy could be easily converted into vibrational energy,leading to the gradual decrease in fluorescent intensity as theatomic number increased. Namely, the heavy atom effect was ob-served in the luminescent emission spectra of the complexes.
3.5. Thermal analyses
Thermal decomposition of the complexes was performed undera static atmosphere of nitrogen at temperatures ranging from 25 to900 �C, and the results of the complexes are shown in Figs. 10–12.
Table 7Calculated DFT reactivity indices and NBO charge for complexes (units in a.u.).
Species EHOMO ELUMO DEL–H l
HL �0.082 �0.038 0.043 0.0601 �0.036 �0.026 0.009 0.0312 �0.057 �0.045 0.011 0.0513 �0.030 �0.021 0.009 0.025
Frontier orbitals HOMO and LUMO, chemical potential l, global hardness g, and electrtrofugality DEe; NBO charge distribution on metal ions (II).
a For hydrogen atom of –COOH group.
Fig. 9. Linear plots of the 1, 2 and 3 systems: (a) oscillator strength (fcal) vs electr
3.5.1. Mg(L)2(H2O)4�2H2O (1)Complex 1 displayed a three-stage decomposition process
(Fig. 10), beginning with the endothermic removal of lattice waterand aqua ligands, which was observed between 98 and 219 �C(found 18.78%, calc. 18.75%, DTAmax = 166 �C). The anhydrous com-plex was stable up to 249 �C, and the second decomposition stagebetween 249 and 337 �C was attributed to the loss of the benzim-idazolium ring and the methylene group in L�, producing MgC2O4
(found 51.66%, calc. 52.52%, DSCmax1 = 250 �C, DSCmax2 = 278 �C). Inthe last exothermic stage, the final loss in mass could not be calcu-lated due to the continued decomposition of the complex at tem-peratures greater than 900 �C.
3.5.2. Ca(L)2(H2O)4�2H2O (2)Similar to complex 1, complex 2 presented three decomposition
steps (Fig. 11). A mass loss of 17.69% was observed between 76 and179 �C, which corresponded to the loss of water molecules fromthe complex (calcd. 18.30%). As the temperature was further in-creased, the remaining material began to decompose at 237 �C.The second decomposition stage located between 237 and 497 �Cwas attributed to the removal of the benzimidazolium ring andthe methylene group, producing CaC2O4 (found 49.19%, calc.51.16%, DSCmax = 278 �C). In the last stage, CaCO3 was graduallyconverted to CaO through the release of CO2 and CO.
3.5.3. [Ba(L)2(H2O)2�2H2O]n (3)As shown in Fig. 12, the first step of the exothermic decomposi-
tion process of 3 was observed between 42 and 134 �C and wasattributed to the loss of water molecules, as indicated by the lossof mass (found 20.66, calc. 18.28%). Between 267 and 480 �C, theanhydrous Ba(II) complex undergoes consecutive losses of thebenzimidazolium and methylene group of L� (DSCmax = 384 �C) toform BaC2O4. The last endothermic step was observed between678 and 778 �C and was likely related to the conversion of BaC2O4
to BaO by loss of CO2 and CO (DSCmax = 754 �C). The total mass lossof 69.94% (calc. 70.57%) agrees with the mass of the proposed prod-uct. The final decomposition products were identified by IR, con-firming the results of TG-DSC analysis.
g x DEn DEe NBO charge
0.021 0.083 0.155 0.033 0.638a
0.004 0.051 0.087 0.024 0.9620.005 0.107 0.270 0.018 1.4780.004 0.035 0.066 0.014 1.883
ophilicity index, x; other conceptual DFT quantities nucleofugality DEn and elec-
ofugality induces (4Ee); (b) oscillator strength (fcal) vs NBO charges on metal.

Fig. 10. DSC-TGA curves of 1.
Fig. 11. DSC-TGA curves of 2.
48 L. Huang et al. / Journal of Molecular Structure 984 (2010) 39–50
4. Conclusion
In this study, three new complexes with distinct architectureswere successfully synthesized from bis(1,3-carboxymethyl)benz-imidazolium (HL) and alkaline earth metal ions (Mg, Ca and Ba)by the hydrothermal method. Using DFT and TD-DFT simulations,the absorption and emission spectra of the complexes were ob-tained, and the theoretical wavelengths were similar to the exper-imental results. The electron cloud density of the frontier orbitalsof complex 1 indicated that the absorption peaks at 256, 263,270, and 277 nm were derived from (p, p) ? (r*, p*) LLCT, (p,p) ? (r*, p*) LLCT, (p, p) ? (r*, p*) ILCT and (p, p) ? (r*, p*) ILCTtransitions, respectively. As the atomic number of the metal in-creased (Mg < Ca < Ba), the energy gap (DEL–H) remained un-changed and the deformation of the complex increased.Electronic transitions between the ground state and the excitedstates occurred from the phenyl group to the imidazolium ringvia intramolecular charge transfer; thus, the process of emission
from S1 ? S0 occurred by LLCT. In addition, a linear relationship be-tween the calculated luminescent oscillator strength and thecharge distributions and the DFT chemical reactivity indices ofthe complexes was observed, and the correlative coefficients were0.9565, 0.9739 and 0.9732, respectively. The results of the presentstudy suggest that the emission peak of the ligand and the alkalineearth metal complexes can be controlled by changing the centralmetal ion.
5. Supplementary material
CCDC No. 757187, 757185 and 757186 (corresponding to[Mg(L)2(H2O)4]�2H2O (1), Ca(L)2(H2O)4�2H2O (2) and [Ba(L)2-(H2O)2�2H2O]n (3)) contain the supplementary crystallographicdata for this paper. These data can be obtained free of charge viawww.ccdc.cam.ac.uk/conts/retrieving.html (or from the CCDC, 12Union Road, Cambridge CB2 1EZ, UK; fax: +44 1223 336 033; e-mail: [email protected])
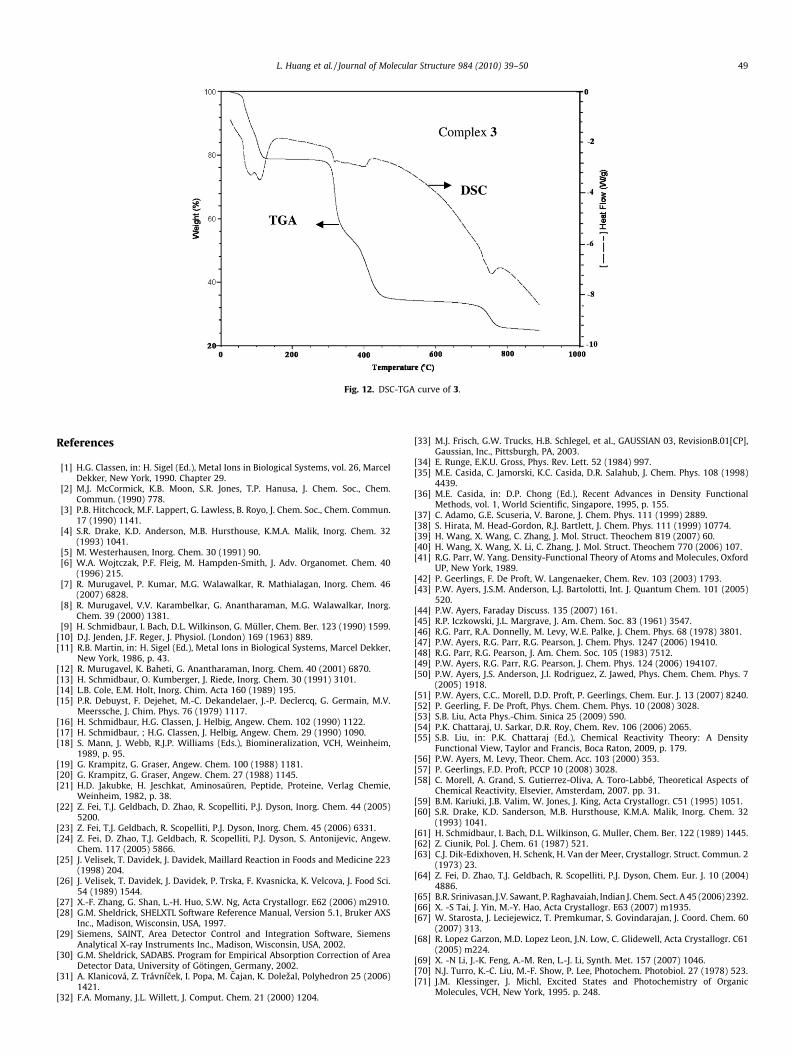
Fig. 12. DSC-TGA curve of 3.
L. Huang et al. / Journal of Molecular Structure 984 (2010) 39–50 49
References
[1] H.G. Classen, in: H. Sigel (Ed.), Metal Ions in Biological Systems, vol. 26, MarcelDekker, New York, 1990. Chapter 29.
[2] M.J. McCormick, K.B. Moon, S.R. Jones, T.P. Hanusa, J. Chem. Soc., Chem.Commun. (1990) 778.
[3] P.B. Hitchcock, M.F. Lappert, G. Lawless, B. Royo, J. Chem. Soc., Chem. Commun.17 (1990) 1141.
[4] S.R. Drake, K.D. Anderson, M.B. Hursthouse, K.M.A. Malik, Inorg. Chem. 32(1993) 1041.
[5] M. Westerhausen, Inorg. Chem. 30 (1991) 90.[6] W.A. Wojtczak, P.F. Fleig, M. Hampden-Smith, J. Adv. Organomet. Chem. 40
(1996) 215.[7] R. Murugavel, P. Kumar, M.G. Walawalkar, R. Mathialagan, Inorg. Chem. 46
(2007) 6828.[8] R. Murugavel, V.V. Karambelkar, G. Anantharaman, M.G. Walawalkar, Inorg.
Chem. 39 (2000) 1381.[9] H. Schmidbaur, I. Bach, D.L. Wilkinson, G. Müller, Chem. Ber. 123 (1990) 1599.
[10] D.J. Jenden, J.F. Reger, J. Physiol. (London) 169 (1963) 889.[11] R.B. Martin, in: H. Sigel (Ed.), Metal Ions in Biological Systems, Marcel Dekker,
New York, 1986, p. 43.[12] R. Murugavel, K. Baheti, G. Anantharaman, Inorg. Chem. 40 (2001) 6870.[13] H. Schmidbaur, O. Kumberger, J. Riede, Inorg. Chem. 30 (1991) 3101.[14] L.B. Cole, E.M. Holt, Inorg. Chim. Acta 160 (1989) 195.[15] P.R. Debuyst, F. Dejehet, M.-C. Dekandelaer, J.-P. Declercq, G. Germain, M.V.
Meerssche, J. Chim. Phys. 76 (1979) 1117.[16] H. Schmidbaur, H.G. Classen, J. Helbig, Angew. Chem. 102 (1990) 1122.[17] H. Schmidbaur, ; H.G. Classen, J. Helbig, Angew. Chem. 29 (1990) 1090.[18] S. Mann, J. Webb, R.J.P. Williams (Eds.), Biomineralization, VCH, Weinheim,
1989, p. 95.[19] G. Krampitz, G. Graser, Angew. Chem. 100 (1988) 1181.[20] G. Krampitz, G. Graser, Angew. Chem. 27 (1988) 1145.[21] H.D. Jakubke, H. Jeschkat, Aminosaüren, Peptide, Proteine, Verlag Chemie,
Weinheim, 1982, p. 38.[22] Z. Fei, T.J. Geldbach, D. Zhao, R. Scopelliti, P.J. Dyson, Inorg. Chem. 44 (2005)
5200.[23] Z. Fei, T.J. Geldbach, R. Scopelliti, P.J. Dyson, Inorg. Chem. 45 (2006) 6331.[24] Z. Fei, D. Zhao, T.J. Geldbach, R. Scopelliti, P.J. Dyson, S. Antonijevic, Angew.
Chem. 117 (2005) 5866.[25] J. Velisek, T. Davidek, J. Davidek, Maillard Reaction in Foods and Medicine 223
(1998) 204.[26] J. Velisek, T. Davidek, J. Davidek, P. Trska, F. Kvasnicka, K. Velcova, J. Food Sci.
54 (1989) 1544.[27] X.-F. Zhang, G. Shan, L.-H. Huo, S.W. Ng, Acta Crystallogr. E62 (2006) m2910.[28] G.M. Sheldrick, SHELXTL Software Reference Manual, Version 5.1, Bruker AXS
Inc., Madison, Wisconsin, USA, 1997.[29] Siemens, SAINT, Area Detector Control and Integration Software, Siemens
Analytical X-ray Instruments Inc., Madison, Wisconsin, USA, 2002.[30] G.M. Sheldrick, SADABS. Program for Empirical Absorption Correction of Area
Detector Data, University of Götingen, Germany, 2002.[31] A. Klanicová, Z. Trávnícek, I. Popa, M. Cajan, K. Dolezal, Polyhedron 25 (2006)
1421.[32] F.A. Momany, J.L. Willett, J. Comput. Chem. 21 (2000) 1204.
[33] M.J. Frisch, G.W. Trucks, H.B. Schlegel, et al., GAUSSIAN 03, RevisionB.01[CP],Gaussian, Inc., Pittsburgh, PA, 2003.
[34] E. Runge, E.K.U. Gross, Phys. Rev. Lett. 52 (1984) 997.[35] M.E. Casida, C. Jamorski, K.C. Casida, D.R. Salahub, J. Chem. Phys. 108 (1998)
4439.[36] M.E. Casida, in: D.P. Chong (Ed.), Recent Advances in Density Functional
Methods, vol. 1, World Scientific, Singapore, 1995, p. 155.[37] C. Adamo, G.E. Scuseria, V. Barone, J. Chem. Phys. 111 (1999) 2889.[38] S. Hirata, M. Head-Gordon, R.J. Bartlett, J. Chem. Phys. 111 (1999) 10774.[39] H. Wang, X. Wang, C. Zhang, J. Mol. Struct. Theochem 819 (2007) 60.[40] H. Wang, X. Wang, X. Li, C. Zhang, J. Mol. Struct. Theochem 770 (2006) 107.[41] R.G. Parr, W. Yang. Density-Functional Theory of Atoms and Molecules, Oxford
UP, New York, 1989.[42] P. Geerlings, F. De Proft, W. Langenaeker, Chem. Rev. 103 (2003) 1793.[43] P.W. Ayers, J.S.M. Anderson, L.J. Bartolotti, Int. J. Quantum Chem. 101 (2005)
520.[44] P.W. Ayers, Faraday Discuss. 135 (2007) 161.[45] R.P. Iczkowski, J.L. Margrave, J. Am. Chem. Soc. 83 (1961) 3547.[46] R.G. Parr, R.A. Donnelly, M. Levy, W.E. Palke, J. Chem. Phys. 68 (1978) 3801.[47] P.W. Ayers, R.G. Parr, R.G. Pearson, J. Chem. Phys. 1247 (2006) 19410.[48] R.G. Parr, R.G. Pearson, J. Am. Chem. Soc. 105 (1983) 7512.[49] P.W. Ayers, R.G. Parr, R.G. Pearson, J. Chem. Phys. 124 (2006) 194107.[50] P.W. Ayers, J.S. Anderson, J.I. Rodriguez, Z. Jawed, Phys. Chem. Chem. Phys. 7
(2005) 1918.[51] P.W. Ayers, C.C.. Morell, D.D. Proft, P. Geerlings, Chem. Eur. J. 13 (2007) 8240.[52] P. Geerling, F. De Proft, Phys. Chem. Chem. Phys. 10 (2008) 3028.[53] S.B. Liu, Acta Phys.-Chim. Sinica 25 (2009) 590.[54] P.K. Chattaraj, U. Sarkar, D.R. Roy, Chem. Rev. 106 (2006) 2065.[55] S.B. Liu, in: P.K. Chattaraj (Ed.), Chemical Reactivity Theory: A Density
Functional View, Taylor and Francis, Boca Raton, 2009, p. 179.[56] P.W. Ayers, M. Levy, Theor. Chem. Acc. 103 (2000) 353.[57] P. Geerlings, F.D. Proft, PCCP 10 (2008) 3028.[58] C. Morell, A. Grand, S. Gutierrez-Oliva, A. Toro-Labbé, Theoretical Aspects of
Chemical Reactivity, Elsevier, Amsterdam, 2007. pp. 31.[59] B.M. Kariuki, J.B. Valim, W. Jones, J. King, Acta Crystallogr. C51 (1995) 1051.[60] S.R. Drake, K.D. Sanderson, M.B. Hursthouse, K.M.A. Malik, Inorg. Chem. 32
(1993) 1041.[61] H. Schmidbaur, I. Bach, D.L. Wilkinson, G. Muller, Chem. Ber. 122 (1989) 1445.[62] Z. Ciunik, Pol. J. Chem. 61 (1987) 521.[63] C.J. Dik-Edixhoven, H. Schenk, H. Van der Meer, Crystallogr. Struct. Commun. 2
(1973) 23.[64] Z. Fei, D. Zhao, T.J. Geldbach, R. Scopelliti, P.J. Dyson, Chem. Eur. J. 10 (2004)
4886.[65] B.R. Srinivasan, J.V. Sawant, P. Raghavaiah, Indian J. Chem. Sect. A 45 (2006) 2392.[66] X. -S Tai, J. Yin, M.-Y. Hao, Acta Crystallogr. E63 (2007) m1935.[67] W. Starosta, J. Leciejewicz, T. Premkumar, S. Govindarajan, J. Coord. Chem. 60
(2007) 313.[68] R. Lopez Garzon, M.D. Lopez Leon, J.N. Low, C. Glidewell, Acta Crystallogr. C61
(2005) m224.[69] X. -N Li, J.-K. Feng, A.-M. Ren, L.-J. Li, Synth. Met. 157 (2007) 1046.[70] N.J. Turro, K.-C. Liu, M.-F. Show, P. Lee, Photochem. Photobiol. 27 (1978) 523.[71] J.M. Klessinger, J. Michl, Excited States and Photochemistry of Organic
Molecules, VCH, New York, 1995. p. 248.

50 L. Huang et al. / Journal of Molecular Structure 984 (2010) 39–50
[72] D.J. Tozer, J. Chem. Phys. 119 (2003) 12697.[73] M.S. Liao, Y. Lu, S. Scheiner, J. Comput. Chem. 24 (2003) 623.[74] A. Dreuw, J.L. Weisman, M. Head-Gordon, J. Chem. Phys. 119 (2003)
2943.
[75] M.J.G. Peach, P. Benfield, T. Helgaker, D.J. Tozer, J. Chem. Phys. 128 (2008)44118.
[76] M.J.G. Peach, C.R. Le Sueur, K. Ruud, M. Guillaume, D.J. Tozer, PCCP 11 (2009)4465.