syntheti sesmogram modelingu purdueunv lafaee i/ in …
TRANSCRIPT

2A-A'8 305 SYNTHETI SESMOGRAM MODELINGU PURDUEUNV LAFAEE I/IN DEPT 0F GEOSCIENCES LW BRAILE 15 NOV 82
8R1-2 ONR N00014-75-C 0972UNCLASFE F/G8/1 N
1 . 1 32 J l
L3 6161 14,o 112.0
111 1.51 _L,lWll, -
MICROCOPY RESOLUTION TEST CHART
NATIONAL BUREAU OF SIANDARDS TA6R A
TIt

SYNTHETIC SEISMOGRAM MODELING/Lawrence W. Braile
Department of GeosciencesPurdue University
West Lafayette,, Indiana 47907
4 N SENRM SRP 197
1 . -FI. ~
0 50 100*N SE) CM
FOR SJFia'ehiclRpr4o.OR0 8>umte to.33
Eat0hsc rgrm 8 51 5Ofic oNaalReeac
Contrat No. 001-5C97Pro ject Perid I 2/ I /80D 2/8/ 2 DKTMUIN TTMN
Report Date I / I E/8VATIONfipa~c.
-.10*- 2

DEPARTMENT OF GEOSCIENCES
PURDUE UNIVERSITY
Final Technical Report
for the
EARTH PHYSICS PROGRAM
OFFICE OF NAVAL RESEARCH
Contract No. N00014-75-C-0972
SYNTHETIC SEISMOGRAM MODELING
by
Lawrence W. Bralle
Technical Report No. ONR-1-82
Project Period 12/1/80 - 2/28/82
Report Date 11/15/82_____________ ___I ITRZDUTION STATEgM A
___ ~~~Dieftibution Unlimited________- air.l

SECUAITY CLASSIFICATION OF THIS PAGE Man,. Data 9ewo__________________
REPORT DOCUJMEN4TATION PAGE MADOR OMIA NG VIREPORT %U L R OVT ACCESSION NO- 3. RE1CIPIT'S CATALOG NUM9ER
ONR- 1-82 Ij ()4. TITLE (Mmd &ahade) 11. TYPE or REPORT a PERIOD COVERED
Synteti Sesmogam odeingTechnicalSynteti Sesmogam odeing12/1/80 - 2/2818241. PERFORMING ORe. REPORT NUMBER
____ ___ ___ ____ ___ ___ ___ ____ ___ ___ ___ONR-1 -827. AUTHOR(*) a- CONTRACT On GRANT NUM0ERre)
Lawrence W. Braile NOO0l 4-75-C-0972
9. PERFORMING ORGANIZATION NAME AND ADDRESS 40. *111GRAM 96911911T. PROJECT. TASK
Department of Geosciences RGAWOKUINMESPurdue UniversityWest Lafayette, IN 47907
11. CONTROLLING OFFICE NAME AND ADDRESS 12. REPORT DATE
ONR Resident Representative 11/15/82Ohio State University Research Center 13 NUOR OF PAGES1314, Ki nnjar Road. rCalumhu~q OH 41212____________
14. MONITORING AGE9NCY NAME G ADDRESS(if dIifen boo Cantet,.ihn Office) IS. SECURITY CLASS. (of Ihift ,epeftJ
Unclassifiled181. gCSICATionDOWNGRADING
I MUCAUMN/AIS. DISTRIBUTION STATEMENT (of tMle Repost
Unlimited jDISTRIBUTION STATEI4E14T A
Approved for publio teleasgI
1T. DISTRIBUTION STATEMENT (of the ahehdmeat aimi Week all, I iitn fDItm ehpeg
Approved for public release: distribution unlimited
IS. SUPPLEMENTARY NOTES
Synthetic Seismograms, Seismic Modeling, Finite Difference, Ray Theory
Iso. KEay WORDS (c~nftan mm mee side It "@@@Osm mmd Ideaity by woene O)
So. ABSTRACT (Caimthwe - isve. old@ It aneeae0Y 0611 8110OH 6F 61-h -inbe)
Seismic modeling techniques for one- and two-dimensional velocity modelshave been developed, tested and applied to analysis of observed seismic re-fraction and reflection data for the continental crust. The reflectivitymethod for one-dimensional models has proven to be an efficient and powerfulmethod for interpretation of the amplitude and waveform of seismic recordsections. The amplitude and waveform characteristics are shown to be importanto interpretation of fine structure of velocity depth profiles. Applications
DD 1 1473 EDITION or I Nov as is OBSOLETE
S/N 002-L414.601S8CURITY CLASSIFICATION OF THIS PAGE (11110an aa beeeeO
Is 717

$9CURITV CLASSIFICATION OF THIS PA09 GMll DOta Entt.4
20.to modeling of a variety of seismic phases are given. Two-dimensionalmodeling techniques utilizing ray-trace travel-time calculations and finite-difference synthetic seismogram calculations were developed. The ray-tracing methods are capable of accurate travel-time applications but requiremodification for amplitude analysis. The finite-difference method is apowerful technique capable of modeling seismic data for complex geologicstructures for body and surface waves. Model studies for simple one- andtwo-dimensional velocity structures illustrate seismic wave propagationincluding complex amplitude and waveform characteristics due to model com-plexity. The principal limitation of the finite-difference technique is thelarge amount of computer time and storage required.
VT' CRA 8!DTIC TB -Unannounced 0JUSt ificatto
By-
Distribution/
AvailabilitY Codes
Avail and/or
SaCuY'V CLAPICATIoN OI@W@PIS PA6lOhm Da heIm
:I,
ABSTRACT
Seismic modeling techniques for one- and two-dimensional velocity
models have been developed, tested and applied to analysis of observed
seismic refraction and reflection data for the continental crust. The
reflectivity method for one-dimensional models has proven to be an efficient
and powerful method for interpretation of the amplitude and waveform
of seismic record sections. The amplitude and waveform characteristics
are shown to be important to interpretation of fine structure of velocity
depth profiles. Applications to modeling of a variety of seismic phases
are given. Two-dimensional modeling techniques utilizing ray-trace travel-
time calculations and finite-difference synthetic seismogram calculations
were developed. The ray-tracing methods are capable of accurate travel-
time applications but require modification for amplitude analysis. The
finite-difference method is a powerful technique capable of modeling
seismic data for complex geologic structures for body and surface waves.
Model studies for simple one- and two-dimensional velocity structures
illustrate seismic wave propagation including complex amplitude and waveform
characteristics due to model complexity. The principal limitation of
the finite-difference technique is the large amount of computer time
and storage required.
- .V _

2
INTRODUCTION
During the past few years our research has been aimed at developing
improved methods for modeling seismograms. This effort has involved
both development of new synthetic seismogram techniques and implementation
and modification of existing computer programs. Our objective has been
not only to provide adequate synthetic seismogram modeling techniques,
which are useful for a wide variety of applications, but also to quanti-
tatively compare these techniques, ascertain the advantages, disadvantages
and range of applicability of the various methods, and to utilize the
techniques to model same real seismological data. Our applications have
largely been to continental crustal structure although the techniques
are 'scale-independent'. The methods can be applied to a wide variety
of models of geological and seismological interest including whole-earth
seismograms, crustal and upper-mantle modeling the shallow seismic ref rac-
tion and reflection studies including wave propagation in the ocean and
ocean-bottom region which is of prime interest to the Navy. Both travel
time and synthetic seismogram amplitude methods have been employed. Synthetic
seismogram methods utilize both ray theory, which is approximate, but
relatively fast; and wave theoretical approaches, which are more exact
and include correct treatment of the various phase conversions and wave
types, but may be restricted in their range of applications because of
the amount of computer time required.
During the past two years, our emphasis has been on the development
of two-dimensional synthetic seismogram methods. We have utilized two
basic approaches in the development and application of two-dimensional
synthetic seismogram modeling techniques. The first involves a ray-
theoretical method utilizing ray tracing which provides primarily travel
times of seismic wave arrivals. This method can be improved, however,
to produce reasonably accurate synthetic seismograms for seismic wave
a-l Z

3
propagation through complicated geologic structures. Developments in
these areas will be reported in a future report.
The second method that we have used involves the numerical solution
of the two-dimensional heterogeneous elastic wave equation using finite-
difference techniques in order to calculate complete synthetic seismo-
grams for complex two-dimensional models. These techniques have the
advantage of providing complete seismograms including effects of wave
type conversion, multiples, and inclusion of body waves as well as surface
waves. However, the principal disadvantage of the finite-difference
techniques has been the requirement of vast amounts of computer time
and storage in order to apply these techniques on a routine basis.
In this report, we summarize the status of our synthetic seismogram
modeling development and application efforts. Previous reports relevant
to this research effort are Department of Geosciences, Purdue University
reports ONR-1-80 and ONR-1-81 prepared by Professor L.W. Braile. Addi-
tional details of some of the applications of seismic modeling performed
during the research period are included in reprints of published papers
which are contained in the Appendix to this report. Recent developments
and improvements in finite-difference modeling techniques and in an approxi-
mate two-dimensional ray theoretical synthetic seismogram method, called
Disk-Ray Theory, will be descirbed in a subsequent report detailing research
pefformed under contract number N00014-82-K-0034.
SYNTHETIC SEISMOGRAM MODELING
A summary of the travel time and synthetic seismogram modeling techniques
that we have utilized and have implemented on the computers at Purdue
University is shown in Table 1. This table provides a swumary of the
various methods and the characteristics of these methods and their associatedlimitations. For example, several of the techniques are restricted to
-~~i ml
- -7--- I*j

4
one-dimensional models - that is, models whose velocities vary only with
the depth parameter. Other methods are capable of calculating synthetic
seismograms for two-dimensional models in which lateral variations in
velocity structure are possible.
Figure 1 is a flaw chart which illustrates the interpretation procedure
for combined travel-time and synthetic seismogram modeling that we apply
to observed seismic data. A primary step in this procedure is the separa-
tion, of observed data into one-dimensional and two-dimensional classes.
Once this determination has been made, the data are subject to both travel-
time and synthetic seismogram (amplitude distance) modeling procedures
for which the computer programs which were described in Table 1 are available.
In the remainder of this report, we describe the application of a variety
of synthetic seismogram techniques which have been developed or implemented
on our computers in order to illustrate the capability of these techniques.
Additional details concerning applications of the synthetic seismogram
methods are contained in the papers in the Appendix to this report.
ONE-DIMENSIONAL SYNTHETIC SEISMOGRAM METHODS
We have found the Modified Reflectivity Method (Kind, 1978) to be
a very powerful technique for synthetic seismogram calculation in those
cases where the velocity structure of interest is basically one-dimensional,
that is where lateral variations in velocity and Q structure are not
significant. A variety of real earth structures represent a close approxi-
mation to this assumption and in these cases the modified reflectivity
method allows for relatively accurate and efficient modeling of observed
seismic data. Some examples are contained in the papers by Olsen and
Bralle (1981), Olsen, Bralle and Johnson (1980), Olsen, Bralle and Stewart
(1982), and Banda, Delchmann, Bralle and Ansorge (1982) which are given
in the Appendix. An additional example of the application of the synthetic
V, V.

5
seismogram technique to observe data and the efficiency of calculation
of synthetic seismograms using the modified reflectivity method is shown
in Figure 2. Our experience with the modified reflectivity method indicate
the importance of amplitude and waveform modeling of observed seismic
data. Investigation of travel-time relationships alone provides little
information as to the detailed earth model. Inclusion of amplitude distance
variations and waveform characteristics, which can be treated using the
synthetic seismogram technique, provide for much improved inference of
the fine structure of the velocity depth curve as well as inference of
Q structure (Braile, 1978).
TWO-DIMENSIONAL MODELING - RAY THEORY
Ray-theoretical techniques have been used for modeling of travel
times of seismic waves in complex geologic structures for some time.
We have implemented an efficient ray-tracing program for accurate calcula-
tion of travel times of refracted and reflected seismic waves following
the method of Cerveny, Molotkov and Psencik (1978). This technique utilizes
a variety of numerical schemes to approximate a two-dimensional velocity
distribution with or without interfaces. The seismic ray paths are then
traced using iterative Snell's Law application through the velocity structure.
Reflections from various interfaces may be selected and refracted waves
are also included. Refractions simulating head waves from homogeneous
layers can be adequately approximated by providing for a small positive
velocity gradient within the homogeneous media. The velocity gradient
that we normally use to simulate the head wave is consistent with that
utilized in the earth flattening transformation and corresponds to approxi-
mately 0.001 km/sllkm for shallow layers. This technique provides adequate
modeling of body-wave travel times in two-dimensional structures. An
example of successful modeling of complex observed seismograms using
- '." r *7
7T,.

6
two-dimensional ray-trace modeling is shown in Figure 3. One of the
limitations of this technique is that amplitudes calculated for individual
ray paths are inaccurate and thus the ray tracing technique is not immnediately
conducive to synthetic seismogram calculation. However, we have utilized
a modified ray theoretical method following the technique of Wiggins
(1976) and McMechan (1974) to produce accurate synthetic seismograms
from the ray trace amplitudes. Progress in this area will be described
in a subsequent report.
FINITE-DIFFERENCE SYNTHETIC SEISMOGRAM MODELING
We have applied the finite-difference miethod to numerically solve
the two-dimensional heterogeneous elastic wave equation for the calcula-
tion of synthetic seismograms in velocity structures with arbitrarily
varying elastic properties. The idea of the finite-difference synthetic
seismogram method is illustrated in Figure 4. A velocity structure is
approximated by a rectangular grid of points in which the elastic properties
(compressional velocity, shear velocity, and density) are tabulated.
Finite-difference approximations to spatial and temporal derivatives
allow solution of the two-dimensional elastic wave equation for a given
instant in time as computed from displacements at previous times. Initial
conditions due to an implied elastic disturbance (source) generates wave
propagation which is simulated by the finite-difference calculations
as a function of time for all points in the velocity grid. Displacement
time histories at a variety of locations are retained in the computer
and become displacement seismograms for the vertical and horizontal components
of particle velocity. The theory of finite-difference synthetic seismogram
calculations has been described by Boore (1972), Alford et al., 1974;
Kelly et al., 1976; Mazzella, 1979; and Espindola, 1979.

7
The two-dimensional equations of motion for displacement in a hetero-
geneous isotropic elastic media are shown in Figure 5. These equations
are approximated by their finite-difference approximations using an explicit
finite-difference formulation as illustrated in Figure 6. Using these
finite-difference approximations, the displacement at any time L + 1
for any arbitrary grid location is given as a function of times L and
L - 1 allowing a calculation of the displacement for all grid locations
at the new time. Once this calculation is complete for the entire veloc
grid, it may be repeated for as many time steps as desired.
This finite-difference application is very straightforward and resu.
in complete seismograms since it is a numerical solution of the elastic
wave equation. However, there are a variety of difficulties which one
encounters in attempting to apply finite-difference calculations to the
calculation of synthetic seismograms. These difficulties are summiarized
in Figure 7. The most difficult problems are that of providing for absorbing
boundary conditions at the edges of the model in which an approximate
absorbing boundary condition due to Clayton and Engquist (1977) is utilized
and the requirement for stability and accuracy which imply small time
step and small grid spacing respectively. These requirements result
in very large computer time and storage capacity. Therefore, calculation
of synthetic seismograms for complicated realistic models of interest
for two-dimensional geological structures may require several tens of
minutes or even hours of computer time utilizing a computer with a memory
capacity of a million or more storage locations.
A finite-difference synthetic seismogram computer code has been
developed and is described in Mazella (1979). We have applied this synthetic
seismogram method to a variety of models in order to test the accuracy,
applicability, and capability of the technique. The velocity models
utilized for this testing are illustrated in Figure 8. One of the useful
IM POPW~~

8
by-products of the synthetic seismogram calculation using
the finite-
difference technique is a displacement field associated with wave propagation
in the elastic model at any instant in time. These displacement fields
can be stored for a number of time steps during the finite-difference
calculation and the displacement fields, often called 'snapshots', are
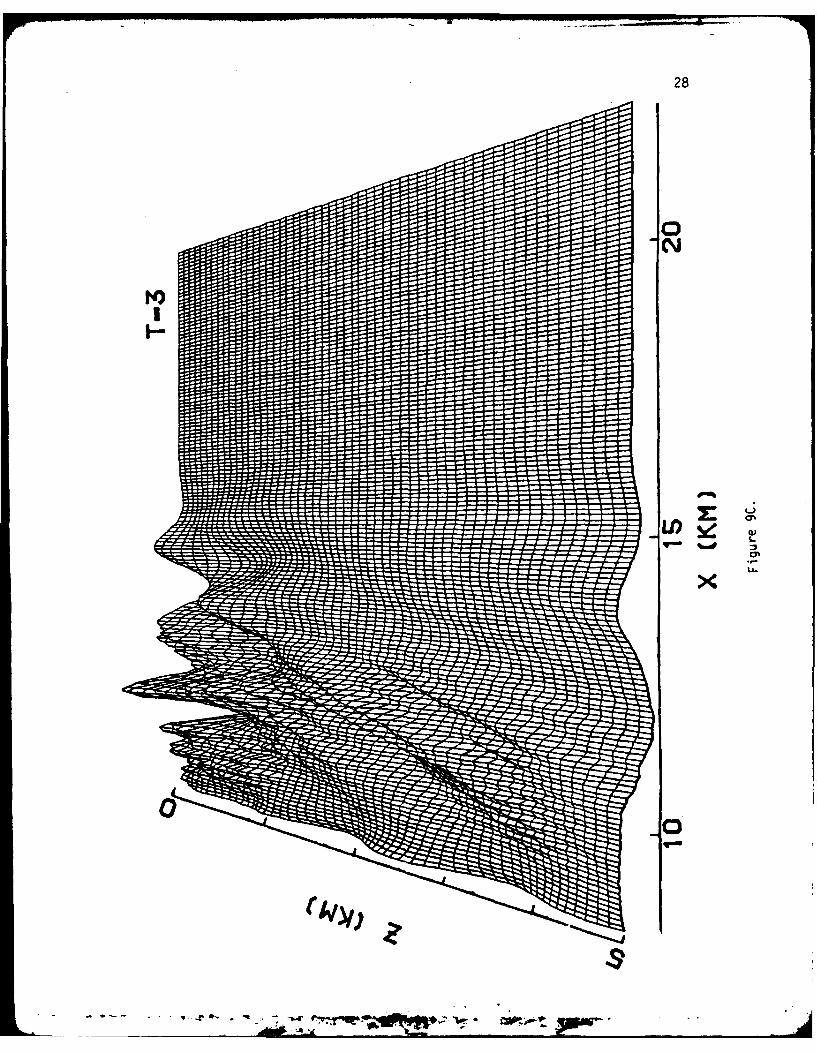
illustrative of the wave propagation in the media. An example of dis-
placement time history snapshots for one of the models shown in Figure
8 are illustrated in Figure 9.
In order to verify the accuracy of the finite-difference program,
we have calculated vertical component synthetic seismograms for a one-
dimensional model corresponding to a layer over a half-space for which
synthetic seismograms have also been computed utilizing the modified
reflectivity method. Comparison of the seismograms for these two calcula-
tions (Figure 10) illustrates the validity of the finite-difference calculations.
Calculation of synthetics for a complex two-dimenisional velocity
structure (model INFL 5 illustrated in Figure 8) are shown in Figure 11.
The corrected seismograms (Figure 118) for this complicated velocity
structure illustrate the expected waveform characteristics of propagation
through this model containing a prominent lateral velocity contrast in
the form of a fault. The time delay due to the fau't and diffracted
and headwave arrivals from the lower interface demonstrate the capability
of this technique for simulating wave propagation and complex geologic
structures.
The principal difficulty with the finite-difference approach is
the amount of computer time required to compute synthetic seismograms
for realistic velocity structures. It is currently too expensive to
compute synthetics using this technique on a routine basis for trial
and error modeling of seismic refraction and reflection data. However,
it 'is feasible to compute synthetics for a variety of characteristic
_13! ,1'

9
models of laterally varying geologic structures and to use the experience
gained with these models as an aid to interpretation of observed seismic
data. In addition, it is highly desirable to have two-dimensional synthetic
seismograms calculated by the finite-difference technique for certain
models in order to use for comparison with approximate techniques as
verification. Furthermore, it is possible that the finite-difference
techniques could be made to be somewhat more efficient, thus improving
our ability to utilize the finite-difference synthetic seismogram technique
on a routine basis. For example, we are currently investigating the
possibilities of using an acoustic formulation of the two-dimensional
finite-difference procedure as a preliminary modeling method. In addition,
we are developing implicit finite-difference schemes for synthetic seismo-
gram modeling which may be significantly faster than the explicit code
that we are presently utilizing.
OPP.
. . .. .... .~~~~ paj : ; ' ""' . .

10
REFERENCES
Alford, R., Kelly, K., and Boore, D., Accuracy ff finite-difference modelingof the acoustic wave equation, Geophysics, 39, p. 834-842, 1974.
Banda, E., Deichmann, N., Braile, L.W., and Ansorge, J., Amplitude studyof the Pg phase, J. Geophysics, (in press), 1982.
Boore, D., Finite difference methods for seismic wave propagation inheterogeneous materials, in Methods in Computational Physics,v. 11, B. Bolt, Ed., New Trirk, Academic Press Inc., 1972.
Braile, L.W., The use of amplitudes in seismic refraction interpretation,(Abs), EOS, Transactions of the American Geophys. Union, 59, 1138,1978.
Braile, L.W., Smith, R.B., Ansorge, J., Baker, M.R., Sparlin, M.A., Prodehl,C., Schilly, M.M., Healy, J.H., Mueller, S., and Olsen, K.H., TheYellowstone-Snake River plain seismic profiling experiment: crustalstructure of the eastern Snake River Plain, J. Geophys. Res., 87,p. 2597-2609, 1982.
Cerveny, V., Molotkov, I.A., and Psencik, I., Ray Methods in Seismology,Charles University Press, Prague, 1978.
Clayton, R., and Engquist, B., Absorbing boundary conditions for acousticand elastic wave equations, Bull. Seism. Soc. Am., 67, p. 1529-1540,1977.
Espindola, J.M., Finite difference synthetic seismograms for kinematicmodels of the earthquake source, Ph.D. thesis, Purdue Univ., WestLafayette, IN, 151 p., 1979.
Kelly, K.R., Ward, R.W., Treitel, S., and Alford, R.M., Synethetic seismo-grams: a finite difference apporach, Geophysics, 41, p. 5-27, 1976.
Kind, R., The reflectivity method for a buried source, J. Geophys., 44,p. 603-612, 1978.
Mazzella, F.E., The generation of synthetic seismograms for laterallyheterogeneous models using the finite difference technique, Ph.D.thesis, Purdue Univ., West Lafayette, IN, 225 p., 1979.
McMechan, G.A., P-wave train synthetic seismograms calculated by quantizedray theory, Geophys. J.R. Astr. Soc., 37, p. 407-421, 1974.
Olsen, K.H., Braile, L.W., and Johnson, P.A., Seismic velocity and Q-structureof the upper mantle lid and low velocity zone for the eastern GreatBasin, Geophys. Res. Letters, 7, p. 1029-1032, 1980.
Olsen, K.H., and Braile, L.W., Seismograms of explosions at regional dis-tances in the western United States: Observations and reflectivitymethod modeling, in Identification of Seismic Sources - Earthquakeor Underground ExpTosion, edited by E.S. Husebye and S. Mykkeltveit,453-466, Reidel, 1981.
RUM, --

11
Olsen, K.H., Braile, L.W., and Stewart, J.N., Modeling short-period crustalphases (P, Lg) for long-range refraction profiles, Phys. of theEarth and Planet. Interiors, 31, (in press), 1982.
Sparlin, M.A., and Braile, L.W., Crustal structure of the eastern SnakeRiver plain determined from ray trace modeling of seismic refrac-tion data, J. Geophys. Res., 87, p. 2619-2633, 1982.
Wiggins, R.A., Body wave amplitude calculations-II, Geophys. J.R. Astr. Soc.,46, p. 1-10, 1976.
I _____
12
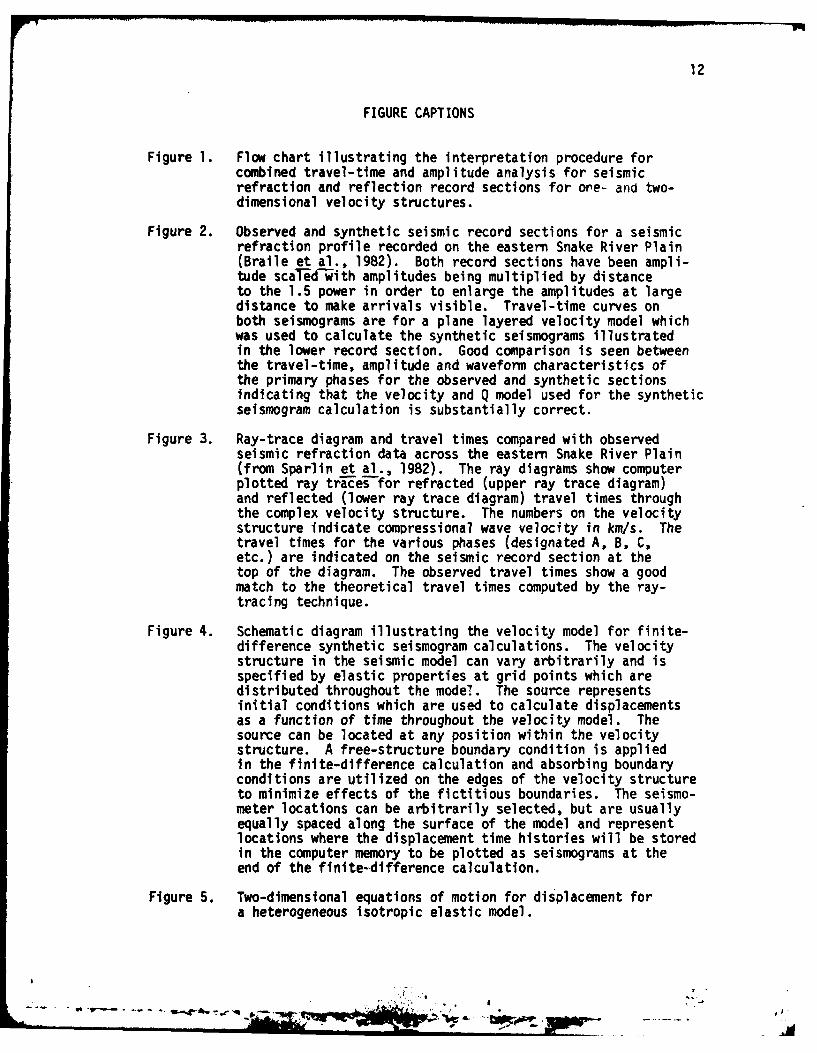
FIGURE CAPTIONS
Figure 1. Flow chart illustrating the interpretation procedure forcombined travel-time and amplitude analysis for seismicrefraction and reflection record sections for one- and two-dimensional velocity structures.
Figure 2. Observed and synthetic seismic record sections for a seismicrefraction profile recorded on the eastern Snake River Plain(Braile et al., 1982). Both record sections have been ampli-tude sca~id-ith amplitudes being multiplied by distanceto the 1.5 power in order to enlarge the amplitudes at largedistance to make arrivals visible. Travel-time curves onboth seismograms are for a plane layered velocity model whichwas used to calculate the synthetic seismograms illustratedin the lower record section. Good comparison is seen betweenthe travel-time, amplitude and waveform characteristics ofthe primary phases for the observed and synthetic sectionsindicating that the velocity and Q model used for the syntheticseismogram calculation is substantially correct.
Figure 3. Ray-trace diagram and travel times compared with observedseismic refraction data across the eastern Snake River Plain(from Sparlin et al., 1982). The ray diagrams show computerplotted ray ticesfor refracted (upper ray trace diagram)and reflected (lower ray trace diagram) travel times throughthe complex velocity structure. The numbers on the velocitystructure indicate compressional wave velocity in km/s. Thetravel times for the various phases (designated A, B, C,etc.) are indicated on the seismic record section at thetop of the diagram. The observed travel times show a goodmatch to the theoretical travel times computed by the ray-tracing technique.
Figure 4. Schematic diagram illustrating the velocity model for finite-difference synthetic seismogram calculations. The velocitystructure in the seismic model can vary arbitrarily and isspecified by elastic properties at grid points which aredistributed throughout the model. The source representsinitial conditions which are used to calculate displacementsas a function of time throughout the velocity model. Thesource can be located at any position within the velocitystructure. A free-structure boundary condition is appliedin the finite-difference calculation and absorbing boundaryconditions are utilized on the edges of the velocity structureto minimize effects of the fictitious boundaries. The seismo-meter locations can be arbitrarily selected, but are usuallyequally spaced along the surface of the model and representlocations where the displacement time histories will be storedin the computer memory to be plotted as seismograms at theend of the finite-difference calculation.
Figure 5. Two-dimensional equations of motion for displacement fora heterogeneous isotropic elastic model.

13
Figure 6. Form of the finite-difference approximations for second orderspatial derivatives and cross product spatial derivativesand second order time derivatives which are approximationsto the two-dimensional elastic equation of motion for displace-ments illustrated in Figure 5.
Figure 7. List of factors which must be considered in explicit finite-difference synthetic seismogram calculations.
Figure 8. Velocity depth models used for finite-difference syntheticseismogram calculations. Distance (X) and depth (Z) aregiven for each model. The lower boundary of each model isassumed to be an infinite half-space, but in fact, in theprogram it consists of a non-reflecting artificial boundary.The numbers within the model indicate the compressional wavevelocity in km/s for each layer of the models. Syntheticseismogram record sections and snapshots of displacementtime histories are shown for the velocity models indicatedin this figure.
Figure 9. Displacement time history snapshots for model INFL2. TheZ component is shown for times 1, 2, 3, 4, 5, 6 and 7 secondspropagation time. The source is located at I km depth and2 Iam distance from the origin. Distance (X) and depth (Z)directions are shown. The perspective diagram indicatesthe Z component of displacement at each instant of time forthe 7 different times represented by the snapshots. Thisvelocity model consists of a single layer over a half-space.The source consists of a compressional point explosive source.As the seismic waves propagate through the model, the dis-placement in X and Z directions can be visualized by thesesnapshots. Note that the moving-window process utilizedin the synthetic seismogram program causes the area of themodel to be shifted to the right (in the direction of increasingX) for successive time steps. This movement of the windowcan be seen by the shift in the X axis values shown at thebottom of each snapshot. The efficiency of the non-reflectingboundary can be seen by the snapshots, particularly at timestep T=2 seconds in which a comnpressional wave is impingingupon the lower boundary of the window space and no prominentreflection can be seen from this non-reflecting boundary.The development of a head wave due to propagation in the6 kmjs half-space below the 4.5 km/s sedimentary layer canbe seen beginning at approximately T=3 seconds and becomingmore pronounced with increasing time. The head wave is clearlyseen In the T-6 snapshot in which a strong compressionalpulse is propagating at a sharp angle upwards and to theright through the sedimentary layer toward the surface.
Figure 10. Synthetic seismograms calculated for model INFL3 (Figure 8)which consisted of a layer over a half-space. The Z componentseismograms were sampled at a 5 km distance interval andare plotted as a reduced-time record section. The strongestarrivals are the Rayleigh waves which begin at about li secondsreduced time on the 5 km distance seismogram but propagateat a relatively slow apparent velocity. The Rayleigh waves
1 -IWO"

14
are left behind by the moving-window process and thus arenot prominent after the first few seismograms. The directwave in the surface layer is visible as the 4.5 km/s apparentvelocity arrival indicated on the record section. The headwave from the 6 km/s half-space is clearly seen as a firstarrival from about 15 km to the maximum 50 km distance rangeconsidered. Additional arrivals consist of P-S conversionsand multiple ref ractions and reflections. Some numericalnoise exists in the later sections of several of the seismo-grams. However, this noise tends to be truncated by themoving window process as the window proceeds ahead of theslowly propagating noise and thus the numerical noise doesnot interfer with the primary phases which propagate in theearly portion of the record section. Also shown for comparisonis a record section calculated for the exact same model (INFL 3)by the modified reflectivity method for a similar sourcewavelet. The reflectivity calculation included phase velo-cities of 2.5 - 100 km/s and thus ignores some of the shearand surface wave arrivals. The correspondence between thetwo record sections is quite good demonstrating the accuracyof the finite-difference method.
Figure 11. Synthetic seismogram record sections for finite-differencecalculation for model INFL 5 (Figure 8). This model consistsof a two-dimensional velocity model with a prominent faultof 5 km offset which occurs 15 km from the source. The seismo-grams shown in the record section indicate the beginningsof a 6 km/s apparent velocity head-wave arrival in the firstthree seismograms and the delay due to the fault structureat 15 km distance is seen beginning at approximately 20 kmon the record section. However, full visualization of thetwo-dimensional effect of the fault structure on the syntheticseismogram is prevented by the presence of some peculiarnumerical noise which occurs in the record section. Thisnoise is caused by an improper choice of the velocity ofthe moving-window which is used to speed up the calculationsof the finite-difference synthetic seismogram program. Inthe moving-window calculation, the finite-difference equationsare solved for only a portion of the velocity model, calleda window, and this window is caused to move through the velo-city model in such a way as to constantly include the phasesof interest. The window is shifted in discrete steps toapproximately move at the average horizontal velocity ofthe seismic waves. However, in this particular example thevelocity of the window was selected slightly too slow andthe wave propagation of the first arrival (compressionalwaves) impinged upon the leading edge of the moving window.During the nexct shift in the window, this resulted in trunca-tion of the displacements at the former window position andthus this truncation effect caused the numerical noise whichis seen in the seismograms from 25 to 45 km distance range.This effect can certainly be avoided by rerunning the syntheticseismogram calculations utilizing a slightly faster velocityfor the moving-window. Vertical (Figure 118) and radial(Figure 11C) component seismograms calculated by the finite-difference method for model INFL 5 (Figure 8) with a correctedwindow velocity. The 6.0 kmn/s head wave is seen to be delayed
_e -W-*1

15
significantly and the amlitudes affected by the fault whichoccurs at a distance of 15 km in the model. Much of theenergy on the record sections is due to P-S conversions andRayleigh waves which are also included in the calculation.Note the small numerical dispersion of the Rayleigh wavetrain at about 3 to 4 seconds reduced time on the 5 km seismo-gram on the vertical component record section. This dispersionis due to too large of a grid spacing in the model for theslowly propagating Rayleigh waves. The spacing is howeveradequate for the body waves and thus only affects the Rayleighwave which in this case is not of primary interest.
- . . . , . . .q,,,,.b , .,Z"' "., -... , ,? ' -" .O__ 7 7 '* Y , .. fl.L

16
TABLE 1. SUMMARY OF SEISMIC INTERPRETATION TECHNIQUES
METHOD CHARACTERISTICS LIMITATIONS
Geometrical Ray Travel-times for Model geometry;HW theory calculation head waves and travel-times only.W of travel-times of reflections for
reflected and refracted plane or dippingphases (Program layered models;TXCURV). exact.
1 Ray Tracing Two-dimensional Travel-times only,(Program RAY2D) Models limited number of
phases, ignores P-Sconversions, guidedwaves and surfacewaves.
Reflectivity Wave-theoretical Restricted to 1-D(Program SYNCAL) solution to models.
response of a lay-ered half space.Includes P, SV,guided phases and
or surface waves.H IExact. Includes Q.
Disk Ray Theory 2-D models, approxi- Inexact amplitudes for(modified RAY2D mate solution for P head waves and near-program) waves, can include critical arrivals; ig-
reflection coeffi- nores guided phases,cients and Q. Com- P-S conversions and
N putationally effi- surface waves.Ccient.
Finite Difference 2-D models, exact Acoustic rather thanAcoustic (Program solution for all elastic. Large com-FDWVAC) wave types in an puter time.
En acoustic media.
Significantly fasterthan FDWVEQ, butslower than RAY2Dsynthetics.
Finite Difference 2-D models, exact Extensive computerElastic (Program solution for all time and storage.FDWVEQ) wave types in elastic
media. Can be modi-fied to include Q.
- - *~.t.77

17
INTERPRETATION PROCEDURE FOR COMBINEDTRAVEL TIME AND AMPLITUDE ANALYSIS OF SEISMIC
REFRACTION RECORD SECTIONS
SEISMIC RECORD SECTION
I
ICORRELATION OF PHASES
- TIME, AMPLITUDE ANDWAVEFORM CONTINUITY
STIME -DISTANCE PLOT
AMPLITUDE -DISTANCE PLOT
[RAVEL-TIME ANLSSTRAVEL TIME ANALYSIS
TRAVEL -TIME INVERS ION -RAYTRACING
ALITUDE-DI STANCE AMPLITUDE-DISTANCE ANALYSIS
ANALYSIS SYNTHETIC SEISMOGRAMS-SYNTHETIC SEISMOGRAMSFAST RAY THEORY ACOUSTIC FINITE DIFFERENCE
ELASTIC FINITE DIFFERENCE
ILIEARTrH goWEL F EARTH MODEL
Figure 1.

18
SHOT POINT 8 NEsw OSRE NE
4
X (K M)RN~u~x1 .5 SYNTHETIC
4-
-3
2p -
0 10 20 30 40 50 60 70 60 90 100 110X (KM) 1978 SRP SP 8 MODEL
Figure 2.

19
4 SE
CDD
0 50 100NW SE
F~ue3.3

20
I-
I- I
-55wq
Z0 U- z
wj -4 C w 0
- 0
QCI) CC
"mIoo.
l91
- --~ - ~ - -~Im

21
TWO DIMENSIONAL EQUATIONS OF MOTIONFOR DISPLACEMENT
( HETEROGENEOUS, ISOTROPIC MEDIA)
a2U a au aw au a
a = a- 2 aw+2j!2w+ Lp t 2 ax xax az f T 6x azl
WHERE: u(x, z) AND w(x, z) ARE DISPLACEMENTS
IN x AND z DIRECTIONS
a IS THE COMPRESSIONAL
pVELOCITY
S -- IS THE SHEAR VELOCITY
P IS THE DENSITY
Figure 5.
S- ,I.
- #-- -

22
FINITE DIFFERENCE APPROXIMATIONS
( EXPLICIT CASE)
SECOND ORDER SPATIAL DERIVATIVES
a-[ [2X. A- Ux, Z. 01 { a2Cm+.. n) [um+ I, n, I) - um, n, 1)
a a(m-. n [Uom. n, ) - u(m- I, n. 1/&H)
CROSS PRODUCT SPATIAL DERIVATIVES
3 - [, (.. ZA , t. 0 0 2 (m. n+ I uI I , n+ I) - u(m- 1. n* I 1
-a 2 (m.. n-I) l(m+ I. n-I i 1) - U(m- I, n- I, ()]} 4 (&H) 2
SECOND ORDER TIME DERIVATIVE
U (m. n. 1+ 1) - 2 U(m, n. I) U u(m. n. I -I ) + f [ Spatial derivatives]
WHERE: 02(m±j,. n) [azcm±1, n) + a?(m~n)]/
mi AND n REFER TO THE x AND z DIRECTION
GRID POINTS AND I IS THE TIME STEP
Figure 6.
W---r. "k, -w
ENEMA-. qmw ,-, r r ,. "y:r,.

23
PRACTICAL ASPECTS OF EXPLICIT FINITE DIFFERENCESYNTHETIC SEISMOGRAM CALCULATION
- TWO DIMENSIONAL APPLICATION
- SOURCE GENERATION
- FREE SURFACE BOUNDARY CONDITION
- ABSORBING BOUNDARIES AT EDGES OF MODEL
- STABILITY CONDITION (SMALL TIME STEP)
- ACCURACY CONDITION (SMALL GRID SPACING)
- NUMBER OF TIME STEPS (LENGTH OF SEISMOGRAMS)
- NUMBER OF GRID POINTS
- LARGE COMPUTER TIME AND STORAGE REQUIREMENTS
Fi gure 7.

24
'r~; Ag bbv
4
16 4 AvY
qp b q 4
4~ ~ A
4L V
I'v 4 4
6. & %~4 4 &
gbv4 a 9 "4 V4 4 4b'4
o
A & V V
1 1 ) 4 f 4 .9
4kx 4 Vo .. P_ k A LA
~. 2:
,bp4SPT 0VPw
44
.. b .4 4 4 .
0 ,4(W&I Z2-1 4(W,,) T
1. .--
cc " , V

25
19 A
o - A AI
A. 7
Wph V
~A V
A4 ~ 9
4 A V 31
&' A ' 4 6 A ,.
iV1 . 1,9 /1-f W
aA d 4V 4 i q*
i** b b. 4 V & 1'4-9 of~'/~ 0
Id.
w P. 1% II go~~~.~ 144 P. A( -
Vbq A A, Io
CO 4 A 4 C4 4 4 ,A W r,-.#
LL4 W.& *V, %SA aV w ,V
..... 'I q4 l ( %.4 OD
A A V V %%
44Ab 4~P4
6 46 T £41 W/ LL-
............b44 4 1h.4bPq49 S~.'... ........ ~( ~
A w

LD__26
LL. 0n
N L
X Oa
w
0
C,,o

27
Lo)
LI)
28
ANA

29
LO)
NJ
I I . . .
cm

30
LI)
.
doltA.

31
LI)
NO
Eu.

32
LI)
Na
0cNL
- .- ~-- -: ~~1-.

33
LL I II
JLLJ-
zolik

34
LUJ
Co-
LOfLUJ
CD CLO
O-
CD --
CD
mI
()o CDA~ /-
Ux
X , 1
a_- '~I~'

35
zwLO z
.J 0
L)J
1 .0NN
(S) 9/X-l
-~~~~~ - -.- - s - clot'-

36
0
0 LoW
LLJ w~ww
(.I) Zow
um N 1- (00
ClC)w 0
zw
w0
IL
C3~ E

37
U) o P
00 0Lo
w "~w)
IL
00(wZ
LL
cr.a

38
DISTRIBUTION LIST
Chief of Naval Research Director, Environmental Sciences DirectorateDepartment of the Navy Geophysical Sciences Division800 North Quincy Street Office of Naval ResearchArlington, Virginia 22217 800 North Quincy Street
Code 10O00 (1) Arlington, VA 22217 (1)Code 460 (1)Code 463 (5) Air Force Office of Scientific ResearchCode 480 (1) Department of the Air ForceCode 420 01) Directorate of Physics (MPG)
ONR Resident Representative Building 410Ohio State Univ. Research Center Bolling Air Force Base1314 Kinnear Road WsigoD 03 1Columbus, OH 43212 WahngoDC233)1
Army Research OfficeDirector Department of the ArmyNaval Research Laboratory Geosciences DivisionCode 2627 Box 12211Washington, DC 20375 (6) Research Triangle Park, NC 27709 (1)
Director Defense Technical Information CenterDefense Advanced Research Building 5Projects Agency Cameron Station1400 Wilson Boulevard Alexandria, VA 22314 (12)Arlington, VA 22209 (1)
Procuring Contracting Officer, Code 614B:DAWOffice of Naval Research Office of Naval ResearchBranch Office/Chicago Department of the Navy536 South Clark St. 800 North Quincy StreetChicago, IL 60605 (1) Arlington, VA 22217 (1)

39
SUPPLEMENTARY DISTRIBUTION LIST
Division of Sponsored Programs Dr. Mark OdegardPurdue University Dept. of PhysicsWest Lafayette, IN 47907 (1) New Mexico State University
Las Cruces, NM 88003 (1)
Dr. Robert B. SmithDept. of Geology & Geophysics Dr. Robert E. HoutzUniversity of Utah Lamont-Doherty Geological Obs.Salt Lake City, UT 84112 (1) Columbia University
New York, NY 10029 (1)
Dr. John KuoHenry Krumb School of Mines Dr. John G. HeacockColumbia University Earth Physics Program, Code 463New York, NY 10027 (1) Office of Naval Research
Arlington, VA 22217
Dr. G.R. KellerDept. of Geological Sciences Dr. R.F. ObrochtaUniversity of Texas, El Paso Office of Naval ResearchEl Paso, TX 79968 (1) 800 N. Quincy Street
Arlingtor, VA 22217 (l)Dr. Ken OlsenLASL, Group G-7 Dr. Murray MacDonaldMS 676 Code 425PO Box 1663 Geology & GeophysicsLos Alamos, NM 87545 Office of Naval Research
Bay St. Louis, MS 39522 (1)
-9W'-7 ,, , .rI,.

40
APPENDIX I
The following papers or abstracts of theses reporting research sup-
ported by the Earth Physics Program of the Office of Naval Research have
been published or are in press. Copies of the papers or abstracts are
included in this appendix.
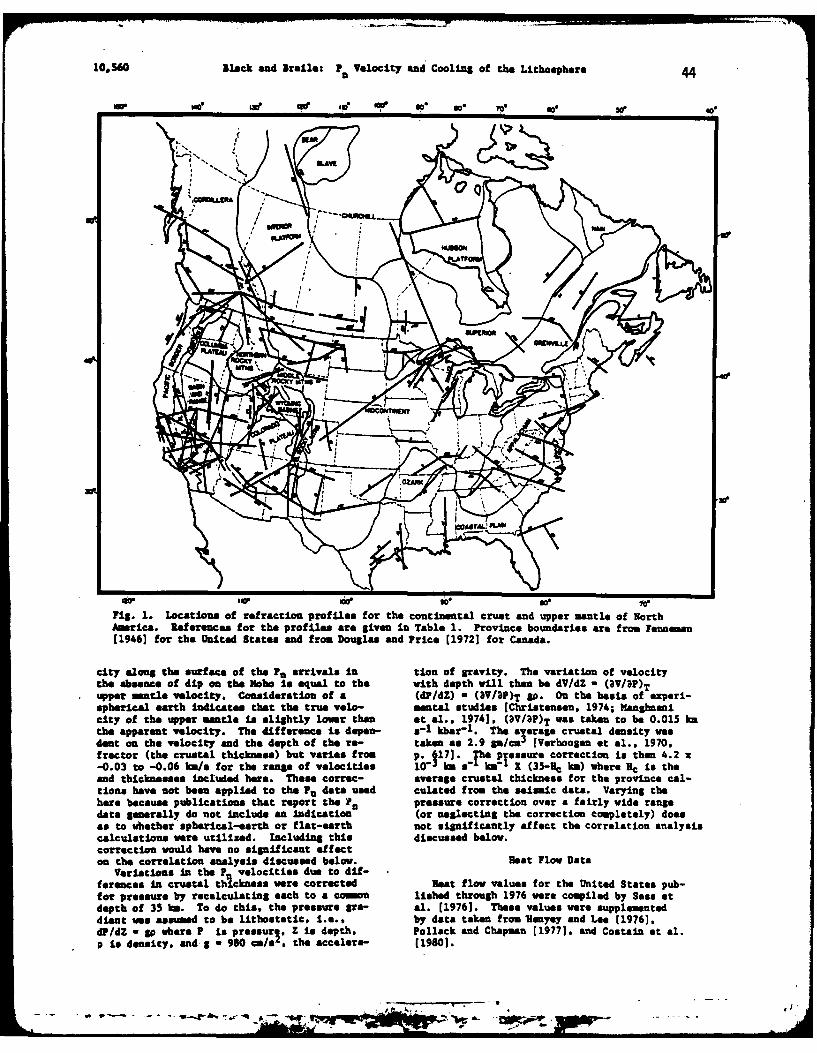
Black, P.R. and L.W. Braile, Pn velocity and cooling of the continentallithosphere, J. Geophys. Res., 87, 10557-10568, 1982.
Olsen, K.H. and L.W. Braile, Seismograms of explosions at regional dis-tances in the western United States: Observations and reflectivitymethod modeling, in Identification of Seismic Sources - Earthquakeor Underground Explosion, edited by E.S. Husebye and S. Mykkeltveit,453-466, Reidel, 1981.
Olsen, K.H., L.W. Braile and P.A. Johnson, Seismic velocity and Q-structureof the upper mantle lid and low velocity zone for the eastern GreatBasin, Geophy. Res. Letters, 7, 1029-1032, 1980.
Olsen, K.H., L.W. Braile and J.N. Stewart, Modeling short-period crustalphases (P, Lg) for long-range refraction profiles, Phys. of theEarth and Planet. Interiors, 31, (in press), 1982.
Banda, E., N. Deichmann, L.W. Braile and J. Ansorge, Amplitude studyof the Pg phase, J. Geophysics, (in press), 1982.
Espindola, J.M., Finite difference synthetic seismograms for kinematicmodels of the earthquake source, Ph.D. thesis, Purdue Univ., WestLafayette, IN, 151 p., 1979.
Mazzella, F.E., The generation of synthetic seismograms for laterallyheterogeneous models using the finite difference technique, Ph.D.Thesis, Purdue Univ., West Lafayette, IN, 225 p., 1979.
-- . - h O ~b . 4 .

JOUIRNAL OF GEOPHYSICAL RESEARCH, VOL. 87. NO. 613, PAGES 10,557-10,568, DECO43ER 10, 1982 41
P VELOCIT! AM COOLING OF TE CITIENTAL LITHOSpYER
Paul It. Black1 and Lawrence V. Brail
Department of Geosciences, Purdue University, Vest Lafayette. Indiana 47907
Abstract. Average upper mantle P. velocities the assmption of isostasy requirea variationsand beat flow were computed within continental of density in the upper mantle and hbe aphysiographic provinces In North America from relationship between Pn and density.* Re notes.publtshed data. F. velocity and heat flow data howver, that '...elevated temperatures maydisplay an Inverse relationship and were found affect velocity more than density' [Pakimer,to correlate with a statistically significant 1963, p. 5754)..correlation coefficient. Temperatures at the This study was undertaken in an attempt tocrust-mantle boundary were estimated from the quantitatively determine the relationship be-heat flow values, and these were used to demon- tween continental ?n velocities and heat flow.strata a correlation between P vilocity and and to determin, whether the implied tempera-tomperatme of upper-mantle material. The ture variations alone are sufficient to be avalue of (3Pn43T)ptbus obtained (-4.4 x 10⁻⁴ viable explanation for the variation in upperto -8.1 x 10-q be s-' C-1) is within the range mantle saanmc velocity. The continental crust.of temperature derivatives determined from and upper mantle of North America ws selectedlaboratory studies of ultramafic rocks. This for study because of the largo number of se-dependency of Pu velocity on temperature In- mic refraction profiles and heat flow easure-plies that one possible explanation for the sants available and because of the range ofobserved geographical distribution in upper- heat flow values present. Ncaue the loca-mantle seismic velocity Is that the variation tions of seismic and thermal observations doIn Pn velocity s primarily a temperature not coincide. and because of large uncertaintiesaffect. Combined with the relationship be- which are possible In any given observation.tween beat flow and crustal age for continents, the data were grouped by provinces and meanthe PU versus heat flow correlation suggests values for each province analyzed.a relationship between P. velocity and crustalage, probably due to progressive cooling of Seismic Datathe continental lithospbere after a thern-tectonic event. One-hundred thirty-one seismic refraction pro-
fulas for the continental crust and upper mantleIntroduction of North America were compiled from publishad lit-
ersature and other sources (Table 1). ObservedSaismologists have ben swere of variations Pa velocities and crustal thicmkness wore tabu-
of continental upper-mantle compressional-wave lated from the profiles resulting in 153 observa-velocity Cnp' velocity at the ohorovidid di- tions of the continental ?n velocity. The datacontinuity) on a regional scale since about were sorted according to pysioSraphic province1960 [Merre., 1969]. The Implications of this (Feunnnan [19461 for the United States andobservation are not clearly understood, however, Douglas and Price (1972] for Canada) and manand several possible explanations have bean P. velocity and crustal thickness were calculatedsuggested. Horat and Simons (19681 found a for each province (Table 2). The locationscorrelation between travel-time anomalies for of the sat--ic profiles and the physiographicthe Longshot nuclear explosion and heat flow. provinces are shown in Figure 1. EstimatedThey could not dmenstrata a similar corres- errors for the man Pa velocity and crustalpondnce with gravity. They concluded that thickness were taken to be the estimated stan-ther al anomalies in the upper mntle (perhaps dard deviation of the marn, S a o/rf, where50-km deep) were the probable cause of travel- a is the standard deviation of the data (Pntime anomalies. Pakiser and Stainhart (19641, or 1c for a given province) and N is the numberand Vqrren and Healy (1973). on the other hand, :f observations. The estimated standard devia-related Pn and mean crustal velocities to den- tion of the mean provides a reasonable choicesity variations. Chus [19771 attributed varn-- for estimating the uncertainty of the nm ?ntions in Pn to compositional differences In velocity for each province because possiblethe upper antle. Fagernes and Kanestrom [19731 errors of Individual P observations are gener-found that variations In the ratio of PU velo- ally not given. However, S is likely to becity to S velocity within a region were too a poor estimate of the uncertainty of the meanlarie to e explained solely by temperature Pn value for provinces containing only a mallvariations, and proposed density variations n"nber of observations such as the Cascadeas the cause. Pakiser (1963], noting that Pn Range, middle Rocky Mountains, southern tockyand crustal thickness are related, found that Mountains, and Colunbia Plateau provinces.
Two possible sources of errors In the PnNow at Zureke Resources Associates, observations have not been analyzed In detail,
Berkeley, California 94704. but are expected to be negligible for the pur-pose of correlation of Pn velocity and heat
Copyright 1982 by the American Geophysical Union. flow by province. They are velocity anisotropyand differences in the apparent and true P. velo-
Paper umber 211100. city due to the earth's sphericity. Although0148-0227/62/002b-110005.00 velocity anisotrophy in the upper mantle of
I,S - -w 9--.- -. t h* - -' - *.

10o5S842Black and Braail: P n Velocity and Cooling of the Lithosphre
TAMK 1. Seismic Refraction Profiles for North America
Profile Reforence Profile Reference
I Richards and Walker (19591 178 Bales and Nation (197312,3 Johnson and Couch (1970] 179 1111 197214,5,6,7 EvIng et al. [1966) 184 Jackson and Pakiser [19656.9 Stewart 1968a, 185 Braila et al. [1974110 Roller 119651 193 Kller et al. [19751Ul Diment et al. [19611 194 Holes and Nation (1973Ul Roller (1964]; Prodehl (19791 195 Olson et &1. [1979)U Langston and ealaborger [19741 198 &arr [1971]12 Hamilton et &i. [19641 199 Kareu and Hunter 11969113 4er et al. (19663 200 Hodgmon 11953]14 Johnson (19651 201,202 Hall and Hsjnal [1973313,16 Mit.,hell and Lmndlse (19713 204,205 Greem et al. (1980]17 Topposada and Sanford (1976] 206 Lyons et ai. (1980118.19 Healy (19631 207 White and Savage (1965)20 Roller and Jacken 119663 208 Warren et al. 11972121,22,23 atz (19541 212 Hill and Pakiser (1966)28,29 Eaton (19631 216 Carder [1973)31 Gibbs and Roller (1966] 217 Forsyth at al. [1974132 Carder et al. [1970] 218,219 Hobeon et al. (1967133 Ryanl and Stuart (19631 220 Glsh et al. 11981135 Berry end Vest [19663 221 Smith et al. (1982)36,37 Cohon end Meyer 119663 222 Sparlin et a. [1982]38 Cra 119611 223 Baldwin [1980]39 Dorman et al. [19721 225 Hall and Hajual [1969)40 McCany and Meyer (19663 226 Sinno et al. [1981)41 Merkel and Alexander (1969] 227,228 Sbor at al. (1968)42 Warren et al. [1966) 229 Reller at al. [1975;43,44 Warre 11969] Mueller and landismn [1971145 Hales et a. (1970] 230 Cleo et a. 11974146 Wlliden [19653 231 Martin [1978147 Jackson at al. 11963) 232 NeMru and Jobidom (1971]48 Jckson and Pekiser [19651; 233,234,
Prodehl end Pekiser [1980) 235,236 Barry and Forsyth (1975)49 Chandra and Cumings (1972) 237,238 Eaton (1966350 Benett et al. [19751 239.240 S zwart (1968b]51,52 Johmon at al. (1972) 241 Bralle at &1. 11982153.54,55 Brry and Fuchs [1973] 242.243,56,57.58, 244,245,59.60.61, 246,247,62.63 McCamy end Meyer [19643 248 Prodehl (1979164 Roller and Healy (19633 249.250.66 Ewing et al. (1955) 251 Warron and Jackson (1968168,69 Hersey et ai. (19593 252,253 Rimey et al. (1962172 1ereu et al. (1976) 254.,255 James et l. (1966175,76 Stauber and Boore 11978) 256 Bates and Bll (1975186,7 Barrett at al. (1964] 257 Tuve 11951); Steinhart and Meyer 11961]154 Shot (19623 256 Steimhart and Mayer 119611157 Steinhart end Meyer 119613 259 Tuve (1953); Stelnbart and Meyor (19611158 Slichter (1951; 260 Tuve [19541; Steinhart and Meyer (19613
Steinhart and meyer [19611 261 Warren (1968163 Steinhart and Meyer 11961) 262 Steinhart et al. [1964]167 Press (1960) 263 Hales at al. (19618173.174 Slichter 119511;
Steinbart and Meyer [19611175 Berg et al. 119601
continents has been reported [amord, 19731, province but would not be expected to signifi-an analysis of western United States data by cantly affect the mean value of Pn. Of course,l--ford et al. [19791 found a relatively mall for provinces that have only a few observations,and poorly defined anisotropy of about 3Z. Be- the effect could be more pronounced. Possiblecause the azimuths of the seismic retfraction errors due to neglect of consideration of theprofiles within each province are randomly die- spherical earth can be evaluated and shomn totributed, any anisotropy present would con- be mall. The errors are due to the fact thattribute to a larger estimated standard deviation many analyses of sismic velocitles utilizeof the mean for the PQ meaesurements for the a flat-earth formulatLon in which apparent veolo-
..
Vsit

Black and Brala: P n Velocity and Cooling of the Lithoapbere 10,159
Ls44 wo a 00'44 400 "00%
N4- f*4
40 .4
14 4-1.4.4 1414
11-4I'-4C10- -a
0t0
1.04 " 1 SO "1 140.
S. 000000000000 1-
l~.a
614 41 I" P. a
*4 W P I p p. % I p- e a v
4. w 4 0a~~ ~~~ ~ ~~~ *0mW -%aN9 mM404'
wo lao *
is 0 40 -0 a - -1 W60i:*
'a4 00I
.2 0468" a's1146P v4 is I I m
a a 0 00 Pe
4 4 V sa 6
U 640- 'V143
"w
10,S60 Black and Braila: P Velocity and Cooling of the Lithosphere 4a 4
or we V LW V N * e 11r ge 0e seSOP
IMAN.
La. S~O*S A
us. . Loaionof ercinpoieLortecnietlcutanMpe ateo ot
Ameria. Rfereces ou th Prflsaegvni al rvneb~dre r rmFnea
[196] or he nied tats ad romDoulaaan Prce 197SLOranda
city alon the scAo h ~arvl i ino rvt.Te aito fvlctthe bsene ofdip naeHb seult h ihdphwl hnb Vd
speical e.Lartincs thefatinpoefr the truevtimental ctudist anChristensent 197f Worthe
city6 of the Unper edntle s lihtl lower thgland Pe al1971, for/Canadasae obe005h
ciyogthe appretfelcity. The differncels dIn-o ofl ravt. The aratan dfesitywsdentsnc i on the velcio andqalt the wt depth ofl the e a en be 2. m/u Verhog t al.,1970
-0.03 mtl00em o herneo velocitiesnsdrtino a0 hePdZ -~n (D/K 90-H On) ther bass h eeandhticalnesses Iicae hre thestre vorc- aeraeutal tes(hiknsor. th74 provinal-ctos he notpeen mapled to slgte lowedatan d catd from the4) seicT ata taying he 05kthee baue puliction Thtptthe difpresence codp-a- brr Teto oerag fairtly det ragdant gnteallot nth nldept anidctoo(rnget the r-tkna2. ocorVrction coltly) does,factor (htherussphericerth ort fla-esrth not1. Tigifianlyeafferte correlaiston analysxcalculton -0ere uftile rncang ofvltis dicse below.1(3-e heeK i hcorretioknese wouldued nore sigifian effec vrg rsa hcns o h rvnecltons the oen analyisdt h disusse u ctd below thea elomi data. ayn h
aritionus pbintn P ha veoctesor due o dif-ecrrcinoerafil wd agfera enea i crut tnlcune wer Idcretedn (onetin twhales foreten Unitettesy puesfs o presur brealulatingoeachtart coot sniicahed through 196ee coilediby Sa etdeputhons we. uodtisd thcprdsne this disuss (171.eselusweesupemneointh woeeato bealistiscse ibel. bydtBaknfoey endw D ee(1961
dP/dZ - go where P is pressurl. Z in depth, Pollack and Chapman (19771. and Costain at al.p is density, and g *960 cm/s . the accelera- (19601.

45Black and Aralle: P, Velocity and Cooling of the Lithosphere 10.$61
TABL 3. Regression Parameters for Pune A + Bq and Pn " A + STU
Regression Provinces 4
Case Variables ethod Excluded N A C A (xl0) 0,(x 1 ) . a
I qo - Pn MEA - 13 8.420 0.123 -68.8 15.9 -0.550 0.10
2 qo - P LSQC - 13 8.386 0.121 -68.0 19.4 -0.550 0.10
3 qo " Pn R-A S 12 8.487 0.131 -75.6 16.0 -0.679 0.05
4 qo - Pn LSQC SN 12 8.516 0.113 -82.9 17.4 -0.679 0.05
5 Tm - P RNA - 13 8.271 0.097 -4.11 0.97 -0.519 0.10
6 T - P LSQC - 13 8.490 0.135 -8.46 2.15 -0.519 0.10
7 Te - P A SN 12 8.312 0.102 -4.40 1.00 -0.619 0.05
8 Tm - P n LSQC SN 12 8.456 0.112 -7.29 1.70 -0.619 0.05
9 To P- RNA S.1S 11 8.370 0.119 -5.53 1.26 -0.653 0.05
10 Tm - Pn LSQC SNSR 11 8.488 0.117 -8.08 1.88 -0.653 0.05
11 qo- Pn LSQ - 13 8.223 0.115 -37.8 17.3 -0.550 0.10
12 qo - P n LSQ S1 12 8.327 0.120 -51.3 17.5 -0.679 0.05
13 Te - P, USQ - 13 8.133 0.082 -2.13 1.06 -0.519 0.10
14 Ta - P, LSQ SK 12 8.189 0.088 -2.72 1.09 -0.619 0.05
15 Ta - Pa LSQ SmoSi 11 8.240 0.101 -3.61 1.40 -0.653 0.05
qo - beat flow averaged by province; Pn " upper mantle compressional wave velocityaveraged by province (In/a); Tm - temperature estimate at the Hoho (*C); RMA - reducedmajor axis method; LSQC - least squares cubic method; LSQ - standard least squareslinear regression; SN - Sierra Nevada province; SR - southern Rocky Mountains province;N - number of data points; A - Intercept; CA - estimated standard deviation of .A; B -slope; a - estimated standard deviation of 3; r - correlation coefficient; a - level
of sianlicance for t.
Beat flow values were sorted by province. estimated uncertainties in heat flow and cruatal
and the mean and estimated standard deviation thicoess for each province (Table 2).
of the mean were calculated for sach province(Table 21. Values of beat flow greater than Correlation200 m/u mare considered anomalous and elimi-nated. Such a high value for observed beat The correlations of continental upper mantleflow generally implies the action of hydro- ncaimic velocity (
1?a) and heat flow (q.) as well
thermal systems or other near-surface conditions as Pn velocity and temperature estimated at thenot representative of the regional heat flow. Hobo-(Tm) wers evaluated by least-squares linear
regression of the form y - A + Nx where y is
Temperatures the Pu variable and x is qo or T_. The coef-ficients A (intercspt), *8(alope', and the cor-
In order to evaluate the possible dependence relation coefficient (r), as ell as standardof the P. velocity on temperature, the tempera- deviations estimates of A (aA) and B (oB ) , were
ture at the ohoroviai& discontinuity (Hobo) calculated and are given in Table 3. It is
for each province must be calculated. Such ell-known that standard linear regression
thermal calculations would require additional methods (x considered the independent variableinformation on the thermal conductivity and -and y considered the dependent variable) yield
heat generation values for each province. In unreliable estimates of the A and B coefficientsaddition, assaptions pertaining to thermal for the situation in which both the x and y
equilibria, the distribution of heat producing variables are subject to error. This can be
elements and the possible contributions of ther- easily demonstrated by comparing the results
ml convection to the heat flow would have to of the regressions for y on x and for x on y.
be made for each province. Such an analysis Because both the x(qo or Ts) and y(Pn) variables
is beyond the scope of this study and, therefore, analysed here are subject to error, the 're-
e have estimated the temperature at the Moho duced major axis' (WNA) and the 'least-squares
beneath each province by utilizing the Sao- cubic' (LSQC) methods of linear regression were
thermal gradient curves presented by Lachenbruch utilized in order to evaluate the correlation
and Sass (19771. The tmperature estimates of Pn versus qo and PC versus Tm. In the MNA
were interpolated from the curves of Lacbenbruch method [Kereackand Raldane. 1950). the x and
and Sass (19771, using the average heat flow y variables are scaled by standard deviations
and crustal thicknes calculated here (Table 2). of the data and the perpendicular distances
Temperature error eastimates are based on the of points to the least squares line are minimized.
" .... 'rd "rv. - . . . l , ml .; swm . ....

10,562 Black and ]ralls: Fe Velocity and Cooling of 'the Lithosphere 46
P% VELOCfl. AND HM FLWNORTH AMER"A
0.5 1.O 1.5 2.0 U
-. '',-0,7,-A4 L--OATh R AUSRAIA CCUj.I \ aEXCLUDEDZ S TD. EV. "
2 ." -, " .. O I . /97 9
7. - Cot --
20 t0 o O 100O IEAT FLOW (.W/ t )
Fit. 2. Pn velocity and heat flow data averaged by province for North America. The pro-vince abbreviations and the data are given in Table 2. Error bars correspond to plus andminus two estimated standard errors of the mean for the Pn and heat flow observations.The best fitting regression line for the case of the Sierra Nevada province excluded isshown along with the regression parameters (case 4, Table 3). Data from Australia [Culland Denham. 19793 are shown by triangles with error bars (for heat flaw only) indicatingplus and minus one standard deviation. Each of the Australian data points correspondsto an individual geological province. The data from Australia were not used in the re-gression line calculation.
In the LSQC method [York. 1966. 19671, each given in Table 3. Regression parameters forobservation is weighted according to Its seti- standard least squares fit to the qo-P andmated error in both the x and y directions. Tm-Pn data are shown for comparison wth theThe solution of a cubic equation yields the EA and LSQC methods as cases 11 to 15 in Tablecoefficients A and 3 and estimates of their 3. The correlation coefficient r and the aeso-standard deviations. Because each data point ciated level of significance a are determinedis individually weighted, and because errors from the linear correlation of the observationin both variables are considered. this method without regard to estimated errors in the datahas the advantage that data points with the and, therefore, are the same for the threesmeallest errors have the greatest effect on methods.the regression line. The regression parmeters The Pn velocity data are plotted versus beatfor the correlations of Pn velocity and heat flow and estimated temperature at the Koho inflow and for P velocity and temperature are Figures 2 and 3. Error bars for the mean Pa
P. VELOCITY AND ESTUMD TEMPRATUREAT THE MOHOOO0.& Qb" To EiT*AhJM E&WO
~~di.( s, XCL/ DED \5%
c I
900 4W0 @W' 1O000 1200 1400To EUTITED TEWERATURE AT MOO M
Fig. 3. P velocity and estimated temprature at the Noho dsta averaged by provincefor North 1merIca. The province abbreviations and data are given in Table 2. Errorbars correspond to plus and minus two estimated standard deviations of the mean cal-culated for the Pn data and estimated error limits for the temperatures. The bestfitting regression line for the case of the Sierra Nevada province excluded is shownalon with the regression paraeters (case 6, Table 3).
$6 Il 4e_ _ . __ _ .. = , ,. . -" ,, Z.

47lack and Bralle: P, Velocity and Cooling of the Lithosphere 10,563
TABLE 4. Comparison of Temperature Derivatives Inferred FromPn - T Regression vith Laboratory Determinations of
(3VP/3T)p for Ultramafic Rocks
3V 4P 10 Reference
-4.4 to -8.1 Regression of Pa and T (this study]-4.12 Dunite [Kern and Richter, 19811-4.94 Peridotite (Kern and Richter, 1981]-5.6 Dunite [Christensen. 1979]-6.1 Dunite [Ramananantoandro and Manghmani, 19781-4.4 Peridotite. data from FTilits [19761-6.5 Harxburgite (Peselnick and Nicolas. 19781-6.7 harzburgite [Peelnick and Nicolas. 1978)-5.6 Heraburgite [Peselnick and Nicolas. 1978]-7.1 Lherzolite (Peselnick and Nicol", 1978)-6.7 Lharzolita (Peselnick and Nicolas, 1978]-6.2 Hrzburgice [Peselnick et al., 1977] (corrected
values by Peselnick and Nicolas 11978])-6.9 Haraburgite [Peselnick et al., 1977] (corrected
values by Peselnick and Nicholas [1978])
velocity and heat flow values are scaled to the correlations of qo and Pu or T and P. areplus and inus two estimated standard devia- statistically significant, the diferenc e
tions of the mean that correspond approximately between the Intercept and slope coefficientsto 95% confidence intervals. The error bars for the various regressions shown In Table 3for temperature at the Hobo are estimated by (cases 1-4 for q and P ; cases 5-10 for Tthe range of temperatures read from the gao- and P) are not lignif i6nt. "thermal gradient curves of Lachenbruch and Sas[1977) corresponding to the 951 confidence Laboratory Datainterval ranges of observed heat flow andcrustal thickness. The best fitting regres- To determine whether the regional variationssion lines for the case of the Sierra Nevada in temperature calculated from beat flow areprovince excluded are also shown in Figures sufficient to explain the entire variation in2 and 3. continental Pn velocities, experimental values
If the Sierra Nevada data point is excluded of (WVp/DT)p must be considered. The regres-from the least squares calculations, the cor- sion line val__es found in this study -4.4 z 104relations between heat flow and Pn velocity to -8.1 10-' km/s/C compare well with theand between temperature and F. velocity are range of experimental measurements of the tem-statistically significant at the a - 0.05 level perature derivatives of compressional velocityof significance (cases 3, 4, 7. 8, 9 and 10, for ultranafic rocks as shown In Table 4. Al-Table 3). The Sierra Nevada data point is one though other factors could also have a signifi-of the most discrepant points on the plots cant effect, these results are consistent withshown in Figures 2 and 3 and its exclusion from the hypothesis that temperature effects couldthe regression calculations is based on the explain the entire observed variation in Pnfact that the estimated mantle heat flow for velocity between provinces.the Sierra Nevada is anomalously low [Blackwell.1971] and thus the estimated temperature at the DiscussionHobo based on average surface heat flow maybe substantially In error. The estimated This study has demonstrated a statisticallyteprature at the Hobo for the Southern Rocky significant relationship between continentalMountains (SR) province also appears highly P. velocity and heat flow on a regional scaleanomalous (Figure 3). The high value of In- for North America. Beat flow has also beenferred temperature is due to the large average related to crustal age [Polyak and Smirnov.crustal thickness of the SR Province and the 19681 and to thickne,8 of the lithosphererelatively high observed beat flow (Table 2). (Crough and Thompson. 1976; Pollack andSuch a high temperature should not exist at Chapman. 1977; Kono and Amsno, 1978]. Figurethe Hoho because it Is above the melting points 4 shows the observed relationship between P.for likely mantle and lower crustal rocks. velocity. crustal age, and heat flow whichUowever. because of the large error bars asso- was obtained by using the relationship betweenciated with the SR data point, its inclusion heat flow and age determined by Polyak andIn the regression analysis has little effect Smirnov [1968) (as plotted by Chapman andon the resulting slope estimates (compare cases Pollack (1975]) and the relationship between7 and 9 or 8 and 10 from Table 3). Although heat flow and Pn velocity found in this study.
- ~ ~ ~ ~ 5 W W -... h-.~-

10,564 Black and Brail: Pn Velocity and Cooling of the Lithosphere 48
HEAT FLOW, Pn VELOCITY ANDAGE FOR CONTINENTAL CRUST
2.5-A00 A A I A 1 ' ' -7 - 7.7
o q0 - AGE DATA. WORLDWIDE (C N ANDPVLLACK. 1975)
CAC*O 7.82-0 -o W + P f AG E DATA. NORTH AmEic wrrH EsT.1o ERROR SOUINDS
j. 8J 0 _
SR3~~ 2.0 -~~G AG DATA. NOARTHAEIASIHET
- s' 1MRZ~ 1.5 60 o 4
40 -- 8.2 G
-8.30.5 20 I_ m I I *
0 500 1000 1500AGE (Id(f) YEARS
0 o501000 1500
3100-P92K
200-
300-
Pig. 4. Relationship of observed at flow. crustal age and Pn velocity. Beat flowage data are from Polyak and Smirnov (1968] as plotted by Chapman and Pollack [1975]for continents. Pn velocity - heat flow relation is inferred by the linear regressionfor North American data shown in Figure 2. Crustal age is interpreted as time sincethe last thermal event affecting the continental lithosphere. Lover schematic dia-gran illustrates the evolution of the continental lithosphere and upper antle velo-city as a function of time (cooling of the lithosphere). Pn values are in km/s infer-red from the qo - Pn - age curve above and the T, estimates (in "C) are inferred fromthe Pn -
T m relationship illustrated in Figure 3. The depth to the base of the litho-sphere is shown based on the depth to the estimated temperature of partial mlting ofupper mantle materials from the model of Pollack and Chapman 11977]. The dotted linein the lower part of the figure show the lithosphere-asthenosphere boundary accordingto the relation determined by Kono and Amano [19783.
Although correlations of heat flow ago and differentiation by magmatic processes) and. (2)heat flow P velocity do not necessarily Imply that variations in Pn velocity are due to aniso-a causal relationship between age and Pn velo- tropy in which the degree of orientation ofcity, the Pn versus age estimates for provinces nisotropic mineral grains varies with time.in North America shown in Figure 4 suggest Rybacb and Buntsbarth 11982) have recently pre-that this relationship is valid. Lithospheric santed data to Indicate that seismic velocitythickness astimates from Pollack and Chapman and heat generation in crystalline rocks are[19771 and Kons and Amano (1978) are also shown inversely related and thus variations in com-in Figure 4. These results suggest that thick- position (and, therefore, heat generation)suing of the lithosphere and an increase in could be a controlling factor in variationsupper mantle Pn velocity are related processes in upper mantle seismic velocity. However,caused by cooling of the continental litho- the agremnt of (aln/3T)p. estimated fromsphere with time after a thermo-tectonic event, the regression of Tm and Pn with experimentallyThe observed range of continental upper mantle determined temperature derivatives for ultra-Pn velocities (27.6 - 8.3 Wals) can be explained mafic rocks suggests that the entire variationas primarily the results of regional differences may be due to temperature effects.in temperature at the Hoho discontinuity. Data from North America were selected for
Alternative explanations for the heat flow, the analysis of the relation between Pn velo-P and crustal age data are (1) that Pn velo- city and heat flow because the voltae andclty is a function of composition that may vary geographical distribution of data were euf-with age (for example, by loss of volatiles or ficient to permit statistical analysis. A
-. . 4
. . . .. .. . .. ll III IIn
!f Ai

49Black and Braile: Pn Velocity and Cooling of the Lithosphere 1056S
similar Pn versus heat flow relationship (Tig- The Earth Beneath the Continents, Geophys.uar 2) was suggested by Cull and Denham [19791 Monogr. Ser., Vol. 10, edited by J.*S.for Australia. Although no detailed analysis Steainhart and T. J. Smith, pp. 166-180,has been performed, a brief examination of the AGU, Washington. D.C., 1966.Pn and heat flow data for Europe and Asia sug- Blackwell. D., The thermal structure of thejests that a similar relationship will be found continental crust, in The Structure andfor these continental regions. Physical Properties of the Earth's Crust,
Geophys. Nonoar. Ser.. Vol. 14, edited byAcknowledgments. This research was supported J. G. Restock, AGU, Washington, D.C., 1971.
by the Office of Naval Research. Earth Physics Braile, L. W., R. B. Smith, G. R. Keller. N. M.Program, contract N00014-75-C-0972, by the Welch, and R. P. Meyer, Crustal structureNational Aeronautics and Space Administration, across the Waatch front from detailed sois-contract NCC521, by contract 9-X60-2133K-1 uIc refraction studies, J. Geophys. Res., 79,with Los Alamos, National Laboratory, and by a 2669-2766, 1974.Purdue University Research Foundation David Braila, L. W., R. B. Smith, J. Ansorge, M. R.Ross grant. We are grateful to Mark Sparlin, Baker, M. Sperlin, C. Prodehl, N. M. Schilly,-Kevin Martindale, Neil Stillman, and John J. R. Healy, St. Mueller, and K. H. Olsen,McGinnis, who aided in the compilation of The Yellowstone-Snake River plain seismicdata used In this research. profiling experiment: Crustal structure of
the eastern Snake River plain, J. Ceophys.References Res.., 87, 2597-2609, 1982.
Carder, D. S., Trans-California seismic pro-Baldwin, J.L., A crustal seismic refraction file, Death Valley to Monterey Bay, Bull.
study in Southwestern Indiana and Southern Seismol. Sac. Am., 63, 571-586, 1973.Illinois, M.S. thesis, Purdue Univ., West Carder, D. S.. A. Qmnr, and T. V. Hcvilly,Lafayette, I3, 1980. Trans-California seismic profile Pahute Mesa
Bamford, D.. Refraction data in western to San Francisco Bay, Bull. Seismol. Sac.Germany - A time-tern interpretation, Z. Am.., 60, 1829-1846, 1970.Geophys., 39, 907-927, 1973. Chandra, N. N., and G. L. Cumming, Seismic
Ramford, D.. M4. Jentsch, and C. Prodehl, Pn refraction studies in Western Canada, Can.anisotropy in northern Britain and the J. Earth Sci., 9. 1099-1109, 1972.eastern and western United States, Geophys. Chapman, D. S., and H. N. Pollack, GlobalJ.R. Astron. Soc., 57, 397-429, 1979. heat flow: A new look, Earth Planet. Sci.
Barr, K. G.. Crustal refraction experiment: Lett., 28, 23-32, 1975.Yellovknife 1966. J. Geophys. Res., 76, Christenm, N. I., Compressional wave velo-1929-1948, 1971. city in rocks at high temperatures and pres-
Barrett, D. L., N. Berry, J. E. Blanchard, sares: Critical thermal gradients, andM. J. Keen, and R. E. McAllister, Seismic crustal low-velocity zones, i. Geophys. Res.,studies on the eastern seaboard of Canada: 84, 6849-6857, 1979.The Atlantic coast of Nova Scotia, Can. J. Christensen, N. I., Compressional wave velo-Earth Sci., 1, 10-22. 1964. city in possible mantle rocks to pressures
Bates. A., and D. 8. Hall, Upper mantle of 30 kilobars, J. Geophys. Res., 79, 407-structure in southern Saskatchewan and 412, 1974.western Manitoba from project Edzoe, Can. Chung, D. J.. P_ velocity and partial melting -J. Earth Sci., 12, 2134-2144, 1975. Discussion, Tectonophysics, 42, T35-T42, 1977.
Bennett, G. T., i. N. Cloves, and R. N. Ellis, Cleo, T. E., K. C. Barr, and M. J. Berry. FineA seismic refraction survey along the southern structure of the crust near Yellowknife, Can.Rocky Mountain trench, Canada. Bull. Seismol. J. Earth Sci., 11, 1534-1549, 1974.Soc. Am., 65, 37-54, 1975. Cohen, T. J., and R. P. Meyer, The midcontinent
Bers, . W., Jr., K. L. Cook, B. D. Narans, Jr., gravity high: Gross crustal structure, inand W. N. Dolan, Seismic investigation of The Earth Beneath the Continents, Goophys.crustal structure in the eastern part of the Monoar. Ser., Vol. 10, edited by 1. S.Basin and Range Province, Bull. Seisuol. Sac. Steinhart and T. J. Smith, pp. 141-165, AGU,A., 50, 511-535, 1960. Washington, D.C., 1966.
Bers, J. W., Jr., L. Trembly, D. A. Emilia, Contain, J. K., L. Clover II, and A. K. Sinha,J. R. Hutt, J. N. King, L. T. Long, W. I. Lo-temperature geothermal resources in theMcanight, S. K. Sarmeh, R. Souders, J. V. eastern United States, Eos Trans. AGCU 61,Thiruvathukal, and D. A. Vossler, Crustal 1, 1980.refraction profile, Oregon coast range, Cram, I. H., Jr., Crustal structure refractionBull. Seismol. Sac. AS., 56, 1357-1362, 1966. survey in South Texas, Geophysics, 26, 560-
Berry, M. J., and D. A. Forsyth, Structure of 573, 1961.the Canadian Cordillera from seismic refrac- Crough, S. T., and G. A. Thompson, Thermaltion and other data, Can. 1. Earth Sci., 12, model of a continental lithosphere, J. Geophys.182-208, 1975. Rs.. 81, 4857-4862, 1976.
Berry, M. J., and K. Fuchs. Crustal structure Cull, J. P., and D. Denham, Regional variationsof the Superior and Greanville provinces of in Australian heat flow, B) j. Aust. Geol.the northeastern Canadian shield, Bull. Geohys.. 4, 1-13, 1979.Setismol. Sac. A.., 63. 1393-1432, 1973. Diment, W. H., S. W. Stevart, and J. C. Roller,
Berry, N. J., and G. F. West, A te-term Crustal structure from the Nevada test siteinterpretation of the first-arrival data to Kingman, Arizona, from seismic and gravityof the 1963 Lake Superior experiment, in observations, J.Geophys. Res., 66,201-213,1961.
Air&..~ - O P

10,566 Black and Braila: Pm Velocity and Cooling of the Lithosphere 50
Dorman, J., J. L. Worzel, R. Leyden, T. N. Cook, Hall, D. H.. and Z. Hajual, Crustal structureand M. Hatsiam-nual, 4rustal section from of northwetern Ontario: Refractioneisamology,seismic refraction measurements near Victoria, Can. J. Earth SJG., 6, 81-99, 1969.Texas, Geophysics, 37, 225-336, 1972. Hall, D. H., and Z. inal, Deep seismic crustal
Douglas, R. J. W., and R. A. Price, Nature and studies in Manitoba. Bull. Seismn1. Soc. Am.,significance of variations in tectonic styles 63, 883-910, 1973.In Canada, in Variations in Tectonic Styles in Hamilton, R. M., A. Ryall, and E. Berg,.CrustalCanada, Geol. Soc. Canada Spec. Pap. 11, edited structure southwest of the San Andreas faultby R.A. Price and R. J. V. Douglas, pp. 625- from quarry blasts, Bull. Seismol. Soc. Am.,688, 1972. 54, 67-77, 1964.
Eaton, J. P., Crustal structure from San Francisco, Haly. J. H., Crustal structure along the coastCalifornia. to Eureka, Nevada. from seismic- of California from seismic-refraction measure-refraction mesurements. J. Geophys. Res.. 68, ments, J. Geop vs. Ras, 68. 5777-5787, 1963.5789-5806, 1963. Henyey, T. L., and T. C. Lee. Heat flow in Lake
Eaton, J. P.. Crustal structure in northern and taboe, California-Nevada, and the Sierra Nevada-central California from seismic evidence in basin and range transition, Geol. Soc. An. Bull.,geology of northern California, Calif. Div. 87, 1179-1187, 1976.Nines Geol. Bull., 190, 419-426, 1966. Herrin, ., Regional variations of P-wave velocity
Ewing, N. J. L. orzel, D. B. Ericson, and B. C. in the upper mantle beneath North America. ineezen, Geophysical and geological i vestiga- The Earth's Crust and Upper Mantle. Geophys.tion8 in the Gulf of Mexico, Part I, Geophysics, Monor. Ser., Vol. 13, edited by P. J. Hart,20, 1-18, 1955. AGU, Washington, D.C., 1969.
Ewing. G. N., A. M. Dainty, J. E. Blanchard, Berney, J. B.. E. T. Bunce, R. F. Wyrick, andand N. J. Keen, Seismic studies on the eastern F. T. Dietz, Geophysical investigation of theseaboard of Canada: The Appalachian system 1, continental margin between Cape Henry, VirginiaCan. J. Earth Sci.. 3, 89-109. 1966. and Jacksonville, Florida, Geol. Soc. Am. Bull..
Fagernes. V., and K. Kanestrom, Variations in 70, 437-465, 1959.the upper mantle structure as derived from Pn Hil1, D. P.. and L. C. Pakiser, Crustal structureand Sn waves, Pure App1. Geophys., 109, 1762- between the Nevada test site and Boise, Idaho,1772, 1973. from seismic-refraction measurements, in The
Fenneman, N. 1. Physical divisions of the United Earth Beneath the Continents, Geophys. Monor.States, U.S. Geological Survey Nap, scale Ser., Vol. 10, edited by J. S. Steinhart and1:7.000,000, 1946. T. J. Smith, pp. 391-419, AGU, Washington, D.C.,
Fielit:, K.. Compressional and shear wave velo- 1966.cities as a function of temperature in rocks at Hill, D. P., Crustal and upper mantle structurehigh pressure, in Explosion Seismology in of the Columbia plateau from long range seismic-Western Europe, edited by P. Giese. C. Prodehl, refraction measurements, Geol. Soc. Am. Bull.,and A. Stein, pp. 40-44, Sprinser-Verlas. Now 83, 1639-1648, 1972.York, 1976. Hobemn• G. D., A. Overton, D. N. Clay, and W.
Forsyth, D. A., 14. J. Berry, end R. N. Ellis, Thatcher, Crustal structure uder HudsonA refraction survey across the Canadian Bay, Can. J. Earth Scl., 4, 929-947, 1967.Cordillera at 54*N. Can. J. Earth Scl., 11 Hodgson, J. H., A seismic survey In the Canadian533-548, 1974. Shield, 1. Refraction studies based on rock-
Gibbs. J. F., and J. C. Roller. Crustal strut- bursts at Kirkland Lake, Ontario. Pub1. DoM.ture determined by seismic-refraction measure- Obs. Ottawa, 16, 111-163, 1953.ments between the Nevada test site and Ludlow, Horai K. and G. Simons. Seismic travel timeCalifornia, U.S. Geol. Survey Prof. Pap. , 550-D. anomaly due to anomalous heat flow and density,D125-D131, 1966. J. Geophys. Res., 73. 7577-7588, 1968.
Gish, D. 1., G. R. Keller, and M. L. Sher, A Jackson W. H.. S. W. Stewart, and L. C. Pakiser.refraction study of deep crustal structure in Crustal structure in estern Colorado fromthe basin and range: Colorado plateau of seismic-refraction measurements, J. Geophys.astern Arizona, J. Geophys. Res., 86, 6029- Res., 68, 5767-5776, 1963.6038, 1981. Jackson, W. H., and L. C. Pakiser. Seismic
Green. A. G., 0. G. Stephenson, G. D. Mann, study of crustal structure in the Southern1. R. Kanasewich, G. L. Cuming, Z. Hajnal, Rocky Mountains, U.S. Gool. Survey Prof. Pay.,J. A. Nair, and G. F. West. Cooperative 525-D. D85-D92. 1965.seismic surveys across the Superior-Churchill James, D. W., T. J. Smith. and J. S. Steinhart,boundary zone in southern Canada, Can. J. Crustal structure of the middle AtlanticEarth Sci., 17, 617-632, 1980. states, J. Geophys. Res., 73, 1983-2007, 1968.
Hales, A. L.. and J. B. Nation, A seismic refrac- Johnson, L. I., Crustal structure between Laketion survey in the northern Rocky Nountains: Need. Nevada, and Mono Lake, California, J.More evidence for an intermediate crustal Geophys. Ras., 70, 2863-2872, 1965.layer, Geo.hys, J. R. Astr9n. Soc., 35. 381-399, Johnson, S. I., and R. W. Couch, Crustal strut-1973. ture in the North Cascad, Mountains of
Hales. A. L., C. E. Helsley, J. J. Dowling. and Washington end. British Columbia from seismicJ. B. Nation, The east coast onshore-offshore refraction measurements, lull. Seismol. Soc.experiment, 1, The first arrival phases. Bull. An, 60, 1259-1269, 1970.Seismol. Sc , Am.. 58, 757-819, 1968. Johnson, S. R., R. W. Couch, N. Gesperle, and
Hales. A. L., C. E. Helsley. and J. B. Nation, 1. R. Banks, Seismic refraction measurementsCrustal structure study on Gulf Coast of Texas, in southeast Alaska and western BritishAn. Asoc. Petrol. Geol. Bull.. 54, 2040- 2057, 1970. Columbia, Can. J. Earth Sci., 9, 1756-1765,1972.

51Black and Braile: P Velocity and Cooling of the Lithosphere 10,S67
Katz, S., Seismic study Of crustal structure great plains. in The Structure and PhMsicalin Pennsylvania and Now York, Bull. Seisnol. Properties of the Earth's Crust. Geophys.
Soc. An.. 303-325. 1954. onor. Ser., Vol. 14. edited by J. G.
eller, G. .,R. B. Smith, and L. W. Braia, Hencock, pp. 77-93. AGU, Washington. D.C.Crustal structure along the Groat Basin- 1971.Colorado Plateau transition from seispt c uller. S., and f. Landimn , An inle ofrefraction studies, J. Geophe. Res.a 80 the unified method of nterpretati on for1093-1097, 197 . crustal seisaid datat Grophys. J. i. Astron.fracki K. A.. and J. B. S. Haldane, Organic Soc., 23 36-371, 1971.correlation and allonetry, Biaetrika, 37. Olson- K-i., G. R. Keller. and J. N. Stewart,
30-41. 1950. Crustal structure along the Rio Grande riftero, H., and A. Richter, Temperature derive- fro sate ic refraction profiles, in Rio _-s
tires of compressional and shear wave velo- Grande Ri.ft: Tectonics and Mlagmatim, edited
cities in ctuJstal and mntle rocks at 6 kbar by R. E. Rickar, pp. 127-143. AGU, Washington.
confining pressure. J. Goophys., 49. 47-56. D.C., 1979.
1981. PakLser, L. C.. Structure of the crust and upper
KOnG, Y., and M. Aaano, Thickening model of mantle in the western United States, J. Geophys.
the continental lirhosphere, Geophys. J. e Rea., 68, 5747-5756, 1963.
Astron. Soc., 54, 405-416, 1978. Pakiser. L. C., and J. S. Steinbart, Explosion
Langston. C. A., and D. V. Helmberser, Inter- seismology in the western hemisphere, in
pretation of body and Rayleigh waves from Research in Geophysics, 2, Solid Earth and
STS to Tucson, Bull. Seismol. Soc. Am., 64, Interface Phenomena, edited by J. Odishaw,
1919-1929, 1974. pp. 123-142, MIT Press, Cambridge, Mass.,
Lachenbruch, A. H., and J. R. Sass, Heat flow 1964.
in the United States and the thermal regime Pesalnick, L.. J. P. Lockwood, and R. M. Stewart,of the crust, in The Earth's Crust, Geophys. Anisotropic elastic velocities of some upper
Monor. Ser., Vol. 20, edited by J. G. Reacock, mantle xenoliths underlying the Sierra Nevada
AGU, Washington. D.C., 1977. batholith, J. Geophys. Res., 82, 2005-2010,1977.
Lyons, J. A., D. A. Forsyth, and J. A. Mair, Peselnick, L., and A. Nicolas, Seismic aniso-Crustal studies in the La Malbae Region tropy in an ophiolite peridotite: Applica-
Quebec, Can. J. Earth Sci., 17, 478-490, 1980. tion to oceanic upper mantle, J. Geophvs.
Manghnani, N. H., R. Ramananantoandro, and Res., 83, 1227-1235, 1978.S. P. Clark, Compressional and shear wave Pollack, H. N., and D. S. Chapman, On the
velocities in granulite facies rocks and regional variation of heat flow, geotherms,
eclogices to 10 kbar, 3. Geophys. Ra., 79, and lithospheric thickness, Tecionophysics,
5427-5446, 1974. 38, 279-296, 1977.
Martin, V. R., A seismic refraction study of Polyak, B. C., and Ya. B. Smirnov, Relation-
the northeastern basin and range and its ship between terrestrial heat flow and the
transition with the eastern Snake River tectonics of continents, Geotectonics, 4,
plain, N.S. Thesis, Univ. of Texas, El 205-213, 1968.
Paso, 1978. Press, F., Crustal structure in the California-
cCamy, K., and R. P. Meyer, A correlation Nevada Region, J. Geophys. Rea., 65, 1039-
method of apparent velocity measurement, 1051, 1960.
J. eophys. Res., 69, 691-699, 1964. Prodehl, C., Crustal structure of the western
McCamy, K. and R. P. Meyer, Crustal results United States, U.S. Geol. Surv. Prof. Pap.,
of fixed multiple shots in the Mississippi 1034, 1979.
embayment, in The Earth Beneath the Con- Prodehl, C., and L. C. Pakiser, Crustal struc-
tinents, Geophys. onotr. Set., Vol. 10, ture of the southern Rocky Mountains from
edited by J. S. Steinhart and T. J. Smith, seismic measurements, Geol. Soc. Am. Bull.,
pp. 166-180, AGU, Washington, D.C., 1966. 91, 147-155, 1980.
Mereu, 1. F., and J. A. Hunter, Crustal and Ramananantoandro, R., and M. H. Manghnani,
upper mantle structure under the Canadian Temperature dependence of the compressional
shield from project early rise data, Bull. wave velocity in an anisotropic dunite:
Seismol. Soc. Am., 59, 147-165, 1969. Measurements to 5006C at 10 kbar, Tectono-
Mereu, 1. F., and C. Jobidon, A seismic physics, 47, 73-84, 1978.
investigation of the crust and moho on Richards, T. C., and D. J. Walker, Measurement
a line perpendicular to the Grenville of the thickness of the earth's crust in the
Front. Can. J. Earth Sci., 8, 1553-1583, Albertan plains of western Canada, Geophysics,
1971. 24, 262-284, 1959.
Mereu, R. F., S. C. Majundar, and R. E. Roller, J. C., Crustal structure in the vicinity
White, The structure of the crust and of Las Vegas, Nevada, from seismic and gravity
upper mantle under the highest ranges observations, U.S. Geol. Surv. Prof. Pap.,
of the Canadian Rockies from a seismic 475-D, D108-Dlll, 1964.
refraction survey, Can. J. Earth Sci., Rollr, J. C., Crustal structure in the eastern
14, 196-208. 1976. Colorado plateaus province from seimic-refrac-
Merkel, R. H., and S. S. Alexander, Use of tion measurements, Bull. Sismol. Soc. As., 55,
correlation analysis to interpret con- 107-119, 1965.
tinental margin ECOOE refraction data, Roller, J. C., and J. H. Healy, Seisaic-refrac-
J. Geophys. Res, 74, 2683-2697, 1969. tion measurements of crustal structure between
Mitchell, B. J., and M. Landisman, Geo- Santa Monica Bay and Lake Mead. J. Geophys.
physical measurements in the southern Res., 68, 5837-5849, 1963.
- - * *

5210,568 Black and Brail: P Velocity and Cooling of the Lithosphere
a
Roller, J. C., and W. H. Jackson, Seismic--wve Stewart, S. W., Crustal structure in Missouripropagation in the upper mantle: Lake Superior by seismic-refraction methods, Bull. Seismol.Wisconsin, to Denver, Colorado, in The Earth Soc. An., 58, 291-323, 1968a.Beneath the Continents, Geophys. Monoar. Set., Stewart, S. W., Preliminary comparison of seismicVol. 10, edited by J. S. Sceinhart and T. J. travel times and inferred crustal structureSmith, pp. 270-275, AGU, Washington, D.C.. adjacent to the San Andreas Fault in the Diablo1966. and Gabilan langes of Central California, in
Romey. C.. B. G. Brooks, R. H. Mansfield, D. S. Geologic Problems of San Andreas Fault SystemCarder. J. N. Jordan. and D. W. Gordon, Travel Conference Proceedings, edited by W. R.times and amplitudes of principal body phases Dickinson, pp. 218-230, Pu 1. Gaol. Sci. 11,recorded from Gnome, Bull. Seismol. Soc. An., Stanford Univ., Stanford. calif., 1968b.52, 1057-1074, 1962. Topposada, T. I.. and A. i. Sanford. Crustal
yall. A., and D. J. Stuart, Travel times end structure in central Nev Mexico interpretedsmplitudes from nuclear explosions, Nevada from the Gasbuggy explosion, lull. Seismol.test site to Ordvay, Colorado. J.ZGephys. Soc. a., 66, 877-886, 1976.Res., 68, 5821-5835. 1963. Tuo, N. A., The earth's crust, Year look
Rybach, L., and G. Buntebarth, Relationship Carneale last. Washinaton, 5O, 69-73 1951.between the petrophysical properties density, Tuve, N. A., The earth's crust, Year Bookseismic velocity, heat generation and Carnegie Last. WashinLton, 52. 103-108. 1953.mineralogical constitution, Earth Planet. Tuve, M. A. , The earth's crust, Year BookSci. Lett., 57, 367-376, 1982. Carnegie Last. Wshinaton, 53, 51-55, 1954.
Sees, J. a., W. I. Dimant, A. 8. Lachenbruch. erhoogem. J.. F. Turner, L. eisa, C. Wahrhaftig,B. V. Marshall, R. J. Munroe, T. 1. Noee. and W. Pyfe. The Earth. 748 pp., Dolt, Rinehart,Jr., and T. C. Urban, A new beat-flow contour and Winston. New York, 1970.map of the conterminoes United States, U.S. Warren. D. u., Transcontinental geophysicalGeol. Surm. Oven File Rap., 76-756, 1976. survey (35*-39"N) seismic refraction profiles
Shot. G.G., Jr., Seismic refraction studies of the crust mnd upper mntle, U.S. Geol. Surv.off the coast of Alaska: 1956-1957. Bull. Naps 1-532-0. 1-533-D. 1-534-0, and 1-535-0.Seismol. SM=. a., 52. 37-57, 1962. 1961.
Shot, G. G., Jr., P. Dehlinger, R. D. Kirk, Merren. D. R.. and J. U. Healy, Structure of theand W. P. French, Seismic refraction studies crumt in the conterminous United States, Tecoff Oregon and Northern California, J. Geophys. tonophysics. 20, 203-213. 1973.Res., 73. 2175-2194, 1968. Warren, D. ., Seismic-refraction survey of
Sino., T. A., 0. 1. Keller, and N. L. Sher, crustal structure in central Arisona, Geol.A crustal seismic refraction study in mest- Soc. Am., 0. 257-282, 1969.central Arizona. J. Geophys. Res.. 86, 5023- Warren, D. I., and W. R. Jackson, Surface seismic5038, 1981. measurements of the project Gasbuggy explosion
Slichter, L. B., Crustal structure in the at intermediate distance ranges, U.S. Geol.Wisconsin area, R , ONR 86200. Office Surv. Open File Rep. 1023. 1968.of Naval Research, Arlington. Virginia. 1951. Warren, D. H., J. H. Healy, and W. R. Jackson,
Smith, R. B., M. N. Schilly, L. W. Braila, J. Crustal seismic measurements in southernAnsorge. J.L. Lehman, M. R. laker. C. Mississippi, J. Geophys. Res., 71, 3437-Prodehl, J. U. Healy, St. Mueller, and 1. U. 3458, 1966.Greensfeldet, The 1978 Yellowstone-Eastern Warren, D. H., J. H. Healy, J. Bohn, and P. A.Snake River plain seimic profiling experi- Marshall, Cruatal calibration of the largement: Crustal structure of the Yellowstone aperture seismic array (LAS), Moatana, U.S.region and experiment design, J. Geophys. Geol. Suwv. Open File Rep. 1671, 1972.Res., 87. 2583-2596, 1982. White. W. R ., and J. C. Savage, Seismic
Sparlia, M. A., L. W. Braila, and I. S. Smith. refraction and gravity study of the earth'sCrustal structure of the Eastern Snake River crust In British Colnbia, Bull. SeiLmol.plain determined from ray-trace modeling of Soc. A., 55, 463-486, 1965.seismic refraction data, J. Geophys. Res.. 87, Willdn. R.. Seismic-refraction measurements2619-2633. 1982. of crustal structure between American Falls
Stauber. D. A., and D. 4. Bore, Crustal thick- Reservoir. Idaho. and Flaming Gorge Reservoir,nese in northern Nevada from seismic refraction Utah, U.S..Geol. Surv. Prof. Pap., 525-C,studies, Bull. SeLamol. Soc. As., 68, 1049- C44-C50, 1965.1058. 1978. York, D., Least-squares fitting of a straight
Steinebart, J. S., and R. P. Meyer, Explosion line, Can. J. Phys., 44, 1079-1086, 1966.studies of continental structure, Carnexie York, D., The best ' ochron, Earth Planet.Inst. Washington Publ. 622, 1961. Sci. Lett., 2, 4 9-482, 1967.
Steinhart, J. S., Z. Suzuki, T. J. Smith,L. T. Aldrich, and 1. S. Sacks, Explosion (leceiv A December 8, 1981;seismology, Year Book Carneie nlast. Washington, revisad July 16. 1982;63, 311-319. 1964. accepted July 21. 1982.)
-" ,,J . " ' - - -'" " L P .r

-. ~z--w-----4 - -W, - -_
53
SEISMOGRAMS OF EXPLOSIONS AT REGIONAL DISTANCES IN TIU WESTERNUNITED STATES. OBSERVATIONS AND REFLECTIVITY METHOD MODELING
K. H. OlsenI and L. W. Braile
2
1 Geosciences Division, Los Alamos NationalLaboratory, Los Alamos, New Mexico 87545, U.S.A.
2 Geoscience Department, Purdue University,West Lafayette, Indiana 47907, U.S.A.
ABSTRACT. Seismic energy propagating through vertically and
laterally varying structures of the earth's crust and loverlithosphere-uppermost mantle is responsible for the numerous andcomplex seismic phases observed on short-period seismograms atregional distance ranges (100 to 2000 kin). Recent advances intechniques for computing synthetic seismograms make it practicalto calculate complete seismograms that realistically model manyfeatures of regional phases. A modified reflectivity methodprogram is used to interpret some details of record sections ofNevada Test Site (NTS) underground explosions that were observed700 to 800 km from the sources.
I. INTRODUCTION
Regional seismic phases recorded by high-gain, short-period orbroadband instruments are likely to play an increasingly im-portant role in seismic source location and identification asacceptable magnitude thresholds are pushed to lower levels.From the standpoint of complexity of seismograms, the epicentraldistance range between -200 km and the transition to simplerteleseismic waveforms around 2000 km presents many challenges tothe seismic analyst. In this range, propagation paths can
traverse the crust, the lower lithosphere, and the uppermostmantle where both vertical and lateral heterogeneities stronglyinfluence waveform characteristics. Good observational data arerare for testing analysis techniques developed for regionalproblems. In contrast to the numerous detailed crustal refrac-tion/reflection profiles that have been obtained from many partsof the world out to distances -200 ki, relatively few long-range
453
E. S. Husebye and S. Atykkeltveit (eds.). Identification of Seismic Souces - Earthquake or UndergroundExplosion, 453-466.Copyrilht c 1961 by D. Reidel Publishing Company.
" " . . .. . v r A"'-" ' "
, -. -tr P .,,z .,.m J ,m = ... , ... ._. . .. ... -

54
454 K. H. OLSEN AND L. W. BRAILI
profiles exist where station spacing is sufficiently tight tofacilitate a clear interpretation of the onset, development, andamplitude vs. distance behavior of the many observable phases.Thus, although signals from sources of interest may be easilyobservable at regional distances, derivation of source para-meters fromn observations at sparsely located observatories orarrays will require careful analysis and modeling of the in-tricacies of wave propagation at these scales.
Phases of interest in regional identification studies fallinto two main categoriest large amplitude, long duration, butsomewhat indistinct wave groups such as Lg and P; and body waves(mainly compressional) that appear either as first arrivals orclosely following as possible wide angle reflections /near-critical refractions from interfaces and/or steep velocitygradients in the deep. crust, lower lithosphere, and uppermostmantle. The Lg and P phases are often the largest amplitudefeatures on regional short-period seismograms, but a clearexplanation of how Lg and P propagate is still lacking (11;this lack perhaps is reflected in the fact that seismologistsfrequently use the notations f or Pg9 interchangeably inreference to a broad, large amplitude phase following Pn- Weadopt the P notation here. The phase in question propagatesvery well in the western United States, but attenuates rapidlyin the eastern U.S. A group velocity around 6 km/s implies Ppropagates as compressijonal waves ultiply reflected within thecrust-which my thus act as a waveguide. Similarly, the -3.5km/s group velocity for Lg suggests shear waves multiply re-flecting within the crustal layers. Some authors 121 prefer totreat Lg as a superposition of higher mode Love and Rayleighwaves propagating in a nearly laterally homogeneous, verticallylayered crust. In any case, the propagation physics is com-plicated and will require quite sophisticated synthetic seismo-gram codes to properly model and interpret observed waveforms.
Record sections of long-range seismic refraction profilesoften show peor more nearly parallel travel time Mr vs. dis-tance (a) Cranches following within several seconds of firstarrivals (3, 4, 51. Bach secondary branch may be traceable onlyover a distance interval of 50 to 200 km before being replacedin a "shingle-like" fashion with another branch or set of ar-rivals (5, 6, 191. These are usually interpreted as parts Ofcusp phases arising from critical refractions and/or wide-anglereflections from first order discontinuities or steep velocitygradients in the upper mntle. Archambeau et &1. [71 andBurdick and Relmborger 18], for example, have derived velocityvs. depth models for the major features of the upper mantlebeneath the U.S. by a joint analysis of travel times, amplitudevs. distance variations, and waveform fitting of the first fewcompressional arrivals *observed at widely separated seismograph
-~~~s *-~. -A .I'

55
SEISMOGRAMS OF EXPLOSIONS AT REGIONAL DISTANCES IN THE US. 453
stations throughout the U.S. These and similar models by othersare most valid for depths greater than about 250 km. Althoughthese analyses suggest that the main features of mantle structureat depths below about 300 km (corresponding to compressionalfirst arrivals at epicentral ranges beyond -1500 km)-may be moreuniform over a global scale [8), it is. known that significantlateral variations in lower lithosphere and uppermost mantleproperties occur beneath the continents on regional and perhapseven finer scales (8, 9, 10, 111. In the depth range betweenthe Moho and -300 ki, several types of structural variationshave been suggested in the literature that would give rise towide angle reflections, converted phases, and similar closelyspaced arrivals on seismograms at regional ranges. ?p These in-clude the presence or absence of the S-wave and/or the P-wavelow velocity zone (LVZ) in the asthenosphere, high velocitymantle lids (12, 131, alternating lamellae of positive andnegative velocity gradients [6, 19), etc. These early arrivingphases often have better defined onsets than the P and Lg phasesand, since they are observed at distances beyond that where atrue head wave Pn arrival can be expected, they may be useful inregional source location and identification. In order to makeuse of the information contained in these arrivals (especiallythe amplitude vs. distance behavior for particular paths ofinterest), it will be necessary to use modern sophisticatedsynthetic seismogram techniques to derive localized fine scaledetails from generalized crust-mantle models.
The purpose of this paper is to explore a few of the prob-lems in modeling regional short-period seismograms by means of amodified reflectivity method (141 computer program developed byR. Kind 115). This numerical program accounts for the effectsof a buried source and is thus capable of computing 'complete'seismograms-including refracted waves, surface reflected bodywaves such as the pP phase, and surface waves. The effects ofanelastic attenuation (Q) for each layer are included as anintegral part of the method [15). The most severe limitation ofthe technique for studies' of regional seismograms is the assump-tion of lateral homogeneity (this is also a limitation for nor-mal modes summation techniques). An item of interest will bethe extent synthetics can be made to match observed waveformsunder this restriction.
Two problems are considered. The first, labeled the B-3model for brevity, employs a simple model consisting of threelayers in the crust without velocity gradients and an almostuniform velocity mantle. A large range of apparent surfacephase velocities is used in order to display S phases and sur-face waves. The second, calculation, the A-10 model, treats themantle structure in detail, but confines attention to compres-sional phases near ther start of the seismogram. The more
- - - - dPN OW _

56
456 IC. ff. OLSEN AND L. W BRAIL.
WmlM us,
00
STATIONS4m"*4
IC
us: sima oo
(a) (b)
Fig. 1. (a) Location map of the western United States withrelative positions of the Nevada Test Site and the Y-ESRP
recording line. (b) Enlargement shoving positions of stationsthat recorded the 27 September 1978 RU?4ET explosion. Asteriskdenotes approximate are for mantle ray turning points from NTSexplosions.
important conclusions of the A-10 model are sumarized here-afuller discussion of this calculation and the implications foruppermost mantle structure beneath the western U.S. can be foundin a previous publication [16):
A c parison of the synthetic seismogram calculations hasbeen made with a lO0km-long record section of short-period ver-tical component seismograms obtained in eastern Idaho during the1978 Yallovetone-Etastrn Snake River Plains (T-ESRLP) seismicprofiling experiment. For these observations, the sources wereunderground nuclear explosions at the Nevada Test Site (NTS) atdistances between 720 and 820 km from the nearly radially ori-ented Linear station array (Fig. I). Only the records from thelargest NT4 explosion, the ab - 5.7 EUeMY event at 1720%00.076GMT, 27 September 1978, are reproduced here since they have thebeat signal-to-noise ratio of the three NTS explosions observedduring the experiment. Additional details of the Y-ESRP instru-mntation, experiment, and data can be found elsewhere (161.

57
SEISMOGRAMS OF EXPLOSIONS AT REGIONAL DISTANCES IN THE U.S. 457
2. COMPUTATIONAL TECHNIQUE
As discussed by Kind [151 and by Fuchs and 16iller [14], thereflection coefficient and time shift calculations in the re-flectivity method are carried out in the frequency domain andthen Fourier transformed to plot seismograms. We includedMuller's [171 earth flattening approximation in both of ourproblems to account for earth curvature effects. Both P and Svelocities are independently specified in all calculations,since the reflection coefficients are functions of both P and Svelocity contrasts at non-normal incidence angles and arerequired even when only computing P phases over a narrow timewindow. In the A-10 calculation, for example, the departure ofthe P/S velocity ratio in a layer from that given by J1oisson'sratio = 1/4 is an important factor in our interpretation [16].Densities are given by a Birch's Law relation (density - 0.252 +0.3788*P velocity). The attenuation factor Qa for P waves waschosen as 25 in the source layers, 200 in the upper crust, and1000 in the lower crust and the uppermost mantle layers; for theLVZ modeling of the A-1O model, Qa in the asthenosphericlayers was adjusted as part of the fitting procedure (seeFig. 5). The attenuation factor for S waves was always assumedto be 4Qa/9 1201. The explosive source algorithm [16] was usedwith the source buried at a depth of 0.640 km in a layer of Pvelocity - 3.55 km/s. These were close to actual field valuesfor the NTS RUIMY explosion. Time intervals, number of samples,and computed lengths of seismograms were chosen so that thedominant frequency of the source spectrum was 1.6 Hz for theA-10 calculation-again close to the observed value. In orderto save computer time for the extended duration B-3 seismogramsections, the parameters were chosen so that the dominant fre-quency of the source was shifted to 0.25 Hz; although this waslow compared to observed frequencies, we felt it was adequatefor the puposes of this initial study. To avoid long computerruns, the wave field was only computed within a limited phasevelocity window. 1 km/s to 20 km/s for B-3, and 6.5 km/s to1000 km/s for A-l0. These integration limits sometimes in-troduced spurious single cycle "phases" at these apparent velo-cities in the computed record sections. The limit velocitieswere chosen so as to not overlap or interfere with arrivals ofinterest in the observations. In the record section plots, theamplitudes of each trace have been multiplied by station dis-tance to maintain a convenient scaling of the amplitudes of thephases which are subject to geometrical spreading and attenua-tion due to anelasticity.
L Ll

58
4S8 K. H. OLSEN AND L. W BRALE
240
200Up
160
9120
0 80
~400- ,o iTTIT740 760 780 800 820
OISTRNCE (KMlJRUMMY Y-SRP
Fig. 2. Vertical component low time resolution seismic recordsection of the RUSff explosion as recorded at Snake River Plainsstations. The time scale is compressed to show envelope be-havior; individual waveforms not readily seen. The P phase isthe broad feature at reduced times between 30 and 60 s. Upwardground motion to the left.
3. DISCUSSION
3.1 The Extended Time Seismograms& B-3 Model
Figure 2 is a true relative amplitude vertical component recordsection of the RIUY explosion recorded on ten matched short-period (1' Us natural frequency) instruments deployed in theeastern Snake liver Plains (Fig. 1). Although the time scale istoo compressed to reveal many details of the waveforms, severalimportant overall features can be noted. The broad (-40-second-long) envelope of the P phase appears at reduced times betweenapproximately 30 to 60+ seconds, and is the largest amplitudefeature on the record. In contrast, the Lg phase expected atreduced times of -130+ seconds (an average velocity of about 3.5ku/s) is poorly developed on these unfiltered records; it isonly obvious at the 770-km station. A few impulsive arrivalscam be seen (such as the first arrivals at reduced time -10seconds, wbich will be discussed in Sec. 3.2, and perhaps anSn j?) phase at tred-80 seconds and -780 ki), but the
59
SEISMOGRAMS OF EXPLOSIONS AT REGIONAL DISTANCES IN THE U.S. 459
impression one gets by viewing this observed section is that thecorrelations seem to be better described as broad energycorrelations rather than phase correlations. A similar con-clusion is suggested by seismograms from central Asia shown inthe paper of Ruzaikin et al. (1). A coherent structure in the Pand Lg phases is difficult to trace from station to station eventhough the stations are only separated by 8 km on the average.
The results of an attempt to model late time arrivals overa regional distance range is shown in Fig. 3. A rudimentary,almost trivial, crust/mantle velocity structure was assumed thatconsisted of three constant velocity layers in the crust over-laying a nearly constant velocity halfspace. (A slight negativegradient in P velocity was introduced just below t~te IMoho inorder to suppress the Pn amplitudes as required by t6 e observa-tions; see Sec. 3.2.) We note several points.
(a) The seismogram section from 100 to 900 km and the enlargedindividual record for 800 km shows a surprising amount ofcomplexity at times beyond the first arrivals even thoughan extremely simple earth model and source function isused. Groups corresponding to the P and Lg phases can beidentified.
(b) There appears to be a considerable amount of S-wave energyalthough none is present in the explosion source algorithm.This is probably due to P-to-S and S-to-P, etc., conver-sions at interfaces and to multiples which the programadequately includes.
(c) The calculated dispersed fundamental mode Rayleigh wave isvery large. There are at least two reasons this Rayleighwave is not representative of the observatio's. First, nocorrections for the short-period bandpass rc.sponse of theseismometers were included in the synthetics. Second, theassumed source spectrum has too much energy at the longerperiods as compared with a near point-source representativeof a NTS explosion, thus over enhancing the Rayleigh Waves.Long-period Rayleigh waves from actual underground explo-sions are probably generated or modified and enhanced bymechanisms such as spall closure and/or tectonic strainrelease; these mechanisms are not adequately treated by theexplosion algorithm used for the present calculation.
(d)- Because the calculated seismogram sections are quite com-plicated even for this simple earth model, they give theimpression that broad "Packets of energy" can be morereadily correlated than any well defined- phases--for atleast the P and LS phases. This was the case with theobservations in Fig. 2. Itt order to better understand thegross behavior of these phases with distance and toidentify the origin of obscure features, it will benecessary to include calculations of the horizontal

60
460 IK. H. OLSEN AND L. W. BRAILE
160 01214020 L i
120 o 1 1 :
401
60 W KIS0 goo0 040 0 0 0 809010
X IKI I Z-COMP. SYNCAL 8-3 Wb
' COPONETFANA M ENA
TCAVELRIMIONS.
Fi. . (a). Sytei Lesga vetcl o pnnt rcrsectin calulate fro AthRIPASnSvlit v.dph tutr
(Mde P-)soni b. ()Epne lto h yteisesoga a h 80kmdsAnc.L prxmt
arvl i n
veag velcit 5 ino for difeen phase or5 gro.p are
IS 22 26 -V 340. ~ *y
TRVE TIM (pre

6!
SEISMOGRAMS OF EXPLOSIONS AT REGIONAL DISTANCES IN THE U.S. 461
(radial) component and to perform calculations at smallstation separation to increase recognizability of phasecorrelations.
These results suggest that the modified reflectivity method,even with the restrictive assumption of lateral homogeneity, canbe a useful technique in understanding the intricacies of Lg andP phases and the types of earth structures that most affect them.In addition, these studies suggest that observations of complexand apparently-incoherent seismic phase arrivals--even over shortdistances--do not necessarily imply strong lateral heterogeneityin crustal structure. Parameter studies would help identifythose aspects where refinements due to lateral h terogeneityand/or scattering need to be considered in order to Setter matchobservations.
3.2 Early Time Arrivals; A-10 Model
Figures 4a and 4b are enlarged portions of the first fewseconds of the digitized RUMMY vertical component seismograms(see also Fig. 2) that show details of the earliest arrivals.We have interpreted [16] this record section in terms of threedifferent compressional phases, all having apparent velocitiesclose to 8 km/s. (a) an extremely weak leading arrival labeledPn, which was lost in the background noise for the two other,lower yield, NTS shots that were also recorded during the Y-ESRPexperiments; (b) a stronger phase labeled Plid follows Pn byabout two or three seconds for epicentral distances between 700and 780 km; (c) beyond 780 km, the Plid phase appears to beovertaken and overwhelmed by a low-frequency phase, PI, whoseamplitude increases rapidly with distance out to at least thefarthest station of the linear array. The detailed reasons forthese labels and identifications are discussed in 1161; they canbe summarized as follows.
The phase labeled Pn could be a wide angle reflection froma weak P-velocity contrast in the lower lithosphere below theHoho rather than a true headwave (in the strict sense of themathematical definition) that travels along the H-discontinuityinterface over the entire 800-km path. However, the sub-MohoP velocity (7.7 to 7.9 km/s) in this region of the Great Basin
is known to be close to both the average and the apparent ve-locity observed in Figs. 2 and 4. This, plus the fact thatother travel time arguments 1161 suggest there is no evidence
for mantle lids or other thin but fairly high gradient zonesdown to a depth of about 100 km, argues that the most straight-forward explanation for this arrival is that it is a Pn-typephase. We calculate that the energy at 800 km is greatly re-duced because the wave travels in a region beneath the Moho thathas a slight negative velocity gradient.
4 !

62
462 K. H. OLSLN AND L. W BRAILI
- Is
1D -- - , (a)0
5 . .
700 720 740 760 780 800 820 840
12 DISTANCE (KM)
LIIAJ
o. (b)4
" 0
700 720 740 760 780 800 820 840DISTANCE (KMI
RUMMYFig. 4. 1a) True relative amplitude record section of earlycompressional arrivals from the RUtSY explosion. (b) Same as(a) with increased amplitudes to show weak Pn phase. Upwardmotion to the left. All traces low pass filtered at 3 Hz.
The sudden onset at about 780 km and subseqktent rapidamplitude growth of the ?I phase indicates it is the cusp ofthe critically refracted P-waves from the steep velocity gradi-ent at the base of the asthenospheric low velocity zone. Theobserved dominant low frequency content is then explained by theattenuation of the high frequency components as the energytravels first downward and then back up through the very low-Qregion of the LVZ. The notation of P for this phase followsthe convention establ'ished by Archambeau et &l. 171.
... ,. .. {, a-. . -. ,,,' 14" f"" _ - = ' :i .W-,I" "",., _IV, j '"a ,w- dp r ~:A"

63
SEISMOGRAMS OF EXPLOSIONS AT REGIONAL DISTANCES IN THE U.S. 463
The travel times, moderate amplitudes, and relatively high
frequency content imply the phase identified as Plid is a wideangle reflection from a discontinuity near the base of themantle lid (- top of LVZ) in this area.
The conclusions concerning these three early arriving com-pressional phases sumarized above were confirmed by using themodified reflectivity program to quantitatively model the arri-val times, amplitudes, and waveforms in the first 15 seconds ofthe record sections. The procedure was to begin with a genericP-velocity vs. depth model for the western U.S. (the T-7 model)derived from a wider data set by Burdick and Helmberger [8) andthen to perturb the model to achieve a better fit [16]. Becauseof the influence of S-velocity contrasts on the P-wtve re-
flectivity calculations, an S-velocity vs. depth model'derivedby Priestly and Brune [18] from an analysis of Rayleigh and Love
wave dispersion on paths crossing the area of interest in theGreat Basin of Eastern Nevada was incorporated into the syn-thetic seismogram modeling. The starting T-7 and Priestly-Brune
(P/B) velocity models are shown by dotted lines in Fig. 5. Thegeneric T-7 P-wave model has a pronounced mantle lid with astrong positive P-velocity gradient beneath the Moho for depths
from 33 to 65 km. Calculation of synthetics for this lidstructure gave very large amplitudes for the "Pn" arrival,which was superimposed on a strong reflection from the base ofthe lid at 65 km [16]. Thus, the T-7 + P/B starting model gaveresults very different from observations. However, as seen inFig. 5, only small changes to the initial model were necessaryto match the observations. To bring the calculated syntheticseismograms into agreement with observations, the gradient atthe base of the LVZ had to be raised to shallower depths and thepositive gradient lid replaced with a smooth but gradual nega-tive gradient starting at the M-discontinuity. The final model,-10, that matches observations is shown by the solid lines in
Fig. 5. Figure 6 is the comparison between the observed andsynthetic record sections. interestingly, no discontinuity inP-velocity is necessary to explain the Plid reflections; thereflections can be adequately modeled by a small negative stepin S velocities at a depth of about 100 km. The synthetics,however, do not seem to adequately model the long oscillatory
trains following the P1 phase onset. This is probably due tointerference effects caused by fine structure in the lower LVZve~ocity gradient that we have not yet modeled by thin enoughlayers in the calculation [16).
These calculations illustrate that synthetic modeling tech-niques can be helpful in phase identification and in quantitativecalculations of amplitude vs. distance behavior and waveformcharacteristics. With a sophisticated reflectivity method cal-
culation we were able to model several important features of
- - ..-- . ~ - -

54
464 K. H. OLSEN AND L. W. BRAILE
VELOCITY (KM/S)
1 O0 2 3 4 5 6 7 8 90
•--50
-100
0:150
250
A- 10T7+P/B ------------
Fig. 5. P-velocity (a) and S-velocity (B) vs. depth plots forthe T-7/Priestly-Brune and A-10 models. Assumed Q structure atleft; a (dimensionless) is Poisson's ratio.
regional short-period seismograms. The technique appearspromising in advancing knowledge of wave propagation and sourceidentification at regional distance ranges.
ACKNOWLEDGMENTS
We especially thank Rainer Kind for making available to us themodified reflectivity method computer program that we haveadapted for our analyses. Paul A. Johnson was responsible forthe compuer runs. We thank Terry C. Wallace and Mike Shore fordiscussiofis and for reviewing the manuscript. The calculationaland data reduction efforts for this research were supported bythe U.S. Department of Energy and partially by ONR Earth PhysicsProgram grant N00014-75-C-0972 to L.W.B. The Snake River Plainsdata were collected during research partially funded by the U.S.National Science Foundation (grant EAR-77-23707 to the Univer-sity of Utah and EAR-77-23357 to Purdue University) and by theU.S.G.S. Geothermal Research Program grant 14-08-0001-G-532 toPurdue.
-q ..i - . .L i pII II I

65
S[ISIOGRMiS OF [XPLOSJONS AT RtEGIONAL DISTANCES IN THE U.S. 465
c co
0
I-
II
w
0o
I I J.J
.400eJ0 m.
040
0 0cz Lo C Ul) C
(03S) 0*L/

66
466 K. H. OLSEN AND L. W. BRAILE
REFERENCES
I. A. I. Ruzaikin, I. L. Nersesov, V. I. Khalturin, and P.Molnar, J. Geophys. Res. 82, pp. 307-316, 1977.'
2 L. Knopoff, F. Schwab, K. Nakanishi, and F. Chang, Geophys.
J. R. Astr. Soc. 39, pp. 41-70, 1974.3. V. Z. Ryaboi, Izv. (Bull.) Acad. Sci. USSR, Ceophys. Ser.,
AGU Trans. 3, pp. 177-184, 1966.4. R. P. Masse, Bull. Seism. Soc. Am. 63, pp. 911-935, 1973.
5. A. Him, L. Steinmetz, R. Kind, and K. Fuchs, Z. Geophys.39, pp. 363-384, 1973.
6. R. Kind, J. Geophys. 40, pp. 189-202, 1974.7. C. B. Archambeau, E. A. Flinn, and D. G. Lambert, J.
Geophys. Res. 74, pp. 5825-5865, 1969.
8. L. J. Burdick and D. V. Helmberger, J. Geophys. Res. 83,
pp. 1699-1712, 1978.9. J. E. York and D. V. Helmbezger, J. Geophys. Res. 78, pp.
1883-1886, 1973.
10. M. Cara, Geophys J. R. Astr. Soc. 57, pp. 649-670, 1979.
11. B. A. Romanowicz and M. Cara, Geophys. Res. Lett. 7, pp.417-420, 1980.
12. A. L. Hales, Earth and Planet. Sci. Lett. 7, pp. 44-46,1969.
13. D. P. Hill, Geol. Soc. Am. Bull. 83, pp. 1639-1648, 1972.
'4. K. Fuchs and G. fdller, Geophys. J. R. Astr. Soc. 23, pp.
417-433, 1971.15. R. Kind, J. Geophys. 44, pp. 603-612, 1978.16. K. H. Olsen, L. W. Braile, and P. A. Johnson, Geophys. Res.
Lett. 7, pp. 1029-1032, 1980.
17. G. MUller, J. Geophys. 42, pp. 429-436, 1977.18. K. Priestly and J. Brune, 3. Geophys. Res. 83, pp.
2265-2272.19. K. Fuchs, Tectonophysics 56, pp. 1-15, 1979.
20. L. Knopoff, Rev. Geophys. 2, pp. 625-660, 1964.

GEOPHYSICAL RESEARCH LETTERS, VOL. 7, NO. 12, PAGES 1029-1032, DECEMBER 1980 67
SEISMIC VELOCITY AND Q-STRUCTURE OF THE UPPER MANTLE LIDAND LOW VELOCITY ZONE FOR THE EASTERN GREAT BASIN
K. H. Olsen, 1 L. W. Braile, 2 and P. A. Johnson1
1Geosciences Division, Los Alamos Scientific Laboratory, Los Alamos, New Mexico 875452Department of Geoseiences, Purdue University, West Lafayette, Indiana 47907
Abstract. A 100-km-long record section of NTS (8 km) and yet long enough (M.100 km) to identify at leastexplroi recorded in the eastern Snake River Plains three distinct (T, A) branches for P waves whose(70<A<80) shows the cusp of critical refractions raypathsbottom in the uppermost mantle beneath afrom the steepened P velocity gradient at the bottom small area in east-central Nevada. Modeling of theof the upper mantle LVZ. Synthetic seismograms arrival times, amplitudes, and waveforms using acalculated with a modified reflectivity program have reflectivity method synthetic seismogram programkeen used to derive a regional velocity model of the (Kind, 1978; Fuchs and M'ller, 1971) enables us toupper mantle beneath the eastern Great Basin. The perturb the generic western U.S. models into amodel suggests that observed very weak P arrivals crust-upper mantle model which gives fine details ofare due to a slight negative velocity gradient below the the LVZ transition in this region.Moho and that no high velocity mantle lid exists in thisregion. Observations
IntroductionOur observations are recordings of two NTS nuclear
The seismic velocity versus depth structure of the explosions obtained while our equipment was deployedupper mantle and lower crust beneath tectonically in eastern Idaho during the Yellowstone-Snake Riveractive areas of the western United States has been Plains (Y-SRP) cooperative seismic profiling experi-studied extensively for nearly 20 years. This has been ment (Brale et al., 1979). Twelve special high-explosivepossible because Nevada Test Site (NTS) underground shots plus blasts at two quarries were used as sourcesexplosions and western U.S. and Mexican earthquakes for crustal profiles in eastern Idaho and Yellowstoneprovide frequent seismic sources in an area well Park. Figurela shows the area of the Y-SRPcovered by seismograph stations. Compressional experiment; Figure lb indicates those stations thatvelocity distributions have mainly been determined by were recorded on an approximate radial line to two NTSintegrating the slope of the travel time curve, dT/dA, explosions on September 27, 1978 (Table 1). Becauseusing the Herglotz-Wechert method. The required RUMMY and DRAUGHTS explosion sites were withintravel time (T) versus distance (A) data have been 3 km of each other, our observed record sections areanalysed from short-period recordings obtained along nearly identical except DRAUGHTS amplitudes arelong-range profiles (Archambeau et al., 1969; Masse et about 1/4 RUMMY amplitudes. We discuss only theal., 1972) and/or from apparent velocities measured better signal-to-noise RUMMY seismograms.directly across large seismic arrays (Johnson, 1967). Instrumentation consisted of 13 vertical componentRecently, availablility of high speed computers and short-period (1 Hz natural frequency) seismometers.development of sophisticated synthetic seismogram Ten of these were telemetered to a centrally locatedmodeling techniques make it practical to fit the travel site and recorded on analog magnetic tape; the threetime and amplitude data by a trial and error procedure southernmost instruments were recorded on portable(Burdick and Helmberger, 1978; Wiggins and smoked paper units and FM tape recorders. All recordsHelmberger, 1973). The important advantage of the were digitized at 100 samples per second and filteredsynthetic seismogram method is that it makes optimum (0-3 Hz) for this analysis.use of amplitude data and detailed waveform fitting to The reduced-time, true relative amplitude recordderive P velocity structure. section for the RUMMY explosion is displayed in
Many compressional and\shear wave studies show Figure 2. Three separate compressional phases withinthat a major feature of the tiantle structure beneath the first four seconds are marked on Figure 2a; ourthe western U.S. is a low velcity zone (LVZ) in the reasoning in so identifying these arrivals is as follows:depth range between 60 and 30 km. It is well known (1) The very first arrivals with an apparent velocitythat significant lateral variations in LVZ properties of 7.8-7.9 km/s are so weak that they could easily be(thickness, depth, values of minimum S and P velocities, missed on initial inspection. From the Y-SRP refrac-presence or absence of a lithospherie "lid," etc.) occur tion data, we determined that the M-discontinuity isover distances of several hundred kilometers and 40km below these stations and the mantle Pnperhaps to even finer scales (Burdick and Helmberger, velocity is close to 7.9km/s. An enlarged view of the1978; York and Helmberger, 1973; Romanowiez and first 12 seconds is shown in Figure2b where theCara, 1980). On the other hand, Burdick and consistency of the Pn arrivals across the spread isHelmberger (1978) suggest mantle structure deeper more apparent. These Snake River Plains seismicthan about 300 km is more uniform over a global scale stations had quite low background noise so theand therefore amenable to modeling using widely implication is that a true headwave Pn arrival willspaced sources and seismograph stations if emphasis is rarely be seen at distances beyond 600km in theplaced on long period body wave arrivals at distances western U.S., except from events of mb 6. In thesebeyond 100. Here we report on a record section of SRP seismograms the ratio of the amplitudes of theNTS explosions taken with matched short-period Pn arrivals to those of the P phase is smaller thaninstruments having a sufficiently small station spacing 0.005. (The 1 energy arrives at reduced times greater
than 32 seconds so is not shown in Figure 2a). OtherThis paper is not subject to U.S. copyright. Pub- investigators (e.g., Hill, 1972, 1973) have commentedlished in 1980 by the American Geophysical Union. that Pn energy at these distances is probably very
Paper number 80L147S. 1029
.h.,. -' -t

1030 Olsen et al.: Great Basin Velocity and Q Structure 68
MM up then used a refleetivity method program developed byur11 Kind (1978), which properly accounts for the effects of
oa buried source and thus allows computation ofcomplete nesmo rams. One advanta e of therefletivcty method over C onird-de Hoop techniques(Hemberger, 1973; elmberler and Burdik, 19 ) is
I.SNthat Q values can be individually ssined to eachSmodel layer rather than distributd over the entire path
adopted as the starting model for compressional wave
u ao velocites in the rust and manle. The generic T-I-T model-was constructed mainly from lonig period data to
40 M the NW and SE of XTS--w/th emphasis an vloitya tm saiV structure below 200km (arrivals for azl>IO). Since
11 II1.1.41V our observations are in the range 70<<80, we(a) ) perturbed the initial model only at depths above
Figure 1. (a) Location map of the western U.S. with 250 km. The T-7 model has a Pn velocity of
relative positions of the Nevada Test Site and the 7.95km/s with a positive gradient below theY-SRP refraction line. (b) Enlargement showing seismic M-discontinuity to 8.05 km/see at the bottom of the lidstations in Idaho used for the September 27 at 65km. A sutstantial LVZ for P-velocities is
observations. Asterisk denotes the approximate area in includeoPbelow 65 km (Figure 5).the Great Basin for mantle ray turning points from.NTS We did not calculate synthetics for shear waveexplosions. phases but were required to include a realistic
S-velocity structure because shear wave velocitycontrasts can have a major influence on P-wave
weak and that care must be taken when attempting to reflection coeffieients--especially for large angles of
extend the Pn branch during long range refraction incidence. Priestly and Brune (1978) used dispersion of
profiling, fundamental mode Rayleigh and Love waves to derive a
(2) Following Pn by about three seconds are shear velocity model in the eastern Great Basin very
stronger arrivals also having apparent velocities close close to the area of the mantle turning points of this
to 8km/s. A striking feature of Figure 2a is that study. The combined P- and S-velocity model, T-7/PB,
beyond 780km the amplitude of the second arriving is shown in Figure5 along with Poisson's ratio (a)
phase increases rapidly with distance and the dominant calculated from the tabulated velocities.
frequency is noticably lower (,0.S Hz) than the The modified refleetivity synthetics for the T-7/PB
frequencies for A<780km and for the Pn phase (both velocity model are shown in Figure4a for an extended
-1.6 Hz). This qualitative observation strongly suggests range from 600 km to 960 km. The P1 phase can be
that the rapid increase of the low frequency phase for seen only for distances beyond 840 km and reduced
6< 780km is a manifestation of a critical distance times greater than 13 seconds. In order to bring the
effect and that the high frequency energy has been synthetic P1 phase into agreement with the observed
attenuated along the travel path. The obvious place for arrival times and to shift the cusp from ^820 km back
this to occur is during the two-way transit of energy to 1-780 km it was necessary to bring the gradient at the
through the mantle LVZ (which also has a high
anelasticity, i.e., low Q). These critical refractions are 20shown schematically In the ray diagram of Figure 3; wefollow the convention of Archambeau et aL. (1969) inlabeling this cusp phase P1 . 15
(3) The higher frequency second arrivals for6< 780 km we attribute to large Iale reflections froman interface lying mainly above the LVZ. These a j0 :_l-
reflections are overtaken and overwhelmed by P1 for - (a)
A<780. Because of the apparent velocity near 8km/s1 ---------------
the high frequency content, and travel time just longer 5 II
than Pn, the synthetic seismogram modeling dis-cussed below suggests this reflection oeurs at the baseof the mantle lid and hence our notation of Plid. 00 7
Modeling 12 OISTANCE l10)
Our technique in modeling the record section was to -
first use a fast asymptotic ray theory computer P .bprogram (derveni, 1979) to fit travel times and CW
approximate amplitudes. For more exact modeling we S
I- 0 .700 720 740 760 700 OO 82D $40
TABLE I. iPTS uplowm r (Sepemb , 27. 1970 OISTACE ouIiOr,6,, Tme rwdimtm - epth rSIUf.wv %Q66nitd RUMMY1'r
so.#.. It1 tt. Le4. W ( m) (mb Pigure 2. (a)True relative amplitude record section ofnlW'rC.Hs 1709:00.071 37,740 114.0200W 441 lO2 s P-wave arrivals from RUMMY. (b)Same as (a) withRU ,,4Y 172,0.076 ,.0800WI 11..o.5,0W 60 12 .7 increased amplitudes to show weak Pn phase.
raf

Olsn et al.: Great Basin Velocity and Q Structure 1031 69
0 • m VELOCITY (KM/S)
-A,' : 3 4 5 6 7 a00Figure 3. Schematic ray diagram showing the head 10 .1..wave phase Pn, the P1 phase critically refractedfrom the gradient noar the bottom of the LVZ, and the .-Plid phase reflected from the base of the mantle lid.
bottom of the LVZ to shallower depths and to make A- 10 -
slight adjustments to Its curvature. Also note from T7+P/B ............Figure 4a that the T-7/PB model gives too large Figure 5. P-velocity (a) and S-velocity (B) versus depthamplitudes for Pn arrivels, and the Plid phase from plots for the T-7/PB and A-10 models. Assumedthe discontinuity at 65ikm depth arrives about 2.5 Q-structure for both models shown at left, a isseconds too early so s superimposed on the Pn phase Poisson's ratio.throughout much of the 600-960 km range. The resultof perturbing the T-7/PB velocity model to bettermatch the observations of Figure 2 is model A-10 shown contrasts (-.3 km/s for P,- 0.39 km/s for S) are used atin Figure 5. The A-10 synthetics are compared with the a depth of ^. 100 kin. In fact, by including the effect oforiginal T-7/PB model In Figure 4b and with, the more S-velocity contrasts on the P-wave reflection co-limited distance range observations in Figure 6. effieients, we can match observed Plid amplitudes by
keeping the P-velocity contrast at zero and relyingDiscussion entirely on an S contrast of -0.15 km/s to produce the
effect on these wide angle reflections. In moving theWe can summarize the nature and reasons for the bottom of the S-velocity lid from a depth of 65km
various model perturbations as follows: proposed by Priestly and Brune to the -100 km required(1) The steepened positive P-velocity gradient in the In our A-10 model, we introduced a negative gradient in
lower part of the LVZ has been raised in order to fit the S-velocities between these two depths; a similarthe arrival times and cusp distance of the PI phase. negative gradient can be seen in the higher mode
(2) In order to match the observed weak Pn, a inversions by Cam (1979), but these are not plotted inslight negative gradient just below the M-discontinuity Figure 5. Hill (1972) and Hales (1969) previously re-is required instead of the positive gradient of the ported arrivals following Pn by two to three secondsgeneric T-7 model. In fact, our A-10 P-velocity model at distances of v.600 km in sections from long rangesuggests that, beneath this part of the Great Basin, the refraction experiments in the Columbia PlateauLVZ may be in contact with the erust at the (EDZOE experiment) and the central U.S. (EARLY*-discontinuity. Similar indications of the absence of a RISE), respectively. Their interpretations-usng travelhigh velocity lid in parts of the western U.S. have been time Information only-suggest a thin (%10 km), sharp,cited by Archambeau et al. (1969) (especially for their but high velocity (8.0 to 8.4 km/s) lid at depths ofSHOAL-FALLON SE profile). 90-100 km is present in those regions. Our Great Basin
(3) The large negative discontinuity at a depth of data agrees in placing a discontinuity (which is perhaps65 km present in both the T-7 P-veloeities and the the "boundary" between the lithosphere and thePriesy-Brune model appears to be too shallow to athenosphere) at lOO km but our P-velocity contrastproperly match the observed Plid-Pn travel time cannot be as pronounced as those implied by Hill anddelay. The observed delay is better reproduced If the Hales and still give rise to the comparitively weakdiscontinuity Is at about 100 km depth. amplitudes that we observe in the 750 km range.
(4) The calculated amplitudes of the Pldre- (5) the Q-strueture (for P-waves) used for the A-10flection are much too large if the T-7/PB velocity model was a generalization of proposed values that
have appeared in recent literature. The most important. . . .. . . . segment is the low value centered in the LVZ. A Qo
value in the range between 50 and 100 appears toadequately attenuate the higher frequency components
I . .. go'1-1 4WP SIM TW0- "M-. Ili, --
Fgure 4. Sythetic seismograms (Z-component) of 0 .. !ey cpreona ph (a) the Ie - -,,T-7/PB model and (b) the A-10 mantle model (Figure 5) 0o5700 IM) ....,. ,,MM amis
which match the observations In the 720 to 820-km (a) ()range. Travel time curves calculated from the Cerveny Figure 6. Comparison of observed (a) and synthetic (b)program. Amplitude multiplied by distance for seismogram record sections for the 720 to 820-kmconvenient plotting. dbtance range.
-~ -- "-

1032 Olsen et al.: Great Basin Velocity and Q Structure 70
of the P1 phase. Q0 ,100 in the LVZ does not Burdick, L.J. and HeImberger, D.V., The upperattenuate P1 enough, whereas Qa ,, 25 completely mantle P velocity structure of the westem Unitedobliterates the P 1 phase In the synthetics. Our value States, J. Geopys. Res., 83, 1699-1712, 1978.of S0<Q&<100 is of the same order as that deduced by Cara, M., Lateral variatio 0f S velocity in the upperHelmberger (1973) from Cagniard-de Hoop techniques, mantle, Geoohys. J. Roy. Astron. Soc., 57, 649-670,
(6) One possible shortcoming of the A-10 model is 1979.the failure to reproduce details of the oscillations of terveng, V., Accuracy of ray theoretical aeismo-the observed P2 phase. We do not believe this to be a grams, J. Ganphy., 46, 135-149, 1979.result of an inadequately detailed source spectrum, Fuchs, K. and Mler-, G., Computation of syntheticsince a comparison of the explosion source spectrum seismograms with the reflectivity method andalgorithm used in the modified reflectivity code s comparison with obse.vations, Geophys. J. Roy.reasonably represented by the source spectrum plus Astron. Soc., 23, 417-433, 1971.instrument response function calculated from known Hars,1A. , T seismic discontinuity In the litho-physical parameters of these explosions (Mueller and sphere, Earth and Planet. Science Letters. 7, 44-46,Murphy, 1971). Arehambeau et al. (1969) observed 1969.compressional wave energy spread out in long, rather Helmberger, D. V., On the structure of the lowcomplicated omcillatory wave trains near caustics and velocity zone, Geophys. J. Roy. Astron. Soc., 34,attributed this to interference between refracted and 251-263, 1973.reflected components near the cusp. Our model layer HelImbrger, D.V. and Burdick, L.J., Syntheticthicknesses (,.5 kin) In the region of the lower depths of seismogrms, Ann. Rev. of Earth and Planetwythe LVZ (120-150km) are of the same order as the Sciences 7, 417-442, 1979.wavelengths (0.10km) of the dominant short period Hill, M.P.,Critically refracted waves in a spheri-energy. Thus, we believe the oscillatory P1 trains cally symmetric radially hetergeneous earth model,may be due to small details of fine structure In the Geophys. J. Roy. Astron. Soc., 34, 251-263, 1973.transition zone which we have not yet attempted to Hill, D.P., Crustal and upper mantle structure of themodel at the required resolution. Columbia Plateau from long range seismic-
In conclusion, relatively minor adjustments in the refraction measurements, Geol. Soo. AmericaT-7/PB model for the western U.S. yield an uppermost Bulletin, 83, 1639-1648, 1972.mantle structure that reproduces in detail the upper Jo i, CR., Array measurements of P veloci-mantle arrivals and very weak Pn observed in the ties in the upper mantle, J. Geophys. Res.. 72,Great Basin. 6309-6323, 1967.
Kind, R., The reflectivity method for a buried source,Acknowledgments. We especially thank Rainer Kind J. Gephys. Res., 44, 603-612, 1978.
for the modified reflectivity computer program used in Masse, P., Landisman, M., and Jenkins, J. ., Anour analysis. We appreciate the assistance of our LASL investigation of the upper mantle compresslonaloolle*Fues, . P. Homuth and T. 0. Handel with the velocity distribution beneath the Basin and Rangeobservations and J. N. Stewart for computer advice, province, Geophys. J. Roy. Astron. SoO., 30, 19-36,Cooperation of the Idaho National Engineering 1972.Laboratory during the field work is appreciated. Mueller, R. A. and Murphy, J. R., Seismic charac-K. H. 0., P. A. J., and the LASL field team were teristies of underground nuclear detonatons: Part 1,supported by the U.S. Department of Energy. L. W. B. seismie spectrum scaling, Bull. Seismol. Soc. Am., 61,acknowledges support from NSF grants EAR-77-23351 1675-1692, 1971.and EAR-77-23707 and ONR grant N00014-75-C-0972. Priestly, K. and Brune, J., Surface waves and theField data were collected during research partially strdoture of the Great Basin of Nevada and Westernsponsored by the NSF grants and by USGS Geothermal Utah, J. Geoph. Res., 83, 2265-2272, 1978.Exploration Program grant 14-08-0001-G-532. Romanowiez, B. A. and Cara, M., Reconsideration of
the relationes between S and P station anomalies inReferences North America, Geophys. Research Letters _,
417-420, 1980.Arehambeau, C. B., Flrm, . A., and Lambert, D. G., Wiggins, R. A. and Helmberger, D. V., Upper mantle
Fine structure of the upper mantle, J. Geophys. Res., structure of the western United States, J. Geophys.74, 5825-5865, 1969. Res., 78, 1870-1880, 1973.
Br-le, L.W., Smith, R. Ft., Ansorge, J., Baker, M.R., Yo',- J.9. and HelImberger, D. V., Low-velocity zoneProdehl, C., Healy, J. H., Mueller, 8., Olsen, K. H., variations in the southwestern United States, J.Priestly, K., and Brune, J., The Yellowstone-Snake Geophys. Res., 78, 1883-1886, 1973.River Plain seismic profiling experiment: easternSnake River Plain (abs.), EOS Trans. AGU, 60, 941, (Received September 7; 1980;1979. accepted October 7, 1980.)
.ldhdw&hw-6 ~

71
Modeling Short-Period Crustal Phases (P. Lg) for Long-RangeRefraction Profiles
K.H. Ol1= 1, L.W. Braile 2 and IJN. Stewart''gawk and Spacreno... iindm Lu Almc -NowmiLabereawey. Las Alono. NM 17545 (U.i4.)
Dqwva. of Goadom PWid anwsdr. Wear Laleveit IN 4M97 IV.SAJ
The ehorseiod anemic phases, know. as P and Ig axe ofuTe recorded at distances of 200-100k Jao.o bg-ragrefractmo profine and are: uuafly the larges-awuplisude featres. an remr sections for this disanc range P and L&V ,pegete a multiply ,eflecied compressional and shear waves in a miassal waveguide whose principal boundaries arethe Meck and the fre sarfams Equivalently. they can be interpreted as the interference pastern produced by asup FApoof . higher-mode . 9V and SN WSWe prosag in a laky weaegude For eauapraonal mu. thewavaguid efficiency a a strong functon of frequency and depends. theO premc or absm of lo-velocity layerswithin a few kilometers of the surime. each as deep sedimmtsay sections commonly found in mve tectonic men. So*low-velocity surface laves rats constructiv mnteronce effects for upcomsing P -as incident at ner Veaina alas *Aheie mraftc and lead to efficiet 1 propagaton. Sewnra good exaumples of wStrn P phase can be found onlong-tangs refraction profies for the sectonically ave wosr United Staow, the 550 km profile eastward fromeSHOAL to Delta. UT is analyzed here. We have need a moodified reflectiviy-method computr prafopa to odelmussel pheem for the SHOAL-Dalta profile. The raemv4ty technique accounts for all body and solace wavesconbutingto theshort-pariod ei ra.Itu isf utht thse synthetic wavefas realistically model the obeue Pchamracteriemc. In thi came the decay Of P amplitudes with disance appears to be dominated by euaer llnmtleakage from the wavapuide amber tha by anelassic aietuon of cruenal rocka.
1. Itatedwd comnptting "oMplete" saisuxpams. mncuding allbody and surface waves. Out objective is to in-
Until recently, the velocty structure of the vestigate the possible utility of modeling ratherEarth s cums was inferred manly from travel-time Complex Short-PerOd Crustal Phases (eg., P andstudies of easily correlatable seismic phases, (usu-. Lg) as an aid to the interpretation of crustalally first arrivals) recorded in refraction profiling properties and structures. In this paper we attempt
epneta. Amplitude and waveform informa- to describe the more important characteristics oftinon seimic-record sections was used mainly in the P and LS Phases, investigate conditions for the
a qualitative way in phase identifications and as generation and propagation of these phases, andan indication of velocity gradients, transition zones determine which properties of the Earth structureand attenuation properties. Since 1970, the in- influence this proagtion. Because of the comn-creased availability of high-speed comiputers and plexity and uncertainties about the theoretical de-the development of sophisticated synthetic-seismo- tails of the generation and propagation of thesegram modeling techniques has made it possible to crustal phases they have heretofore been littleuse amplitude and waveform data optimally to used in the interpretation 6f seismic refractionderive detailed velocity and Q structure (Muller profiles - even though they are often the largest-and Fuchs, 1976; Braile, 1977). In particular, we amplitude features on record Sections. We showemploy here a modified reflectivity-method Pro- one aspect of how modeling crusta] Phases withgramn developed by Kind (1978) that is capable of complete synthetic seistmopams can improve our
0031-9201/I2/0000/S017S 09IM Eleeier Scientific Publishing Company

.72
knowledge of Earth structure. Because relatively P-bar and - 3.5 km s- for L& (Olsen and Braile.few complete seismic-record sections (or regional 1981).distances (200-2000 km) showing P and LS phases Both P-bar and Ls phases propagate efficientlyare available from observed dama, we rely heavily in the continental crust and are often the largest.on the analysis of P and L& waveforms by means amplitude arrivals on short-period seismograms atof synthetic seismograms calculated using the regional distances (Fig. 1). In addition to the comn-modified reflectivity method for a variety of Earth plex and long-duration character of both P-barmodels. and L& phases, these arrivals also display little
For clarity in both typography and conitext, we coherence in waveform or even in the envelope ofshall henceforth write -P-bar in place of the P the complex wave packet over relatively short dis-notation. tances. These characteristics of P-bar and 4g wave
propagation can be modeled qualitatively usingsynthetic-seismogram techniques. An example of a
l2egqonal Ciia Pbmes (P. L4) vertical-component synthetic-seismogratm calcula-tion resulting from a crustal model appropriate to
The P-bar and LS phase are usually well me the westen United States or other tectonic areas iscorded on short-period instruments at regional "hw in Fig. 2. Both P-bar and LS phases aredistance ranges (100-2000 km). They are .com- prominent arrivals on the reord sections, havingmonly seen as broad (At > 20 s), complex wave durations of tens of seconds and relatively largetrins having group velocities or- 6.0 km s- for amplitudes in the short-period range. Unlike the
T-X/? (s)020 40 60
X I I I I I
' 0_ _ _ __ _ _ _ _ __ _ _ _ _
X C i. _ __ __ __ ___ __ __ __ __ __ __
II8-W .
-001
FI&~~~~~ ~ ~ ~~ _.__________w n * dffvB dwm i wSuoa 1 vm fdCM2M ~ d f UNW tM M 6 M Oot Mbm 4 M 4 hM POOM MMd-vewoe Ion~ 62k -14.Ak -1 meavY o omXbyd-10 a mh~ mb W db
ftu ~ ~ ~ ~ -msmlAW m Dyw aw(93

73
SYNh(T1E U13W~PSS IO0l1ID RPl.kEC~t Vt!r rI40D
INTUMI0N LlIITS PtM VELOCITY • 3.0. 20 invs
700
240warm U.S. 210I1ICI IC 15
ao so-
4 6 a 0 0 1,; eS MI5M ov uIN") CMy. SIXni Z-C€i SwN3 TinA
Fig2 Vu2 mI..mpoarI sylrmiuiomopats -ad actim for a austal model repfmetave ofa taicioeky active soef sucas the was. Uids Sum. The Pf P-b. Sm. LS and m Rayeib (R) wave iops are indicated the X = 1100
primary waveforms, such as Pn and Sa, which is illustrated ian Fig.3 indicating the waveformdisplay waveform coherence over long distances, characteristics of the complex P-bar and Lg phasesthe P-bar and Lg waveform characteristics change as a functio of reduced time as wed as theirconsiderably with distance, and phase correlations average or group velocity. It is seen for this modelare usually impossible. However, correlation of the that the P-bar phase has average velocities in theenergy represented by the group-velocity envelope range of 6 km s-I and the LS phase has groupis usually possible. An enlargement of one of the velocities near 3.6 km s-.imogrms for the record section shown in Fig. 2 Observations and synthetic-seismopun anly-
s1"ITEric EmqK I MODIFIED REFLCTIVITT IMET"O
AVUR1GE VELOCITY 1101,11
1.0 7.0 6.0 5.0 4.0 3.6 3.2 3.0
¢TIlIOAW
.I
0 20 40 6I0 60 100 520 J40 150 160laetU.S. I1ZT4CI CNLT.L Hol T-XISI 15)
' ,+... ,. . - .. 1,r. --
. + __ ii ii i AL

.. . . .. . .. _
74
'
~LrM
20 3040 ~ 20-
-100 0I ssag,oss No ili o, M ooo
V tsuU5I 1TRYI1014 CItC FO R X IM
Fiu. 4 V~sim~a~po~o etioedsmo Im rowt ci calailajd naaog the modified rellectivity method for cloody specui(10 kin) mazimopaliu at daiamm beea 5N0 and 950 km an eplouiom sorce Nowe bow rapidly the wevelom oberen vaneswith dissnam a the P-bar window (reduced time 4-70 s). Mw P-vdmty a=W mod u "orn at th I-L
sis presented here and by Douchon (2982) suggest window arises from P to S conversion. Once con-that both P-bar and Lg propagate as multiply verted. SV energy is very efficiently confined in areflected compreusional and shear waves ithin wavegide whose prncpal boundaries are discoa-the crust. ar, equivalently, they are the interference tinuities or steep velocity gradients at tlkc. Mohopatterns produced by the superposition of a large and at the free surface Although we have not herenumber of leaky P. and S-modes respectively modeled the SH component of motion of the LS(MaskeD 1966). We have performed a paramete phase, we expect that it also can be represented asstudy of abort-period propagation from explosion a guided wave with the nea surface and Moho assources in continental crustal model, which shows waveguide boundaries, as Bouchosi (1982) has alsothat the modified reflectivity technique can repro- suggested. The total channeled energy is relativelyduce many of the observed characteristics of these insensative to fine-scale detail (a few kmn) of vra-phases, such as envelope modulation rapidly vary- cal velocity gradients near the wavegtudeing lateral-waveform coherence. ecS& (Olse Of. boundaries, but the waefor cohernc at surface
;j1a0mometers can still vary appreciably over do-f-or synthetic modeling of ELg using shalow tances of - 10 kmn (Fis.4 and 5). Undercritical
uxplosion sources, the SV energy in the 14 group and wide-angle reflections at the waveguide
1WT!-SMhION CMREN t t M#LSI
soo
120
V t4s, am. hIMIIr--1C5"9 5CM PLOAICIOPIC
Fa S. Syselie read e y Biuatns rapid latal cses in wavdo cabermm in the L window (reduced n e 130-170s)for theme modenmd ran in wA& b
th-rso, qiaetyte r hei"riic -- i-es r tee vlocty ____ i t -.

75
boundaries are nearly total, so attenuation and thefrequency spectra depend almost entirely on Q ofcrustal materials. Thus 1. is a good measure of 0. a
There is frequently a confusion or imprecision* in the literaiture concerning the nomenclature for ~
the P~baphase with the tarmPgbeing applied toany phase following Pa and having an apparentvelocity of -6.0 kmn s-1. in the western UnitedStates where the complex P-bar phase can be veryprominent. at -distances of 200-2000 km., the Pgphase - a head wave traveling along the top ofthe "ganitic" basement - attenuates extremelyrapidly and is usually unobservable beyond - 150 MOE SDl0, UPPER 6.7KM J
kin (Rtyall and Stuart. 1963). So, although P-baronsets fallo= the extension of the Pg travel-timebranch, the two phases have quite different prop-agation and attenuation characteristics. Similarlyto L4. the "t rue" P-bar phase propagates by multi-ple wide-angle reflection of PniP, but the- efi-ciency of the upper waveguide boundary is a coln-plex function of frequency and i very sensitive tothe presence of low-velocity layers at or near thesurface. Our paramete studies (e.g., Figs. 6 and 7)confirmn that a low-velocity surface layer - suchas the thick sedimentr section in tectonic areassuch as the Basin and Range and Colorado Plateau MOE 509, UPPER 6. 7KM )
poncsof the western United States - is thekyfactor for efficient propagation of P-bar. The
controlling factor is the nature of the fre-surfacereflection of upcoming P-waves previously rmflected from the Moho, and midcrustal discontinui-tdes. In the absence of low-velocity surface layers(iLe., in shield areas) nearly all upward-traveling Penergy is converted to SV upon free-surface reflec- '.?tion. Note the very small values of the P-PAenergy-reflectiOnl coefficient (R 0 , 0O) in orig.6(A); the energy fraction converted to SY at thefree surface is Rft= I-RAOp (Haskell, 1966).4 Zt-loX o,Thus, P-SV conversion is nearly complete and MODEL 5016, UPPER 6.7KM ICIP-bar does not propagate efficiently in shields.
On the other hand, when a low-velocitynear-surface layer is present, Ropp is a stronfunction of frequency (owing to constructive anddestructive interference effects) but on the average Fwg 6. Eawuw fleti =defidmt A., as a fuacuce of an*is large (igs. 6(B) and 6(CQ. A relatively lArg of iandO aed freuniUSC for lbS thUS am&a and Ranamount of omptusaonal energy isrflce bac sa"nw od shon ~Fig, 14. A,,. is the (vacua of imaet
P'B wnwstD reflcte as P (rm th fme owtuc. NIow that.into the crust, and P-bar propagates with mod- for thW free srface the iraciom of P-Wau stee GcaMW tocrate efficiency. Figure 7 illustrates the effect of a 5v is AWS I - Al

76
taw~.m 'tw.low-velocty surface layer on both P-bar and Ls* * propagation. Figure 7(B) illustrates that as the
-. tickness of the low-velocity surface layer is in-creased, the efficiency of propaga. ion of the P-bar
- * phase increases. With no low-velocity sedimentary
(A) "~*order as thoue of primary arrivals such as Pn and
surface layer does not capthepeakamltdin in.of the P-bar phase appreciably, but does sifi-
* a a scandy affect the complex waveform characteristicsof the phase. The exact waveform character of the
W&M VXIT'rInin)P-bar phase cannot be predicted at any givmn-. distance. even for these laterally homogeneous
mo~ls, because the lateral coherency (Fig. 4) variesU U 0 ~ -rapidly owing to the constructive and destructive
interference effects inherent in the propagation ofUsa: OUR P-bar. Barker et al. (19S1) have emphasized that
x: WSo ' -- the P-bar and Lg phases are sigafinty affectedby local geological structure (site-response condi-
flu a tions). They have shown that variations in amph-XS -- tude, by a factor of as much as 10, and significant
If differences in the character and waveform of bothTIOV 3M 0 2 2 a w-P-bar and 14 may be caused by local geological
.44 conditions in the vicinity of the recording seismo-. . * graph. However, these local effects must be dis-(B) tm~ K",q " lkPP T.4/gIs tinguished from the waveform complexity which is
due to constructive and destructive interference4.4O K=" 4410"ICY effects in the propagation of the P-bar and L&
3.. 3. 3. -. - - phases. For example, in the very simple and later-We ... aW " . , .- , -. - ally homogeneous models that we have shown here
1106OP -a 0(Figs. 2, 4. 5, 7(B), (C), the detailed characteristicsXS of the P-bar and Lg phases are Complicated be--
cause of propagation effects even though the pos-sible contributions of local geological conditionshave not been included.
ism. 2 0Haskell (1966) has discussed the attenuation ofP-bar amplitudes with distance due to P to SYconversion by multiple surface reflections, And
CANSI) low-velocity oafto layers; (3) SYutheu ssapm
Fill 7. (A) P .2. ty vein depth for awIal modes with upt for the L& umn window. Only ViniMW 00numut ANimpectively 3 km (Tio PI.ATI) 2 km. I kcm. and 0 km (TIC dhowi.
a' T""K

77
concluded that this leakage attenuation usually the lower Crust). Three observations provide evi-dominates ova Q-effects even in the western dence for the efficiency of P-bar and Lg propap-United States where P-bar is often very strong on tion being due to a waveguide effect in which theshortperiod seismopams. Our work on the lowr boundary of the waveguide s the MoboSHOAL-Delta record section discussed below is discontinuity. First, Haskell (1966) has shown thatin apeeme1t that P-bar attenuation is a poor the Moho velocity-transtion zone (or disontinu-mesure of Q for crustal rocks, ity) is an effective reflector for wide.angle P and
Shurbet (1960) observed P-bar phases from SV reflection (large refection coefficients). Sec.Nevada Test Site (NTS) explosions at Lubbock. ondly, observed seismic refraction and wide.TX (- 1400 km range) and suggested (Shurbet, angle-relection record sections for both shield and1969) that a low-velocity (V,. - 5.5 kn s- )chan- tedonic areas (Fig. 8-10) indicate that P-wavenel at depths between 5 and 10 km would explain reflection from the Moho (phase PrP) not only isseveral features of the P-bar phase on the Lubbock larse, but multiple PmP arrivals can also be dis-seimogms. Our reflectivity-method calculations tinguished on the semnic-record section. Theseshow that such a low-velocity crustal channel is multiple PmP reflections (as well as other, more.not uniquely required for P-bar propagation - complicated paths) contribute to high-amplitudelow-velocity layers at the surface are sufficient to arrivals which have a complicated and long-dura-form a good P-bar waveguide. However, since tiont wave character but which travel within anP-bar is essentially an interference patternproduced by layers less than one seismic wave-length in thickness (analogous to thin-film coat- 0 6s8-3Cins in optics) shallow low-velocity channels would taffect the details of the P-bar coda. Thus, certaindetails of P-bar phases may in some instanceslend h a:dsupportto suggested low-velocty channekin the Z5ii~
Strong P-bar phases are often found on long- 2range refraction profile for other parts of theworld, as well as for the western United States, ..oGood examples are the Eschelobe NW profile insouthern Germany (Mueller, 1977), the 900 kinBrest to Toulon profile in France (Him et al.,1973; Kind, 1974) and the 800 ki EDZOE profile os-3w
intermittent P-bar phases (FiglI). PtchmIt '-sevteanaropan Rofies and alsof conludeta 0
P-bar cosit of a.uper oio of mult,,.ply re- -g..,,fleeted PoP waves, which are recorded only if the " " .-upper reflection point atthe surface lie in e"ment ary terrain. -,
As suggested by Haskele (1966) and Bouchon(1932), the low e boundary of the was wuide for (3gy dFuchs, 197))illnsiambowmulupieflucoosofP-bar and propaation is the Moho (with pot- p (P.PP) rmp - na beyond A0 km to fou pable conributions from other disontnuit within c. -b
' ta X-rA s sug g este b y "H -sk e l 1 " 6)., a nd.- .o n ,& L I .... w ed = f n * e C . . .

78
A P
• :..21: *"
.,-1. - ,--I _- L * : .;'- ..
Fig9. Via -- at mcdses hrm NIM to E&e, NV. iflumnia mmpn of MWUlie Pm? az disA@=e beycd 300~ km woform pat df P-a.
average velocity of -6 km s-I a ross the record propagation of the P-bar phase as illustratedsections at ranges of several hundred kilometers or schematically in Fig. 11. Multiple PmP reflections,greater. Thirdly, our synthetic-seismogram model as well as more-complex multiples wihin the low.studies, as shown above and in the synthetic wave- velocity surface layer and possible P to S conver.forms calculated for the SHOAL-Delta profile sions and multiples at the Conrad disontinuity,discussed below, as well as the results of Bouchon contribute to wide-angle reflected energy having a(1982), also indicate that the Moho discontinuity complex interference waveform propagating at -6is an effective waveguide boundary for P-bar and km s-I at distances of several hundred kilometersLg propagation. Thus, we view the generation and from a source. A low-velocity srface layer is
* ~ ~PPPMPP, -
'ing
.5 -,I"___!I " ' , : "
.eu
71s. 10. mg effem s in mPi&9 for the profile frm il to Navajo Lake, NM.

79
RAYPATHS
, .,M, IM/I
0" U .:: I
MWW9 ALI
REDUCED TRAVEL TIME CURVES
,MITUE-OISTANICE C.VIVESI "I.
0 'M MO 300 40 IM
X biv~I
Fl3 . i 1. Sthmaidbiaammdeaalho mltiple re'lectioIs of PP mw to forI the arusal P-ba pas fa rag beca -20
phase. If te surfce low-veoiy a is n ,ot pre- lusraein F, ig. 7. We expec that both tke SV ardsent, the majoity of multiple Prop energy is even- SM components of Lg wave prdpagau~or c aial.tuallyc€onverted to SVmoion as indicatod by dhe oglous to those sbownin, Fi. 11 for P. crelection coefficients shown in Fig. 6 and the re- that the low.velocity surface layer is not required
.
. . .
. . . ... ,..-D - . ,.

80
in order to produce an efficient waveguide. The The long-range SHOAL profile was part of afree surface and the Moho and other crustal dis- network of refraction-profile recordings mainly incontinuities are adequate for producing a wave- California, Nevada and Utah carried out betweenguide for the Lg phase. 1961 and 1963 by field parties from the U.S.
Geological Survey (Prodehl, 1979). Approximately31 different explosion and earthquake source sites
3. Application to SHOAL-Delta profile were used; there were several explosions within theNevada Test Site (shown as only one source loca.
Figure 12 is a map of the western United States tion in Fig. 12). Many of the crustal models de-showing the locations of several refraction profiles rived by Prodehl (1979) from the 1961-1963 pro-that display examples of the P-bar phase. This iles were obtained from 200-300 kin profiles usingpaper discusses only the interpretation of the P-bar chemical explosions in the Pacific Ocean. in lakesphase along the 550 km profile extending eastward or in drill holes. Two of these segmentedfrom the nuclear explosion SHOAL to Delta, UT. shorter-range reversed profiles (NTS-Boise. ID.
* , ,/ 4.
/ i/\ ,-'----; I
,. , .
!-h --..--- ...-
Fg. 12 Location of m- log-=a wismc pof les (havy hia) in th wster Uited Stat whih ahiit strang P-e plaAstarisks are macleer esplas ia.ne; d=t sam dbmaal shoipoits. Dashed ham are araectiog shwwramp profile which wmrused for deml tastalsruetwe tudin. Nulear hoepoint S. SHOAL. 0. OASBUOOY; NiS. Nrvada Tes Site. 0th,.shotpaints: 0A Del" Ur:; Eu, Eureka. NV;. Mo NV; B ise, ID; H, Hike NV; F. FaB.. Nv (aeflhqualt). Simplifid frmMProdehl (1979).
- _ q 4 h . -,- III I ---

81
and Fallon, NV-Delta, UIT) intersect near Eureka, station coherence (or lack thereof) of the differentNV, which is near the midpoint of the SHOAL- compressional phases is not apparent. Our syn-Delta long-range profile. thetic-seissnogram modeling shows rapid changes
The observed reduced-time vertical-component in interstation coherence for the P-bar phase overrecord section from the SHOAL shotpoint is given distance intervals sometimes less than 10 km. suchin Fig. 13(A) (Prodehl. 1979), where the onset rapid coherence variation is one of the more dis-times of the Pn. PmP and P-bar phases have been tinctive characteristics of P-bar and Lg inter-marked. For the - 200 km profiles used for de- ference-pattern-type phases, as discussed above.tailed cral-structure studies, ten - 2.5 kmi (six. However, the P-bar phases from SHOAL (Fig. 13)seismometer) spreads were separated by distances well illustrate another characteristic of these phasesof - 10-15 kmi (Prodehl, 1979). In contrast, as - the long oscillatory trains folowing emergentshown in Fig. 13(A), the long-range SHOAL pro- onsets In Fig. 13(A), the P-bar trains becomefile had - 50 kmi station separations, so the inter- identifiable at ranges between 300 and 400 kmi.
Our procedure for modeling the SHOAL-Deltasetsmoprams was to accept the basic Basin and
U~RV NP~~)C~C SZSUIORISRange crust/upper-mantle velocity model inter-WOWIN FM ftE prfted by Prodehl (1979) from several short (ISO-
6 250 km) refraction profiles in the vicinity of4 PMP_ Eureka, NV (Fig. 12) involving shotpoints at2 Eureka, NV; Delta, UT; Hiko, NV; Elko, NV;0- ~ and NTS. This is the crustal model given in Pro-
-2 del's (1979) Table 2 and shown here in Fig. 14.
-. -6w4 SHOAL DELTA IEUREKA)CRUSTAL MODELS
-1 ONDAL-M1A5
-2
-4i.In
0 im no0 lo 400 S0 600
6D)(wr esi modwfrti HA-ea TeS9SI/D6Mdl e o h 'astictsimo
lasill-mp ~ ~ ~ ret5' rW prmssecmUas( i aultosdfe ~ m&etp3I=Asmdcpo0-P an -b an -dtf by -aha hu am so-o at03k-et o l se

82
We then adjusted the details of the P-velocity somewhat different, both the SD9 Model (uniformmodel ono. for the uppermost 3 km (Models SDi0, 3 km layer of 4 km s- I sediment) and the SDi6SD9 and SDI6, shown in Fig. 14). Our purpose Model (uniform gradient from Vp = 4.0 km s-I athere is not to make a complete reinterpretation of 0.6 km depth to V, = 5.7 km s- I at 3.0 kin) showthe SHOAL-Delta profile, but only to demon- appreciable P energy returned to the crust forstrate how the presence or absence of low-velocity energy in the -60" incidence angle and 0.5-1-5surface lavers determines the corresponding pres- Hz range, which are the ranges in which most ofence or absence of P-bar phases on Basin and the energy is transmitted for these models. FiguresRange record sections. Our synthetic modeling 15{() and (C) show that the integrated result ofindicates that we could continue improving the fit such multiple reflections is a well-developed P-barto the relatively sparse SHOAL-Delta observa- phase in both cases. Conversely, the SDIO Modeltions by adjusting deeper crustal velocity discon- with no low-velocity surface layer (Fig. 6(A)) hastinuities and/or gradients as well as the near- nearly zero P-P conversion and completelysurface velocity structure. However, we feel that supresses P-bar propagation (Fig. 15(A)). Sincethese other model adjustments might unduly con- * there are, undoubtedly, lateral variations in thefuse the key physical issue of the P-bar/low-veloc- near-surface layer structure and velocity, wavesity surface-layer relation that we want to em- propagating in the real Earth will "avcrage" minorphasiz here. For all SD-seies Models the. source variations, and a detailed matching of P-bar wave-depth was held constant at 0.3 km - the ap- form and modulation characteristics is not justi-proximate SHOAL explosion d6pth. Poisson's rate fled. However, the total energy in the P-bar phasewas assumed to be 0.25 (Vs= V,/4J), and a as represented by the RMS amplitudes ove theNafe-Drake velocity-density relationship was as- several-second duration of the P-bar phase is asumed (Olsen and Braile, 1981). The assumed vari- quantity that depends on the presence of low-ation of Q with depth is also shown in Fig. 14. The velocity surface layers over the propagation path,assumed peak frequency for the source spectrum but this energy is relatively insensitive to assumedwith 12Hz. fine details in the synthetic modelsl so long as
The crustal model that gives the better agree- some low-velocity layers are present (see alsomert with the observed record section is SD9, Fig, 7(B)).which has a pronounced low-velocity layer (VP = In summary, the short-period regional custal4.0 km s- 1, 3 km thick) at the surface. The ob- phases, commonly known as P-bar and L4, propa-served and synthetic record sections are compared gate as multiple P-wave and S-wave reflections inin Fig. 13. a crustal waveguide whose principal boundaries
are the Moho and the free surface, as shownschematically in Fig. 11. Near-surface low-velocity
4. Discussion layers create constructive interference effects forupcoming P-wave energy at wide angles of inci-
The key role of near-surface layers in control-, dence, which results in a large fraction of theling the amplitude and character of the P-pc P-wave energy being retained in the waveguidephase can be followed by comparing Figs. 6 13 and hence in efficient propagation of the P-barand 15. Figure 6 is a comparison of the reflection phase. For no surface low-velocity layers, nearlycoefficients (square root of energy) for near-surface all upcoming P energy converts to SV and is lostP to P reflection (R0vp) for near-critical to prazing to further P-bar propagation. Although the Mohoangles of incidence of upward-traveling P-waves. and the free surface are also the principal wave-These plane-wave reflection functions were calcu. guide bundaries for Lg. Lg propagation effi-lated using a Thomson-Haskell layer matrix ciency is little affected by near-surface low veloci-method (HaskeD 1966). which is the same algo- ties.rithm used in the reflectivity program (Kind, 1978). Comparison of our synthetic modeling with theAlthough the details of the interference fringes are observations discussed by Barket et a1. (1982) sug-
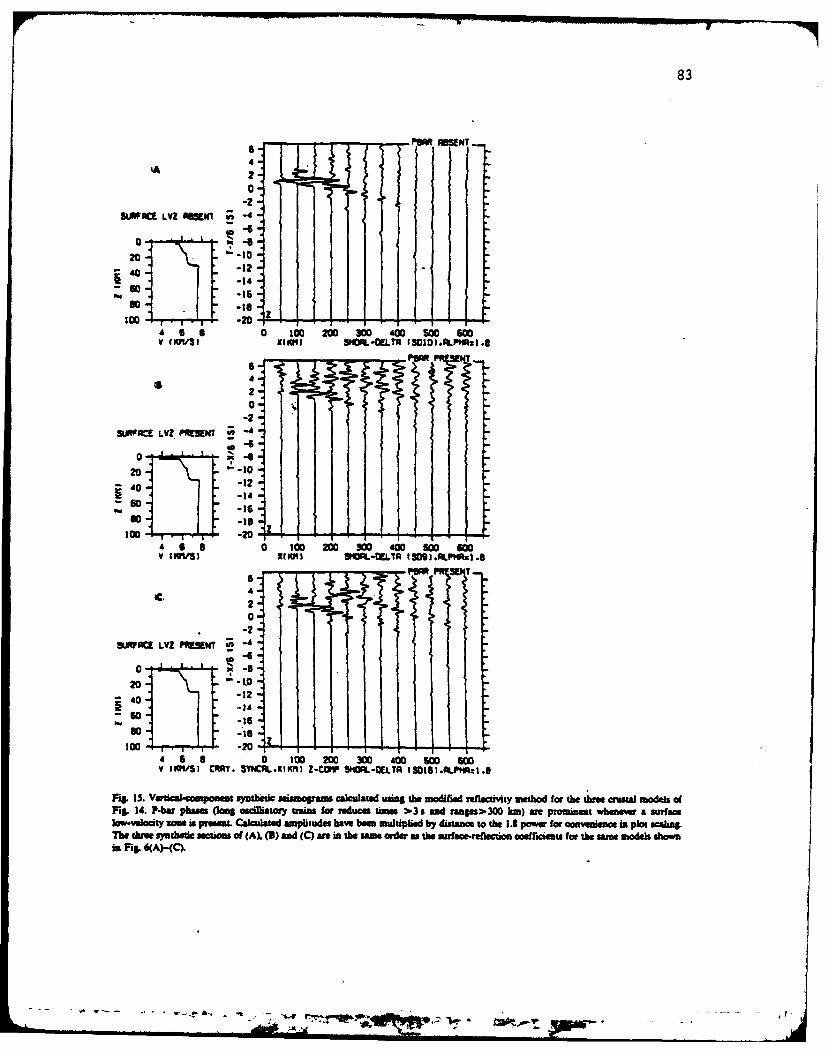
83
S - - -- .. MEM
4
-12
-1S-1S
4 S S 0 100 200 300 4M0 00 160v ONvs I KIMNI SPX-MEL? 13OIIAPII.8
6 42
-25aDPM~ LV! PMCENV -4
0-. -S
-10s o , - 0 1 0
4 00 10 200 30 400 100 600V 1M19n ZIMt SIa-iLIh IS09.FtPRl.S
SRSC. 4
20
-2
SW~Ac! LV! PKSKWT 0-4
02w* Lo
-12-1S
4 S S 0 100 200 300 400 Soo 600V IX"VI CfRry. SYNCg...XtIMI Z-COMP SM0.-ILTA t50tSI.ftLPHR:.S
FgS.Vwtcai-eompot synteti seaunoprams Wicuated umSi the .odifid rfleathity method for the the am odl o-f-aPig. 14. P4ba phaes (lIMS MeclAoSM tains for reUce times zo3s and ranga300 kin) are prominent whenve A suf mwlow-velocty wone is present Caleulaed amplitudes have bee mupled by disance to the 1.1 poW for comiwenmc in plot 5caln6The thme syemtic sectios of (A). (B) and (C) mOan the saorderas wthe mtrace-reflwcto oermmeu for the sam models shownin Ft&. G(AH4(

84
gests that there are two important factors in the Douchon. M. 193. The complete synthe, of mac =utobserved complexity of P-bar and Lg phases. The Phu" At Woal dstaneL 3. I eophys. Res. 87: 1735-first is the complicated interference patterns of 1741.Draile L.W. 1977. Inuuterrttion of crustal velosity Vradimupropagation, even for very simple laterally homo- a QW 1 Ie n m f rustle city Vri-a
geneous crustal layers such as we have discussed tiao prOflm. In: J-0. Heamctk (Editw The Earth's Crust.here, and the second is the local geology or site-re- American Geopbysicl UnKm. Geophysical Monoraph 20.sponse effects. The first-order effect is that of Washianton. DC. pp. 427-439.laterally homogeneous layering; propagation Haskell. N ,- 1966. The leakage atenuat o o contenalwithin this structure is sufficient to produce very t al P ws- I 0veOL L R..s 71: 3955-3967.
complex seismograms which display littie lateral rane orA. ls in western E e IL an st cu. r o1 the
coherency, as we have shown. Consideration of the looe lithophere in France (southern Dretae). 2. Geo.effects of local geological conditions. as discussed phyL. 39: 363-334.by Barker et &1. (1982), leads to further waveform Kind I. 1974. Long r age propapo of smc 533V i
the ow lithoeq* J. Geophys.. 40: 189-20aand. amplitude complexities which are difficult to Kn IL. 1"8. The rle avity method for a buried source. J.disentangle in single-station seismograms, Gphys, 44: 603-612.
Mu. ILF, Majumdar. SC. and Whitm L 19n. TheSstructure of the crust and upper mantle under the highest
Acrowledgamts nges of the Canadian Roiea from a asmic refractionA11may. Can. J. Earth ScL. 14: 196-208.
Mueller. ., 1977. A new model of the contiaul crut In:We thank Greg Ebring for the Thomson- J.0. Mescock (Editor) The Eart's Cms Anme n Gee-
Haskel computer program and for the reflection- physical Union. Ceopysical monoaph 20. D. pp. 289-coefficient plots. Carl Daudt assisted with corn- 317.puter work and ilustrations. We are grateful to Maller. 0. and Fuchs, K.. 1976. Irvasion of sumic recordsDave Warren for collecting and mking available with the aid of synthetc ammopms. In: P. OeM C.
Prodeho and S Stm (Editors) Explono Semolog mto us unpublished amplitude-calibration data for Cnral S Sprinlf. Berlin. pp. 179-11U.the SHOAL-Delta profile and for GASBUGGY OlsM. L and Daile. LW. 1931. Sumograms of erplosiosrecord sections from U.S. Geological Survey open at reional distances an the western United States: obser.files. We thank Mike Berry for the record sections don and relecuvity method modebag, In: ES. Husecy
and S. Mykkelrveit (Editors). ldentifcaion o Seismcin Figs. I and 8, and Claus Prodehl for those in - or Undergound Exp ReidelFigs. 9 and 10. This work was supported by the Dordre. pp. 453-466.U.S. Department of Energy. Prodehi. C.. 1979. Crustal Smcture of the western United
State. Prof. Pap. 1034, U.S. Gal. Survey, Wa hi-toD. 74 pp.
RYaiL A. and Start. DJ. 1963. Travel times and ampitudesfrmo nuclear explosions. Nevada Test Site to Ordway.Colorado. J. Geophys. las. 68: 5321-5335.
Darker. B.W. Der. ZLA. and Mraw. C.P. 1931. The efflect of Shurbert. D.H. 1960. The P phase tUansttd by custa rockcrustal structure an the regional phases Pg and 14 at the to intermediate distanies. J. Geophys. Ras 65: 1809-1814.Nevada Tet Site . reophys. Rm.. 36: 1686-1700. Shurbet, D.H. 1969. A low-velocity layer in the Earth's erust.
DerT. MJ. and Fuchs. K. 1973. Crustal structue of the GOL Soc. Am. Bull 80: I9-193.Superior and Gavie provinces of the northeasternCanUdia shield. BulL Sismol. Soc. Am.. 63: 1393-1432.
- .-.- -. v*-. "* -- I
-, .....-. s _ . " - '

J Geophys (1982) 51:153-164 Journal of 85Geophysics
Amplitude Study of the Pg Phase*E. Banda', N. Deichmann , L.W. Braile2 , and J. Ansorge'
Institute of Geopbysics, ETH-Hoenggerberg, CH-8093-Zfirich, Switzerland2 Department of Geosciences, Purdue University, West Lafayette, Indiana 470907, USA
Abstract. The amplitude 'of the Pg phase, as recorded in rough picture of the velocity-depth structure. The increasingexplosion seismology studies, is analyzed with the aid of use of the ray tracing interpretation techniques and meth-synthetic seismograms. Parameters such as source fre- ods derived from the Herglotz-Wiechert travel-time inver-quency, low-velocity cover above the crust (sediments or sion (including r-p methods) result in velocity models ofweathered layer), low-velocity layers within the upper crust, the upper crust that include velocity gradients which arevelocity gradients, thickness of the gradient zone, attenua- very often poorly defined. In fact, layers with constant ve-tion and Poisson's ratio strongly influence the amplitude- locity, the simplest model, fit the travel-time data equallydistance pattern of the Pg phase. A systematic study clearly well in most cases. Healy (1963) has shown that very differ-shows that different models of the continental upper crust ent velocity-depth models, from homogeneous layers todisplay distinct amplitude-distance characteristics. These continuous gradient zones can fit equally well the travel-models could not be distinguished by travel-time interpreta- time data for a particular phase. However, as will be showntion alone. below, the amplitude-distance character of these models
In the presence of gradient zones the amplitude-distance may be significantly different. At present, either very de-curve shows different patterns depending on the source fre- tailed travel-time information or amplitude studies are thequency. The higher the frequency, the more pronounced only techniques available for accurate determination ofare the relative maxima in the amplitudes. The presence velocity gradients in the earth's crust.of a low-velocity cover at the surface accentuates the char- In the following discussion, we use the term upper crustacter of the amplitude-distance curves even if the cover for the upper 10-15 km of t'.e crystalline continental base-is thin (a few hundred meters). Moreover, a low-velocity ment lying immediately beneath the surface sediments andcover produces P to S conversions and multiples following above the lower crustal layer. The P-wave velocity of thethe Pg which obscure possible secondary crustal phases. upper crust normally varies between 5.7 and 6.3 km/s.The thickness of the velocity gradient zone influences the These velocities are characteristic of sialic rocks at the ap-amplitude decay and the width of the relative maxima. propriate upper crustal temperature and pressures. TheLow-velocity layers within the uppercrust cause a faster compressional seismic wave critically refracted (head wave)drop-off of the amplitudes than would be expected from in the upper crust is usually called Pg. In explosion seismicray theory. Detailed Pg amplitude studies are thus useful studies, the Pg phase is normally recognized as the firstin improving the knowledge of the physical properties of arrival in the distance range of about 10-100 km. The nota-the upper continental crust. The application of the derived tion Pg is also used in earthquake seismology studies butcriteria to two sets of real data allow us to determine fine in these cases it often refers to a different phase at largerdetails of the velocity-depth function which are of great distances.importance for the understanding of the earth's crust. Studies of the Pg phase recorded in refraction profiles
(M5ller and Fuchs, 1976; Miller and Mueller, 1979, BandaKey words: Explosion seismology -Upper continental crust and Ansorge, 1980; Braile et al., 1982) have shown how- Seismic amplitude - Source frequency - Low-velocity amplitude information can be used to greatly reduce thelayer - Velocity gradient. range of models fitting the travel-time interpretation. As
refraction surveys are becoming more detailed, with closelyspaced recordings and improved amplitude control, we feelthat the qualitative comparisons attempted so far in most
Introduction amplitude studies are not enough, and that understandingUnderstanding the fine structure and physical properties the variation of Pg amplitudes as a function of variousof the continental crust is one of the principle goals of parameters will provide further insight into the velocityexplosion seismology. Interpretation of seismic refraction structure of the upper crust. In turn, this information willdata using traditional travel-time methods gives only a serve as a basis for comparison with laboratory measure-
ments and petrological studies leading to a better knowl-* Contribution No. 383 Institute of Geophysics ETH-Zrich. edge of the physical properties of the basement.
Switzerland In this paper we discuss. on the basis of synthetic se-Offprint requests to: J. Ansorge ismograms, the Pg amplitude-distance curves and their vari-
0340-062X 82 0051 0153 S02.40

154 86
ation with parameters such as frequency content of the contrasts. For our computations we have used thicknessessource, presence of low-velocity cover and of low-velocity corresponding to less than one wavelength of the frequencylayers within the upper crust, velocity gradients, thickness range considered.of the gradient zone, attenuation (Q- ') and Poisson's ratio. Record sections of the vertical comlionent of groundWe also present examples of amplitude-distance modelling displacement have been calculated for all the models withfor observed Pg amplitude data from central Europe and a distance interval of 5 km between 0 and 100 km (Fig. 1).western North America. Except where stated, the Vp!Vs ratio was assumed to be
C3 (Poisson ratio= 0.25) and the Q, values were fixed at100 for the sediments or weathered layer and at 500 for
Methods of Computation the basement with Qs equal to 4Q/9. The depth of the
Synthetic seismograms can at present be calculated by a source was fixed at 100 m depth.variety of methods. For our purposes we have used the All record sections were plotted with a reduction veloci-reflectivity method developed by Fuchs (1968) and Fuchs ty of 6.0 km/s and the amplitudes of each trace were multi-ind Muller (1971) with the fundamental modification by plied by the distance for a more accurate reading of theKind (1978) and the asymptotic ray method described by 'amplitudes (Fig. 1). Amplitudes were read taking the maxi-Cerven, et a]. (1977). These two methods and others have mum (peak-to-peak) of the first cycle (reading the first pulsebeen extensively discussed in the literature (see Chapman, has given identical results for theoretical seismograms). Fi-1978 and Spudich and Orcutt, 1980 for reviews). nally the amplitude readings were plotted as function of
Since the objective of this paper is to describe in detail distance, as shown in Fig. 1.the amplitude-distance behaviour of the Pg wave and to The phase velocity interval used to determine the rangeunderstand related later arrivals (multiply reflected, re- of angles of incidence over which the reflectivity programfracted and/or converted), we have used mainly the reflecti- integrates was 0.2-0.4 km/s below the minimum velocityvity method. The modification by Kind (1978) includes in the models and 1.0-2.0 km/s above the maximum. Thisthese secondary effects by taking into account the free sur- range includes all of the compressional and shear wavesface and placing the source in the reflectivity zone. This of interest propagating in the upper crust. The large phasetechnique requires velocity models consisting of laterally velocity range leads, especially for high frequencies, to veryhomogeneous and isotropic layers. Velocity gradients are long computer runs (e.g. for the model in Fig. 1, 23.3 minapproximated by a stack of thin layers with small velocity CPU time on a Cyber M0722A). However, it is worthwhile
0
IL' 11011 !• 5 C
K ..........- ., ll
U -J1 10 dL .
is . -'4 5 6 7 0oo 100
VP rKH/S3 OISTRNCE CKMJ
3)
'I -
-0-O P S
0 10 20 30 40 50 60. 70 80 30 100X (KfM)
Fig. I. Example of synthetic record-section calculated using the reflectivity method with a dominant frequency of 4 Hz for modelPG IIK. displayed in the left inset. The amplitude-distance curve (solid line) is shown together with the curves for !/'x and I ix2 decaysin the right inset. Note the prominent secondary phases: Pw. %hispering gallery (see terveny et al., 1977), Pg(S). direct Pg convertedto S at the base of the sediments, PgPg, Pg reflected once at the free surface, PgPg(S). reflected Pg converted to S
:,,,w"

87Table I. Model parameters 8
Model Lower Layer V, Number Gradientlimit thick- ofof layer ness layers
-1"
(kin) (kin) (kmis) (km/s/kin)
PGI 2.0 2,0 4.0 2 0.0 Rectivity
15.0 13.0 6.0 5 0.020.0 5.0 6.5 2 0.0 .... :Ray method ,
PG3 2.0 2,0 4.0 2 0.015.0 13.0 5.9-6.1 5 0.01520.0 5.0 6.1 2 0.0
PG6 2.0 2.0 4.0 2 0.0 .
15.0 13.0 5.75-6.25 1 0.038 20.0 5.0 6.25 2 0.0 cc
PG11 2.0 2.0 4.0 2 0.0 -1015.0 13.0 5.5-6.5 5 0.07720.0 5.0 6.5 2 0.0 .20 -
PGI IK 2.0 2.0 4.0 2 0.0 me0 ,1979) co7.0 5.0 5.5-5.885 5 0.077
20.0 13.0 5.885 3 0.0PGIIKK 2.0 2.0 4.0 2 0.0
10.0 1 0 5.5-6.12 0 0.077 Vw t CKd/S320.0 10.0 6.12 2 0.0
PG11L 2.0 2.0 4.0 2 0.0 pe-7.0 5.0 5.5-5.885 5 0.077 o (Fg 2). l o thi cas als wit aet
12.0 5.0 5.5 2 0.0 im STRNCE CKM20.0 8.0 6.3 2 0.0 Fi. 2. Amplitude-distance curves (peak-peak) of Pn phase for
PGILL 2.0 2.0 4.0 2 0.0 model EC4 (erven , 1979) computed using relectivity (continuous
10.0 8.0 5.5-6.12 8 0.077 line) and using ray-method (dotted line)
15.0 5.0 5.5 1 0.020.0 5.0 6.3 1 0.0
PG12 2.0 2.0 4.0 2 0.015.0 13.0 6.1-5.9 5 -0.015 with the asymptotic ray theory method, we started by teter-20.0 5.0 6,5 2 0.0 mining the amplitude-distance curves for one of the models
PG22 2.0 2.0 4.0 2 0.0 published by Cerveny (1979) for which he used both meth-15.0 13.0 5.3-6.7 5 0.108 ods (Fig. 2). Although this case deals with a gradient zone20.0 5.0 6.7 2 0.0 in the upper mantle, the situation is analogous to a gradient
SUL3 7 1.0 4.5 2 0.0 zone in the upper crust with a sedimentary layer above.1.3 0.3 4.8-5.6 1 2.67 The ray method obviously sharpens the peak of the ampli-5 . 3.7 5.6-5.9 5 0.081 tude-distance curve. This is because the asymtotic ray meth-
10.0 5.0 5.9-6.1 7 0.04 od represents a "high frequency approximation" to the21.0 11.0 6.1 2 0.0 wave equation (erven , et al., 1977; Chapman, 1978). As
SULZ4 1.0 1.0 4.3 2 0.0 is shown below, similar erence obtained from other1,3 0.3 4.8--5.6 b 2.67 computations.in this study. The ray method is inexpensive6.3 5.0 5.6-6.0 6 0.0 and for much of the available data and some crustal models,17.0 10.7 6.0 2 0.0 which can also include lateral inhomogeneities, this approx-
SULZ6 1.0 1.0 4.6 2 0.0 imation is accurate enough. For more detailed studies, in5.7 47 5.6-5.95 7 0.074 which the models can be approximated by flat homoge-8.2 2.5 5.95-6.0 4 0.02 neous layers, the reflectivity method is more appropriate
17.0 8.8 6.0 1 0.0 and has therefore been used in this paper.SULd 1.0 1.0 4.6 2 0.0 The synthetic seismograms computed in this study rep-5.7 4.7 5.6-5.95 7 0.074 resent ground displacements instead of ground velocities.
7.0 1.3 5.95--5.98 3 0.023 - as measured in observed seismograms. As shown in the17.0 10.0 5.98 1 0.0 example in Fig. 3, for which both velocity and displacement
were calculated, the difference in the amplitude-distancebehaviour is not significant. At least for the models pre-sented here, the results from displacement can thus be
performing these computations to reveal the influence -of applied directly to observed velocity data. Moreover, itthe sediments. Many tests were run before choosing the should be noted that the dominant frequency used in dis-best illustrative models for the purpose of this paper, whichi placement computations is increased when the displacementare listed in Table 1.- sismograms are differentiated to obtain velocity (see
To compare the performance of the reflectivity method spectra in Fig. 3).

.15688
0 0
==i rlZr0= U
P4 -10
0 6 7 25 HzVP CK/S3 VP CKH/S3
Fd VOUNC f 3.0
0 0.
K"
-l U TN 5-F(UEOT~r '' feE
Cc 0.2 V.
0 5 10 15 200
FREQUENCY CHZ3
0.6
O R rray2 0. 2method
1.0 .5 Z. 0 0.0 e.i 0. a a 5 10 15 20
REDUCED TIME CS3 REDUCED TINE CS3 FREQUENCT C'iZ3
C 10 20 30 '40 50 60 70 8'0 90 100 110 120 0 I'D 20 30 '40 50 6'0 70 so 9t :.C
DISTANCE EK11- DISTANCE EK14J
Fig. 3. Comparison of amplitude-distance curves of displacement Fig. 4. Amplitude-distance curves for model PG I IK (upper right(continuous line) and velocity (dotted line) seismograms for model inset) for frequencies of 2.!, 4. 5 and 8 Hz (Fourier spectra inPG II KK (upper right inset). The corresponding spectra show the the lower inset) computed using reflectivity method (contmnousfrequency shift between displacement and velocity signals. The lines). Dotted line corresponds to ray-method computation withbottom insets show the signals (at 35 kin) for displacement and program SEIS4velocity; the intervals used to calculate the spectra are markedby vertical bars
Discussion of Model Parameters For the same model, amplitudes were computed withSource Frequency the asymptotic ray theory and are also displayed in Fig. 4.
As was to be expected, the ray method works reasonablyThe frequency content of seismic refraction data varies from well for high frequencies, although the slope of the ampli-about 2 Hz to more than 20 Hz depending on the shooting tude decay is somewhat enhanced. Asymptotic ray theorytechnique, charge size, frequency response of the instrument accounts for the influence of different frequencies on theand local geological environment. Comparison of the shape amplitudes of waves reflected at first order discontinuitiesof the amplitude-distance curves for low frequency source (terven ' et al., 1977) but not for waves refracted from asignals (-.2 Hz) with those for high frequency (% 8 Hz) gradient zone (Banda, 1979). Therefore, if we are dealingshows significant differences when velocity gradients are with good quality data, suitable for amplitude studies, ittruncated at shallow depth or low-velocity layers are pres- is of fundamental importance to compute the theoreticalent in the model. For that reason we have computed most seismograms using the reflectivity, or other wave theoryof the models for frequencies 2-8 Hz. method, with a source which has a dominant frequency
Figure 4 shows an example of the results for model similar to that of the experimental data.PGI IK computed for 2.5, 4, 6 and 8 Hz dominant frequen-cies. The fact that the velocity structure of the upper crust Thickness and Velocity Structure of Sedimentschanges, from a positive gradient (0.077 km/s/kin) to zerogradient at 7 km depth produces a different response of Qualitative differences in the character of the wave fieldthe medium depending on the source frequency. The varia- due to the presence of sediments are well known. Theirtion of amplitude with distance is more pronounced at the influence was studied quantitatively with models which arehigher frequencies. As discussed in more detail below, this identical except for the velocity structure of the sediments.is due to the fact that shorter wavelengths are affected Figure 5 shows the results for models with 0, 0.2, 2 andmainly by the focusing effect of the gradient zone, thus 5 km of sediments overlying an upper crust containing aproducing strong relative amplitude-maxima at a distance velocity gradient of 0.077 kms/krn. Beyond about 60 kmof 45 km. At the same distance, longer wavelengths are the shapes of the amplitude-distance curves are essentiallyalready affected by the homogeneous layer beneath the gra- identical. The most important difference is that even fordient zone. Higher frequencies are thus more informative models with as little as 0.2 km of sediments, a relative maxi-in amplitude studies. mum of the amplitude curve is observed which is missing
Ir,
'Idi& POIM
i
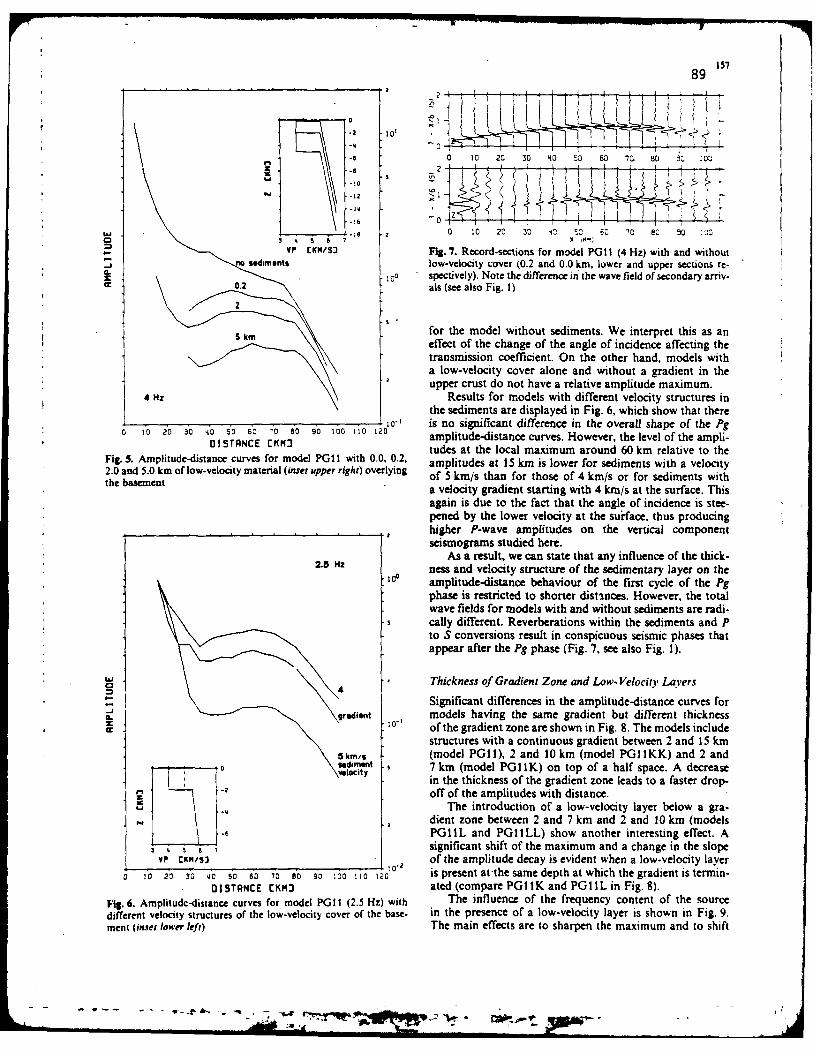
15789
.2 101 i
0 10 20 30 4o so 60 70. 60 0 : 00
Z 2
-12
-to 0 10 20 30 4 0.C 60 70 6. 50 i 0
VP CX/S3 Fig. 7. Record-sections for model PG 11 (4 Hz) with and withoutno sediments low-velocity cover (0.2 and 0.0 km, lower and upper sections re-
o.0 spectively). Note the difference in the wave field of secondary arriv-C" 0.2 "als (see also Fig. 1)
for the model without sediments. We interpret this as aneffect of the change of the angle of incidence affecting thetransmission coefficient. On the other hand, models witha low-velocity cover alone and without a gradient in theupper crust do not have a relative amplitude maximum.
4 Hz Results for models with different velocity structures inthe sediments are displayed in Fig. 6, which show that there
610 1 is no significant difference in the overall shape of the Pg0 10 20 30 450'o 6 ,0 io "o 100 110 120 amplitude-distance curves. However, the level of the ampli-
DISTANCE E tudes at the local maximum around 60 km relative to theFig. 5. Amplitude-distance curves for model PGI I with 0.0, 0.2, amplitudes at 15 km is lower for sediments with a velocity2.0 and 5.0 km of low-velocity material (inset upper right) overlying of 5 km/s than for those of 4 km/s or for sediments withthe basement a velocity gradient starting with 4 km/s at the surface. This
again is due to the fact that the angle of incidence is stee-pened by the lower velocity at the suiface, thus producinghigher P-wave amplitudes on the vertical component
. ' seismograms studied here.As a result, we can state that any influence of the thick-
2.5 Hz ness and velocity structure of the sedimentary layer on theI c amplitude-distance behaviour of the first cycle of the Pg
phase is restricted to shorter distinces. However, the totalwave fields for models with and without sediments are radi-cally different. Reverberations within the sediments and Pto S conversions result in conspicuous seismic phases thatappear after the Pg phase (Fig. 7, see also Fig. 1).
I Thickness of Gradient Zone and Low-Velocity Layers
*" Significant differences in the amplitude-distance curves forgradient models having the same gradient but different thickness
-- " of the gradient zone are shown in Fig. 8. The models include
structures with a continuous gradient between 2 and 15 km5km/s (model PGII), 2 and 10 km (model PGIIKK) and 2 and-sediment 7 km (model PGI IK) on top of a half space. A decrease
:, \ 'I'lity Yin the thickness of the gradient zone leads to a faster drop-F1 off of the amplitudes with distance.
The introduction of a low-velocity layer below a gra-dient zone between 2 and 7 km and 2 and 10 km (models
S I" PGIIL and PGIILL) show another interesting effect. A7 significant shift of the maximum and a change in the slope
VP CKM/3s of the amplitude decay is evident when a low-velocity layer0 0 20 301 50 63 70 eo 90 001 120 is present at-the same depth at which the gradient is termin-
DISTANCE CKtM3 ated (compare PGIIK and PGIIL in Fig. 8).Fig. 6. Amplitude-distance curves for model PGI 1 (2.5 Hz) with The influence of the frequency content of the sourcedifferent velocity structures of the low-velocity cover of the base- in the presence of a low-velocity layer is shown in Fig. 9.ment (inset lower left) The main effects are to sharpen the maximum and to shift
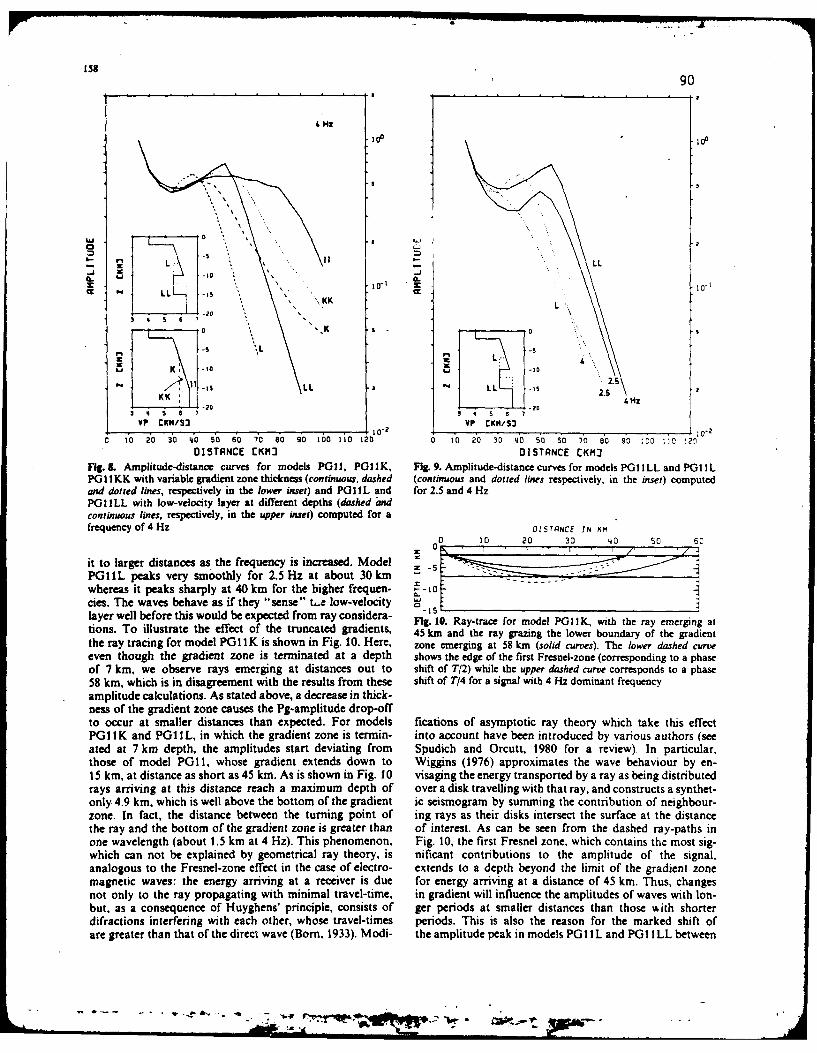
15890
t HZ
5 9
I.J0
.. I~~~ -D_' J.. i
-r 10-1
L
M L
K -10 l.,
,,.I1 zsLL a LL -s 2.S
KK kIL ' 2.5\z, ' ~ -20 -20
IP C'KIIS' 1 ¥- P rKM/S' 0,, 0 2 , *
C 10 20 i0 '0 SD 6o 7 8O 9o0 160 110 120 0 10 2'0 30 '0 5' tO -'0 8' 9'0 :6O 11C 1211DISTRNCE rKM' DISTANCE CKH)
Fig.& Amplitude-distance curves for models PGII, PG0IK, Fig. 9. Amplitude-distance curves for models PGI1LL and PGIILPGII KK with variable gradient zone thickness (continuous, dashed (continuous and dotted lines respectively, in the inset) computedand dotted lines, respectively in the lower inset) and PGI IL and for 2.5 and 4 HzPGI ILL with low-velocity layer at different depths (dashed andcontinuous lines, respectively, in the upper inset) computed for afrequency of 4 Hz OISTCE IN K
0 1o 20 30 40 50 60
it to larger distances as the frequency is increased. ModelPOIL peaks very smoothly for 2.5 Hz at about 30 km . ----whereas it peaks sharply at 40 km for the higher frequen- !_-0cies. The waves behave as if they "sense" tLa low-velocity - _
layer well before this would be expected from ray considera- Fig. 10. Ray-trace for model P011K, with the ray emerging at
tions. To illustrate the effect of the truncated gradients, 45 km and the ray grazing the lower boundary of the gradientthe ray tracing for model PG11K is shown in Fig. 10. Here, zone emerging at 58 km (solid curves). The lower dashed curveeven though the gradient zone is terminated at a depth shows the edge of the first Fresnel-zone (corresponding to a phaseof 7 km, we observe rays emerging at distances out to shift of T/2) while the upper dashed curve corresponds to a phase58 km, which is in disagreement with the results from these shift of T14 for a signal with 4 Hz dominant frequencyamplitude calculations. As stated above, a decrease in thick-ness of the gradient zone causes the Pg-amplitude drop-offto occur at smaller distances than expected. For models fications of asymptotic ray theory which take this effectPG11K and PGI IL, in which the gradient zone is termin- into account have been introduced by various authors (seeated at 7 km depth, the amplitudes start deviating from Spudich and Orcutt, 1980 for a review). In particular,those of model PGI 1, whose gradient extends down to Wiggins (1976) approximates the wave behaviour by en-15 km, at distance as short as 45 km. As is shown in Fig. 10 visaging the energy transported by a ray as being distributedrays arriving at this distance reach a maximum depth of over a disk travelling with that ray, and constructs a synthet-only 4.9 km, which is well above the bottom of the gradient ic seismogram by summing the contribution of neighbour-zone. In fact, the distance between the turning point of ing rays as their disks intersect the surface at the distancethe ray and the bottom of the gradient zone is greater than of interest. As can be seen from the dashed ray-paths inone wavelength (about 1.5 km at 4 Hz). This phenomenon, Fig. 10, the first Fresnel zone, which contains the most sig-which can not be explained by geometrical ray theory, is nificant contributions to the amplitude of the signal.analogous to the Fresnel-zone effect in the case of electro- extends to a depth beyond the limit of the gradient zonemagnetic waves: the energy arriving at a receiver is due for energy arriving at a distance of 45 km. Thus, changesnot only to the ray propagating with minimal travel-time, in gradient will influence the amplitudes of waves with Ion-but, as a consequence of Huyghens' principle, consists of ger periods at smaller distances than those with shorterdifractions interfering with each other, whose travel-times periods. This is also the reason for the marked shift ofare greater than that of the direct wave (Born, 1933). Modi- the amplitude peak in models PG I IL and PGIILL between
I IOft

159
91
G1DIENT (0OVS/0) LS HX12: -0.0151: 0.0 13: +0.0155: +0.038
11: +0.07722: +0.108 -
a. C-€: • 22-.
.... .......
i2
Is O. S0. . . .. 2.5 Hz ------?.. .. 2000
VP E:KN/53 VP r'K1S37{. ,10-
2 10-2
0 I 20 30 '4 50 60 70 80 90 00 liD 120 0 10 20 30 40 50 60 70 80 90 100 110 120
DISTANCE EK"IM DISTANCE EKM3
Fig. 11. Amplitude-distance curves for models PG12 (negative gra- Fig. 12. Amplitude-distance curves for models PG 1, PG6 and PG IIdient). PGI (no gradient) and PG3, PG6, PGlI and PG22 (positive (see inset and Table 1) for Q= 500, continuous lines, Q = 200,gradients) for a frequency of 2.5 Hz (see Table I for model specfi- dotted lines and Q= 2000 (dashed line for model PG 11)cations)
2.5 and 4 Hz, and for the frequency dependence i. ,n were calculated for 2.5 Hz, they are also representative ofin Fig. 4. higher frequencies as long as the gradient zones extend to
Reflections originating from the low-velocity layer have sufficient depth. The results shown in Fig 11 illustrate thatalso been studied. Our results do not differ from those pub- small positive velocity gradients in the upper crust will belished by Braile and Smith (1975), Smith et al. (1975) and resolvable by amplitude measurements on reasonably goodfurther modified by Banda (1979): the reflection from the experimental data. For example, the amplitude-d --. ztop of the low-velocity layer will only be seen as a separate characteristics of Models PG1 and PG6 are significantl%phase when the upper crust has a very small or zero gra- different although the velocity structure differs only b% thedient, the frequency is high enough and the transition is presence of a small (0.038 km/s/kin) gradient in Modelnearly a first order discontinuity. In this case the interfer- PG6.ence of Pg with the reflection changes the Pg amplitudesat larger distances (this has not been studied in detail inthis paper). If the above mentioned conditions are not ful- Attenuation (Q)filled the Pg amplitudes will barely be affected by the reflec- We have tested models with Q values for compressionaltion from the top of the low-velocity layer. waves of 200, 500 and 2000 for the upper crust to investigate
the influence of attenuation upon the amplitude of the Pgwave. The curves shown in Fig. 12 are not sufficiently dis-
Variation of Gradients tinct for us to infer apparent Q from Pg amplitude calcula-tions. As already demonstrated by Hill (1971) a slight chan-
It is well known that even a slight positive velocity gradient ge in the gradient could make up for the differences showngreatly influences the amplitude of refracted phases in Fig. 12 without taking the attenuation into account. To(Cerveny, 1966; Hill, 1971). Thus, we have tried to vary estimate Q in the basement one could use the method pro-systematically the velocity gradient in the basement models posed by Braile (1977) which requires that the Pg ampli-in order to determine the corresponding amplitude-distance tudes be modelled simultaneously with the amplitudes ofcurves. We have arbitrarily chosen the gradient to be linear, the reflection from the bottom of the upper crust. Alterna-Amplitudes for models with various gradients between tively, if the geometrical spreading factors are sufficiently-0.015 and 0.108 km/s/km were computed and are shown well known, and the band-width of the source is broadin Fig. I1. From a comparison with a calculation for model enough, it is conceivable that spectral ratio methods (seeGPl 1 at higher frequency and from the discussion in the BAth, 1974 for a review) might be adequate to infer Q inprevious section, it can be stated that, although these curves the upper crust.
.. ............. ..- '..

160 92
2--
(0
0 10 20 30 L0 so 60 70 60 30 100 110 120
CID
0 ! L.... .... .... . .I. . .. .[ . .I. .. [ . ..... .. .... I.. .. I. . . .I. . . .I. ..... .. ..... ' ' .... .... .. . .
O0 0 20 30 40 so 60 70 80 30 100 110 120DISTANCE IN KM
O 10 20 30 40o 50 60 70 80 90 100 110 120
0
-S
I-
10
Fig. 13. Bottom: ray-trace for model Sulz-7. Note vertical exageration of model plot. Middle record section of S..lz-south data, verticalcomponent, bandpass filtered 8-16 Hz, trace normalized. Travel-time curve corresponds to ray-trace below Top. synthetic record sectionof flat layer approximation of model SuIz-7 (see Fig. 14 and Table 1) vertical component velocity amplitude multiplied by distance
Poisson's Ratio (a) Schoeneich, 1968; Lemcke et al., 1968). The velocity struc-
Seismic velcity studies of the crust show that a Poisson ture of the basement was then adjusted until the generalratio of 0.25 is in general a good average. However, in shape of the travel-time data was matched. No attempt
was made to model the local variitions in sedimentarysome cases strong deviations from this value have been structure and basement depth which produce the small time
found. The influence of a has been studied for a few models screanemedt e o rocecte records.with values 0.2-0.35. The resulting amplitude-distance discrepancies, limited to one or two consecutive records.
wihves 0.2-.35 Thefer resuificantltin froma tde ance This applies particularly to the local anomaly between 94curves do not differ significantly from each other. Only and 101 km which, because of the noor signal to noise ratio,curves for models involving a sudden change of a at a cannot be resolved with these data alone.
discontinuity produce distinct features in the Pg versus re- For plotting convenience, the seismograms in Fig. 13
flection amplitude ratio as already shown by Olsen et al. wer trac n ormalieTe toe am s of the
(1979). first cycle were multiplied by the scale factor marked above
each seismogram to obtain the true particle velocity valuesExamples of Data from the Black Forest (Germany) in llm/s. The amplitude data for the Pg phase are plotted
as crosses with corresponding shot and station numbersand the Basin and Range (U.S.A.) in Fig. 14.
Between 1974 and 1980 several quarry blasts near Sulz, The size of shot number I was only 700 kg while thesouthern Germany, were recorded along a 113 km long others were around 2,000 kg, so that the corresponding am-profile running south along the eastern margin of the Black plitude values were multiplied by a correction factor of 1 4,Forest into the Swiss Alpine foreland. The first 2 s of the equal to the cube root of the charge ratio, which seemsresulting seismic record-section are shown in Fig. 13 togeth- to be appropriate for this specific quarry. The ;emaininger with the travel-time curve corresponding to the ray-trace scatter seems to be independent of the shots, and althoughmodel in the lower part of the figure. The ray tracing was it amounts to about a factor of two, the data define anperformed using the method of Gebrande (1976). amplitude-distance behavior characterized by a rapid de-
The velocity structure of the sediments (including a crease in the first 20 km, a local maximum at about 40 kmwedge of late Paleozoic and early Mesozoic sediments with and a smooth decay out to about 100 km.P-velocity of 3.8 km, s between 0 and 40 kin) and the shape In order to be able to apply the reflectivity method toof the basement/sediments boundary were modelled to fit the data, the curved layers derived from the ray-tracingthe available bore-hole data (Buechi et al., 1965; Boigk and technique were approximated by flat layers in model
AD Al 28 305 SYNTHETIC SEISMOGRAM MODELING(U) PURDUE UNIV LAFAYETTEIN DEPT 0F GEOSCIENCES LW BRAIL 15 NOV 82TR-182ONR N000475-C0972
UNCLASSFE FIG 8/11 NL
I.D
6~ 83L '

6L
111101
rH
""'51 1.4
MICROCOPY RESOLUTION TEST CHART
NA11ONAL BUREAU OF STANDARDS 1963 A
tt

93 161
.2
Ia
1% "".......r,131Z 76k-. s .ss 1
X ".8 5.7 5.8 5.9 8.0 6.1 8.2 i.3 a
00-
0 aL m
"a
7- Z 54. - - LS 10-2
3 1 5 61 7
VF. CKNt/S3
0 t0 20 3o '0 50 60 70 80 90 100 1io 120 130
DISTANCE CKM
Fig. 14. Amplitude data of Sulz-South record section (Fig. 13) (crosses with shot and station numbers) and amplitude-distance curvesfor the four models shown in the lower uset and listed in Table 1. Top Inset shows an enkrgd view of the gradient zones of thefour models
number 7 (insets in Fig. 14 and Table 1) and the sediments in Fig. 13. Shooting up-dip over the first 50 km and down-were simplified to a single layer. The resulting synthetic dip beyond that distance will have a slight focusing effectrecord section (vertical pound velocity with a dominant on the rays, thus contributing somewhat to the observed.frequency of 8 Hz) is reproduced at the top of Fig. 13. The relative amplitude maximum at that distance. However, be-offset of the calculated amplitude-distance curve as a whole cause the lateral changes in velocity structure indicated inwas adjusted to the experimental data by a least-squares Fi& 13 are small (note that the model is plotted with 2 xmethod (Fig. 14, curve 7). For three other my-trace models vertical exageration) and because the positive velocity gra-which satisfy the travel-time data equally well, amplitude- dients in the flat-layered models which satis* the amplitudedistance curves were calculated in the same way and plotted data also fit the travel-time data modelled with a curvedin Fig. 15 together with their velocity-depth functions. This sediment-basement boundary, we anticipate that the ampli-illustrates some of the possible model variations. A compar- tude-distance effects of the two-dimensional structure willison between models 3 and 4 shows how a second gradient be negligible.zone of sufficient strength and extent can significantly in- A very different amplitude-distance character of the Pgcrease the distance at which the amplitude decay occurs. phase is observed for the Basin and Range province ofModels 6 and 7 illustrate the effect of small changes in the tectonically active western North American continent.the extent of a second zone with slight gradient. The lop- A Ps data-set from this region was analyzed for this study.rithmic standard deviations of data points from these curves The seismic records are from the northern Basin and Rangerange between 0.23 and 0.27, which correspond to ampli- (NBR) (shotpoints Mountain City, Eureka and Elko) intude factors of 1.7 and 1.9 respectively. The amplitude- Western United States and were originally studied by Hilldistance behaviour of the models presented here do not and Pakiser (1966) and presented by Prodehl (1970, 1979).differ from each other sufficiently to be able to discriminate Partial record sections emphasizing the Pg arrivals forbetween them on the basis of this data alone. However, the NBR data are shown in Fig. 15. The record sectionsas the insets in Fig. 14 show, the velocity-depth variations are from Prodeh (1979) and the travel-time curves shownof these models are very small, so that the results are good are the results of ray-trace modelling by Fauria (1981). Am-evidence for a strong gradient (0.07-0.08 km/s/kin) in the plitudes of the Pg phase were read from the sections shownupper 5-6 km of the basement. in Fig. 15 and corrected for plot scaling factors using the
It should be noted that computational techniques re- calibration signals presented on the original sectionsstrict us to consideration of flat-layered models for the am- (Prodehl, 1979). The Pg amplitudes were adjusted toplitude modelling even though small lateral variations are account for the differing shotpoints and plotted as a func-evident in the travel-time model for the Suiz data as shown tion of distance in Fig. 16. Although there is considerable
_-NE"7 ,

162 94
N MOUNTAIN CITY- EUREKA S
X (kin) [1
N EUREKA-MOUNTAIN CITY S
S.- x
1L20I X (km):
N ELKO-EUREKA S
x" k'' ir0
N ELKO-BOISE S
x
I " ft. 15. Partial record sections of the PZ phase0 for the northern a= and Rage povin"e.
Travel-time curves shown are the rmult of ray-ta modei by Fauria (1981)
scatter in these data (the range is illustrated by the shaded Coindulemarea of the plot) it appears that Pg amplitudes for the NBRdecay rapidly with distance and do not display :.e local The fine structure of the continental basement, i.e. the dis-maximum which was characteristic of the Sulz data and tribution of physical parameters with depth, can reveal sig-which indicated a velocity gradient. In fact, the NBR Pg nificant aspects of the crustal evolution and the interactionamplitude data are fitted best by the P01 model consisting of different crustal units as well as its thermal and compoi-of homogeneous upper crust. The scatter in the data shown tional history. Very often the upper part of the cvs doesin Fig. 16 and the fact that the data represent a compilation not show pronounced interfaces with discontinuities in ve-from several different refraction lines preclude more de- locity and density. Vertical incidence reflection cannottailed analysis. Note that the very smal positive or negative resolve velocity structure in the absence of distinct imped.gradients (les than that for model PG3) and virtually kay ance boundaries. On the other hand, combined travd-timeQ value could be present in the upper crust of the NBR and amplitude* analysis of refraction data can give morebased on these data alone. However, because no strong detailed insight into the velocity structure. Therefore con-gradient or low-velocity effects are observed in the ampli- bined relection and refraction surveys should be carriedtude distance data, the upper crust in the NBR appears out in crustal investigations.to be nearly a homogeneous velocity layer. A representative velocity-depth structure requires either
+ - - u " - -pm , - . . " , ' +.,++- •.

95 163
*NORTHERN BASIN AND RANGE 4. The increasing thickness of the gradient zone in the bowePg AMPLtTUDES meat reduces the amplitude decay with distance and broad-
. . ensthe width of the relative ampiud maximum.:3 MT CITY49URIIA a S. The Pg amplitudes decay with distance much fiate in
KUREKA-MYW CITY &* K~~~LKO-901 0 th rsneo o-velocity layer than would'be expectedELKO-EUREKA *from geometrical ray theoxy.
6. Relable Pg amplitude data, characterized by a continu-o ~ ~ ~ u mlcrse Or a steady value over some distance or ee
. . . . .. .... a local maximum, aflows us to distinguish between homoge-V _4neOus constant velocity layers and various gradient zones
0 in the uppe crust.7. Apparent Qvalues cannot be extracted from the mpli-~
4' tude distance behaviour ofPg data alone.
8. Synthetic seismogrami calculations based on aypoiray theory can be used only as a frslt approximation to
Ps 1, igdetermine detailed velocity depth structures.~~ ~These results, of course apply only to a crus which
j can be appoximated by lateraly homogeneous models. Fo-cusing effects due to lateral heterogeneities may completelymask the amplituide-distance behaviour due to vertical
40 Ito structures and must be studied by other methods.X (kin) Admkiw w riedge s. This work was initiated when one of us (LWB)
FIg. 16. Aplts.mo data for the PS phase for the NIR was on sabbatical leave at the lasttut of Gophysims ETH-data shown in Fg IS. Th sbk Peo rersnsth 1111 Zicb, SwitZerland. We thank Rainer Kind for providing a copyscatter of the data points, Theoretical amltude-distance curve. of his modified reflectivity progrmme._ Clas= Prodehl provided
*calculated by the rellectivity method are shown for models P~OI, original copies of some of the seisuna recor sections. Partial*P03 and PG12 (Tbl 1) support for LWB was provided by Offs of Naval Research Earth
Physics Progra con1tract N00014-73-C.O97 and N00014-82-K-033 and by the U.S. Geooical Survey Geothermal ExplorationProgram griant No. 14C3-O01-G-674. The help of Diete Eierin orgaimug the quarry Nlast at the shorpoint sulz is graefly
detile ad hghy acuatetrvelti. dta i* aP~I~ -dg . We are alsratefu to Erhard Wielandt for helfu*of observation points on the order of a few hundred! meteMl dicsin eadn h rsnlzseefc n oWle
or a combination of trawl-tim and reliable amplitude data dicsin rectiuin to theMWO paefefcti ind to g 1.*Obtained from an average tecord spacing of a few kilome- Agstin Udias Walter Mooney, Robert &. Smith and iosep Gailart*ten. The following conclusions draw from this study can critically read the manuscpt.*help to achieve a better interprettioni of the amplitude data
and hence lead to a more reliable estimate of velocity-depthstructure of the upper continental crust. Rew
I -Thefreuaiey ontntof the source is a critical prm. Banda. E.: Perfiles Sismicos Profido en Corta Continental.1. Thefrequncy cntentEstructur 4e la Cotn y Manso Superior en ian Cordileras
ter when gradient nonest and/or discontinuities of velocity 3jica. Ph D.Thesis, Unive-rsiy of Deredona 1979are present. Higher frequencies produce more pronounced Banda, E.. Ansorge 3.: Crustal sMOitur under the central and
*variations of amplitudes with distance. The amplitude vani- ea1113rn part Of the Betic COrdiflera Oe*oys. 3. Rt. Astron.ations am likely to be resolvable within the scatter of the Soc. A3 535-532, 1980data and thus high frequency source signals lead to better Bith, M.: Spectral Anaysis in Geophysic. Amsterdam: Elsevieresolution. 1974
of th basment ecnuatesrelaive oigk H., Schoeech, H.: Die Tiefeulage der permbais im noerd-2. A low-velocity cover lftebsmn ceautsrltv ichen Tail des o bheingrabens. In: Grabent Problems, 1. H.maxima in the amplitude-distance curve when velocity gra- Ifhss and SL. Mueller, eds: pp 45-55. Stuttgar: Scbweazr-
*dients ame present in the crystalline upper crust. Layer thick- bart'sclie Vsrabuhhndun 1968*nesse of only 0.2 kin, i.e. even weathered layers, can cause Dorm, M.: Optik. 8ein Springler 1933
this effect. In addition, multiple rellections, refractions and Dnaile, LW.. Smith. R.l.: Guide to the interpretation of crustalconersonsin the low-velocity cove contribute consders- rfraction proffuft. Geoplys. J. It. Astron. Soc. U9. 14S5-176.
bly to a compliated wave field following the initial Pg 1rnLW: nepeaio f7Stl eoiygadet narrival and probably make later arrivals from deeper parts strutur us.:ingrpapitude-crrected eoimogramis. n Thof the crust undetectable. earths crust. Am. Geopliys. Union Monogr. 3.,427-439. 19773. Reletions from the top of a low-velocity layer within leslie. L.W., Smith, R. Ansorge. 3. laker. M.R.. Sparlin. MA..the upper crust will affect the PS amplitudes by inteirferece Prodahl C.. Schilly. M.M.. Healy, iii.. Mueller, St.. Ohee.
Onl ifthe Am0110111111181. hisreqire lo pulens CH.: The YdowskoneSmake Rime plain seimi profinx.auj i thy n Srog eouh. hureqirs lw radests Panimen0t: Crusal MUtr of the Eastern Snake River Plain.
in the basement abOve, a first: order discontinuity at the J. Oseophys. ResA 572597-2610, 1932,bottom of the upper crust and a high frequency source iehi. U~P.. Lemke. K., Wiener, 0.. Zioudaus, J.: Geologiace
Br~blsssi dsr Erdo'Iszploratioa aof das Mesoaciktum iou Us.-

166 96wandum des sewlael1hm Molassebeckens .110l. Ver. Kind, Rt.: Thbe reflectivity ethod for a buied swim J. owphys.
3, 1 1 Paerol. Gol. Ing;. 32.84 7-38,1965 .44,603-612,197MCMagnmsa, CJI: A am aWo for comeputialg synthetic smeno Loctcke. L., Buachi U.P, Wiener, 0.: Einige Ergibaisse der Erd-
rm Oeophys. J. IL. Astron. Soc. A 481-51k 1978 oexploration auf dis mittellendisehe Mole der Zentrabsab-Cemn*,. V.: Cie dynamic properies of reflected and head waves weiL. Bull. Va. Schweiz Patrol Gvol. Ing. 35,87, 1 -34,196s
is wleydee eaWs crnst. Geophys. J. Rt. Astron. Soc. It, Mffller, 0., Fuchs. K.: Invarsion of seismic records wit the aid139147, 1966 of synthetic saismoras. In: Explosion seismolog in Central
Ceirvent, V.: Accuracy of ray theoretical saisaoggram J. Giophys. Europs P. Giee, C Prodehi and A. Stein, eds.: pp. 178-1l8.41L 135-149,1979 Heidelberg: Springer 1976
Cavam*. V., Molotkov. IA. Pleaulk I.: Ray methodi in ums.- Muste, a.. Mueller, S.: Travel-time and aupltar interpretationloM. Prague: Charles University Press 1977 of crustal phases on the refraction profile Ddla-W, Utah. Bull.
Faunia, TJ.:.Cueal structure of the Northern Rain and Rang Seismol. Soc. AuL 0, 1121-1132,1979and Snake River Plain: A ray-tram travel-tiug interpretation Olsen, L.H., Keller, G.X. Stewart, j.N.: CrusWa structure alongof the Eurea, Nevada, to Bois, Idaho, seismic refracton the Rio Grande Rift from seismic refraction profiles. In: Rioprollle. M. Thesis, Purdue University 1981 Grande Rift: Tectonics and mapsadu., Li Raecker, id..
Fuchs. K.: Tha refecion of epherical waves fromn transition zones pp. 127-143. Washington: Am. Geophys. Union 1979with arbitrary depth-dependent esti wtoduli and density. J. Prodehi. C.: Seismic rfracton study of crutal structure in thePhys. Eart 16 (Spec ssue), 27-41,1968 Western United States. Geol. Soc. Am. Dull. 31, 2629-2646,
Fucbs, L, M4ller, G.: Computation of synthetic seimgrpam with 1970thes reflectivity metod and -compa- on wit obwvatious. Prodabi, C.: Crustal structure of the Wotern United States. U.S.Geopbys. J. Rt. MAtro. Soc. 2U417-433,1971 Goal. Surv. Profussioal Paper 34K 18-23, 1979
Coebrande, H.: A siic-ray tracing method for two-dimsensional Smnith, ft.B., Braile, LW., Keller, G.R.: Upper crustal low-velocityR o ogio media, in: Explosion seiswology in motral layer: a possible effect of high temperatures over a muantic
urpeN. P. Gifee C. Prodel and A. Stein, ads.. pp. 162-167. upward at the Basin and Range-Colorado Plateau transtion.Heidelberg: Spinle 1976 Earth Planet. Sci. Lett 211, 197-204,975
Hoaly, J.H.: Crustal stricture along the comat of California from Spudich, P., Orcutt, J.: A new look at the seimic velocitystuurseismic-refraction measurements. J. Geophys. Res. OW Of the Oceanic Crust. Rev. Geophys Spame Pays. 113. 3,5777-573, 1963 627--645, 1980
Hill. D.P.: Velocity gradients and aneasticity from crustal body Wiggins, RL: body wave amplitude calculation-li. Ceophys. 3.wave amplitudes. eop*ys.Ru.,309-3325,1971 Rt. Astron. Soc. 4C 1-10, 1976
Hill, DYP. Paktiser, LC.: Crustal stuceture: betwe the Nevadalta it and 1.1..e, Idaho, from sesunwc-rhaction measure-mwafts In: 7he Earth beeath the continents, Am. Geophys. Received May 6.1982; Revised version July 9, 1962Union Monegr. 10, 391-419,1966 - Accepte July 12,1982
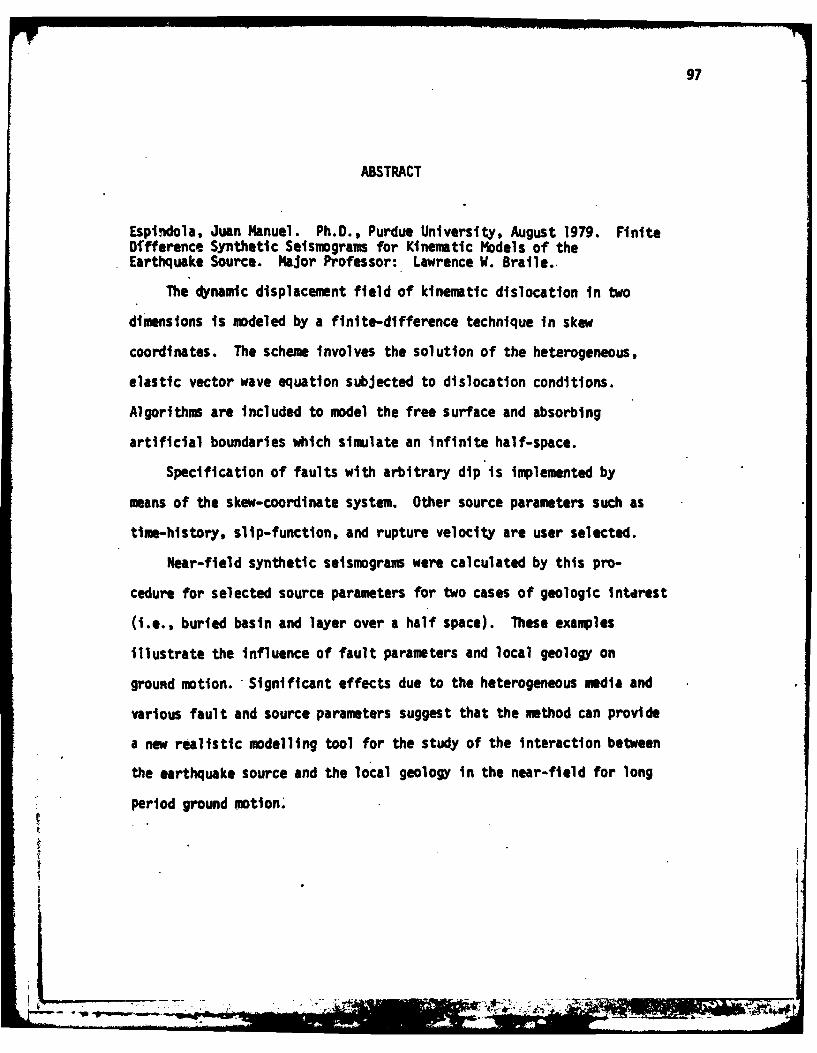
97
ABSTRACT
Espindola, Juan Manuel. Ph.D., Purdue University, August 1979. FiniteDi~fference Synthetic Seismograms for Kinematic Models of theEarthquake Source. Major Professor: Lawrence W1. Braile..
The dynamic displacement field of kinematic dislocation in two
dimensions is modeled by a finite-difference technique in skew
coordinates. The scheme involves the solution of the heterogeneous,
elastic vector wave equation subjected to dislocation conditions.
Algorithm~ are included to model the free surface and absorbing
artificial boundaries which simulate an infinite half-space.
Specification of faults with arbitrary dip is implemented by
means of the skew-coordinate system. Other source parameters such as
time-history, slip-function, and rupture velocity are user selected.
Near-field synthetic seismograms were calculated by this pro-
cedure for selected source parameters for two cases of geologic interest
(i.e., buried basin and layer over a hal f space). These examples
illustrate the influence of fault parameters and local geology on
ground motion. 'Significant effects due to the heterogeneous media and
various fault and source parameters suggest that the method can provide
a new realistic modelling tool for the study of the interaction between
the earthquake source and the local geology in the near-field for long
period ground motion.

ABSTRACT
Mazella. Frederick Elwood. Ph.D..Purdue University. August1979. The Generation of Synthetio Seismograms for LaterallyHeterogeneous Models Using the Finite Difference Technique.Major Professor: Lawrence W. Braile.
A method for the generation of synthetic seismograms for
two-dimensional heterogeneous models specified only by P-
wave (dilatation) velocity has been developed. The finite
difference approximation technique is 4pplied-to the two-
dimensional vector wave equation for an elastic and
isotropic model. The finite difference calculations are
applied to a designated portion of the model at any
particular time step during the lifetime of the
approximation. This portion of the model is referred to as
the window and is prescribed to include the waves of
interest which propagate through the model. A suite of
models are evaluated with various windiw parameters which
provides insight Into the limitations and capabilities of
the method. The computational efficiency of the windowing
technique allows evaluation of mode*!s which are
•approximately twice as large as those which can be evaluated
by other numerical approximation techniques not employing a
.. i4

windowing scheme for the same computing resources (time and
memory).
Two types of boundary conditions are employed on the
walls of the window. The upper horizontal surface is
treated with a second order heter*geneous free surface
'boundary condition developed during this study. All other
surfaces of the window are treated with a nonref looting
boundary condition to minimize false reflections and mode
conversions. Seismograms, can be obhained for any location
inside or on the boundaries of the model.
Synthetic seismograms are calculated for seven
heterogeneous (both vertical and horizontal) geologically
realistic models. Each model is d.eacribed graphically and
is accompanied by a displacement seismoaram record section
for the vertical and horizontal components. These record
sections reveal significant amplituie and time effects which
result from the velocity structure.

ATE
Llfl E Di