system analysis study of routes 101, 152, & 156: executive summary · 2008-06-24 · system...
TRANSCRIPT
System Analysis Study June 2008
i
System Analysis Study of Routes 101, 152, & 156: Executive Summary
This study investigated improvement scenarios designed to move future east-west traffic more efficiently in the northern San Benito County – southern Santa Clara County area. Travel patterns, traffic flows and congestion, benefits and costs, and environmental considerations were studied on Caltrans Focus Routes US 101 and State Routes (SR) 152 and 156 as well as on SR 25. The results of these investigations (see Figure 3) are presented in this report to aid decision-makers in developing an improvement strategy. State Highways Studied. State Routes 152 and 156 and US Highway 101 are Caltrans Focus Routes providing major east-west and north-south service for interregional travel in California south of the San Francisco Bay Area. Located in northern San Benito and southern Santa Clara Counties, State Routes 152 and 156 connect the Central Valley, I-5, and SR 99 in the east with US Highway 101 (US 101) in the west. From there, US 101 provides the major north-south service to California coastal areas. As Focus Routes, these highways are especially important for goods movement and have interregional and statewide significance. US 101, SRs 152 and 156, and the other state route in the study area, SR 25, are currently congested, hindering the efficient movement of people and goods. Continued growth in interregional traffic as well as growth in regional and local population and jobs will result in increased travel demand and increasing congestion on the Focus Routes and SR 25. To address this congestion, the System Analysis Study of Routes 101, 52, and 156 (SAS) investigated potential investments in the roadway system. Study Area. As shown in Figure 1, the study area included US 101 between SR 156 in San Benito County and Cochrane Road in Santa Clara County. It also included SR 25 between US 101 and San Felipe/Bolsa “Y” in Hollister, SR 152 between US 101 and SR 156, and SR 156 in San Benito and Santa Clara Counties. Improvement Scenarios. To address anticipated heavy congestion in the area, the SAS developed and analyzed five improvement scenarios comprehensively (Scenarios 1, 2, 4, 5, and 6). Three additional scenarios (Scenarios 4A, 6A, and 7) were also examined but only for changes in traffic patterns. These scenarios correspond for the most part to alternatives proposed in Santa Clara Valley Transportation Authority (VTA)’s Southern Gateway Transportation and Land Use Study, Final Report from August 2006.
An overview of the five improvement scenarios is shown in Figure 3. Briefly, Scenarios 1, 2, and 5 proposed improvements along existing alignments while Scenarios 4 and 6 proposed new alignments as well as improvements on existing alignments. Scenario descriptions are provided below.

System Analysis Study June 2008
ii
Figure 1. Overview of Study Area
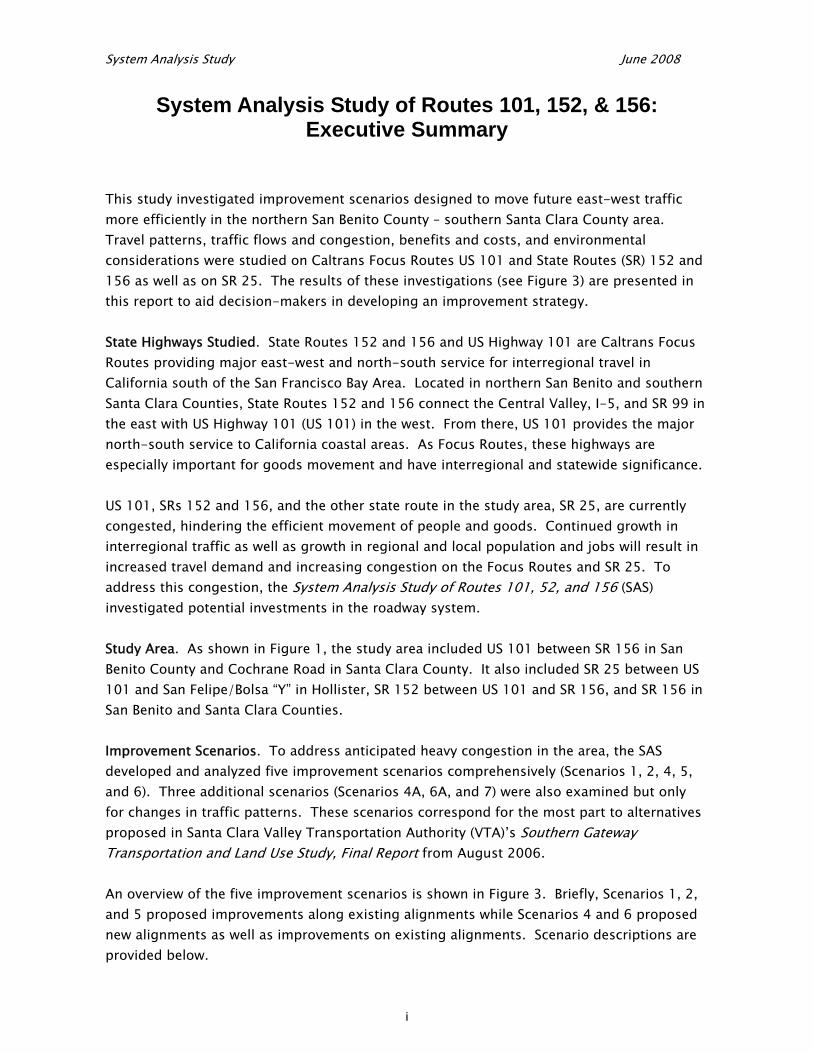
Traffic Analysis. Four main travel patterns are expected to characterize future traffic flows in the study area. Flows were examined in the 2030 PM peak hour, which is expected to be the heaviest travel hour in the area in the future. Figure 2 provides examples of these flows at selected locations. In Figure 2, a star shows the selected location while the thickness of the highlighted line indicates the volume of traffic passing through that location as well as the
System Analysis Study June 2008
iii
directions to and from which the traffic travels. Appendix E provides results for all locations and all directions. Travel between the Gilroy-San Jose-San Francisco Bay Area and the Central Valley was almost exclusively along SR 152 in all scenarios. Figure 2a demonstrates this pattern and shows eastbound traffic on SR 152 east of SR 156 in the 2030 PM peak hour; westbound traffic shows a similar pattern. Travel between Monterey-Santa Cruz Counties and the Central Valley mainly chose southerly paths including SR 156 or the new alignments. The absence of color and thickness on US 101 in Figure 2a indicates that travelers coming from Monterey-Santa Cruz Counties and heading to the Central Valley did not choose to travel north on US 101 and then east on SR 152. This result is typical for all scenarios.
Figure 2. Examples of 2030 PM Peak Hour Travel Patterns in the Study Area
2a. Eastbound Central Valley Traffic
System Analysis Study June 2008
iv
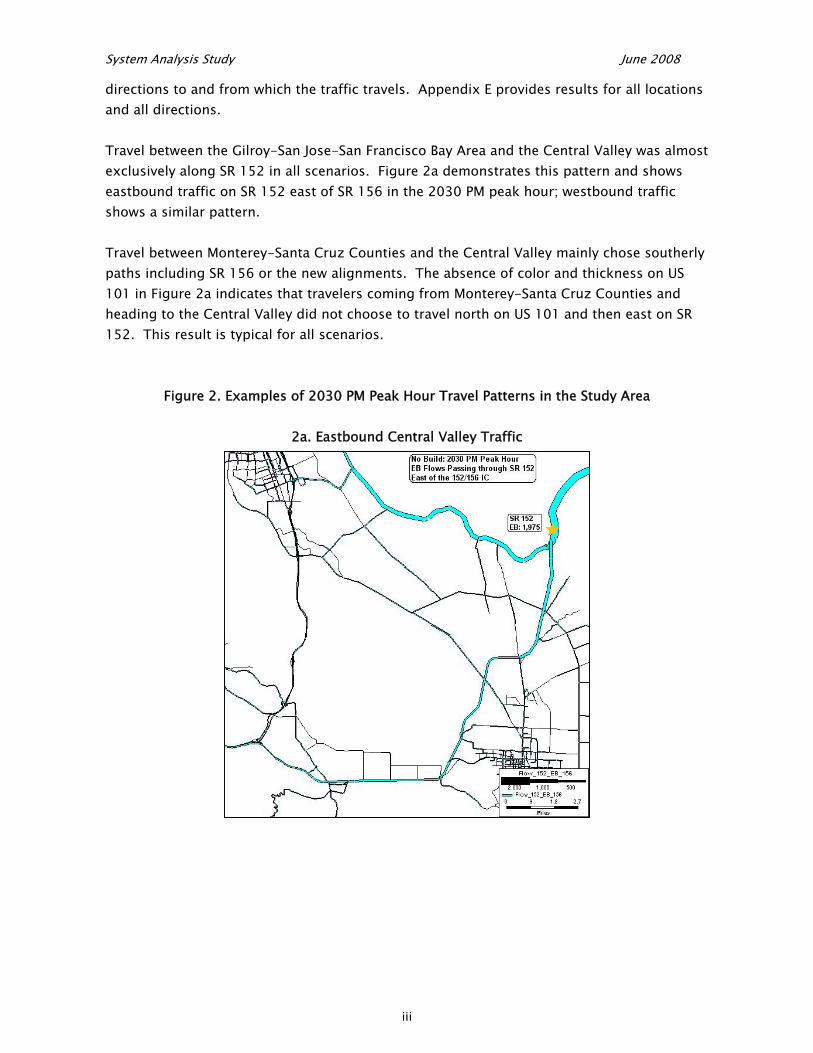
2b. Southbound Gilroy/Bay Area Traffic
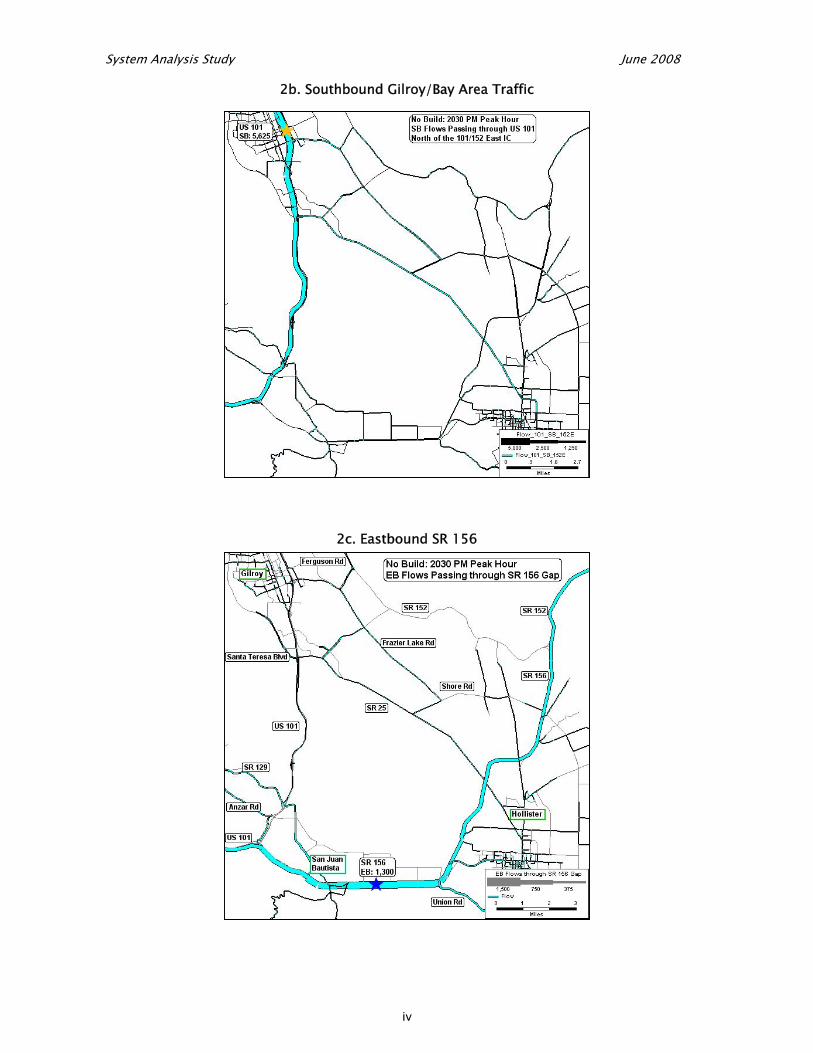
2c. Eastbound SR 156
System Analysis Study June 2008
v
Travelers going between the Gilroy-San Jose-San Francisco Bay Area and greater Hollister used mainly SR 25 and the local Frazier Lake Road (between SRs 25 and 152) in the No Build 2030 PM peak hour. This Hollister-Bay Area traffic did not travel on SR 156 and on an increasingly congested US 101 as evidenced by the lack of color and thickness on US 101 in Figure 2b. The final traffic pattern includes trips between greater Hollister and locations to the south and west. These trips chose SR 156 as part of their route choice (not shown). Given these travel patterns, we note that SR 156 between San Juan Bautista and greater Hollister would carry a mix of traffic (Figure 2c). In the No Build case in the 2030 PM peak hour, approximately 40% of eastbound traffic continued on to SR 152 towards the Central Valley. In the westbound direction, approximately 30% came from the Central Valley. Most of the remaining traffic passing through the selected location on SR 156 was heading to or from greater Hollister. The implications of these travel patterns for the proposed improvement scenarios are shown in Figure 3. In the 2030 PM peak hour, north-south flows along US 101 between Gilroy and Morgan Hill experienced high congestion in all scenarios even with US 101 as an eight-lane facility. Between SR 156 and Gilroy, US 101 showed moderate congestion as a six-lane facility (shown in Figure 3), though congestion bordered on heavy levels. Since much of the east-west traffic in the region is also expected to use US 101, these results are not surprising. For east-west flows on SRs 152, 156, and 25, Figure 3 shows that congestion in the 2030 PM peak hour was alleviated on more state highways in Scenarios 1 and 2 than in Scenarios 4, 5, and 6. Scenarios 4, 5, and 6 were expected to relieve congestion by diverting traffic off of state highways that were not improved. However, with the strong travel patterns identified above, little diversion occurred, leaving unimproved sections of highways highly congested. In Scenario 4, unimproved sections of SRs 25 and 152 continued to show congestion. For traffic traveling on SR 25 between the Gilroy/Bay Area and Hollister, some drivers shifted to the new alignment. However, this shift allowed traffic to divert off of the local Frazier Lake Road onto SR 25, leaving Frazier Lake Road with low congestion but leaving the unimproved section of SR 25 highly congested. In the case of SR 152, since most of the traffic using this route traveled between the Gilroy/Bay Area and the Central Valley, SR 152 traffic did not travel out-of-direction to use the new alignment but instead continued to use SR 152, leaving the route with high levels of congestion. However, SR 156 between San Juan Bautista and Hollister did show improvement in congestion levels. Some interregional traffic moving between Monterey and Santa Cruz Counties and the Central Valley shifted off of SR 156 and onto the new alignment. This left SR 156 with the low levels of congestion shown in Figure 3, although congestion in the peak direction bordered on medium levels.

System Analysis Study June 2008
vi
In Scenarios 5 and 6, the unimproved sections of SRs 152 and 156 remained congested. As with Scenario 4, SR 152 did not carry the kind of northeast-southwest interregional traffic that could have diverted off of SR 152 and onto the new alignments. Rather, traffic on SR 152 traveled mainly between the Central Valley and the Gilroy/Bay Area and did not experience enough travel time savings to use the new alignments. SR 152 therefore remained congested. For SR 156, some interregional traffic between the Central Valley and Monterey-Santa Cruz Counties using mainly SR 129 shifted off of SR 156 and instead used US 101 and the new alignments. However, with the increasing congestion on US 101, not enough travelers changed paths to bring SR 156 to low congestion levels. The results above showed that without improvement, SR 152 remained congested in the different scenarios. Currently, VTA is studying improvements to the SR 152 corridor including realignments. While the SAS supports improvements to the SR 152 corridor, the SAS did not examine possible corridor locations and configurations being considered by VTA and its partners. VTA’s analysis will provide more information on which SR 152 configurations provide the most benefits to travelers. Benefit-Cost Analysis. Looking at the number of state highways with reduced congestion is not sufficient for determining which scenario might provide the most benefits for the scenario cost. Benefits to travelers in the study area depend on factors such as the number of trips on each roadway, travel times and distances of these trips, vehicle operating costs, and possible safety improvements. Therefore, the SAS included a benefit-cost analysis of the five proposed improvement scenarios to systematically and comprehensively capture the net benefits of each scenario. Cost estimates for each scenario are shown in Figure 3. Costs included capital, support, and right of way costs as well as a contingency for environmental mitigation costs. Annual operating and maintenance costs for each scenario were also estimated. For each scenario, mobility benefits, vehicle operating savings, and safety benefits1 accruing to travelers in the study area were identified for the study period. The benefit-cost analysis assumed full funding would be available and also, that any scenario would be open for travel by 2013. The analysis period extended through 2035. Benefits and costs were identified for each year in the analysis period and then discounted, and the standard benefit-cost measures were estimated.2 Results are presented in Figure 3.
1 Possible safety benefits are based on 2004 California accident rate groups, which are averages. Therefore, the safety benefits reported in the SAS should be regarded as planning level estimates and not be used for actual accident analyses of the study area. 2 NET_BC software developed by Bernardin, Lochmueller & Associates was used to develop benefit-cost measures and supporting information.

System Analysis Study June 2008
vii
The analysis showed that the benefit-cost ratio for each scenario is greater than one, indicating that each scenario is economically justified. Scenarios 1 and 2 had the highest net present values, followed by Scenarios 4, 6, and 5 in that order.3 Environmental Considerations. The environmental analysis for the System Analysis Study was prepared from a regional planning level rather than a single corridor or project-by-project level aspect. The conclusions provided are approximate and are based on cursory analysis of probable effects. All of the scenarios evaluated would likely result in some level of adverse environmental impacts, primarily involving scenic, farmland, biological, and cultural resources. Factors taken into consideration when evaluating the potential effects of new transportation facilities on environmental resources included:
Changes in scenic character Sensitive plant and animal species and sensitive habitat present Removal of vegetation Loss of or segmenting of open space Impacts to water bodies and riparian corridors Conversion to non-agricultural uses, segmentation of active parcels, disruption of
agricultural activities Presence of recorded prehistoric and historic resources
The scenarios that would involve widening of existing roadways only (Scenarios 1 and 2) could have potentially higher levels of impact to biological and cultural resources. Scenarios 4, 5 and 6 would likely have higher levels of impact to scenic resources and farmlands because they all include construction of new alignments and/or new frontage roads in addition to widening of existing highways.
With the early identification of environmental resources that may be impacted within the study area, this analysis will hopefully provide some framework for developing advanced mitigation strategies on a regional level. Findings. In 2030, congestion on state highways in northern San Benito County and southern Santa Clara County is expected to be widespread in the PM peak hour. The System Analysis Study of Routes 101, 152, and 156 (SAS) evaluated five scenarios thought to improve the future east-west traffic flow through the area. The study concludes that all five scenarios provide at least some improvement to east-west flows in the sense that congestion is alleviated to various degrees compared to the No Build Scenario, i.e., the “do nothing” case.
3 The results assume that the difference in a given scenario’s costs and the most expensive scenario’s costs earns the normal rate of return. Given this assumption, a higher net present value represents a greater return on the investment.

System Analysis Study June 2008
viii
Since congestion and scenario cost alone are not adequate to determine which scenario is the best use of investment funds, should full funding be available, the SAS included a benefit-cost analysis. If all scenarios could be constructed by the year 2013, then all five scenarios are economically justified as evidenced by benefit-cost ratios greater than one. Scenarios 1 and 2 have the highest net present values,4 followed by Scenario 4, Scenario 6, and Scenario 5. With additional time and resources, further study could include a benefit-cost sensitivity analysis. This type of analysis determines how assumptions about model inputs affect the traffic analysis and benefit-cost results. In addition, given that full funding will not be available to construct a complete scenario by 2013, phasing and associated benefits and costs could be examined to develop an optimal phasing strategy. Continued congestion on US 101 suggests that additional study to improve flows along that corridor is warranted. Finally, VTA is currently studying SR 152 improvements, which should provide more accurate cost estimates and evaluation of Scenario 6. Results. Results of the traffic and benefit-cost analyses are shown in Figure 3. Descriptions of each scenario follow. Figure 3 Scenario Descriptions. In all improvement scenarios, US 101 was widened to six lanes between SR 156 near San Juan Bautista and SR 25. In addition, all scenarios included adding a high occupancy vehicle lane in each direction on US 101 between SR 25 and Cochrane Road in Morgan Hill, bringing the facility to eight lanes. In Scenario 1, SR 152 was widened to four lanes. SR 156 was widened to four lanes between San Juan Bautista and 4th Street near Hollister, while SR 25 was widened to four and six lanes. Scenario 2 resembles Scenario 1. However, in Scenario 2, SR 152 was not widened, and SR 156 was widened to four lanes in its entirety. In Scenarios 4, 5, and 6, new east-west alignments were proposed. In Scenario 4, a new four-lane freeway south of SR 25 was proposed between US 101 and SR 156. SR 156 was widened to four lanes between the new route and SR 152 while SR 25 was widened to four lanes between the new route and Hollister. In Scenario 5, a new east-west route was proposed along the existing Shore-Fairview Road. SR 156 was widened to four lanes between the new route and SR 152, while SR 25 was
4 Net present value comparisons assume investments are of equal scale. Therefore, the SAS assumes that the difference in cost between the most expensive scenario and a given scenario earns the normal rate of return.
System Analysis Study June 2008
ix
widened to six lanes between the new route and US 101 and to four lanes between the new route and Hollister. In Scenario 6, a new east-west route was proposed north of Shore-Fairview Road. SR 156 was widened to four lanes between the new route and SR 152. SR 25 was widened to six lanes between the new route and US 101 and to four lanes between the new route and Hollister. In Figure 3, low congestion is shown in green, medium congestion is shown in gold, and high congestion is shown in red.5
5 The SAS analyzed the proposed improvement scenarios using a new version of the regional travel demand model from the Association of Monterey Bay Area Governments (AMBAG). AMBAG makes no warranty, express or implied, on the results or opinions derived from these data for any project study not conducted by AMBAG.
System Analysis Study June 2008
x
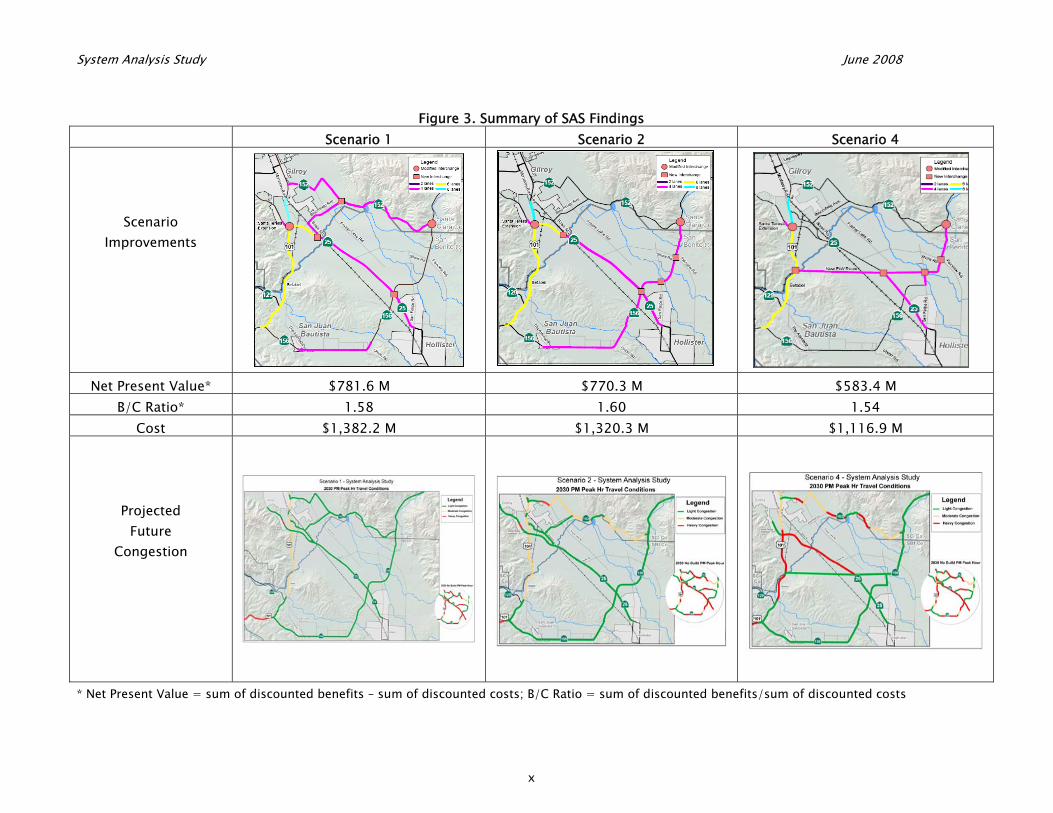
Figure 3. Summary of SAS Findings Scenario 1 Scenario 2 Scenario 4
Scenario Improvements
Net Present Value* $781.6 M $770.3 M $583.4 M
B/C Ratio* 1.58 1.60 1.54 Cost $1,382.2 M $1,320.3 M $1,116.9 M
Projected Future
Congestion
* Net Present Value = sum of discounted benefits – sum of discounted costs; B/C Ratio = sum of discounted benefits/sum of discounted costs
System Analysis Study June 2008
xi
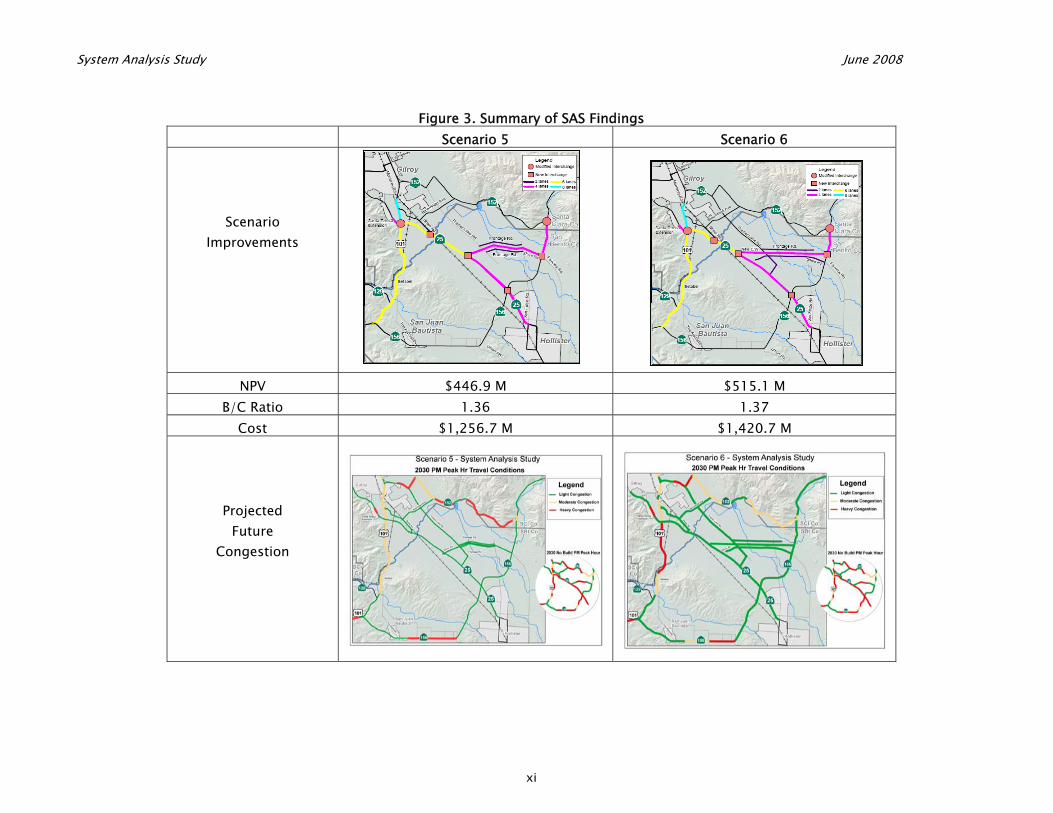
Figure 3. Summary of SAS Findings Scenario 5 Scenario 6
Scenario Improvements
NPV $446.9 M $515.1 M B/C Ratio 1.36 1.37
Cost $1,256.7 M $1,420.7 M
Projected Future
Congestion