system analyzer 1.0 getting started guide - texas...
TRANSCRIPT

System Analyzer 1.0 Getting Started Guide
July 13, 2011

2
Contents
System Analyzer 1.0 Getting Started Guide .......................................................................................... 1 About System Analyzer ............................................................................................................................ 3 Installing System Analyzer ...................................................................................................................... 5 Exploring System Analyzer With Captured Data .................................................................................. 6
3.1 Exploring the CPU Load............................................................................................................. 8 3.2 Exploring the Execution Graph .................................................................................................. 9 3.3 Exploring the Context Aware Profile ........................................................................................ 10 3.4 Exploring Duration Analysis ..................................................................................................... 10
Creating Sample Projects ...................................................................................................................... 11 4.1 Notes for EVM6472 MessageQ Project Template ................................................................... 12 4.2 Notes for EVMTI816x SimpleTask Project Templates ............................................................. 13 4.3 Notes for Single-Core Stairstep Project Templates .................................................................. 14 4.4 Notes for System Analyzer Tutorial Project Templates ............................................................ 14 4.5 For More Information ............................................................................................................... 15
Capturing Live Data in a Sample Project ............................................................................................. 16 5.1 Creating the Project ................................................................................................................. 17 5.2 Modifying the C Source Code .................................................................................................. 18 5.3 Modifying the Configuration File ............................................................................................... 20 5.4 Building the Project .................................................................................................................. 22 5.5 Debugging the Project ............................................................................................................. 23 5.6 Capturing System Analyzer Data with the Project .................................................................... 25 5.7 Analyzing System Analyzer Data ............................................................................................. 27

3
Chapter 1
About System Analyzer
The System Analyzer tool suite provides real-time visibility into the performance and behavior of your code running on TI's embedded single-core and multi-core devices. It allows you to analyze information that is collected from software and hardware instrumentation in a number of different ways. It includes both host-side tooling and target-side code modules (the UIA software package).

4
Within Code Composer Studio, System Analyzer provides:
• Visual tools for application analysis, including:
o Benchmarking how long an action takes to complete, including context-awareness for multi-threaded analysis.
o Load monitoring for the CPU load of the entire application and individual threads.
o Execution sequence analysis for monitoring task switches and the state of kernel objects such as semaphores.
o Data analysis for monitoring the number and types of changes over time for a data value.
• Multi-core event correlation for software and hardware events
• Real-time event monitoring and analysis
• Recording and playback of events. You can further analyze events by searching, filtering, and sorting them in various ways.
On the target(s), the Unified Instrumentation Architecture (UIA) software package provides:
• Event loggers and a service framework for capturing events and transporting them to the host.
• Transports using both JTAG and non-JTAG (for example, Ethernet and file).
• Software events and metadata are predefined for many common uses
• SYS/BIOS events are pre-instrumented and easy to enable
• Software instrumentation APIs to control loggers, events, and more
See http://processors.wiki.ti.com/index.php/Multicore_System_Analyzer for more information about what System Analyzer can do.

5
Chapter 2
Installing System Analyzer
System Analyzer and the components it requires are automatically installed as part of the Code Composer Studio v5.1 installation. To download CCSv5, see http://processors.wiki.ti.com/index.php/Category:Code_Composer_Studio_v5.
If you are using CCS v5.0 and don’t want to install CCS v5.1, you can install a slightly older version of System Analyzer, by following these steps:
1) Choose Help > Install New Software from the CCS menus.
2) Click Add to the right of the Work with field.
3) In the Add Repository dialog, type “System Analyzer” as the Name. Type http://software-dl.ti.com/dsps/dsps_public_sw/sdo_ccstudio/MCSAv1 in the Location field. Then click OK.
4) Check the box next to DVT, and click Next. (System Analyzer is installed as part of the Data Visualization Technology component of CCS.)
5) Continue clicking Next as needed and accept the license agreement as prompted.
6) Click Finish to install or update the DVT software component. When the installation is finished, restart CCS.
6
Chapter 3
Exploring System Analyzer With Captured Data
You can experiment with the host-side System Analyzer features using a CSV (comma-separated values) data file that is provided with the DVT installation. This file is a recording of instrumentation data collected in a run-time session using a 6-core EVM6472 application.
Using this recorded data is a quick and easy way to try out the analysis features provided by System Analyzer. You don’t need to have a hardware target, a CCS project, a target configuration, or a debugging session.
To load the provided CSV file, follow these steps:
1) Start Code Composer Studio 5.1.
2) Choose the Tools > System Analyzer > Open CSV File menu command.
3) In the CSV File Parameters dialog, click the “…” button to the right of the File Name field.
4) Browse to the <ccs_install>\ccsv5\ccs_base\dvt_3.1.x.xx\ AnalysisLibrary\DataProviders\CsvViewer folder, where x.xx is the latest version of DVT you have installed.
5) Select the saSampleData.csv file and click Open.

7
6) In the Analysis Feature column, choose features you want to use. These features will process events that apply to them when you open the CSV file. (You can run additional analysis features after you open the file.)
7) In the Which Cores column, choose whether to display events from ALL cores or a single core. For this example, use ALL cores. For the Task Load feature, a specific core name is required (not ALL), and you can select or type the name. For this example, type “C64XP_1”.
8) In the Which Views to Open column, choose the view types you want to open automatically. You can later open more views, but these checkboxes provide an easy way to open a number of them. For this example, check the following boxes:
9) Click Run. You will see the Log View and the views you selected.
10) Explore the views that you opened as described in the following sections. You can press F1 to get help on using a particular view.
When you are using your own SYS/BIOS application with System Analyzer, you can use the CPU Load, Task Load, and Execution Graph features without having to add any C code to your target application.
The Context Aware Profile, Duration, and Count Analysis features require that you add API calls to log some additional events for benchmarking or data value changes. Benchmarking events were added to the application used to record the sample CSV file.

8
3.1 Exploring the CPU Load
Move to the CPU Load graph view. This view shows the change in CPU load (as a percentage) with time for each CPU.
Try the following:
• Click on the name of a CPU above the graph to highlight the corresponding line in the graph. (If you do not see these buttons, right click on the graph and choose Legend.)
• Zoom in with the toolbar icon. Zoom in further by holding down the Alt key and using the mouse to outline the part of the graph you want to expand.
• Move the vertical scrollbar to the left or right to see events from different time ranges.
• Open the summary view for the CPU load by right-clicking on the graph and choosing CPU Load views > Summary. Most of the System Analyzer features provide a graph, summary, and detail view. The summary and detail views present data in a table.
• Press F1 to get help on using this view.
The Task Load views are similar to the CPU load views, except that they show the load due to individual threads on a single core. To open a Task Load view for a different core, choose Tools > System Analyzer > System Analyzer File - saSampleData.csv > Task Load from the CCS menu bar. Type C64XP_1 as the core name, for example, and click Finish.

9
3.2 Exploring the Execution Graph
Move to the Execution Graph view. This view shows which thread is running at a given time. Sources (cores and threads) are listed in the left column. Click on a source to open an indented list of contexts for that source.
Try the following:
• Zoom in and out with the toolbar icons. You will probably need to zoom in several times to see execution state transitions.
• Click on a source named with the format <core name>.OS to open the list of threads on that core. A colored line for each item shows when that context is in control.
• Click the Tree Mode icon to switch to a hierarchical mode where you can expand and collapse context nodes.
• Press F1 to get help on using this view.
• Click the icon in both both the CPU Load graph and the Execution Graph. Arrange your CCS window to show both views at the same time. Scroll one of the graphs horizontally. Notice that both graphs scroll together. This is called grouping. The graphs scroll at different speeds if they are displayed at different zoom levels. A single group is created for all the views of the same System Analyzer data when you enable grouping. You can group both graphs and detail views to scroll together; the times at which events occur are correlated between the views.
Source rows with the format <core name>.<thread name> show context switches in green and running threads in blue. You can click these rows to open them further to show their state. State transitions are indicated by a vertical black line across the colored bar.
10
3.3 Exploring the Context Aware Profile
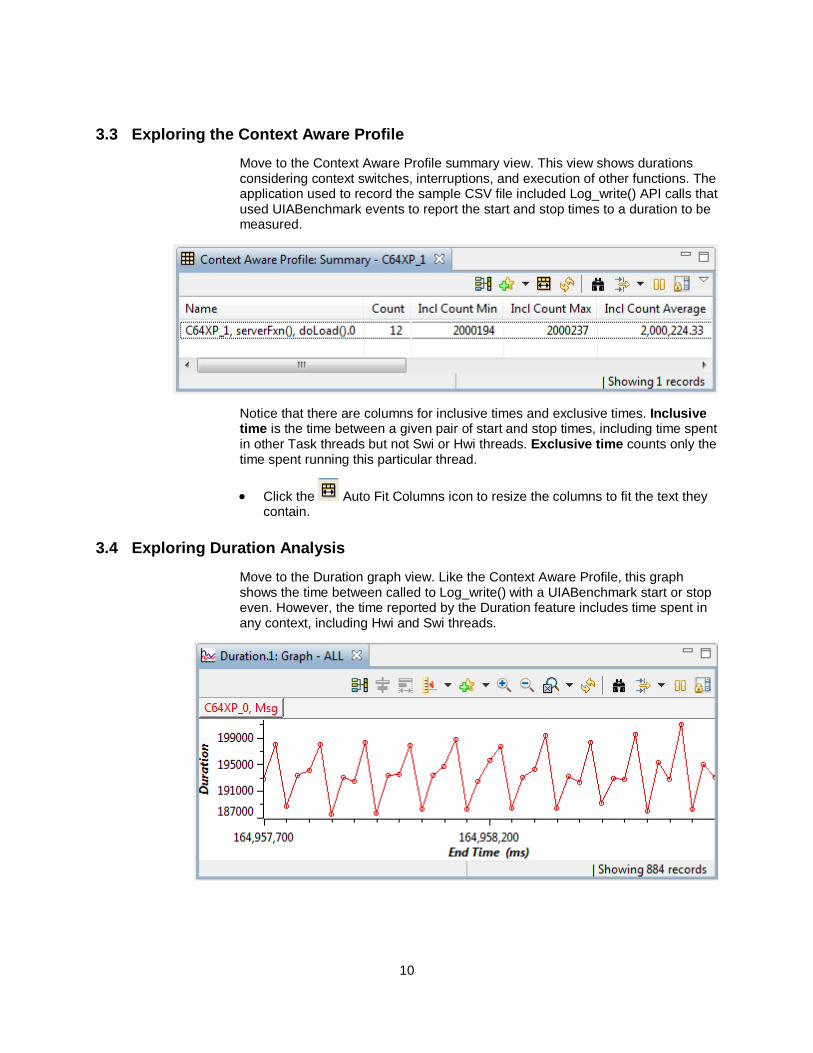
Move to the Context Aware Profile summary view. This view shows durations considering context switches, interruptions, and execution of other functions. The application used to record the sample CSV file included Log_write() API calls that used UIABenchmark events to report the start and stop times to a duration to be measured.
Notice that there are columns for inclusive times and exclusive times. Inclusive time is the time between a given pair of start and stop times, including time spent in other Task threads but not Swi or Hwi threads. Exclusive time counts only the time spent running this particular thread.
• Click the Auto Fit Columns icon to resize the columns to fit the text they contain.
3.4 Exploring Duration Analysis
Move to the Duration graph view. Like the Context Aware Profile, this graph shows the time between called to Log_write() with a UIABenchmark start or stop even. However, the time reported by the Duration feature includes time spent in any context, including Hwi and Swi threads.

11
Chapter 4
Creating Sample Projects
System Analyzer and UIA provide a number of project templates for use in CCS.
To use these project templates, begin creating a new CCS project by choosing File > New > CCS Project from the menus. In the Project Templates section of the New Project wizard, expand the System Analyzer (UIA) item to see the list of available templates.
When you select a project template, a description of the project is shown to the right. Finish creating the project and examine the *.c code files and *.cfg configuration file. All required products and repositories are pre-configured.
Multi-core project templates are available for the EVM6472 and the EVMTI816x. Single-core project templates that use the “stairstep” example from SYS/BIOS are available for a number of supported transports. Additional tutorial examples are provided; these are described on the Texas Instruments Embedded Processors Wiki.

12
See the sections that follow for any specific notes about settings or changes you need to make to the project files before building, loading, and running it.
4.1 Notes for EVM6472 MessageQ Project Template
On the Project Templates section of the New CCS project wizard, select the “evm6472: MessageQ” template. This example shows how to use IPC’s MessageQ module with UIA. The same image must be loaded on all cores.
The RTSC Configuration Settings page of the wizard automatically has the correct RTSC Target, Platform, and Build-Profile set.
After creating the project, examine the message.c and message.cfg files.
In the message.c file, notice two calls to Log_write2() in tsk0_func(), which runs only on CORE0. The calls to Log_write2() pass events of UIABenchmark_start and UIABenchmark_stop types. These are used to bracket the code that uses MessageQ to send and receive a message from a remote processor.
In the message.cfg file, notice that the LoggingSetup module is configured to use the UploadMode_NONJTAGTRANSPORT mode. This mode uses Ethernet as the default transport to move Log records to CCS via the UIA ServiceMgr framework. This example configures the ServiceMgr module to use a multi-core topology. All the cores route their data to the ServiceMgr module running on Linux. The configuration also contains a section that configures the NDK, which is used by the Ethernet transport.
UIA ships pre-built EVM6472 Ethernet drivers. The libraries are in the <uia_install>\packages\ti\uia\examples\evm6472\ndkdrivers directory. These libraries were copied out of the PDK_1_00_00_05 package. This was done to make building the examples easier.
Within the configuration file of EVM6472 example, the following line gets the pre-built Ethernet libraries and includes them in the build. If you have an updated PDK, simply remove this statement and add the libraries into the project (or follow the instructions with the PDK).
var ndkdrivers = xdc.loadPackage('ti.uia.examples.evm6472.ndkdrivers');
Note that the NDK currently supports only the COFF format.
You can use the following System Analyzer features when running this example: CPU Load, Task Load, Execution Graph, Duration, and Context Aware Profile.

13
4.2 Notes for EVMTI816x SimpleTask Project Templates
On the Project Settings page of the New CCS project wizard, be sure to select the correct Device Variant (e.g. C674X or CortexM3).
On the Project Templates page of the New CCS project wizard, select one of the “evmti816x: SimpleTask” templates. These examples use LoggerCircBuf or LoggerSM (shared memory) to log benchmark events. Different projects are provided for the DSP, video M3, and vpss M3.
On the RTSC Configuration Settings page of the wizard, make sure to check the box for SysLink package in the Products and Repositories list. Use the Add button to add the repository if it is not shown.
The RTSC Configuration Settings page of the wizard automatically has the correct RTSC Target, Platform, and Build-Profile set. For example:
After creating the project, examine the simpleTask.c and *.cfg files.
In the simpleTask.c file, notice the two calls to Log_write1() in the taskLoad() function. The calls to Log_write1() pass event types of UIABenchmark_start and UIABenchmark_stop. These are used to bracket the code that reverses the bits in a buffer.
The configuration filename depends on the core and the logger implementation. For example, for the LoggerCircBuf version of the DSP application, the configuration file is called dspLoggerCircBuf.cfg. All versions of the configuration files for these examples include the simpleTask.cfg.xs configuration file. This shared file configures Clock, Semaphore, and Task objects. It also configures IPC and the shared memory region.
The non-shared configuration files cause the LoggingSetup module to use the UploadMode_NONJTAGTRANSPORT mode. This mode uses Ethernet as the default transport to move Log records to CCS via the UIA ServiceMgr framework. This example configures the ServiceMgr module to use a multi-core topology.
You can use the following System Analyzer features with these examples: CPU Load, Task Load, Execution Graph, Duration, and Context Aware Profile.
The <uia_install>\packages\ti\uia\examples\evmti816x directory contains a readme.txt file with details on how to run the example. The source code and a Makefile to build the Linux application are also included in the <uia_install>packages\ti\uia\examples\evmti816x directory.
14
4.3 Notes for Single-Core Stairstep Project Templates
On the Project Templates page of the New CCS project wizard, expand the System Analyzer > Single-core Examples list and choose a “Stairstep” template. These examples use Hwi, Swi, and Task threads run to add to the CPU load of the system. This example periodically generates log events.
Each of the examples uses a different transport mode. These modes are configured by setting the LoggingSetup.eventUploadMode parameter.
The following list provides notes that apply to specific versions of this example:
• Stairstep Ethernet. This template is configured for use on the EVM6472 with NDK. Within the configuration file, the following line gets the pre-built Ethernet libraries and includes them in the build. If you have an updated PDK or are using a different device, simply remove this statement and add the libraries into the project (or follow the instructions with the PDK). See Section 4.1 for more about using the NDK with an application for the EVM6472.
var ndkdrivers = xdc.loadPackage('ti.uia.examples.evm6472.ndkdrivers');
• Stairstep JTAG RunMode. This mode is only supported on CPUs that support real-time JTAG access. This support is provided on the C64x+ and C66x CPUs. When the UploadMode_JTAGRUNMODE is used, the UIA ServiceMgr framework and NDK are not used.
• All other Stairstep templates. The JTAG StopMode, ProbePoint, and Simulator templates are not-platform specific. These templates do not use the UIA ServiceMgr framework or the NDK.
In the Stairstep example, the cpuLoadInit() function gets the CPU frequency and fills arrays with load values corresponding to 0, 25, 50, 75, and 95 percent CPU loads. The timerFunc() function is a Hwi thread that runs every 100ms to launch a Hwi, Swi, and Task thread. Each thread then performs a doLoad() function before relinquishing the CPU. After staying at each load setting for 5 seconds, timerFunc() calls the step() function to advance to the next set of Hwi, Swi, and Task load values. The cycle repeats after reaching the 95 percent load.
You can use the following System Analyzer features when running these examples: CPU Load, Task Load, and Execution Graph.
4.4 Notes for System Analyzer Tutorial Project Templates
You can create projects using the System Analyzer and UIA tutorials.
• Tutorial 1: This template is intended for use on a C64x+ or C66x simulator. This tutorial shows how to log errors, warnings, and informational events, benchmark code, and control which events are logged. Refer to http://processors.wiki.ti.com/index.php/McsaTutorial1 for details.

15
• Tutorial 2: This template is intended for use on a C64x+ or C66x emulator. This tutorial shows how to log data that can be graphed and analyzed for minimum, maximum, and average statistics. Refer to http://processors.wiki.ti.com/index.php/McsaTutorial2 for details.
Additional tutorials will be provided online and as updates. See http://processors.wiki.ti.com/index.php/Multicore_System_Analyzer_Tutorials.
4.5 For More Information
To learn more about System Analyzer and the software products used with it, refer to the following documentation:
• UIA online reference help (also called "CDOC"). Open with CCSv4 online help or run <uia_install>/docs/cdoc/index.html. Use this help system to get reference information about static configuration of UIA modules and C functions provided by UIA. Notice that links to CDOC topics are shown in green in the System Analyzer help.
• TI Embedded Processors Wiki. http://processors.wiki.ti.com
System Analyzer. http://processors.wiki.ti.com/index.php/Multicore_System_Analyzer
Code Composer Studio. http://processors.wiki.ti.com/index.php/Category:Code_Composer_Studio_v5
SYS/BIOS. http://processors.wiki.ti.com/index.php/Category:SYSBIOS
NDK. http://processors.wiki.ti.com/index.php/Category:NDK
SysLink. http://processors.wiki.ti.com/index.php/Category:SysLink
• RTSC-Pedia Wiki. http://rtsc.eclipse.org/docs-tip for XDCtools documentation.
• TI E2E Community. http://e2e.ti.com/
For CCS and DVT information, see the Code Composer forum at http://e2e.ti.com/support/development_tools/code_composer_studio/f/81.aspx
For SYS/BIOS, XDCtools, IPC, NDK, and SysLink information, see the SYS/BIOS forum at http://e2e.ti.com/support/embedded/f/355.aspx
Also see the forums for your specific processor(s).
• SYS/BIOS 6.x Product Folder. http://focus.ti.com/docs/toolsw/folders/print/dspbios6. html
• Embedded Software Download Page. http://software-dl.ti.com/dsps/dsps_public_sw/sdo_sb/targetcontent/index.html for downloading SYS/BIOS, XDCtools, IPC, and NDK versions.
16
Chapter 5
Capturing Live Data in a Sample Project
This chapter walks you through the process of creating, building, and running a sample project to capture live data with System Analyzer. This example uses a simulator with the JTAG Stop mode, so you do not need any special hardware in order to follow the steps in this example. If you have a hardware device that is supported by System Analyzer, you can use that device instead of the simulator when using this example.

17
5.1 Creating the Project
Follow these steps in CCS v5.1 to create this sample project:
1) Start Code Composer Studio 5.1.
2) Choose File > New > CCS Project from the menus.
3) On the CCS Project page, type Stairstep_Sample as the Project name. Make sure the Use default location checkbox is checked.
4) Select C6000 as the Device Family and Generic C64x+ Device as the Variant.
5) In the Project Templates area, expand the System Analyzer (UIA) item and the Single-core Examples category. Select Stairstep JTAG StopMode.
18
6) Click Next.
7) On the RTSC Configuration Settings page, select the software versions you want to use. These instructions were tested with XDCtools 3.22.1, SYS/BIOS 6.32.2, IPC 1.23.2, and System Analyzer 1.0.1.
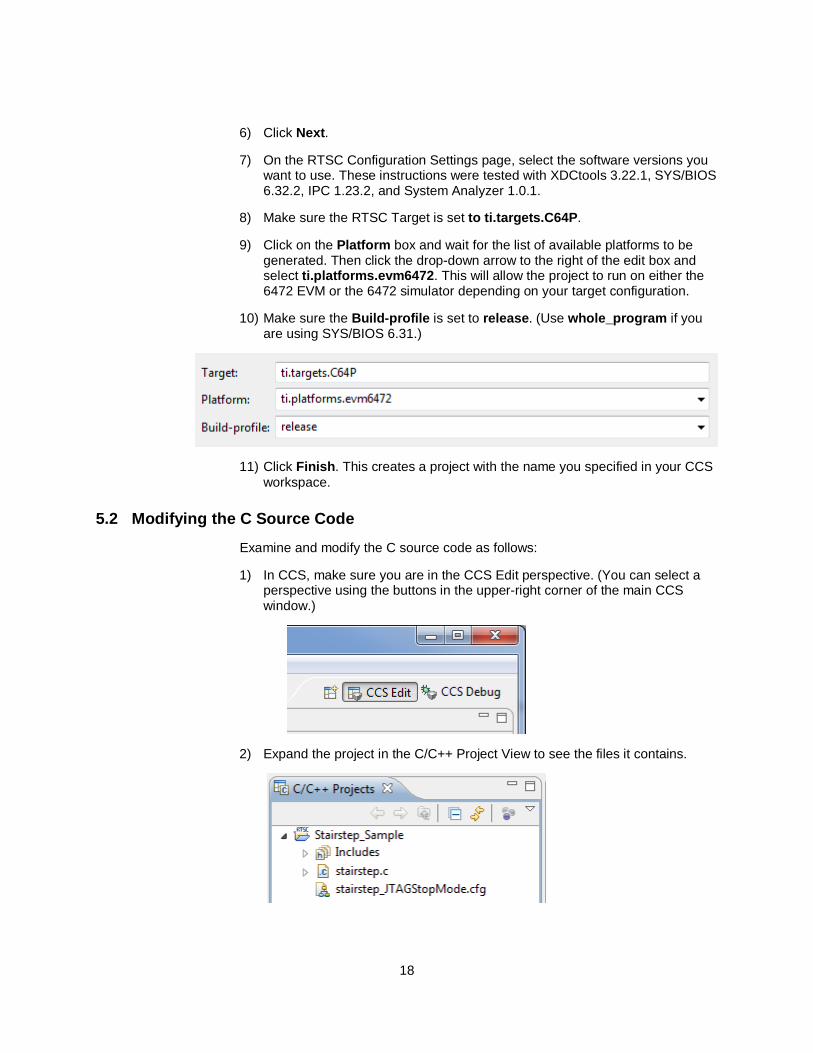
8) Make sure the RTSC Target is set to ti.targets.C64P.
9) Click on the Platform box and wait for the list of available platforms to be generated. Then click the drop-down arrow to the right of the edit box and select ti.platforms.evm6472. This will allow the project to run on either the 6472 EVM or the 6472 simulator depending on your target configuration.
10) Make sure the Build-profile is set to release. (Use whole_program if you are using SYS/BIOS 6.31.)
11) Click Finish. This creates a project with the name you specified in your CCS workspace.
5.2 Modifying the C Source Code
Examine and modify the C source code as follows:
1) In CCS, make sure you are in the CCS Edit perspective. (You can select a perspective using the buttons in the upper-right corner of the main CCS window.)
2) Expand the project in the C/C++ Project View to see the files it contains.
19
3) Double-click on the stairstep.c file to open it in the CCS editor.
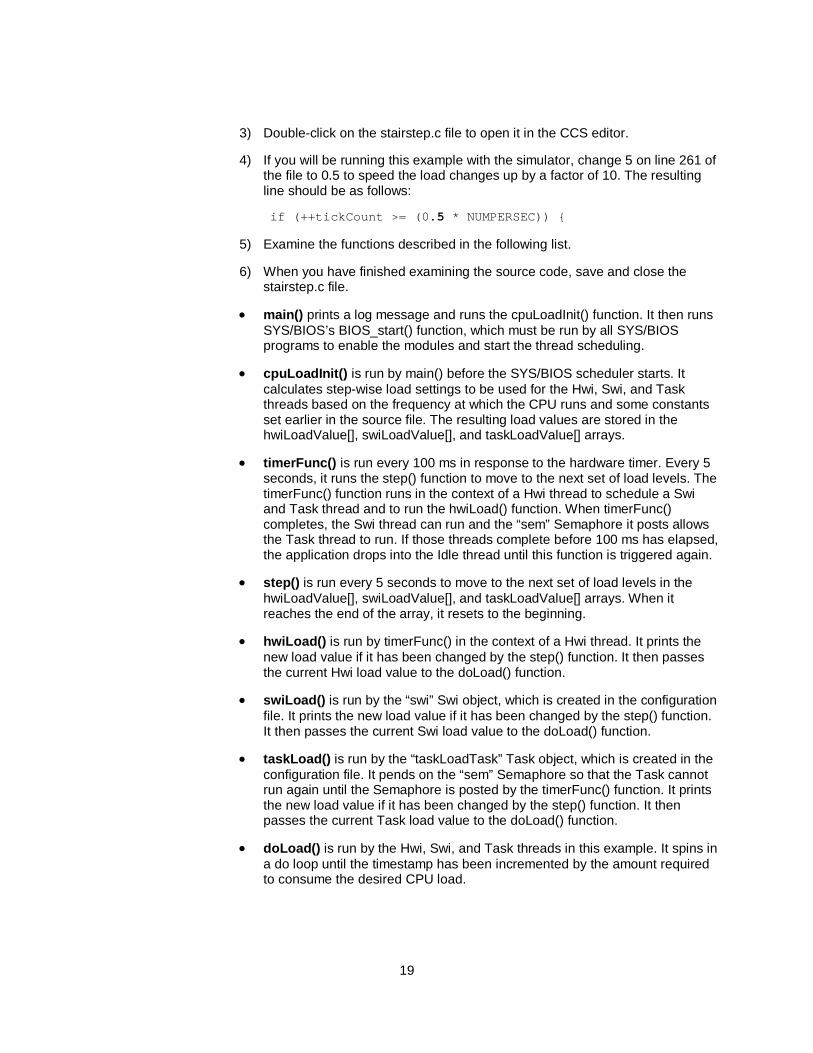
4) If you will be running this example with the simulator, change 5 on line 261 of the file to 0.5 to speed the load changes up by a factor of 10. The resulting line should be as follows:
if (++tickCount >= (0.5 * NUMPERSEC)) {
5) Examine the functions described in the following list.
6) When you have finished examining the source code, save and close the stairstep.c file.
• main() prints a log message and runs the cpuLoadInit() function. It then runs SYS/BIOS’s BIOS_start() function, which must be run by all SYS/BIOS programs to enable the modules and start the thread scheduling.
• cpuLoadInit() is run by main() before the SYS/BIOS scheduler starts. It calculates step-wise load settings to be used for the Hwi, Swi, and Task threads based on the frequency at which the CPU runs and some constants set earlier in the source file. The resulting load values are stored in the hwiLoadValue[], swiLoadValue[], and taskLoadValue[] arrays.
• timerFunc() is run every 100 ms in response to the hardware timer. Every 5 seconds, it runs the step() function to move to the next set of load levels. The timerFunc() function runs in the context of a Hwi thread to schedule a Swi and Task thread and to run the hwiLoad() function. When timerFunc() completes, the Swi thread can run and the “sem” Semaphore it posts allows the Task thread to run. If those threads complete before 100 ms has elapsed, the application drops into the Idle thread until this function is triggered again.
• step() is run every 5 seconds to move to the next set of load levels in the hwiLoadValue[], swiLoadValue[], and taskLoadValue[] arrays. When it reaches the end of the array, it resets to the beginning.
• hwiLoad() is run by timerFunc() in the context of a Hwi thread. It prints the new load value if it has been changed by the step() function. It then passes the current Hwi load value to the doLoad() function.
• swiLoad() is run by the “swi” Swi object, which is created in the configuration file. It prints the new load value if it has been changed by the step() function. It then passes the current Swi load value to the doLoad() function.
• taskLoad() is run by the “taskLoadTask” Task object, which is created in the configuration file. It pends on the “sem” Semaphore so that the Task cannot run again until the Semaphore is posted by the timerFunc() function. It prints the new load value if it has been changed by the step() function. It then passes the current Task load value to the doLoad() function.
• doLoad() is run by the Hwi, Swi, and Task threads in this example. It spins in a do loop until the timestamp has been incremented by the amount required to consume the desired CPU load.

20
5.3 Modifying the Configuration File
Examine and modify the configuration file as follows. The modifications cause the application to log additional events for analysis.
1) Double-click the stairstep_JTAGStopMode.cfg configuration file. By default, double-clicking opens the XGCONF configuration file editor.
Note: These instructions were written for use with SYS/BIOS 6.32. If you are using SYS/BIOS 6.31 or higher, XGCONF has a spreadsheet-link interface for setting properties.
2) Look at the configurations of the following instances, which are used by the stairstep.c source file:
• sem. The timerFunc() function posts this Semaphore to allow the taskLoadTask to run. When the taskLoadTask runs, it pends on this Semaphore so the task cannot run again until the Semaphore is posted.
• swi. This Swi instance runs the swiLoad() function once when it is posted by the timerFunc() function.
• taskLoadTask. This Task instance runs the taskLoad() function when it is scheduled by posting the Semaphore.
• timer0. This Timer runs the timerFunc() function once every 100 ms.
3) Notice that the ti.uia.sysbios.LoggingSetup module is used by this application. This enables UIA event logging to be sent to the System Analyzer features.
4) In the Outline pane, select the LoggingSetup module.
5) In the center pane, set the sysbiosSwiLogging property to true.

21
6) If you are using SYS/BIOS 6.32.01 or higher, choose the BIOS module in the Outline view. Choose the Runtime view. Set the SYS/BIOS library type to “custom”. (This setting is required in order to allow you to enable Swi and Hwi load monitoring.) If you are using the Advanced view instead of the Runtime view, set the libType property to LibType_Custom.
7) In the Available Products list, type Load in the “type filter text” field just below the Available Products title. You should see the SYS/BIOS tree expanded to show the Realtime Analysis > Load module.
8) Right-click on the Load module and choose Use Load.

22
9) In the center pane for the CPU Load Monitor module, make sure that all the boxes are checked in the Basic view. (Or, in the Advanced view, set the swiEnabled and hwiEnabled properties to true.)
10) Press Ctrl+S to save your changes to the configuration file. Changes are validated when you save so that any errors are shown in the Problems view before you build the project.
5.4 Building the Project
Follow these steps to build the sample project:
1) Right-click on the project in the C/C++ Projects pane, and select Build Project from the context menu.
2) Watch the progress of the build in the Console area. (You can run the build in the background if you like.) When the build is finished, the Console area should say "Finished building target: Stairstep_Sample.out" to indicate that the project was built successfully. In addition to compiling and linking the C source file, the build also processes the *.cfg configuration file using XDCtools. Since the default configuration of the project is "Debug", the files generated from the configuration are stored in the project's Debug\configPkg folder.

23
5.5 Debugging the Project
To debug the application, follow these steps:
1) In CCS, choose File > New > Target Configuration File.
2) In the Target Configuration dialog, type C6472sim.ccxml as the File name. You can use the default location of the project directory.
3) Click Finish.
4) In the Basic tab, select Texas Instruments Simulator as the Connection and type 6472 as the Device filter.
5) Select the C6472 Device Cycle Accurate Simulator, Little Endian device.
6) Click Save.
7) Choose View > Target Configurations in CCS.
8) In the Target Configurations pane, expand the Projects > Stairstep_Sample list to see your target configuration. (If you chose to use a shared location for the target configuration, expand the User Defined list.)
24
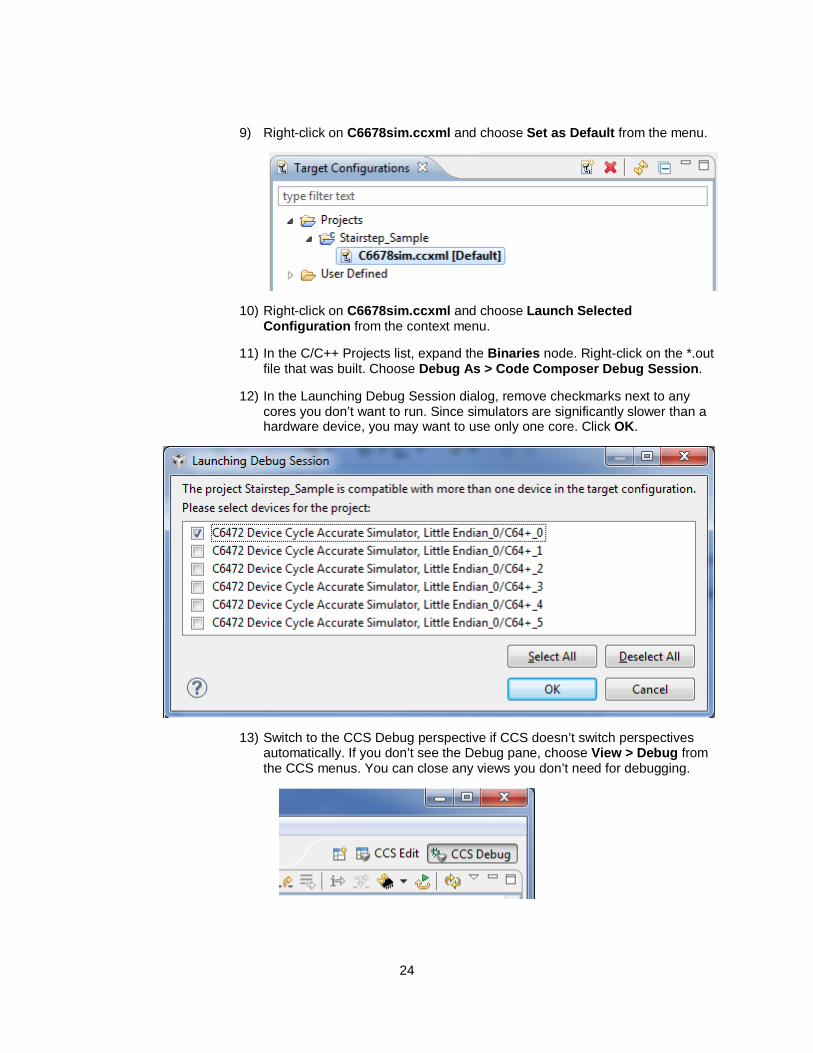
9) Right-click on C6678sim.ccxml and choose Set as Default from the menu.
10) Right-click on C6678sim.ccxml and choose Launch Selected Configuration from the context menu.
11) In the C/C++ Projects list, expand the Binaries node. Right-click on the *.out file that was built. Choose Debug As > Code Composer Debug Session.
12) In the Launching Debug Session dialog, remove checkmarks next to any cores you don’t want to run. Since simulators are significantly slower than a hardware device, you may want to use only one core. Click OK.
13) Switch to the CCS Debug perspective if CCS doesn’t switch perspectives automatically. If you don’t see the Debug pane, choose View > Debug from the CCS menus. You can close any views you don’t need for debugging.

25
5.6 Capturing System Analyzer Data with the Project
The program runs to the beginning of main(). Follow these steps to capture event data using System Analyzer:
1) Choose Tools > System Analyzer > Live in the menus.
2) In the Live Parameters dialog, use the following settings:
Notice that since you are running a debugging session, System Analyzer can get information about the cores and transports from the debugging session.

26
3) Choose the views checked in the previous figure for the Task Load and Execution Graph analysis features. (The program is not yet instrumented to log events used in the Context Aware Profile, Duration, and Count Analysis features.)
4) Since you are using JTAG stop-mode, make sure you choose to collect data Until data transfer is manually paused.
5) Click Run.
6) Right-click on each core that has the program loaded, and choose Resume from the context menu.
7) Let the program run for a while.
Note: If you are using a simulator, you may need to run the program for several hours in order to get enough data to see the stairstep pattern in the load graphs. If you just want to see some events in the System Analyzer Live Session: Logs view, about 7 events will be generated within a few minutes.
8) Right-click on the cores that are running, and choose Suspend from the context menu. Events are passed to the System Analyzer views and processed when you suspend execution because you are using JTAG stop-mode.
9) You can continue using Resume and Suspend to collect more events.
Note: You can ignore warnings about a dropped interrupt that begin to occur as the CPU load increases.
27
5.7 Analyzing System Analyzer Data
Follow these steps to examine the event data you collect using System Analyzer:
1) In the System Analyzer Live Session: Logs view, notice that you can click on the headings to sort the events by any column. See the System Analyzer User’s Guide (SPRUH43) for information about using special features in this view, such as finding and filtering events, synchronizing with other views, and bookmarking events.
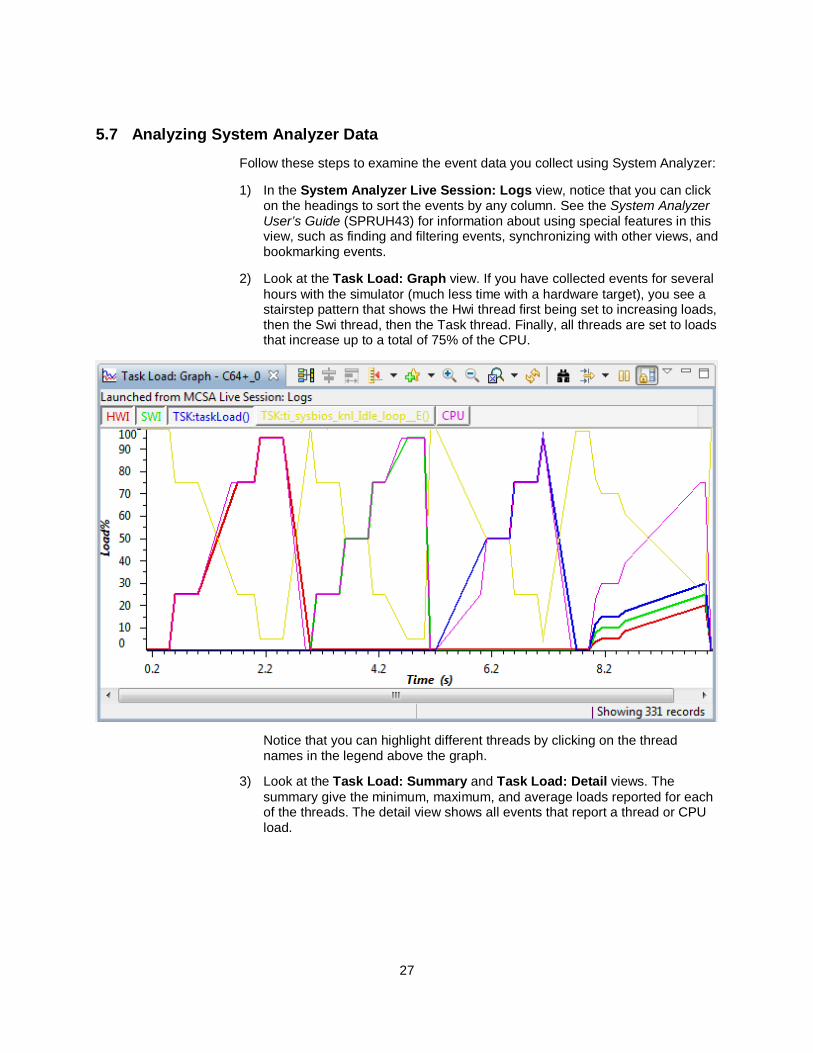
2) Look at the Task Load: Graph view. If you have collected events for several hours with the simulator (much less time with a hardware target), you see a stairstep pattern that shows the Hwi thread first being set to increasing loads, then the Swi thread, then the Task thread. Finally, all threads are set to loads that increase up to a total of 75% of the CPU.
Notice that you can highlight different threads by clicking on the thread names in the legend above the graph.
3) Look at the Task Load: Summary and Task Load: Detail views. The summary give the minimum, maximum, and average loads reported for each of the threads. The detail view shows all events that report a thread or CPU load.
28
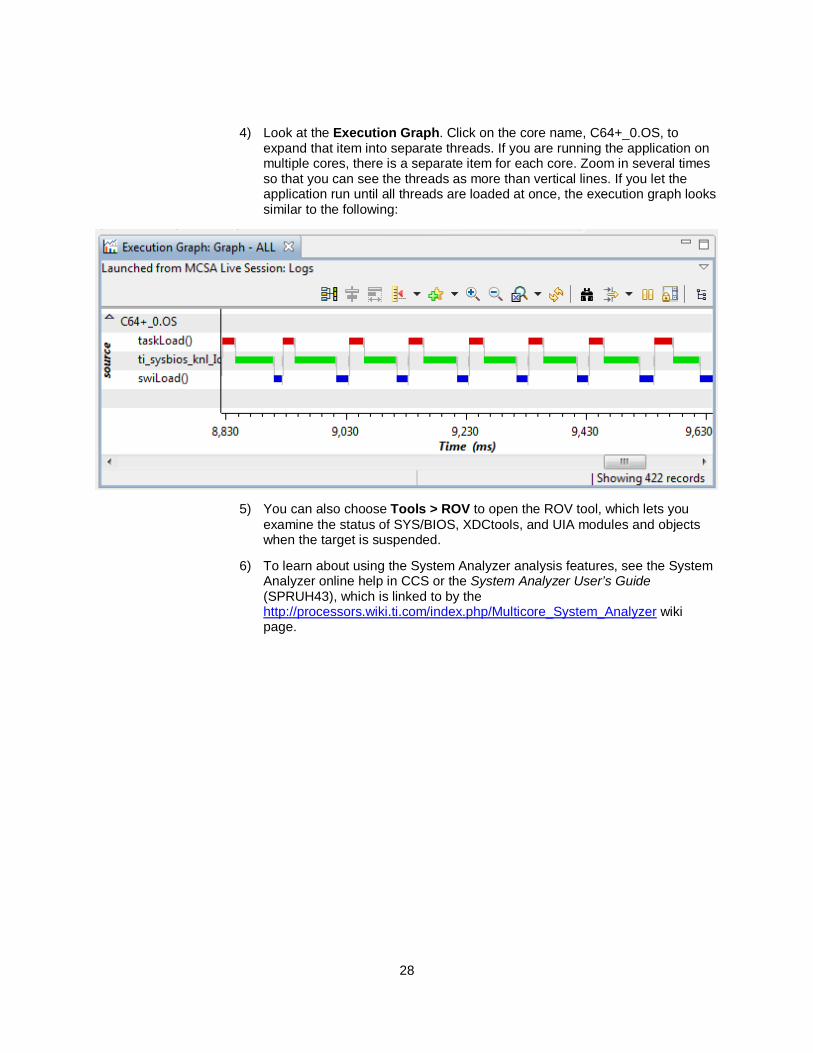
4) Look at the Execution Graph. Click on the core name, C64+_0.OS, to expand that item into separate threads. If you are running the application on multiple cores, there is a separate item for each core. Zoom in several times so that you can see the threads as more than vertical lines. If you let the application run until all threads are loaded at once, the execution graph looks similar to the following:
5) You can also choose Tools > ROV to open the ROV tool, which lets you examine the status of SYS/BIOS, XDCtools, and UIA modules and objects when the target is suspended.
6) To learn about using the System Analyzer analysis features, see the System Analyzer online help in CCS or the System Analyzer User’s Guide (SPRUH43), which is linked to by the http://processors.wiki.ti.com/index.php/Multicore_System_Analyzer wiki page.

IMPORTANT NOTICE
Texas Instruments Incorporated and its subsidiaries (TI) reserve the right to make corrections, modifications, enhancements, improvements, and other changes to its products and services at any time and to discontinue any product or service without notice. Customers should obtain the latest relevant information before placing orders and should verify that such information is current and complete. All products are sold subject to TI’s terms and conditions of sale supplied at the time of order acknowledgment.
TI warrants performance of its hardware products to the specifications applicable at the time of sale in accordance with TI’s standard warranty. Testing and other quality control techniques are used to the extent TI deems necessary to support this warranty. Except where mandated by government requirements, testing of all parameters of each product is not necessarily performed.
TI assumes no liability for applications assistance or customer product design. Customers are responsible for their products and applications using TI components. To minimize the risks associated with customer products and applications, customers should provide adequate design and operating safeguards.
TI does not warrant or represent that any license, either express or implied, is granted under any TI patent right, copyright, mask work right, or other TI intellectual property right relating to any combination, machine, or process in which TI products or services are used. Information published by TI regarding third-party products or services does not constitute a license from TI to use such products or services or a warranty or endorsement thereof. Use of such information may require a license from a third party under the patents or other intellectual property of the third party, or a license from TI under the patents or other intellectual property of TI.
Reproduction of TI information in TI data books or data sheets is permissible only if reproduction is without alteration and is accompanied by all associated warranties, conditions, limitations, and notices. Reproduction of this information with alteration is an unfair and deceptive business practice. TI is not responsible or liable for such altered documentation. Information of third parties may be subject to additional restrictions.
Resale of TI products or services with statements different from or beyond the parameters stated by TI for that product or service voids all express and any implied warranties for the associated TI product or service and is an unfair and deceptive business practice. TI is not responsible or liable for any such statements.
TI products are not authorized for use in safety-critical applications (such as life support) where a failure of the TI product would reasonably be expected to cause severe personal injury or death, unless officers of the parties have executed an agreement specifically governing such use. Buyers represent that they have all necessary expertise in the safety and regulatory ramifications of their applications, and acknowledge and agree that they are solely responsible for all legal, regulatory and safety-related requirements concerning their products and any use of TI products in such safety-critical applications, notwithstanding any applications-related information or support that may be provided by TI. Further, Buyers must fully indemnify TI and its representatives against any damages arising out of the use of TI products in such safety-critical applications.
TI products are neither designed nor intended for use in military/aerospace applications or environments unless the TI products are specifically designated by TI as military-grade or "enhanced plastic." Only products designated by TI as military-grade meet military specifications. Buyers acknowledge and agree that any such use of TI products which TI has not designated as military-grade is solely at the Buyer's risk, and that they are solely responsible for compliance with all legal and regulatory requirements in connection with such use.
TI products are neither designed nor intended for use in automotive applications or environments unless the specific TI products are designated by TI as compliant with ISO/TS 16949 requirements. Buyers acknowledge and agree that, if they use any non-designated products in automotive applications, TI will not be responsible for any failure to meet such requirements.
Following are URLs where you can obtain information on other Texas Instruments products and application solutions:
Products Applications
Amplifiers amplifier.ti.com Audio www.ti.com/audio
Data Converters dataconverter.ti.com Automotive www.ti.com/automotive
DLP® Products www.dlp.com Broadband www.ti.com/broadband
DSP dsp.ti.com Digital Control www.ti.com/digitalcontrol
Clocks and Timers www.ti.com/clocks Military www.ti.com/military
Interface interface.ti.com Optical Networking www.ti.com/opticalnetwork
Logic logic.ti.com Security www.ti.com/security
Power Mgmt power.ti.com Telephony www.ti.com/telephony
Microcontrollers microcontroller.ti.com Video & Imaging www.ti.com/video
RFID www.ti-rfid.com Wireless www.ti.com/wireless
RF/IF and ZigBee® Solutions www.ti.com/lprf
Mailing Address: Texas Instruments, Post Office Box 655303, Dallas, Texas 75265 Copyright © 2011, Texas Instruments Incorporated