system dynamic modelling of three different wind turbine
TRANSCRIPT
This is a repository copy of System Dynamic Modelling of Three Different Wind Turbine Gearbox Designs under Transient Loading Conditions.
White Rose Research Online URL for this paper:http://eprints.whiterose.ac.uk/123465/
Version: Accepted Version
Article:
Al-Hamadani, H, An, T, King, M et al. (1 more author) (2017) System Dynamic Modelling ofThree Different Wind Turbine Gearbox Designs under Transient Loading Conditions. International Journal of Precision Engineering and Manufacturing, 18 (11). pp. 1659-1668. ISSN 1229-8557
https://doi.org/10.1007/s12541-017-0194-1
[email protected]://eprints.whiterose.ac.uk/
Reuse
Unless indicated otherwise, fulltext items are protected by copyright with all rights reserved. The copyright exception in section 29 of the Copyright, Designs and Patents Act 1988 allows the making of a single copy solely for the purpose of non-commercial research or private study within the limits of fair dealing. The publisher or other rights-holder may allow further reproduction and re-use of this version - refer to the White Rose Research Online record for this item. Where records identify the publisher as the copyright holder, users can verify any specific terms of use on the publisher’s website.
Takedown
If you consider content in White Rose Research Online to be in breach of UK law, please notify us by emailing [email protected] including the URL of the record and the reason for the withdrawal request.
International Journal of Precision Engineering and Manufacturing (2017) Vol. 18, No. 11 pp. 1659-1668 DOI: 10.1007/s12541-017-0194-1
1. Introduction
The WT gearboxes are replaced frequently within a six to eight-year period, which is considerably shorter than the designed life of 20 years1. The premature failures of some gearbox components may be caused by transient loads experienced by the drivetrain, especially when the size of modern WTs has been steadily increased during last decades2. The cost of WT gearbox can be up to 13% of the total cost of a WT, with further operational costs incurred due to the difficulty of replacing failed mechanical components, especially in offshore operation environment3. Reducing the component failures and downtime of the gearbox will make wind energy more economically viable to achieve sustainable generation of renewable energy. However, the WT gearbox consists of a large number of moving mechanical components which increasing the likelihood of failure; this is a concern as replacements of large components in offshore environment are expensive. It is important to develop accurate simulation models of the WT drivetrain in the design development stage of the WT drivetrain and gearbox configuration to investigate dynamic loads when it is subjected to various operational conditions.
WT drivetrain undergoes various operational conditions and its design configuration affects how the gearbox components react to transient loading conditions. This paper studies the system dynamic response of three different WT drivetrain configurations under normal and shutdown operations. The pure torsional multibody dynamic models are developed by using MATLAB/Simulink, including the turbine rotor, the gearbox components and the generator. The model of each configuration captures more details of drivetrain dynamic behaviour, such as the torsional deformation and dynamic responses of key mechanical components of the WT drivetrain, than that of the widely used two mass or five mass drivetrain models. The required
parameters for building multistage gearbox dynamic models are obtained by developing CAD models. Eigenfrequency analysis of the WT drivetrains is performed by using MATLAB/Simulink control design tools. The influence of the WT drivetrain design configuration on the eigenfrequencies of the system and how they affect the dominant frequencies and the meshing forces of gears of the gearbox during normal operation and shutdown are discussed in detail. Parametric study of key variables of the drivetrain components is performed and how these affecting the dynamic responses of the system are studied.
2. System Dynamic Modelling
Peeters et al.4 developed three types of multibody dynamic models in their analysis of WT drivetrain dynamics. These were a purely torsional model, a more advanced rigid multibody model which included the bearings, and finally a flexible multibody model. Using the rigid and flexible multibody approaches developed these models could provide a “good insight into the loads experienced” however the authors stated that it came with a high computational cost5. Increasing the flexibility of WT drivetrain components in the modelling did not always result in more accurate results6. The pure torsional model was able to produce approximations of torsional vibrations7, angular velocities and accelerations8, torques of low speed shaft (LSS) and high speed shaft (HSS)9 and gear meshing forces8. If the bearing loads were required to be modelled, the torsional model could be expanded to include the rotational and translational degrees of freedom10. Mandic et al.7 proposed a damping control technique to monitor the input torques of LSS and used a controller to regulate the generator torque. The controller produced a resistive damping torque to reduce damping at natural frequencies of the system. This technique had shown to be able to reduce resonant oscillations thus resulted in less damage to
System Dynamic Modelling of Three Different Wind Turbine Gearbox Designs under Transient Loading Conditions
Haider Al-Hamadani, Taylan An, Matthew King, and Hui Long*
Department of Mechanical Engineering, The University of Sheffield, Sheffield, United Kingdom, S1 3JD
*Corresponding Author / E-mail: [email protected] Abstract: Wind turbine (WT) drivetrain design configurations affect dynamic loads experienced by the drivetrain components under different operational conditions. This paper presents system modelling of dynamic loads experienced by key mechanical components within WT gearbox under different operational conditions by using MATLAB/Simulink. Two operational conditions of WTs are considered; normal operation and shutdown, using torque spectrums measured from a field operating wind turbine. The torsional dynamic loads under these conditions differ significantly; during normal operation, the maximum torque ratio is below the recommend value however it exceeds the recommended level during shutdown. It has been found that the shutdown event has a considerable effect on gear loading; it causes occurrences of loading reversal of gear meshing forces. Moreover, the variation range of meshing forces between planetary and sun gears is five to six times higher than that during normal operation. During shutdown, the most dominated vibration frequency of the WT drivetrains is the lowest one which is very close to the estimated natural frequency of the low speed shaft and that may cause the resonance of the drivetrain system. KEYWORDS: Wind Turbine, Drivetrain, Multibody dynamics, Vibration, Transient loading

International Journal of Precision Engineering and Manufacturing (2017) Vol. 18, No. 11 pp. 1659-1668 DOI: 10.1007/s12541-017-0194-1
gearbox components. Similar modelling techniques were used by Girsang et al.9 in the modelling of the WT drivetrain using Simulink while loading conditions were obtained by FAST software. By using a purely torsional model the drivetrain was simulated under a variety of wind and grid loading conditions, allowing the analysis of the dynamic interactions between components during transient loading conditions to be carried out7, 9.
Simulation tools could be used in the design development stage of WT drivetrain and gearbox configurations to reduce vibrations at resonant frequencies9. The torsional dynamic model for WT gearboxes is one of the common modelling approaches because of its fast solution time with low computational costs. In this paper, purely torsional model is adequate to model three different configurations of the WT drivetrain and gearbox. It follows a similar approach as the one used by Peeters et al.4, including single degree of freedom (DOF) per drivetrain component with the associated torsional and gear mesh stiffnesses. The models developed in this study are computationally effective to capture the torsional loads, meshing forces of all gear stages and dynamic responses of key WT drivetrain and gearbox components during free and forced vibrations.
3. Three Different WT Gearbox Designs
The majority of gearbox designs in modern WTs has very similar configurations therefore they experience the similar failure modes11. Depending on the required output speed to be fed into the generator, the commonly used WT gearbox configurations are recommended in the international standard12. The common WT gearbox design configurations include one planetary gear stage followed by two parallel gear stages or two planetary gear stages followed by one parallel gear stage12. Another design configuration includes only two planetary gear stages13. In all gearbox design configurations, the ring gear does not rotate and is fixed on gearbox casing.
The development of WT drivetrain dynamic models can be beneficial in understanding the loading behaviour and predicating the response of WT drivetrain components under transient loading conditions. This study evaluates three different gearbox configurations of the WT drivetrain, Drivetrains A, B and C, they are designed by using CAD software as shown in Fig. 1. The gearbox design parameters are presented in Table 1. The complete drivetrains are modelled by MATLAB/Simulink. The WT drivetrains using three different gearbox configurations are simulated under normal operation and shutdown respectively to evaluate the dynamic response of the system under the transient events. A comparison of system dynamic behaviour is made for different gearbox configurations to understand their potential for load reduction on key components of WT gearbox.
Fig. 1 Simplified schematic of WT drivetrains and their gearboxes CAD models, from the top to the bottom: Drivetrain-A, Drivetrain-B and Drivetrain-C (LSS = Low Speed Shaft, ISS = Intermediate Speed Shaft, HSS = High Speed Shaft) Table 1 Design parameters of three different WT drivetrains
Parameters Drivetrain
A B C Rated power (MW) 3 3 2 Gearbox ratio 1:34 1:115 1:92 Gearbox stages 2 3 3
Gearbox stage1 Planetary Planetary Planetary stage2 Planetary Planetary Parallel stage3 - Parallel Parallel
Min. rotor speed (rpm) 8.6 8.6 10.8 Rated rotor speed (rpm) 14.8 16.1 16 Max. rotor speed (rpm) 18.4 18.4 19.1
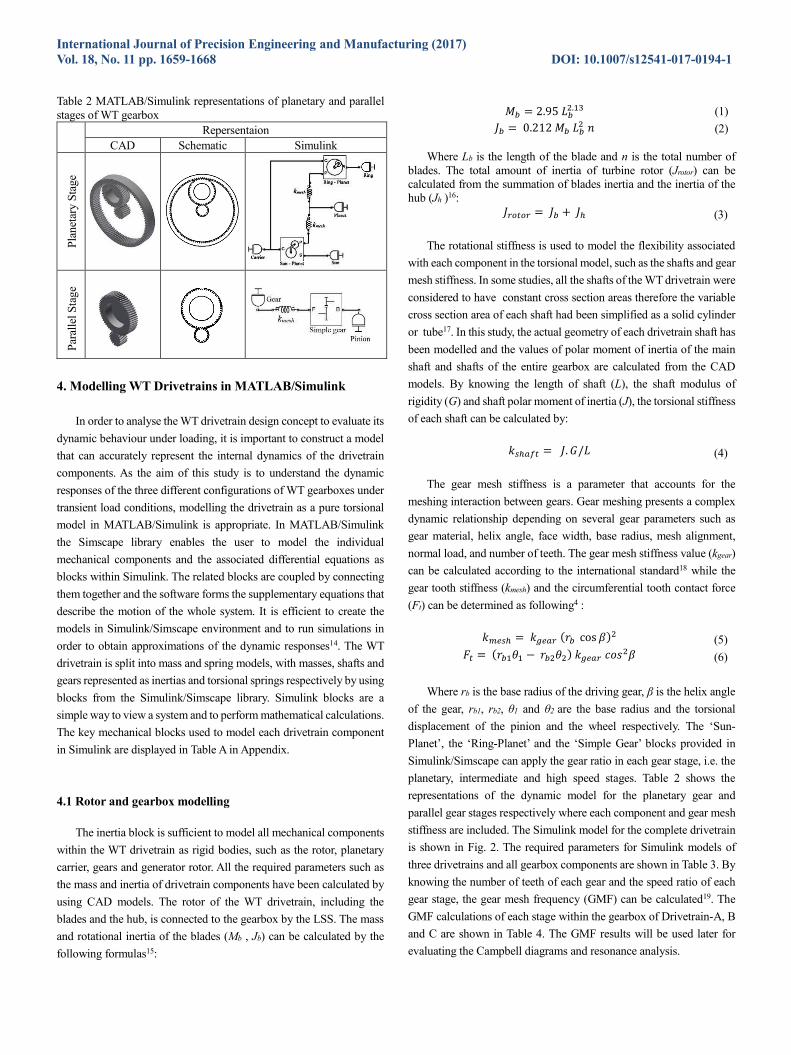
International Journal of Precision Engineering and Manufacturing (2017) Vol. 18, No. 11 pp. 1659-1668 DOI: 10.1007/s12541-017-0194-1 Table 2 MATLAB/Simulink representations of planetary and parallel stages of WT gearbox
Repersentaion CAD Schematic Simulink
Plan
etar
y St
age
Para
llel S
tage
4. Modelling WT Drivetrains in MATLAB/Simulink
In order to analyse the WT drivetrain design concept to evaluate its dynamic behaviour under loading, it is important to construct a model that can accurately represent the internal dynamics of the drivetrain components. As the aim of this study is to understand the dynamic responses of the three different configurations of WT gearboxes under transient load conditions, modelling the drivetrain as a pure torsional model in MATLAB/Simulink is appropriate. In MATLAB/Simulink the Simscape library enables the user to model the individual mechanical components and the associated differential equations as blocks within Simulink. The related blocks are coupled by connecting them together and the software forms the supplementary equations that describe the motion of the whole system. It is efficient to create the models in Simulink/Simscape environment and to run simulations in order to obtain approximations of the dynamic responses14. The WT drivetrain is split into mass and spring models, with masses, shafts and gears represented as inertias and torsional springs respectively by using blocks from the Simulink/Simscape library. Simulink blocks are a simple way to view a system and to perform mathematical calculations. The key mechanical blocks used to model each drivetrain component in Simulink are displayed in Table A in Appendix.
4.1 Rotor and gearbox modelling
The inertia block is sufficient to model all mechanical components within the WT drivetrain as rigid bodies, such as the rotor, planetary carrier, gears and generator rotor. All the required parameters such as the mass and inertia of drivetrain components have been calculated by using CAD models. The rotor of the WT drivetrain, including the blades and the hub, is connected to the gearbox by the LSS. The mass and rotational inertia of the blades (Mb , Jb) can be calculated by the following formulas15:
警長 噺 に┻ひの 詣長態┻怠戴 (1) 蛍長 噺 ど┻になに 警長 詣長態 券 (2)
Where Lb is the length of the blade and n is the total number of blades. The total amount of inertia of turbine rotor (Jrotor) can be calculated from the summation of blades inertia and the inertia of the hub (Jh )16: 蛍追墜痛墜追 噺 蛍長 髪 蛍朕
(3)
The rotational stiffness is used to model the flexibility associated with each component in the torsional model, such as the shafts and gear mesh stiffness. In some studies, all the shafts of the WT drivetrain were considered to have constant cross section areas therefore the variable cross section area of each shaft had been simplified as a solid cylinder or tube17. In this study, the actual geometry of each drivetrain shaft has been modelled and the values of polar moment of inertia of the main shaft and shafts of the entire gearbox are calculated from the CAD models. By knowing the length of shaft (L), the shaft modulus of rigidity (G) and shaft polar moment of inertia (J), the torsional stiffness of each shaft can be calculated by: 倦鎚朕銚捗痛 噺 蛍┻ 罫【詣 (4)
The gear mesh stiffness is a parameter that accounts for the meshing interaction between gears. Gear meshing presents a complex dynamic relationship depending on several gear parameters such as gear material, helix angle, face width, base radius, mesh alignment, normal load, and number of teeth. The gear mesh stiffness value (kgear) can be calculated according to the international standard18 while the gear tooth stiffness (kmesh) and the circumferential tooth contact force (Ft) can be determined as following4 : 倦陳勅鎚朕 噺 倦直勅銚追 岫堅長 cos 紅岻態
(5) 繋痛 噺 岫堅長怠肯怠 伐 堅長態肯態岻 倦直勅銚追 潔剣嫌態紅 (6)
Where rb is the base radius of the driving gear, く is the helix angle of the gear, rb1, rb2, し1 and し2 are the base radius and the torsional displacement of the pinion and the wheel respectively. The ‘Sun-Planet’, the ‘Ring-Planet’ and the ‘Simple Gear’ blocks provided in Simulink/Simscape can apply the gear ratio in each gear stage, i.e. the planetary, intermediate and high speed stages. Table 2 shows the representations of the dynamic model for the planetary gear and parallel gear stages respectively where each component and gear mesh stiffness are included. The Simulink model for the complete drivetrain is shown in Fig. 2. The required parameters for Simulink models of three drivetrains and all gearbox components are shown in Table 3. By knowing the number of teeth of each gear and the speed ratio of each gear stage, the gear mesh frequency (GMF) can be calculated19. The GMF calculations of each stage within the gearbox of Drivetrain-A, B and C are shown in Table 4. The GMF results will be used later for evaluating the Campbell diagrams and resonance analysis.
International Journal of Precision Engineering and Manufacturing (2017) Vol. 18, No. 11 pp. 1659-1668 DOI: 10.1007/s12541-017-0194-1
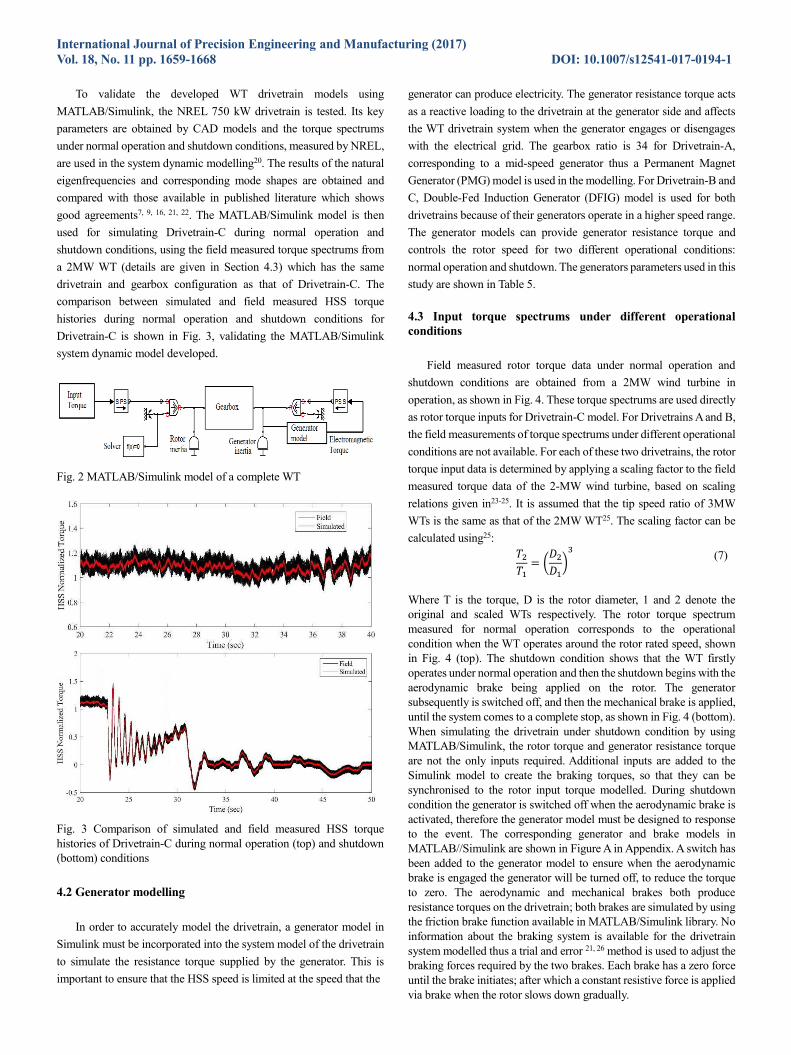
To validate the developed WT drivetrain models using MATLAB/Simulink, the NREL 750 kW drivetrain is tested. Its key parameters are obtained by CAD models and the torque spectrums under normal operation and shutdown conditions, measured by NREL, are used in the system dynamic modelling20. The results of the natural eigenfrequencies and corresponding mode shapes are obtained and compared with those available in published literature which shows good agreements7, 9, 16, 21, 22. The MATLAB/Simulink model is then used for simulating Drivetrain-C during normal operation and shutdown conditions, using the field measured torque spectrums from a 2MW WT (details are given in Section 4.3) which has the same drivetrain and gearbox configuration as that of Drivetrain-C. The comparison between simulated and field measured HSS torque histories during normal operation and shutdown conditions for Drivetrain-C is shown in Fig. 3, validating the MATLAB/Simulink system dynamic model developed.
Fig. 2 MATLAB/Simulink model of a complete WT Fig. 3 Comparison of simulated and field measured HSS torque histories of Drivetrain-C during normal operation (top) and shutdown (bottom) conditions 4.2 Generator modelling
In order to accurately model the drivetrain, a generator model in Simulink must be incorporated into the system model of the drivetrain to simulate the resistance torque supplied by the generator. This is important to ensure that the HSS speed is limited at the speed that the
generator can produce electricity. The generator resistance torque acts as a reactive loading to the drivetrain at the generator side and affects the WT drivetrain system when the generator engages or disengages with the electrical grid. The gearbox ratio is 34 for Drivetrain-A, corresponding to a mid-speed generator thus a Permanent Magnet Generator (PMG) model is used in the modelling. For Drivetrain-B and C, Double-Fed Induction Generator (DFIG) model is used for both drivetrains because of their generators operate in a higher speed range. The generator models can provide generator resistance torque and controls the rotor speed for two different operational conditions: normal operation and shutdown. The generators parameters used in this study are shown in Table 5. 4.3 Input torque spectrums under different operational conditions
Field measured rotor torque data under normal operation and shutdown conditions are obtained from a 2MW wind turbine in operation, as shown in Fig. 4. These torque spectrums are used directly as rotor torque inputs for Drivetrain-C model. For Drivetrains A and B, the field measurements of torque spectrums under different operational conditions are not available. For each of these two drivetrains, the rotor torque input data is determined by applying a scaling factor to the field measured torque data of the 2-MW wind turbine, based on scaling relations given in23-25. It is assumed that the tip speed ratio of 3MW WTs is the same as that of the 2MW WT25. The scaling factor can be calculated using25: 劇態劇怠 噺 磐経態経怠卑戴
(7)
Where T is the torque, D is the rotor diameter, 1 and 2 denote the original and scaled WTs respectively. The rotor torque spectrum measured for normal operation corresponds to the operational condition when the WT operates around the rotor rated speed, shown in Fig. 4 (top). The shutdown condition shows that the WT firstly operates under normal operation and then the shutdown begins with the aerodynamic brake being applied on the rotor. The generator subsequently is switched off, and then the mechanical brake is applied, until the system comes to a complete stop, as shown in Fig. 4 (bottom). When simulating the drivetrain under shutdown condition by using MATLAB/Simulink, the rotor torque and generator resistance torque are not the only inputs required. Additional inputs are added to the Simulink model to create the braking torques, so that they can be synchronised to the rotor input torque modelled. During shutdown condition the generator is switched off when the aerodynamic brake is activated, therefore the generator model must be designed to response to the event. The corresponding generator and brake models in MATLAB//Simulink are shown in Figure A in Appendix. A switch has been added to the generator model to ensure when the aerodynamic brake is engaged the generator will be turned off, to reduce the torque to zero. The aerodynamic and mechanical brakes both produce resistance torques on the drivetrain; both brakes are simulated by using the friction brake function available in MATLAB/Simulink library. No information about the braking system is available for the drivetrain system modelled thus a trial and error 21, 26 method is used to adjust the braking forces required by the two brakes. Each brake has a zero force until the brake initiates; after which a constant resistive force is applied via brake when the rotor slows down gradually.

International Journal of Precision Engineering and Manufacturing (2017) Vol. 18, No. 11 pp. 1659-1668 DOI: 10.1007/s12541-017-0194-1
Fig. 4 Input torque spectrum during normal operation (top) and shutdown (bottom) Table 3 Parameters of mechanical components of three WT drivetrain configurations
Parameters Drivetrain
A B C Rotor inertia (kg.m2) 2.67e+6 2.67e+6 6.03e+6 Generator inertia (kg.m2) 680 680 60 Stage 1 (2) Planet carrier inertia (kg.m2)
2.32e+3 (871.4)
2.32e+3 (871.4) 173.86
Stage 1 (2) Ring gear inertia (kg.m2)
832.78 (233.79)
2314 (226.1) -
Stage 1 (2) Planet gear inertia (kg.m2)
37.119 (7.115) 87.9 (9.0) 356
Stage 1 (2) Sun gear inertia (kg.m2)
2.187 (0.887) 7.9 (0.4) 29
Stage 1 (2) Planet gear number 3 (3) 3 (3) 3 Stage 2 (3) Gear inertia (kg.m2) - (17.7) 270
(270) Stage 2 (3) Pinion inertia (kgm2) - (0.3) 1.5 (2) Stage 1 (2) Ring-Planet mesh stiffnesses (Nm/rad)
1.54e+9 (1.62e+8)
7.09e+8 (1.43e+8) 1.22e+9
Stage 1 (2) Sun-Planet mesh stiffnesses (Nm/rad)
1.54e+9 (1.62e+8)
7.09e+8 (1.43e+8) 1.22e+9
Stage 2 (3) Gear-Pinion mesh stiffnesses (Nm/rad) - (5.88e+8) 1.63e+9
(5.7e+8) LSS stiffness (Nm/rad) 9.30e+9 9.30e+9 1.6e+8 Stage 1,2 connecting shaft stiffness (Nm/rad) 1.06e+8 1.06e+8 3.42e+8
Stage 2,3 connecting shaft stiffness (Nm/rad) - 1.40e+7 1.85e+9
HSS stiffness (Nm/rad) 1.40e+7 1.95e+6 3.1e+8
Table 4 Gear mesh frequencies of three WT drivetrain gearboxes
Gearbox mesh frequency Drivetrain Orders
A B C GMF stage I 146x 154x 174x GMF stage II 730x 707.259x 648x GMF stage III - 2419.575x 2664x
Table 5 WT drivetrains generator parameters
Parameters Drivetrain
A B C Rated speed (RPM) 515 1836 1680 Generator type PMG DFIG DFIG Number of poles 10 4 4 Gird voltage (Volt) 690 690 690 Frequency (Hz) 60 60 60 Mutual inductance (Lm) 0.32 3.0 3.0 Stator leakage reactance (Ls) 0.64 0.1 0.1 Line inductance 0.09 0.09 0.1
5. Results and Discussion 5.1 Free and forced vibration analysis
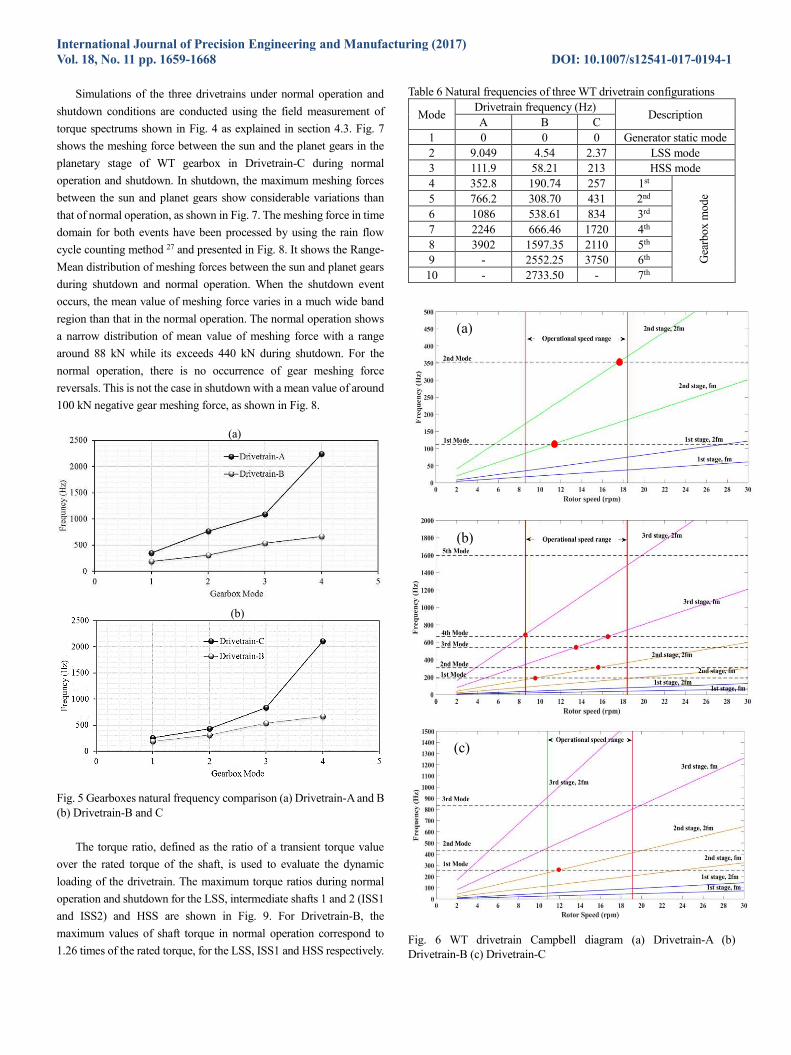
The results show the responses of three different WT drivetrain configurations under free vibration, normal operation and shutdown conditions. The natural frequencies and the vibration modes of gearboxes of Drivetrain-A, B and C are presented in Table 6. Fig. 5 illustrate the tendency of the gearbox natural frequency with the gearbox mode for Drivetrain-A, B and Drivetrain-B, C respectively. The results show that increasing the number of gearbox stages or the drivetrain rated power both result in reduction of the natural frequencies.
Avoiding resonance is a key part of WT drivetrain design due to the severe consequences it could bring on the drivetrain system. When the WT drivetrain is excited under the transient conditions it is important to establish whether the system is vibrating close to the natural frequencies. The phenomena of resonance can occur when the exciting frequency of the system corresponds to the natural frequencies. This can have a significant impact on the WT drivetrain causing premature failure of some components and is therefore an important consideration in system dynamic studies. Fig. 6 shows the Campbell diagrams for the gearboxes of Drivetrain-A, B and C respectively. The drivetrain resonance may occur when the diagonal lines, the GMF of each stage cross the horizontal lines, representing the gearbox natural frequencies within the zone of rotor operational speed. For the lowest gearbox ratio, Drivetrain-A with gearbox of two stages, the 1st and 2nd GMF of the 2nd stage cross the lines of the 1st and 2nd gearbox vibration mode during the low and high speed conditions, which should be avoided. Increasing the number of gearbox stages from two to three without change the WT rated power, comparing Drivetrains-A and B, will not change the drivetrain system dynamic behaviour by moving away from the resonance occurrence, in contrast, making it more likely to happen. One of the options to minimize the resonance is to shift-up the range of operational speed or to shift-down the WT power from 3MW to 2MW by reducing the number of teeth of gears using Drivetrain-C, as shown in Fig. 6(c).
Normal operation
Braking Stopping
International Journal of Precision Engineering and Manufacturing (2017) Vol. 18, No. 11 pp. 1659-1668 DOI: 10.1007/s12541-017-0194-1
(a)
(b)
Simulations of the three drivetrains under normal operation and shutdown conditions are conducted using the field measurement of torque spectrums shown in Fig. 4 as explained in section 4.3. Fig. 7 shows the meshing force between the sun and the planet gears in the planetary stage of WT gearbox in Drivetrain-C during normal operation and shutdown. In shutdown, the maximum meshing forces between the sun and planet gears show considerable variations than that of normal operation, as shown in Fig. 7. The meshing force in time domain for both events have been processed by using the rain flow cycle counting method 27 and presented in Fig. 8. It shows the Range-Mean distribution of meshing forces between the sun and planet gears during shutdown and normal operation. When the shutdown event occurs, the mean value of meshing force varies in a much wide band region than that in the normal operation. The normal operation shows a narrow distribution of mean value of meshing force with a range around 88 kN while its exceeds 440 kN during shutdown. For the normal operation, there is no occurrence of gear meshing force reversals. This is not the case in shutdown with a mean value of around 100 kN negative gear meshing force, as shown in Fig. 8.
Fig. 5 Gearboxes natural frequency comparison (a) Drivetrain-A and B (b) Drivetrain-B and C
The torque ratio, defined as the ratio of a transient torque value over the rated torque of the shaft, is used to evaluate the dynamic loading of the drivetrain. The maximum torque ratios during normal operation and shutdown for the LSS, intermediate shafts 1 and 2 (ISS1 and ISS2) and HSS are shown in Fig. 9. For Drivetrain-B, the maximum values of shaft torque in normal operation correspond to 1.26 times of the rated torque, for the LSS, ISS1 and HSS respectively.
Table 6 Natural frequencies of three WT drivetrain configurations
Mode Drivetrain frequency (Hz) Description A B C
1 0 0 0 Generator static mode 2 9.049 4.54 2.37 LSS mode 3 111.9 58.21 213 HSS mode 4 352.8 190.74 257 1st
Gea
rbox
mod
e 5 766.2 308.70 431 2nd 6 1086 538.61 834 3rd 7 2246 666.46 1720 4th 8 3902 1597.35 2110 5th 9 - 2552.25 3750 6th 10 - 2733.50 - 7th
Fig. 6 WT drivetrain Campbell diagram (a) Drivetrain-A (b) Drivetrain-B (c) Drivetrain-C
(a)
(b)
(c)

International Journal of Precision Engineering and Manufacturing (2017) Vol. 18, No. 11 pp. 1659-1668 DOI: 10.1007/s12541-017-0194-1
These values are below 1.35, the factor of safety for design loads as recommended in the WT design requirement standards12. These levels of torsional loads are not likely to contribute to the premature failure problem; as excessive loading is not observed for the three drivetrains modelled during normal operation. During the shutdown, however, the torsional loads are at a maximum for all the shafts when the mechanical brake being applied. This is an indication of a higher level of torsional vibrations within the system. The lowest torque ratio is 1.32 (HSS in Drivetrain-C) and the highest torque ratio is 1.38 (LSS in Drivetrain-B). For Drivetrain A and B, the torque ratio for LSS and ISS1 exceed the recommended value of 1.35 12. Furthermore Fig. 10 shows that the maximum range of torsional loads of the gearbox shafts for the three configurations is considerably high during shutdown; the ratio of maximum torque ranges under shutdown condition for all shafts of Drivetrains A, B and C is 5 to 6.5 times higher than that under normal operation. It is stated that at least 1000 shutdown procedures may occur on a WT per year28, the ranges of torsional loads during these transient conditions are considerable higher than that during normal operation, these high load conditions can be damaging for some key mechanical components. Due to the occurrence of resonance and high torsional loads during shutdown condition, this is a possible contributing factor to the premature failure problem of WT gearbox components.
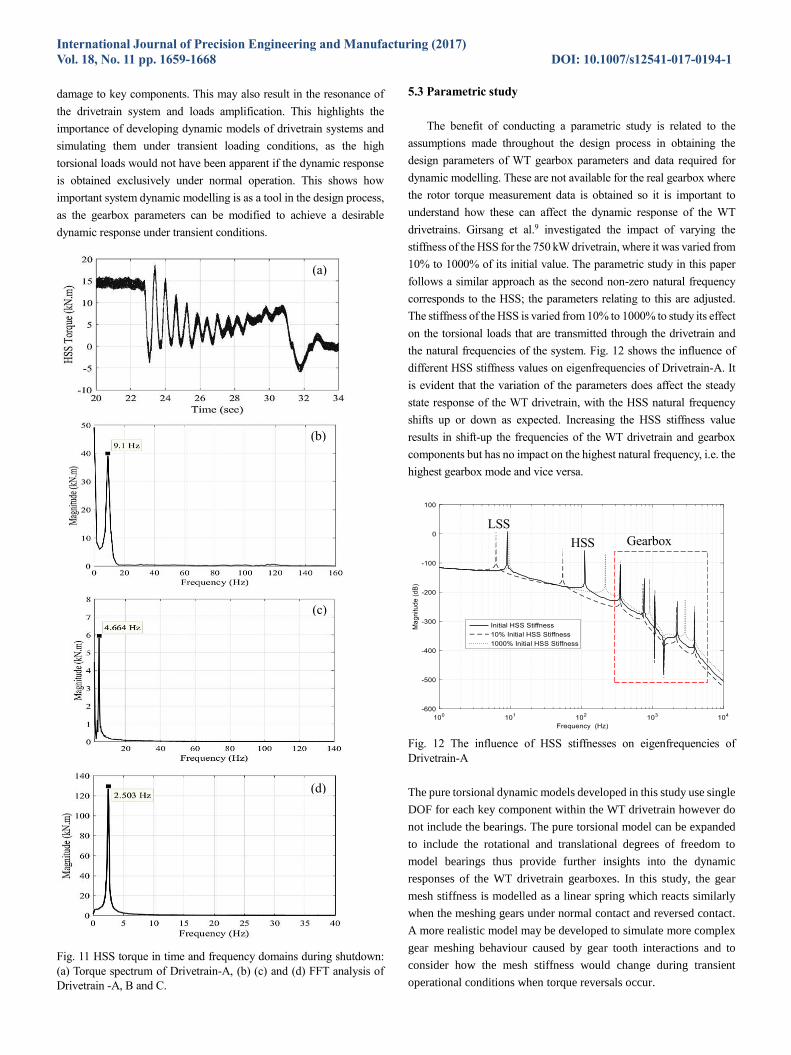
Fig. 7 Meshing force of sun-planet over time of Drivetrain-C during normal operation (top) and shutdown (bottom) 5.2 Frequency excitation during normal operation and shutdown Fig. 11(a) shows the torque transmitted in time domain of the HSS for Drivetrain-A during shutdown. The Fast Fourier Transform (FFT) is
computed for the torque time histories during normal operation and shutdown, for the HSS of Drivetrains-A, B and C. During normal operation, the system is not excited at high amplitudes or near its natural frequencies as there are no peak values observed. In these conditions, there is a relatively low risk of resonance occurring. Fig. 11(b), (c) and (d) show that when the mechanical brake is engaged during shutdown, the most dominated frequencies are 9.1 Hz, 4.664 Hz and 2.503 Hz for Drivetrain-A, B and C respectively.
Fig. 8 Range-Mean of meshing forces of sun-planet of Drivetrain-C during normal operation and shutdown
Fig. 9 Maximum shaft torque ratios of three drivetrains during normal operation (top) and shutdown (bottom)
Fig. 10 Maximum torque range ratios between shutdown and normal operation for gear shafts of three drivetrains
These frequency values are very close to the calculated natural frequencies of the LSS shown in Table 6 (i.e. 9.049 Hz, 4.54 Hz, 2.37 Hz). They are close enough to suggest that there is high possibility for the system to be excited at its natural frequencies, possibly causing
Maximum allowed
Maximum allowed
International Journal of Precision Engineering and Manufacturing (2017) Vol. 18, No. 11 pp. 1659-1668 DOI: 10.1007/s12541-017-0194-1
(a)
(b)
(c)
(d)
damage to key components. This may also result in the resonance of the drivetrain system and loads amplification. This highlights the importance of developing dynamic models of drivetrain systems and simulating them under transient loading conditions, as the high torsional loads would not have been apparent if the dynamic response is obtained exclusively under normal operation. This shows how important system dynamic modelling is as a tool in the design process, as the gearbox parameters can be modified to achieve a desirable dynamic response under transient conditions.
Fig. 11 HSS torque in time and frequency domains during shutdown: (a) Torque spectrum of Drivetrain-A, (b) (c) and (d) FFT analysis of Drivetrain -A, B and C.
5.3 Parametric study
The benefit of conducting a parametric study is related to the assumptions made throughout the design process in obtaining the design parameters of WT gearbox parameters and data required for dynamic modelling. These are not available for the real gearbox where the rotor torque measurement data is obtained so it is important to understand how these can affect the dynamic response of the WT drivetrains. Girsang et al.9 investigated the impact of varying the stiffness of the HSS for the 750 kW drivetrain, where it was varied from 10% to 1000% of its initial value. The parametric study in this paper follows a similar approach as the second non-zero natural frequency corresponds to the HSS; the parameters relating to this are adjusted. The stiffness of the HSS is varied from 10% to 1000% to study its effect on the torsional loads that are transmitted through the drivetrain and the natural frequencies of the system. Fig. 12 shows the influence of different HSS stiffness values on eigenfrequencies of Drivetrain-A. It is evident that the variation of the parameters does affect the steady state response of the WT drivetrain, with the HSS natural frequency shifts up or down as expected. Increasing the HSS stiffness value results in shift-up the frequencies of the WT drivetrain and gearbox components but has no impact on the highest natural frequency, i.e. the highest gearbox mode and vice versa.
Fig. 12 The influence of HSS stiffnesses on eigenfrequencies of Drivetrain-A
The pure torsional dynamic models developed in this study use single
DOF for each key component within the WT drivetrain however do
not include the bearings. The pure torsional model can be expanded
to include the rotational and translational degrees of freedom to
model bearings thus provide further insights into the dynamic
responses of the WT drivetrain gearboxes. In this study, the gear
mesh stiffness is modelled as a linear spring which reacts similarly
when the meshing gears under normal contact and reversed contact.
A more realistic model may be developed to simulate more complex
gear meshing behaviour caused by gear tooth interactions and to
consider how the mesh stiffness would change during transient
operational conditions when torque reversals occur.
LSS mode HSS
modGearbox modes
International Journal of Precision Engineering and Manufacturing (2017) Vol. 18, No. 11 pp. 1659-1668 DOI: 10.1007/s12541-017-0194-1 6. Conclusions
The system dynamic responses of three different drivetrain
gearbox design configurations have been modelled under normal
operation and shutdown conditions. The following conclusions may
be drawn:
1. Comparison between Drivetrain-A, B and C shows that similar
levels of torsional loads are acting on the shafts during normal
operation. However, during shutdown, the drivetrains are under
higher levels of torsional loads when compared to that under
normal operation, increased by 10% in LSS for Drivetrain-A and
B and by 16% in HSS for Drivetrain-C.
2. During shutdown condition, the drivetrain system may be excited
close to a natural frequency of the system, possibly causing
system resonant oscillations. The modelling results show that
larger drivetrain configurations result in a reduction of system
natural frequencies.
3. Drivetrain-B shows the lowest levels of gearbox modes however
it may have the highest probability of resonance occurrence,
while Drivetrain-C shows a better dynamic response in regarding
to resonance occurrences within the operation speed range and
smaller torque ranges during shutdown, when comparing with
that of Drivetrains A and B.
4. During shutdown, the variation range of the meshing force
between the planet and sun gears of all drivetrains is five to six
times higher than that in normal operation. The comparison
between these two loading conditions shows that the shutdown
condition is one of the most critical loading conditions that the
WT gearbox components may experience which may contribute
to premature failures.
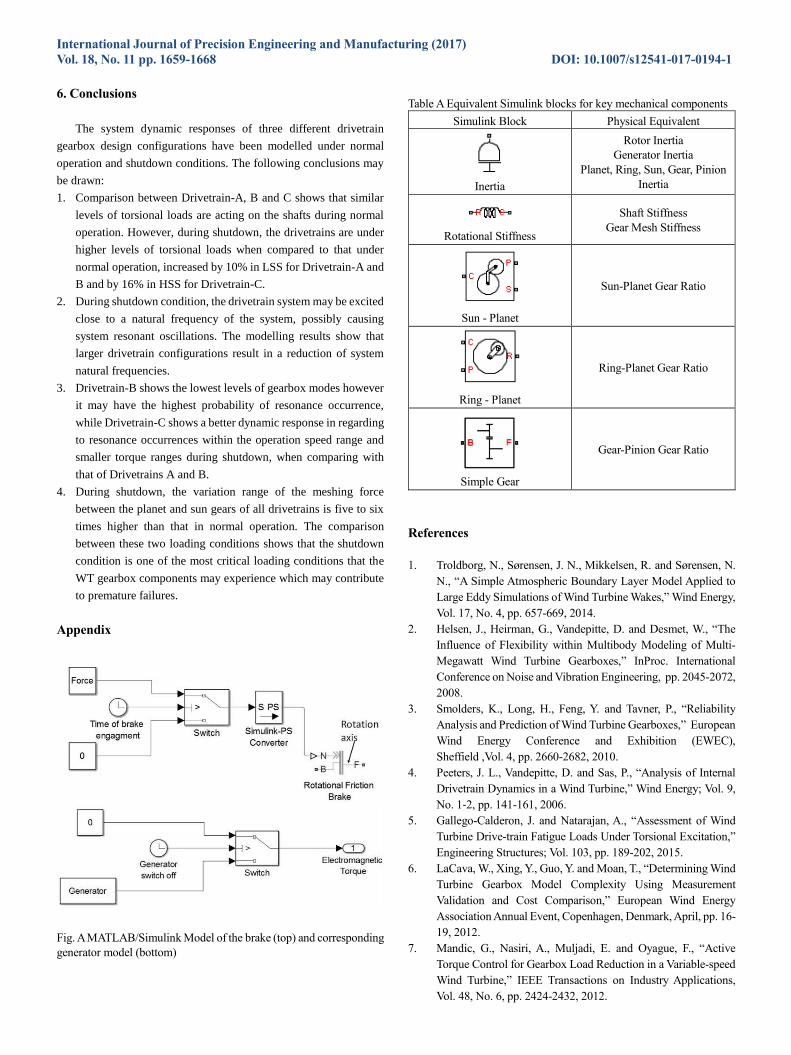
Appendix Fig. A MATLAB/Simulink Model of the brake (top) and corresponding generator model (bottom)
Table A Equivalent Simulink blocks for key mechanical components
Simulink Block Physical Equivalent
Inertia
Rotor Inertia Generator Inertia
Planet, Ring, Sun, Gear, Pinion Inertia
Rotational Stiffness
Shaft Stiffness Gear Mesh Stiffness
Sun - Planet
Sun-Planet Gear Ratio
Ring - Planet
Ring-Planet Gear Ratio
Simple Gear
Gear-Pinion Gear Ratio
References 1. Troldborg, N., Sørensen, J. N., Mikkelsen, R. and Sørensen, N.
N., “A Simple Atmospheric Boundary Layer Model Applied to Large Eddy Simulations of Wind Turbine Wakes,” Wind Energy, Vol. 17, No. 4, pp. 657-669, 2014.
2. Helsen, J., Heirman, G., Vandepitte, D. and Desmet, W., “The Influence of Flexibility within Multibody Modeling of Multi-Megawatt Wind Turbine Gearboxes,” InProc. International Conference on Noise and Vibration Engineering, pp. 2045-2072, 2008.
3. Smolders, K., Long, H., Feng, Y. and Tavner, P., “Reliability Analysis and Prediction of Wind Turbine Gearboxes,” European Wind Energy Conference and Exhibition (EWEC), Sheffield ,Vol. 4, pp. 2660-2682, 2010.
4. Peeters, J. L., Vandepitte, D. and Sas, P., “Analysis of Internal Drivetrain Dynamics in a Wind Turbine,” Wind Energy; Vol. 9, No. 1┽2, pp. 141-161, 2006.
5. Gallego-Calderon, J. and Natarajan, A., “Assessment of Wind Turbine Drive-train Fatigue Loads Under Torsional Excitation,” Engineering Structures; Vol. 103, pp. 189-202, 2015.
6. LaCava, W., Xing, Y., Guo, Y. and Moan, T., “Determining Wind Turbine Gearbox Model Complexity Using Measurement Validation and Cost Comparison,” European Wind Energy Association Annual Event, Copenhagen, Denmark, April, pp. 16-19, 2012.
7. Mandic, G., Nasiri, A., Muljadi, E. and Oyague, F., “Active Torque Control for Gearbox Load Reduction in a Variable-speed Wind Turbine,” IEEE Transactions on Industry Applications, Vol. 48, No. 6, pp. 2424-2432, 2012.
International Journal of Precision Engineering and Manufacturing (2017) Vol. 18, No. 11 pp. 1659-1668 DOI: 10.1007/s12541-017-0194-1 8. Shi, W., Kim, C., W., Chung, C., W., and Park, H., C., “Dynamic
Modeling and Analysis of a Wind Turbine Drivetrain Using the Torsional Dynamic Model,” International Journal of Precision Engineering and Manufacturing, Vol. 14, No. 1, pp. 153-159, 2013.
9. Girsang, I., P., Dhupia, J., S., Muljadi, E., Singh, M., et al., “Gearbox and Drivetrain Models to Study Dynamic Effects of Modern Wind Turbines,” IEEE Transactions on Industry Applications; Vol. 50, No. 6, pp. 3777-3786, 2014.
10. Link, H., Keller, J., Guo, Y. and McNiff, B., “Gearbox Reliability Collaborative Phase 3 Gearbox 2 Test Plan,” National Renewable Energy Laboratory (NREL), NREL/TP-5000-58190, 2013.
11. Musial, W., Butterfield, S. and McNiff, B., “Improving wind turbine gearbox reliability,” European Wind Energy Conference, Milan, Italy, pp. 7-10. 2007.
12. “Wind Turbines Part 4: Design Requirements for Wind Turbine Gearboxes,” British Standards Institution, BS EN 61400-4, 2013.
13. Wang, B., Michon, M., Holehouse, R., and Atallah, K., “Dynamic Behaviour of a Multi-MW Wind Turbine, ” Energy Conversion Congress and Exposition (ECCE), IEEE, pp. 955-962. 2015.
14. Natick,M., “SimscapeTM: User’s Guide, ” MathWorks, Inc. 15. Rodriguez, A., G., Rodríguez, A., G., and Payán, M., B.,
“Estimating Wind Turbines Mechanical Constants,” InProc. Int. Conf. Renewable Energies and Power Quality (ICREPQ’07), pp. 27-30. 2007.
16. Oyague, F., “Gearbox Modeling and Load Simulation of a Baseline 750-kW Wind Turbine Using State-of-the-art Simulation Codes,” National Renewable Energy Laboratory Golden, CO, 2009.
17. Shi, W., Park, H.,C., Na, S., Song, J., et al. “Dynamic Analysis of Three-dimensional Drivetrain System of Wind Turbine,” International Journal of Precision Engineering and Manufacturing, Vol. 15, No. 7, pp. 1351-1357, 2014.
18. “Calculation of Load Capacity of Spur and Helical Gears - Part 5, ” Strength and quality of materials, Std. ISO 6336-1, 2007.
19. Romero, A., Lage, Y., Soua, S., Wang, B., et al. “Vestas V90-3MW Wind Turbine Gearbox Health Assessment Using a Vibration-Based Condition Monitoring System,” Shock and Vibration; Vol. 2016, No., 2016.
20. Al-Hamadani, H., Long, H. and Cartmell, M., “Effects of Model Complexity on Torsional Dynamic Responses of NREL 750 kW Wind Turbine Drivetrain,” Proceedings of the International Conference on Power Transmissions (ICPT), Chongqing, China, 27-30 October, p. 203-212, 2016.
21. Bruce, T., Long, H., and Dwyer-Joyce, R., S., “Dynamic Modelling of Wind Turbine Gearbox Bearing Loading During Transient Events,” IET Renewable Power Generation; Vol. 9, No. 7, pp. 821-830, 2015.
22. Oyague, F., Butterfield, C., and Sheng, S., “Gearbox Reliability Collaborative Analysis Round Robin,” National Renewable Energy Laboratory, Golden, CO, NREL/CP-500-45325, 2009.
23. Doman, G., S., “Structural Dynamic Considerations in Wind Turbine Design,” Wind Turbine Technology: Fundamental Concepts in Wind Turbine Engineering, 2nd Edition, ASME Press 2009.
24. Sieros, G., Chaviaropoulos, P., Sørensen, J., D., Bulder, B., et al.,
“Upscaling Wind Turbines: Theoretical and Practical Aspects and their Impact on the Cost of Energy,” Wind energy; Vol. 15, No. 1, pp. 3-17, 2012.
25. Manwell, J., F., McGowan, J., G., and Rogers, A., L., “Wind Energy Explained: Theory, Design and Application,” John Wiley & Sons, 2010.
26. Scott, K., Infield, D., Barltrop, N., Coultate, J., et al., “Effects of Extreme and Transient Loads on Wind Turbine Drive Trains,” American Institute of Aeronautics and Astronautics, 2011.
27. Downing, S., D., and Socie, D., “Simple Rainflow Counting Algorithms,” International Journal of Fatigue; Vol. 4, No. 1, pp. 31-40, 1982.
28. “Guideline for the Certification of Wind Turbines,” Windenergie GL, Hamburg, Germany, 2003.