system dynamics analysis on management of airline–airport
TRANSCRIPT

1
System Dynamics Analysis on Management of Airline–Airport
Coexistence with Load Factor Guarantee
Nobuaki MINATONobuaki MINATONobuaki MINATONobuaki MINATO
Graduate School of System Design and Management,
Keio University
4-1-1, Hiyoshi, Kohoku-ku, Yokohama, 223-8526, Japan
Tel: +81-45-564-2579 Fax: +81-45-564-2541
E-mail: [email protected]
Risako MORIMOTORisako MORIMOTORisako MORIMOTORisako MORIMOTO
Toulouse Business School
20 Bd Lascrosses BP7010, 31068 Toulouse Cedex 7, France
Tel: +33561294712 Fax: +33561294994
E-mail: [email protected]
Abstract: We discussed management of airline–airport coexistence for a sustainable air transport system. Governments provide various financial supports for unprofitable regional airways when such airways are essential to local life and the economy. However, providing inefficient subsidies are often criticised worldwide. This paper examines the validity of load factor guarantee (LFG) scheme in which an airline and an airport agree on the load factor of a flight and the airport compensates for any discrepancy between the actual and agreed upon load factor. We analysed LFG management using data from Noto Airport and All Nippon Airways (ANA) from 2005 to 2011. By examining several scenarios using system dynamics (SD), we found that LFG is effective in maintaining regional airways when combined with appropriate levels of subsidies. The results illustrated that only an annual negotiation of a target load factor cannot balance the benefits between an airline and an airport and thus, it does not sustain the condition of mutualism. The keys to the success of airline–airport coexistence are integral management of LFG and monthly demand adjustment. The SD model is applicable to airways worldwide and contributes to better design and management of a regional air transport system. Keywords: System Dynamics, Airline, Airport, Coexistence, Load Factor Guarantee, Japan
1. Introduction
1.1. Research Background
Regional air transport generally has thin air traffic demand that has high fluctuations, thus its
operational efficiency is lower than that of trunk routes (Suzuki et al. 1995). Critical decisions for enhancing the profitability of regional air transport businesses were fleet selection and daily frequency

2
(Sato et al. 1990). However, at the micro level, forecasting future air traffic demand is mostly imprecise (Lyneis 2000), adding to the difficulties that an airline encounters when making decisions and when developing a new regional airway. To reduce such a business risk for an airline associated with the entry of a new regional airway, governments provide financial support when demand for air travel is expected to be slight and when air transport is important to the local life and the economy (Minato and Morimoto 2011a). For example, policies such as profit loss compensation, landing fee reductions and fuel tax reductions are made available (Nomura and Kiritoshi 2010).
We agree with the need for regional development to provide a regional airway that generates significant economic activity and that contributes to the development of the areas surrounding the airport (Graham 2003, 203-216, Miller and Clarke 2007). Airports are now considered ‘leading players in regard to economic, productive, tourist and commercial upgrades of a territory, owing to ‘multiplier effect’ in the number of potential business transactions they may stimulate’ (Jarach 2005, 1).
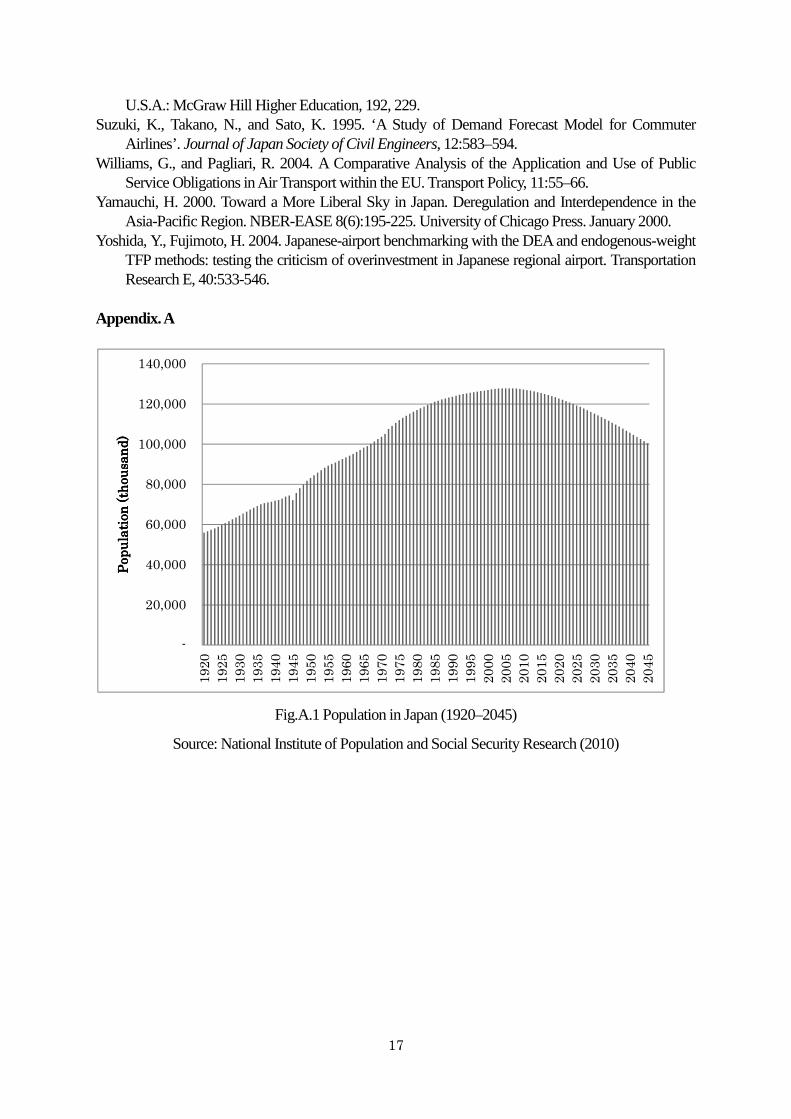
However, managing regional airways that depend solely on public financing is problematic for Japanese society primarily for two reasons. First, the decrease in the Japanese population. In contrast to growth in the world population, the Japanese population has been decreasing after it reached a maximum of 127,787,000 in 2004 (Fig.A.1 in Appendix A). According to the National Institute of Population and Social Security Research, the Japanese population is expected to continue to decrease for the next few decades. Moreover, an increase in the percentage of older people means a decline in the percentage of the working age population who are supposed to pay taxes and support society. This prediction implies that original financial sources in the form of governmental subsides are unlikely to be assured in the future.
Second, the government’s debt causes problem for depending on public financing. Fig.A.2 in Appendix A shows the ratio of government debt to GDP for the seven most developed countries in the world from 1995 to 2010 (Ministry of Finance (MOF) 2011). Although the ratio for Japan was less than 100% in 1995, it has dramatically increased during the period, and finally, reached almost 200% in 2010. Japan has the worst debt to GDP ratio among the seven countries. The unrestrained debt-financed allocation of public funds to stimulate the economic cycle has resulted in a national debt level that threatens future generations (Feldhoff 2002). Although current public finance practices were political and not economical, they were unnecessary distortions to the economy (Yoshida and Fujimoto 2004). Considering the revenue decrease and the debt increase expected in the future, redesigning regional air transport in Japan into a more self-sustained system is necessary.
Therefore, this paper aims to explore the possibility of bilateral coexistence of an airline and an airport to enable unprofitable regional airways to become more self-sustaining. We shed light on a management scheme called load factor guarantee (LFG), which attempts to mitigate business risk and may be able to manage the profitability of airways based more on market principles. More concretely, LFG is an agreement in which an airline and an airport usually owned by a local government agree to the load factor of a regional flight beforehand. The airport and the government then compensate for the discrepancy between the actual and the agreed upon load factor. In some cases, an airline transfers a portion of its revenues to a local government when the actual load factor is higher than the guaranteed load factor (Noto Airport Promotion Council (NAPC) 2012). LFG enables airlines to maintain load factors above the breakeven level, and therefore, encourages airlines to enter regional air routes even when profitability is uncertain. In addition, the local government is encouraged to increase the number of air passengers from the local community to enhance the load factor of a regional airway.

3
1.2. Originality of the Research
The originality of the research reflects an attempt to transform a regional air transport system
from a competitive or parasitic system into a bilateral coexistent system (Fig.1). Before air deregulations, the Japanese regional air transport system was maintained based on a pyramid structure, as shown in Fig.1 (up left). At the top was the Ministry of Transport (MOT), which regulated the aviation industry. At the bottom were small regional airlines, most of them were established with the financial aid of local governments. In the middle, three major Japanese airlines (Japan Airline (JAL), All Nippon Airways (ANA) and Japan Air System (JAS)) operated both domestically and internationally. The strong hierarchy of the air transport system was a mirror of Japan’s centralised governance structure (Feldhoff 2002, 2003). Because the hierarchy had order and control, the business relationship was rather ‘predatory’, similar to the food chain in the natural world.
However, air deregulations broke the equilibrium and airlines and airports began to compete with each other (Barrett, S. 2000). The strong remained in the market and the weak were eliminated as a result of free competition. Therefore, some of the regional airlines and regional airports only relied on governments for subsidies to remain in the market. In short, two different evolutionary trends arose in the regional air transport system in Japan. One is a transformation from predatory to competitive (Fig.1, down left) and the other is a transformation from predatory to parasite (Fig.1, up right).
This research focuses on the bilateral coexistence of a regional air transport system (Fig.1, down left). This coexistence implies that each regional air transport stakeholder bilaterally relies on the other stakeholders to coexist in a market rather than competing with one another or being a parasite on external resources such as public financing. In other words, this research discusses a symbiosis between an airline and an airport.
The remainder of the paper is structured as follows. Section 2 overviews previous research concerning the management of unprofitable regional air transport systems. Section 3 explains the model structure and the data. Section 4 discusses the simulation results. Finally, Section 5 summarises the key findings and discusses future works.
Fig.1 Originality of the research

4
2. Literature Review
The unprofitability of a regional air transport is a worldwide issue. As a countermeasure, national
subsidy programmes have become common practices worldwide, particularly when demand for air travel is slight but air transport is important for local life and the economy. In the United States, Essential Air Services (EAS) provides ‘small communities throughout the United States and Alaska with a minimum level of air transport service, connecting them through carrier hubs to the national network’ (Grubesic and Matisziw 2011). In addition, these small communities can use the subsidised money to attract new or additional air services (Santana 2009). The public service obligation (PSO) in Europe ensures minimum levels of air service to remote regions by subsidising non-commercial routes (Lian and Ronnevik 2011). Once awarded with the PSO, airlines are granted a monopoly on the route for a period not exceeding three years (Williams and Pagliari 2004). Ten countries applied to the PSO scheme in 2006: Finland, France, Germany, Greece, Ireland, Italy Portugal, Spain, Sweden and the UK (Santana 2009). Williams and Pagliari (2004) addressed the issue of the imbalance in the air services among European countries and proposed a more centralised administration and funding of PSOs at the EU level. Their belief was that such a change could result in a more efficient and equitable distribution of subsidies, and a greater degree of consistency with broader EU economic, social and regional development goals (Williams and Pagliari 2004).
The national subsidy programmes originated following air deregulation and were developed to counteract negative regional consequences (Lian and Ronnevik 2011). Apart from sharing a common background, they share a common purpose—to assure remote areas a minimum of air access—and a common rationale—economic development of remote areas (Williams and Pagliari 2004). Many researchers criticised the inefficiency of the subsidy programmes. For example, Grubesic and Matisziw (2011) noted an example of a subsidised flight route between the EAS community of Lewistown, Montana to its nearest hub airport city, Billings, Montana. ‘During 2006, airfare on this route cost $88 with a 30-day advance purchase on Big Sky airlines. However, the government cost was $1343 per passenger. According to the US department of transportation, this route averaged two people per day during 2006’ (Grubesic and Matisziw 2011). Moreover, they pointed out that market coverage is often redundant and suggested alternative definitions of community eligibility to increase programmatic efficiency and reduce federal spending on subsidies (Grubesic and Matisziw 2011). In addition, Lian and Ronnevik (2011) noted the disadvantage of providing subsidies only for local residents. Their argument was that non-residents of the regions have to pay full fares, thus restricting the potential for incoming tourism. Inefficiency and ineffectiveness are common issues discussed regarding national subsidy programmes.
In Japan, national subsidy programmes are limited to flights to remote islands. Matsumoto (2007), in reviewing commercially unsustainable air transport for remote islands in Nagasaki prefecture, stressed on the importance of governmental subsidies and airport construction to promote tourism. Moreover, Kato el al. (2011) pointed out the necessity of subsidies for local airports. They argued that, ‘airports with more than 5.2 million passengers were profitable when depreciation is taken into account; however, most local airports have fewer than 2.5 million passengers. When depreciation costs are excluded, airports need at least 2.7 million passengers to be viable’ (Kato et al. 2011). Their research implies the necessity for public support for sustaining regional airways with small air traffic demand; however, the existing national programme does not mitigate the problem. Furthermore, as previously discussed, the expected societal changes in the future, including the decline in the population and the government increase, does not allows regional air transport system to be sustained based solely on public financing.

5
Thus, this paper examined the LFG that enables mitigation of business risk and managing profitability. However, not many studies exist on LGF; therefore, the validity of management must be appropriately studied. Hihara (2007) analysed LFG agreement between Ishikawa Prefecture and ANA. His research attempted to forecast future load factor and pay-off considering the impact of the LFG agreement on both parties’ decision making but the results were not significant due to the data scarcity. Fukuyama et al. (2009) analysed the LFG agreement between Tottori Prefecture in Japan and Asiana Airlines in Korea. Their research regarded LFG as a Nash bargaining competition between airlines and the local government and examined the rationality of the negotiations using multivariate regression analysis. The negotiation approximately resulted in a Nash bargaining solution in 2007. Furthermore, they forecasted that the load factor would increase as much as 80% in 2010 and that the local government would be required to pay over 100 million JPY to the airline primarily as a result of decreasing utilisation of the airport by local residents. They concluded that well-integrated public support was continuously necessary for maintaining an unprofitable regional airport. In addition, Minato and Morimoto (2011b) analysed the LFG agreement between Noto Airport and All Nippon Airways (ANA) using system dynamics (SD). However, the previous SD model excluded dynamic negotiations and demand adjustments between an airline and an airport (Minato and Morimoto 2011b). Thus, this research attempts to include these market-oriented aspects into a study of the air transport system.
3. Model
3.1. Overview of the Model
The simulation aims to examine the validity of a LFG scheme by analysing the effect of each
stakeholder’s decision-making on long-term airline–airport coexistence. For such a purpose, we developed a SD model that calibrated a general LFG management framework adopted by an airline and an airport (Fukuyama 2009, Minato and Morimoto 2011b). The model consists of four different subsystems: 1) flight and passenger subsystem, 2) demand adjustment subsystem, 3) load factor adjustment subsystem and 4) LFG subsystem. Fig.2 shows a subsystem diagram which aims to describe the overall architecture of the model (Sterman 2000, 99).
An airline provides flights depending on its flight strategy that takes into account frequency and fleet. The strategy defines supply in terms of the number of seats. In contrast, the number of passengers is generated by market demand based on historical data. The flight and passenger subsystem generate the average load factor as an input to the LFG subsystem. The airline and airport negotiate within the load factor adjustment subsystem and generate a target load factor as an input to the LFG subsystem. Payment is calculated based on the discrepancy between the average load factor and the target load factor. When a certain discrepancy exists between the two load factors, an airport with financial support from the local government that owns it, attempts to stimulate passenger demand by providing subsidies. Hence, the airline–airport coexistence is maintained based on a LFG scheme.

6
Fig.2 Overview of the model (Subsystem Diagram)
3.2. Data
We adopted data on Haneda–Noto flights in Japan from 2005 to 2011, believing that the case is
appropriate for simulation for two primary reasons. Haneda–Noto is a route that has operated from Noto Airport since it opened; thus, providing a complete stream of uninterrupted data. Second, the prefecture government owns and manages the airport and has supported ANA and passengers through LFG. This particular LFG requires ANA to operate twice-daily flights between Haneda and Noto. Whenever average load factors are below the guaranteed threshold, the prefecture government compensates ANA for the difference. When the load factor exceeds the guaranteed load factor, ANA transfers some revenues to the prefecture government. These agreements have successfully sustained the twice-daily flights since the airport opened in 2003. Table 1 shows the flight and passenger records (NAPC 2012).
In this particular LFG, both parties agreed on a maximum payment amount and ranges around the guaranteed load factor, resulting in both parties being exempted from making payments since 2005. For example, in 2005, the target load factor was 64%. However, the government had to pay ANA only when the actual load factor was below 63% and ANA had to pay the government only when the load factor exceeded 65% (NAPC 2010). This paper excluded the maximum payment and the ranges around the guaranteed load factor to develop a more generalised simulation model of a LFG. These factors are specific to Haneda–Noto flights and are not applicable to other flights in Japan (Fukuyama et al. 2009).
Table 1 Historical Haneda–Noto flight data (NAPC 2012)
2005 2006 2007 2008 2009 2010 # of Seats in A/C 166 166 166 166 166 166 # of Passengers 160,052 156,945 158,558 150,365 148,768 132,698 Seats Provided 240,575 241,195 242,517 241,437 239,294 237,705 Average LF 66.5% 65.1% 65.4% 62.3% 62.2% 55.8% Target LF 64% 62% 62% 62% 62% 62%

7
3.3. Model Structure
3.3.1. Flight and Passenger Subsystem
Fig.3 shows the stock and flow diagram (SFD) for a flight and passenger subsystem. There are
two stocks in the model: 1) Accumulated Number of Seats Provided, which generates a supply to the system and 2) Accumulated Number of Passengers, which generates a demand to the system. Average Load Factor is computed using these two stock variables.
An inflow to the stock, Monthly Number of Seats Provided, is computed by the multiple of four variables: Number of Days per Month, Number of Flights per Day, Number of Seats per Aircraft and Operation Reliability. Each variable is set based on the historical data as summarised in Table 2. The monthly supply is accumulated into the stock for 12 months and is repeatedly discarded at the end of a year by Timing of Calculation using the pulse train function of Vensim.
The other inflow to the stock, Monthly Number of Passengers, is computed by summing Monthly Passenger Demand and Subsidized Passenger Demand. Monthly Passenger Demand is set based on the historical data using the lookup function as in Table A1 in Appendix A. We assumed that the demand in the months of May and June 2012 would be same as that in the previous year of May and June, because actual data were not yet available.
Subsidized Passenger Demand is computed using the Demand Adjustment Subsystem, which is explained later. Monthly demand is accumulated into the stock for 12 months and repeatedly discarded at the end of a year. This discard might not be realistic for practical air transport business operations; however, we designed this model to simulate the game between the airline and the airport. At the end of each year, they compute the average load factor for the year to determine payments to the other, and the result does not influence next year’s passenger demand.
Fig.3 Flight and passenger subsystem
3.3.2. Load Factor Guarantee Subsystem
Accumulated Numberof Seats Provided
Accumulated Numberof Passengers
Monthly Number ofSeats Provided
Monthly Number ofPassengers
Number of Seatsper Aircraft
Number of Flightsper Day
OperationReliability
Average LoadFactor
Monthly PassengerDemand
Number of Daysper Month
Discard of SeatRecord
Discard ofPassenger Record
Timing ofCalculation
<Timing ofCalculation>
<SubsidizedPassenger Demand>
Monthly PassengerLookup
<Time>

8
Fig.4 shows the SFD for the LFG subsystem. Two main stocks are used in the model: 1)
Financial Stock of Airline, calculated in Eq.1 and 2) Financial Stock of Airport, calculated in Eq.2. The term Financial Stock means the latest cash position of an airline and airport, which enables evaluation of their financial states by monitoring these stock variables.
An airport pays a Guarantee Fee as calculated in Eq.3 when the Average Load Factor is lower than the Target Load Factor. In contrast, an airline pays a Cooperation Fee as calculated in Eq.4 when the Average Load Factor was larger than the Target Load Factor. Each payment is calculated at the end of a year according to the Timing of Calculation. The unit payment is set based on the historical data, as shown in Table 2.
������������� ������ =�GuaranteeFee − CooperationFee
Eq. Eq. Eq. Eq. 1111
������������� ���� =�CooperationFee − GuaranteeFee
Eq. Eq. Eq. Eq. 2222
!��������� = Ifthenelse(TargetLoadFactor> ./012304526728951, .88;<ulatedNumberofSeatsProvided× DiscrepancyofLoadFactor × UnitPayment× TimingofCalculation, 0)
Eq. Eq. Eq. Eq. 3333
I��������� = Ifthenelse(AverageLoadFactor> K213094526728951, .88;<ulatedNumberofSeatsProvided× DiscrepancyofLoadFactor × UnitPayment × TimingofCalculation, 0)
Eq. Eq. Eq. Eq. 4444
Fig.4 LFG subsystem
Financial Stock ofAirline
Financial Stock ofAirport
Cooperation FeeGuarantee Fee
<Timing ofCalculation>
Unit Payment
<Discrepancy ofLoad Factor>
<Average LoadFactor>
<Target LoadFactor>
<Timing ofCalculation>
<Average LoadFactor>
<Target LoadFactor>
<Accumulated Numberof Seats Provided>

9
3.3.3. Load Factor Adjustment Subsystem
Fig.5 shows the SFD for the Load Factor Adjustment Subsystem. The model contains one stock
variable, Target Load Factor. Each stakeholder negotiates to adjust the Target Load Factor according to the Discrepancy of Load Factor, which depends on the Timing of Calculation. The Target Load Factor is increased when the Average Load Factor is larger than the Target Load Factor in the previous year. In contrast, the Target Load Factor is decreased when the Average Load Factor is lower than the Target Load Factor. The Load Factor Adjustment Rate defines the adjusted discrepancy. Since Actual Adjustment should be integrals, the Reminder is subtracted from the Load Factor Adjustment.
Fig.5 Load factor adjustment subsystem
3.3.4. Demand Adjustment Subsystem
Fig.6 shows the SFD for the Demand Adjustment Subsystem. The demand is adjusted according
to the discrepancy between the Target Load Factor and the Average Load Factor in the previous year and the Demand Adjustment Rate (DAR). We assume that the demand adjustment is conducted by controlling the ticket price with subsidies. Ticket Price Elasticity of Demand is computed in Eq.5 (Murakami et al. 2008, 59–64),
PriceElasticityofDemand(eM) = −(qMOP − qM)/qM(pMOP − pM)/pM
Eq. Eq. Eq. Eq. 5555
where q is demand and p is price. In addition, we assume that Price Elasticity of Demand is fixed throughout the simulation and is set at −0.74 for the baseline simulation (Yamauchi 2000, 195-225). Converting Eq.5, the Required Decrease of Ticket Price is computed as in Eq.6, which defines Subsidy
<Average LoadFactor>
Discrepancy ofLoad Factor
Target LoadFactorIncrease Load
FactorDecrease Load
Factor
<Timing ofCalculation>
Load FactorAdjustment Rate
Load FactorAdjustment
Reminder
Actual Adjustment
<Timing ofCalculation>

10
per Ticket. The total amount of the subsidy is computed using the multiple of Subsidized Passenger Demand and Subsidy per Ticket. The subsidy payment is accumulated in the stock of Accumulated Amount of Subsidy. We evaluate how much an airport and a local government should spend by adjusting the Average Load Factor.
RequiredDecreaseofTicketPrice = −(qMOP − qM) × pMqM × eM
Eq. Eq. Eq. Eq. 6666
Fig.6 Demand adjustment subsystem
Table 2 Parameter assumptions (Source: NAPC, ANA, Ishikawa Prefecture)
Variable name Value Unit Number of Flights per Day 4 Flights Number of Seats per Aircraft 166 (Airbus A320) Seats Number of Days per Month 30 Days Operation Reliability 0.99 Fixed Ticket Price 275 ($1USD = ¥80JPY) USD Unit Payment 75 ($1USD = ¥80JPY) USD Price Elasticity of Demand −0.74 (Yamauchi 2000, 195-225)
4. Results and Discussions
The simulation aims to examine the validity of LFG for airline–airport coexistence in the long
run. We examined four different scenarios: 1) Baseline, 2) Negotiation, 3) Subsidy and 4) Combination. The baseline scenario does not include any measure of the impact on the system. The negotiation scenario includes adjustment to the rate of the guaranteed load factor. The subsidy scenario includes a
Insufficient PassengerDemand to Breakeven
<Average LoadFactor>
<Target LoadFactor>
Fixed Ticket Price
DemandAdjustment Rate
<Monthly PassengerDemand>
Ticket Price Elasticityto Demand
SubsidizedPassenger Demand
AccumulatedAmount of SubsidyPay Subsidy
Subsidy per TicketRequired Decrease ofTicket Price

11
demand adjustment using ticket subsidies. The combination scenario considers both adjustments noted in the negotiation scenario and the subsidy scenario. For each scenario, we run the simulation for 84 months (seven years). The length of the simulation is based on the current practice of the LFG between Noto Airport and ANA after they fixed the fleet size using the Airbus A320 with 166 seats in 2005 (NAPC 2012).
4.1. Baseline Scenario
We set a baseline scenario assuming no load factor adjustment and no demand adjustment. Fig.7a shows Financial Stock and Fig.7b shows Accumulated Payment of the airline and the airport. The movements of each financial stock are horizontally symmetrical because neither party took an adjustment action. In the beginning, the airline continuously pays for the airport because there is adequate air passenger demand. However, the trend begins to change around year five attributable to the increase in demand. Then, the airport has to pay for the airline to fulfil the load factor discrepancy. Both parties sometimes win and sometimes lose; thus, the airline–airport relationship is not a path-dependent system. Although the amount of the payments will probably be balanced in the long run, the airline must bear the negative financial situation for a certain period. This situation might force the airline to decide to withdraw from the entered airway route. We consider some measures to sustain the coexistence of airline and airport.
Fig.7a Financial stock (Baseline Scenario)
Fig.7b Accumulated payment
(Baseline Scenario)
4.2. Negotiation Scenario
Next, we examine the negotiation scenario highlighting the Load Factor Adjustment Subsystem (Fig.5). We assume that each stakeholder negotiates to adjust the Target Load Factor according to the discrepancy of the load factor in the previous year. We implemented a parametric study on the Load Factor Adjustment Rate (LFAR), setting it as 0%, 20%, 40%, 60%, 80% and 100%, without any adjustment on the demand side.
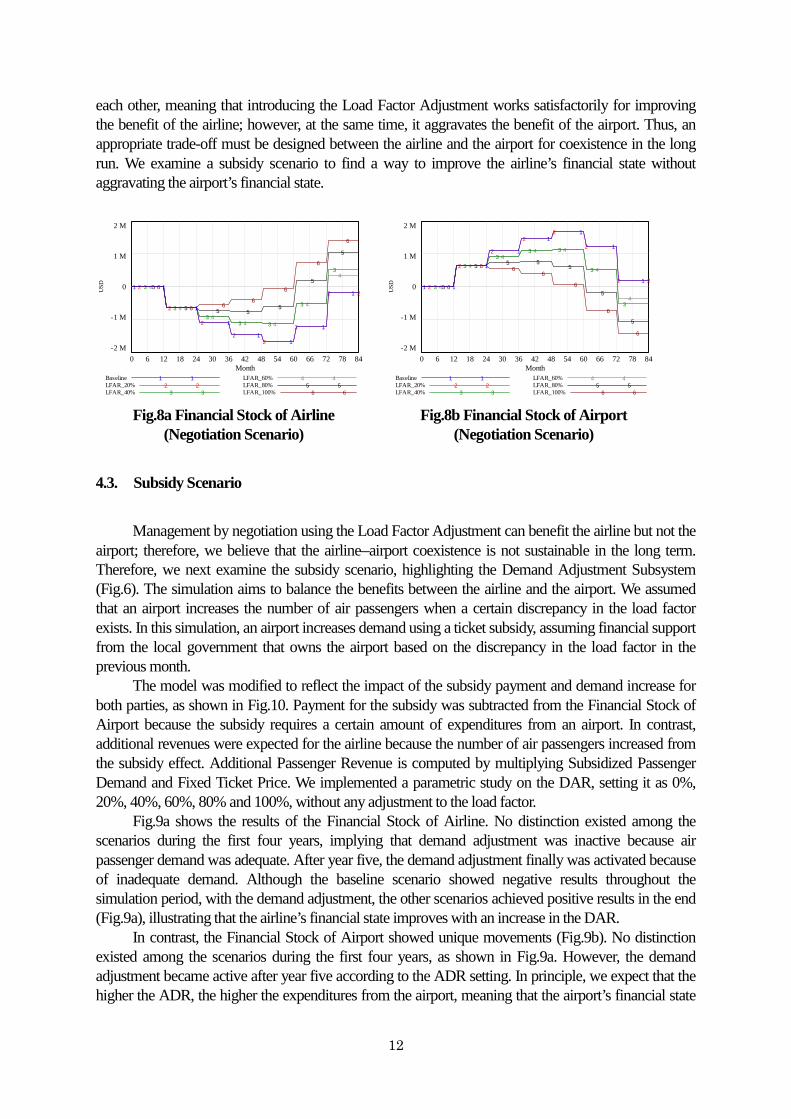
Fig.8a shows the results of the Financial Stock of Airline. No distinction existed among the scenarios during the first two years, implying that the load factor adjustment was inactive given the appropriate design of LFAR according to the expected demand. At 20% of LFAR, although the result was the same as the baseline, we found an incremental improvement when LFAR increased. In contrast, Fig.8b shows the results of the Financial Stock of Airport. Compared with the baseline, although the result had no difference at 20% of the LFAR, it decreased according to the LFAR. This occurrence is contrary to the findings of the airline as previously noted. When the result is positive for the airline, the result is always negative for the airport. The movements were totally symmetrical to
Financial Stock
2 M
1 M
0
-1 M
-2 M
2 2
2 2
2 2
2 22 2
2 2
2 2 21 1 1
1 1
1 1
1 11 1
1 1
1 1
0 6 12 18 24 30 36 42 48 54 60 66 72 78 84Month
US
D
Airline 1 1 1 1 1 Airport 2 2 2 2 2 2
Accumulated Payment
2 M
1.5 M
1 M
500,000
02 2 2 2 2 2 2 2 2 2
2 2
2 2
1 1
1 1
1 1
1 1
1 1 1 1 1 1
0 6 12 18 24 30 36 42 48 54 60 66 72 78 84Month
US
D
Airline 1 1 1 1 1 Airport 2 2 2 2 2 2
12
each other, meaning that introducing the Load Factor Adjustment works satisfactorily for improving the benefit of the airline; however, at the same time, it aggravates the benefit of the airport. Thus, an appropriate trade-off must be designed between the airline and the airport for coexistence in the long run. We examine a subsidy scenario to find a way to improve the airline’s financial state without aggravating the airport’s financial state.
Fig.8a Financial Stock of Airline
(Negotiation Scenario)
Fig.8b Financial Stock of Airport
(Negotiation Scenario)
4.3. Subsidy Scenario
Management by negotiation using the Load Factor Adjustment can benefit the airline but not the
airport; therefore, we believe that the airline–airport coexistence is not sustainable in the long term. Therefore, we next examine the subsidy scenario, highlighting the Demand Adjustment Subsystem (Fig.6). The simulation aims to balance the benefits between the airline and the airport. We assumed that an airport increases the number of air passengers when a certain discrepancy in the load factor exists. In this simulation, an airport increases demand using a ticket subsidy, assuming financial support from the local government that owns the airport based on the discrepancy in the load factor in the previous month.
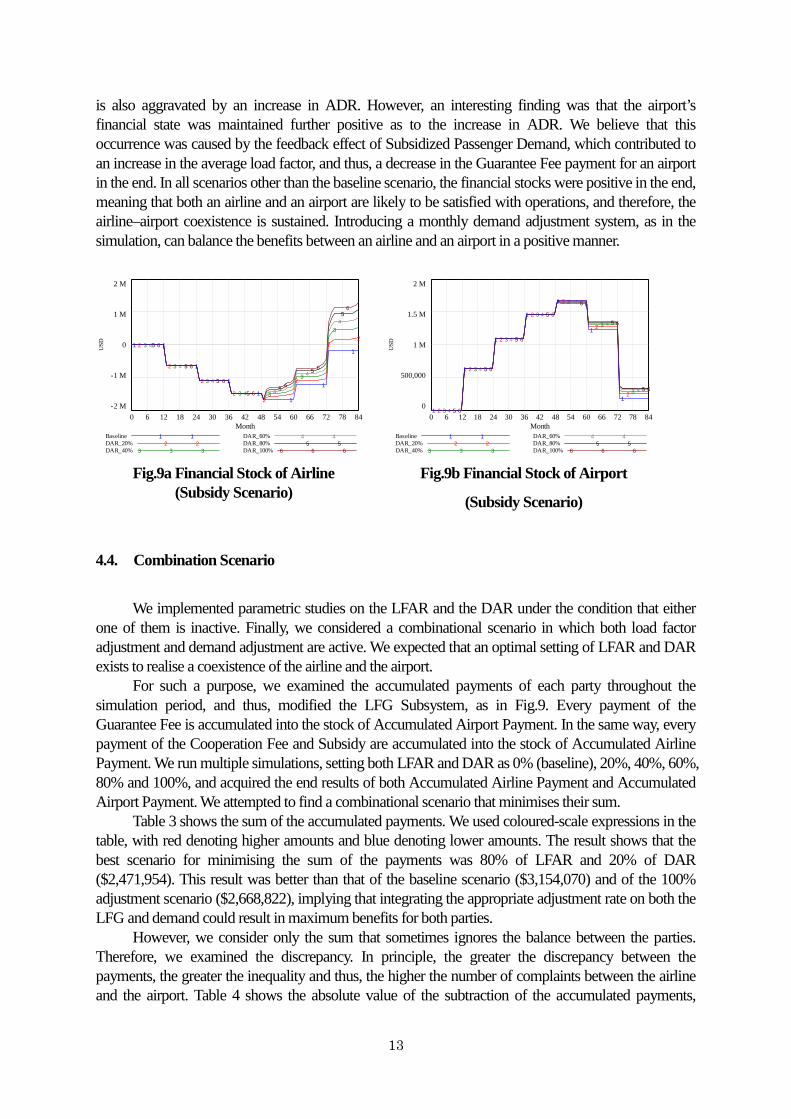
The model was modified to reflect the impact of the subsidy payment and demand increase for both parties, as shown in Fig.10. Payment for the subsidy was subtracted from the Financial Stock of Airport because the subsidy requires a certain amount of expenditures from an airport. In contrast, additional revenues were expected for the airline because the number of air passengers increased from the subsidy effect. Additional Passenger Revenue is computed by multiplying Subsidized Passenger Demand and Fixed Ticket Price. We implemented a parametric study on the DAR, setting it as 0%, 20%, 40%, 60%, 80% and 100%, without any adjustment to the load factor.
Fig.9a shows the results of the Financial Stock of Airline. No distinction existed among the scenarios during the first four years, implying that demand adjustment was inactive because air passenger demand was adequate. After year five, the demand adjustment finally was activated because of inadequate demand. Although the baseline scenario showed negative results throughout the simulation period, with the demand adjustment, the other scenarios achieved positive results in the end (Fig.9a), illustrating that the airline’s financial state improves with an increase in the DAR.
In contrast, the Financial Stock of Airport showed unique movements (Fig.9b). No distinction existed among the scenarios during the first four years, as shown in Fig.9a. However, the demand adjustment became active after year five according to the ADR setting. In principle, we expect that the higher the ADR, the higher the expenditures from the airport, meaning that the airport’s financial state
2 M
1 M
0
-1 M
-2 M
6
6 66
6
6
6
5
5 5 55
5
5
4
4
44 4
4
4
3
3
33 3
3
3
2
2
2
22
2
2 21 1
1
1
11
1
1
0 6 12 18 24 30 36 42 48 54 60 66 72 78 84Month
US
D
Baseline 1 1LFAR_20% 2 2LFAR_40% 3 3
LFAR_60% 4 4LFAR_80% 5 5LFAR_100% 6 6
2 M
1 M
0
-1 M
-2 M
6
6 66
6
6
6
5
55 5
5
5
5
4
4
44 4
4
4
3
3
33 3
3
3
2
2
2
22
2
2 21 1
1
1
11
1
1
0 6 12 18 24 30 36 42 48 54 60 66 72 78 84Month
US
D
Baseline 1 1LFAR_20% 2 2LFAR_40% 3 3
LFAR_60% 4 4LFAR_80% 5 5LFAR_100% 6 6
13
is also aggravated by an increase in ADR. However, an interesting finding was that the airport’s financial state was maintained further positive as to the increase in ADR. We believe that this occurrence was caused by the feedback effect of Subsidized Passenger Demand, which contributed to an increase in the average load factor, and thus, a decrease in the Guarantee Fee payment for an airport in the end. In all scenarios other than the baseline scenario, the financial stocks were positive in the end, meaning that both an airline and an airport are likely to be satisfied with operations, and therefore, the airline–airport coexistence is sustained. Introducing a monthly demand adjustment system, as in the simulation, can balance the benefits between an airline and an airport in a positive manner.
Fig.9a Financial Stock of Airline
(Subsidy Scenario)
Fig.9b Financial Stock of Airport
(Subsidy Scenario)
4.4. Combination Scenario
We implemented parametric studies on the LFAR and the DAR under the condition that either
one of them is inactive. Finally, we considered a combinational scenario in which both load factor adjustment and demand adjustment are active. We expected that an optimal setting of LFAR and DAR exists to realise a coexistence of the airline and the airport.
For such a purpose, we examined the accumulated payments of each party throughout the simulation period, and thus, modified the LFG Subsystem, as in Fig.9. Every payment of the Guarantee Fee is accumulated into the stock of Accumulated Airport Payment. In the same way, every payment of the Cooperation Fee and Subsidy are accumulated into the stock of Accumulated Airline Payment. We run multiple simulations, setting both LFAR and DAR as 0% (baseline), 20%, 40%, 60%, 80% and 100%, and acquired the end results of both Accumulated Airline Payment and Accumulated Airport Payment. We attempted to find a combinational scenario that minimises their sum.
Table 3 shows the sum of the accumulated payments. We used coloured-scale expressions in the table, with red denoting higher amounts and blue denoting lower amounts. The result shows that the best scenario for minimising the sum of the payments was 80% of LFAR and 20% of DAR ($2,471,954). This result was better than that of the baseline scenario ($3,154,070) and of the 100% adjustment scenario ($2,668,822), implying that integrating the appropriate adjustment rate on both the LFG and demand could result in maximum benefits for both parties.
However, we consider only the sum that sometimes ignores the balance between the parties. Therefore, we examined the discrepancy. In principle, the greater the discrepancy between the payments, the greater the inequality and thus, the higher the number of complaints between the airline and the airport. Table 4 shows the absolute value of the subtraction of the accumulated payments,
2 M
1 M
0
-1 M
-2 M
6
6
6
66
6
6
5
5
5
55
5
5
4
4
4
4 4
4
4
3
3
3
3 3
3
3
2
2
2
22
2
22
1 1
1
1
11
1
1
0 6 12 18 24 30 36 42 48 54 60 66 72 78 84Month
US
D
Baseline 1 1DAR_20% 2 2DAR_40% 3 3 3
DAR_60% 4 4DAR_80% 5 5DAR_100% 6 6 6
2 M
1.5 M
1 M
500,000
06
6
6
6
6
6
6
5
5
5
5
5
5
5
4
4
4
4
4
4
4
3
3
3
3
3
3
3
2
2
2
2
2
2
2
1
1
1
1
1
1
1
0 6 12 18 24 30 36 42 48 54 60 66 72 78 84Month
US
D
Baseline 1 1DAR_20% 2 2DAR_40% 3 3 3
DAR_60% 4 4DAR_80% 5 5DAR_100% 6 6 6

14
indicating that the best scenario for minimising the discrepancy is either the baseline scenario or 20% of LFAR and 0% of DAR ($188,850). This result implies that doing nothing or doing the least is better for minimising the inequality between the airline and the airport. However, in both scenarios, the sum of the accumulated payments resulted in the maximum discrepancy (Table.3). If both parties work primarily to minimise the discrepancy, the result is the worst in terms of total payments. Therefore, both parties need to know that the behaviour of the air transport system and the developed SD model contribute to better decision making through simulations.
Fig.10 LFG subsystem (Modified)
Table.3 Sum of accumulated payments of an airline and an airport (USD)
Airline + Airport DAR
0% 20% 40% 60% 80% 100%
LFAR
0% 3,154,070 3,091,140 3,050,650 3,025,710 3,014,800 3,012,140 20% 3,154,070 3,090,660 3,048,150 3,020,480 3,005,200 2,998,850 40% 2,799,110 2,716,090 2,659,580 2,622,120 2,764,490 2,749,770 60% 2,621,630 2,715,470 2,658,050 2,618,520 2,593,720 2,578,390 80% 2,568,234 2,471,954 2,573,774 2,527,379 2,497,624 2,480,304 100% 2,681,812 2,566,042 2,652,592 2,589,172 2,543,352 2,668,822
Financial Stock ofAirline
Financial Stock ofAirport
Cooperation FeeGuarantee Fee
<Timing ofCalculation>
Unit Payment
<Discrepancy ofLoad Factor>
<Average LoadFactor>
<Target LoadFactor>
<Timing ofCalculation>
<Average LoadFactor>
<Target LoadFactor>
<Accumulated Numberof Seats Provided>
Accumulated AirlinePayment
Accumulated AirportPayment
<Pay Subsidy>
Airline Paymenet
Airport Payment
AdditionalPassenger Revenues
<SubsidizedPassenger Demand>
<Fixed Ticket Price>

15
Table.4 Discrepancy of accumulated payments between an airline and an airport (USD)
|Airline–Airport| DAR
0% 20% 40% 60% 80% 100%
LFAR
0% 188,850 251,780 292,270 317,210 328,120 330,780 20% 188,850 252,260 294,770 322,440 337,720 344,070 40% 521,070 437,890 381,080 343,480 485,550 470,530 60% 343,590 437,270 379,550 339,880 314,780 299,150 80% 1,053,506 949,726 1,044,046 990,301 953,196 928,676 100% 1,408,468 1,292,698 1,379,248 1,315,828 1,270,008 1,395,478
5. Conclusions
We discussed management of the airline–airport coexistence using the LFG on the basis of
Haneda–Noto flights in Japan from 2005 to 2011. We examined several scenarios and found that the LFG is effective in maintaining a regional flight when combined with appropriate subsidy levels. Our research showed that only negotiating on a target load factor cannot balance the benefits between an airline and an airport; thus, mutualism for both parties is not sustainable. Integration of the LFG and the monthly demand adjustment is the key to success for airline–airport coexistence. The developed SD model is beneficial for both parties in understanding the interdependency in a business system and the necessity for cooperation to enhance business sustainability.
However, current management practices are contrary to our findings. These practices introduce the LFG only to reduce the business risk to an airline when pursuing a new entry. In Japan, most local governments provide subsidies to maintain unprofitable regional flights, as is often the case throughout the world. However, such a subsidy policy is not optimally integrated with the LFG. For example, for Haneda–Noto flights, the local governments provide ticket subsidies for air passengers; however, the amount of the ticket subsidy is fixed at around USD25 (NAPC 2012) and does not reflect the latest market situation. The fundamental intention of designing the LFG is to primarily introduce a principle that is more market-oriented for managing a regional air transport system (Ishikawa Prefecture). Although integration of a subsidy with an LFG means a temporal financial loss for an airport and a local government, such a measure results most effective in maintaining airline–airport coexistence in the end based on our research results.
The SD model was designed to fit a regional airway in Japan. Although we believe that the model contributes to examining regional airways globally, future research needs to determine this belief. Furthermore, a number of coexistence examples, such as universities and museums, hospitals and pharmacies exist. Our future research will be extended to develop SD models for these different domains and to determine the keys to success in managing their coexistence. References Barrett, S. 2000. ‘Airport Competition in the Deregulated European Aviation Market’. Journal of Air
Transport Management, 6(1):13–27. Feldhoff, T. 2002. ‘Japan’s Regional Airports: Conflicting National, Regional and Local Interests’.
Journal of Transport Geography, 10(3):165–175. Feldhoff, T. 2003. ‘Japan’s Capital Tokyo and its Airports: Problems and Prospects from Subnational
and Supranational Perspectives’. Journal of Air Transport Management, 9(4):241–254.

16
Fukuyama, T., Kagawa, T., and Ikeda, Y. 2009. ‘Analyses on International Airways at Yonago Airport in Japan: Benefit and Bargaining of Local Government’. IATSS Review, 34(1):90–98.
Graham, A. 2003. Managing Airport: An International Perspective. Second Edition. Oxford, U.K.: Elsevier, 8, 203–216.
Grubesic, T., and Matisiw, T. 2011. ‘A Spatial Analysis of Air Transport Access and the Essential Air Service Program in the United States’. Journal of Transport Geography, 19(1):93–105.
Halpern, H. 2010. ‘Marketing Innovation: Sources, Capabilities and Consequences at Airports in Europe’s Peripheral Areas’. Journal of Air Transport Management, 16:52–58.
Hihara, K. 2007. ‘Quantitative Analysis about the Payoffs of “Load Factor Guarantee Mechanism” for Noto Airport’. Journal of Japanese Society of Transport Economics, 51:169–178.
Humphreys, I., Francis, and G. 2002a. ‘Performance Measurement: A Review of Airports’. International Journal of Transport Management, 1:79–85.
Humphreys, I., and Francis, G. 2002b. ‘Policy Issues and Planning of UK Regional Airports’. Journal of Transport Geography, 10:249–258.
Jarach, D. 2005. Airport Marketing: Strategies to Cope with the New Millennium Environment. England: Ashgate Publishing Limited, 1–11.
Kato, K., Uemura, T., Indo, Y., Okada, A., Tanabe, K., Saito, S., Oguma, H., Yamauchi, H., Shiomi, E., Saegusa, M., Migita, K. 2011. Journal of Air Transport Management, 17(2):88-93. March 2011
Lian, J., and Ronnevik, J. 2011. ‘Airport Competition-Regional Airports Losing Ground to Main Airports’. Journal of Transport Geography, 19:85–92.
Lyneis, J. 2000. ‘System Dynamics for Market Forecasting and Structural Analysis’. System Dynamics Review, 16:3–25.
Matsumoto, I. 2007. ‘A Study of the Air Routes and the Airports in 5 isolated Islands in Nagasaki’. Nagasaki Prefectural University Journal, 41(3):111–186.
Miller, B., and Clarke, J. 2007. The Hidden Value of Air Transportation Infrastructure. Technological Forecasting and Social Change, 74:18–35.
Minato, N., and Morimoto, R. 2010. ‘Sustainable Airline Strategy Using Portfolio Theory’. Journal of Air Transport and Management, 17(3):195-198. May 2011
Minato, N., and Morimoto, R. 2011a. ‘Designing Commercial Sustainability of Unprofitable Regional Airport Using System Dynamics Analysis’. Research in Transport Business and Management, 1(1):80–90. August 2011.
Minato, N., and Morimoto, R. 2011b. ‘Policy Design for Sustainable Regional Air Transport Using Load Factor Guarantee’. Japanese Journal of System Dynamics, 10:13–24.
Ministry of Finance (MOF). 2011. http://www.mof.go.jp/jouhou/syuzei/siryou/007.htm, Accessed on 28 June 2012.
Murakami, H., Kato, I., Takahashi, N., Sakakibara, H. 2008. Economics of Aviation. 59-64. Nomura, S., and Kiritooshi, K. 2010. Aviation Globalization and Airport Business. Japan: Doubun-kan,
89–98, 160–161. Noto Airport Promotion Council (NAPC). 2012. http://www.noto-airport.jp/, Accessed on 31 March,
2012. Papatheodorou, A., and Lei, Z. 2006. ‘Leisure Travel in Europe and Airline Business Models: A Study
of Regional Airports in Great Britain’. Journal of Air Transport Management, 12:47–52. Santana, I. 2009. Do Public Service Obligations Hamper the Cost Competitiveness of Regional
Airlines? Journal of Air Transport Management, 15:344–349. Sato, K., Takano, N., Igarashi, H. 1990. ‘Introduction program of regional air transportation’.
Proceedings of Operation Research Society of Japan. Spring 1990. Sterman, J. 2000. Business Dynamics: Systems Thinking and Modelling for a Complex World.
17
U.S.A.: McGraw Hill Higher Education, 192, 229. Suzuki, K., Takano, N., and Sato, K. 1995. ‘A Study of Demand Forecast Model for Commuter
Airlines’. Journal of Japan Society of Civil Engineers, 12:583–594. Williams, G., and Pagliari, R. 2004. A Comparative Analysis of the Application and Use of Public
Service Obligations in Air Transport within the EU. Transport Policy, 11:55–66. Yamauchi, H. 2000. Toward a More Liberal Sky in Japan. Deregulation and Interdependence in the
Asia-Pacific Region. NBER-EASE 8(6):195-225. University of Chicago Press. January 2000. Yoshida, Y., Fujimoto, H. 2004. Japanese-airport benchmarking with the DEA and endogenous-weight
TFP methods: testing the criticism of overinvestment in Japanese regional airport. Transportation Research E, 40:533-546.
Appendix. A
Fig.A.1 Population in Japan (1920–2045)
Source: National Institute of Population and Social Security Research (2010)
-
20,000
40,000
60,000
80,000
100,000
120,000
140,000
19
20
19
25
19
30
19
35
19
40
19
45
19
50
19
55
19
60
19
65
19
70
19
75
19
80
19
85
19
90
19
95
20
00
20
05
20
10
20
15
20
20
20
25
20
30
20
35
20
40
20
45
Pop
ula
tion
(th
ousa
nd
)P
opu
lati
on (
thou
san
d)
Pop
ula
tion
(th
ousa
nd
)P
opu
lati
on (
thou
san
d)

18
Fig.A.2 Governments’ debt ratio to GDP (1995–2010)
Source: Ministry of Finance (2011)
Table.A.1 Monthly passenger demand Source: NAPC (2012)
2005 2006 2007 2008 2009 2010 2011
Jul 12993 13,037 12,598 13,938 12,704 12,780 12,050 Aug 16,370 16,738 15,443 14,612 14,073 14,258 15,149 Sep 12,252 12,141 13,809 12,853 12,405 11,420 13,222 Oct 13,501 14,393 12,394 12,289 12,063 13,371 13,766 Nov 13,321 13,770 13,379 11,711 11,833 12,246 13,342 Dec 13,418 13,054 13,587 12,384 12,244 10,047 11,680 Jan 12,525 13,026 12,166 12,885 11,577 10,752 9,816 Feb 11,645 12,804 11,844 11,661 11,235 10,913 10,560 Mar 15,511 12,776 13,288 13,443 13,209 9,348 11,314 Apr 10,516 10,406 10,253 10,901 9,680 7,237 9,757 May 14,521 11,421 14,711 12,589 13,725 10,792 10,792 Jun 13,920 13,016 14,906 10,811 14,418 10,162 10,162
0
50
100
150
200
250
199
5
199
6
199
7
199
8
199
9
200
0
200
1
200
2
200
3
200
4
200
5
200
6
200
7
200
8
200
9
201
0
%% %%
Japan
USA
UK
Germany
France
Italy
Canada
Japan