system of rice intensification-pilot project - sri -...
TRANSCRIPT

System of Rice Intensification-Pilot Project
National Bank for Agriculture and Rural DevelopmentJharkhand Regional Office

NABARD InitiativesNABARD along with leading CSOs, Sir Dorabji Tata Trust (SDTT), Watershed Support Services and Activities Network (WASSAN), Professional Assistance for Developmental Action (PRADAN) worked out a model for coverage of large number of farmers under SRI in every state in the country in 2010.
NABARD, Jharkhand RO, launched a program with 52 projects, to cover 30000 farmers during 2010-2012, with the support of 5 Resource Agencies (RAs) and 49 Project Implementing Agencies (PIAs), spread across 23 of the 24 districts of the state
It adopted a model covering 600 farmers by each PIA, with an area of about 150 acre @ 0.25 ac per farmer and 25 farmers per village over two years

The salient features of the project
Mainstreaming technology adoption.
Awareness creation & capacity building of PIAs and the famers through conduct of appropriate programs & supply of training kits, publicity materials etc
In-situ pilot demonstrations
Provision of critical inputs & implements (weeder and sprayer)
Five experienced and technically qualified NGOs to act as ‘Resource’ Agencies
The salient features of the project
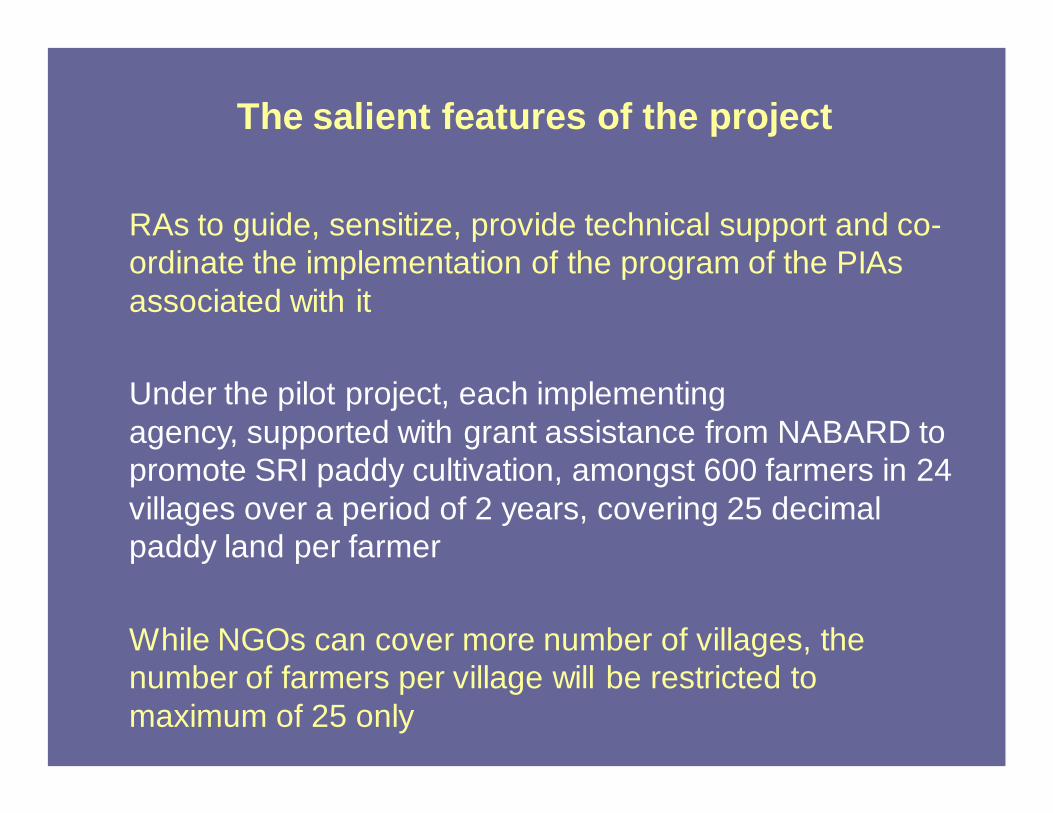
RAs to guide, sensitize, provide technical support and co-ordinate the implementation of the program of the PIAs associated with it
Under the pilot project, each implementing agency, supported with grant assistance from NABARD to promote SRI paddy cultivation, amongst 600 farmers in 24 villages over a period of 2 years, covering 25 decimal paddy land per farmer
While NGOs can cover more number of villages, the number of farmers per village will be restricted to maximum of 25 only

The salient features of the project
The RAs to train the implementing NGOs regarding operational aspects of the scheme, SRI techniques in detail, provide promotional material in print form, flip charts, audio visuals, etc.
Implementing NGOs required to adhere to a uniform code of implementation including farmer wise monitoring system and MIS reporting
As per the model project, the grant assistance for coverage of 200 farmers/PIA in year I was Rs.3.45 lakhs and for year II it was Rs.6.51 lakhs to cover 400 farmers

Project Components
Implementing NGOs were required to form Farmers Clubs in each village where the scheme was being implemented for which the NGOs were supported under NABARD scheme for Farmers Club
Implementing NGOs were also required to form Joint Liability Groups (JLGs) of farmers for availing crop loans (KCC) from banks. NGOs are eligible for grant assistance from NABARD for formation of JLGs.
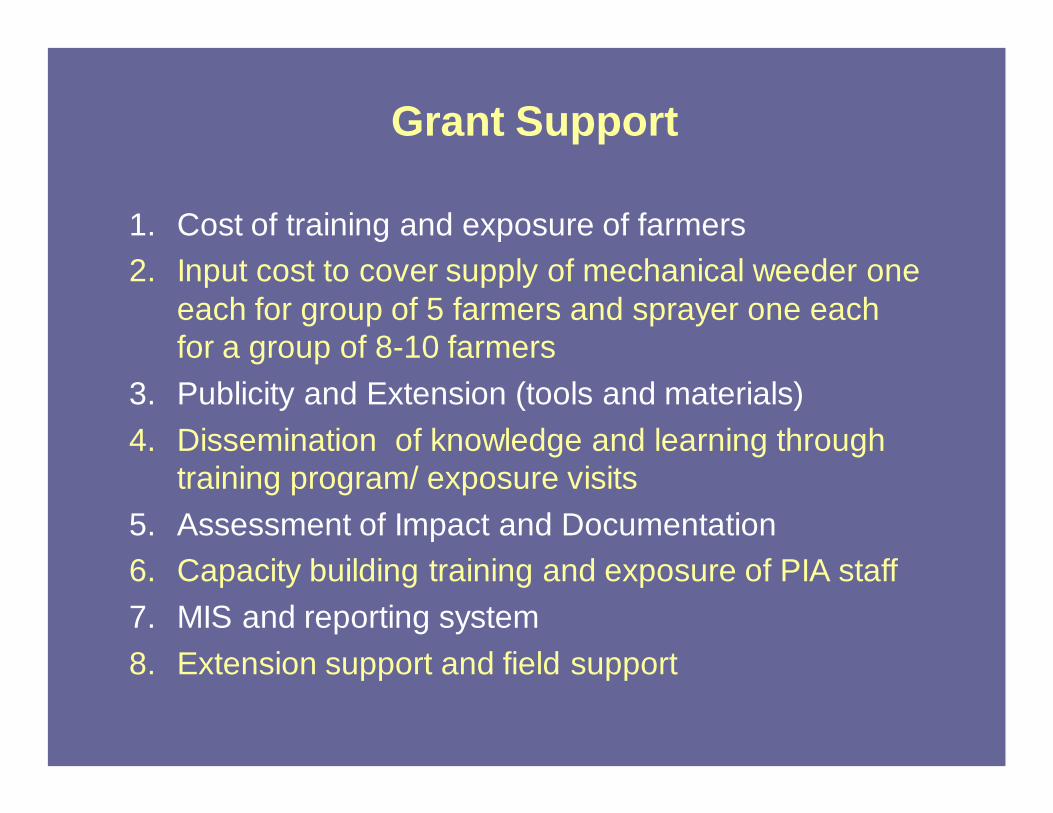
Grant Support
1. Cost of training and exposure of farmers2. Input cost to cover supply of mechanical weeder one
each for group of 5 farmers and sprayer one each for a group of 8-10 farmers
3. Publicity and Extension (tools and materials)4. Dissemination of knowledge and learning through
training program/ exposure visits5. Assessment of Impact and Documentation6. Capacity building training and exposure of PIA staff7. MIS and reporting system8. Extension support and field support

Project Targets
Project Period: 2010-2011
No of Farmers to be covered: 33000
Area coverage: 8250 acre
Coverage of Districts: 23

Resource Agencies
1. Professional Assistance for Development Assistance (PRADAN), Ranchi
2. Society of Promotion of Wastelands Development, Ranchi
3. Gene Campaign, Ranchi4. Net work for Enterprise Enhancement and
Development Support (NEEDS), Deoghar5. Collectives for integrated Livelihood Initiatives
(CiNi), Jamshedpur, East Singhbhum

Coverage of Farmers & Area
2010: 5195 farmers2011: 28975 farmersTotal: 34170 farmers
2010: 7243 acre 2011: 1184 acre Total: 8427 acre
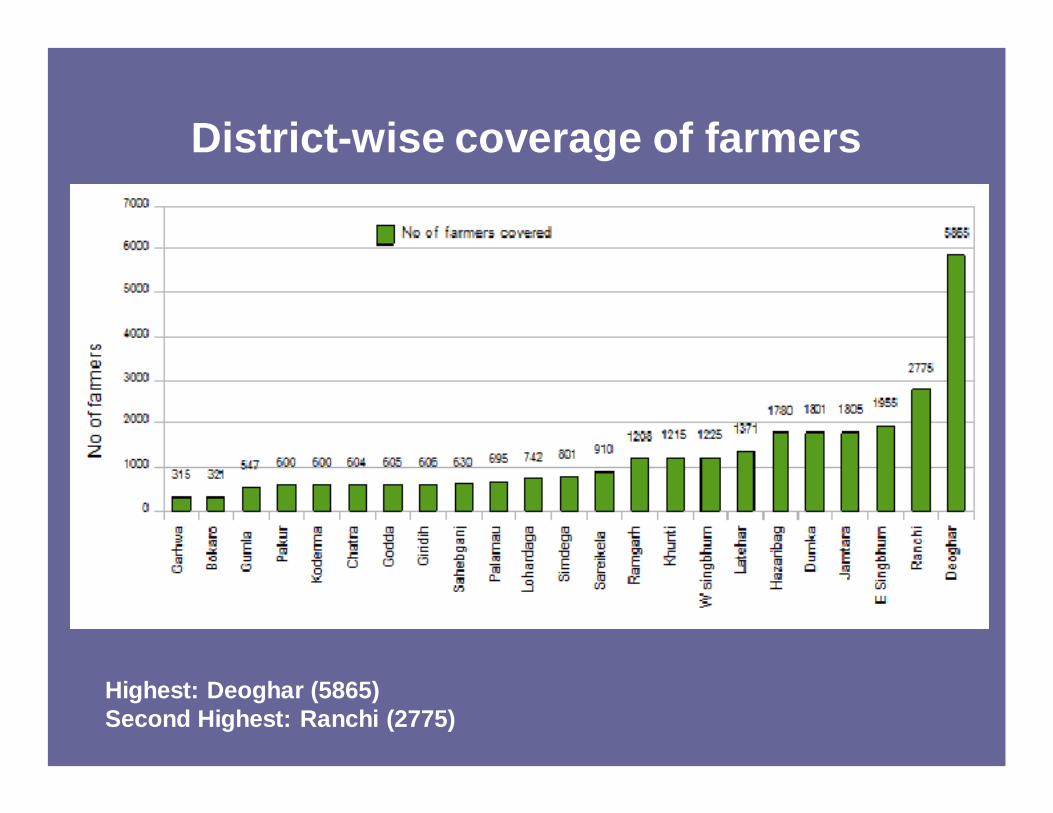
District-wise coverage of farmers
Highest: Deoghar (5865)Second Highest: Ranchi (2775)
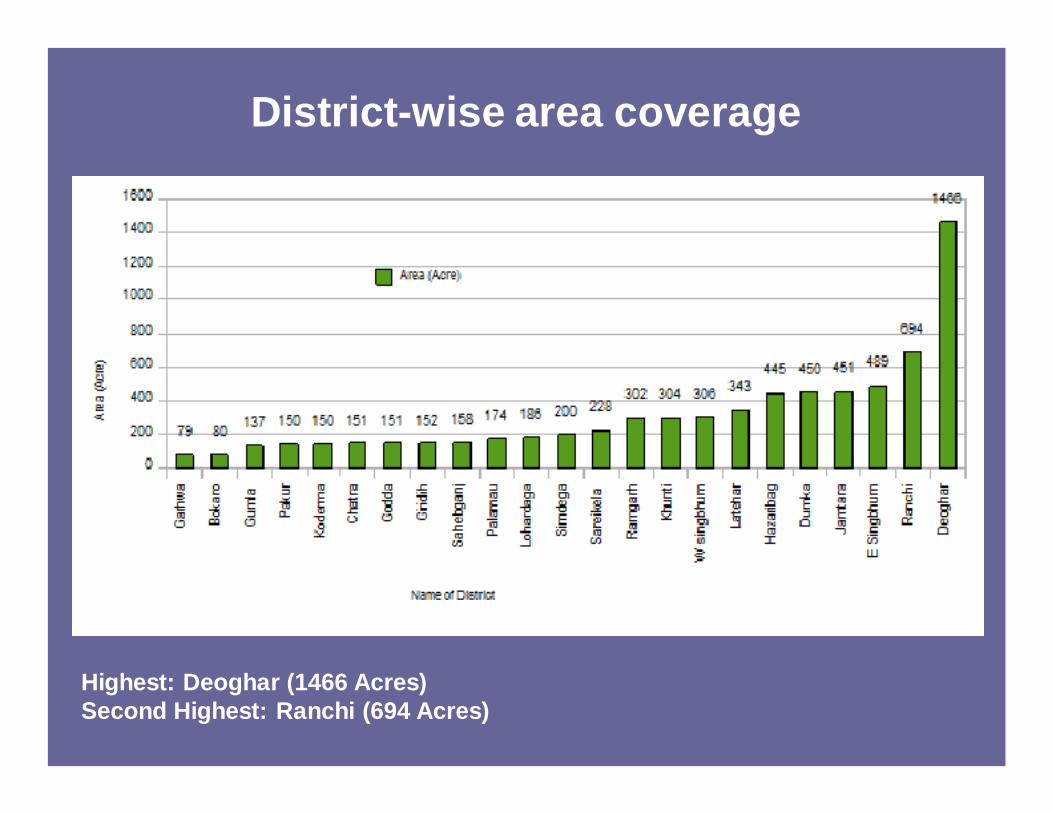
District-wise area coverage
Highest: Deoghar (1466 Acres)Second Highest: Ranchi (694 Acres)

Yield Attributes
Effective TillersT: 11; SRI: 32 (Nos./Hill)
Grains / PanicleT: 115; SRI: 185 (Nos./Panicle)

Yield Attributes
Grain YieldT: 35.49; SRI: 69.54 (Q/Ha)
Straw Yield T: 44.22; SRI: 71.68 (Q/Ha)

Land type-wise yield attributes
Effective Tillers Grains / Panicle

Land type-wise yield attributes
Grain Yield Straw Yield

Variety-wise grain yield in Upland Yield in Q/Ha

Variety-wise grain yield in Midland
Yield in Q/Ha

Variety-wise grain yield in Midland
Yield in Q/Ha

Variety-wise grain yield in Midland
Yield in Q/Ha

Variety-wise grain yield in Lowland
Yield in Q/Ha

Results
Land Holding (Acre)
Average Holding
No of Days of food security
(Acre) SRI Traditional
Add. food security
0‐1 0.66 323 168 155
1‐2 1.79 894 348 546
> 2 3.73 1838 729 1109

Results
Table 19. Cost-Benefit Analysis
Lowland
Components Rate/kg
Traditional SRI Producti
on in kg/acre
Income Production in
kg/acre
Income
Income from Grain (in kg)
10 1,385 13,846 2,652 26,518
Income from Straw (in kg)
3 1,704 5,113 3,502 10,506
Total Income 18,960 37,024 Cost of Cultivation 12,500 12,465 Benefit-Cost Ratio (Total income / total expenditure)
1.52 2.97

Results
Cost-Benefit Analysis
Midland
Components Rate/kg
Traditional SRI Productio
n in kg/acre
Income Production in
kg/acre
Income
Income from Grain (in kg)
10 1,182 11,822 2,377 23,765
Income from Straw (in kg)
3 1,830 5,490 3,300 9,899
Total Income 17,312 33,664 Cost of Cultivation 12,500 12,465 Benefit-Cost Ratio (Total income / total expenditure)
1.38 2.70

ResultsCost-Benefit Analysis
Upland
Components Rate/kg
Traditional SRI Producti
on in kg/acre
Income
Production in
kg/acre
Income
Income from Grain (in kg) 10 502 5,020 960 9,595
Income from Straw (in kg) 3 512 1,656 1,050 3,150
Total Income 6,676 12,745
Cost of Cultivation 5,800 8,435
Benefit-Cost Ratio (Total income / total expenditure)
1.15 1.51

Results Cost of cultivation (traditional vs. SRI) In upland, midland and lowland
Sr No. Particulars
Cost of cultivation in midland & lowland
(in Rs/acre) Cost of cultivation in upland (in Rs/acre)
Traditional SRI Traditional SRI 1 Inputs 3,120 4,405 2,260 3,405
2 Labour component
a. Human labour 6,680 5,600 2,640 3,920
b. Animal resource 1,500 1,500 900 900
3 Machinery rental 1,200 960 0 210
4
Total expenditure on production (1+2+3) 12,500 12,465 5,800 8,435

Thank You