system status briefing - eskom.co.za · system status briefing phakamani hadebe group chief...
TRANSCRIPT

System Status Briefing
Phakamani Hadebe
Group Chief Executive
16 November 2018

1
Operational performance
3 Future outlook
Conclusion
4
2
Summary of system performance
9 point recovery plan
5
Contents

While Distribution, Transmission and Koeberg are operating efficiently, the rest of Generation faces operational challenges
Summary of Eskom system performance
While Distribution, Transmission and Koeberg are operating efficiently, the rest of Generation
faces operational challenges
Causes:
• Deterioration of coal fired power stations
• 10 stations with less than 20 coal stock days, as per grid code requirement
• While inherent, other challenges happened in our midst
Outcome:
• Increased utilisation of emergency resources (OCGT’s1, interruptible load shedding and
demand response)
Manifestation of the above:
• EAF FY19 is 74.2%, is currently inadequate
• Current system status is therefore not optimal
While we have a recovery plan, load shedding cannot be ruled out for the remainder of 2018
South Africans can support by reducing their usage, especially at peak times
1
3
4
1.OCGT – Open Cycle Gas Turbine, 2. EAF - Energy Availability Factor . As at end October ’18 ,
3. Current financial year ends In March 2019
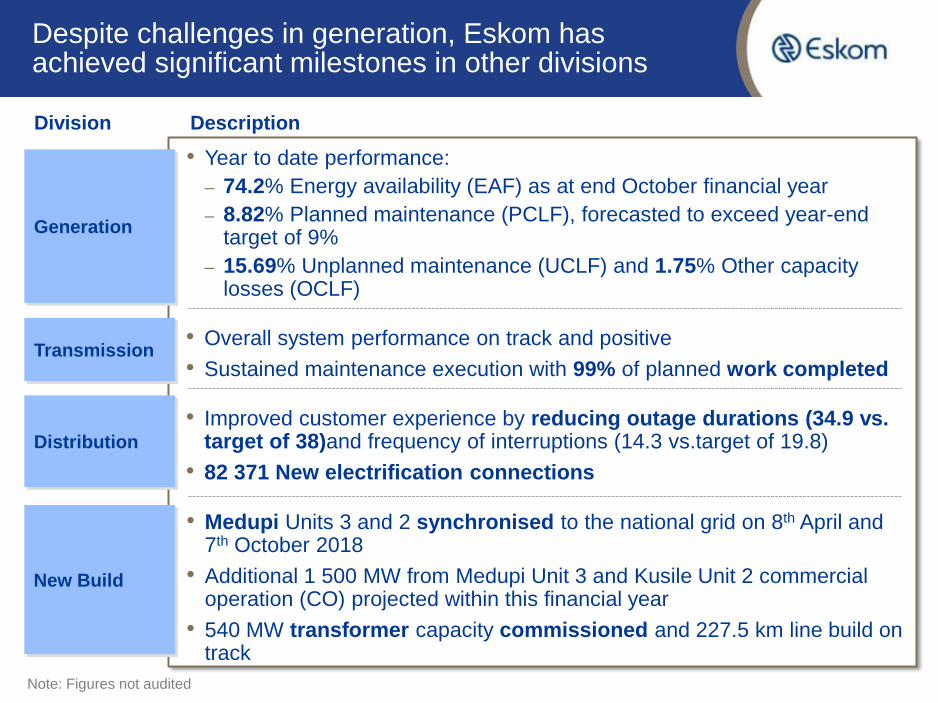
Despite challenges in generation, Eskom has achieved significant milestones in other divisions
Description
Generation • Year to date performance:
‒ 74.2% Energy availability (EAF) as at end October financial year
‒ 8.82% Planned maintenance (PCLF), forecasted to exceed year-end target of 9%
‒ 15.69% Unplanned maintenance (UCLF) and 1.75% Other capacity losses (OCLF)
Division
Transmission
New Build
• Medupi Units 3 and 2 synchronised to the national grid on 8th April and 7th October 2018
• Additional 1 500 MW from Medupi Unit 3 and Kusile Unit 2 commercial operation (CO) projected within this financial year
• 540 MW transformer capacity commissioned and 227.5 km line build on track
Distribution
Generation
• Overall system performance on track and positive
• Sustained maintenance execution with 99% of planned work completed
• Improved customer experience by reducing outage durations (34.9 vs. target of 38)and frequency of interruptions (14.3 vs.target of 19.8)
• 82 371 New electrification connections
Note: Figures not audited

The Capacity Outlook is based on planned outages and the ‘Tetris’ chart assists in optimising outage schedules
Source: Tetris Plan V4.37 – 15 November 2018
20000
25000
30000
35000
40000
45000
50000
Nov Dec Jan Feb Mar
2018 2019
Available Capacity Gas units Operating Reserves PCLF UCLF Peak Demand Installed Capacity
Summer UCLF
7000 MW Summer UCLF
7500 MW UCLF
PCLF
Operating Reserve
Available Capacity
Gas
5300 MW
Average Planned Maintenance (PCLF)
To accommodate the anticipated planned maintenance, OCGT’s will likely be required for most months up
until March 2019.

9 Point
Recovery Plan
However, Generation availability has deteriorated to below what we aspired to achieve
Percentage (%)
*Year to date figures.
FY 2019 Performance data unaudited and subject to change
EAF higher in winter due to lower levels of planned maintenance
9.2 8.8 7.2 5.3 7.5 9.9 8.6
Ja
n ’18
14.8
3.2
11.8
15.3
16.6
69.7
2.5 0.7
14.5
2.6
15.3 12.7
70.2 78.2
Ap
r ’1
8
Fe
b ’1
8
16.6
2.8
11.1
15.7
69.6
14.4
Ma
r ’1
8
0.8
74.0
16.0
76.1
1.7
Ma
y ’18
14.2 15.4
76.2
Ju
n ’18
Ju
l ’1
8
1.7
73.7 A
ug ’18
2.2
72.3
Sp
et ’1
8
3.5
Oct
’18
69.4
1.9
74.2
FY
19
*
12.3
UCLF OCLF EAF PCLF
Contributing factors
• Undesired coal quality
• Recent strikes
• Financial and capacity
constraints leading to
minimal refurbishments
and maintenance on
ageing fleet
• Outage execution
(overruns)
• Ops and maintenance
skills – availability and
training
• Maintenance cost
decreased in past five
years leading to
unsustainability
Generation performance for the 2019 financial year

7
Build-up of UCLF for FY19 from major contributors
0.44
1.56
1.61
0.93
1.33
2.79
14
15
16
13
12
4
5
2
0
3
1
12.12
5.64 15.29
Partial load loss
Boiler tube leaks
Full load loss
Outage Slip
13.68
0.14
6.49
Total unplanned losses (UCLF)
Full and partial losses were the highest contributors with a total of 12.12% of total UCLF for FY19 YTD
Outage slips contributed 1.56% to the total UCLF
Boiler tube leaks also contributed significantly at 1.61% of total UCLF
UCLF DV 4 KR 2 GV 2 LT 5
Note: All figures are year to date and unaudited
Source: Generation UCLF performance Analysis FY2019 YTD (14 Nov 2018 – unaudited data)
Key insights
Major incidents, as well as full and partial losses were key contributors to the increase in unplanned losses
Percentage (%)

A 9 point recovery plan has been put in place to address our key operational challenges
Fixing coal stock piles
Prepare for increased
OCGT usage
Fixing human capital
Prepare for rain
Fixing new plant
Fixing outage duration
and slips
Fixing units on long-
term forced outages
Fixing full load losses
and trips
Partial losses and
Boiler tube leaks
1
3
4
2
5
7
8
6
9

Fixing new plant – To reduce Full load losses from 2.79%
1
• New build units are expected to have initial unreliability.
• Especially Kusile, unreliability is even higher than expected.
• Experience from previous new builds (Majuba and Kendal) showed high initial
unreliability followed by excellent performance
• Spending on addressing known design errors
• 1.5 billion Capex investment
• Established an expert SWAT team to guide recovery
Objectives
State of new units
Source: Wikipedia, Bathtub curve

10
Fixing full load losses and trips - To reduce Full load losses from 2.79%
2
Process
Actions
• Relinking: a shift from centrally led approach
• Improve usage of Local Purchase Orders at site level
Maintenance
(Online and
Offline)
• Maintenance Effectiveness Assessments (MEAs) for
online and offline works
• Spares management optimisation
• Complete project to improve maintenance strategies and
work packages
Optimize
procurement
processes to
enable swifter
purchases when
required
Improve planning,
execution and
effectiveness of
maintenance
Objective Description

11
Fixing units on long-term forced outages - To
reduce impact of major incidents on UCLF 3
Lethabo
Unit 5
(600MW)
• High Pressure (HP) steam pipe failure on 10 October ‘18
• Investigation ongoing so required scope on HP pipework not
yet defined
• Planned outage scope to be executed during repair time
Grootvlei
Unit 2
(200 MW)
• Auxiliary steam range pipe burst on 26 January ‘18
• Also experience Generator issues
• Initial delay due to funding constraints
Kriel
Unit 2
(600MW)
• Stator earth fault on 03 May ‘18
• Spare generator stator now on site (insurance and
commercial process delays)
• Next planned outage being executed during repair time.
Duvha
Unit 4
(600MW)
• On 23 August ‘17, turbine tripped on generator stator earth
fault
• Duration due to long lead-time for major components
Description
Repair time
between 6 and 12
months
24 November
2018
30 April 2019
6 November 2018
Expected return date

Source: GPSS outage schedule for coal fleet (Nov 2018)
4 Fixing partial load losses - To reduce partial losses and boiler tube leaks
• 59 outages are planned for the
coal fleet between Sep ’18 and
Dec ‘19 to address PLL’s and
maintain critical plant systems
• Next 12 months funding plan:
‒ R11,5b Capex
• 12 to 24 months funding plan:
‒ R8.2b Capex
Key insights:
Planned outages for coal fired generating fleet until Nov ‘19

Fixing partial load losses includes addressing major contributors per plant and system
Generation UCLF performance per plant and system for FY19 (YTD)
Key Insights from analysis of YTD partial load losses
• Arnot, Kendal and Duvha contribute ~50% to the total Partial Load Losses
• Draught Plant and Gas Cleaning contribute about 55% to the total Partial Load Losses YTD
4
Percentage (%)

14
Fixing outage duration and slips to reduce contribution to UCLF from 1.56%
5
Offline maintenance (outages)
• Allocate specialist resources at each station for additional
focus on:
• Drive Rotek outage performance improvement in 4 focus
areas: Enabling contracts, personnel skills, spares management
and quality
• OPEX and CAPEX funds need to be available early
(Oct in previous year) to execute works effectively
Improve
outage
planning
and
execution
performance
to improve
PCLF
Objective Description
Up front
planning
Outage
readiness
Execution
quality

Fixing Human Capital to improve operations
15
6
Human Capital Initiatives
Make appointments in critical positions
• Appoint permanent Power Station Managers and
their critical subordinates
• Relinking and relocation of Commercial and Human
Resources personnel to Generation to keep
accountability at Generation group level
• Internal recruitment plan initiated, plan to effect
appointments 1 February 2019

16
Prepare for increased OCGT usage 7
INCREASE OCGT
USAGE
1. Fixing partial load
loses
2. To minimise risk of
load shedding or
reduce degree of
load shedding if
unavoidable
Budget:
• R 750m to R 1bn
forecast by end of
March 2019
• This does not
include OCGT
usage to mitigate
for risk of rain
Excerpt of OCGT historical performance Recovery plan

Prepare for rain
17
Measures are in place to reduce the impact of the rain season and in
compliance with the various power stations Wet Coal Handling Procedures
8
• At least 3 days strategic stockpiles for use during
sustained rainfall at all critical power stations
• Procedures in place for how and when to use strategic
stockpiles
• Ensure adequate fuel oil stocks for combustion
support when coal is wet
• Funding available and diesel supply assured for
extended OCGT usage in case required for system
support
Strategic
Stockpiles
Procedures
Fuel Oil
OCGT usage
1
3
4
2

Fix Coal Stockpiles to recover 10 stations that fell below Grid code requirement
9a
Focus area
Challenge
Stock days
Description
‒ 10 power stations below the Grid Code requirement of 20 days
‒ 5 of the 10 stations are below the minimum (<10 days of coal stock)
‒ Total stock days1 was 25.6 days as at 15 November 2018
‒ It is projected to grow to 28.2 days by 31 March 2019 from existing
and new signed contracts, ending with 6 stations still below the Grid
Code.
‒ It is projected that stations will reach expected level between September
2019 and February 2020
10 Stations
impacted
Risks
‒ Risk of rain
• Mitigations in place include compacted dry strategic stockpiles
1. Excluding Medupi and Kusile 2. NERSA has been duly informed as required by the Grid Code
‒ Arnot, Camden, Duvha, Hendrina, Komati, Kriel, Kendal, Majuba, Matla,
and Tutuka
‒ All in Mpumalanga Province

Coal shortages are a result of a number of factors 9b
Initial shortages in 2017 And long term reasons… As a result of short term reasons…
• Levels improved until
October ‘17
• Majuba and Tutuka fell
below Eskom minimum
but were above the Grid
Code required level of
20 days
• Total system coal stock1
was more than 40 days
• Decline started in
November ‘17 due to
undersupply from
existing suppliers and
long period to conclude
new coal contracts
• In 2018 only 8.3 Mt of required 12.2 Mt
coal was contracted & supplied
• 6 Mt cost plus mines undersupply due to
lack of capital investment
• Increased burn at stations with low stock
levels – low EAF at stations with sufficient
coal
• 750 Kt per month/8.5 Mt per annum coal
supply stoppage when 3 collieries2 were
placed under business rescue in
February 2018.
• Impact to date is 5.7Mt unplanned
shortfall 3
• We have diverted coal from other stations
to Hendrina and Komati. These stations
received 100% of their coal supply from
Optimum and Koornfontein
• Inability to renew
/conclude long-term
contracts with Arnot,
Optimum and New Largo
• Procurement process
takes ~1 year to conclude
• Lack of capital investment
in cost plus results in
reduced production
• Limited investment in
opening new mines
1. Excluding Medupi and Kusile 2. Optimum, Koornfontein and Brakfontein collieries 3. equivalent to 15 system stock days

Progress on 4 Mt urgent procurement
National Treasury engaged on process to
execute urgent procurement
Eskom then issued 2 requests to all existing
suppliers for above maximum contractual
supply and alternative coal offers
~4 Mt coal offered to be supplied above
max level of existing contracts over 11
months
Confirmation of supply above max coal on
existing contract issued for commencement
More than 30 Mt of alternative coal offered
for supply in excess of two years
3.2 Mt coal from offers can be delivered
within four months against 4 Mt target
Alternative coal offers are subject to
National Treasury approval
First coal expected December 2018
27 new coal contracts
have been concluded
between January 2018
and October 2018 for
supply of 15.8 Mt in the
current financial year.
Total contracted volume
is 73 Mt (need 116
Mt/annum)
Additional contracts in
the pipeline are at
advanced tender stage
Limited transfer of
Medupi coal by road has
commenced
1.4 Mt per annum Medupi
coal transfer by rail is
planned to commence in
Dec 2018
Short term provisions Fast tracking recovery
Eskom is executing
urgent purchasing of 4
Mt for immediate supply
to recover all power
stations to above
minimum level by 31
March 2019.
Success in procuring this
coal will see system stock
increasing to 36.3 days
by 31 March 2019
Only 1.1 Mt of the
required 4M t through
urgent procurement is
currently firm
Progress to date on short term coal stock recovery and recovery acceleration
9c

Simulating the inclusion of 4Mt potential emergency coal shows an increase in total stock days
21 Source: November 2018 Supply Plan (02Nov2018) v1A Including Pipeline sources
9d
• The success of sourcing the urgent 4Mt will see all stations reaching healthy alarm level and 36.3 system stock days by
March 2019 – work in progress
• Only 1.1 Mt of the required 4M t through urgent procurement is currently firm
• The 2.9 Mt balance is still to be contracted through the urgent procurement process for first coal in December 2018
Key insights
Simulating the
inclusion of 4Mt
potential
emergency coal
shows an increase
in total stock days
on 31 March 2018
to 36.3 days from
the 28.2 days
reflected in the
recovery plan
Actual and forecasted stock days for total system between Jun ’17 and Mar ‘20

Our strategy is to revert coal supply to dedicated long term coal contracts
Coal strategy
Eskom Long Term Coal Strategy revised to revert Eskom’s coal supply to
dedicated long term coal contracts for the life of the stations, with preference for
conveyor delivered coal.
• Cost plus contract extension to match power stations life and utilize the
dedicated coal reserve for supply to other power station
• Reinvestment in cost plus mines to enable contractual supply and more
• Extension of existing long term fixed price contracts for designated power
stations and options to supply other power stations
• Coal Open Tender to source uncontracted coal for the life of power stations
• Transnet to provide rail solutions for Eskom on Build, Own, Operate basis –
Eskom to focus on core business (generation and supply of electricity)
1
2
3
4
5
9e

In conclusion, the 9-point system recovery plan aims to return EAF to 75% by November 2019
Eskom’s 9 point plan aims to achieve 5 key objectives
We are currently implementing a 9-point system recovery plan that will return EAF
to 75% by November 2019.
This will result in:
A robust emergency procurement process that will shorten maintenance
restoration times
Significant head-way in returning long-term outage plants back to service
Reduction in full load losses (FLL’s) and partial load losses (PLL’s)
Critical vacancies filled in Generation
Coal stock levels returned to grid code heights

Comparison of aspirational versus achievable YTD EAF for Nov ’18- Nov ‘20
77.0
75.5
0.0
Sep 20
73.5
Mar 20 Sep 19 Jul 19
76.5
75.0
Jan 21 Jan 19
76.0
Nov 18 Mar 19 Jan 20
77.5
Nov 19 May 20
74.0
Nov 20 Mar 21 Jul 20
74.5
May 19
Aspirational
YTD Trend
YT
D E
AF
(%
)
Probable
YTD Trend
Source: Generation EAF improvement estimates required to achieve 78% by FY2021
Nov ‘18 Nov ‘19 Nov ‘20
75.8%
75.1%
Arrest EAF
deterioration
and plan for
EAF recovery
77.1%
76.3%
EAF improvements
based on 80% of
aspirational trends
The recovery plan is forecasted to improve EAF, and extra
effort will be made to get closer to our aspiration
Based on analysis and the recovery plan, the green line is the aspirational recovery trend while the red line represents the
most likely recovery trajectory.

Backup
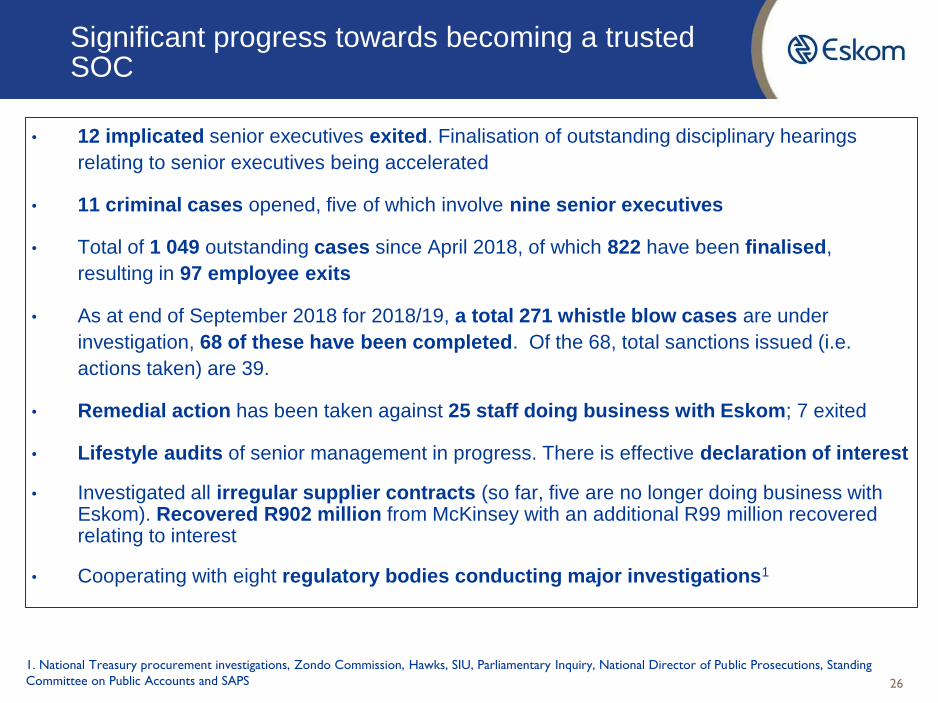
• 12 implicated senior executives exited. Finalisation of outstanding disciplinary hearings
relating to senior executives being accelerated
• 11 criminal cases opened, five of which involve nine senior executives
• Total of 1 049 outstanding cases since April 2018, of which 822 have been finalised,
resulting in 97 employee exits
• As at end of September 2018 for 2018/19, a total 271 whistle blow cases are under
investigation, 68 of these have been completed. Of the 68, total sanctions issued (i.e.
actions taken) are 39.
• Remedial action has been taken against 25 staff doing business with Eskom; 7 exited
• Lifestyle audits of senior management in progress. There is effective declaration of interest
• Investigated all irregular supplier contracts (so far, five are no longer doing business with Eskom). Recovered R902 million from McKinsey with an additional R99 million recovered relating to interest
• Cooperating with eight regulatory bodies conducting major investigations1
1. National Treasury procurement investigations, Zondo Commission, Hawks, SIU, Parliamentary Inquiry, National Director of Public Prosecutions, Standing
Committee on Public Accounts and SAPS 26
Significant progress towards becoming a trusted SOC