system study: auxiliary feedwater 1998 2018
TRANSCRIPT
The INL is a U.S. Department of Energy National Laboratory operated by Battelle Energy Alliance
INL/EXT-19-56439
System Study: Auxiliary Feedwater 1998–2018
Zhegang Ma Kellie J. Kvarfordt John A. Schroeder Thomas E. Wierman December 2019
NOTICE
This information was prepared as an account of work sponsored by an agency of the U.S. Government. Neither the U.S. Government nor any agency thereof, nor any of their employees, makes any warranty, express or implied, or assumes any legal liability or responsibility for any third party’s use, or the results of such use, of any information, apparatus, product, or process disclosed herein, or represents that its use by such third party would not infringe privately owned rights. The views expressed herein are not necessarily those of the U.S. Nuclear Regulatory Commission.
INL/EXT-19-56439
System Study: Auxiliary Feedwater
1998–2018
Zhegang Ma1, Kellie J. Kvarfordt1, John A. Schroeder2, Thomas E. Wierman2
Update Completed December 2019
1Idaho National Laboratory, Risk Assessment and Management
Services Department, Idaho Falls, Idaho 83415
2Schroeder Incorporated, 3945 Wise Owl Way, Island Park, Idaho 83429
http://www.inl.gov
Prepared for the Division of Risk Assessment
Office of Nuclear Regulatory Research U.S. Nuclear Regulatory Commission
NRC Agreement Number NRC-HQ-14-D-0018

System
Study 2018 Update
Auxiliary Feedwater December 2019
iii
ABSTRACT
This report presents an unreliability evaluation of the auxiliary feedwater
(AFW) system at 69 U.S. commercial nuclear power plants. Demand, run hours,
and failure data from calendar year 1998 through 2018 for selected components
were obtained from the Institute of Nuclear Power Operations (INPO) Industry
Reporting and Information System (IRIS), formerly the INPO Consolidated
Events Database (ICES). The unreliability results are trended for the most recent
10-year period while yearly estimates for system unreliability are provided for
the entire active period. No statistically significant increasing or decreasing
trends were identified in the AFW results.

System
Study 2018 Update
Auxiliary Feedwater December 2019
iv
System
Study 2018 Update
Auxiliary Feedwater December 2019
v
CONTENTS
ABSTRACT ................................................................................................................................................. iii
ACRONYMS .............................................................................................................................................. vii
1. INTRODUCTION ................................................................................................................................ 1
2. SUMMARY OF FINDINGS ................................................................................................................ 3
3. INDUSTRY-WIDE UNRELIABILITY ............................................................................................... 4
4. INDUSTRY-WIDE TRENDS .............................................................................................................. 6
5. BASIC EVENT GROUP IMPORTANCES ......................................................................................... 8
6. DATA TABLES ................................................................................................................................. 12
7. SYSTEM DESCRIPTION .................................................................................................................. 23
8. REFERENCES .................................................................................................................................... 27
FIGURES
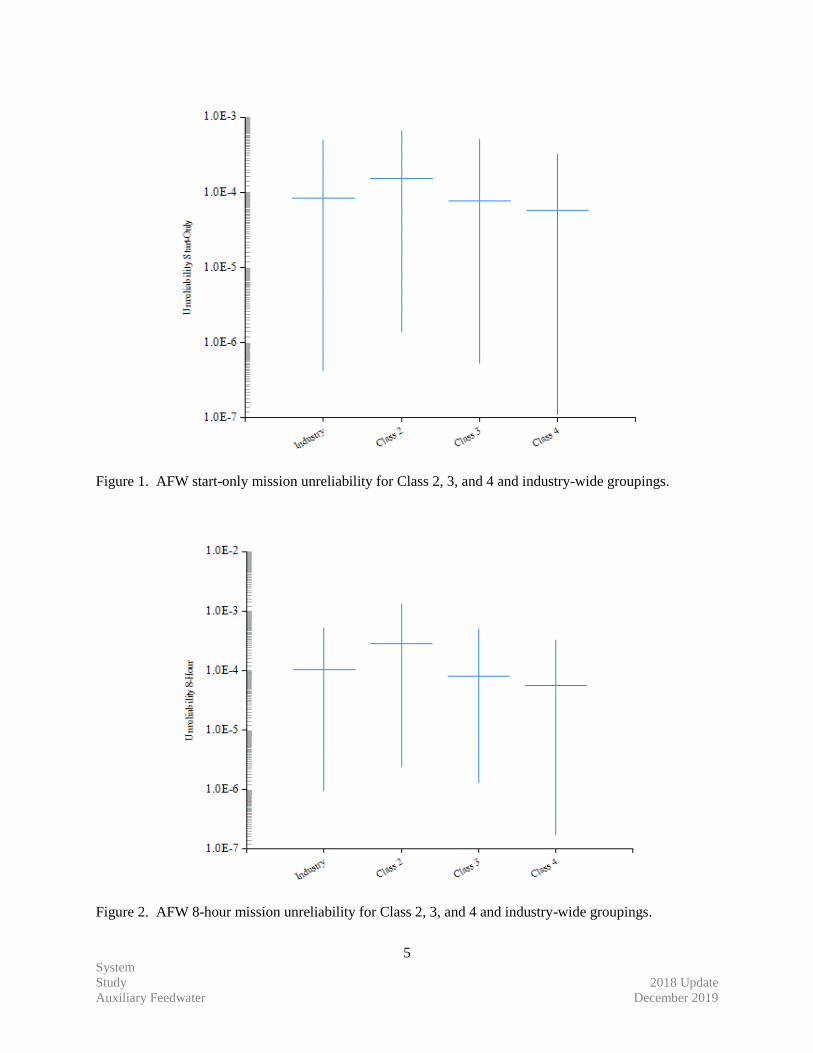
Figure 1. AFW start-only mission unreliability for Class 2, 3, and 4 and industry-wide groupings. .......... 5
Figure 2. AFW 8-hour mission unreliability for Class 2, 3, and 4 and industry-wide groupings. ............... 5
Figure 3. Trend of AFW system unreliability (start-only model). ............................................................... 7
Figure 4. Trend of AFW system unreliability (8-hour model). .................................................................... 7
Figure 5. AFW industry-wide basic event group importances. ................................................................... 8
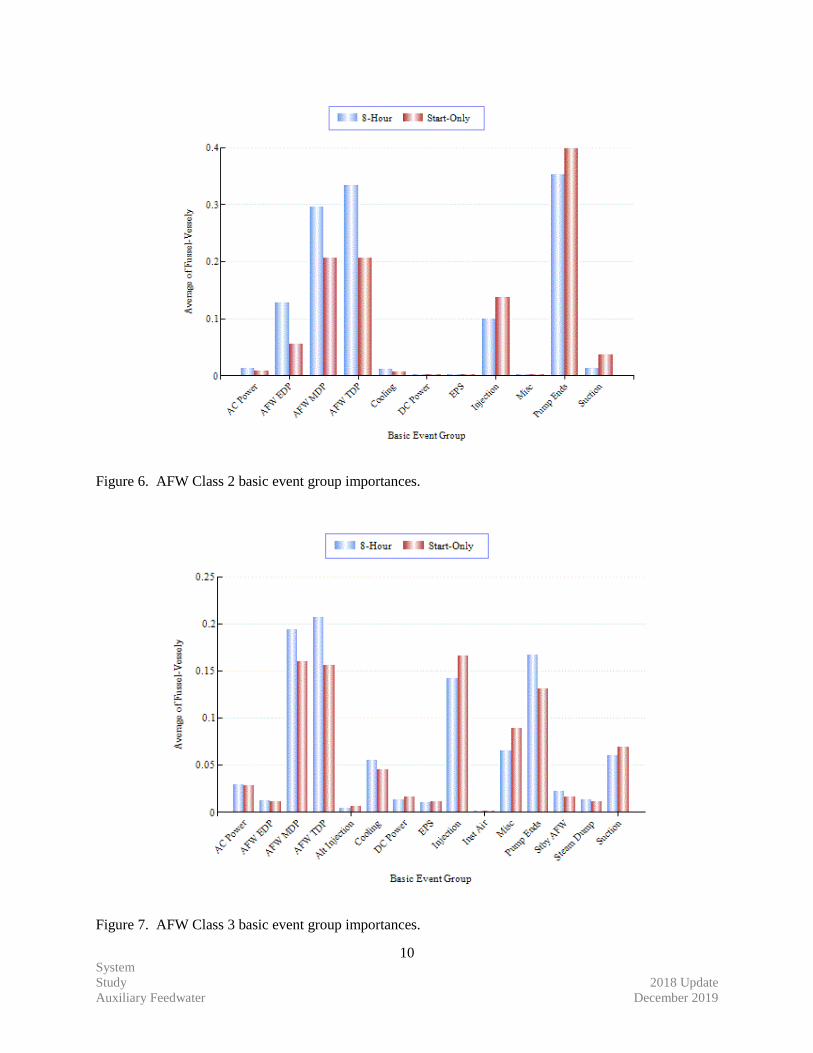
Figure 6. AFW Class 2 basic event group importances. ............................................................................ 10
Figure 7. AFW Class 3 basic event group importances. ............................................................................ 10
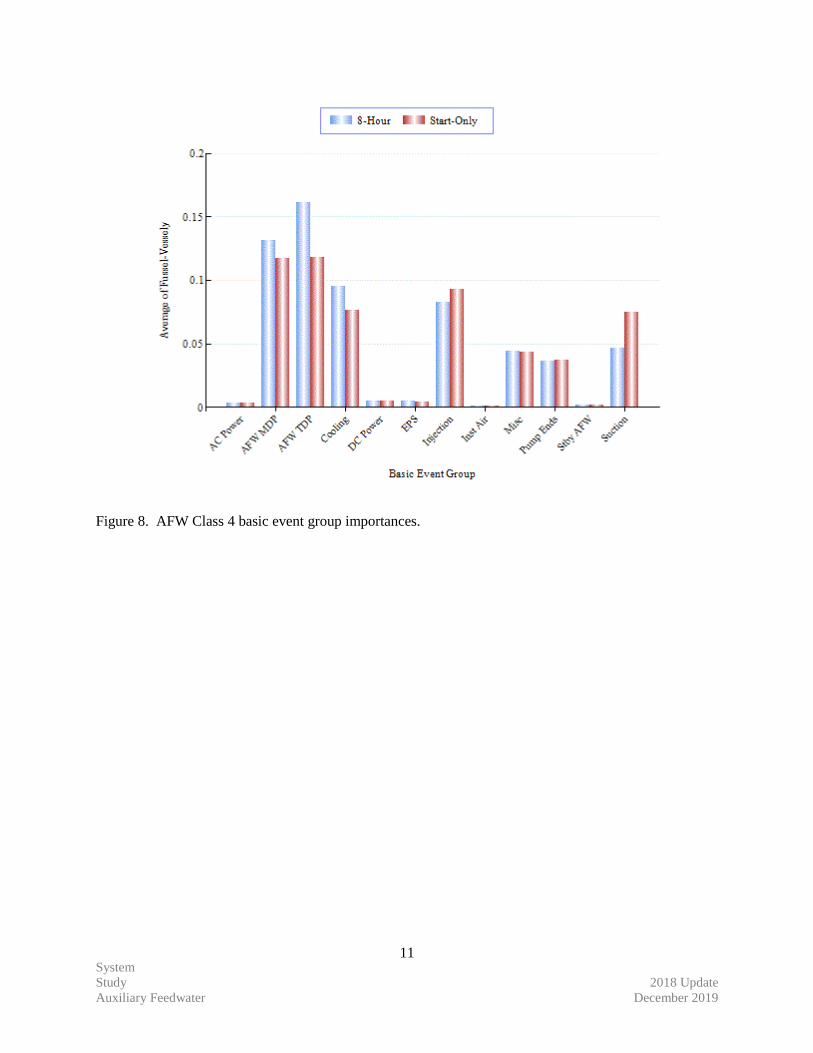
Figure 8. AFW Class 4 basic event group importances. ............................................................................ 11
Figure 9. Simplified generic AFW system diagram................................................................................... 25
System
Study 2018 Update
Auxiliary Feedwater December 2019
vi
TABLES
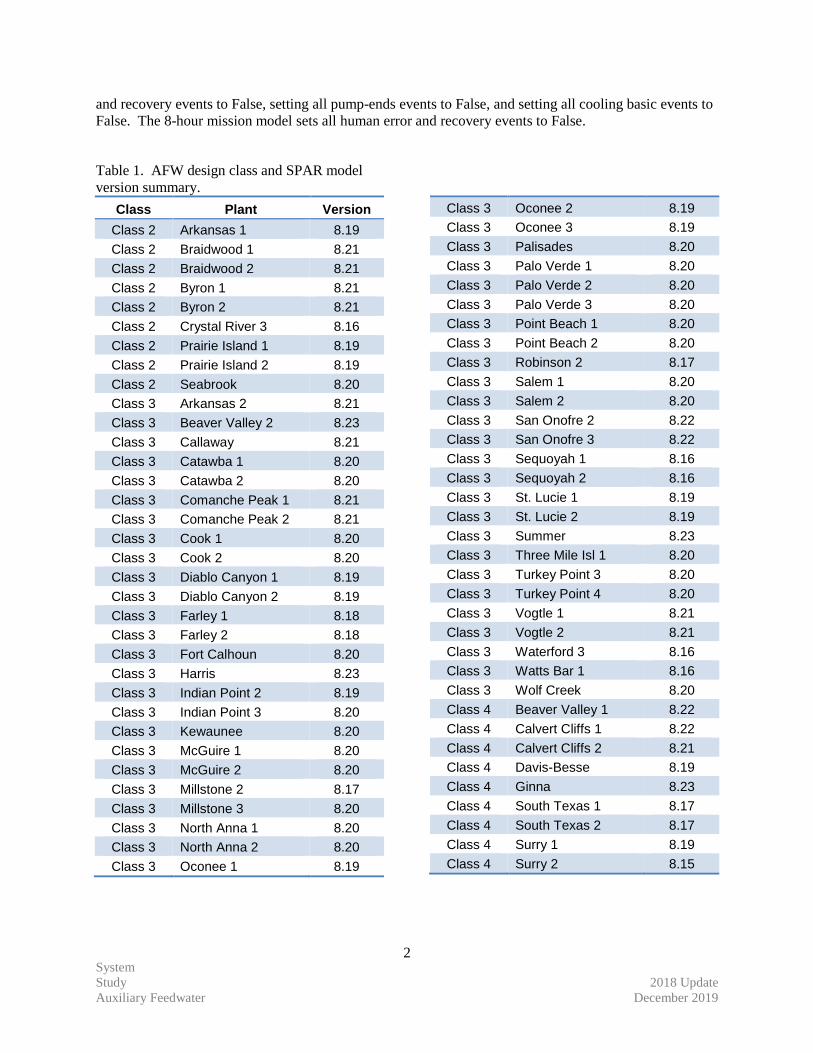
Table 1. AFW design class and SPAR model .............................................................................................. 2
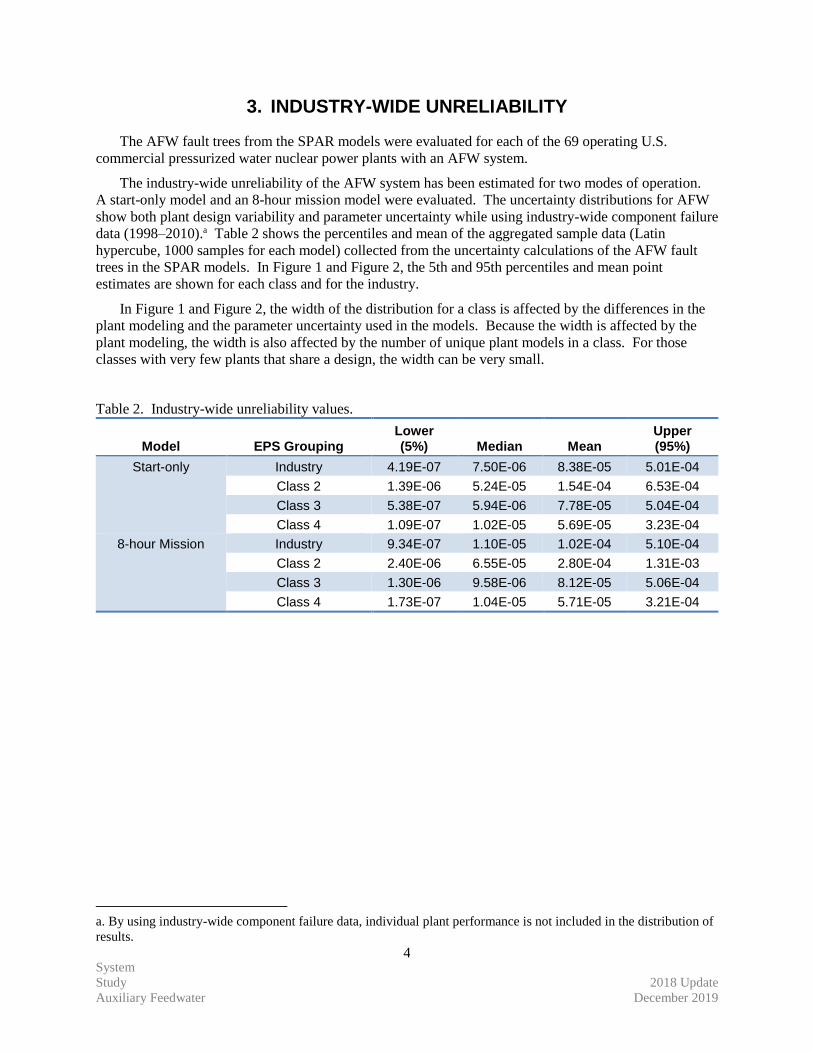
Table 2. Industry-wide unreliability values. ................................................................................................ 4
Table 3. AFW model basic event importance group descriptions. .............................................................. 9
Table 4. Plot data for AFW start-only trend, Figure 3. .............................................................................. 12
Table 5. Plot data for AFW 8-hour trend, Figure 4. ................................................................................... 13
Table 6. Basic event reliability trending data. ........................................................................................... 14
Table 7. Basic event UA trending data. ..................................................................................................... 21
Table 8. Failure mode acronyms. ............................................................................................................... 22
Table 9. Listing of the AFW design classes. .............................................................................................. 26
System
Study 2018 Update
Auxiliary Feedwater December 2019
vii
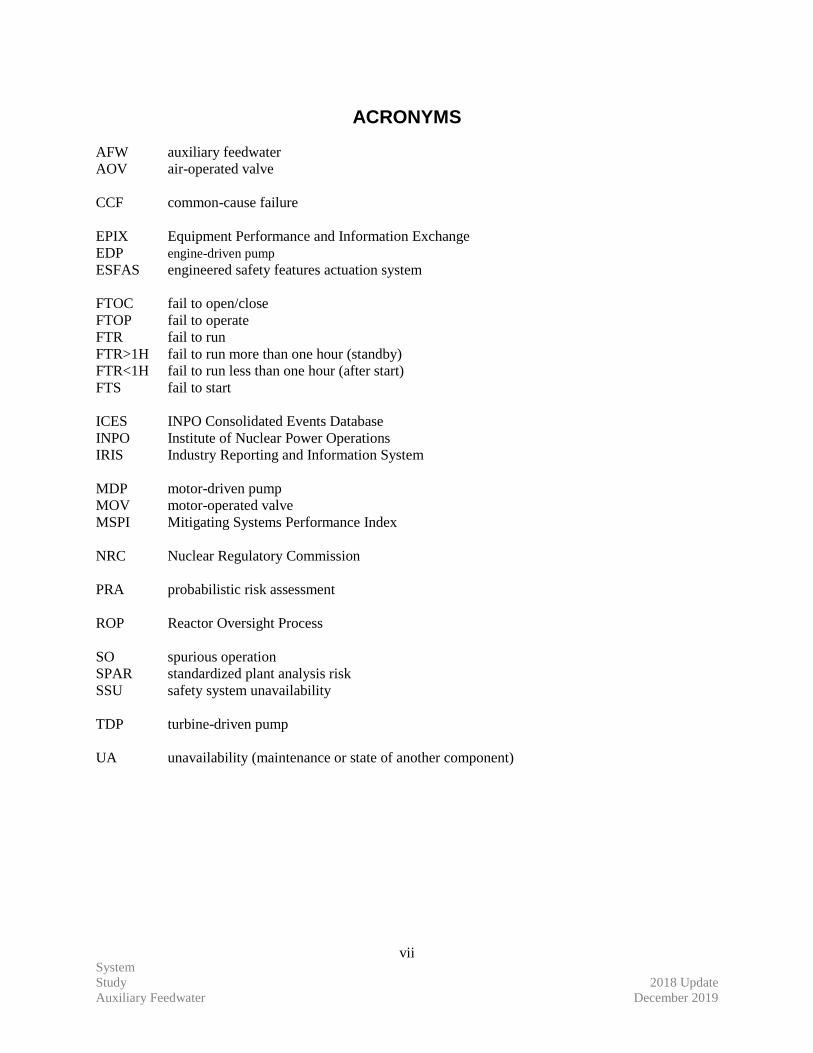
ACRONYMS
AFW auxiliary feedwater
AOV air-operated valve
CCF common-cause failure
EPIX Equipment Performance and Information Exchange
EDP engine-driven pump
ESFAS engineered safety features actuation system
FTOC fail to open/close
FTOP fail to operate
FTR fail to run
FTR>1H fail to run more than one hour (standby)
FTR<1H fail to run less than one hour (after start)
FTS fail to start
ICES INPO Consolidated Events Database
INPO Institute of Nuclear Power Operations
IRIS Industry Reporting and Information System
MDP motor-driven pump
MOV motor-operated valve
MSPI Mitigating Systems Performance Index
NRC Nuclear Regulatory Commission
PRA probabilistic risk assessment
ROP Reactor Oversight Process
SO spurious operation
SPAR standardized plant analysis risk
SSU safety system unavailability
TDP turbine-driven pump
UA unavailability (maintenance or state of another component)

System
Study 2018 Update
Auxiliary Feedwater December 2019
viii
System
Study 2018 Update
Auxiliary Feedwater December 2019
1
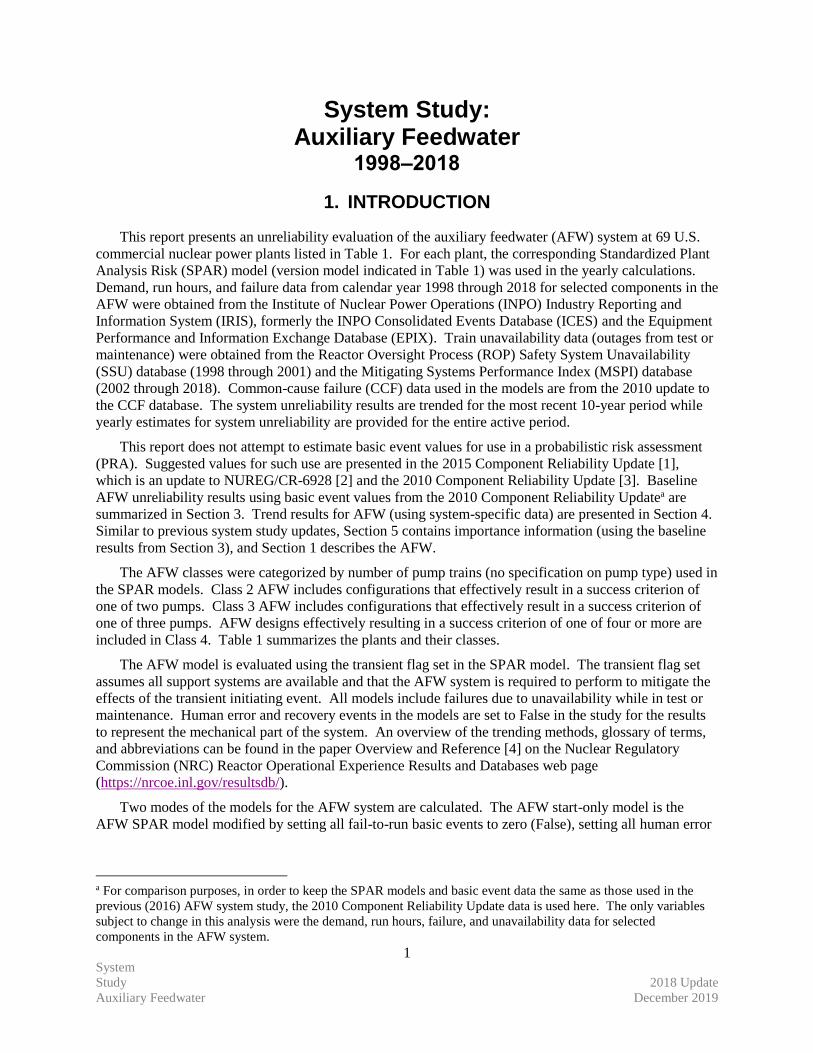
System Study: Auxiliary Feedwater
1998–2018
1. INTRODUCTION
This report presents an unreliability evaluation of the auxiliary feedwater (AFW) system at 69 U.S.
commercial nuclear power plants listed in Table 1. For each plant, the corresponding Standardized Plant
Analysis Risk (SPAR) model (version model indicated in Table 1) was used in the yearly calculations.
Demand, run hours, and failure data from calendar year 1998 through 2018 for selected components in the
AFW were obtained from the Institute of Nuclear Power Operations (INPO) Industry Reporting and
Information System (IRIS), formerly the INPO Consolidated Events Database (ICES) and the Equipment
Performance and Information Exchange Database (EPIX). Train unavailability data (outages from test or
maintenance) were obtained from the Reactor Oversight Process (ROP) Safety System Unavailability
(SSU) database (1998 through 2001) and the Mitigating Systems Performance Index (MSPI) database
(2002 through 2018). Common-cause failure (CCF) data used in the models are from the 2010 update to
the CCF database. The system unreliability results are trended for the most recent 10-year period while
yearly estimates for system unreliability are provided for the entire active period.
This report does not attempt to estimate basic event values for use in a probabilistic risk assessment
(PRA). Suggested values for such use are presented in the 2015 Component Reliability Update [1],
which is an update to NUREG/CR-6928 [2] and the 2010 Component Reliability Update [3]. Baseline
AFW unreliability results using basic event values from the 2010 Component Reliability Updatea are
summarized in Section 3. Trend results for AFW (using system-specific data) are presented in Section 4.
Similar to previous system study updates, Section 5 contains importance information (using the baseline
results from Section 3), and Section 1 describes the AFW.
The AFW classes were categorized by number of pump trains (no specification on pump type) used in
the SPAR models. Class 2 AFW includes configurations that effectively result in a success criterion of
one of two pumps. Class 3 AFW includes configurations that effectively result in a success criterion of
one of three pumps. AFW designs effectively resulting in a success criterion of one of four or more are
included in Class 4. Table 1 summarizes the plants and their classes.
The AFW model is evaluated using the transient flag set in the SPAR model. The transient flag set
assumes all support systems are available and that the AFW system is required to perform to mitigate the
effects of the transient initiating event. All models include failures due to unavailability while in test or
maintenance. Human error and recovery events in the models are set to False in the study for the results
to represent the mechanical part of the system. An overview of the trending methods, glossary of terms,
and abbreviations can be found in the paper Overview and Reference [4] on the Nuclear Regulatory
Commission (NRC) Reactor Operational Experience Results and Databases web page
(https://nrcoe.inl.gov/resultsdb/).
Two modes of the models for the AFW system are calculated. The AFW start-only model is the
AFW SPAR model modified by setting all fail-to-run basic events to zero (False), setting all human error
a For comparison purposes, in order to keep the SPAR models and basic event data the same as those used in the
previous (2016) AFW system study, the 2010 Component Reliability Update data is used here. The only variables
subject to change in this analysis were the demand, run hours, failure, and unavailability data for selected
components in the AFW system.
System
Study 2018 Update
Auxiliary Feedwater December 2019
2
and recovery events to False, setting all pump-ends events to False, and setting all cooling basic events to
False. The 8-hour mission model sets all human error and recovery events to False.
Table 1. AFW design class and SPAR model
version summary.
Class Plant Version
Class 2 Arkansas 1 8.19
Class 2 Braidwood 1 8.21
Class 2 Braidwood 2 8.21
Class 2 Byron 1 8.21
Class 2 Byron 2 8.21
Class 2 Crystal River 3 8.16
Class 2 Prairie Island 1 8.19
Class 2 Prairie Island 2 8.19
Class 2 Seabrook 8.20
Class 3 Arkansas 2 8.21
Class 3 Beaver Valley 2 8.23
Class 3 Callaway 8.21
Class 3 Catawba 1 8.20
Class 3 Catawba 2 8.20
Class 3 Comanche Peak 1 8.21
Class 3 Comanche Peak 2 8.21
Class 3 Cook 1 8.20
Class 3 Cook 2 8.20
Class 3 Diablo Canyon 1 8.19
Class 3 Diablo Canyon 2 8.19
Class 3 Farley 1 8.18
Class 3 Farley 2 8.18
Class 3 Fort Calhoun 8.20
Class 3 Harris 8.23
Class 3 Indian Point 2 8.19
Class 3 Indian Point 3 8.20
Class 3 Kewaunee 8.20
Class 3 McGuire 1 8.20
Class 3 McGuire 2 8.20
Class 3 Millstone 2 8.17
Class 3 Millstone 3 8.20
Class 3 North Anna 1 8.20
Class 3 North Anna 2 8.20
Class 3 Oconee 1 8.19
Class 3 Oconee 2 8.19
Class 3 Oconee 3 8.19
Class 3 Palisades 8.20
Class 3 Palo Verde 1 8.20
Class 3 Palo Verde 2 8.20
Class 3 Palo Verde 3 8.20
Class 3 Point Beach 1 8.20
Class 3 Point Beach 2 8.20
Class 3 Robinson 2 8.17
Class 3 Salem 1 8.20
Class 3 Salem 2 8.20
Class 3 San Onofre 2 8.22
Class 3 San Onofre 3 8.22
Class 3 Sequoyah 1 8.16
Class 3 Sequoyah 2 8.16
Class 3 St. Lucie 1 8.19
Class 3 St. Lucie 2 8.19
Class 3 Summer 8.23
Class 3 Three Mile Isl 1 8.20
Class 3 Turkey Point 3 8.20
Class 3 Turkey Point 4 8.20
Class 3 Vogtle 1 8.21
Class 3 Vogtle 2 8.21
Class 3 Waterford 3 8.16
Class 3 Watts Bar 1 8.16
Class 3 Wolf Creek 8.20
Class 4 Beaver Valley 1 8.22
Class 4 Calvert Cliffs 1 8.22
Class 4 Calvert Cliffs 2 8.21
Class 4 Davis-Besse 8.19
Class 4 Ginna 8.23
Class 4 South Texas 1 8.17
Class 4 South Texas 2 8.17
Class 4 Surry 1 8.19
Class 4 Surry 2 8.15
System
Study 2018 Update
Auxiliary Feedwater December 2019
3
2. SUMMARY OF FINDINGS
The results of this AFW system unreliability study are summarized in this section. Of particular
interest is the existence of any statistically significanta increasing trends. In this update, no statistically
significant increasing or decreasing trends were identified in the AFW unreliability trend results.
The industry-wide AFW start-only and 8-hour basic event group importances were evaluated and are
shown in Figure 5:
In the Start-Only case—the leading contributors to AFW system unreliability are the AFW MDP
(motor-driven pump), AFW TDP (turbine-driven pump), Pump Ends, and Injection groups of basic
events.
In the 8-Hour case— the leading contributor to AFW system unreliability is the AFW TDP group of
basic events followed by the AFW MDP, Recovery, Pump Ends, and Injection groups.
a. Statistically significant is defined in terms of the ‘p-value.’ A p-value is a probability indicating whether to accept
or reject the null hypothesis that there is no trend in the data. P-values of less than or equal to 0.05 indicate that we
are 95% confident that there is a trend in the data (reject the null hypothesis of no trend.) By convention, we use the
"Michelin Guide" scale: p-value < 0.05 (statistically significant), p-value < 0.01 (highly statistically significant); p-
value < 0.001 (extremely statistically significant).
System
Study 2018 Update
Auxiliary Feedwater December 2019
4
3. INDUSTRY-WIDE UNRELIABILITY
The AFW fault trees from the SPAR models were evaluated for each of the 69 operating U.S.
commercial pressurized water nuclear power plants with an AFW system.
The industry-wide unreliability of the AFW system has been estimated for two modes of operation.
A start-only model and an 8-hour mission model were evaluated. The uncertainty distributions for AFW
show both plant design variability and parameter uncertainty while using industry-wide component failure
data (1998–2010).a Table 2 shows the percentiles and mean of the aggregated sample data (Latin
hypercube, 1000 samples for each model) collected from the uncertainty calculations of the AFW fault
trees in the SPAR models. In Figure 1 and Figure 2, the 5th and 95th percentiles and mean point
estimates are shown for each class and for the industry.
In Figure 1 and Figure 2, the width of the distribution for a class is affected by the differences in the
plant modeling and the parameter uncertainty used in the models. Because the width is affected by the
plant modeling, the width is also affected by the number of unique plant models in a class. For those
classes with very few plants that share a design, the width can be very small.
Table 2. Industry-wide unreliability values.
Model EPS Grouping Lower (5%) Median Mean
Upper (95%)
Start-only Industry 4.19E-07 7.50E-06 8.38E-05 5.01E-04
Class 2 1.39E-06 5.24E-05 1.54E-04 6.53E-04
Class 3 5.38E-07 5.94E-06 7.78E-05 5.04E-04
Class 4 1.09E-07 1.02E-05 5.69E-05 3.23E-04
8-hour Mission Industry 9.34E-07 1.10E-05 1.02E-04 5.10E-04
Class 2 2.40E-06 6.55E-05 2.80E-04 1.31E-03
Class 3 1.30E-06 9.58E-06 8.12E-05 5.06E-04
Class 4 1.73E-07 1.04E-05 5.71E-05 3.21E-04
a. By using industry-wide component failure data, individual plant performance is not included in the distribution of
results.
System
Study 2018 Update
Auxiliary Feedwater December 2019
5
Figure 1. AFW start-only mission unreliability for Class 2, 3, and 4 and industry-wide groupings.
Figure 2. AFW 8-hour mission unreliability for Class 2, 3, and 4 and industry-wide groupings.
System
Study 2018 Update
Auxiliary Feedwater December 2019
6
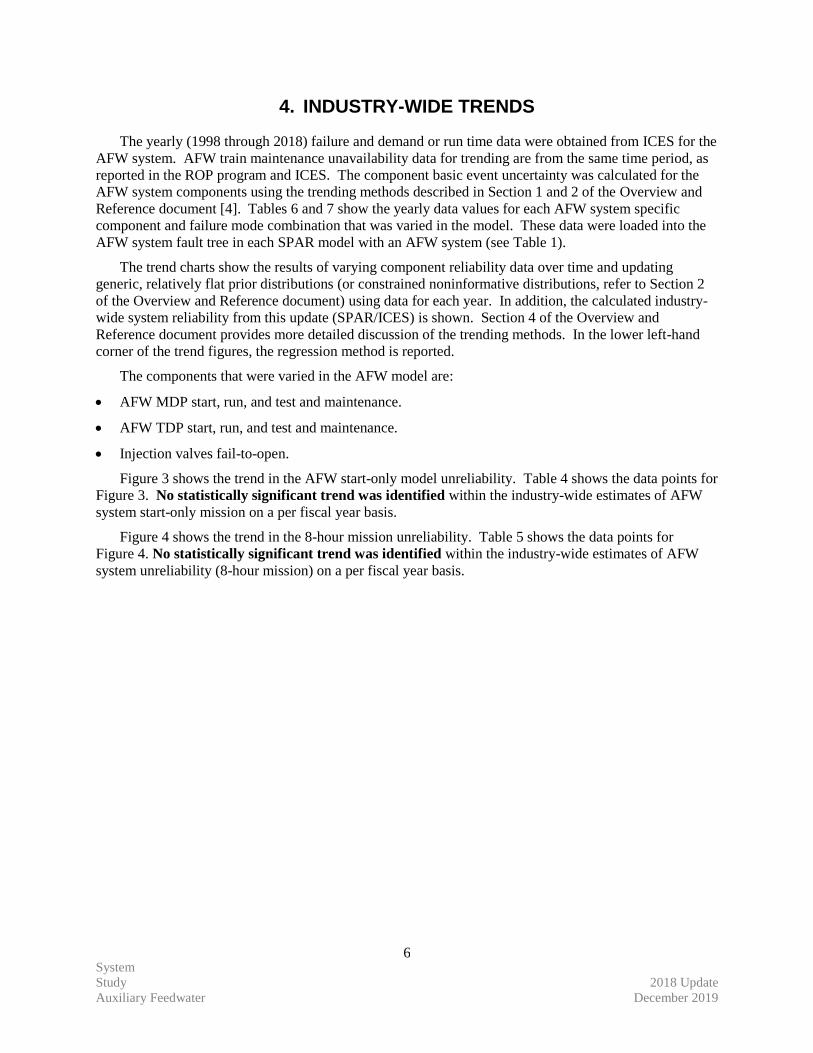
4. INDUSTRY-WIDE TRENDS
The yearly (1998 through 2018) failure and demand or run time data were obtained from ICES for the
AFW system. AFW train maintenance unavailability data for trending are from the same time period, as
reported in the ROP program and ICES. The component basic event uncertainty was calculated for the
AFW system components using the trending methods described in Section 1 and 2 of the Overview and
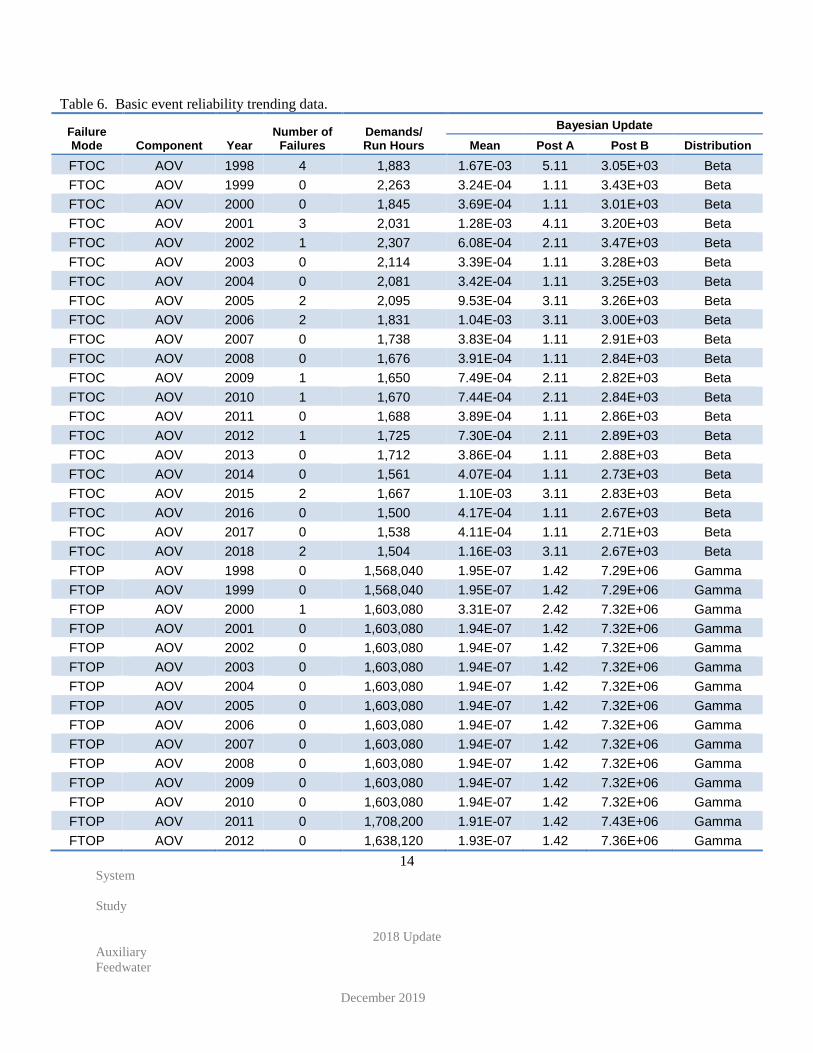
Reference document [4]. Tables 6 and 7 show the yearly data values for each AFW system specific
component and failure mode combination that was varied in the model. These data were loaded into the
AFW system fault tree in each SPAR model with an AFW system (see Table 1).
The trend charts show the results of varying component reliability data over time and updating
generic, relatively flat prior distributions (or constrained noninformative distributions, refer to Section 2
of the Overview and Reference document) using data for each year. In addition, the calculated industry-
wide system reliability from this update (SPAR/ICES) is shown. Section 4 of the Overview and
Reference document provides more detailed discussion of the trending methods. In the lower left-hand
corner of the trend figures, the regression method is reported.
The components that were varied in the AFW model are:
AFW MDP start, run, and test and maintenance.
AFW TDP start, run, and test and maintenance.
Injection valves fail-to-open.
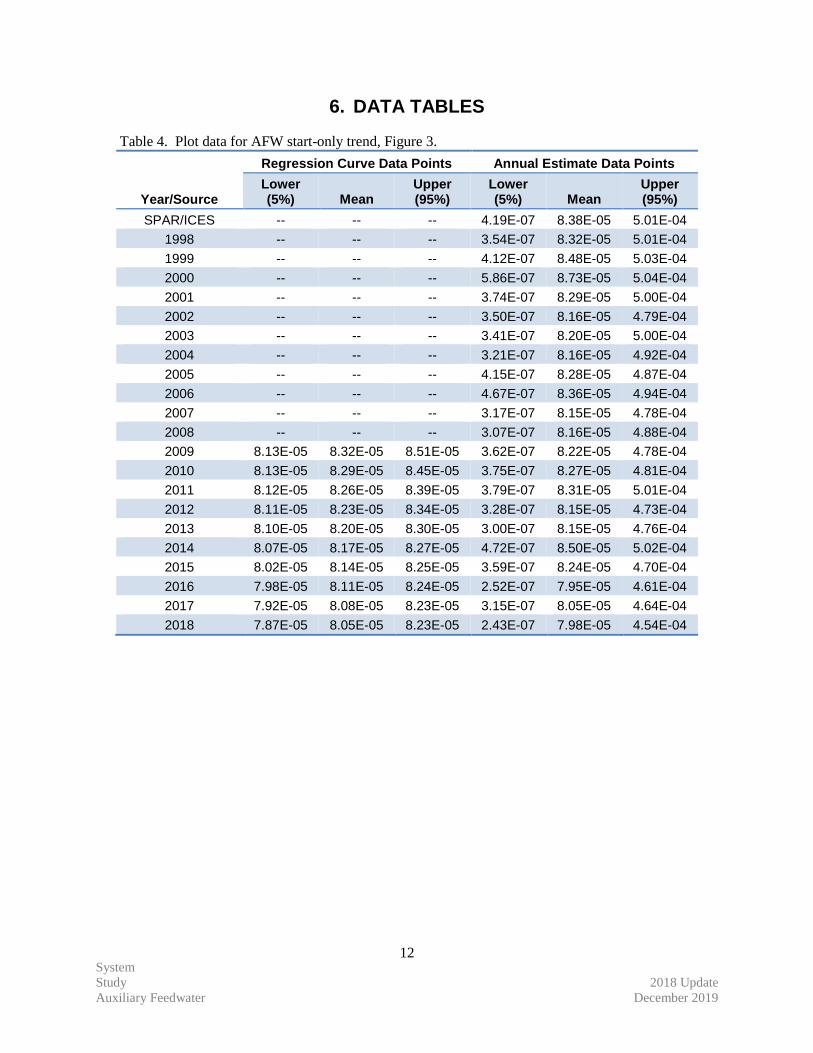
Figure 3 shows the trend in the AFW start-only model unreliability. Table 4 shows the data points for
Figure 3. No statistically significant trend was identified within the industry-wide estimates of AFW
system start-only mission on a per fiscal year basis.
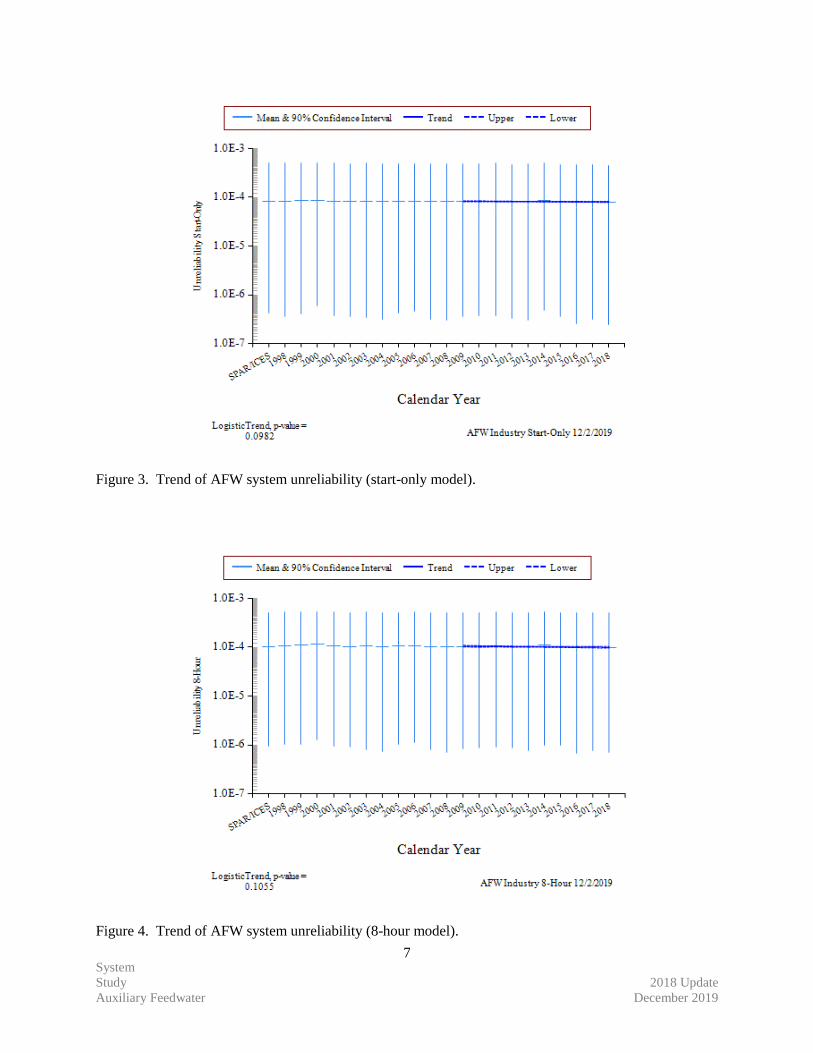
Figure 4 shows the trend in the 8-hour mission unreliability. Table 5 shows the data points for
Figure 4. No statistically significant trend was identified within the industry-wide estimates of AFW
system unreliability (8-hour mission) on a per fiscal year basis.
System
Study 2018 Update
Auxiliary Feedwater December 2019
7
Figure 3. Trend of AFW system unreliability (start-only model).
Figure 4. Trend of AFW system unreliability (8-hour model).
System
Study 2018 Update
Auxiliary Feedwater December 2019
8
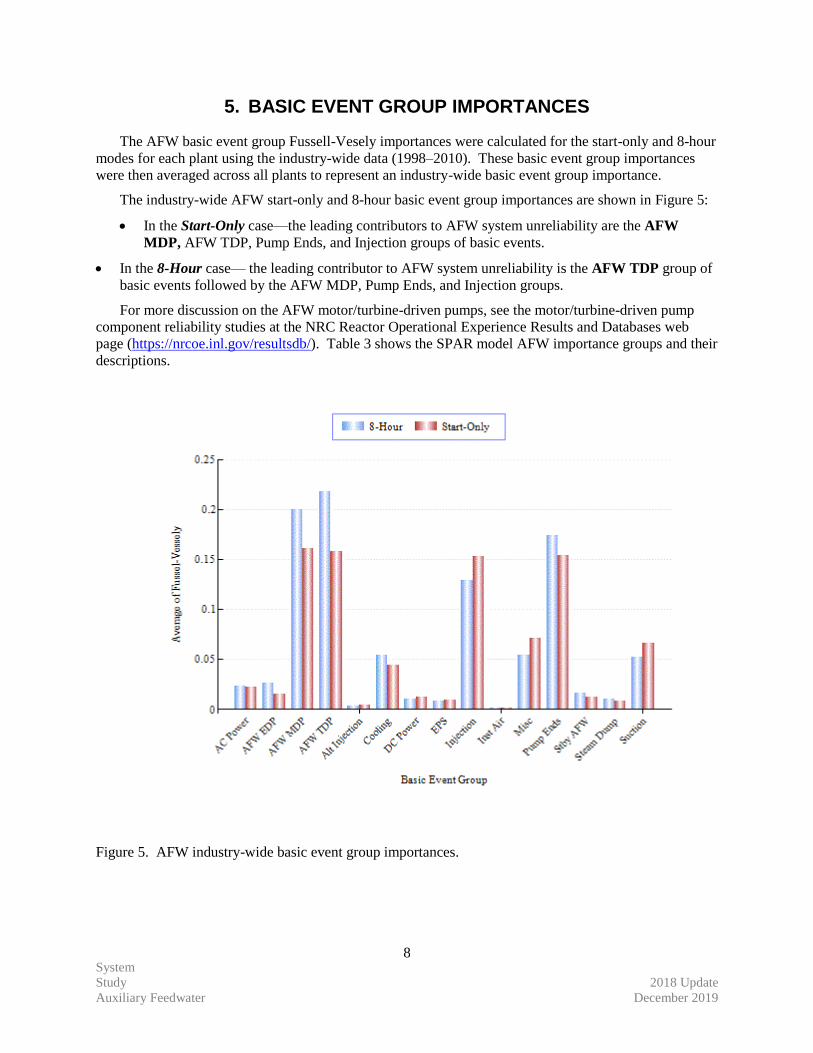
5. BASIC EVENT GROUP IMPORTANCES
The AFW basic event group Fussell-Vesely importances were calculated for the start-only and 8-hour
modes for each plant using the industry-wide data (1998–2010). These basic event group importances
were then averaged across all plants to represent an industry-wide basic event group importance.
The industry-wide AFW start-only and 8-hour basic event group importances are shown in Figure 5:
In the Start-Only case—the leading contributors to AFW system unreliability are the AFW
MDP, AFW TDP, Pump Ends, and Injection groups of basic events.
In the 8-Hour case— the leading contributor to AFW system unreliability is the AFW TDP group of
basic events followed by the AFW MDP, Pump Ends, and Injection groups.
For more discussion on the AFW motor/turbine-driven pumps, see the motor/turbine-driven pump
component reliability studies at the NRC Reactor Operational Experience Results and Databases web
page (https://nrcoe.inl.gov/resultsdb/). Table 3 shows the SPAR model AFW importance groups and their
descriptions.
Figure 5. AFW industry-wide basic event group importances.
System
Study 2018 Update
Auxiliary Feedwater December 2019
9
Table 3. AFW model basic event importance group descriptions.
Group Description
AC Power The ac buses and circuit breakers that supply power to the AFW pumps.
AFW EDP All basic events associated with the diesel engine-driven pumps (EDPs). The start, run, common-cause, and test and maintenance are included in this group of basic events.
AFW MDP All basic events associated with the motor-driven pumps. The start, run, common-cause, and test and maintenance are included in this group of basic events.
AFW TDP All basic events associated with the turbine-driven pumps. The start, run, common-cause, and test and maintenance are included in this group of basic events.
Alternate Injection Alternate injection sources such as firewater.
Cooling The pumps, valves, and heat exchangers that provide heat removal to the pumps. In addition, the pumps, valves, air-conditioning equipment that are modeled to provide room cooling to the AFW equipment
DC Power The batteries and battery chargers that supply power to the pump control circuitry.
EPS AFW dependency on the emergency power system.
Injection The motor-operated valves and check valves in the injection path.
Inst Air Instrument air support to the AFW model.
Miscellaneous Other events that are not typically modeled or of very low importance.
Pump Ends The common-cause failure of the pump ends. Used to model common-cause without the pump drivers.
Steam Dump All basic events associated with the steam dump.
Stby AFW Standby means of injecting water to the steam generators. Includes startup feedwater and cross-ties to adjacent units.
Suction The motor-operated valves and air-operated valves in the tank suction path. Includes the failure of the tank.
The basic event group importances were also averaged across plants of the same AFW class to
represent class basic event group importances. The AFW class-specific start-only and 8-hour basic event
group importances are shown in Figure 6 through Figure 8.
System
Study 2018 Update
Auxiliary Feedwater December 2019
10
Figure 6. AFW Class 2 basic event group importances.
Figure 7. AFW Class 3 basic event group importances.
System
Study 2018 Update
Auxiliary Feedwater December 2019
11
Figure 8. AFW Class 4 basic event group importances.
System
Study 2018 Update
Auxiliary Feedwater December 2019
12
6. DATA TABLES
Table 4. Plot data for AFW start-only trend, Figure 3.
Year/Source
Regression Curve Data Points Annual Estimate Data Points
Lower (5%) Mean
Upper (95%)
Lower (5%) Mean
Upper (95%)
SPAR/ICES -- -- -- 4.19E-07 8.38E-05 5.01E-04
1998 -- -- -- 3.54E-07 8.32E-05 5.01E-04
1999 -- -- -- 4.12E-07 8.48E-05 5.03E-04
2000 -- -- -- 5.86E-07 8.73E-05 5.04E-04
2001 -- -- -- 3.74E-07 8.29E-05 5.00E-04
2002 -- -- -- 3.50E-07 8.16E-05 4.79E-04
2003 -- -- -- 3.41E-07 8.20E-05 5.00E-04
2004 -- -- -- 3.21E-07 8.16E-05 4.92E-04
2005 -- -- -- 4.15E-07 8.28E-05 4.87E-04
2006 -- -- -- 4.67E-07 8.36E-05 4.94E-04
2007 -- -- -- 3.17E-07 8.15E-05 4.78E-04
2008 -- -- -- 3.07E-07 8.16E-05 4.88E-04
2009 8.13E-05 8.32E-05 8.51E-05 3.62E-07 8.22E-05 4.78E-04
2010 8.13E-05 8.29E-05 8.45E-05 3.75E-07 8.27E-05 4.81E-04
2011 8.12E-05 8.26E-05 8.39E-05 3.79E-07 8.31E-05 5.01E-04
2012 8.11E-05 8.23E-05 8.34E-05 3.28E-07 8.15E-05 4.73E-04
2013 8.10E-05 8.20E-05 8.30E-05 3.00E-07 8.15E-05 4.76E-04
2014 8.07E-05 8.17E-05 8.27E-05 4.72E-07 8.50E-05 5.02E-04
2015 8.02E-05 8.14E-05 8.25E-05 3.59E-07 8.24E-05 4.70E-04
2016 7.98E-05 8.11E-05 8.24E-05 2.52E-07 7.95E-05 4.61E-04
2017 7.92E-05 8.08E-05 8.23E-05 3.15E-07 8.05E-05 4.64E-04
2018 7.87E-05 8.05E-05 8.23E-05 2.43E-07 7.98E-05 4.54E-04

System
Study 2018 Update
Auxiliary Feedwater December 2019
13
Table 5. Plot data for AFW 8-hour trend, Figure 4.
Year/Source
Regression Curve Data Points Annual Estimate Data Points
Lower (5%) Mean
Lower (5%) Mean
SPAR/ICES -- -- -- 9.34E-07 1.02E-04 5.10E-04
1998 -- -- -- 1.01E-06 1.06E-04 5.19E-04
1999 -- -- -- 1.02E-06 1.09E-04 5.26E-04
2000 -- -- -- 1.26E-06 1.13E-04 5.30E-04
2001 -- -- -- 9.38E-07 1.05E-04 5.16E-04
2002 -- -- -- 8.96E-07 1.03E-04 5.14E-04
2003 -- -- -- 7.94E-07 1.04E-04 5.16E-04
2004 -- -- -- 7.42E-07 1.03E-04 5.13E-04
2005 -- -- -- 1.02E-06 1.04E-04 5.15E-04
2006 -- -- -- 1.11E-06 1.06E-04 5.17E-04
2007 -- -- -- 7.96E-07 1.02E-04 5.14E-04
2008 -- -- -- 6.93E-07 1.02E-04 5.14E-04
2009 1.01E-04 1.05E-04 1.09E-04 8.38E-07 1.02E-04 5.12E-04
2010 1.01E-04 1.04E-04 1.07E-04 8.74E-07 1.03E-04 5.13E-04
2011 1.01E-04 1.03E-04 1.06E-04 9.15E-07 1.05E-04 5.16E-04
2012 1.01E-04 1.03E-04 1.05E-04 8.75E-07 1.01E-04 5.13E-04
2013 1.00E-04 1.02E-04 1.04E-04 7.48E-07 1.01E-04 5.12E-04
2014 9.96E-05 1.02E-04 1.04E-04 9.98E-07 1.09E-04 5.21E-04
2015 9.88E-05 1.01E-04 1.03E-04 9.64E-07 1.02E-04 5.12E-04
2016 9.79E-05 1.00E-04 1.03E-04 6.61E-07 9.82E-05 5.10E-04
2017 9.68E-05 9.99E-05 1.03E-04 7.60E-07 9.99E-05 5.11E-04
2018 9.57E-05 9.93E-05 1.03E-04 6.97E-07 9.73E-05 5.09E-04
System
Study
2018 Update
Auxiliary
Feedwater
December 2019
14
Table 6. Basic event reliability trending data.
Failure Mode Component Year
Number of Failures
Demands/ Run Hours
Bayesian Update
Mean Post A Post B Distribution
FTOC AOV 1998 4 1,883 1.67E-03 5.11 3.05E+03 Beta
FTOC AOV 1999 0 2,263 3.24E-04 1.11 3.43E+03 Beta
FTOC AOV 2000 0 1,845 3.69E-04 1.11 3.01E+03 Beta
FTOC AOV 2001 3 2,031 1.28E-03 4.11 3.20E+03 Beta
FTOC AOV 2002 1 2,307 6.08E-04 2.11 3.47E+03 Beta
FTOC AOV 2003 0 2,114 3.39E-04 1.11 3.28E+03 Beta
FTOC AOV 2004 0 2,081 3.42E-04 1.11 3.25E+03 Beta
FTOC AOV 2005 2 2,095 9.53E-04 3.11 3.26E+03 Beta
FTOC AOV 2006 2 1,831 1.04E-03 3.11 3.00E+03 Beta
FTOC AOV 2007 0 1,738 3.83E-04 1.11 2.91E+03 Beta
FTOC AOV 2008 0 1,676 3.91E-04 1.11 2.84E+03 Beta
FTOC AOV 2009 1 1,650 7.49E-04 2.11 2.82E+03 Beta
FTOC AOV 2010 1 1,670 7.44E-04 2.11 2.84E+03 Beta
FTOC AOV 2011 0 1,688 3.89E-04 1.11 2.86E+03 Beta
FTOC AOV 2012 1 1,725 7.30E-04 2.11 2.89E+03 Beta
FTOC AOV 2013 0 1,712 3.86E-04 1.11 2.88E+03 Beta
FTOC AOV 2014 0 1,561 4.07E-04 1.11 2.73E+03 Beta
FTOC AOV 2015 2 1,667 1.10E-03 3.11 2.83E+03 Beta
FTOC AOV 2016 0 1,500 4.17E-04 1.11 2.67E+03 Beta
FTOC AOV 2017 0 1,538 4.11E-04 1.11 2.71E+03 Beta
FTOC AOV 2018 2 1,504 1.16E-03 3.11 2.67E+03 Beta
FTOP AOV 1998 0 1,568,040 1.95E-07 1.42 7.29E+06 Gamma
FTOP AOV 1999 0 1,568,040 1.95E-07 1.42 7.29E+06 Gamma
FTOP AOV 2000 1 1,603,080 3.31E-07 2.42 7.32E+06 Gamma
FTOP AOV 2001 0 1,603,080 1.94E-07 1.42 7.32E+06 Gamma
FTOP AOV 2002 0 1,603,080 1.94E-07 1.42 7.32E+06 Gamma
FTOP AOV 2003 0 1,603,080 1.94E-07 1.42 7.32E+06 Gamma
FTOP AOV 2004 0 1,603,080 1.94E-07 1.42 7.32E+06 Gamma
FTOP AOV 2005 0 1,603,080 1.94E-07 1.42 7.32E+06 Gamma
FTOP AOV 2006 0 1,603,080 1.94E-07 1.42 7.32E+06 Gamma
FTOP AOV 2007 0 1,603,080 1.94E-07 1.42 7.32E+06 Gamma
FTOP AOV 2008 0 1,603,080 1.94E-07 1.42 7.32E+06 Gamma
FTOP AOV 2009 0 1,603,080 1.94E-07 1.42 7.32E+06 Gamma
FTOP AOV 2010 0 1,603,080 1.94E-07 1.42 7.32E+06 Gamma
FTOP AOV 2011 0 1,708,200 1.91E-07 1.42 7.43E+06 Gamma
FTOP AOV 2012 0 1,638,120 1.93E-07 1.42 7.36E+06 Gamma
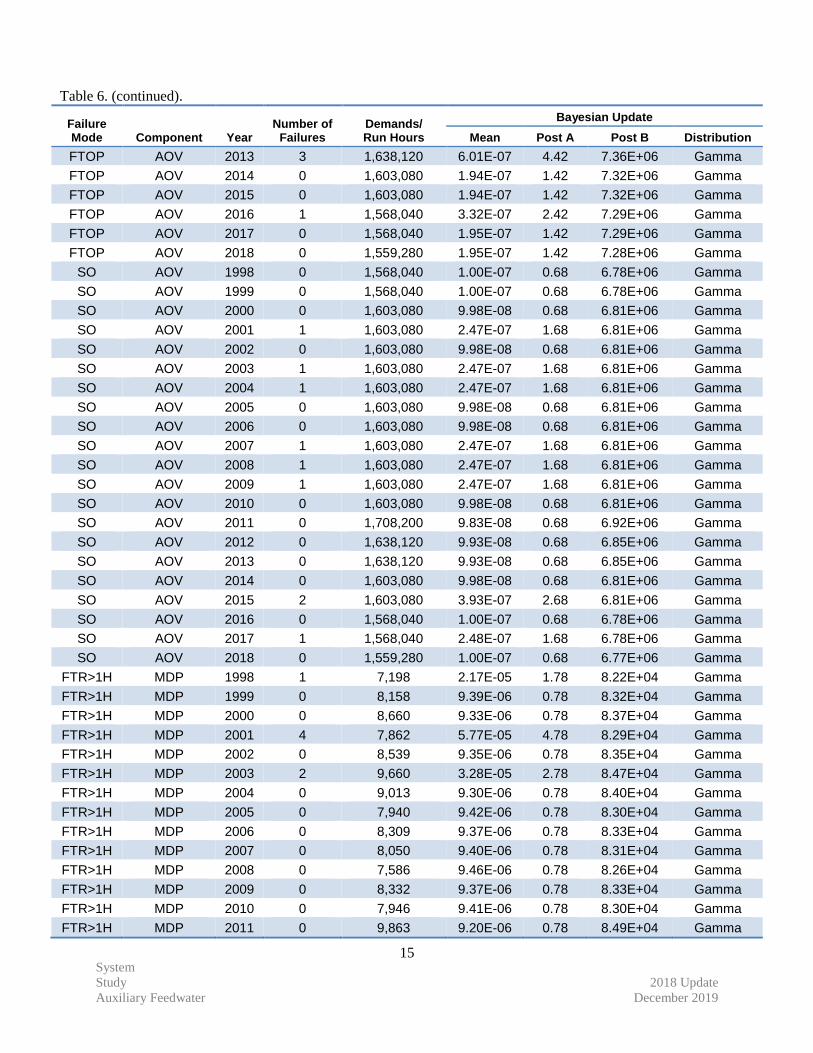
Table 6. (continued).
System
Study 2018 Update
Auxiliary Feedwater December 2019
15
Failure Mode Component Year
Number of Failures
Demands/ Run Hours
Bayesian Update
Mean Post A Post B Distribution
FTOP AOV 2013 3 1,638,120 6.01E-07 4.42 7.36E+06 Gamma
FTOP AOV 2014 0 1,603,080 1.94E-07 1.42 7.32E+06 Gamma
FTOP AOV 2015 0 1,603,080 1.94E-07 1.42 7.32E+06 Gamma
FTOP AOV 2016 1 1,568,040 3.32E-07 2.42 7.29E+06 Gamma
FTOP AOV 2017 0 1,568,040 1.95E-07 1.42 7.29E+06 Gamma
FTOP AOV 2018 0 1,559,280 1.95E-07 1.42 7.28E+06 Gamma
SO AOV 1998 0 1,568,040 1.00E-07 0.68 6.78E+06 Gamma
SO AOV 1999 0 1,568,040 1.00E-07 0.68 6.78E+06 Gamma
SO AOV 2000 0 1,603,080 9.98E-08 0.68 6.81E+06 Gamma
SO AOV 2001 1 1,603,080 2.47E-07 1.68 6.81E+06 Gamma
SO AOV 2002 0 1,603,080 9.98E-08 0.68 6.81E+06 Gamma
SO AOV 2003 1 1,603,080 2.47E-07 1.68 6.81E+06 Gamma
SO AOV 2004 1 1,603,080 2.47E-07 1.68 6.81E+06 Gamma
SO AOV 2005 0 1,603,080 9.98E-08 0.68 6.81E+06 Gamma
SO AOV 2006 0 1,603,080 9.98E-08 0.68 6.81E+06 Gamma
SO AOV 2007 1 1,603,080 2.47E-07 1.68 6.81E+06 Gamma
SO AOV 2008 1 1,603,080 2.47E-07 1.68 6.81E+06 Gamma
SO AOV 2009 1 1,603,080 2.47E-07 1.68 6.81E+06 Gamma
SO AOV 2010 0 1,603,080 9.98E-08 0.68 6.81E+06 Gamma
SO AOV 2011 0 1,708,200 9.83E-08 0.68 6.92E+06 Gamma
SO AOV 2012 0 1,638,120 9.93E-08 0.68 6.85E+06 Gamma
SO AOV 2013 0 1,638,120 9.93E-08 0.68 6.85E+06 Gamma
SO AOV 2014 0 1,603,080 9.98E-08 0.68 6.81E+06 Gamma
SO AOV 2015 2 1,603,080 3.93E-07 2.68 6.81E+06 Gamma
SO AOV 2016 0 1,568,040 1.00E-07 0.68 6.78E+06 Gamma
SO AOV 2017 1 1,568,040 2.48E-07 1.68 6.78E+06 Gamma
SO AOV 2018 0 1,559,280 1.00E-07 0.68 6.77E+06 Gamma
FTR>1H MDP 1998 1 7,198 2.17E-05 1.78 8.22E+04 Gamma
FTR>1H MDP 1999 0 8,158 9.39E-06 0.78 8.32E+04 Gamma
FTR>1H MDP 2000 0 8,660 9.33E-06 0.78 8.37E+04 Gamma
FTR>1H MDP 2001 4 7,862 5.77E-05 4.78 8.29E+04 Gamma
FTR>1H MDP 2002 0 8,539 9.35E-06 0.78 8.35E+04 Gamma
FTR>1H MDP 2003 2 9,660 3.28E-05 2.78 8.47E+04 Gamma
FTR>1H MDP 2004 0 9,013 9.30E-06 0.78 8.40E+04 Gamma
FTR>1H MDP 2005 0 7,940 9.42E-06 0.78 8.30E+04 Gamma
FTR>1H MDP 2006 0 8,309 9.37E-06 0.78 8.33E+04 Gamma
FTR>1H MDP 2007 0 8,050 9.40E-06 0.78 8.31E+04 Gamma
FTR>1H MDP 2008 0 7,586 9.46E-06 0.78 8.26E+04 Gamma
FTR>1H MDP 2009 0 8,332 9.37E-06 0.78 8.33E+04 Gamma
FTR>1H MDP 2010 0 7,946 9.41E-06 0.78 8.30E+04 Gamma
FTR>1H MDP 2011 0 9,863 9.20E-06 0.78 8.49E+04 Gamma
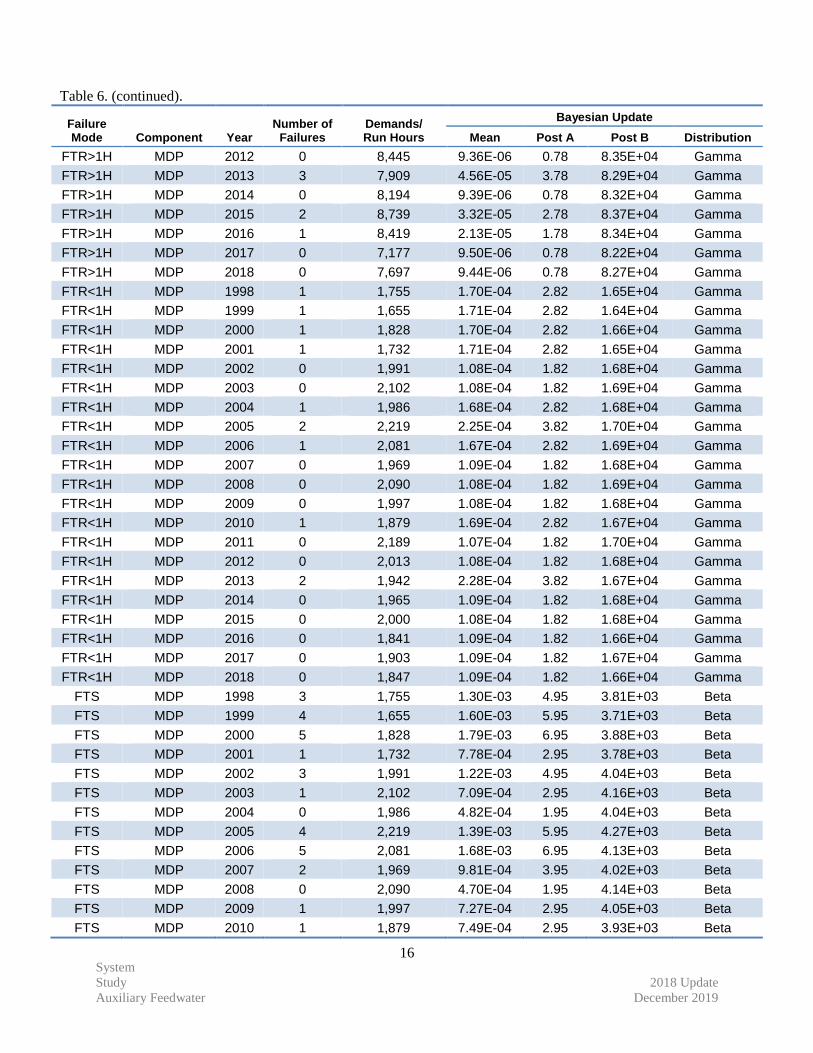
Table 6. (continued).
System
Study 2018 Update
Auxiliary Feedwater December 2019
16
Failure Mode Component Year
Number of Failures
Demands/ Run Hours
Bayesian Update
Mean Post A Post B Distribution
FTR>1H MDP 2012 0 8,445 9.36E-06 0.78 8.35E+04 Gamma
FTR>1H MDP 2013 3 7,909 4.56E-05 3.78 8.29E+04 Gamma
FTR>1H MDP 2014 0 8,194 9.39E-06 0.78 8.32E+04 Gamma
FTR>1H MDP 2015 2 8,739 3.32E-05 2.78 8.37E+04 Gamma
FTR>1H MDP 2016 1 8,419 2.13E-05 1.78 8.34E+04 Gamma
FTR>1H MDP 2017 0 7,177 9.50E-06 0.78 8.22E+04 Gamma
FTR>1H MDP 2018 0 7,697 9.44E-06 0.78 8.27E+04 Gamma
FTR<1H MDP 1998 1 1,755 1.70E-04 2.82 1.65E+04 Gamma
FTR<1H MDP 1999 1 1,655 1.71E-04 2.82 1.64E+04 Gamma
FTR<1H MDP 2000 1 1,828 1.70E-04 2.82 1.66E+04 Gamma
FTR<1H MDP 2001 1 1,732 1.71E-04 2.82 1.65E+04 Gamma
FTR<1H MDP 2002 0 1,991 1.08E-04 1.82 1.68E+04 Gamma
FTR<1H MDP 2003 0 2,102 1.08E-04 1.82 1.69E+04 Gamma
FTR<1H MDP 2004 1 1,986 1.68E-04 2.82 1.68E+04 Gamma
FTR<1H MDP 2005 2 2,219 2.25E-04 3.82 1.70E+04 Gamma
FTR<1H MDP 2006 1 2,081 1.67E-04 2.82 1.69E+04 Gamma
FTR<1H MDP 2007 0 1,969 1.09E-04 1.82 1.68E+04 Gamma
FTR<1H MDP 2008 0 2,090 1.08E-04 1.82 1.69E+04 Gamma
FTR<1H MDP 2009 0 1,997 1.08E-04 1.82 1.68E+04 Gamma
FTR<1H MDP 2010 1 1,879 1.69E-04 2.82 1.67E+04 Gamma
FTR<1H MDP 2011 0 2,189 1.07E-04 1.82 1.70E+04 Gamma
FTR<1H MDP 2012 0 2,013 1.08E-04 1.82 1.68E+04 Gamma
FTR<1H MDP 2013 2 1,942 2.28E-04 3.82 1.67E+04 Gamma
FTR<1H MDP 2014 0 1,965 1.09E-04 1.82 1.68E+04 Gamma
FTR<1H MDP 2015 0 2,000 1.08E-04 1.82 1.68E+04 Gamma
FTR<1H MDP 2016 0 1,841 1.09E-04 1.82 1.66E+04 Gamma
FTR<1H MDP 2017 0 1,903 1.09E-04 1.82 1.67E+04 Gamma
FTR<1H MDP 2018 0 1,847 1.09E-04 1.82 1.66E+04 Gamma
FTS MDP 1998 3 1,755 1.30E-03 4.95 3.81E+03 Beta
FTS MDP 1999 4 1,655 1.60E-03 5.95 3.71E+03 Beta
FTS MDP 2000 5 1,828 1.79E-03 6.95 3.88E+03 Beta
FTS MDP 2001 1 1,732 7.78E-04 2.95 3.78E+03 Beta
FTS MDP 2002 3 1,991 1.22E-03 4.95 4.04E+03 Beta
FTS MDP 2003 1 2,102 7.09E-04 2.95 4.16E+03 Beta
FTS MDP 2004 0 1,986 4.82E-04 1.95 4.04E+03 Beta
FTS MDP 2005 4 2,219 1.39E-03 5.95 4.27E+03 Beta
FTS MDP 2006 5 2,081 1.68E-03 6.95 4.13E+03 Beta
FTS MDP 2007 2 1,969 9.81E-04 3.95 4.02E+03 Beta
FTS MDP 2008 0 2,090 4.70E-04 1.95 4.14E+03 Beta
FTS MDP 2009 1 1,997 7.27E-04 2.95 4.05E+03 Beta
FTS MDP 2010 1 1,879 7.49E-04 2.95 3.93E+03 Beta
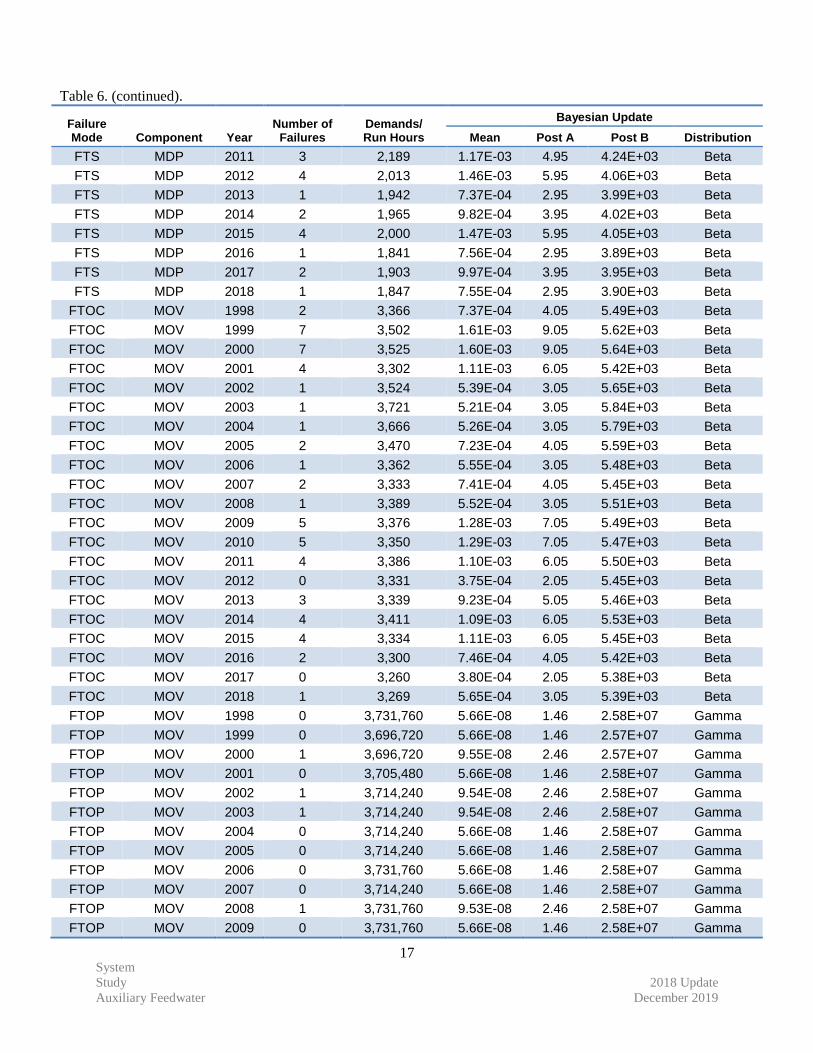
Table 6. (continued).
System
Study 2018 Update
Auxiliary Feedwater December 2019
17
Failure Mode Component Year
Number of Failures
Demands/ Run Hours
Bayesian Update
Mean Post A Post B Distribution
FTS MDP 2011 3 2,189 1.17E-03 4.95 4.24E+03 Beta
FTS MDP 2012 4 2,013 1.46E-03 5.95 4.06E+03 Beta
FTS MDP 2013 1 1,942 7.37E-04 2.95 3.99E+03 Beta
FTS MDP 2014 2 1,965 9.82E-04 3.95 4.02E+03 Beta
FTS MDP 2015 4 2,000 1.47E-03 5.95 4.05E+03 Beta
FTS MDP 2016 1 1,841 7.56E-04 2.95 3.89E+03 Beta
FTS MDP 2017 2 1,903 9.97E-04 3.95 3.95E+03 Beta
FTS MDP 2018 1 1,847 7.55E-04 2.95 3.90E+03 Beta
FTOC MOV 1998 2 3,366 7.37E-04 4.05 5.49E+03 Beta
FTOC MOV 1999 7 3,502 1.61E-03 9.05 5.62E+03 Beta
FTOC MOV 2000 7 3,525 1.60E-03 9.05 5.64E+03 Beta
FTOC MOV 2001 4 3,302 1.11E-03 6.05 5.42E+03 Beta
FTOC MOV 2002 1 3,524 5.39E-04 3.05 5.65E+03 Beta
FTOC MOV 2003 1 3,721 5.21E-04 3.05 5.84E+03 Beta
FTOC MOV 2004 1 3,666 5.26E-04 3.05 5.79E+03 Beta
FTOC MOV 2005 2 3,470 7.23E-04 4.05 5.59E+03 Beta
FTOC MOV 2006 1 3,362 5.55E-04 3.05 5.48E+03 Beta
FTOC MOV 2007 2 3,333 7.41E-04 4.05 5.45E+03 Beta
FTOC MOV 2008 1 3,389 5.52E-04 3.05 5.51E+03 Beta
FTOC MOV 2009 5 3,376 1.28E-03 7.05 5.49E+03 Beta
FTOC MOV 2010 5 3,350 1.29E-03 7.05 5.47E+03 Beta
FTOC MOV 2011 4 3,386 1.10E-03 6.05 5.50E+03 Beta
FTOC MOV 2012 0 3,331 3.75E-04 2.05 5.45E+03 Beta
FTOC MOV 2013 3 3,339 9.23E-04 5.05 5.46E+03 Beta
FTOC MOV 2014 4 3,411 1.09E-03 6.05 5.53E+03 Beta
FTOC MOV 2015 4 3,334 1.11E-03 6.05 5.45E+03 Beta
FTOC MOV 2016 2 3,300 7.46E-04 4.05 5.42E+03 Beta
FTOC MOV 2017 0 3,260 3.80E-04 2.05 5.38E+03 Beta
FTOC MOV 2018 1 3,269 5.65E-04 3.05 5.39E+03 Beta
FTOP MOV 1998 0 3,731,760 5.66E-08 1.46 2.58E+07 Gamma
FTOP MOV 1999 0 3,696,720 5.66E-08 1.46 2.57E+07 Gamma
FTOP MOV 2000 1 3,696,720 9.55E-08 2.46 2.57E+07 Gamma
FTOP MOV 2001 0 3,705,480 5.66E-08 1.46 2.58E+07 Gamma
FTOP MOV 2002 1 3,714,240 9.54E-08 2.46 2.58E+07 Gamma
FTOP MOV 2003 1 3,714,240 9.54E-08 2.46 2.58E+07 Gamma
FTOP MOV 2004 0 3,714,240 5.66E-08 1.46 2.58E+07 Gamma
FTOP MOV 2005 0 3,714,240 5.66E-08 1.46 2.58E+07 Gamma
FTOP MOV 2006 0 3,731,760 5.66E-08 1.46 2.58E+07 Gamma
FTOP MOV 2007 0 3,714,240 5.66E-08 1.46 2.58E+07 Gamma
FTOP MOV 2008 1 3,731,760 9.53E-08 2.46 2.58E+07 Gamma
FTOP MOV 2009 0 3,731,760 5.66E-08 1.46 2.58E+07 Gamma
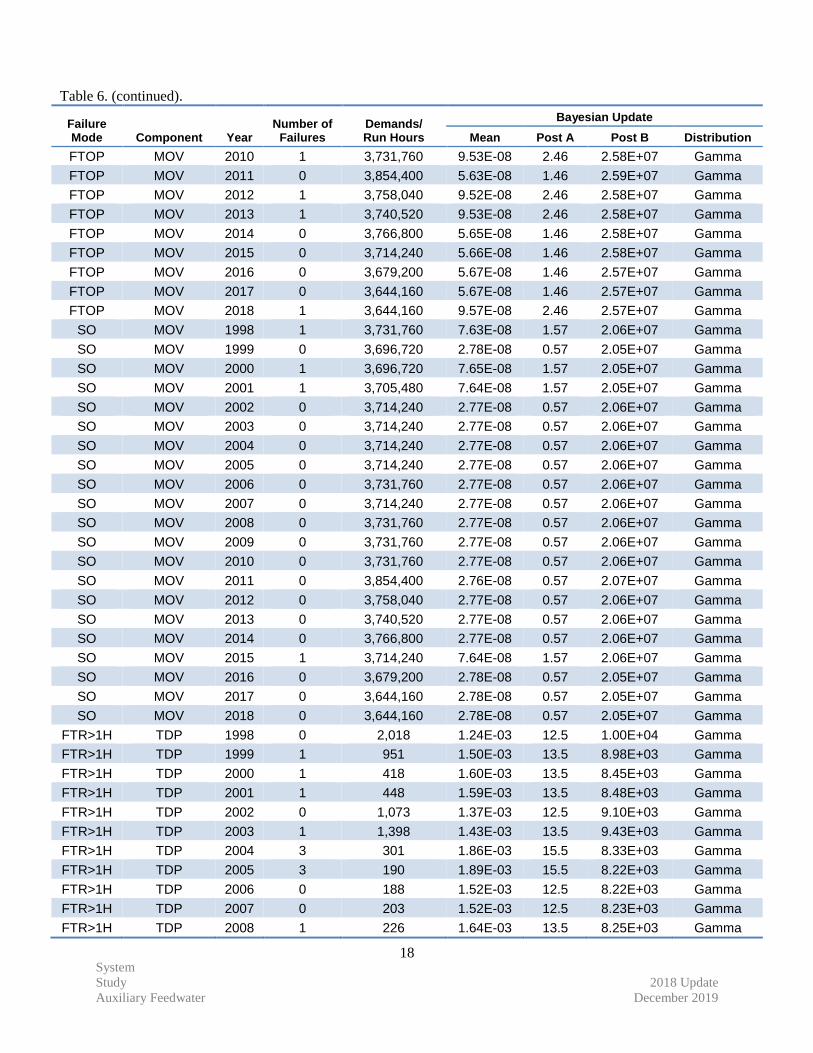
Table 6. (continued).
System
Study 2018 Update
Auxiliary Feedwater December 2019
18
Failure Mode Component Year
Number of Failures
Demands/ Run Hours
Bayesian Update
Mean Post A Post B Distribution
FTOP MOV 2010 1 3,731,760 9.53E-08 2.46 2.58E+07 Gamma
FTOP MOV 2011 0 3,854,400 5.63E-08 1.46 2.59E+07 Gamma
FTOP MOV 2012 1 3,758,040 9.52E-08 2.46 2.58E+07 Gamma
FTOP MOV 2013 1 3,740,520 9.53E-08 2.46 2.58E+07 Gamma
FTOP MOV 2014 0 3,766,800 5.65E-08 1.46 2.58E+07 Gamma
FTOP MOV 2015 0 3,714,240 5.66E-08 1.46 2.58E+07 Gamma
FTOP MOV 2016 0 3,679,200 5.67E-08 1.46 2.57E+07 Gamma
FTOP MOV 2017 0 3,644,160 5.67E-08 1.46 2.57E+07 Gamma
FTOP MOV 2018 1 3,644,160 9.57E-08 2.46 2.57E+07 Gamma
SO MOV 1998 1 3,731,760 7.63E-08 1.57 2.06E+07 Gamma
SO MOV 1999 0 3,696,720 2.78E-08 0.57 2.05E+07 Gamma
SO MOV 2000 1 3,696,720 7.65E-08 1.57 2.05E+07 Gamma
SO MOV 2001 1 3,705,480 7.64E-08 1.57 2.05E+07 Gamma
SO MOV 2002 0 3,714,240 2.77E-08 0.57 2.06E+07 Gamma
SO MOV 2003 0 3,714,240 2.77E-08 0.57 2.06E+07 Gamma
SO MOV 2004 0 3,714,240 2.77E-08 0.57 2.06E+07 Gamma
SO MOV 2005 0 3,714,240 2.77E-08 0.57 2.06E+07 Gamma
SO MOV 2006 0 3,731,760 2.77E-08 0.57 2.06E+07 Gamma
SO MOV 2007 0 3,714,240 2.77E-08 0.57 2.06E+07 Gamma
SO MOV 2008 0 3,731,760 2.77E-08 0.57 2.06E+07 Gamma
SO MOV 2009 0 3,731,760 2.77E-08 0.57 2.06E+07 Gamma
SO MOV 2010 0 3,731,760 2.77E-08 0.57 2.06E+07 Gamma
SO MOV 2011 0 3,854,400 2.76E-08 0.57 2.07E+07 Gamma
SO MOV 2012 0 3,758,040 2.77E-08 0.57 2.06E+07 Gamma
SO MOV 2013 0 3,740,520 2.77E-08 0.57 2.06E+07 Gamma
SO MOV 2014 0 3,766,800 2.77E-08 0.57 2.06E+07 Gamma
SO MOV 2015 1 3,714,240 7.64E-08 1.57 2.06E+07 Gamma
SO MOV 2016 0 3,679,200 2.78E-08 0.57 2.05E+07 Gamma
SO MOV 2017 0 3,644,160 2.78E-08 0.57 2.05E+07 Gamma
SO MOV 2018 0 3,644,160 2.78E-08 0.57 2.05E+07 Gamma
FTR>1H TDP 1998 0 2,018 1.24E-03 12.5 1.00E+04 Gamma
FTR>1H TDP 1999 1 951 1.50E-03 13.5 8.98E+03 Gamma
FTR>1H TDP 2000 1 418 1.60E-03 13.5 8.45E+03 Gamma
FTR>1H TDP 2001 1 448 1.59E-03 13.5 8.48E+03 Gamma
FTR>1H TDP 2002 0 1,073 1.37E-03 12.5 9.10E+03 Gamma
FTR>1H TDP 2003 1 1,398 1.43E-03 13.5 9.43E+03 Gamma
FTR>1H TDP 2004 3 301 1.86E-03 15.5 8.33E+03 Gamma
FTR>1H TDP 2005 3 190 1.89E-03 15.5 8.22E+03 Gamma
FTR>1H TDP 2006 0 188 1.52E-03 12.5 8.22E+03 Gamma
FTR>1H TDP 2007 0 203 1.52E-03 12.5 8.23E+03 Gamma
FTR>1H TDP 2008 1 226 1.64E-03 13.5 8.25E+03 Gamma
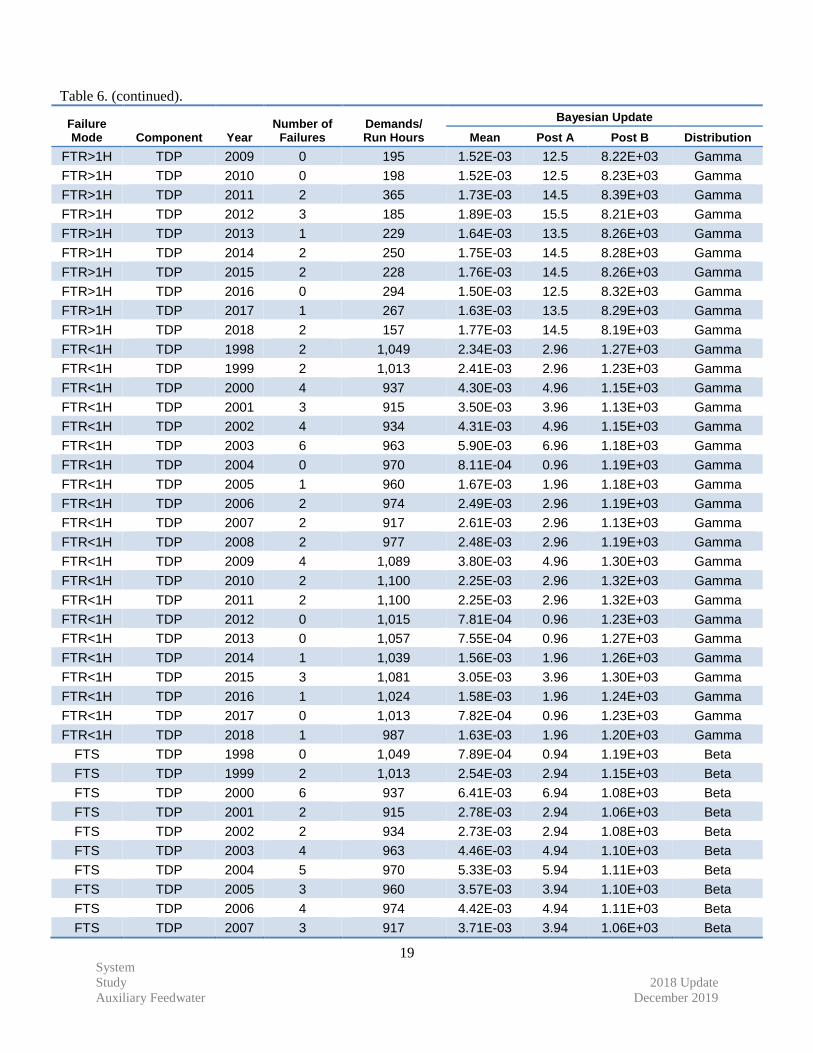
Table 6. (continued).
System
Study 2018 Update
Auxiliary Feedwater December 2019
19
Failure Mode Component Year
Number of Failures
Demands/ Run Hours
Bayesian Update
Mean Post A Post B Distribution
FTR>1H TDP 2009 0 195 1.52E-03 12.5 8.22E+03 Gamma
FTR>1H TDP 2010 0 198 1.52E-03 12.5 8.23E+03 Gamma
FTR>1H TDP 2011 2 365 1.73E-03 14.5 8.39E+03 Gamma
FTR>1H TDP 2012 3 185 1.89E-03 15.5 8.21E+03 Gamma
FTR>1H TDP 2013 1 229 1.64E-03 13.5 8.26E+03 Gamma
FTR>1H TDP 2014 2 250 1.75E-03 14.5 8.28E+03 Gamma
FTR>1H TDP 2015 2 228 1.76E-03 14.5 8.26E+03 Gamma
FTR>1H TDP 2016 0 294 1.50E-03 12.5 8.32E+03 Gamma
FTR>1H TDP 2017 1 267 1.63E-03 13.5 8.29E+03 Gamma
FTR>1H TDP 2018 2 157 1.77E-03 14.5 8.19E+03 Gamma
FTR<1H TDP 1998 2 1,049 2.34E-03 2.96 1.27E+03 Gamma
FTR<1H TDP 1999 2 1,013 2.41E-03 2.96 1.23E+03 Gamma
FTR<1H TDP 2000 4 937 4.30E-03 4.96 1.15E+03 Gamma
FTR<1H TDP 2001 3 915 3.50E-03 3.96 1.13E+03 Gamma
FTR<1H TDP 2002 4 934 4.31E-03 4.96 1.15E+03 Gamma
FTR<1H TDP 2003 6 963 5.90E-03 6.96 1.18E+03 Gamma
FTR<1H TDP 2004 0 970 8.11E-04 0.96 1.19E+03 Gamma
FTR<1H TDP 2005 1 960 1.67E-03 1.96 1.18E+03 Gamma
FTR<1H TDP 2006 2 974 2.49E-03 2.96 1.19E+03 Gamma
FTR<1H TDP 2007 2 917 2.61E-03 2.96 1.13E+03 Gamma
FTR<1H TDP 2008 2 977 2.48E-03 2.96 1.19E+03 Gamma
FTR<1H TDP 2009 4 1,089 3.80E-03 4.96 1.30E+03 Gamma
FTR<1H TDP 2010 2 1,100 2.25E-03 2.96 1.32E+03 Gamma
FTR<1H TDP 2011 2 1,100 2.25E-03 2.96 1.32E+03 Gamma
FTR<1H TDP 2012 0 1,015 7.81E-04 0.96 1.23E+03 Gamma
FTR<1H TDP 2013 0 1,057 7.55E-04 0.96 1.27E+03 Gamma
FTR<1H TDP 2014 1 1,039 1.56E-03 1.96 1.26E+03 Gamma
FTR<1H TDP 2015 3 1,081 3.05E-03 3.96 1.30E+03 Gamma
FTR<1H TDP 2016 1 1,024 1.58E-03 1.96 1.24E+03 Gamma
FTR<1H TDP 2017 0 1,013 7.82E-04 0.96 1.23E+03 Gamma
FTR<1H TDP 2018 1 987 1.63E-03 1.96 1.20E+03 Gamma
FTS TDP 1998 0 1,049 7.89E-04 0.94 1.19E+03 Beta
FTS TDP 1999 2 1,013 2.54E-03 2.94 1.15E+03 Beta
FTS TDP 2000 6 937 6.41E-03 6.94 1.08E+03 Beta
FTS TDP 2001 2 915 2.78E-03 2.94 1.06E+03 Beta
FTS TDP 2002 2 934 2.73E-03 2.94 1.08E+03 Beta
FTS TDP 2003 4 963 4.46E-03 4.94 1.10E+03 Beta
FTS TDP 2004 5 970 5.33E-03 5.94 1.11E+03 Beta
FTS TDP 2005 3 960 3.57E-03 3.94 1.10E+03 Beta
FTS TDP 2006 4 974 4.42E-03 4.94 1.11E+03 Beta
FTS TDP 2007 3 917 3.71E-03 3.94 1.06E+03 Beta
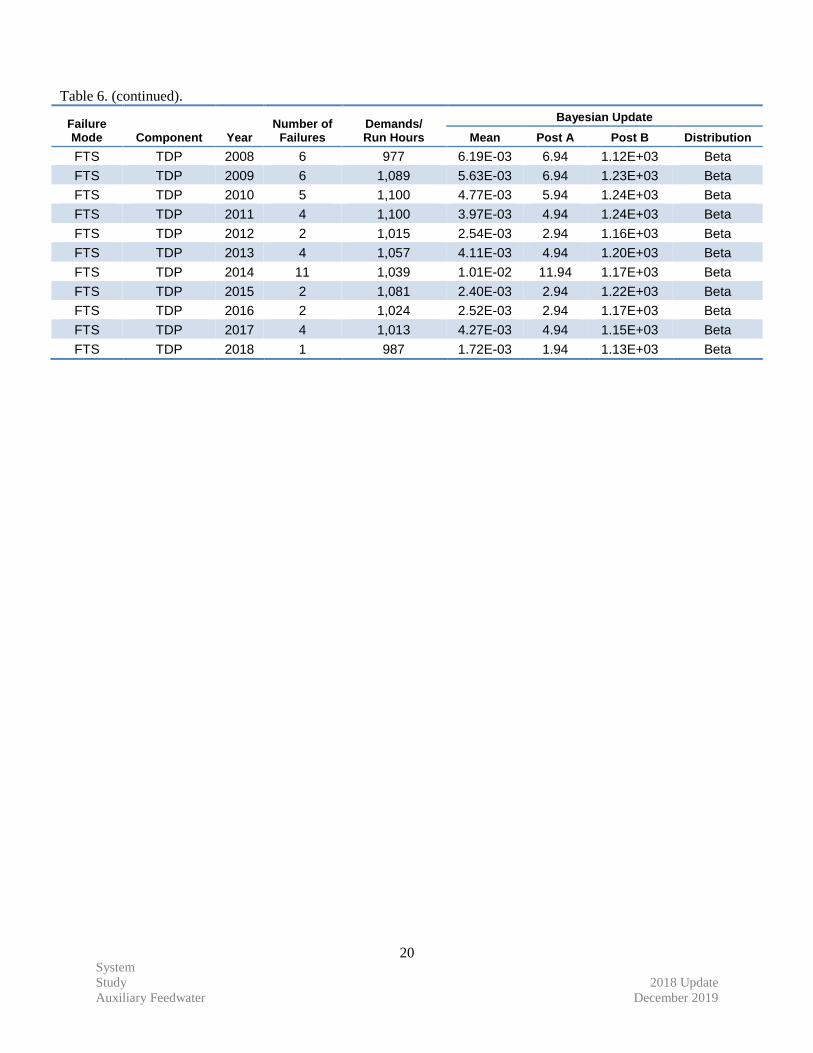
Table 6. (continued).
System
Study 2018 Update
Auxiliary Feedwater December 2019
20
Failure Mode Component Year
Number of Failures
Demands/ Run Hours
Bayesian Update
Mean Post A Post B Distribution
FTS TDP 2008 6 977 6.19E-03 6.94 1.12E+03 Beta
FTS TDP 2009 6 1,089 5.63E-03 6.94 1.23E+03 Beta
FTS TDP 2010 5 1,100 4.77E-03 5.94 1.24E+03 Beta
FTS TDP 2011 4 1,100 3.97E-03 4.94 1.24E+03 Beta
FTS TDP 2012 2 1,015 2.54E-03 2.94 1.16E+03 Beta
FTS TDP 2013 4 1,057 4.11E-03 4.94 1.20E+03 Beta
FTS TDP 2014 11 1,039 1.01E-02 11.94 1.17E+03 Beta
FTS TDP 2015 2 1,081 2.40E-03 2.94 1.22E+03 Beta
FTS TDP 2016 2 1,024 2.52E-03 2.94 1.17E+03 Beta
FTS TDP 2017 4 1,013 4.27E-03 4.94 1.15E+03 Beta
FTS TDP 2018 1 987 1.72E-03 1.94 1.13E+03 Beta
System
Study
2018 Update
Auxiliary Feedwater
December 2019
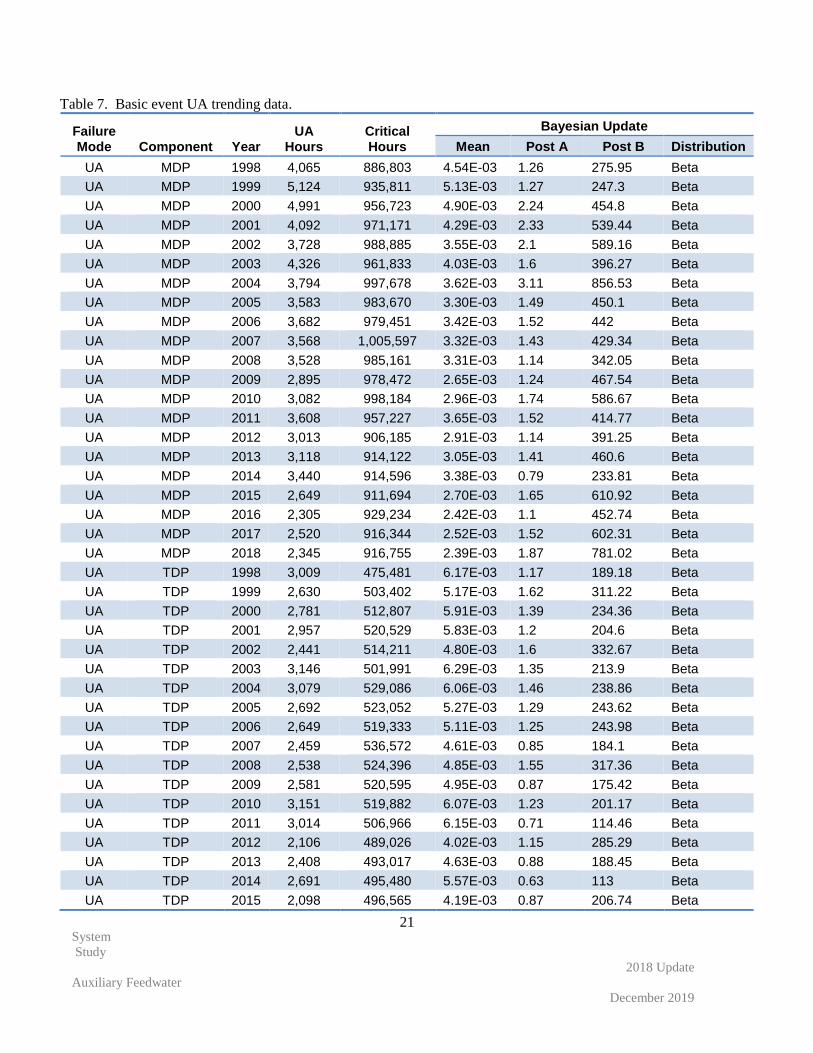
21
Table 7. Basic event UA trending data.
Failure Mode Component Year
UA Hours
Critical Hours
Bayesian Update
Mean Post A Post B Distribution
UA MDP 1998 4,065 886,803 4.54E-03 1.26 275.95 Beta
UA MDP 1999 5,124 935,811 5.13E-03 1.27 247.3 Beta
UA MDP 2000 4,991 956,723 4.90E-03 2.24 454.8 Beta
UA MDP 2001 4,092 971,171 4.29E-03 2.33 539.44 Beta
UA MDP 2002 3,728 988,885 3.55E-03 2.1 589.16 Beta
UA MDP 2003 4,326 961,833 4.03E-03 1.6 396.27 Beta
UA MDP 2004 3,794 997,678 3.62E-03 3.11 856.53 Beta
UA MDP 2005 3,583 983,670 3.30E-03 1.49 450.1 Beta
UA MDP 2006 3,682 979,451 3.42E-03 1.52 442 Beta
UA MDP 2007 3,568 1,005,597 3.32E-03 1.43 429.34 Beta
UA MDP 2008 3,528 985,161 3.31E-03 1.14 342.05 Beta
UA MDP 2009 2,895 978,472 2.65E-03 1.24 467.54 Beta
UA MDP 2010 3,082 998,184 2.96E-03 1.74 586.67 Beta
UA MDP 2011 3,608 957,227 3.65E-03 1.52 414.77 Beta
UA MDP 2012 3,013 906,185 2.91E-03 1.14 391.25 Beta
UA MDP 2013 3,118 914,122 3.05E-03 1.41 460.6 Beta
UA MDP 2014 3,440 914,596 3.38E-03 0.79 233.81 Beta
UA MDP 2015 2,649 911,694 2.70E-03 1.65 610.92 Beta
UA MDP 2016 2,305 929,234 2.42E-03 1.1 452.74 Beta
UA MDP 2017 2,520 916,344 2.52E-03 1.52 602.31 Beta
UA MDP 2018 2,345 916,755 2.39E-03 1.87 781.02 Beta
UA TDP 1998 3,009 475,481 6.17E-03 1.17 189.18 Beta
UA TDP 1999 2,630 503,402 5.17E-03 1.62 311.22 Beta
UA TDP 2000 2,781 512,807 5.91E-03 1.39 234.36 Beta
UA TDP 2001 2,957 520,529 5.83E-03 1.2 204.6 Beta
UA TDP 2002 2,441 514,211 4.80E-03 1.6 332.67 Beta
UA TDP 2003 3,146 501,991 6.29E-03 1.35 213.9 Beta
UA TDP 2004 3,079 529,086 6.06E-03 1.46 238.86 Beta
UA TDP 2005 2,692 523,052 5.27E-03 1.29 243.62 Beta
UA TDP 2006 2,649 519,333 5.11E-03 1.25 243.98 Beta
UA TDP 2007 2,459 536,572 4.61E-03 0.85 184.1 Beta
UA TDP 2008 2,538 524,396 4.85E-03 1.55 317.36 Beta
UA TDP 2009 2,581 520,595 4.95E-03 0.87 175.42 Beta
UA TDP 2010 3,151 519,882 6.07E-03 1.23 201.17 Beta
UA TDP 2011 3,014 506,966 6.15E-03 0.71 114.46 Beta
UA TDP 2012 2,106 489,026 4.02E-03 1.15 285.29 Beta
UA TDP 2013 2,408 493,017 4.63E-03 0.88 188.45 Beta
UA TDP 2014 2,691 495,480 5.57E-03 0.63 113 Beta
UA TDP 2015 2,098 496,565 4.19E-03 0.87 206.74 Beta
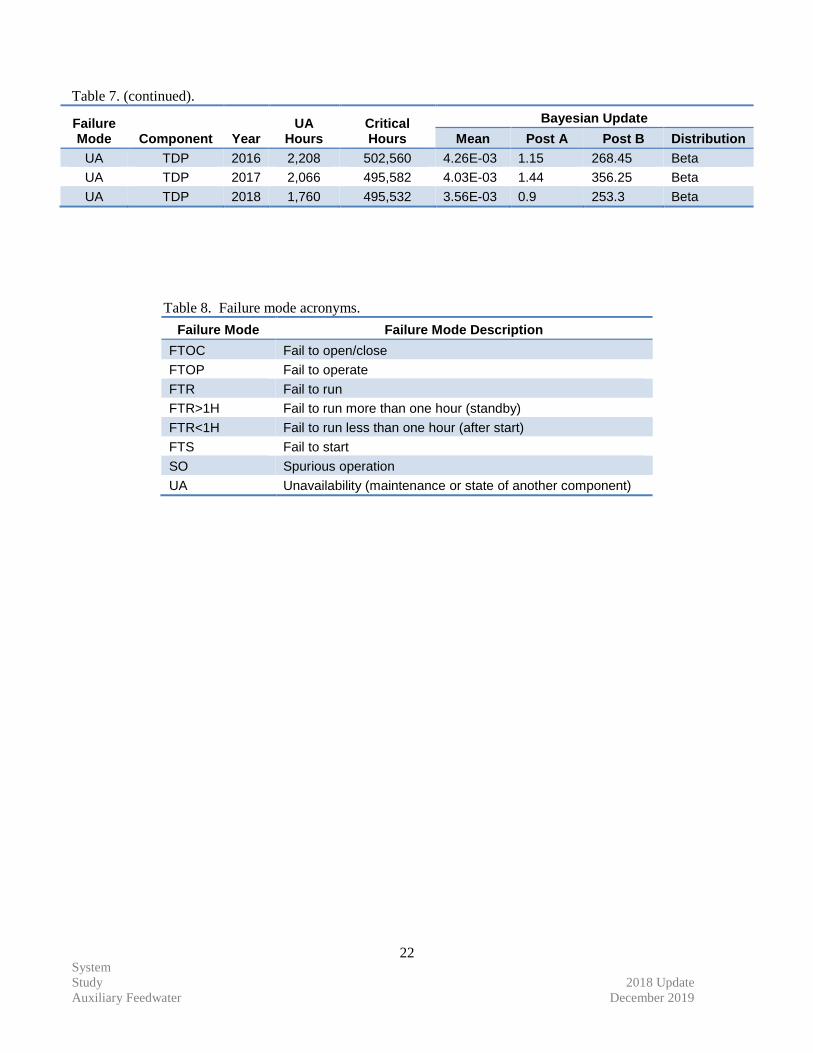
Table 7. (continued).
System
Study 2018 Update
Auxiliary Feedwater December 2019
22
Failure Mode Component Year
UA Hours
Critical Hours
Bayesian Update
Mean Post A Post B Distribution
UA TDP 2016 2,208 502,560 4.26E-03 1.15 268.45 Beta
UA TDP 2017 2,066 495,582 4.03E-03 1.44 356.25 Beta
UA TDP 2018 1,760 495,532 3.56E-03 0.9 253.3 Beta
Table 8. Failure mode acronyms.
Failure Mode Failure Mode Description
FTOC Fail to open/close
FTOP Fail to operate
FTR Fail to run
FTR>1H Fail to run more than one hour (standby)
FTR<1H Fail to run less than one hour (after start)
FTS Fail to start
SO Spurious operation
UA Unavailability (maintenance or state of another component)
System
Study
2018 Update
Auxiliary Feedwater
December 2019
23
7. SYSTEM DESCRIPTION
The main purpose of the AFW system is to provide feedwater to the steam generators to maintain a heat sink
in the event of (1) a loss of main feedwater, (2) a reactor trip and loss of offsite power, and (3) a small break loss
of coolant accident. The system, at some plants, can also provide a source of feedwater to the steam generators
during plant startup and shutdown. However, the system cannot supply sufficient feedwater flow during power
operation. At most plants, the system can only supply adequate feedwater to the steam generators with steam
loads less than 5% of rated flow.
The safety-related function of the AFW system is to maintain water inventory in the steam generators for
reactor residual heat removal when the main feedwater system is unavailable. The system is designed to
automatically start and supply sufficient feedwater to prevent the relief of primary coolant through the pressurizer
safety valves. The AFW system, in conjunction with the steam generators and the main steam line atmospheric
relief and/or safety valves, is used to cool the reactor coolant system to the residual heat removal cut-in
temperature and pressure. At this temperature and pressure, the residual heat removal system is used to further
cool the reactor coolant system. The AFW system may also be used to temporarily hold the plant in a hot standby
condition while main feedwater flow is being restored, with the option of cooling the reactor coolant system to the
residual heat removal system initiation temperature.
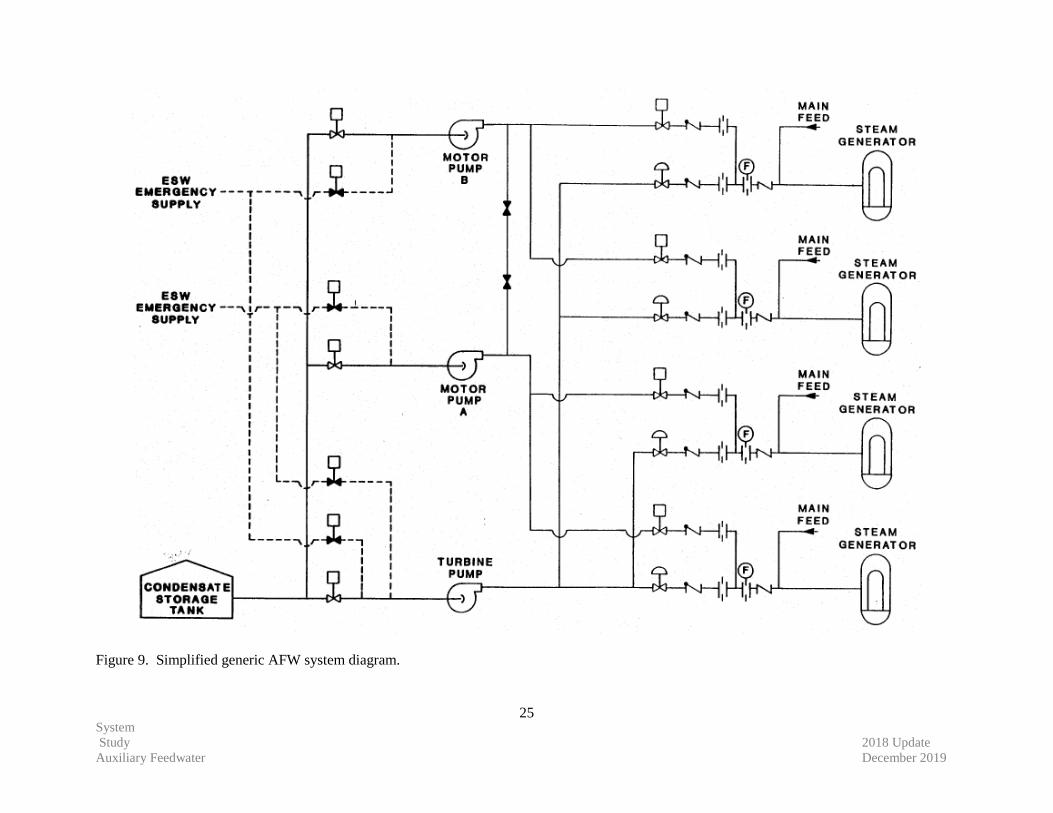
The AFW system typically consists of at least two independent divisions. The divisions consist of a number
of different combinations of electric-motor-driven and/or turbine-driven pump trains or diesel-driven pump trains.
Electrical power, control, and instrumentation associated with each division are independent from one another.
Typically, the electric-motor-driven pump trains make up one division and the turbine-driven pump train the
other. Some plants have a diesel-driven pump in place of the turbine-driven pump, or a second turbine-driven
pump in place of the electric-motor-driven pumps. Figure 9 shows a simplified generic AFW system diagram.
The AFW system is typically started automatically by the engineered safety features actuation system
(ESFAS) or equivalent, depending on plant design and terminology. The ESFAS system automatic start signals
include a predetermined low water level condition in one or more steam generators, a loss of the operating main
feedwater pumps, a loss of electrical power on safety-related buses, and a safety injection signal. There are
additional start signals, but these four are the most common. There is significant variation among the plants in
how the system responds given a start signal. However, in most cases, a low-level condition in one steam
generator starts only the electric-motor-driven pumps, while a low-level condition in two or more steam
generators starts both the electric and turbine-driven pumps. For the plants that have two divisions consisting of
one train per division (i.e., an electric-motor and turbine-driven pump train), most start signals start both pumps.
Feedwater flow to each steam generator is normally controlled by a flow control valve that will modulate
either open or closed to maintain steam generator level. The flow control valve can be controlled either
automatically or manually. A flow recirculation line is provided downstream of each pump discharge. The
recirculation line allows for continuous flow back to the suction source to provide minimum flow protection for
the pump. In addition, a test return line is provided downstream of each pump discharge to allow for either full or
partial testing of the pumps. To limit the flow, as steam generator pressure lowers during a cool down, the system
utilizes several different methods depending on plant design. Some plants use a current limiter that acts to
increase downstream pump pressure thereby reducing motor amps, others use flow restricting orifices or pipe
design configurations, and others use the flow control valve that modulates closed when a flow reduction signal is
received.
The turbine for each turbine-driven pump is classified as an atmospheric discharge, non-condensing turbine.
Typically, driving steam is supplied from the main steam lines upstream of the main steam isolation valves from
at least two steam generators. (Design class 11 turbine steam supply is from one steam generator.) Each steam
supply line to the turbine contains a normally closed fail-open air operated steam isolation valve. Some plants
System
Study 2018 Update
Auxiliary Feedwater December 2019
24
have a dc-powered motor-operated valve. A bypass is provided around each of these isolation valves with a flow-
restricting orifice and a normally closed fail-to-open air-operated bypass isolation valve. The bypass provides a
small, controlled rate of steam flow to the AFW turbine for warming the steam lines and turbine. Steam drain
traps are provided in the low points of the steam line to drain condensate from the lines as condensate present in
the steam lines could have an adverse effect on turbine reliability during an unplanned demand.
Each turbine is supplied with a hydraulic governor control valve, and a trip and throttle valve with motor reset
capability. The turbine is brought up to speed by governor control upon being supplied with steam by opening the
steam supply isolation valve(s). The governor then controls the turbine speed at the pump rated speed by
modulating the governor control valve. The governor controlled turbine speed can be adjusted from the control
room, the remote shutdown panel, or manually at the governor.
The turbine is stopped by remotely closing the trip throttle valve from the control room or the remote
shutdown panel. The trip and throttle valve is automatically (electrically) tripped on turbine overspeed at 115%
of rated speed. The electric overspeed trip can be reset from either the control room or remote shutdown panel. A
mechanical overspeed trip also provides automatic overspeed protection at 125% of rated speed. The mechanical
overspeed trip can only be reset at the trip and throttle valve.
Feedwater is supplied to both divisions through either a single condensate storage tank with separate suction
supply lines or two storage tanks with redundant supply lines. Each tank typically will have its level maintained
above the minimum volume needed to provide a net positive suction head to the pumps and allow for 6 hours of
system operation. For extended operation of the system or as a backup for the storage tanks, an ensured source of
water is provided from a service water system. The switchover to the ensured source can be accomplished by
either an automatic re-alignment of the suction valves based on a sensed, low-suction pressure condition or
manually by operator action depending on the plant design (typical alignment at most plants is by manual
capability).
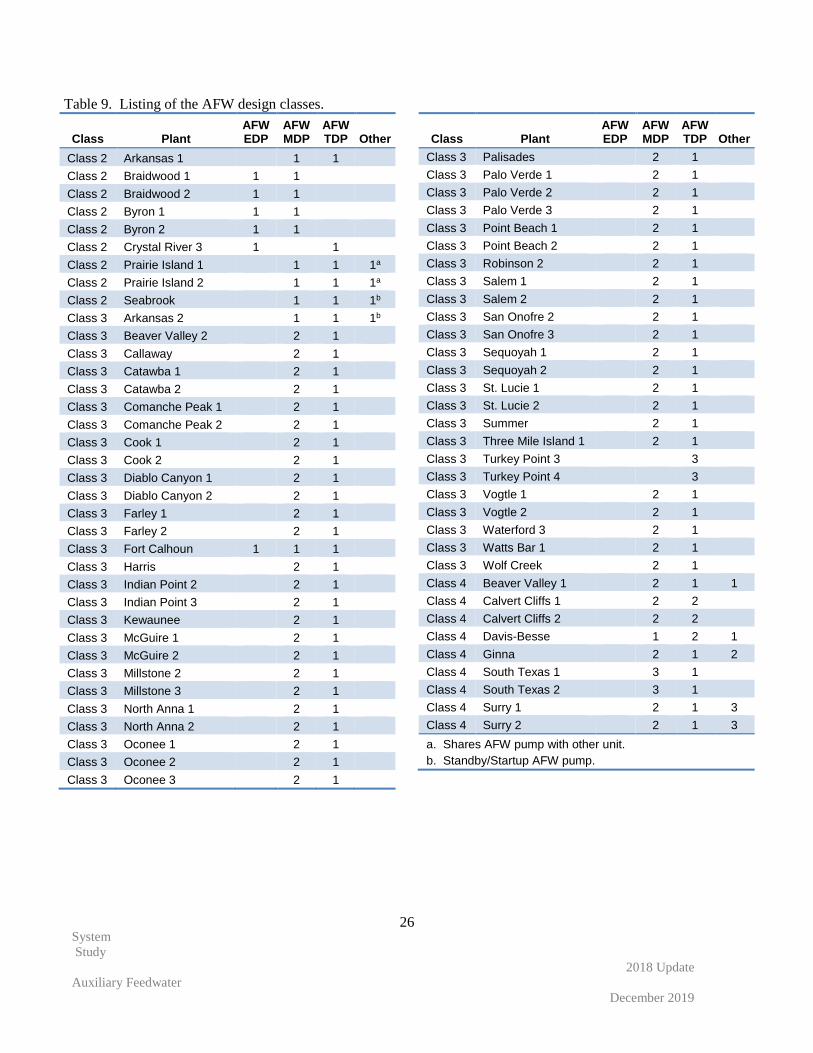
The AFW systems analyzed can be grouped into three different design classes based on the effective
redundancy of the pumps. Each system typically consists of at least two independent divisions. The divisions
consist of a number of motor-, turbine-, and/or diesel-driven pumps. In addition, some SPAR models include
other sources of emergency feed water such as the startup feedwater pump(s). The configurations are shown in
Table 9.
System
Study 2018 Update
Auxiliary Feedwater December 2019
25
Figure 9. Simplified generic AFW system diagram.
System
Study
2018 Update
Auxiliary Feedwater
December 2019
26
Table 9. Listing of the AFW design classes.
Class Plant AFW EDP
AFW MDP
AFW TDP Other
Class 2 Arkansas 1 1 1
Class 2 Braidwood 1 1 1
Class 2 Braidwood 2 1 1
Class 2 Byron 1 1 1
Class 2 Byron 2 1 1
Class 2 Crystal River 3 1 1
Class 2 Prairie Island 1 1 1 1a
Class 2 Prairie Island 2 1 1 1a
Class 2 Seabrook 1 1 1b
Class 3 Arkansas 2 1 1 1b
Class 3 Beaver Valley 2 2 1
Class 3 Callaway 2 1
Class 3 Catawba 1 2 1
Class 3 Catawba 2 2 1
Class 3 Comanche Peak 1 2 1
Class 3 Comanche Peak 2 2 1
Class 3 Cook 1 2 1
Class 3 Cook 2 2 1
Class 3 Diablo Canyon 1 2 1
Class 3 Diablo Canyon 2 2 1
Class 3 Farley 1 2 1
Class 3 Farley 2 2 1
Class 3 Fort Calhoun 1 1 1
Class 3 Harris 2 1
Class 3 Indian Point 2 2 1
Class 3 Indian Point 3 2 1
Class 3 Kewaunee 2 1
Class 3 McGuire 1 2 1
Class 3 McGuire 2 2 1
Class 3 Millstone 2 2 1
Class 3 Millstone 3 2 1
Class 3 North Anna 1 2 1
Class 3 North Anna 2 2 1
Class 3 Oconee 1 2 1
Class 3 Oconee 2 2 1
Class 3 Oconee 3 2 1
Class Plant AFW EDP
AFW MDP
AFW TDP Other
Class 3 Palisades 2 1
Class 3 Palo Verde 1 2 1
Class 3 Palo Verde 2 2 1
Class 3 Palo Verde 3 2 1
Class 3 Point Beach 1 2 1
Class 3 Point Beach 2 2 1
Class 3 Robinson 2 2 1
Class 3 Salem 1 2 1
Class 3 Salem 2 2 1
Class 3 San Onofre 2 2 1
Class 3 San Onofre 3 2 1
Class 3 Sequoyah 1 2 1
Class 3 Sequoyah 2 2 1
Class 3 St. Lucie 1 2 1
Class 3 St. Lucie 2 2 1
Class 3 Summer 2 1
Class 3 Three Mile Island 1 2 1
Class 3 Turkey Point 3 3
Class 3 Turkey Point 4 3
Class 3 Vogtle 1 2 1
Class 3 Vogtle 2 2 1
Class 3 Waterford 3 2 1
Class 3 Watts Bar 1 2 1
Class 3 Wolf Creek 2 1
Class 4 Beaver Valley 1 2 1 1
Class 4 Calvert Cliffs 1 2 2
Class 4 Calvert Cliffs 2 2 2
Class 4 Davis-Besse 1 2 1
Class 4 Ginna 2 1 2
Class 4 South Texas 1 3 1
Class 4 South Texas 2 3 1
Class 4 Surry 1 2 1 3
Class 4 Surry 2 2 1 3
a. Shares AFW pump with other unit.
b. Standby/Startup AFW pump.
System
Study 2018 Update
Auxiliary Feedwater December 2019
27
8. REFERENCES
[1] United States Nuclear Regulatory Commission, "Component Reliability Data Sheets Update 2015,"
February 2017. [Online]. Available:
https://nrcoe.inl.gov/resultsdb/publicdocs/AvgPerf/ComponentUR2015.pdf.
[2] S. A. Eide, T. E. Wierman, C. D. Gentillon, D. M. Rasmuson and C. L. Atwood, "Industry-Average
Performance for Components and Initiating Events at U.S. Commercial Nuclear Power Plants,"
NUREG/CR-6928, U.S. Nuclear Regulatory Commission, February 2007.
[3] United States Nuclear Regulatory Commission, "Component Reliability Data Sheets Update 2010,"
January 2012. [Online]. Available:
https://nrcoe.inl.gov/resultsdb/publicdocs/AvgPerf/ComponentUR2010.pdf.
[4] C. D. Gentillion, "Overview and Reference Document for Operational Experience Results and
Databases Trending," February 2016. [Online]. Available:
https://nrcoe.inl.gov/resultsdb/publicdocs/Overview-and-Reference.pdf.