systematic characterization of pan‐cancer mutation...
TRANSCRIPT

Article
Systematic characterization of pan-cancermutation clustersMarija Buljan1,2 , Peter Blattmann1 , Ruedi Aebersold1,3,* & Michael Boutros2,4,5,**
Abstract
Cancer genome sequencing has shown that driver genes can oftenbe distinguished not only by the elevated mutation frequency butalso by specific nucleotide positions that accumulate changes at ahigh rate. However, properties associated with a residue’s poten-tial to drive tumorigenesis when mutated have not yet beensystematically investigated. Here, using a novel methodologicalapproach, we identify and characterize a compendium of 180hotspot residues within 160 human proteins which occur with asignificant frequency and are likely to have functionally relevantimpact. We find that such mutations (i) are more prominent inproteins that can exist in the on and off state, (ii) reflect the iden-tity of a tumor of origin, and (iii) often localize within interfaceswhich mediate interactions with other proteins or ligands. Follow-ing, we further examine structural data for human proteincomplexes and identify a number of additional protein interfacesthat accumulate cancer mutations at a high rate. Jointly, theseanalyses suggest that disruption and dysregulation of proteininteractions can be instrumental in switching functions of cancerproteins and activating downstream changes.
Keywords cancer genomics; hotspot analysis; interface mutations; protein
complexes
Subject Categories Cancer; Computational Biology; Genome-Scale &
Integrative Biology
DOI 10.15252/msb.20177974 | Received 3 September 2017 | Revised 14
February 2018 | Accepted 15 February 2018
Mol Syst Biol (2018) 14: e7974
Introduction
Cancer genome sequencing has had a major role in mapping cellular
pathways leading to tumorigenesis (Lawrence et al, 2014; Leiserson
et al, 2015) and in elucidating diverse molecular mechanisms that
can drive oncogenic transformation (Alexandrov et al, 2013) and
drug resistance (Garraway & Lander, 2013). These mechanisms
include genomic rearrangements, smaller insertions and deletions,
or single point mutations. Eventually, they all lead to changes in the
expression levels or to altered functions of cancer driver genes and
their products. Analysis of different cancer genomics datasets has
further underscored a high degree of heterogeneity in the mutation
frequency and spectrum among different cancer types (Garraway &
Lander, 2013; Lawrence et al, 2013) and uncovered a long tail of
low-frequency driver mutations (Garraway & Lander, 2013). As a
corollary, in spite of the great progress in charting mutational events
that define different cancer types, the task to distinguish driver and
passenger mutations in an individual genome remains a formidable
challenge. Furthermore, even when a high mutation rate across a
number of patients indicates the gene is a cancer driver, functional
impact of individual mutations and their connection to the affected
cellular pathways are not readily evident (Garraway & Lander,
2013; Cancer Genome Atlas Research, 2014b; Alvarez et al, 2016).
Large-scale cancer genome initiatives, specifically The Cancer
Genome Atlas (TCGA, https://cancergenome.nih.gov/) and Interna-
tional Cancer Genome Consortium (International Cancer Genome
et al, 2010; ICGC, http://icgc.org/), have increased statistical power
in the analyses of cancer mutations and have driven the develop-
ment of innovative approaches for the study of patient data (Dees
et al, 2012; Hofree et al, 2013; Kandoth et al, 2013; Lawrence et al,
2013, 2014; Chen et al, 2014; Sanchez-Garcia et al, 2014). In particu-
lar, a number of recent methods address the fact that even within a
specific driver gene not all mutations will have an equal effect (Kan
et al, 2010; Burke et al, 2012; Porta-Pardo et al, 2017). To account
for this, they implement positional mutation biases as criteria for the
detection of candidate driver genes (Davoli et al, 2013; Tamborero
et al, 2013; Kamburov et al, 2015; Tokheim et al, 2016; Gao et al,
2017). Some of these approaches are agnostic to prior knowledge
(Araya et al, 2016), while others focus on regions of known func-
tional relevance, such as protein domains (Miller et al, 2015; Yang
et al, 2015), phosphosites (Reimand & Bader, 2013) or interaction
interfaces (Porta-Pardo et al, 2015; Engin et al, 2016). Recently,
Vogelstein et al (2013) have shown that oncogenes often contain not
only regions but also specific residues which accumulate a high frac-
tion of the overall mutational load within a gene. In addition, Chang
et al (2016) developed a statistical model for detecting residues with
a high mutation frequency and applied it to the pan-cancer data.
1 Department of Biology, Institute of Molecular Systems Biology, ETH Zurich, Zurich, Switzerland2 Division Signaling and Functional Genomics, German Cancer Research Center (DKFZ), Heidelberg, Germany3 Faculty of Science, University of Zurich, Zurich, Switzerland4 Department of Cell and Molecular Biology, Faculty of Medicine Mannheim, Heidelberg University, Heidelberg, Germany5 German Cancer Consortium (DKTK), Heidelberg, Germany
*Corresponding author. Tel: +41 4463 33170; E-mail: [email protected]**Corresponding author. Tel: +49 6221 421950; E-mail: [email protected]
ª 2018 The Authors. Published under the terms of the CC BY 4.0 license Molecular Systems Biology 14: e7974 | 2018 1 of 19
Published online: March 23, 2018

Importantly, both approaches demonstrated that the sheer presence
of such residues was often sufficient to identify cancer driver genes.
Many of the individual cancer mutations are not well studied in
terms of how they influence the properties of proteins (Cancer
Genome Atlas Research et al, 2013). In addition, due to the artifact-
prone raw data and inconsistency in mutation calling, the genome-
sequencing information is still noisy (Alioto et al, 2015). Accordingly,
integration of relevant protein structural and functional annotations
with mutational patterns could help in distinguishing variants with a
likely impact. Here, based on previous observations (Vogelstein et al,
2013), we developed an approach for the detection of single protein
residues that accumulate point mutations at a significantly higher
rate than their surrounding sequence, which we refer to as “hotspot”
residues. Specifically, we used the developed approach to obtain a
comprehensive set of such protein residues and investigate protein
properties that associate with them. The methodology we used is
robust to gene length, background mutation rates, and presence of
common variants. We make this tool available as an open-source
DominoEffect R/Bioconductor software package (Code EV1).
In this study, we applied the tool to 40 cancer types with the
TCGA or ICGC sequencing data and identified 180 hotspot mutation
residues in 160 genes that had a likely functional impact. These
mutations alone had the power to cluster tumors based on the cell
type of origin, and many of the hotspots were found within proteins,
for example, enzymes, that are known to exist in the active and inac-
tive states. Importantly, we found that a significant fraction of the
hotspots resided within tumor suppressors. Furthermore, two-thirds
of the identified instances were not classified as known cancer genes
but many could be functionally linked to cancer pathways or were,
as exemplified by Poly(rC) binding protein 1 (PCBP1), previously
suggested to have a role in the regulation of cancer genes and
proteins. We next characterized the affected protein regions using
sequence annotations and associated data on their structural, func-
tional, and interaction features. These analyses showed that the
hotspot residues often fell within regions responsible for binding
ligands, nucleic acids, and other proteins. To further follow up on this
observation, we used available structural data and homology-based
3D models for human complexes. We mapped protein interfaces in
these and based on the presence of mutation clusters within the
mapped interfaces, we were able to identify 87 proteins in which
cancer mutations were likely to affect protein interactions. Again,
two-thirds of the instances were proteins that have not previously
been defined as cancer drivers. These, among others, included the
coactivator-associated arginine methyltransferase 1 (CARM1) and the
retinoid X receptor alpha (RXRA), which both also had hotspot resi-
dues. Overall, characterization of the recurrent functional mutations
suggests that a disruption and dysregulation of protein interactions
could be an important molecular mechanism for switching functions
of cancer proteins.
Results
Hotspot mutations point to known and candidate cancerdriver genes
We collected single nucleotide mutation data deposited as a part of
the TCGA and ICGC projects and mapped these nucleotide changes
to the encoded protein sequences using the Ensembl gene annota-
tions (Yates et al, 2016; see Materials and Methods). Collectively,
the data encompassed 40 different cancer types from 22 tissues,
with the sequencing information from ~10,000 tumor samples,
including ~1,300,000 mutations within coding sequences (see Mate-
rials and Methods).
Next, we developed and applied a tool we term DominoEffect
(Code EV1). The tool identifies and characterizes individual hotspot
protein residues that accumulate mutations at a significantly higher
rate than their surrounding protein sequence (Figs 1 and EV1). In
Mutations in cancer patients
Detection of hotspots with DominoEffect.R
Filtering for damaging mutations with a likely functional impact
Detection of protein residues associated with cancer development
Detection of mutation clusters at the interfaces
Characterization of mutations’ likely effects
Mapping of interfaces in proteins that form stable complexes
Figure 1. Outline of the approach.
Identification of hotspot mutations from the TCGA and ICGC data includes
detection of residues that accumulate mutations at a significantly higher rate
than their surrounding regions, followed by excluding common polymorphisms
and mutations that are not likely to have functional effects. To better
characterize protein elements that embed these mutations, we performed an
extensive annotation and analysis of both hotspot residues and proteins that
contained them. Furthermore, the approach applied to search for interaction
interfaces that accumulate cancer mutations at a high rate is shown. This
includes collection of structures and structural models for stable protein
interactions, mapping of interfaces in these and assessment if cancer mutations
are present within the interfaces at a significantly higher rate than elsewhere in
the protein sequence. Finally, thus identified proteins and interfaces are further
characterized.
2 of 19 Molecular Systems Biology 14: e7974 | 2018 ª 2018 The Authors
Molecular Systems Biology Features of mutation hotspot residues Marija Buljan et al
Published online: March 23, 2018

this study, we applied DominoEffect to search for protein “hotspot”
residues that accumulated a high mutation load (here defined as
15% of the mutations) within the windows of 200 and 300 amino
acids (see Materials and Methods for the explanation of thresholds).
Next, we filtered the obtained residues to avoid false assignments
and included only mutations that have a likely functional impact.
The largest sources of false positives should be sequencing errors
that repeatedly occurred at the same residues or individual poly-
morphisms, which were not detected in the paired healthy tissue.
To account for the latter, but not to exclude the germline risk vari-
ants, we filtered out all residues that were common polymorphisms
in the human population (i.e., genomic variants with a reported
population frequency higher than 1%). We based the filtering on
the available data from the 1000 Genomes Project (Genomes Project
et al, 2015), Kaviar (Glusman et al, 2011), Exome Aggregation
Consortium (Lek et al, 2016), and Ensembl-linked databases
(Sherry et al, 2001; Yates et al, 2016). To further filter out both,
sequencing errors and population polymorphisms, we applied the
PolyPhen-2 algorithm which assesses a likely mutation effect on the
protein function (Adzhubei et al, 2010). PolyPhen-2 uses a proba-
bilistic classifier with eight sequence-based and three structure-
based features. This filtering step can also exclude true disease
hotspots that do not have a sufficient structural or evolutionary
support for strong effects. However, to gain more confidence in the
individual predictions, we deemed it necessary to account for the
substantial presence of false positives in the initial set of hotspot
residues. For instance, nearly a third of the initially identified
“hotspots” (132 out of 451) were annotated as common variants,
which still likely represents an underestimate as a catalog of non-
disease human polymorphisms is still incomplete. Simulations of
randomly re-assigned mutations within titin, that is, a gene with
the highest overall mutation burden, did not report any hotspot
residues (1,000 repetitions). Thus, under the naıve assumption that
each amino acid is equally likely to be mutated at random, back-
ground mutations should not strongly contribute to false positives.
Using the approach introduced here, we applied the DominoEf-
fect tool to the pan-cancer data and identified both known instances
of hotspot driver mutations as well as residues that were as yet not
annotated as such. In total, we identified 180 hotspots within 160
genes (Dataset EV1) for which the reported mutations were catego-
rized as deleterious by the PolyPhen-2. This set, thus, represents
frequently mutated residues that could be of particular functional
relevance in cancer development. The gene set was also enriched
for known cancer drivers (54 or 34% of the genes with hotspots
were in the Cancer Gene Census). For a comparison, a fraction of
known drivers among the genes that were selected by simply asking
for a high mutation load within a protein (more than 100 mutations)
or at an individual residue (more than 5 mutations) was 7.9% and
9.6%, respectively). Of note, on average, 88% of tumor allele
changes assigned as hotspot mutations were reported as heterozy-
gotic in the TCGA dataset. The most commonly mutated amino acid
was arginine (37% of the hotspot residues had arginine as a refer-
ence amino acid, while its overall frequency in the reference
proteome was 6%). The second most frequently mutated amino acid
was glutamate, which was predominantly mutated to lysine (11%
of all events). For an illustration, in a protein set with an equal
representation of all codons and an equal probability of nucleotide
changes, a frequency of such mutation would be only 0.61%. Inde-
pendently of the hotspot analysis, we additionally searched for
cancer mutation clusters in known and modeled protein interaction
interfaces (Fig 1).
Strikingly, 36% (3,679/10,118) of the analyzed cancer genomes
had at least one of the 180 hotspot residues mutated (Fig 2A). For a
comparison, the same size randomly selected gene set that
contained any of the protein positions with five or more pan-cancer
mutations was on average mutated in 14% of the patients
(P < 6 × 10�12, distance from the observed distribution of 1,000
random values). The major contributors to the highly prevalent
mutations were the well-studied oncogenes KRAS, BRAF, IDH1,
PIK3CA, NRAS, SF3B1, CTNNB1, and PTEN: More than one-quarter
(i.e., 27%) of all patients had a hotspot mutation in at least one of
these genes. However, in the whole set, a majority (106/160) of the
genes with hotspots were not previously annotated as cancer
drivers. Importantly, 18 (i.e., 17%) of these candidate genes had a
homolog in the Cancer Gene Census (Futreal et al, 2004). These
instances are listed in the Dataset EV2 and they included, among
others, RBL2, KLF5, and ARAF as homologs of cancer drivers RB1,
PBX1, and BRAF, respectively. The fraction of Cancer Gene Census
homologs in the background set of human genes was significantly
lower than among the hotspot genes (7 versus 17%, respectively,
P < 3 × 10�4, chi-square test). Therefore, the approach used here is
capable of suggesting biologically relevant cases for further follow-
up studies, while maintaining an overall low false-positive rate
(Marx, 2014).
▸Figure 2. Properties of proteins and residues with frequent hotspot mutations.
A A high fraction of the sequenced samples (i.e., 36%) have at least one of the detected hotspot residues mutated. Strong contributors to this signal are the listedknown cancer drivers with hotspots. Hotspots in one or more of these proteins are mutated in 27% of the analyzed tumor samples.
B Proteins with hotspot mutations (dark cyan) have a higher fraction of enzymes than other proteins in the Cancer Gene Census (light red, P < 0.015) or all otherhuman proteins (dark green, ***P < 10�4, chi-squared test). Color representation of proteins from the three sets follows the same scheme on all the following figures.
C Protein domains that are significantly overrepresented among the proteins with hotspot mutations compared to the non-cancer background proteins (adjustedP ≤ 0.01, Fisher’s test).
D Protein annotations (GO terms) that are overrepresented among the proteins with hotspots compared to the non-cancer background proteins (adjusted P < 10�4,Fisher’s test). Transcription factor binding and several other terms related to regulation of gene expression are more abundant among the other proteins in theCancer Gene Census than among the genes with hotspots.
E Hotspot mutations that mapped to the functionally similar protein segments in two or more different proteins are classified depending on whether the mutationoccurred within a protein domain with an enzymatic function (first column), another region in the protein that can mediate binding to other proteins, nucleic acids,ligands or lipids, or in a region that contains a signaling motif or a transmembrane segment.
F Examples of individual proteins of interest. PCBP1, RXRA, and CARM1 are functionally related to cancer-relevant processes and have hotspot mutations (dark redcircles) within the RNA binding KH domain, ligand-binding segment, and enzymatic domain, respectively. Other missense mutations in these proteins are depicted asblue circles. Pfam protein domains encoded by these genes are shown as colored boxes.
ª 2018 The Authors Molecular Systems Biology 14: e7974 | 2018 3 of 19
Marija Buljan et al Features of mutation hotspot residues Molecular Systems Biology
Published online: March 23, 2018

Genes with hotspot residues can often exist in both an activeand inactive state
The obtained extensive set of known and candidate cancer-asso-
ciated genes with hotspot mutations provides an opportunity to
define gene and protein characteristics associated with such resi-
dues. Mutational impacts are well characterized for the few most
frequently mutated cancer hotspots, but general principles of protein
properties that associate with hotspot residues have not yet been
systematically investigated. From the biological view, hotspot
Percentage of enzymes in the set
%
Proteins with Hotspot Mutations
Other proteins in Cancer Census
Other background proteins***
A
0 10 205 15 25
C Protein domains D Functional annotations
Fibrobast growth factor signaling
Platelet activation
Cell proliferation
Transcription factor binding
Protein phosphorylation
GTPase activity
Kinase domains
Ras-related domains
Protein kinase C1 domains
Cystein-rich regions in TK receptors
KH domains(RNA binding)
Bromodomain
%0 2 4 10 12 146 80 2 4 10 126 8
%
Annotated ligand-binding region0 100 200 300 400 462 aa
0
12RXRA S427F/Y
zf-C4 pecer_enomroH1FA-pecer_cuN
# M
utat
ions
0 100 200 300 400 500 608 aa
0
7CARM1
CARM1 PRMT5
A202V
# M
utat
ions
0 100 200 300 356 aa
0
8L100Q
KH_1 KH_1 KH_1
PCBP1
# M
utat
ions
F
Lipid binding
Transmembrane
Oth
er
Pfam domainsPDB interfaces
Annotated UniProt
Zn fingerKH domain
Oth
er b
ind
ing
Annotated UniProt
Ras domains
Idh
Other
Kinases
Enz
ymat
ic d
omai
ns
Protein-protein
Nucleic acid
E
05
1015
2025
30
Signaling motifs
Ligand
# In
stan
ces
Frequency of hotspot mutations B
Hotspot mutations, 180 mutations in 160 genes
5
15
25
35
10
30
20
%
Percentage of patients with
at least one of the detected
hotspots mutated KRAS, BRAF, IDH1 PIK3CA, NRAS, SF3B1
CTNNB1, PTEN
Figure 2.
4 of 19 Molecular Systems Biology 14: e7974 | 2018 ª 2018 The Authors
Molecular Systems Biology Features of mutation hotspot residues Marija Buljan et al
Published online: March 23, 2018

residues should be enriched in single positions with the power, if
mutated, to affect the overall protein function. Among the most
prominent examples of cancer drivers with hotspot residues are
kinases and Ras proteins where the hotspot mutations frequently
act by switching the proteins to a constantly active state. Both of
these protein families have enzymatic activity, even though Ras
proteins need additional activators for this. We hence assessed if the
genes with hotspots overall contained a high fraction of enzymes.
For this, we used the Expasy Enzyme database annotations
(Bairoch, 2000) and compared genes with hotspot residues to the (i)
genes in the Cancer Gene Census (excluding the genes with hotspot
mutations and homologs of genes with hotspot mutations) and to
(ii) all other protein coding genes. We indeed observed that,
compared to the other two categories, genes with hotspots were
enriched in enzymatic functions (26% of the genes with hotspots
were annotated as enzymes; P ≤ 0.015 and P < 9.3 × 10�5, chi-
squared test, respectively, compared to the other two sets; Fig 2B
and Dataset EV3). Of note, Expasy Enzyme annotations did not
include the Ras proteins, as GTP hydrolysis does not represent their
main function (Dataset EV3). The fact that the observed trend was
also present in a comparison with the genes in the Cancer Gene
Census suggested that the observation should not be influenced by a
bias in protein annotations, which are likely to be more complete
for better-studied genes. Moreover, the fraction of enzymes was
even two times higher among the here-identified genes with hotspot
residues than among the genes in the Cancer Gene Census that were
involved in translocations (P < 0.0003). This suggests that different
gene classes could preferentially be activated through different
mutational processes (Latysheva et al, 2016). To confirm that this
observation was not influenced by the filtering of hotspots to
include only those with a likely deleterious effect (using PolyPhen-
2), we assessed a fraction of enzymes in the initial set of hotspots
after excluding only common polymorphisms. In this set, 21% of
proteins (i.e., 62 out of 290) were annotated as enzymes. This was a
lower fraction than in the final set, but still considerably higher than
the fraction of enzymes in the background set of human proteins
(P < 7.6 × 10�5, chi-squared test). Of note, a set of the Cancer Gene
Census genes without the hotspot genes may still contain drivers
with hotspot mutations that have not been detected by the approach
applied here.
In accordance with these observations, protein domains that
were most frequently encoded by the genes with hotspot residues
were kinase and Ras domains, Fig 2C and Dataset EV4; adjusted
P-values for the overrepresentation were < 6 × 10�9 and < 0.008,
respectively, Fisher’s test, when compared to the background set of
non-cancer proteins). In addition, the genes with hotspot residues
were also enriched in proteins involved in the related Rho GTPase
signaling: 10 genes were associated with this pathway, which repre-
sents four times higher fraction than in the set of non-cancer back-
ground genes (P < 10�3, Fisher’s test). Both Rho and Ras proteins
are known to often function as binary switches. Among the proteins
with hotspots were also those with bromodomains, which are func-
tional elements found in epigenetic regulators, and KH domains that
play a role in RNA binding. Both domain types were overrepre-
sented compared to the background set of non-cancer proteins (ad-
justed P < 0.03, Fisher’s test). Furthermore, genes with hotspot
residues were strongly enriched in the functional categories (GO
terms) associated with signal transduction; receptor signaling linked
to the fibroblast growth factors (P < 10�16, Fisher’s test, compared
to non-cancer proteins) and platelet activation (adjusted P < 10�4,
Fisher’s test), a process that is known to play a role in metastasis
(Gay & Felding-Habermann, 2011). These processes were also
enriched when compared to other proteins in the Cancer Gene
Census (P < 10�4 and P < 10�3, respectively, Fig 2C and Dataset
EV4), but several functions associated with cancer development,
such as cell proliferation, transcription factor binding, and regula-
tion of gene expression, were enriched only compared to non-cancer
background genes (P < 10�4). In fact, some of the categories, such
as transcription factor and chromatin binding, were more abundant
among those Cancer Gene Census genes that were not among the
here-identified “hotspot genes” (Fig 2D and Dataset EV4). Overall,
this shows that many of the genes with hotspot residues relate to
cancer-associated processes and that jointly more than a third of
them encode proteins that are known to exist in an active and inac-
tive state.
Hotspot residues frequently map to crucial functional elementsin proteins
Next, we sought to identify which functional elements within
protein sequences were common target sites for hotspot mutations.
For this, we first mapped annotated functional regions using the
Pfam predictions (Finn et al, 2016) and UniProt Knowledgebase
(KB) annotations (The UniProt, 2017). We then investigated
whether the hotspot residues were mapping to the same functional
domains in different proteins. We found that domains which were
targets of hotspot mutations in two or more proteins were often
associated with enzymatic activities, or with binding to proteins,
nucleic acids, or lipids (Fig 2E and Dataset EV1). Most frequently,
hotspot residues localized within kinase and Ras domains (12 and 9
times, respectively), which also represented a predisposition for
domain regions within these protein sequences. Namely, 86% and
100% of the mutations were within the respective domains, which
is higher than expected, considering the domain coverage of
proteins (P < 4 × 10�4 and P < 0.09, chi-squared test, respectively).
In addition, hotspot residues mapped to other domains known to be
associated with cancer proteins, such as the lipid binding PH
domain (Futreal et al, 2004), but also to enzymatic and binding
domains within proteins that are not yet in the Cancer Gene Census
(Dataset EV1). This, for instance, highlighted the Poly(rC) binding
protein 1 (PCBP1, Fig 2F) as a possible cancer gene candidate.
PCBP1 is as yet not classified as a driver (Futreal et al, 2004), but it
is involved in the regulation of the expression of a number of cancer
genes and has been previously implicated in tumorigenesis and
metastasis (Wang et al, 2010; Huo et al, 2012; Wagener et al, 2015;
Zhou & Tong, 2015). A hotspot residue within this protein mapped
to the KH domain that has a role in nucleic acid recognition and is
also a target of a hotspot mutation in the known cancer driver
FUBP1.
Further, mapping of hotspot residues onto UniProtKB functional
annotations showed that in several instances mutations were falling
within protein segments involved in ligand binding. These included
both well-known cancer drivers and proteins that are as yet not in
the Cancer Gene Census, such as nuclear receptor RXRA (Fig 2F and
Dataset EV1). As a following step, we analyzed the PDB structures
of proteins with the identified hotspot mutations (Berman et al,
ª 2018 The Authors Molecular Systems Biology 14: e7974 | 2018 5 of 19
Marija Buljan et al Features of mutation hotspot residues Molecular Systems Biology
Published online: March 23, 2018

2000; www.rcsb.org). When structural data were available, we
aligned the segments with hotspot mutations onto the correspond-
ing PDB sequences (see Materials and Methods). Jointly, the analy-
ses of both UniProtKB annotated features and available structures
highlighted protein interaction interfaces as a functional element
class that was an important target of hotspot mutations (Dataset
EV1). These included the well-studied cases of CTNNB1, PIK3R1,
and SMAD4 proteins as well as proteins that are as yet not anno-
tated as drivers, but are functionally connected to cancer pathways.
An example of this are hotspot residues within the CARM1 and
METTL4 proteins that mapped to the interaction interfaces within
their protein arginine methyl transferase (PRMT) domains. The
PRMT domain is commonly found in epigenetic regulators and
mediates methylation of arginine residues on histone tails. The
observed hotspot mutations in CARM1 and METTL4 could thus
have an effect on the interactions between the CARM1 proteins that
together form a complex, or on the METTL4 binding to its interactor
protein METTL3. Both METTL4 and CARM1 (Fig 2F) are not yet in
the Cancer Gene Census. Finally, hotspot residues in the PBX2 and
MAX proteins mapped to their conserved DNA interfaces, suggesting
abolished or altered transcriptional regulation. Jointly, the ability of
mutations to affect protein interactions or nucleic acid and ligand-
binding properties suggests the means by which they could have a
potential to switch the protein function and influence downstream
processes in the cell.
An important role of hotspot mutations is the inactivation oftumor suppressors
Tumor suppressor genes can be inactivated during the course of
disease either through mutations that affect their transcription
levels or through changes that influence protein expression, stabil-
ity, or function. In the case of the PTEN (Papa et al, 2014),
FBXW7 (Welcker & Clurman, 2008) and SMAD4 (Miyaki & Kuroki,
2003) genes, as well as several other tumor suppressors (de Vries
et al, 2002; Hanel et al, 2013), a frequent mechanism of inactiva-
tion is through point mutations that reoccur at the defined residues
and act dominantly on the molecular level. For these genes,
disease-causing effects of single inactivating mutations were
demonstrated by the follow-up functional studies and in animal
models (Taketo & Takaku, 2000; Welcker & Clurman, 2008). In
the cancer genomics studies, mutational clustering is often used as
a signature that is associated with oncogenes (Davoli et al, 2013;
Vogelstein et al, 2013). However, these individual examples show
that hotspots can also pinpoint to a preferential mechanism for
tumor suppressor inactivation. In order to categorize hotspot muta-
tions that could function by inactivating tumor suppressors, we
analyzed which of the here-identified genes were categorized as
tumor suppressors in the Cancer Gene Census, or were predicted
to be suppressors based on mutation signatures in an independent
study (Davoli et al, 2013). In addition, to further expand the set of
tumor suppressor candidates, we assessed the frequency of delete-
rious mutations within the here-defined set of hotspot genes using
the mutation data from the above-described TCGA and ICGC data-
sets. For this, we considered changes with a likely highly deleteri-
ous impact on the protein sequence (i.e., premature nonsense
mutations and out of frame insertions/deletions), and we
compared these to the synonymous mutations within the same
genes. The latter represented neutral mutations and served as a
measure of a background mutation rate in the sequences (see
Materials and Methods). Using a conservative threshold that
required an overrepresentation of deleterious over neutral changes
within a protein, we found that 15 genes with a hotspot mutation
also exhibited mutation patterns typical of tumor suppressors
(Dataset EV5). Collectively, together with the proteins that were
annotated as suppressors in the Cancer Gene Census or were
suggested as tumor suppressors in a previous pan-cancer study
(Davoli et al, 2013), this analysis highlighted 23 (i.e., 14%) of the
here-identified genes with hotspots that could, at least in some
contexts, act as tumor suppressors (Dataset EV5). In addition to
the known cancer drivers, this list included ARHGAP5 and RBL2
genes, which are homologs of the SRGAP3 and RB1 Cancer Gene
Census genes, respectively (Fig 3A and Dataset EV2). Of note, the
obtained list of tumor suppressors with hotspot residues is likely
still incomplete. For instance, literature evidence and mutation
patterns also highlight the KLF5, SPOP, and POLE genes as possi-
ble tumor suppressors even though they do not pass the set
thresholds (Fig 3A and Dataset EV5). Overall, this analysis
supports the notion that an important fraction of hotspot muta-
tions could act by turning the original protein function off.
Furthermore, to gain additional insights into the distribution of
functional effects of hotspot mutations, we classified genes in which
hotspot residues were mutated in 10 or more tumor samples into
the following three categories: (i) instances where mutations
occurred within a tumor suppressor and were likely inactivating,
(ii) instances where mutations affected protein binding properties
and were likely activating, and (iii) all other instances (Fig 3B and
Dataset EV6). These more frequently mutated instances encom-
passed in total 53 genes and included the experimentally character-
ized hotspots within the PTEN, FBXW7, SMAD4, EP300, and
CREBBP tumor suppressors. In the set of proteins with more
frequently mutated and better-characterized hotspots, 32% (i.e.,17
of 53) were tumor suppressor, 51% (i.e., 27 of 53) represented
instances where hotspot mutations were likely to affect protein
binding properties, and 17% (i.e., 9 of 53) were proteins in which
the impacts of hotspot mutations could not be readily classified.
Since a considerable fraction of better-characterized hotspots is
likely to function by inactivating a tumor suppressor, this should
also be considered as one of possible mechanisms of action for the
less well-characterized hotspots.
Proteins with mutation hotspots are often fundamental incancer interaction modules
It was suggested that proteins involved in cancer should play a
central role in cellular interaction networks (Davoli et al, 2013).
However, proteins interesting from a disease perspective are often
more intensively studied and, as a result of this, a larger number of
their interaction partners are catalogued compared to proteins with
an unknown function. Using a complementary approach, we
compared the presence of iPfam domains (Wang et al, 2012; Finn
et al, 2014), that is, Pfam domains that can mediate protein–protein
interactions, in the protein sets that we established above: (i)
proteins that contain hotspot mutations, (ii) other proteins encoded
by the Cancer Gene Census (described above), and (iii) all other
human proteins. The catalog of iPfam domains is built on the
6 of 19 Molecular Systems Biology 14: e7974 | 2018 ª 2018 The Authors
Molecular Systems Biology Features of mutation hotspot residues Marija Buljan et al
Published online: March 23, 2018

available PDB structures, but using sequence features should gener-
ally be less strongly affected by biases in previous knowledge than
the reliance on targeted interaction data. We observed that Pfam
interaction domains were more abundant in the two sets of cancer-
associated proteins, than in the background human proteins
(P < 10�4 and P < 10�13, respectively, chi-squared test), whereas no
significant difference between the first two sets was observed,
Fig 4A. Hence, this underlined that forming interactions with other
proteins was often an essential part for the function of proteins with
hotspots.
Proteins with similar functions are often close in interaction
networks, and functional and disease annotations of a protein’s
interaction partners can assist in determining its role in the cell
(Lundby et al, 2014; Menche et al, 2015). In accord with this, close-
ness to modules with known cancer drivers could assist in identify-
ing less well-studied proteins that could be functionally related to
cancer pathways. To address this, we searched interactions depos-
ited in the BioGRID database (Chatr-Aryamontri et al, 2015) classi-
fied as physical associations or direct interactions, and focused
specifically on the 106 proteins with hotspots that were not in the
Cancer Gene Census. We found that first interaction neighbors of
these proteins were indeed enriched in Cancer Gene Census proteins
(13% versus expected 3%, P < 10�166, when compared to random
networks, Fig 4B and C). Individually, 20 (i.e., 19%) of these 106
proteins had interaction neighborhoods strongly enriched in the
known cancer drivers (adjusted P < 0.05, Dataset EV7), and these
clusters often included other proteins with hotspot mutations
(Dataset EV7). Of note, known cancer drivers have on average a
higher number of interaction partners than other proteins so their
presence in the interaction neighborhood is not a direct evidence for
the protein’s association to cancer. However, it can be useful for
better understating of protein roles in the cell. The obtained
interaction network for the 19 proteins is shown in Fig 4D. This
included KLF5 and SOS1 proteins, which are both homologs of
known cancer driver genes (Dataset EV2), as well as transcriptional
regulators CARM1 and ZBTB7A, and signaling regulators RHPN2
and GPX1. Additionally, 27 interaction pairs in which one partner
was a candidate with a hotspot mutation and the other partner was
a Cancer Gene Census protein were also supported with a PDB
structure or a homology-based structural model that indicated a
stable interaction between the proteins (see Materials and Methods).
Notably, the RXRA protein was in protein complexes with RARA,
PPARG, NCOA1, NCOA2, and NCOR2 cancer drivers. All of these
complexes have been described at the structural level. The hotspot
mutation in this gene was originally reported in the TCGA study of
bladder cancer (Cancer Genome Atlas Research, 2014a), but its
impact has as yet not been characterized. The observation that a
number of the candidates with hotspot mutations were physically
associated with each other or with known cancer drivers suggests
their possible connections to interaction networks relevant in
disease development.
Recurrent mutations group cancer types by their cell typeof origin
We further assessed whether individual hotspot residues were
mutated across different tumor types, or whether they were more
often specific for a single origin of tumor. To address this, we first
grouped similar tumor types from the TCGA and ICGC datasets (see
Materials and Methods) and analyzed how a pan-cancer signal for
each hotspot was distributed across the different tumor types. We
found that 35 out of 180 hotspot residues were largely associated
with one tumor type, that is, more than 75% of the mutations on
these 35 positions were reported in a single tumor type (Dataset
# M
utat
ions
0 200 400 600 800 1000 1139 aa
RBL2
DUF3452 RB_A RB_B
E127D/K
0
8
# M
utat
ions
0 100 200 300 400 457 aa
0
6
KLF5
E419K/Q
zf
A
A hotspot maps to binding segments in an oncogene
Hotspots cannot be readily characterized
Tumor suppresors with hotspots
B
Figure 3. An important fraction of hotspot mutations has a role in inactivating tumor suppressors.
A A number of hotspot mutations are associated with tumor suppressors. Among these are RBL2 and KLF5 proteins that are not in the Cancer Gene Census, but arehomologs of cancer drivers. Hotspot mutations within these proteins are shown as dark red circles, while missense and highly deleterious mutations are depicted asblue and gray circles, respectively. The encoded Pfam domains are shown as colored boxes.
B Almost a third (i.e., 32%) of the genes with better-annotated, more common hotspot mutations (observed in at least ten patients) are tumor suppressors. Anotherprominent category is genes with apparently activating mutations that affect binding properties of oncogenes (51% of the total 53 genes).
ª 2018 The Authors Molecular Systems Biology 14: e7974 | 2018 7 of 19
Marija Buljan et al Features of mutation hotspot residues Molecular Systems Biology
Published online: March 23, 2018
EV8). This included SPOP, which was exclusively mutated in pros-
tate adenocarcinoma, and RXRA, where 80% of mutations were
observed in the bladder urothelial cancer. However, a larger number
of positions were mutated in multiple tumor types. For instance, for
89 hotspot positions, a single tumor type never contributed to 50%
or more of the mutations (Dataset EV8).
Next, we performed a hierarchical clustering of the analyzed
tumor types, based on the percentage of patients that had a muta-
tion in each of the identified hotspots. Patterns of hotspot muta-
tions could also point to the shared and cell-type-specific pathways
in cancer. To account for the uncertainty in clustering, we used
the pvclust R package, as this method includes bootstrap resam-
pling of the detected clusters (Suzuki & Shimodaira, 2006). For the
visualization, we produced a heatmap with thus obtained tumor
clusters and included only hotspots that were mutated in 33% or
more of the patients in at least one tumor type (Fig 5). This
showed that many of the detected clusters represented well the
cancer etiology. For instance, the majority of adenocarcinomas
(ovarian, colorectal, lung, and pancreatic) were clustered together,
while squamous cell carcinomas (lung, cervical, and head and
%
A
*
H
C
O
0 20 40 60
Percentage of proteins with an iPfam domain(domain that mediates interactions)
D
BCOR
SMAD4
SOX2
RB1
PBX2
HOXA9
AR
ZBTB7A
NCOR1
NCOR2
PPARGBCL6
TRIM24MAX
TMPRSS3
JAZF1
NSD1
RXRA MAPK1
BCL3
SMAD2
NCOA4
FUS
EZH2CTCF RARA
NCOA2
EP300CTNNB1MYOD1RANBP2
TOP2B
JUN
DAXX
TP63
ESR1WWTR1KLF5
SMAD3
FBXW7NCOA1
SMARCA4
CCND2
RAF1
CCND1
HRAS
CDK6
RHPN2
RHOA
HNF1A
BAZ1A
PML
CEBPA SMARCE1TP53
QKISET CREBBP CREB1
MYC
PRKCI
AXIN1
SRSF3
EIF5A
RELXPO1 IRF4
RPL5
AFF1HSP90AB1
HMGA1
PPIL2
POT1
PIK3R1
PDGFRA
DDX5
PIK3CA
LMNA
TGFBR2
PRCC
PIK3CB
ERBB3
ALK
KRASMAP2K2
BRAF
RRAS2 ARAF
YWHAE
MLH1
JAK3
CARM1
DROSHA
SMARCD1
MALT1
H3F3A
ARID1A
MET
NF2
CBL
BCR
EGFR
ABI1
NPM1 VHL
SFPQ
PPP6C
IKBKB
MAP2K1
CASP8TCF3
IL7RNOTCH1
LCK
PTPN11
ERG
SOS1
PLCG1
MUC1
CDK4MTOR
RHEBATM
ATR
TSC2
TSC1
CCNE1
CCND3
GPX1
ABL2
DCTN1
RBL2
TOP1
BRCA1
SND1SUZ12
MDM2
WRN
RAD21DHX9
DICER1
RPL10ABL1
NTRK1
CNBP
Num
ber
of o
bse
rvat
ions
Number of interactions with cancer census proteins
Random Networks
B
Candidateswith hotspots
p < 10
0 100 200
010
0020
00
-166
MARK3
HSP90AA1
PCBP1
EWSR1
C Other census
proteins
Census proteins
with a hotspot
Can
dida
te p
rote
ins
with
a h
otsp
ot
%
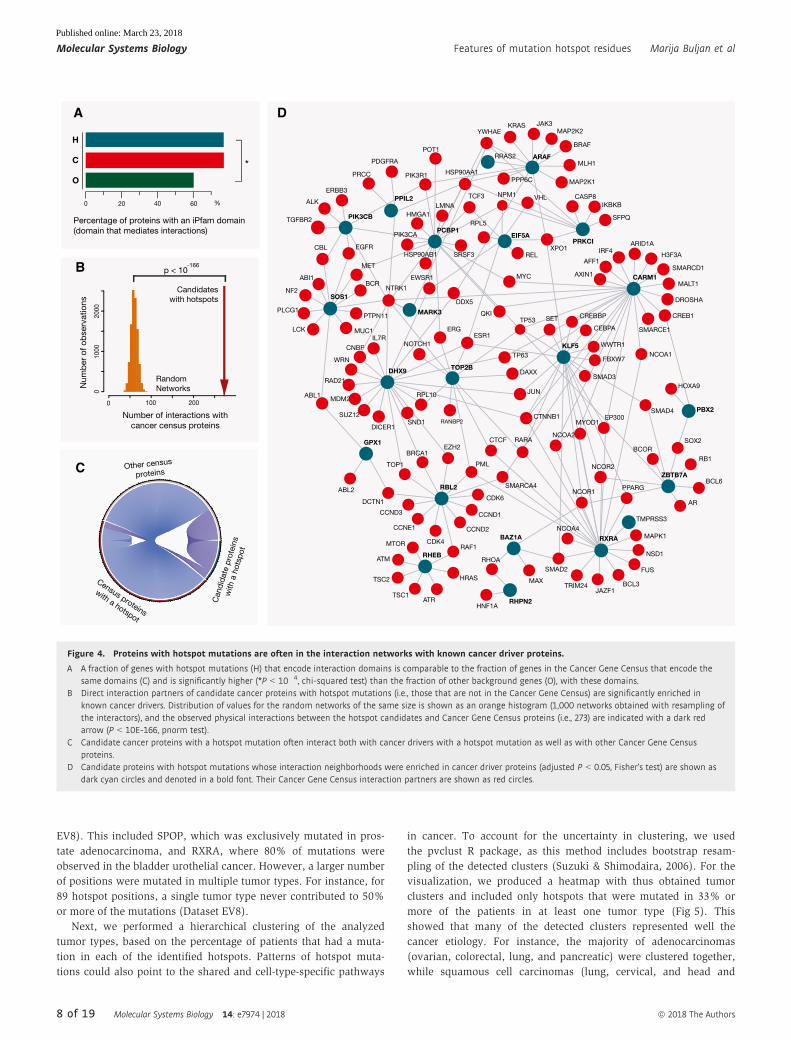
Figure 4. Proteins with hotspot mutations are often in the interaction networks with known cancer driver proteins.
A A fraction of genes with hotspot mutations (H) that encode interaction domains is comparable to the fraction of genes in the Cancer Gene Census that encode thesame domains (C) and is significantly higher (*P < 10�4, chi-squared test) than the fraction of other background genes (O), with these domains.
B Direct interaction partners of candidate cancer proteins with hotspot mutations (i.e., those that are not in the Cancer Gene Census) are significantly enriched inknown cancer drivers. Distribution of values for the random networks of the same size is shown as an orange histogram (1,000 networks obtained with resampling ofthe interactors), and the observed physical interactions between the hotspot candidates and Cancer Gene Census proteins (i.e., 273) are indicated with a dark redarrow (P < 10E-166, pnorm test).
C Candidate cancer proteins with a hotspot mutation often interact both with cancer drivers with a hotspot mutation as well as with other Cancer Gene Censusproteins.
D Candidate proteins with hotspot mutations whose interaction neighborhoods were enriched in cancer driver proteins (adjusted P < 0.05, Fisher’s test) are shown asdark cyan circles and denoted in a bold font. Their Cancer Gene Census interaction partners are shown as red circles.
8 of 19 Molecular Systems Biology 14: e7974 | 2018 ª 2018 The Authors
Molecular Systems Biology Features of mutation hotspot residues Marija Buljan et al
Published online: March 23, 2018

neck) were in a separate cluster. The example of the lung cancer
reinforced the notion that a cell type of cancer origin (adenoma
versus sarcoma) was more strongly defining the mutation hotspot
pattern than a tissue. Uterine carcinomas which can have both
epithelial and sarcoma components were in a larger cluster that
contained both epithelial adenocarcinomas and sarcomas.H
NS
C
CE
SC
LUS
C
BLC
A
ES
CA
BR
CA
STA
D
UC
S
PA
AD
PA
CA
LUA
D
RE
AD
CO
AD
OV
AD
UC
EC
ES
AD
LIC
A
LIR
I
LIN
C
LIH
C
PB
CA
BO
CA
LGG
GB
M
LAM
L
CM
DI
CLL
E
SA
RC
KIR
C
OR
CA
PC
PG
PR
AD
SK
CM
THC
A
AC
C
KIR
P
KIC
H
TGC
T
UV
M
FLT3 835IDH2 140
DNMT3A 882SP8 156KIT 816
SPOP 133RAC1 29
EGFR 598EGFR 289
TMEM247 128KRTAP4−5 74
NEFH 645PIK3CA 88
GNA11 209GNAQ 209SF3B1 625CHEK2 416
SYNE2 1238COQ10A 67
RXRA 427FGFR3 249
HRAS 12HRAS 13
MAPK1 322HRAS 61
SF3B1 700FGFR2 252
PPP2R1A 179MAMLD1 572
PIK3CA 345FBXW7 465
PTEN 130FBXW7 505
CDKN2A 138GNAS 844U2AF1 34
CTNNB1 33CTNNB1 32CTNNB1 37CTNNB1 41
IDH2 172IDH1 132
BRAF 600NRAS 61
PIK3CA 542PIK3CA 545
PIK3CA 1047KRAS 12
−6 −4 −2 0 2 4 6
Log2 (Percentage of Patients with a mutation)
AdenocarcinomasSquamous cell carcinomas High prevalence of mutations in the IDH genes
Liver cancersStrongly clustered together:
High prevalence of mutations in the BRAF gene
Figure 5.
ª 2018 The Authors Molecular Systems Biology 14: e7974 | 2018 9 of 19
Marija Buljan et al Features of mutation hotspot residues Molecular Systems Biology
Published online: March 23, 2018

Additionally, liver cancers were clustered together, but kidney
tumors of different origins did not show such a clear trend. Blood
tumors were largely defined by the scarcity of point mutations,
and skin cutaneous melanoma and thyroid cancer were clustered
together based on a high frequency of the BRAF hotspot mutation.
We included here only pan-cancer hotspots, but those identified on
the level of individual tumor types could also contribute to better
definition of relationships among the cell types of origin. Overall,
this analysis showed a strong power of hotspot mutations to reflect
the identity of a tumor of origin.
Interface mutation clusters reveal disease-relevant interactions
Characterization of functional protein segments affected by the
hotspot mutations has recognized binding interfaces as frequent
mutation targets (Figs 2 and 4). However, by focusing solely on
single residues that stand out from their surrounding regions, one
might miss clusters of adjacent mutations that only cross the signifi-
cance threshold in combination. To address this, we implemented a
workflow in which we investigated the presence of such clusters
within the protein interaction interfaces. For this, we used available
structures or homology-based structural models (Mosca et al, 2013)
for protein pairs that were predicted to be part of the same protein
complex or form stable interactions (see Materials and Methods).
From the representative structures, we extracted information on
protein interfaces and assessed whether cancer mutations occurred
at a much higher rate within the interaction interfaces than in the
rest of the sequence (see Materials and Methods). For the latter, we
adapted the ActiveDriver tool (Reimand & Bader, 2013), which was
initially developed to assess mutation rates in phosphosites by
implementing a logistic regression model.
Proteins in which the mutation clusters were identified with the
most significant P-values were cancer drivers for which it was previ-
ously shown that mutations in their interfaces can lead to disease
development by disrupting interactions with regulatory proteins
(PIK3CA and PPP2R1A) or by preventing GTP hydrolysis (KRAS,
HRAS, and GNAS); Dataset EV9, 87 proteins in total. Importantly,
this analysis additionally identified a number of instances that are
not in the Cancer Gene Census yet (Table 1), including RXRA and
CARM1 (Fig 6A and B). Both RXRA and CARM1 were among the
above-identified “hotspot genes”, and their hotspot residues were
within the interaction interfaces. We further used protein GO term
annotations (Harris et al, 2004) to assess whether proteins with
interface mutation clusters were enriched in any functional cate-
gories. Cellular processes that were overrepresented among these
proteins included proliferation, ubiquitin signaling, and complement
pathway activation (Dataset EV10, adjusted P < 0.01). Ubiquitin-
regulated signaling was represented with several relevant examples,
most notably with the oncogene CBL and with the CUL1 and CUL4B
homologs that are not yet in the Cancer Gene Census. CUL1 plays a
role in different cancer signaling cascades and in cell cycle progres-
sion (Nakayama & Nakayama, 2006). Of interest, both CUL1 and
CUL4B had a mutation cluster at one of the interface contacts with
the regulator protein CAND1 (Fig 6C). In addition, we used annota-
tions of protein complexes from the ConsensusPathDB (Kamburov
et al, 2013) and found a number of protein complexes relevant in
cancer that would be affected through these mutations (Dataset
EV10). Notably, heterotrimeric G protein complex had one of the
strongest signals. The complex is composed of the oncogene GNAS,
and the GNB1 and GNG2 proteins (G protein b and c subunits,
respectively). Of relevance, mutations in the GNB1 protein interface
were recently shown to promote cellular growth and transforma-
tion, as well as kinase inhibitor resistance (Yoda et al, 2015). Some
of the identified mutation clusters, including those within the GNB1
and GNG2 proteins, had a relatively low mutation count (Dataset
EV9). This reflects the fact that often there are multiple options for
activating or inactivating relevant cellular pathways and interaction
modules (Cancer Genome Atlas Research N, 2014b), which is also
one of the explanations of a long tail of cancer driver mutations.
In addition to finding mutation clusters within protein–protein
interfaces, the analysis identified a mutation cluster at the interface
of the PAX5 transcription factor with DNA, as well as a number of
contacts with small ligands, most commonly ATP and GTP. PAX5 is
a known tumor suppressor with a highly conserved DNA-binding
motif (Garvie et al, 2001) that is often involved in leukemia devel-
opment, however, most frequently through translocations. Overall,
mutation clusters in structural interfaces were able to highlight addi-
tional cancer-relevant proteins and protein regions, which can medi-
ate a switch in protein activity and function.
Discussion
Even with the abundance of cancer genomics data, discerning driver
and passenger mutations remains a major task (Glusman et al,
2017). Nevertheless, examples of driver genes from the commonly
◀ Figure 5. Hotspot mutations drive clustering of tumor types.
The depicted heatmap includes hotspots that weremutated in at least one-third of the patients in one or more tumor types. The coloring corresponds to the log2 value of the
percentage of patients with a mutation in each tumor type. The range goes from 0 to 78% of patients. The latter value corresponds to the percentage of patients with the
KRAS 12 mutation in pancreatic cancer (which is 6.28 on the log2 scale). Clustering of tumor types was performed independently with the pvclust method and it included
data for all hotspot mutations. The ordering of tumor types on the heatmap is based on the dendrogram obtained with the pvclust method. A simplified version of the
dendrogram above the heatmap indicates clusters that were reported up to the height of 0.5 (the full scale was from 0 to 0.7). In addition, themost distinct individual clusters
(corresponding to the height of 0.25) are colored and annotated. Different hotspots in the same gene tend to cluster together, and the clustering of tumor types is largely
based on the cell type of origin. Abbreviations: head and neck squamous cell carcinoma (HNSC), cervical squamous cell carcinoma and endocervical adenocarcinoma (CESC),
lung squamous cell carcinoma (LUSC), bladder urothelial carcinoma (BLCA), esophageal cancer (ESCA), breast invasive carcinoma (BRCA), stomach adenocarcinoma (STAD),
uterine carcinosarcoma (UCS), pancreatic adenocarcinoma (PAAD), pancreatic cancer (PACA), lung adenocarcinoma (LUAD), rectum adenocarcinoma (READ), colon
adenocarcinoma (COAD), ovarian serous cystadenocarcinoma (OVAD), uterine corpus endometrial carcinoma (UCEC), esophageal adenocarcinoma (ESAD), liver cancers
(LICA, LIRI, LINC), liver hepatocellular carcinoma (LIHC), pediatric brain cancer (PBCA), bone cancer (BOCA), brain lower grade glioma (LGG), glioblastoma multiforme (GBM),
acutemyeloid leukemia (LAML), chronic myeloid disorders (CMDI), chronic lymphocytic leukemia (CLLE), sarcoma (SARC), kidney renal clear cell carcinoma (KIRC), oral cancer
(ORCA), pheochromocytoma and paraganglioma (PCPG), prostate adenocarcinoma (PRAD), skin cutaneous melanoma (SKCM), thyroid carcinoma (THCA), adrenocortical
carcinoma (ACC), kidney renal papillary cell carcinoma (KIRP), kidney chromophobe (KICH), testicular germ cell tumors (TGCT), and uveal melanoma (UVM).
10 of 19 Molecular Systems Biology 14: e7974 | 2018 ª 2018 The Authors
Molecular Systems Biology Features of mutation hotspot residues Marija Buljan et al
Published online: March 23, 2018

mutated protein families, such as Ras proteins and kinases, do show
that similar molecular principles are often reused for the activation
of oncogenic processes. As a corollary, comprehensive cataloging of
residues, which can facilitate a switch in protein function, could
help in identifying additional cancer-associated genes. Here, based
on the sequencing data for more than 10,000 cancer genomes, we
composed a set of most common hotspot mutations with a likely
functional effect and characterized these using available structural
and interaction data, as well as protein sequence features and
residue annotations. Frequently, these mutations were located in
the protein regions that interacted with ligands, or at the interaction
interfaces with other proteins. This represents known mechanisms
of cancer development, where the altered ligand binding on one
hand, or escape from the regulation by interacting proteins on the
other hand, leads to oncogenic activation. The former is illustrated
with the BRAF, KRAS, and IDH1 and the latter with the PIK3R1,
CTNNB1, and CDK6 proteins. Recognizing which protein segments
are particularly important for disease development can be a starting
point for more focused studies of these, as we demonstrated here
with interaction interfaces. Such “hypothesis-driven” analyses will
have more power to detect functional elements mutated at a lower
frequency, compared to methods that do not include any biological
information.
An additional important role of hotspot mutations is likely to be
in inactivating protein function. This class of hotspot residues can
hence indicate the most efficient mechanisms for shutting down
tumor suppressors. On the cellular level, such mutations can (i) act
in a dominant negative manner with respect to the other protein
copy (Welcker & Clurman, 2008; Blattner et al, 2017), (ii) be suffi-
cient for inactivation if the gene is dosage sensitive, or (iii) be
combined with an inactivating mutation in the other gene allele.
Mechanistically, these mutations tend to disrupt the original protein
function, exemplified by the disrupted substrate binding in CREBBP
and EP300, or to prevent the activation of a tumor suppressor,
exemplified by mutations within the SMAD4 interface or CHEK2
activation loop (Dataset EV5). Alternatively, these mutations can
Table 1. Significant gene hits with mutation clusters at theinteraction interfaces that are currently not in the Cancer GeneCensus.
Gene name P-value
CARM1 3.43E-09
C5 6.05E-07
METTL14 1.30E-06
CUL1 2.83E-06
ABCD1 1.67E-05
SCN2A 1.82E-4
IL1RAP 2.07E-4
MAP1LC3A 3.66E-4
CNOT1 3.66E-4
ITGAX 0.001
CUL4B 0.001
UCHL1 0.001
SUPT5H 0.002
BMP2 0.002
CSF2RB 0.002
GNB1 0.002
LRRC4C 0.002
C6 0.003
WDR5 0.003
POLR1A 0.003
ILK 0.004
RXRA 0.004
FLT1 0.005
UBA3 0.005
IL6 0.006
PRKAG3 0.007
TLR4 0.009
MCM6 0.009
TNPO1 0.010
CYFIP1 0.011
ACTB 0.012
CHRNB2 0.013
MPO 0.013
MCM7 0.013
SERPINA10 0.014
EIF5A 0.014
KPNA1 0.014
CDC7 0.015
ITGA2B 0.019
F10 0.019
IRF7 0.019
RPA1 0.019
CHP2 0.020
RAMP2 0.024
Table 1 (continued)
Gene name P-value
COL4A2 0.024
GNG2 0.025
CAB39 0.026
C3 0.028
CFB 0.030
TAF1 0.031
KDM1B 0.034
TRAF2 0.034
SCAF8 0.037
MAPK8 0.037
IL21 0.037
XRCC5 0.045
TTC7B 0.046
PSMB3 0.046
ª 2018 The Authors Molecular Systems Biology 14: e7974 | 2018 11 of 19
Marija Buljan et al Features of mutation hotspot residues Molecular Systems Biology
Published online: March 23, 2018

interfere with the oncogene regulation, exemplified by the PIK3R1
interface to PIK3CA. Analogously to this, oncogenes that are dosage
sensitive are likely to be activated through changes that will result
in the increased transcript and protein levels. Of note, some of the
genes with hotspots are also frequently found overexpressed in dif-
ferent tumor types (Dataset EV11). Overall, molecular principles of
activation and inactivation of genes in cancer will frequently be the
same as in other diseases, and interpretation of genomics data in
general would be strongly empowered with a comprehensive cata-
log of functional, structural, and interaction properties of individual
residues in human proteins.
As more cancer genomes get sequenced, we expect that the list
of genes with hotspot mutations will expand. Furthermore, greater
sample sizes can allow for a detection of residues that are mutated
only in certain tumor types. Many of the proteins with hotspot
mutations identified here do not have well-characterized functions
in the cell. In this context, it is interesting that some of the less-
studied genes with hotspot mutations were proposed to be impor-
tant in cellular decision-making in embryonic stem cells (ESCs). A
recent screen for the genes that contribute to the commitment of
ESCs to differentiation (Leeb et al, 2014) highlighted as hits the
PRKCI kinase, the DHX9 RNA binding protein, and the ZNF706
zinc finger protein, which were all identified here through their
hotspot residues. Notably, retinoic acid receptors are known to
play a key crucial role in cell differentiation, which again high-
lights the example of the RXRA protein (Fig 6A).
Cancer classification based on molecular data, which include
point mutations, copy number variations, and mRNA and protein
expression, has proven to be able to recapitulate pathological
subtypes and suggest finer subclasses within tumor types (Hoadley
et al, 2014). Remarkably, here we observed that clustering of tumor
types based on a small number of functional hotspot mutations was
able to largely mimic the behavior of much more complex molecular
datasets. This observation thus suggests a central role of hotspot
mutations in shaping downstream mRNA and protein expression
levels and cellular phenotypes. Of note, hotspots with a high muta-
tion frequency defined the major trends among the clusters, but
adding information on more residues was able to refine the relation-
ships among different tumor types. It is conceivable that additional
hotspots detected at the level of individual tumor types will also be
informative for this. However, the power to detect these hotspots
strongly depends on the cohort sizes. A higher number of sequenced
genomes should hence allow for a better granularity in discerning
cell-type-specific signaling networks, but also aid in recognizing the
shared mechanisms of cancer progression.
The hotspot residues identified here encompass only 180 amino
acids and represent a very small fraction of the coding genome. Still,
more than a third of the sequenced patients had a mutation in at
least one of these residues. Of relevance, many (i.e., 45) of the
proteins with hotspot mutations are classified as druggable (Dataset
EV12). Among these are the mentioned RXRA and PRKCI proteins.
Importantly, hotspot mutations can be of a high clinical relevance;
they are attractive therapeutic targets, both for small molecules and
for antibodies, as well as for immunotherapy. The former is exem-
plified with the BRAF, KIT, and EGFR proteins. Furthermore, these
mutations can be useful in diagnostics, either in gene panels or in
liquid biopsies. Hotspot mutations are also of high interest in
biomedical studies, as reducing the number of candidate mutations
for the follow-up studies simplifies experimental design and reduces
costs.
Here, using several resources, we compose a set of human
protein complexes and incorporate structural data to analyze these.
CARM1 dimerRXRA (brown) with PPARG (blue), NCOA2 peptide, retinoic acid and DNA
A
CAND1 (purple) and CUL1(blue) with RBX1 (yellow)
CB
Figure 6. Mutations at the interaction interfaces can affect regulation of cancer-associated processes.
A Residues within the interaction interface of the RXRA protein (brown) toward the PPARG receptor (peroxisome proliferator-activated receptor gamma, blue) areshown as spheres. A signal for this interface was driven by the hotspot mutation in RXRA (shown as a red sphere). Other protein regions in the representative PDBstructure (3dzy) are shown as ribbons. The NCOA2 coactivator peptide is not visible from the shown angle, while the retinoic acid can be partly seen above theinterface and it is represented with dark red sticks.
B CARM1 protein dimer is shown within the representative PDB structure (5dx0). Again, the interface segments are depicted as spheres and the rest of the protein asribbons. Significant signal within the interface is driven by the CARM1 hotspot mutation that is shown in red.
C Interaction interfaces that gave a strong signal for the clustering of cancer mutations in the CAND1 (cullin associated and neddylation dissociated 1, purple) andCUL1 (culling homolog 1, blue) proteins are shown as spheres and other protein segments as ribbons. The shown PDB structure (1u6g) represents a complex thatadditionally contains the RBX1 protein (RING-box protein 1, yellow).
12 of 19 Molecular Systems Biology 14: e7974 | 2018 ª 2018 The Authors
Molecular Systems Biology Features of mutation hotspot residues Marija Buljan et al
Published online: March 23, 2018

In this way, we detect a number of additional interaction interfaces
that are significantly affected by cancer mutations. Of interest, many
of the identified candidate proteins belong to protein families that
already have cancer-associated members (such as MCM6 and
MCM7 proteins, MAPK8, or CDC7, Table 1). A larger set of interac-
tion pairs with structural models will likely identify many more
cases where formation or dissociation of specific protein interactions
has an important role in cancer. Finally, integration of cancer geno-
mics analyses with large-scale experimental approaches, such as
functional genomics screens (Boutros et al, 2015), protein interac-
tion (Aebersold & Mann, 2016), and genetic epistasis assays (Laufer
et al, 2013) as well as studies of mutation effects on pathway activa-
tion and proteome re-organization (Collins et al, 2013), can addi-
tionally help in narrowing down medically and clinically relevant
candidates. Eventually, a larger catalog of cancer-associated muta-
tions further characterized in vitro and in model organisms would
be invaluable for understanding different routes of disease emer-
gence and for identifying therapeutic opportunities.
Materials and Methods
DominoEffect R package
In order to automate detection and annotation of hotspot mutations
from the sequencing data, we developed an R/Bioconductor pack-
age DominoEffect. The package relies on the gene and protein anno-
tations from the Ensembl database, which can also be obtained
through the BiomaRt R package (Kinsella et al, 2011). Its central
part is an algorithm for the detection of significant hotspot muta-
tions in the protein segments of a defined length. For this, the
default is to use windows of 200 and 300 amino acid lengths that
are centered on the potential hotspot residues (i.e., residues with 5
or more mutations) and require that in both cases at least 15% of
mutations in the segment fall on the same residue. The length of
windows was chosen so to encompass an individual protein
domain. Domains are frequently independent functional and struc-
tural protein units and are typically 100–250 residues long (Chothia
et al, 2003). A threshold for the fraction of mutations was chosen
after assessing different values for the pre-defined window length
(i.e., both 200 and 300 aa) and asking for the resulting gene set to
be enriched in the genes involved in cancer pathways. The thresh-
old of 15% was associated with the lowest P-value for the enrich-
ment in “Pathways in cancer” according to the KEGG pathways
annotations (Kanehisa et al, 2016). The minimum number of muta-
tions (default 5), window lengths, and thresholds for the required
fraction of mutations can be easily adjusted in the package. In addi-
tion, the percentage of mutations can be replaced with a require-
ment for the high overrepresentation of mutations at a candidate
hotspot residue when compared to the overall mutation rate in the
window. The tool excludes common population variants, gives a
hotspot P-value (adjusted Poisson test), and overlaps the hotspot
residues with the instantly downloaded functionally annotated
regions in the UniProt/Swiss-Prot KB. For the latter step, when
transferring SwissProt annotations, it controls for the sequence
agreement between the UniProt and Ensembl protein sequences. In
this study, we used the package on the Pan-cancer data, but with
more permissive thresholds, it can also be used for finding hotspot
mutations relevant for individual tumor types. With the default
settings, only highly frequent mutations will be identified in the
smaller patient cohorts. Details and examples are provided in the
package vignette. In addition to cancer, the tool can be applied to
any other disease for which sufficient exon sequencing data are
available (Hoischen et al, 2014).
Mapping genomic mutations onto protein sequences
The results shown here are in part based upon data generated by
the TCGA Research Network: http://cancergenome.nih.gov/. We
obtained whole exome somatic mutation data deposited in the
TCGA and ICGC cancer genomics repositories and available in
September 2015. We retrieved somatic mutations sequencing level 2
files from the TCGA web service and proceeded with the analyses of
those files that passed the Broad Institute quality filters and were
listed on their MAF Dashboard site (https://confluence.broadinsti
tute.org/display/GDAC/MAF+Dashboard). This included the
following TCGA tumor types: acute myeloid leukemia (LAML),
adrenocortical carcinoma (ACC), bladder urothelial carcinoma
(BLCA), brain lower grade glioma (LGG), breast invasive carcinoma
(BRCA), cervical squamous cell carcinoma and endocervical adeno-
carcinoma (CESC), cholangiocarcinoma (CHOL), colon adenocarci-
noma (COAD), glioblastoma multiforme (GBM), head and neck
squamous cell carcinoma (HNSC), kidney chromophobe (KICH),
kidney renal clear cell carcinoma (KIRC), kidney renal papillary cell
carcinoma (KIRP), liver hepatocellular carcinoma (LIHC), lung
adenocarcinoma (LUAD), lung squamous cell carcinoma (LUSC),
lymphoid neoplasm diffuse large B-cell lymphoma (DLBC), ovarian
serous cystadenocarcinoma (OV), pancreatic adenocarcinoma
(PAAD), pheochromocytoma and paraganglioma (PCPG), prostate
adenocarcinoma (PRAD), rectum adenocarcinoma (READ), sarcoma
(SARC), skin cutaneous melanoma (SKCM), stomach adenocarci-
noma (STAD), testicular germ cell tumors (TGCT), thyroid carci-
noma (THCA), uterine carcinosarcoma (UCS), uterine corpus
endometrial carcinoma (UCEC), and uveal melanoma (UVM).
Additionally, we downloaded files with simple somatic mutations
from the ICGC data release 19. We excluded files with an unusually
high mutation rate and files that were also available as a part of the
TCGA set. This added further mutation data for the following tumor
types: acute lymphoblastic leukemia (ALL), bladder cancer (BLCA),
bone cancer (BOCA), breast triple negative/lobular cancer (BRCA),
chronic lymphocytic leukemia (CLLE), chronic myeloid disorders
(CMDI), colorectal cancer (COCA), esophageal adenocarcinoma
(ESAD), esophageal cancer (ESCA), ewing sarcoma (BOCA), gastric
cancer (GACA), liver cancers (LICA, LIRI, LINC, LIAD, LIHM), lung
cancer (LUSC), malignant lymphoma (MALY), neuroblastoma
(NBL), oral cancer (ORCA), ovarian cancer (OV), pancreatic cancer
(PACA), pancreatic cancer endocrine neoplasms (PAEN), pediatric
brain cancer (PBCA), prostate adenocarcinoma (PRAD), early onset
prostate cancer (EOPC), and renal cancers (RECA).
To consistently map these mutations onto protein sequences, we
downloaded gene and transcript annotations from the Ensembl data-
base (Yates et al, 2016), release 73. For each gene, we chose a
representative, that is, longest protein coding transcript and used an
in-house Perl script to map the genomic mutations to the corre-
sponding amino acids. For the genomic mutation coordinates that
were not aligned to the Human reference genome assembly build 37
(i.e., GRCh37), we used the UCSC LiftOver service (Kent et al, 2002)
ª 2018 The Authors Molecular Systems Biology 14: e7974 | 2018 13 of 19
Marija Buljan et al Features of mutation hotspot residues Molecular Systems Biology
Published online: March 23, 2018
and transferred these to GRCh37. Jointly, the analyzed TCGA and
ICGC mutation datasets covered 40 different tumor types which
spanned 23 tissues of origin. Sequencing data reported mutations
for 10,118 samples in total. In the obtained cancer genomes, more
than a million single nucleotide somatic changes within protein
sequences were observed (1,356,533 single nucleotide mutations).
Seventy percent of these mutations (947,359) categorized as non-
synonymous and were predicted to result in an amino acid change.
Detection of hotspot mutations with a likely functional effect
We developed the R package DominoEffect that is described above
and that analyses mutation patterns within protein sequences and
finds hotspot residues which accumulate mutations at a much
higher rate than their neighborhood protein regions. We ran the
package on the compendium of the TCGA and ICGC data
described above and additionally on the TCGA data alone. The
latter was done to account for a possible difference in quality
between the files: The downloaded TCGA files passed a quality
check for entering the Broad firehose, but the individual ICGC files
did not have a reference for the quality. Lower quality of mutation
data in some of the files could thus result in the general back-
ground mutation noise and prevent detection of the less frequent
hotspots. However, merging the two datasets gives more power to
detect less prominent thresholds. Hence, we combined the signifi-
cant results from the both analysis.
A major source of false positives in the set of the identified
hotspot mutations is due to common variants that, incorrectly, were
not detected in the paired healthy tissue from the same patient. In
order to address this systematically, we combined information on
variants from several different resources. However, filtering out all
positions that vary in the reference genomes would affect true muta-
tions and germline risk variants. In order to keep these, we excluded
only hotspots that overlapped with the genome variants that
occurred in more than 1% of the population. This does not exclude
all false positives from the set, but it increases the quality of the
current predictions.
To obtain the information on the common variants, we down-
loaded Ensembl variation data using the BioMart tool (Ensembl
releases 75 and updated 82; the latter coordinates were transferred
with the LiftOver tool to the genome assembly build 37). This
included variation data from the 1,000 genomes (Genomes Project C
et al, 2015), dbSNP (Sherry et al, 2001), and other databases.
Furthermore, we downloaded the Kaviar database (Glusman et al,
2011) as well as coordinates of genomic variants collected by the
Exome Aggregation Consortium (release 1, a subset without the
TCGA variants) (Lek et al, 2016) and assessed overlaps with the
identified hotspot mutations. We excluded all hotspots that over-
lapped with a variant for which the associated general population
frequency in either of the reference populations was higher than
1%.
Next, we used the PolyPhen-2 tool (Adzhubei et al, 2010)
through the online batch submission and retrieved predictions for
the likely functional effects of the genomic changes corresponding
to protein hotspots. For all coordinates that were predicted to
result in a “deleterious” change, we kept the associated protein
hotspot position. All other predicted hotspots were excluded from
the further analysis in order to reduce possible false-positive
instances of hotspot mutations in the final set. This, however,
possibly also excluded some true positives. In addition, we submit-
ted the genomic coordinates of hotspots to the Provean tool (Choi
et al, 2012) and noted that positions, which were predicted as
“deleterious” according to this predictor largely agreed with the
used predictions.
To obtain estimates of random mutation events, we made a
simulation where amino acids were equally represented and all
nucleotides were equally likely to mutate. We repeated the simu-
lation 10,000 times and noted frequency of different types of
events. This gave an estimate for the expected mutation rate of
glutamate to lysine in a randomly composed and freely mutated
protein set.
Characterization of genes with hotspot mutations
We retrieved the list of genes annotated as the Cancer Gene Census
(Futreal et al, 2004) from the COSMIC web resource (Forbes et al,
2017). We used the list available on January 11, 2017. Based on this
catalogue, we classified the genes with the identified hotspot muta-
tions as known or candidate cancer driver genes. Next, through the
Ensembl BioMart service (Kinsella et al, 2011), we retrieved predic-
tions for all human genes that are homologous to those with hotspot
mutations, and assessed which of these were in the cancer Gene
Census or had a hotspot mutation themselves.
We composed two other sets of genes to which we compared
those with hotspot mutations: (i) all other genes in the Cancer Gene
Census, that is, excluding those with hotspots and paralogs of genes
with hotspot mutations (based on the Ensembl homology assign-
ments) and (ii) all other protein coding genes in the UniProtKB
reference set of human proteins (release 2016_06, July 2016), that
is, excluding all Cancer Gene Census genes or genes with hotspot
mutations. We used the UniProtKB and Ensembl BioMart to map
Ensembl, Uniprot, and Entrez gene identifiers for the genes in the
three sets.
Next, we obtained information on the proteins classified as
enzymes from the Expasy ENZYME nomenclature database
(Bairoch, 2000), release 06-July 2016. We compared the fractions of
enzymes in the three datasets using the chi-squared test in R.
Further, we retrieved GO annotations (Gene Ontology, 2015) for the
genes in the three sets using the Ensembl Biomart service. In addi-
tion, we obtained information on the domains encoded by the
proteins in the three sets by taking predictions for the human
proteins provided by the Pfam database (release 28.0, May 2015).
For the GO terms and Pfam domains associated with the set of genes
with hotspot mutations (i.e., with three or more genes), we
compared fractions of proteins annotated with the same terms and
domains among the three sets. For this, we used the Fisher’s test in
R and accounted for the multiple testing with the Benjamini–Hoch-
berg correction (https://www.r-project.org/).
Genes involved in the signaling by Rho GTPases were obtained
from the GenScript website where the assignments were based on
the Reactome annotations (Fabregat et al, 2016). Rho proteins often
function as binary switches that control a variety of biological
processes (Ellenbroek & Collard, 2007).
Annotation of the affected protein residues
We used the Pfam batch service (Finn et al, 2016) to predict exact
domain coordinates in the representative Ensembl protein
sequences, which the cancer mutations were mapped to. We
14 of 19 Molecular Systems Biology 14: e7974 | 2018 ª 2018 The Authors
Molecular Systems Biology Features of mutation hotspot residues Marija Buljan et al
Published online: March 23, 2018
overlapped positions of hotspot mutations with the boundaries of
individual domains. In addition, we retrieved data on functionally
annotated regions within the proteins with hotspot mutations from
the UniProtKB service. We aligned these protein regions to the
representative Ensembl proteins and looked for an overlap with the
hotspot mutations. UniProtKB annotations also provide information
on the PDB structures associated with each protein. For all proteins
with hotspot mutations, for which X-ray structural data were avail-
able, we obtained a representative PDB structure. Representative
structure was chosen so to cover the longest possible stretch of a
protein sequence and to have a resolution below 3 Angstroms (A),
when possible. In addition, for the candidate proteins that were not
in the Cancer Gene Census, we analyzed all available PDB crystal
structures. For the selected PDB identifiers, we retrieved residue-
associated data from the PDBePISA database (Krissinel & Henrick,
2007). Of note, from the structural point of view, residues are classi-
fied as being either at the interface, buried inside the protein core or
exposed at the surface (Chothia, 1976; Levy, 2010). The PDBePISA
assignments provided information on the accessible and buried
surface area of each amino acid. In our analysis, we focused on the
PDBePISA annotated complex interfaces that had a complexation
significance score (CSS) higher than 0.3 when the interface contacts
were formed between two proteins, or CSS higher than 0.05 when
the interface was formed with a ligand or nucleic acid. The score
indicates how significant the interface is for the assembly formation,
and we used these thresholds to prioritize biologically relevant
interfaces for further analyses. We further classified protein residues
with the buried surface area larger than 25 A² as interface residues.
We used a conservative threshold in order to obtain a more confi-
dent prediction of amino acids that contribute to the interface
formation. Interfaces encompassed protein–protein, protein–DNA,
and protein–ligand interactions. We mapped coordinates of inter-
faces in the PDB structures to Ensembl proteins by aligning interface
stretches to these and, when interface segments were shorter than
five amino acids, we included surrounding residues in the alignment
so to have segments of five amino acids or longer. To align the PDB
with the Ensembl protein sequences, we used a Perl script and a
Smith–Waterman local alignment algorithm from the Emboss pack-
age with the default parameters (release Emboss-6.6.0). Coordinates
were mapped when the sequence identity between the aligned
peptides was at least 80%, or—if the alignment was longer than ten
amino acids—at least 60%. We then assessed an overlap of hotspot
positions with the interaction interfaces in proteins.
Signatures of tumor suppressor genes
Somatic mutation files obtained from the TCGA and ICGC and
described above also contained information on the other types of
small-range mutations in the sequenced genomes. We analyzed
these changes and classified premature nonsense mutations and out
of frame insertions and deletions in the encoded proteins as highly
deleterious. We compared these to the synonymous amino acid
changes in the same proteins, which represented an imperfect
(Supek et al, 2014) approximation for the local background muta-
tion rate. Genes with a high number of the reported deleterious
changes (at least 25) and large contribution of these changes to the
overall mutation load (the ratio of deleterious over synonymous
changes was higher than 0.7) were considered as tumor suppressor
candidates.
To address whether a mechanism of action for any of the muta-
tions was interference with the activation of tumor suppressors
through phosphorylation, we obtained positions of phosphosites in
these proteins using the PhosphoSitePlus resource (Hornbeck et al,
2012). We obtained coordinates of phosphosites that were reported
by a small scale or two or more mass spectrometry studies and
assessed if they were in the vicinity of hotspots.
Interaction partners and neighborhoods of the proteins with hotspots
To compare a fraction of domains that mediate protein interac-
tions among the previously composed sets of genes (genes with
hotspot mutations, other genes in the Cancer Gene Census and
background human proteins), we obtained domain annotations
from the iPfam 1.0 (June 2013) and used chi-squared test in R.
Further, we used a Functional Annotation service from the
ConsensusPathDB-human database compendium (Kamburov et al,
2013). This resource integrates human interaction networks and
includes binary, complex, signaling, and other experimentally
identified interaction relationships. Specifically, for the uploaded
proteins with hotspot mutations, we used the Network neighbor-
hood-based entity set analysis, which finds network centers whose
direct interaction neighborhood is enriched with the provided
proteins. Overrepresentation is calculated based on the back-
ground of all human proteins for which the annotation necessary
for the analysis is available. The calculated P-value is based on
the hypergeometric test and corrected for multiple testing with the
false discovery rate method. Among the significant hits, we
searched for the protein centers that had a hotspot mutation them-
selves and for which other proteins with hotspots were overrepre-
sented in their interaction neighborhood.
In addition, we used publicly available annotated physical inter-
actions from the BioGRID database (BioGRID version 3.4.138), and
among these, we searched for the interaction partners of proteins
with hotspot mutations. We considered only interactions classified
as “physical association” or “direct interaction”, and this included
interaction pairs identified using the affinity chromatography or the
BioID method for the former, or using the two hybrid, pull down,
enzymatic studies, florescence energy transfer, Western blotting, or
protein complementation assays for the latter. We then calculated
the fraction of proteins from the Cancer Gene Census in the interac-
tion neighborhood of each individual protein. Enrichment of known
cancer drivers among the interaction neighbors of candidate
proteins could serve as an indication of their connection to the
cancer-relevant pathways.
Clustering of tumor types
We grouped the TCGA and ICGC tumor types that had the same
name abbreviation and excluded from the further analysis those,
which had sequencing data available for fewer than 50 patients. In
all other tumor types, we noted a number of patients with the
somatic mutation data. For each of the identified hotspot mutations,
we looked at the individual tumor types and calculated a fraction of
patients which had this residue mutated. On the thus obtained table,
we used the pvclust R package, which performs hierarchical cluster-
ing with bootstrap resampling (Suzuki & Shimodaira, 2006). We
used median distance as a clustering method and noted the resulting
clusters of tissue types that had high P-values after 10,000 boot-
strapping repetitions.
ª 2018 The Authors Molecular Systems Biology 14: e7974 | 2018 15 of 19
Marija Buljan et al Features of mutation hotspot residues Molecular Systems Biology
Published online: March 23, 2018
We next drew a heatmap plot where the clustering of tissue
types was defined with the pvclust results and where, for the clar-
ity, we reduced the number of the visualized hotspots by includ-
ing only those mutated in one-third or more of the patients in at
least one tumor type. Clustering of hotspots was based on the
pvclust results. The original values for the fractions of patients
with each hotspot mutation were log2-transformed, and zeroes
were represented as the lowest values in the table. A heatmap in
Fig 5 depicts a simplified version of the pvclust dendrogram. R
packages gplots and RColorBrewer were used for the heatmap
drawing.
Interface mutation clusters
We obtained a representative dataset of stable human protein
interactors with a structural support from the Interactome3D data-
base version 2016_06 (Mosca et al, 2013). The Interactome3D
database contains experimentally observed protein interaction part-
ners for which either a PDB structure exists or a homology model
could be generated. In our analyses, we focused on those interac-
tion pairs that are likely to form stable complexes [i.e., interac-
tions that were reported within the same complex in the Reactome
database (Fabregat et al, 2016) or Corum (Ruepp et al, 2010), or
by three or more Affinity purification experiments (Chatr-
Aryamontri et al, 2015)]. We obtained a representative dataset
provided by the Interactome3D that corresponds to the top ranking
structures and models. For all the template PDB structures corre-
sponding to members of the above-defined complexes, we
retrieved residue annotations from the PDBePISA database
(Krissinel & Henrick, 2007). We further followed the procedure
described above in the Methods section “Annotation of the affected
protein residues” in order to identify interface residues in the
template proteins and, when possible, map the obtained interface
coordinates to the Ensemble protein sequences. Next, we used the
ActiveDriver tool (version 0.0.10) (Reimand & Bader, 2013) in
order to assess positional clustering of mutations reported in the
cancer genomics studies. ActiveDriver implements a logistic regres-
sion model. It was initially developed to identify phosphosites that
had a mutation pattern which significantly differed from the gene
background mutation rate, while accounting for the differences in
mutation rates between structured and disordered protein regions.
We used the package settings in which the user can provide coor-
dinates of the regions of interest and analyzed mutations clustering
at the interaction interfaces. For the required mutation data, we
provided the amino acid changes reported in the above-described
TCGA and ICGC datasets, and we specified intrinsically disordered
protein regions by using the IUPred tool (Dosztanyi et al, 2005;
version 1.0) with the settings for short disorder and a residue
disorder prediction threshold of 0.5. From the ActiveDriver
predicted proteins with significant interface mutation clusters, we
analyzed further those that had a multiple testing corrected P-value
lower than 0.05. For these proteins, we searched for the particular
interfaces that were likely to be affected with the reported muta-
tions. We used GO term protein annotations (Harris et al, 2004;
GO database annotations for UniProtKB proteins, release Novem-
ber 2017) to assess cellular processes in which these proteins
could play a role, and the ConsensusPathDB service for finding
larger affected complexes. For the former analyses, we compared
the GO term frequency between the set of proteins with frequently
mutated interfaces and the rest of the representative proteome
using the Fisher’s test and we adjusted the obtained P-values for
multiple testing using the Benjamini–Hochberg correction. In the
Dataset EV10, we reported significant terms which were associated
with three or more proteins.
Drug targets
We obtained information on the druggable proteins for the list of
genes with hotspot mutations using the DGIdb service (Griffith et al,
2013) (http://dgidb.genome.wustl.edu/).
Amplified and overexpressed genes
We used the cgdsr R package from the cBioPortal and obtained the
GISTIC values and the estimated z-scores for mRNA values from
the available TCGA studies, which included data from 35 and 32
tumor types, respectively. Using as thresholds CNV values > 1 and
mRNA z-scores > 2, we looked at the percentages of patients in
each tumor type that had the “hotspot genes” amplified and/or
overexpressed. To obtain comparable sizes of gene sets, we asked
for a gene to be either amplified in 5% or more or to be overex-
pressed in 10% or more of the patients of the same tumor type. We
excluded ovarian adenocarcinoma data from the former analysis as
the majority of genes had apparently unspecific and strong signals
in this tumor type.
Data availability
The code for identifying and annotating protein hotspot residues is
available for download as an R/Bioconductor software package
“DominoEffect” in Code EV1. The folder contains example datasets
and a vignette that explains the code usage in detail. We recom-
mend using the up-to-date version available from the Bioconductor
website: https://bioconductor.org/packages/3.7/bioc/html/Domino
Effect.html.
Expanded View for this article is available online.
AcknowledgementsWe gratefully acknowledge contributions from the TCGA Research Network.
We are also very grateful to the ICGC for the tumor genome resequencing
data generated. We would like to acknowledge Madan Babu, Jelena Bara-
novic, Robert Weatheritt, Rodolfo Ciuffa, Steffie Revia, Marco Faini, Max
Frank, Isabell Bludau, and Lucija Silic for their feedback on the study. We
apologize for not including citations to individual cancer genomics studies
due to space restrictions. A structure used in the scheme on Fig 1 is
reprinted by permission from: Springer Nature, Nature Structural and Mole-
cular Biology, The structure of the Pan2–Pan3 core complex reveals cross-
talk between deadenylase and pseudokinase, IB Schafer et al, 2014 (Licence
Number: 4303640958191). Work in the laboratory of M. Boutros is in part
supported by an ERC Advanced Grant Syngene (ERC-2011-ADG_20110310).
R.A. acknowledges the following grant support: ERC grant Proteomics v3.0
(ERC-2008-AdG_20080422), ERC Proteomics 4D (670821), and the Swiss
National Science Foundation (3100A0-688 107679). M. Buljan was funded by
the Cluster of Excellence CellNetworks (EXC 81) and SystemsX.ch (TPdF
2013/135) fellowships. P.B. was supported by the SNSF SystemsX.ch fellow-
ship (TPdF 2013/134).
16 of 19 Molecular Systems Biology 14: e7974 | 2018 ª 2018 The Authors
Molecular Systems Biology Features of mutation hotspot residues Marija Buljan et al
Published online: March 23, 2018
Author contributionsMBu, PB, RA and MBo jointly conceived the study, interpreted the results, and
wrote the manuscript. Analyses were performed by MBu. PB co-authored the
DominoEffect R/Bioconductor package. RA and MBo co-supervised the study.
Conflict of interestThe authors declare that they have no conflict of interest.
References
Adzhubei IA, Schmidt S, Peshkin L, Ramensky VE, Gerasimova A, Bork P,
Kondrashov AS, Sunyaev SR (2010) A method and server for predicting
damaging missense mutations. Nat Methods 7: 248 – 249
Aebersold R, Mann M (2016) Mass-spectrometric exploration of proteome
structure and function. Nature 537: 347 – 355
Alexandrov LB, Nik-Zainal S, Wedge DC, Aparicio SA, Behjati S, Biankin AV,
Bignell GR, Bolli N, Borg A, Borresen-Dale AL, Boyault S, Burkhardt B,
Butler AP, Caldas C, Davies HR, Desmedt C, Eils R, Eyfjord JE, Foekens JA,
Greaves M et al (2013) Signatures of mutational processes in human
cancer. Nature 500: 415 – 421
Alioto TS, Buchhalter I, Derdak S, Hutter B, Eldridge MD, Hovig E, Heisler
LE, Beck TA, Simpson JT, Tonon L, Sertier AS, Patch AM, Jager N,
Ginsbach P, Drews R, Paramasivam N, Kabbe R, Chotewutmontri S,
Diessl N, Previti C et al (2015) A comprehensive assessment of somatic
mutation detection in cancer using whole-genome sequencing. Nat
Commun 6: 10001
Alvarez MJ, Shen Y, Giorgi FM, Lachmann A, Ding BB, Ye BH, Califano A (2016)
Functional characterization of somatic mutations in cancer using
network-based inference of protein activity. Nat Genet 48: 838 – 847
Araya CL, Cenik C, Reuter JA, Kiss G, Pande VS, Snyder MP, Greenleaf WJ
(2016) Identification of significantly mutated regions across cancer types
highlights a rich landscape of functional molecular alterations. Nat Genet
48: 117 – 125
Bairoch A (2000) The ENZYME database in 2000. Nucleic Acids Res 28:
304 – 305
Berman HM, Westbrook J, Feng Z, Gilliland G, Bhat TN, Weissig H, Shindyalov
IN, Bourne PE (2000) The protein data bank. Nucleic Acids Res 28:
235 – 242
Blattner M, Liu D, Robinson BD, Huang D, Poliakov A, Gao D, Nataraj S,
Deonarine LD, Augello MA, Sailer V, Ponnala L, Ittmann M, Chinnaiyan AM,
Sboner A, Chen Y, Rubin MA, Barbieri CE (2017) SPOP mutation drives
prostate tumorigenesis in vivo through coordinate regulation of PI3K/
mTOR and AR signaling. Cancer Cell 31: 436 – 451
Boutros M, Heigwer F, Laufer C (2015) Microscopy-based high-content
screening. Cell 163: 1314 – 1325
Burke JE, Perisic O, Masson GR, Vadas O, Williams RL (2012) Oncogenic
mutations mimic and enhance dynamic events in the natural activation
of phosphoinositide 3-kinase p110alpha (PIK3CA). Proc Natl Acad Sci USA
109: 15259 – 15264
Cancer Genome Atlas Research N (2014a) Comprehensive molecular
characterization of urothelial bladder carcinoma. Nature 507: 315 – 322
Cancer Genome Atlas Research N (2014b) Comprehensive molecular profiling
of lung adenocarcinoma. Nature 511: 543 – 550
Cancer Genome Atlas Research N, Weinstein JN, Collisson EA, Mills GB, Shaw
KR, Ozenberger BA, Ellrott K, Shmulevich I, Sander C, Stuart JM (2013) The
cancer genome atlas pan-cancer analysis project. Nat Genet 45:
1113 – 1120
Chang MT, Asthana S, Gao SP, Lee BH, Chapman JS, Kandoth C, Gao J, Socci
ND, Solit DB, Olshen AB, Schultz N, Taylor BS (2016) Identifying recurrent
mutations in cancer reveals widespread lineage diversity and mutational
specificity. Nat Biotechnol 34: 155 – 163
Chatr-Aryamontri A, Breitkreutz BJ, Oughtred R, Boucher L, Heinicke S, Chen
D, Stark C, Breitkreutz A, Kolas N, O’Donnell L, Reguly T, Nixon J, Ramage
L, Winter A, Sellam A, Chang C, Hirschman J, Theesfeld C, Rust J, Livstone
MS et al (2015) The BioGRID interaction database: 2015 update. Nucleic
Acids Res 43: D470 –D478
Chen JC, Alvarez MJ, Talos F, Dhruv H, Rieckhof GE, Iyer A, Diefes KL, Aldape K,
Berens M, Shen MM, Califano A (2014) Identification of causal genetic
drivers of human disease through systems-level analysis of regulatory
networks. Cell 159: 402 – 414
Choi Y, Sims GE, Murphy S, Miller JR, Chan AP (2012) Predicting the functional
effect of amino acid substitutions and indels. PLoS One 7: e46688
Chothia C (1976) The nature of the accessible and buried surfaces in proteins.
J Mol Biol 105: 1 – 12
Chothia C, Gough J, Vogel C, Teichmann SA (2003) Evolution of the protein
repertoire. Science 300: 1701 – 1703
Collins BC, Gillet LC, Rosenberger G, Rost HL, Vichalkovski A, Gstaiger M,
Aebersold R (2013) Quantifying protein interaction dynamics by SWATH
mass spectrometry: application to the 14-3-3 system. Nat Methods 10:
1246 – 1253
Davoli T, Xu AW, Mengwasser KE, Sack LM, Yoon JC, Park PJ, Elledge SJ (2013)
Cumulative haploinsufficiency and triplosensitivity drive aneuploidy
patterns and shape the cancer genome. Cell 155: 948 – 962
Dees ND, Zhang Q, Kandoth C, Wendl MC, Schierding W, Koboldt DC, Mooney
TB, Callaway MB, Dooling D, Mardis ER, Wilson RK, Ding L (2012) MuSiC:
identifying mutational significance in cancer genomes. Genome Res 22:
1589 – 1598
Dosztanyi Z, Csizmok V, Tompa P, Simon I (2005) IUPred: web server for the
prediction of intrinsically unstructured regions of proteins based on
estimated energy content. Bioinformatics 21: 3433 – 3434
Ellenbroek SI, Collard JG (2007) Rho GTPases: functions and association with
cancer. Clin Exp Metastasis 24: 657 – 672
Engin HB, Kreisberg JF, Carter H (2016) Structure-based analysis reveals
cancer missense mutations target protein interaction interfaces. PLoS One
11: e0152929
Fabregat A, Sidiropoulos K, Garapati P, Gillespie M, Hausmann K, Haw R, Jassal
B, Jupe S, Korninger F, McKay S, Matthews L, May B, Milacic M, Rothfels K,
Shamovsky V, Webber M, Weiser J, Williams M, Wu G, Stein L et al (2016)
The reactome pathway knowledgebase. Nucleic Acids Res 44: D481 –D487
Finn RD, Miller BL, Clements J, Bateman A (2014) iPfam: a database of
protein family and domain interactions found in the Protein Data Bank.
Nucleic Acids Res 42: D364 –D373
Finn RD, Coggill P, Eberhardt RY, Eddy SR, Mistry J, Mitchell AL, Potter SC,
Punta M, Qureshi M, Sangrador-Vegas A, Salazar GA, Tate J, Bateman A
(2016) The Pfam protein families database: towards a more sustainable
future. Nucleic Acids Res 44: D279 –D285
Forbes SA, Beare D, Boutselakis H, Bamford S, Bindal N, Tate J, Cole CG, Ward
S, Dawson E, Ponting L, Stefancsik R, Harsha B, Kok CY, Jia M, Jubb H,
Sondka Z, Thompson S, De T, Campbell PJ (2017) COSMIC: somatic cancer
genetics at high-resolution. Nucleic Acids Res 45: D777 –D783
Futreal PA, Coin L, Marshall M, Down T, Hubbard T, Wooster R, Rahman N,
Stratton MR (2004) A census of human cancer genes. Nat Rev Cancer 4:
177 – 183
Gao J, Chang MT, Johnsen HC, Gao SP, Sylvester BE, Sumer SO, Zhang H, Solit
DB, Taylor BS, Schultz N, Sander C (2017) 3D clusters of somatic
ª 2018 The Authors Molecular Systems Biology 14: e7974 | 2018 17 of 19
Marija Buljan et al Features of mutation hotspot residues Molecular Systems Biology
Published online: March 23, 2018

mutations in cancer reveal numerous rare mutations as functional
targets. Genome Med 9: 4
Garraway LA, Lander ES (2013) Lessons from the cancer genome. Cell 153:
17 – 37
Garvie CW, Hagman J, Wolberger C (2001) Structural studies of Ets-1/Pax5
complex formation on DNA. Mol Cell 8: 1267 – 1276
Gay LJ, Felding-Habermann B (2011) Contribution of platelets to tumour
metastasis. Nat Rev Cancer 11: 123 – 134
Gene Ontology C (2015) Gene ontology consortium: going forward. Nucleic
Acids Res 43: D1049 –D1056
Genomes Project C, Auton A, Brooks LD, Durbin RM, Garrison EP, Kang HM,
Korbel JO, Marchini JL, McCarthy S, McVean GA, Abecasis GR (2015) A
global reference for human genetic variation. Nature 526: 68 – 74
Glusman G, Caballero J, Mauldin DE, Hood L, Roach JC (2011) Kaviar: an
accessible system for testing SNV novelty. Bioinformatics 27:
3216 – 3217
Glusman G, Rose PW, Prlic A, Dougherty J, Duarte JM, Hoffman AS, Barton GJ,
Bendixen E, Bergquist T, Bock C, Brunk E, Buljan M, Burley SK, Cai B,
Carter H, Gao J, Godzik A, Heuer M, Hicks M, Hrabe T et al (2017)
Mapping genetic variations to three-dimensional protein structures to
enhance variant interpretation: a proposed framework. Genome Med 9:
113
Griffith M, Griffith OL, Coffman AC, Weible JV, McMichael JF, Spies NC, Koval
J, Das I, Callaway MB, Eldred JM, Miller CA, Subramanian J, Govindan R,
Kumar RD, Bose R, Ding L, Walker JR, Larson DE, Dooling DJ, Smith SM
et al (2013) DGIdb: mining the druggable genome. Nat Methods 10:
1209 – 1210
Hanel W, Marchenko N, Xu S, Yu SX, Weng W, Moll U (2013) Two hot spot
mutant p53 mouse models display differential gain of function in
tumorigenesis. Cell Death Differ 20: 898 – 909
Harris MA, Clark J, Ireland A, Lomax J, Ashburner M, Foulger R, Eilbeck K,
Lewis S, Marshall B, Mungall C, Richter J, Rubin GM, Blake JA, Bult C,
Dolan M, Drabkin H, Eppig JT, Hill DP, Ni L, Ringwald M et al (2004) The
gene ontology (GO) database and informatics resource. Nucleic Acids Res
32: D258 –D261
Hoadley KA, Yau C, Wolf DM, Cherniack AD, Tamborero D, Ng S, Leiserson
MD, Niu B, McLellan MD, Uzunangelov V, Zhang J, Kandoth C, Akbani
R, Shen H, Omberg L, Chu A, Margolin AA, Van’t Veer LJ, Lopez-Bigas N,
Laird PW et al (2014) Multiplatform analysis of 12 cancer types reveals
molecular classification within and across tissues of origin. Cell 158:
929 – 944
Hofree M, Shen JP, Carter H, Gross A, Ideker T (2013) Network-based
stratification of tumor mutations. Nat Methods 10: 1108 – 1115
Hoischen A, Krumm N, Eichler EE (2014) Prioritization of
neurodevelopmental disease genes by discovery of new mutations. Nat
Neurosci 17: 764 – 772
Hornbeck PV, Kornhauser JM, Tkachev S, Zhang B, Skrzypek E, Murray B,
Latham V, Sullivan M (2012) PhosphoSitePlus: a comprehensive resource
for investigating the structure and function of experimentally determined
post-translational modifications in man and mouse. Nucleic Acids Res 40:
D261 –D270
Huo LR, Liang JT, Zou JH, Wang LY, Li Q, Wang XM (2012) Possible
novel roles of poly(rC)-binding protein 1 in SH-SY5Y neurocytes:
an analysis using a dynamic Bayesian network. Neurosci Bull 28:
282 – 290
International Cancer Genome C, Hudson TJ, Anderson W, Artez A, Barker AD,
Bell C, Bernabe RR, Bhan MK, Calvo F, Eerola I, Gerhard DS, Guttmacher A,
Guyer M, Hemsley FM, Jennings JL, Kerr D, Klatt P, Kolar P, Kusada J, Lane
DP et al (2010) International network of cancer genome projects. Nature
464: 993 – 998
Kamburov A, Stelzl U, Lehrach H, Herwig R (2013) The ConsensusPathDB
interaction database: 2013 update. Nucleic Acids Res 41: D793 –D800
Kamburov A, Lawrence MS, Polak P, Leshchiner I, Lage K, Golub TR, Lander
ES, Getz G (2015) Comprehensive assessment of cancer missense
mutation clustering in protein structures. Proc Natl Acad Sci USA 112:
E5486 – E5495
Kan Z, Jaiswal BS, Stinson J, Janakiraman V, Bhatt D, Stern HM, Yue P,
Haverty PM, Bourgon R, Zheng J, Moorhead M, Chaudhuri S, Tomsho LP,
Peters BA, Pujara K, Cordes S, Davis DP, Carlton VE, Yuan W, Li L et al
(2010) Diverse somatic mutation patterns and pathway alterations in
human cancers. Nature 466: 869 – 873
Kandoth C, McLellan MD, Vandin F, Ye K, Niu B, Lu C, Xie M, Zhang Q,
McMichael JF, Wyczalkowski MA, Leiserson MD, Miller CA, Welch JS,
Walter MJ, Wendl MC, Ley TJ, Wilson RK, Raphael BJ, Ding L (2013)
Mutational landscape and significance across 12 major cancer types.
Nature 502: 333 – 339
Kanehisa M, Sato Y, Kawashima M, Furumichi M, Tanabe M (2016) KEGG as a
reference resource for gene and protein annotation. Nucleic Acids Res 44:
D457 –D462
Kent WJ, Sugnet CW, Furey TS, Roskin KM, Pringle TH, Zahler AM, Haussler D
(2002) The human genome browser at UCSC. Genome Res 12: 996 – 1006
Kinsella RJ, Kahari A, Haider S, Zamora J, Proctor G, Spudich G, Almeida-King
J, Staines D, Derwent P, Kerhornou A, Kersey P, Flicek P (2011) Ensembl
BioMarts: a hub for data retrieval across taxonomic space. Database
(Oxford) 2011: bar030
Krissinel E, Henrick K (2007) Inference of macromolecular assemblies from
crystalline state. J Mol Biol 372: 774 – 797
Latysheva NS, Oates ME, Maddox L, Flock T, Gough J, Buljan M, Weatheritt RJ,
Babu MM (2016) Molecular principles of gene fusion mediated rewiring of
protein interaction networks in cancer. Mol Cell 63: 579 – 592
Laufer C, Fischer B, Billmann M, Huber W, Boutros M (2013) Mapping genetic
interactions in human cancer cells with RNAi and multiparametric
phenotyping. Nat Methods 10: 427 – 431
Lawrence MS, Stojanov P, Polak P, Kryukov GV, Cibulskis K, Sivachenko A,
Carter SL, Stewart C, Mermel CH, Roberts SA, Kiezun A, Hammerman PS,
McKenna A, Drier Y, Zou L, Ramos AH, Pugh TJ, Stransky N, Helman E, Kim
J et al (2013) Mutational heterogeneity in cancer and the search for new
cancer-associated genes. Nature 499: 214 – 218
Lawrence MS, Stojanov P, Mermel CH, Robinson JT, Garraway LA, Golub TR,
Meyerson M, Gabriel SB, Lander ES, Getz G (2014) Discovery and saturation
analysis of cancer genes across 21 tumour types. Nature 505: 495 – 501
Leeb M, Dietmann S, Paramor M, Niwa H, Smith A (2014) Genetic exploration
of the exit from self-renewal using haploid embryonic stem cells. Cell
Stem Cell 14: 385 – 393
Leiserson MD, Vandin F, Wu HT, Dobson JR, Eldridge JV, Thomas JL, Papoutsaki
A, Kim Y, Niu B, McLellan M, Lawrence MS, Gonzalez-Perez A, Tamborero D,
Cheng Y, Ryslik GA, Lopez-Bigas N, Getz G, Ding L, Raphael BJ (2015) Pan-
cancer network analysis identifies combinations of rare somatic mutations
across pathways and protein complexes. Nat Genet 47: 106 – 114
Lek M, Karczewski KJ, Minikel EV, Samocha KE, Banks E, Fennell T, O’Donnell-
Luria AH, Ware JS, Hill AJ, Cummings BB, Tukiainen T, Birnbaum DP,
Kosmicki JA, Duncan LE, Estrada K, Zhao F, Zou J, Pierce-Hoffman E,
Berghout J, Cooper DN et al (2016) Analysis of protein-coding genetic
variation in 60,706 humans. Nature 536: 285 – 291
Levy ED (2010) A simple definition of structural regions in proteins and its
use in analyzing interface evolution. J Mol Biol 403: 660 – 670
18 of 19 Molecular Systems Biology 14: e7974 | 2018 ª 2018 The Authors
Molecular Systems Biology Features of mutation hotspot residues Marija Buljan et al
Published online: March 23, 2018
Lundby A, Rossin EJ, Steffensen AB, Acha MR, Newton-Cheh C, Pfeufer A,
Lynch SN, Consortium QTIIG, Olesen SP, Brunak S, Ellinor PT, Jukema JW,
Trompet S, Ford I, Macfarlane PW, Krijthe BP, Hofman A, Uitterlinden AG,
Stricker BH, Nathoe HM et al (2014) Annotation of loci from genome-wide
association studies using tissue-specific quantitative interaction
proteomics. Nat Methods 11: 868 – 874
Marx V (2014) Cancer genomes: discerning drivers from passengers. Nat
Methods 11: 375 – 379
Menche J, Sharma A, Kitsak M, Ghiassian SD, Vidal M, Loscalzo J, Barabasi AL
(2015) Disease networks. Uncovering disease-disease relationships through
the incomplete interactome. Science 347: 1257601
Miller ML, Reznik E, Gauthier NP, Aksoy BA, Korkut A, Gao J, Ciriello G, Schultz
N, Sander C (2015) Pan-cancer analysis of mutation hotspots in protein
domains. Cell Syst 1: 197 – 209
Miyaki M, Kuroki T (2003) Role of Smad4 (DPC4) inactivation in human
cancer. Biochem Biophys Res Commun 306: 799 – 804
Mosca R, Ceol A, Aloy P (2013) Interactome3D: adding structural details to
protein networks. Nat Methods 10: 47 – 53
Nakayama KI, Nakayama K (2006) Ubiquitin ligases: cell-cycle control and
cancer. Nat Rev Cancer 6: 369 – 381
Papa A, Wan L, Bonora M, Salmena L, Song MS, Hobbs RM, Lunardi A,
Webster K, Ng C, Newton RH, Knoblauch N, Guarnerio J, Ito K, Turka LA,
Beck AH, Pinton P, Bronson RT, Wei W, Pandolfi PP (2014) Cancer-
associated PTEN mutants act in a dominant-negative manner to suppress
PTEN protein function. Cell 157: 595 – 610
Porta-Pardo E, Garcia-Alonso L, Hrabe T, Dopazo J, Godzik A (2015) A pan-
cancer catalogue of cancer driver protein interaction interfaces. PLoS
Comput Biol 11: e1004518
Porta-Pardo E, Kamburov A, Tamborero D, Pons T, Grases D, Valencia A,
Lopez-Bigas N, Getz G, Godzik A (2017) Comparison of algorithms for the
detection of cancer drivers at subgene resolution. Nat Methods 14:
782 – 788
Reimand J, Bader GD (2013) Systematic analysis of somatic mutations in
phosphorylation signaling predicts novel cancer drivers. Mol Syst Biol 9: 637
Ruepp A, Waegele B, Lechner M, Brauner B, Dunger-Kaltenbach I, Fobo G,
Frishman G, Montrone C, Mewes HW (2010) CORUM: the comprehensive
resource of mammalian protein complexes–2009. Nucleic Acids Res 38:
D497 –D501
Sanchez-Garcia F, Villagrasa P, Matsui J, Kotliar D, Castro V, Akavia UD, Chen
BJ, Saucedo-Cuevas L, Rodriguez Barrueco R, Llobet-Navas D, Silva JM,
Pe’er D (2014) Integration of genomic data enables selective discovery of
breast cancer drivers. Cell 159: 1461 – 1475
Sherry ST, Ward MH, Kholodov M, Baker J, Phan L, Smigielski EM, Sirotkin K
(2001) dbSNP: the NCBI database of genetic variation. Nucleic Acids Res
29: 308 – 311
Supek F, Minana B, Valcarcel J, Gabaldon T, Lehner B (2014) Synonymous
mutations frequently act as driver mutations in human cancers. Cell 156:
1324 – 1335
Suzuki R, Shimodaira H (2006) Pvclust: an R package for assessing the
uncertainty in hierarchical clustering. Bioinformatics 22: 1540 – 1542
Taketo MM, Takaku K (2000) Gastrointestinal tumorigenesis in Smad4 (Dpc4)
mutant mice. Hum Cell 13: 85 – 95
Tamborero D, Gonzalez-Perez A, Lopez-Bigas N (2013) OncodriveCLUST:
exploiting the positional clustering of somatic mutations to identify
cancer genes. Bioinformatics 29: 2238 – 2244
The UniProt C (2017) UniProt: the universal protein knowledgebase. Nucleic
Acids Res 45: D158 –D169
Tokheim C, Bhattacharya R, Niknafs N, Gygax DM, Kim R, Ryan M,
Masica DL, Karchin R (2016) Exome-scale discovery of hotspot mutation
regions in human cancer using 3D protein structure. Cancer Res 76:
3719 – 3731
Vogelstein B, Papadopoulos N, Velculescu VE, Zhou S, Diaz LA Jr, Kinzler KW
(2013) Cancer genome landscapes. Science 339: 1546 – 1558
de Vries A, Flores ER, Miranda B, Hsieh HM, van Oostrom CT, Sage J, Jacks
T (2002) Targeted point mutations of p53 lead to dominant-negative
inhibition of wild-type p53 function. Proc Natl Acad Sci USA 99:
2948 – 2953
Wagener R, Aukema SM, Schlesner M, Haake A, Burkhardt B, Claviez A,
Drexler HG, Hummel M, Kreuz M, Loeffler M, Rosolowski M, Lopez C,
Moller P, Richter J, Rohde M, Betts MJ, Russell RB, Bernhart SH, Hoffmann
S, Rosenstiel P et al (2015) The PCBP1 gene encoding poly(rC) binding
protein I is recurrently mutated in Burkitt lymphoma. Genes Chromosom
Cancer 54: 555 – 564
Wang H, Vardy LA, Tan CP, Loo JM, Guo K, Li J, Lim SG, Zhou J, Chng WJ, Ng
SB, Li HX, Zeng Q (2010) PCBP1 suppresses the translation of metastasis-
associated PRL-3 phosphatase. Cancer Cell 18: 52 – 62
Wang X, Wei X, Thijssen B, Das J, Lipkin SM, Yu H (2012) Three-dimensional
reconstruction of protein networks provides insight into human genetic
disease. Nat Biotechnol 30: 159 – 164
Welcker M, Clurman BE (2008) FBW7 ubiquitin ligase: a tumour suppressor
at the crossroads of cell division, growth and differentiation. Nat Rev
Cancer 8: 83 – 93
Yang F, Petsalaki E, Rolland T, Hill DE, Vidal M, Roth FP (2015) Protein
domain-level landscape of cancer-type-specific somatic mutations. PLoS
Comput Biol 11: e1004147
Yates A, Akanni W, Amode MR, Barrell D, Billis K, Carvalho-Silva D,
Cummins C, Clapham P, Fitzgerald S, Gil L, Giron CG, Gordon L,
Hourlier T, Hunt SE, Janacek SH, Johnson N, Juettemann T, Keenan S,
Lavidas I, Martin FJ et al (2016) Ensembl 2016. Nucleic Acids Res 44:
D710 –D716
Yoda A, Adelmant G, Tamburini J, Chapuy B, Shindoh N, Yoda Y, Weigert O,
Kopp N, Wu SC, Kim SS, Liu H, Tivey T, Christie AL, Elpek KG, Card J,
Gritsman K, Gotlib J, Deininger MW, Makishima H, Turley SJ et al (2015)
Mutations in G protein beta subunits promote transformation and kinase
inhibitor resistance. Nat Med 21: 71 – 75
Zhou M, Tong X (2015) Downregulated Poly-C binding protein-1 is a novel
predictor associated with poor prognosis in Acute Myeloid Leukemia.
Diagn Pathol 10: 147
License: This is an open access article under the
terms of the Creative Commons Attribution 4.0
License, which permits use, distribution and reproduc-
tion in any medium, provided the original work is
properly cited.
ª 2018 The Authors Molecular Systems Biology 14: e7974 | 2018 19 of 19
Marija Buljan et al Features of mutation hotspot residues Molecular Systems Biology
Published online: March 23, 2018