systematic dissection and optimization of inducible...
TRANSCRIPT
©20
12 N
atu
re A
mer
ica,
Inc.
All
rig
hts
res
erve
d.
nature biotechnology advance online publication �
A rt i c l e s
Genetic analysis and engineering would greatly benefit from an improved understanding of how transcriptional regulatory elements are encoded in DNA. Evolutionary analysis and chromatin-state map-ping have revealed myriad regulatory elements across the human genome1,2, but we are largely unable to explain why an element is active in a specific cell type or to predict the effect of a specific muta-tion. Moreover, although synthetic regulatory elements can provide powerful tools for genetics, high-throughput screening and gene therapy3–5, our ability to engineer such elements is limited, particularly in mammalian systems, where directed evolution is generally imprac-tical and traditional functional assays6 suffer from low throughput.
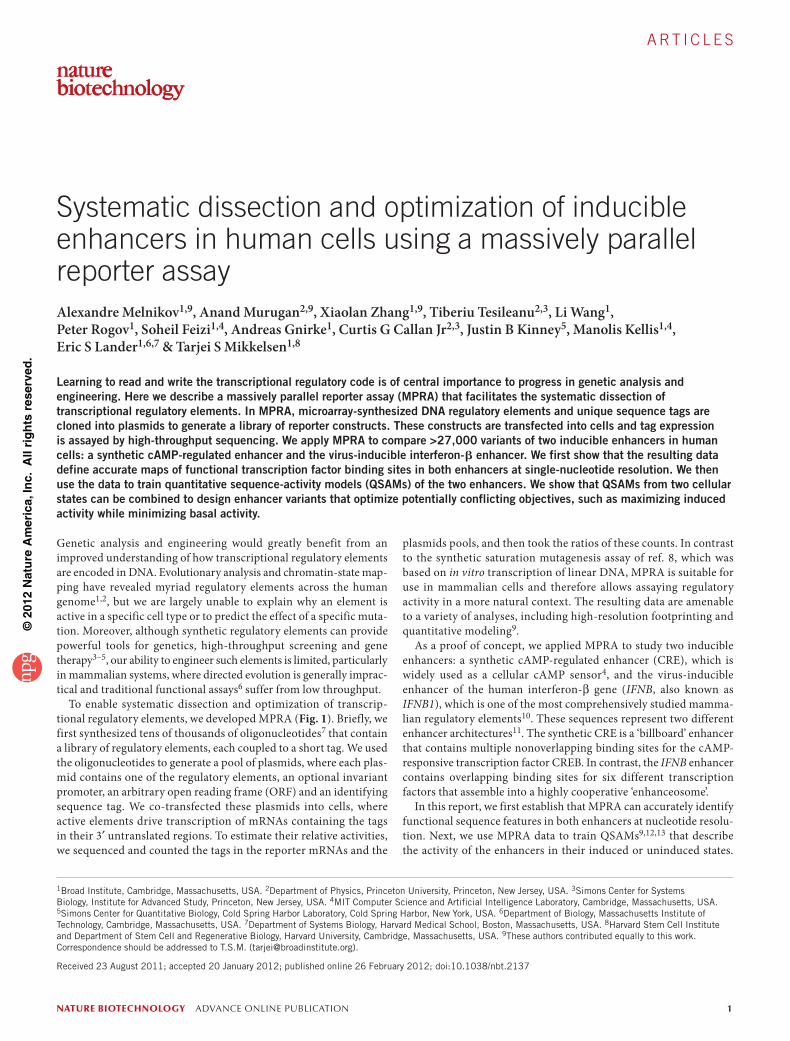
To enable systematic dissection and optimization of transcrip-tional regulatory elements, we developed MPRA (Fig. 1). Briefly, we first synthesized tens of thousands of oligonucleotides7 that contain a library of regulatory elements, each coupled to a short tag. We used the oligonucleotides to generate a pool of plasmids, where each plas-mid contains one of the regulatory elements, an optional invariant promoter, an arbitrary open reading frame (ORF) and an identifying sequence tag. We co-transfected these plasmids into cells, where active elements drive transcription of mRNAs containing the tags in their 3′ untranslated regions. To estimate their relative activities, we sequenced and counted the tags in the reporter mRNAs and the
plasmids pools, and then took the ratios of these counts. In contrast to the synthetic saturation mutagenesis assay of ref. 8, which was based on in vitro transcription of linear DNA, MPRA is suitable for use in mammalian cells and therefore allows assaying regulatory activity in a more natural context. The resulting data are amenable to a variety of analyses, including high-resolution footprinting and quantitative modeling9.
As a proof of concept, we applied MPRA to study two inducible enhancers: a synthetic cAMP-regulated enhancer (CRE), which is widely used as a cellular cAMP sensor4, and the virus-inducible enhancer of the human interferon-β gene (IFNB, also known as IFNB1), which is one of the most comprehensively studied mamma-lian regulatory elements10. These sequences represent two different enhancer architectures11. The synthetic CRE is a ‘billboard’ enhancer that contains multiple nonoverlapping binding sites for the cAMP-responsive transcription factor CREB. In contrast, the IFNB enhancer contains overlapping binding sites for six different transcription factors that assemble into a highly cooperative ‘enhanceosome’.
In this report, we first establish that MPRA can accurately identify functional sequence features in both enhancers at nucleotide resolu-tion. Next, we use MPRA data to train QSAMs9,12,13 that describe the activity of the enhancers in their induced or uninduced states.
systematic dissection and optimization of inducible enhancers in human cells using a massively parallel reporter assayAlexandre Melnikov1,9, Anand Murugan2,9, Xiaolan Zhang1,9, Tiberiu Tesileanu2,3, Li Wang1, Peter Rogov1, Soheil Feizi1,4, Andreas Gnirke1, Curtis G Callan Jr2,3, Justin B Kinney5, Manolis Kellis1,4, Eric S Lander1,6,7 & Tarjei S Mikkelsen1,8
Learning to read and write the transcriptional regulatory code is of central importance to progress in genetic analysis and engineering. Here we describe a massively parallel reporter assay (MPRA) that facilitates the systematic dissection of transcriptional regulatory elements. In MPRA, microarray-synthesized DNA regulatory elements and unique sequence tags are cloned into plasmids to generate a library of reporter constructs. These constructs are transfected into cells and tag expression is assayed by high-throughput sequencing. We apply MPRA to compare >27,000 variants of two inducible enhancers in human cells: a synthetic cAMP-regulated enhancer and the virus-inducible interferon-b enhancer. We first show that the resulting data define accurate maps of functional transcription factor binding sites in both enhancers at single-nucleotide resolution. We then use the data to train quantitative sequence-activity models (QSAMs) of the two enhancers. We show that QSAMs from two cellular states can be combined to design enhancer variants that optimize potentially conflicting objectives, such as maximizing induced activity while minimizing basal activity.
1Broad Institute, Cambridge, Massachusetts, USA. 2Department of Physics, Princeton University, Princeton, New Jersey, USA. 3Simons Center for Systems Biology, Institute for Advanced Study, Princeton, New Jersey, USA. 4MIT Computer Science and Artificial Intelligence Laboratory, Cambridge, Massachusetts, USA. 5Simons Center for Quantitative Biology, Cold Spring Harbor Laboratory, Cold Spring Harbor, New York, USA. 6Department of Biology, Massachusetts Institute of Technology, Cambridge, Massachusetts, USA. 7Department of Systems Biology, Harvard Medical School, Boston, Massachusetts, USA. 8Harvard Stem Cell Institute and Department of Stem Cell and Regenerative Biology, Harvard University, Cambridge, Massachusetts, USA. 9These authors contributed equally to this work. Correspondence should be addressed to T.S.M. ([email protected]).
Received 23 August 2011; accepted 20 January 2012; published online 26 February 2012; doi:10.1038/nbt.2137
©20
12 N
atu
re A
mer
ica,
Inc.
All
rig
hts
res
erve
d.
� advance online publication nature biotechnology
A rt i c l e s
Finally, we demonstrate that these QSAMs can be combined to iden-tify mutations that increase enhancer inducibility (the ratio of induced versus uninduced activity).
RESULTSExperimental design and mutagenesis strategiesWe synthesized 142-mer oligonucleotide pools containing 87-nt CRE and IFNB enhancer variants, as well as 10-nt tags and various invari-ant sequences required for cloning (Supplementary Fig. 1).
We tested two different mutagenesis strategies. The first was ‘single-hit scanning’8 where we assayed ~1,000 specific enhancer variants, including all possible single substitutions, multiple series of consecu-tive substitutions and small insertions at all positions (Supplementary Table 1). Each scanning variant was linked to 13 tags for a total of 13,000 distinct enhancer-tag combinations. This redundancy provides parallel measurements for each variant, which can be used to both quantify and reduce the impact of experimental noise, including tag-dependent bias (Supplementary Fig. 2). The second was ‘multi-hit sampling’9 where we assayed ~27,000 distinct enhancer variants (Supplementary Table 2), each linked to a single tag. These variants were constructed by introducing random nucleotide substitutions into the enhancers at a rate of 10% per position. Because the variants were designed in silico and then synthesized, they provided a uniform muta-tional spectrum. This strategy is advantageous because each substitu-tion is assayed in a larger fraction of the variants and the use of multiple substitutions enables detection of interactions; one disadvantage is that the measurements for individual variants are less accurate.
We cloned oligonucleotide pools synthesized according to both strategies into identical plasmid backbones, inserted a minimal TATA-box promoter and a luciferase gene between the variants and tags, and transfected the resulting plasmid pools into human embryonic kidney (HEK293T) cells. To induce the CRE or IFNB enhancer, we treated the transfected cells with forskolin or infected them with Sendai virus, respectively. To estimate the relative activities of the enhancer variants, we sequenced 20–120 million PCR-amplified mRNA and plasmid tags from each transfection.
Assay validationWe validated the resulting data using several different approaches (Supplementary Fig. 3). First, we examined the distributions of plas-mid tag counts. We found that the vast majority (≥99.6%) of the tags we designed were indeed present in each pool, and that their relative concentrations were similar (coefficient of variation, 0.45–1.0). This confirms we successfully generated high-complexity plasmid pools.
Second, we synthesized and transfected each of the two CRE plas-mid pools twice. We found that the ~13,000 and ~27,000 pairs of mRNA-plasmid tag ratios obtained from the single- and multi-hit pools, respectively, were highly correlated (Pearson r2 = 0.61 and 0.67, least significant P < 10−100). The medians of the 13 tag ratios from
each distinct variant in the replicate single-hit pools were even more similar (r2 = 0.89, P < 10−100). This indicates that MPRA is robust, and that the noise level can be controlled by adjusting the number of distinct tags linked to each distinct variant.
Finally, we subcloned 24 plasmids from each of two CRE pools and individually measured their luciferase expression levels after forsko-lin treatment. We found a linear relationship between the MPRA- and luciferase-based activities for both pools (r2 = 0.45 and 0.75, P < 0.0002). This indicates that MPRA is directly comparable to traditional reporter assays.
Single-hit scanningWe began our analysis by attempting to dissect the two induced enhancers using the scanning mutagenesis data. We estimated the relative activity of each variant by comparing the median of its 13 mRNA/plasmid tag ratios to the median ratio for tags linked to the corresponding wild-type enhancer8.
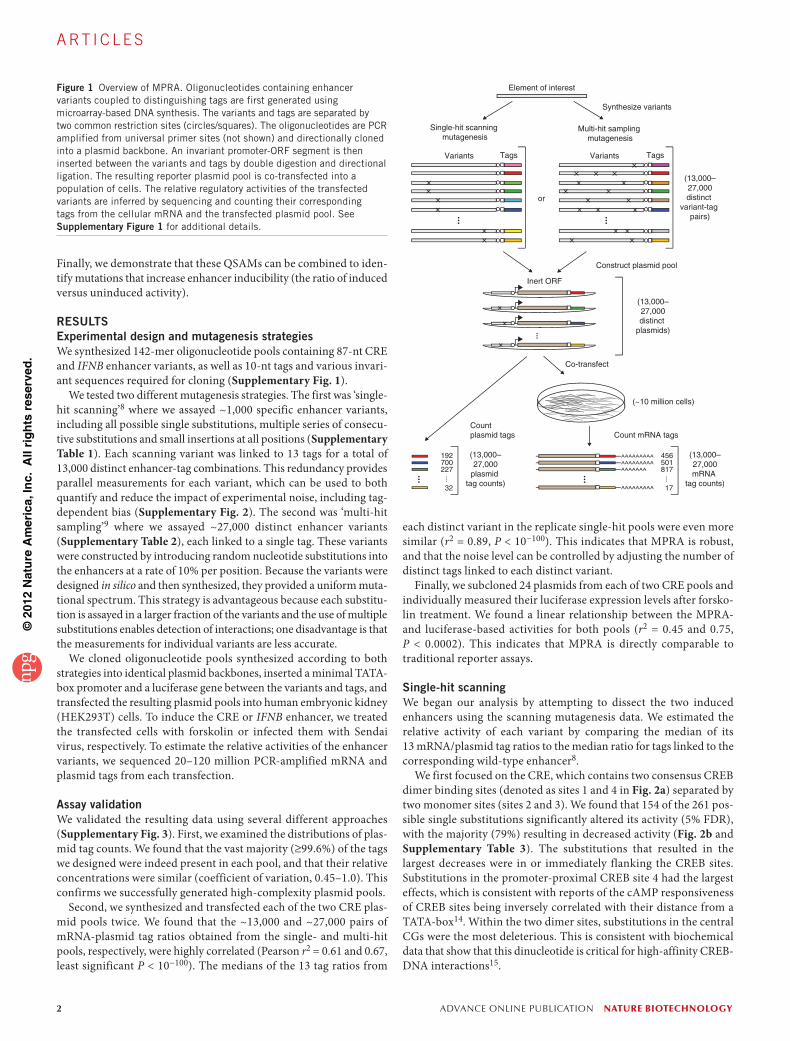
We first focused on the CRE, which contains two consensus CREB dimer binding sites (denoted as sites 1 and 4 in Fig. 2a) separated by two monomer sites (sites 2 and 3). We found that 154 of the 261 pos-sible single substitutions significantly altered its activity (5% FDR), with the majority (79%) resulting in decreased activity (Fig. 2b and Supplementary Table 3). The substitutions that resulted in the largest decreases were in or immediately flanking the CREB sites. Substitutions in the promoter-proximal CREB site 4 had the largest effects, which is consistent with reports of the cAMP responsiveness of CREB sites being inversely correlated with their distance from a TATA-box14. Within the two dimer sites, substitutions in the central CGs were the most deleterious. This is consistent with biochemical data that show that this dinucleotide is critical for high-affinity CREB-DNA interactions15.
AAAAAAAAA
AAAAAAAAA
AAAAAAA
AAAAAAAAA
Variants
Element of interest
Inert ORF
Tags
Co-transfect
Count mRNA tags
Construct plasmid pool
or
Synthesize variants
Single-hit scanning mutagenesis
Multi-hit sampling mutagenesis
Variants Tags
(13,000–27,000distinct
plasmids)
(13,000–27,000distinct
variant-tag pairs)
(13,000– 27,000 mRNA
tag counts)
(~10 million cells)
456
817
17
501(13,000– 27,000 plasmid
tag counts)
192
227
32
700
Count plasmid tags
Figure 1 Overview of MPRA. Oligonucleotides containing enhancer variants coupled to distinguishing tags are first generated using microarray-based DNA synthesis. The variants and tags are separated by two common restriction sites (circles/squares). The oligonucleotides are PCR amplified from universal primer sites (not shown) and directionally cloned into a plasmid backbone. An invariant promoter-ORF segment is then inserted between the variants and tags by double digestion and directional ligation. The resulting reporter plasmid pool is co-transfected into a population of cells. The relative regulatory activities of the transfected variants are inferred by sequencing and counting their corresponding tags from the cellular mRNA and the transfected plasmid pool. See Supplementary Figure 1 for additional details.
©20
12 N
atu
re A
mer
ica,
Inc.
All
rig
hts
res
erve
d.
nature biotechnology advance online publication �
A rt i c l e s
Substitutions at 47 of 61 positions outside of the CREB sites also caused significant (5% FDR), although generally more subtle, changes in activity. This may reflect the effects of cryptic non-CREB binding sites. In particular, two substitutions upstream of CREB site 1, as well as almost every substitu-tion in a C-rich motif flanking CREB site 4, resulted in increased CRE activity. These substitutions may therefore cause either increased recruitment of activating factors or decreased recruitment of repressors.
Scanning the CRE with blocks of eight consecutive substitutions caused changes that were consistent with the single substitu-tions, but often more deleterious (Fig. 2c and Supplementary Fig. 4). Notably, although most single substitutions in CREB site 1 had no detectable effects, the functional relevance of this site was clearly supported by the com-bined effect of multiple substitutions.
Insertions of both 5 and 10 nt were well-tolerated at multiple posi-tions between CREB sites 1 and 2 and between sites 3 and 4 (Fig. 2d and Supplementary Fig. 5). This implies that the CRE activity is not dependent on specific spacing or phasing between these sites. In contrast, insertions between sites 2 and 3 resulted in decreased activity, despite single substi-tutions having small effects in the same region. This may reflect a direct interaction between proteins at these two sites, which was also suggested by a study of these sites in their natural context16.
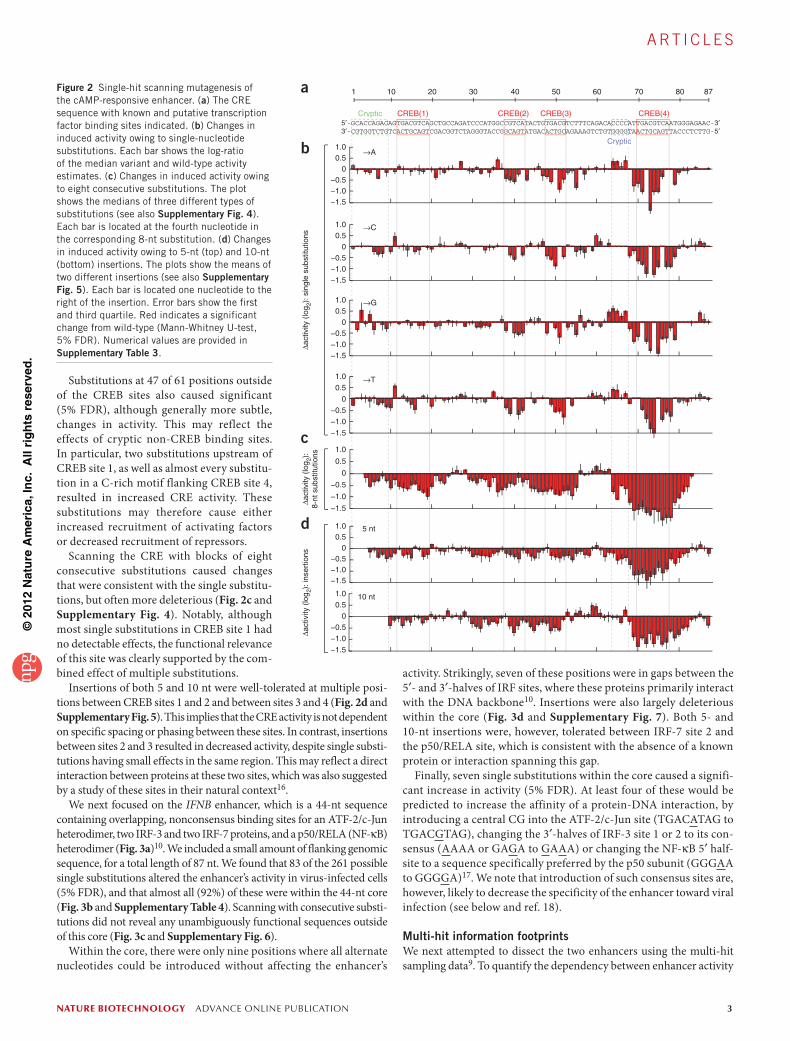
We next focused on the IFNB enhancer, which is a 44-nt sequence containing overlapping, nonconsensus binding sites for an ATF-2/c-Jun heterodimer, two IRF-3 and two IRF-7 proteins, and a p50/RELA (NF-κB) heterodimer (Fig. 3a)10. We included a small amount of flanking genomic sequence, for a total length of 87 nt. We found that 83 of the 261 possible single substitutions altered the enhancer’s activity in virus-infected cells (5% FDR), and that almost all (92%) of these were within the 44-nt core (Fig. 3b and Supplementary Table 4). Scanning with consecutive substi-tutions did not reveal any unambiguously functional sequences outside of this core (Fig. 3c and Supplementary Fig. 6).
Within the core, there were only nine positions where all alternate nucleotides could be introduced without affecting the enhancer’s
activity. Strikingly, seven of these positions were in gaps between the 5′- and 3′-halves of IRF sites, where these proteins primarily interact with the DNA backbone10. Insertions were also largely deleterious within the core (Fig. 3d and Supplementary Fig. 7). Both 5- and 10-nt insertions were, however, tolerated between IRF-7 site 2 and the p50/RELA site, which is consistent with the absence of a known protein or interaction spanning this gap.
Finally, seven single substitutions within the core caused a signifi-cant increase in activity (5% FDR). At least four of these would be predicted to increase the affinity of a protein-DNA interaction, by introducing a central CG into the ATF-2/c-Jun site (TGACATAG to TGACGTAG), changing the 3′-halves of IRF-3 site 1 or 2 to its con-sensus (AAAA or GAGA to GAAA) or changing the NF-κB 5′ half-site to a sequence specifically preferred by the p50 subunit (GGGAA to GGGGA)17. We note that introduction of such consensus sites are, however, likely to decrease the specificity of the enhancer toward viral infection (see below and ref. 18).
Multi-hit information footprintsWe next attempted to dissect the two enhancers using the multi-hit sampling data9. To quantify the dependency between enhancer activity
5′-GCACCAGACAGTGACGTCAGCTGCCAGATCCCATGGCCGTCATACTGTGACGTCTTTCAGACACCCCATTGACGTCAATGGGAGAAC-3′3′-CGTGGTCTGTCACTGCAGTCGACGGTCTAGGGTACCGGCAGTATGACACTGCAGAAAGTCTGTGGGGTAACTGCAGTTACCCTCTTG-5′
TGACGTCAGACTGCAGT
GCACCAGACCGTGGTCTG
TGACGTCAAACTGCAGTTG TG T
AC AAC AGTGACGACTGCA
CGTCATGCAGTA
CREB(1) CREB(2) CREB(3) CREB(4)
Cryptic
−1.5−1.0−0.5
00.51.0
−1.5−1.0−0.5
00.51.0
1 8710 20 30 40 50 60 70 80
−1.5−1.0−0.5
00.51.0
−1.5
−1.0
−0.5
0
0.5
1.0
−1.5
−1.0
−0.5
0
0.5
1.0
−1.5−1.0−0.5
00.51.0
−1.5−1.0−0.5
00.51.0
→A
→C
→G
5 nt
10 nt
→T
∆act
ivity
(lo
g 2): s
ingl
e su
bstit
utio
ns∆a
ctiv
ity (
log 2)
:8-
nt s
ubst
itutio
ns∆a
ctiv
ity (
log 2)
: ins
ertio
ns
a
b
c
d
Cryptic
Figure 2 Single-hit scanning mutagenesis of the cAMP-responsive enhancer. (a) The CRE sequence with known and putative transcription factor binding sites indicated. (b) Changes in induced activity owing to single-nucleotide substitutions. Each bar shows the log-ratio of the median variant and wild-type activity estimates. (c) Changes in induced activity owing to eight consecutive substitutions. The plot shows the medians of three different types of substitutions (see also Supplementary Fig. 4). Each bar is located at the fourth nucleotide in the corresponding 8-nt substitution. (d) Changes in induced activity owing to 5-nt (top) and 10-nt (bottom) insertions. The plots show the means of two different insertions (see also Supplementary Fig. 5). Each bar is located one nucleotide to the right of the insertion. Error bars show the first and third quartile. Red indicates a significant change from wild-type (Mann-Whitney U-test, 5% FDR). Numerical values are provided in Supplementary Table 3.
©20
12 N
atu
re A
mer
ica,
Inc.
All
rig
hts
res
erve
d.
� advance online publication nature biotechnology
A rt i c l e s
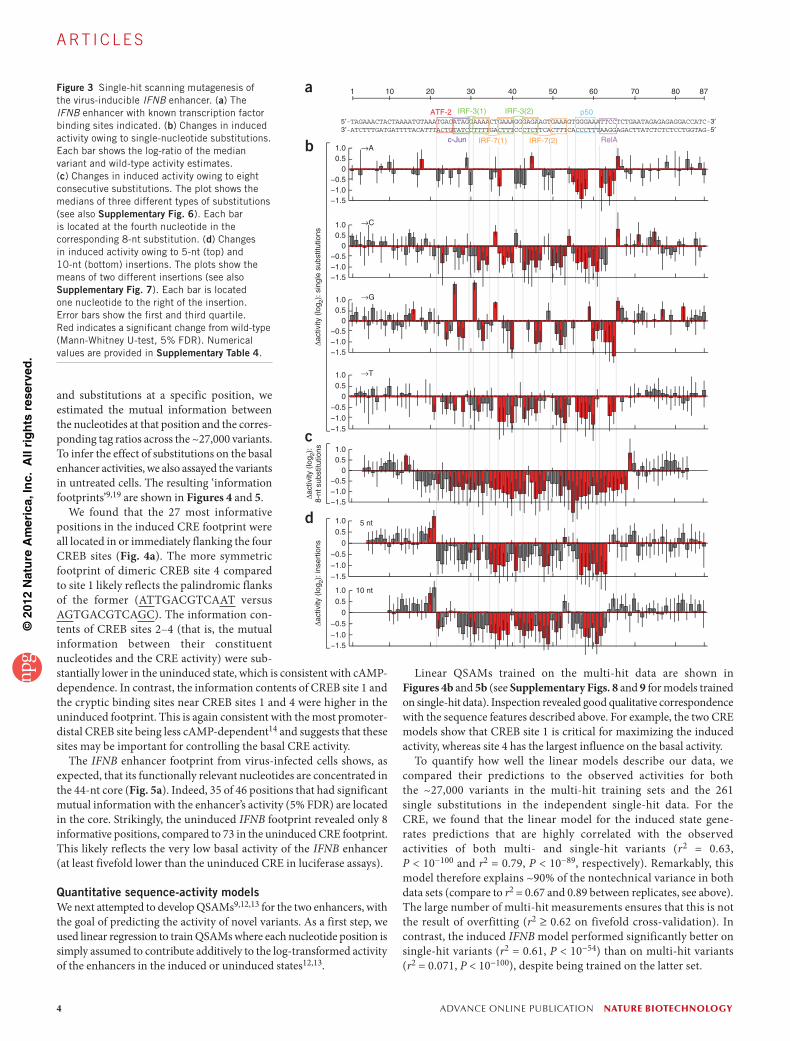
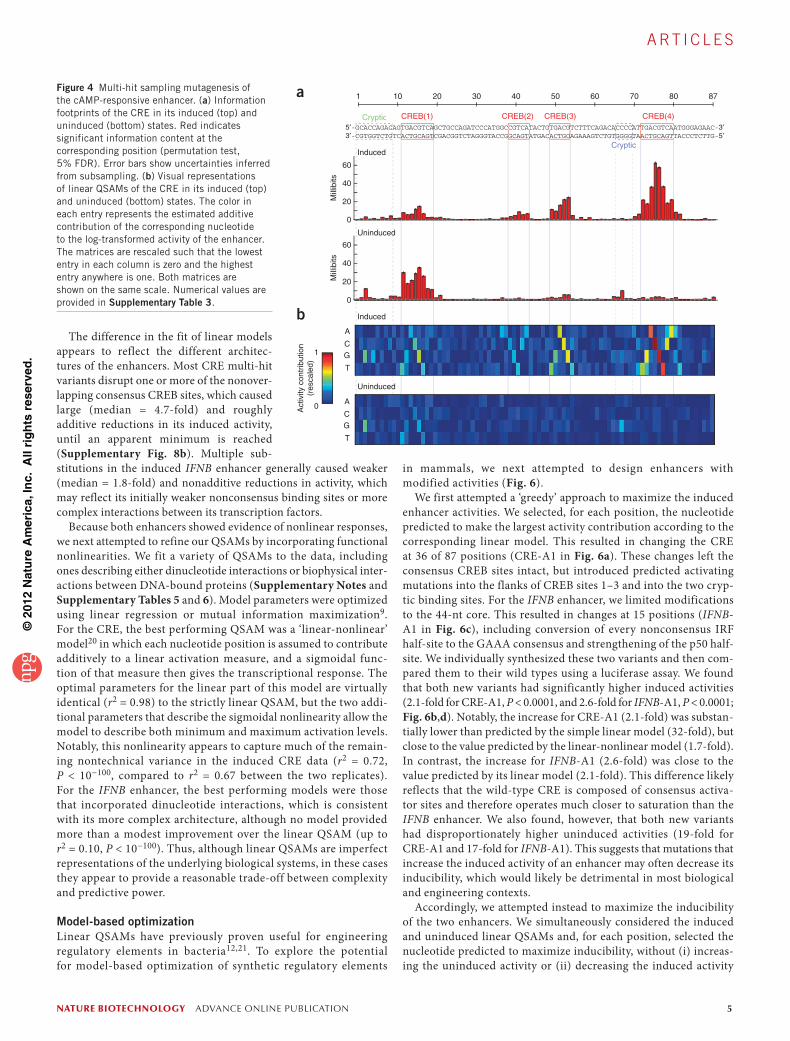
and substitutions at a specific position, we estimated the mutual information between the nucleotides at that position and the corres-ponding tag ratios across the ~27,000 variants. To infer the effect of substitutions on the basal enhancer activities, we also assayed the variants in untreated cells. The resulting ‘information footprints’9,19 are shown in Figures 4 and 5.
We found that the 27 most informative positions in the induced CRE footprint were all located in or immediately flanking the four CREB sites (Fig. 4a). The more symmetric footprint of dimeric CREB site 4 compared to site 1 likely reflects the palindromic flanks of the former (ATTGACGTCAAT versus AGTGACGTCAGC). The information con-tents of CREB sites 2–4 (that is, the mutual information between their constituent nucleotides and the CRE activity) were sub-stantially lower in the uninduced state, which is consistent with cAMP- dependence. In contrast, the information contents of CREB site 1 and the cryptic binding sites near CREB sites 1 and 4 were higher in the uninduced footprint. This is again consistent with the most promoter-distal CREB site being less cAMP-dependent14 and suggests that these sites may be important for controlling the basal CRE activity.
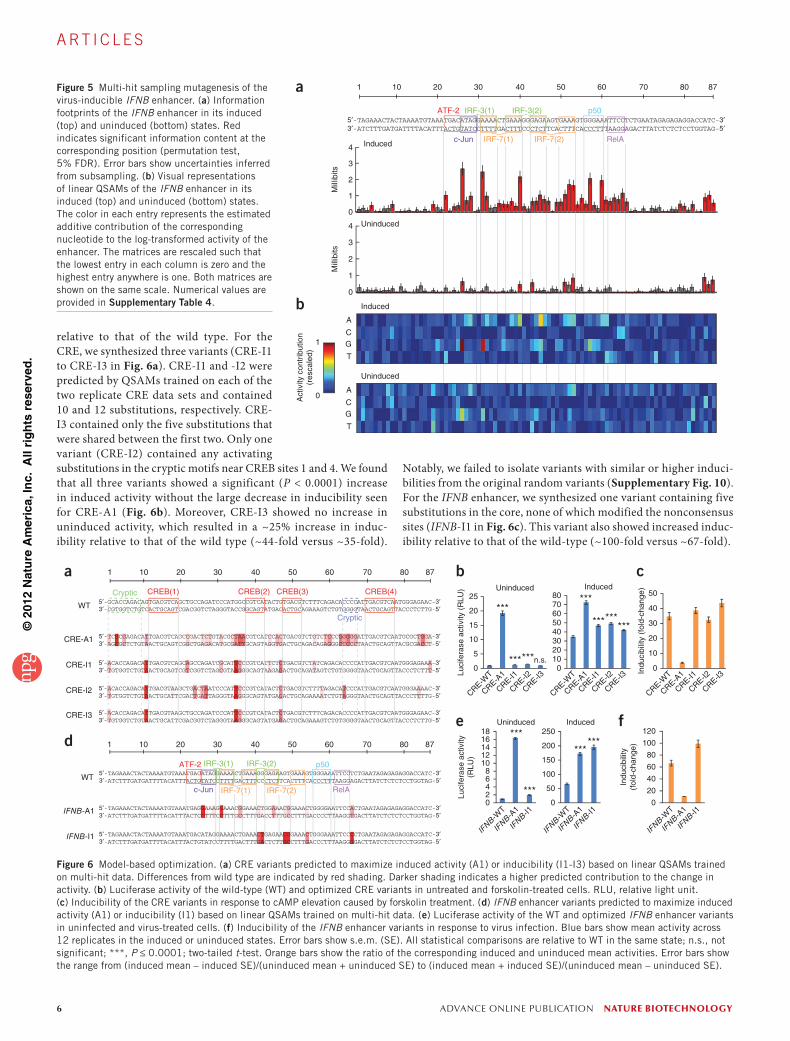
The IFNB enhancer footprint from virus-infected cells shows, as expected, that its functionally relevant nucleotides are concentrated in the 44-nt core (Fig. 5a). Indeed, 35 of 46 positions that had significant mutual information with the enhancer’s activity (5% FDR) are located in the core. Strikingly, the uninduced IFNB footprint revealed only 8 informative positions, compared to 73 in the uninduced CRE footprint. This likely reflects the very low basal activity of the IFNB enhancer (at least fivefold lower than the uninduced CRE in luciferase assays).
Quantitative sequence-activity modelsWe next attempted to develop QSAMs9,12,13 for the two enhancers, with the goal of predicting the activity of novel variants. As a first step, we used linear regression to train QSAMs where each nucleotide position is simply assumed to contribute additively to the log-transformed activity of the enhancers in the induced or uninduced states12,13.
Linear QSAMs trained on the multi-hit data are shown in Figures 4b and 5b (see Supplementary Figs. 8 and 9 for models trained on single-hit data). Inspection revealed good qualitative correspondence with the sequence features described above. For example, the two CRE models show that CREB site 1 is critical for maximizing the induced activity, whereas site 4 has the largest influence on the basal activity.
To quantify how well the linear models describe our data, we compared their predictions to the observed activities for both the ~27,000 variants in the multi-hit training sets and the 261 single substitutions in the independent single-hit data. For the CRE, we found that the linear model for the induced state gene-rates predictions that are highly correlated with the observed activities of both multi- and single-hit variants (r2 = 0.63, P < 10−100 and r2 = 0.79, P < 10−89, respectively). Remarkably, this model therefore explains ~90% of the nontechnical variance in both data sets (compare to r2 = 0.67 and 0.89 between replicates, see above). The large number of multi-hit measurements ensures that this is not the result of overfitting (r2 ≥ 0.62 on fivefold cross-validation). In contrast, the induced IFNB model performed significantly better on single-hit variants (r2 = 0.61, P < 10−54) than on multi-hit variants (r2 = 0.071, P < 10−100), despite being trained on the latter set.
5′-TAGAAACTACTAAAATGTAAATGACATAGGAAAACTGAAAGGGAGAAGTGAAAGTGGGAAATTCCTCTGAATAGAGAGAGGACCATC-3′3′-ATCTTTGATGATTTTACATTTACTGTATCCTTTTGACTTTCCCTCTTCACTTTCACCCTTTAAGGAGACTTATCTCTCTCCTGGTAG-5′
TGACAACTG
ATAGGTATCAT
GAAACTTT
TGAAAACTTT
GGAGACCTCTGAGACTCTGGAGACCTCT
ATTCCTTAAGGA
TGGGAAACCCTT
ATF-2 IRF-3(1) IRF-3(2) p50
c-Jun RelAIRF-7(1) IRF-7(2)
AT
GC
ATAGGTATCCAT
TGAAAACTTTGAAAACTTT
GAAAATTTT
AT
GC
1 8710 20 30 40 50 60 70 80
−1.5−1.0−0.5
00.51.0
−1.5−1.0−0.5
00.51.0
−1.5−1.0−0.5
00.51.0
−1.5−1.0−0.5
00.51.0
−1.5−1.0−0.5
00.51.0
−1.5
−1.0
−0.5
0
0.5
1.0
−1.5−1.0
−0.5
0
0.5
1.0
→A
→C
→G
5 nt
10 nt
→T
∆act
ivity
(lo
g 2): s
ingl
e su
bstit
utio
ns∆a
ctiv
ity (
log 2)
:8-
nt s
ubst
itutio
ns∆a
ctiv
ity (
log 2)
: ins
ertio
ns
a
b
c
d
Figure 3 Single-hit scanning mutagenesis of the virus-inducible IFNB enhancer. (a) The IFNB enhancer with known transcription factor binding sites indicated. (b) Changes in induced activity owing to single-nucleotide substitutions. Each bar shows the log-ratio of the median variant and wild-type activity estimates. (c) Changes in induced activity owing to eight consecutive substitutions. The plot shows the medians of three different types of substitutions (see also Supplementary Fig. 6). Each bar is located at the fourth nucleotide in the corresponding 8-nt substitution. (d) Changes in induced activity owing to 5-nt (top) and 10-nt (bottom) insertions. The plots show the means of two different insertions (see also Supplementary Fig. 7). Each bar is located one nucleotide to the right of the insertion. Error bars show the first and third quartile. Red indicates a significant change from wild-type (Mann-Whitney U-test, 5% FDR). Numerical values are provided in Supplementary Table 4.
©20
12 N
atu
re A
mer
ica,
Inc.
All
rig
hts
res
erve
d.
nature biotechnology advance online publication �
A rt i c l e s
The difference in the fit of linear models appears to reflect the different architec-tures of the enhancers. Most CRE multi-hit variants disrupt one or more of the nonover-lapping consensus CREB sites, which caused large (median = 4.7-fold) and roughly additive reductions in its induced activity, until an apparent minimum is reached (Supplementary Fig. 8b). Multiple sub-stitutions in the induced IFNB enhancer generally caused weaker (median = 1.8-fold) and nonadditive reductions in activity, which may reflect its initially weaker nonconsensus binding sites or more complex interactions between its transcription factors.
Because both enhancers showed evidence of nonlinear responses, we next attempted to refine our QSAMs by incorporating functional nonlinearities. We fit a variety of QSAMs to the data, including ones describing either dinucleotide interactions or biophysical inter-actions between DNA-bound proteins (Supplementary Notes and Supplementary Tables 5 and 6). Model parameters were optimized using linear regression or mutual information maximization9. For the CRE, the best performing QSAM was a ‘linear-nonlinear’ model20 in which each nucleotide position is assumed to contribute additively to a linear activation measure, and a sigmoidal func-tion of that measure then gives the transcriptional response. The optimal parameters for the linear part of this model are virtually identical (r2 = 0.98) to the strictly linear QSAM, but the two addi-tional parameters that describe the sigmoidal nonlinearity allow the model to describe both minimum and maximum activation levels. Notably, this nonlinearity appears to capture much of the remain-ing nontechnical variance in the induced CRE data (r2 = 0.72, P < 10−100, compared to r2 = 0.67 between the two replicates). For the IFNB enhancer, the best performing models were those that incorporated dinucleotide interactions, which is consistent with its more complex architecture, although no model provided more than a modest improvement over the linear QSAM (up to r2 = 0.10, P < 10−100). Thus, although linear QSAMs are imperfect representations of the underlying biological systems, in these cases they appear to provide a reasonable trade-off between complexity and predictive power.
Model-based optimizationLinear QSAMs have previously proven useful for engineering regulatory elements in bacteria12,21. To explore the potential for model-based optimization of synthetic regulatory elements
in mammals, we next attempted to design enhancers with modified activities (Fig. 6).
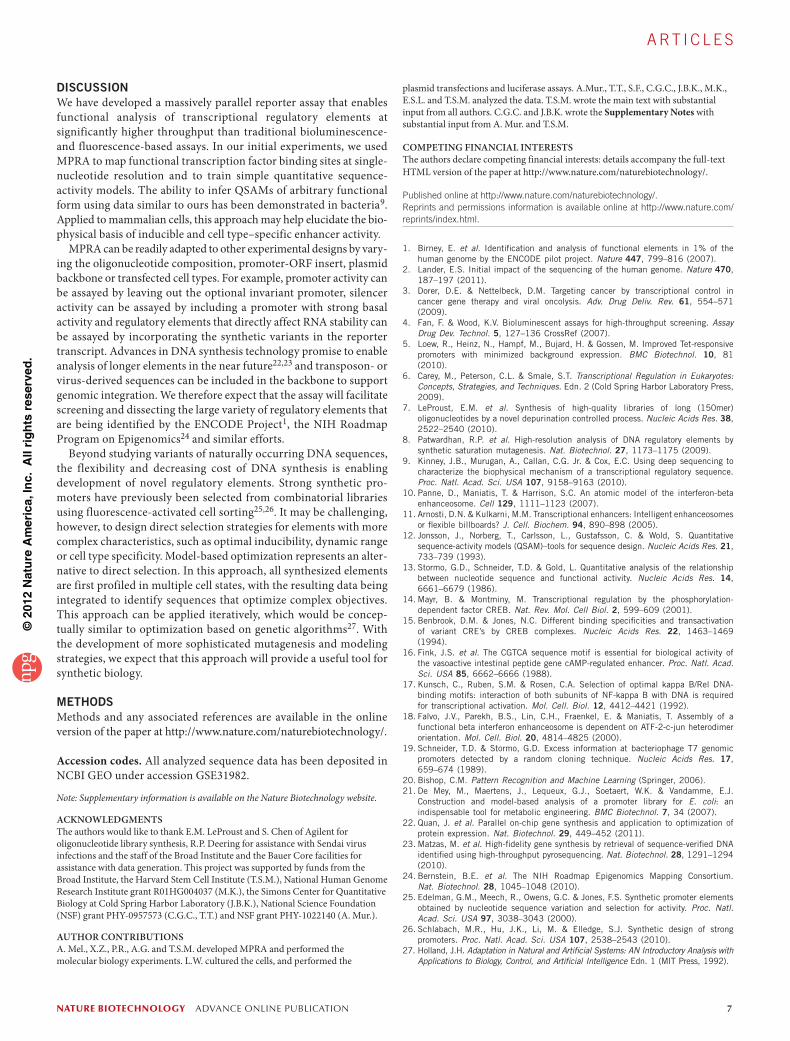
We first attempted a ‘greedy’ approach to maximize the induced enhancer activities. We selected, for each position, the nucleotide predicted to make the largest activity contribution according to the corresponding linear model. This resulted in changing the CRE at 36 of 87 positions (CRE-A1 in Fig. 6a). These changes left the consensus CREB sites intact, but introduced predicted activating mutations into the flanks of CREB sites 1–3 and into the two cryp-tic binding sites. For the IFNB enhancer, we limited modifications to the 44-nt core. This resulted in changes at 15 positions (IFNB- A1 in Fig. 6c), including conversion of every nonconsensus IRF half-site to the GAAA consensus and strengthening of the p50 half-site. We individually synthesized these two variants and then com-pared them to their wild types using a luciferase assay. We found that both new variants had significantly higher induced activities (2.1-fold for CRE-A1, P < 0.0001, and 2.6-fold for IFNB-A1, P < 0.0001; Fig. 6b,d). Notably, the increase for CRE-A1 (2.1-fold) was substan-tially lower than predicted by the simple linear model (32-fold), but close to the value predicted by the linear-nonlinear model (1.7-fold). In contrast, the increase for IFNB-A1 (2.6-fold) was close to the value predicted by its linear model (2.1-fold). This difference likely reflects that the wild-type CRE is composed of consensus activa-tor sites and therefore operates much closer to saturation than the IFNB enhancer. We also found, however, that both new variants had disproportionately higher uninduced activities (19-fold for CRE-A1 and 17-fold for IFNB-A1). This suggests that mutations that increase the induced activity of an enhancer may often decrease its inducibility, which would likely be detrimental in most biological and engineering contexts.
Accordingly, we attempted instead to maximize the inducibility of the two enhancers. We simultaneously considered the induced and uninduced linear QSAMs and, for each position, selected the nucleotide predicted to maximize inducibility, without (i) increas-ing the uninduced activity or (ii) decreasing the induced activity
0
20
40
60
0
20
40
60
5′-GCACCAGACAGTGACGTCAGCTGCCAGATCCCATGGCCGTCATACTGTGACGTCTTTCAGACACCCCATTGACGTCAATGGGAGAAC-3′3′-CGTGGTCTGTCACTGCAGTCGACGGTCTAGGGTACCGGCAGTATGACACTGCAGAAAGTCTGTGGGGTAACTGCAGTTACCCTCTTG-5′
TGACGTCAGACTGCAGT
GCACCAGACACGTGGTCTG
TGACGTCAAACTGCAGTTG TG T
AC AAC AGTGACGTCACTGCA
CGTCATGCAGTA
CREB(1) CREB(2) CREB(3) CREB(4)
1 8710 20 30 40 50 60 70 80
Mill
ibits
Mill
ibits
Act
ivity
con
trib
utio
n(r
esca
led)
Induced
Uninduced
Induced
Uninduced
A
CG
T
A
CG
T
0
1
a
b
Cryptic
Cryptic
Figure 4 Multi-hit sampling mutagenesis of the cAMP-responsive enhancer. (a) Information footprints of the CRE in its induced (top) and uninduced (bottom) states. Red indicates significant information content at the corresponding position (permutation test, 5% FDR). Error bars show uncertainties inferred from subsampling. (b) Visual representations of linear QSAMs of the CRE in its induced (top) and uninduced (bottom) states. The color in each entry represents the estimated additive contribution of the corresponding nucleotide to the log-transformed activity of the enhancer. The matrices are rescaled such that the lowest entry in each column is zero and the highest entry anywhere is one. Both matrices are shown on the same scale. Numerical values are provided in Supplementary Table 3.
©20
12 N
atu
re A
mer
ica,
Inc.
All
rig
hts
res
erve
d.
� advance online publication nature biotechnology
A rt i c l e s
relative to that of the wild type. For the CRE, we synthesized three variants (CRE-I1 to CRE-I3 in Fig. 6a). CRE-I1 and -I2 were predicted by QSAMs trained on each of the two replicate CRE data sets and contained 10 and 12 substitutions, respectively. CRE-I3 contained only the five substitutions that were shared between the first two. Only one variant (CRE-I2) contained any activating substitutions in the cryptic motifs near CREB sites 1 and 4. We found that all three variants showed a significant (P < 0.0001) increase in induced activity without the large decrease in inducibility seen for CRE-A1 (Fig. 6b). Moreover, CRE-I3 showed no increase in uninduced activity, which resulted in a ~25% increase in induc-ibility relative to that of the wild type (~44-fold versus ~35-fold).
Notably, we failed to isolate variants with similar or higher induci-bilities from the original random variants (Supplementary Fig. 10). For the IFNB enhancer, we synthesized one variant containing five substitutions in the core, none of which modified the nonconsensus sites (IFNB-I1 in Fig. 6c). This variant also showed increased induc-ibility relative to that of the wild-type (~100-fold versus ~67-fold).
0
1
2
3
4
0
1
2
3
4
5′-TAGAAACTACTAAAATGTAAATGACATAGGAAAACTGAAAGGGAGAAGTGAAAGTGGGAAATTCCTCTGAATAGAGAGAGGACCATC-3′3′-ATCTTTGATGATTTTACATTTACTGTATCCTTTTGACTTTCCCTCTTCACTTTCACCCTTTAAGGAGACTTATCTCTCTCCTGGTAG-5′
TGACAACTG
ATAGGTATCCAT
GAAACTTT
TGAAAACTTT
GGAGACCTCTGAGAACTCT
GGAGACTCT
ATTCCTAAGGA
TGGGAAACCCTT
ATF-2 IRF-3(1) IRF-3(2) p50
c-Jun RelAIRF-7(1) IRF-7(2)
AT
GC
ATAGGTATCCAT
TGAAAGACTTTGAAACTTT
AAAATTTT
AT
GAC
1 8710 20 30 40 50 60 70 80
Mill
ibits
Mill
ibits
Induced
Uninduced
Induced
Uninduced
A
CG
T
A
CG
T
Act
ivity
con
trib
utio
n(r
esca
led)
0
1
a
b
Figure 5 Multi-hit sampling mutagenesis of the virus-inducible IFNB enhancer. (a) Information footprints of the IFNB enhancer in its induced (top) and uninduced (bottom) states. Red indicates significant information content at the corresponding position (permutation test, 5% FDR). Error bars show uncertainties inferred from subsampling. (b) Visual representations of linear QSAMs of the IFNB enhancer in its induced (top) and uninduced (bottom) states. The color in each entry represents the estimated additive contribution of the corresponding nucleotide to the log-transformed activity of the enhancer. The matrices are rescaled such that the lowest entry in each column is zero and the highest entry anywhere is one. Both matrices are shown on the same scale. Numerical values are provided in Supplementary Table 4.
5′-GCACCAGACAGTGACGTCAGCTGCCAGATCCCATGGCCGTCATACTGTGACGTCTTTCAGACACCCCATTGACGTCAATGGGAGAAC-3′3′-CGTGGTCTGTCACTGCAGTCGACGGTCTAGGGTACCGGCAGTATGACACTGCAGAAAGTCTGTGGGGTAACTGCAGTTACCCTCTTG-5′
5′-ACACCAGACATTGACGTAAGCTGCCAGATCCCATTCCCGTCATACTCTGACGTCTTTCAGACACCCCATTGACGTCAATGGGAGAAC-3′3′-TGTGGTCTGTAACTGCATTCGACGGTCTAGGGTAAGGGCAGTATGAGACTGCAGAAAGTCTGTGGGGTAACTGCAGTTACCCTCTTG-5′
5′-ACACCAGACATTGACGTAAGCTGACTAATCCCATTCCCGTCATACTCTGACGTCTTTTAGACATCCCATTGACGTCAATGGGAAAAC-3′3′-TGTGGTCTGTAACTGCATTCGACTGATTAGGGTAAGGGCAGTATGAGACTGCAGAAAATCTGTAGGGTAACTGCAGTTACCCTTTTG-5′
5′-ACACCAGACATTGACGTCAGCAGCCAGATCGCATTCCCGTCATTCTCTGACGTCTATCAGACACCCCATTGACGTCAATGGGAGAAA-3′3′-TGTGGTCTGTAACTGCAGTCGTCGGTCTAGCGTAAGGGCAGTAAGAGACTGCAGATAGTCTGTGGGGTAACTGCAGTTACCCTCTTT-5′
TGACGTCAGACTGCAGT
GCACCAGACACGTGGTCTG
TGACGTCAAACTGCAGTTG T
C AACGTGACGTCACTGCA
CGTCATGGCAGTA
CREB(1) CREB(2) CREB(3) CREB(4)
1 8710 20 30 40 50 60 70 80
Cryptic
Cryptic
5′-TCGCGAGACATTGACGTCAGCCGACTCTGTACGCTAACGTCATCCACTGACGTCTGTCTCCCGGGGGATTGACGTCAATGCGCTGGA-3′3′-AGCGCTCTGTAACTGCAGTCGGCTGAGACATGCGATTGCAGTAGGTGACTGCAGACAGAGGGCCCCCTAACTGCAGTTACGCGACCT-5′
a
WT
CRE-A1
CRE-I1
5′-TAGAAACTACTAAAATGTAAATGACATAGGAAAACTGAAAGGGAGAAGTGAAAGTGGGAAATTCCTCTGAATAGAGAGAGGACCATC-3′3′-ATCTTTGATGATTTTACATTTACTGTATCCTTTTGACTTTCCCTCTTCACTTTCACCCTTTAAGGAGACTTATCTCTCTCCTGGTAG-5′
5′-TAGAAACTACTAAAATGTAAATGACATAGGAAAACTGAAACTGAGAACGGAAACTGGGAAATTCCCCTGAATAGAGAGAGGACCATC-3′3′-ATCTTTGATGATTTTACATTTACTGTATCCTTTTGACTTTGACTCTTGCCTTTGACCCTTTAAGGGGACTTATCTCTCTCCTGGTAG-5′
5′-TAGAAACTACTAAAATGTAAATGAGGAAAGGAAACGGAAACTGGAAACGGAAACTGGGGAATTCCACTGAATAGAGAGAGGACCATC-3′3′-ATCTTTGATGATTTTACATTTACTCCTTTCCTTTGCCTTTGACCTTTGCCTTTGACCCCTTAAGGTGACTTATCTCTCTCCTGGTAG-5′
TGACAACTG
GGC
AT
GAAACTTT
TGAAAACTTT
GGAGACCTCTGAGAACTCT
GGAGACCTCT
ATTCCTAAGGA
TGGGAAACCCTT
ATF-2 IRF-3(1) IRF-3(2) p50
c-Jun RelAIRF-7(1) IRF-7(2)
AT
GC
ATAGGTATCCATAT
TGAAAGACTTTGAAA
ACTTTAAAATTTT
AT
GAC
1 8710 20 30 40 50 60 70 80d
WT
IFNB-A1
IFNB-I1
CRE-I2
CRE-I3 e f***
***
******
Luci
fera
se a
ctiv
ity(R
LU)
Indu
cibi
lity
(fol
d-ch
ange
)
Uninduced Induced
02468
1012141618
0
50
100
150
200
250
0
20
40
60
80
100
120
IFNB
-WT
IFNB
-A1
IFNB
-I1
IFNB
-WT
IFNB
-A1
IFNB
-I1
IFNB
-WT
IFNB
-A1
IFNB
-I1
b c
10
20
30
40
50
***
******
***
*********
Luci
fera
se a
ctiv
ity (
RLU
)
Indu
cibi
lity
(fol
d-ch
ange
)Uninduced Induced
n.s.0 0 0
5
10
15
20
25
1020304050607080
CRE-WT
CRE-A1
CRE-I1
CRE-I2
CRE-I3
CRE-WT
CRE-A1
CRE-I1
CRE-I2
CRE-I3
CRE-WT
CRE-A1
CRE-I1
CRE-I2
CRE-I3
Figure 6 Model-based optimization. (a) CRE variants predicted to maximize induced activity (A1) or inducibility (I1-I3) based on linear QSAMs trained on multi-hit data. Differences from wild type are indicated by red shading. Darker shading indicates a higher predicted contribution to the change in activity. (b) Luciferase activity of the wild-type (WT) and optimized CRE variants in untreated and forskolin-treated cells. RLU, relative light unit. (c) Inducibility of the CRE variants in response to cAMP elevation caused by forskolin treatment. (d) IFNB enhancer variants predicted to maximize induced activity (A1) or inducibility (I1) based on linear QSAMs trained on multi-hit data. (e) Luciferase activity of the WT and optimized IFNB enhancer variants in uninfected and virus-treated cells. (f) Inducibility of the IFNB enhancer variants in response to virus infection. Blue bars show mean activity across 12 replicates in the induced or uninduced states. Error bars show s.e.m. (SE). All statistical comparisons are relative to WT in the same state; n.s., not significant; ***, P ≤ 0.0001; two-tailed t-test. Orange bars show the ratio of the corresponding induced and uninduced mean activities. Error bars show the range from (induced mean – induced SE)/(uninduced mean + uninduced SE) to (induced mean + induced SE)/(uninduced mean – uninduced SE).
©20
12 N
atu
re A
mer
ica,
Inc.
All
rig
hts
res
erve
d.
nature biotechnology advance online publication �
A rt i c l e s
DISCUSSIONWe have developed a massively parallel reporter assay that enables functional analysis of transcriptional regulatory elements at significantly higher throughput than traditional bioluminescence- and fluorescence-based assays. In our initial experiments, we used MPRA to map functional transcription factor binding sites at single- nucleotide resolution and to train simple quantitative sequence- activity models. The ability to infer QSAMs of arbitrary functional form using data similar to ours has been demonstrated in bacteria9. Applied to mammalian cells, this approach may help elucidate the bio-physical basis of inducible and cell type–specific enhancer activity.
MPRA can be readily adapted to other experimental designs by vary-ing the oligonucleotide composition, promoter-ORF insert, plasmid backbone or transfected cell types. For example, promoter activity can be assayed by leaving out the optional invariant promoter, silencer activity can be assayed by including a promoter with strong basal activity and regulatory elements that directly affect RNA stability can be assayed by incorporating the synthetic variants in the reporter transcript. Advances in DNA synthesis technology promise to enable analysis of longer elements in the near future22,23 and transposon- or virus-derived sequences can be included in the backbone to support genomic integration. We therefore expect that the assay will facilitate screening and dissecting the large variety of regulatory elements that are being identified by the ENCODE Project1, the NIH Roadmap Program on Epigenomics24 and similar efforts.
Beyond studying variants of naturally occurring DNA sequences, the flexibility and decreasing cost of DNA synthesis is enabling development of novel regulatory elements. Strong synthetic pro-moters have previously been selected from combinatorial libraries using fluorescence-activated cell sorting25,26. It may be challenging, however, to design direct selection strategies for elements with more complex characteristics, such as optimal inducibility, dynamic range or cell type specificity. Model-based optimization represents an alter-native to direct selection. In this approach, all synthesized elements are first profiled in multiple cell states, with the resulting data being integrated to identify sequences that optimize complex objectives. This approach can be applied iteratively, which would be concep-tually similar to optimization based on genetic algorithms27. With the development of more sophisticated mutagenesis and modeling strategies, we expect that this approach will provide a useful tool for synthetic biology.
METHODSMethods and any associated references are available in the online version of the paper at http://www.nature.com/naturebiotechnology/.
Accession codes. All analyzed sequence data has been deposited in NCBI GEO under accession GSE31982.
Note: Supplementary information is available on the Nature Biotechnology website.
ACKnoWLEdGMEnTSThe authors would like to thank E.M. LeProust and S. Chen of Agilent for oligonucleotide library synthesis, R.P. Deering for assistance with Sendai virus infections and the staff of the Broad Institute and the Bauer Core facilities for assistance with data generation. This project was supported by funds from the Broad Institute, the Harvard Stem Cell Institute (T.S.M.), National Human Genome Research Institute grant R01HG004037 (M.K.), the Simons Center for Quantitative Biology at Cold Spring Harbor Laboratory (J.B.K.), National Science Foundation (NSF) grant PHY-0957573 (C.G.C., T.T.) and NSF grant PHY-1022140 (A. Mur.).
AUTHoR ConTRIBUTIonSA. Mel., X.Z., P.R., A.G. and T.S.M. developed MPRA and performed the molecular biology experiments. L.W. cultured the cells, and performed the
plasmid transfections and luciferase assays. A.Mur., T.T., S.F., C.G.C., J.B.K., M.K., E.S.L. and T.S.M. analyzed the data. T.S.M. wrote the main text with substantial input from all authors. C.G.C. and J.B.K. wrote the Supplementary Notes with substantial input from A. Mur. and T.S.M.
CoMPETInG FInAnCIAL InTERESTSThe authors declare competing financial interests: details accompany the full-text HTML version of the paper at http://www.nature.com/naturebiotechnology/.
Published online at http://www.nature.com/naturebiotechnology/. reprints and permissions information is available online at http://www.nature.com/reprints/index.html.
1. Birney, E. et al. Identification and analysis of functional elements in 1% of the human genome by the ENCODE pilot project. Nature 447, 799–816 (2007).
2. Lander, E.S. Initial impact of the sequencing of the human genome. Nature 470, 187–197 (2011).
3. Dorer, D.E. & Nettelbeck, D.M. Targeting cancer by transcriptional control in cancer gene therapy and viral oncolysis. Adv. Drug Deliv. Rev. 61, 554–571 (2009).
4. Fan, F. & Wood, K.V. Bioluminescent assays for high-throughput screening. Assay Drug Dev. Technol. 5, 127–136 CrossRef (2007).
5. Loew, R., Heinz, N., Hampf, M., Bujard, H. & Gossen, M. Improved Tet-responsive promoters with minimized background expression. BMC Biotechnol. 10, 81 (2010).
6. Carey, M., Peterson, C.L. & Smale, S.T. Transcriptional Regulation in Eukaryotes: Concepts, Strategies, and Techniques. Edn. 2 (Cold Spring Harbor Laboratory Press, 2009).
7. LeProust, E.M. et al. Synthesis of high-quality libraries of long (150mer) oligonucleotides by a novel depurination controlled process. Nucleic Acids Res. 38, 2522–2540 (2010).
8. Patwardhan, R.P. et al. High-resolution analysis of DNA regulatory elements by synthetic saturation mutagenesis. Nat. Biotechnol. 27, 1173–1175 (2009).
9. Kinney, J.B., Murugan, A., Callan, C.G. Jr. & Cox, E.C. Using deep sequencing to characterize the biophysical mechanism of a transcriptional regulatory sequence. Proc. Natl. Acad. Sci. USA 107, 9158–9163 (2010).
10. Panne, D., Maniatis, T. & Harrison, S.C. An atomic model of the interferon-beta enhanceosome. Cell 129, 1111–1123 (2007).
11. Arnosti, D.N. & Kulkarni, M.M. Transcriptional enhancers: Intelligent enhanceosomes or flexible billboards? J. Cell. Biochem. 94, 890–898 (2005).
12. Jonsson, J., Norberg, T., Carlsson, L., Gustafsson, C. & Wold, S. Quantitative sequence-activity models (QSAM)–tools for sequence design. Nucleic Acids Res. 21, 733–739 (1993).
13. Stormo, G.D., Schneider, T.D. & Gold, L. Quantitative analysis of the relationship between nucleotide sequence and functional activity. Nucleic Acids Res. 14, 6661–6679 (1986).
14. Mayr, B. & Montminy, M. Transcriptional regulation by the phosphorylation-dependent factor CREB. Nat. Rev. Mol. Cell Biol. 2, 599–609 (2001).
15. Benbrook, D.M. & Jones, N.C. Different binding specificities and transactivation of variant CRE’s by CREB complexes. Nucleic Acids Res. 22, 1463–1469 (1994).
16. Fink, J.S. et al. The CGTCA sequence motif is essential for biological activity of the vasoactive intestinal peptide gene cAMP-regulated enhancer. Proc. Natl. Acad. Sci. USA 85, 6662–6666 (1988).
17. Kunsch, C., Ruben, S.M. & Rosen, C.A. Selection of optimal kappa B/Rel DNA-binding motifs: interaction of both subunits of NF-kappa B with DNA is required for transcriptional activation. Mol. Cell. Biol. 12, 4412–4421 (1992).
18. Falvo, J.V., Parekh, B.S., Lin, C.H., Fraenkel, E. & Maniatis, T. Assembly of a functional beta interferon enhanceosome is dependent on ATF-2-c-jun heterodimer orientation. Mol. Cell. Biol. 20, 4814–4825 (2000).
19. Schneider, T.D. & Stormo, G.D. Excess information at bacteriophage T7 genomic promoters detected by a random cloning technique. Nucleic Acids Res. 17, 659–674 (1989).
20. Bishop, C.M. Pattern Recognition and Machine Learning (Springer, 2006).21. De Mey, M., Maertens, J., Lequeux, G.J., Soetaert, W.K. & Vandamme, E.J.
Construction and model-based analysis of a promoter library for E. coli: an indispensable tool for metabolic engineering. BMC Biotechnol. 7, 34 (2007).
22. Quan, J. et al. Parallel on-chip gene synthesis and application to optimization of protein expression. Nat. Biotechnol. 29, 449–452 (2011).
23. Matzas, M. et al. High-fidelity gene synthesis by retrieval of sequence-verified DNA identified using high-throughput pyrosequencing. Nat. Biotechnol. 28, 1291–1294 (2010).
24. Bernstein, B.E. et al. The NIH Roadmap Epigenomics Mapping Consortium. Nat. Biotechnol. 28, 1045–1048 (2010).
25. Edelman, G.M., Meech, R., Owens, G.C. & Jones, F.S. Synthetic promoter elements obtained by nucleotide sequence variation and selection for activity. Proc. Natl. Acad. Sci. USA 97, 3038–3043 (2000).
26. Schlabach, M.R., Hu, J.K., Li, M. & Elledge, S.J. Synthetic design of strong promoters. Proc. Natl. Acad. Sci. USA 107, 2538–2543 (2010).
27. Holland, J.H. Adaptation in Natural and Artificial Systems: AN Introductory Analysis with Applications to Biology, Control, and Artificial Intelligence Edn. 1 (MIT Press, 1992).
©20
12 N
atu
re A
mer
ica,
Inc.
All
rig
hts
res
erve
d.
nature biotechnology doi:10.1038/nbt.2137
ONLINE METHODSOligonucleotide library design and synthesis. We designed 142-mer oligonucleotides to contain, in order, the universal primer site ACTGGCCGCTTCACTG, an 87-nt variable sequence, KpnI/XbaI restric-tion sites (GGTACCTCTAGA), a 10-nt variable tag sequence and the uni-versal primer site AGATCGGAAGAGCGTCG (Supplementary Fig. 1). The wild-type CRE sequence was derived from pGL4.29 (Promega). The wild-type interferon-β enhancer sequence was derived from the NCBI36/hg18 human genome reference assembly. The enhancer variants were designed as described in ‘Experimental design and mutagenesis strategies’, and 100 distinct wild-type enhancer-tag pairs were included in each multi-hit pool. The distinct tags were selected from randomly generated 10-nt sequences, with the following constraints: (i) must contain all four nucleotides, (ii) must not contain a run of more than four identical nucleotides, (iii) must not contain a KpnI or XbaI restriction site, and (iv) must not contain a known mammalian microRNA seed sequence (obtained from http://www.targetscan.org/, April 2009).
The resulting oligonucleotide libraries were synthesized by Agilent as previ-ously described7. Sanger sequencing of subcloned MPRA plasmids suggested that the synthesis error rate was 1 in 200–300, with small deletions being the most common failure mode (data not shown).
Plasmid construction. Oligonucleotide libraries were resuspended in TE 0.1 buffer (10 mM Tris-HCl, 0.1 mM EDTA, pH 8.0) and amplified using 8–12 cycles of PCR using Phusion High-Fidelity PCR Master Mix with HF buffer (New England Biolabs (NEB)) and primers ACTGGCCGCTTCACTG and CGACGCTCTTCCGATCT. The resulting PCR products were selected on the basis of size on 4% NuSieve 3:1 agarose gels (Lonza), purified using QIAquick Gel Extraction kits (Qiagen) and reamplified with primers GCTAAGGGCCTAACTGGCCGCTTCACTG and GTTTAAGGCCTCCGAGGCCGACGCTCTTC to add SfiI sites.
To generate the plasmid backbone for the MPRA constructs, the luc2 reporter gene was removed from pGL4.10[luc2] (Promega) by HindIII-XbaI digestion. The 5′ extension of the HindIII site was filled in with Klenow fragment of DNA polymerase I (NEB) and the XbaI site was eliminated by treatment with Mung Bean nuclease (NEB). The resulting linear plasmid was self-ligated to generate cloning vector pGL4.10M.
To insert the variable regions into the MPRA vector, purified oligonucleo-tide PCR products were digested with SfiI (NEB) and directionally cloned into SfiI-digested pGL4.10M using One Shot TOP10 Electrocomp E. coli cells (Invitrogen). To preserve library complexity, the efficiency of trans-formation was maintained at >3 × 10⁸ cfu/µg. Isolated plasmid pools were digested with KpnI/XbaI to cut between the enhancer variants and tags, ligated with the 1.78 kb KpnI-XbaI fragment of pGL4.23[luc2/minP] (Promega), which contains a minimal TATA-box promoter and the luc2 ORF, and then transformed into E. coli as described above. Finally, to remove vector background, the resultant plasmid pools were digested with KpnI, size selected on a 1% agarose gel, self-ligated and re-transformed into E. coli.
For validation of QSAM optimized enhancers, each variant was indi-vidually synthesized with the constant flanking sequences CTGGCC TAACTGGCCGCTTCACTG and GGTACCTGAGCTCGC (IDT). The oligonucleotides were PCR amplified as described above with primers CTGGCCTAACTGGCC and GCGAGCTCAGGTACC, cloned into pGL4.24[luc2P/minP] (Promega) using the In-Fusion PCR Cloning System (Clontech) and verified by Sanger sequencing before transfection.
Cell culture and transfection. HEK293T/17 cells (ATCC CRL-11268) were cultured in DMEM (Mediatech) supplemented with 10% FBS and l-glutamine/penicillin/streptomycin.
For transfection of a plasmid pool, 4×10⁶ cells were grown to 40–50% confluence in a 10 cm culture dish. Cells were transfected with 10 µg DNA from each plasmid pool in 1 ml Opti-MEM I Reduced Serum Medium (Invitrogen) using 30 µl Lipofectamine LTX and 10 µl Plus Reagent (Invitrogen). The transfection mixtures were removed by media exchange after 5 h. After 24 h, cells transfected with CRE plasmid pools were treated for 5 h with 100 µM forskolin (Sigma) in DMSO (induced state) or an
equivalent volume of DMSO only (uninduced state). Cells transfected with IFNB plasmid pools were infected with Sendai virus (ATCC VR-907) at an MOI of 10 (induced state) or mock infected (uninduced state) for 16 h. Immediately following these treatments, cells were lysed in RLT buffer (Qiagen) and frozen at −80 °C. Total RNA was isolated from cell lysates using RNeasy kits (Qiagen).
For transfection of individual validation plasmids, 2.3×10⁴ cells were seeded into each well of 96-well plates. Each well was transfected with 15 µl of Opti-MEM I Reduced Serum Medium (Invitrogen) containing 100 ng of luc2P reporter plasmid with CRE- or IFNB-derived variants and 10 ng of pGL4.73[hRluc/SV40] (Promega) for normalization, 0.25 µL Lipofectamine LTX and 0.1 µL Plus Reagent (Invitrogen). Cell were treated with forskolin or infected with Sendai virus as described above. Luciferase activities were measured using Dual-Glo Luciferase Assay (Promega) and an EnVision 2103 Multilabel Plate Reader (PerkinElmer).
Tag-Seq. mRNA was extracted from total RNA using MicroPoly(A)Purist kits (Ambion) and treated with DNase I using the Turbo DNA-free kit (Ambion). First-strand cDNA was synthesized from 400-700 ng mRNA using High Capacity RNA-to-cDNA kits (Applied Biosystems).
Tag-Seq sequencing libraries were generated directly from 12% of a cDNA reaction or 50 ng plasmid DNA by 26 cycle PCR using Pfu Ultra HS DNA polymerase 2× master mix (Agilent) and primers AATGATACGGCGACCACCGAGATCTACACTCTTTCCCTACACGACGCTCTTCCGATCT and CAAGCAGAAGACGGCATACGAGATXXXXXXXXGTGACTGGAGTTCAGACGTGTGCTCTTCCGATCTCGAGGTGCCTAAAGG (where XXXXXXXX is a library-specific index sequence). The resultant PCR products were size-selected using 2% agarose E-Gel EX (Invitrogen). The libraries were sequenced in indexed pools of eight, or individually, using 36-nt single-end reads on Illumina HiSeq 2000 instruments.
To infer the tag copy numbers in each Tag-Seq library, all sequence reads were examined, regardless of their quality scores. If the first 10 nt of a read perfectly matched one of the 13,000 or 27,000 designed tags and the remain-ing nucleotides matched the expected upstream MPRA construct sequence, this was counted as one occurrence of that tag. All reads that did not meet this criterion were discarded. All tags that did not have a count of at least 20 in every sequenced CRE or IFNB enhancer plasmid pool were also discarded. The mRNA/plasmid tag ratios were normalized by multiplying by the ratio of the total number of plasmid and mRNA tag counts from the corresponding Tag-Seq libraries.
Analysis of single-hit scanning variants. To estimate the relative activity of each distinct enhancer variant, the median of its 13 mRNA/plasmid tag ratios were compared to the median of the mRNA/plasmid ratios for tags linked to the corresponding WT enhancer. To increase the accuracy of this comparison, 65 distinct WT enhancer-tag pairs were included in each pool design. Significant differences in the median ratios were inferred by apply-ing the Mann-Whitney U-test to all variant-WT pairs and then applying the Benjamini-Hochberg procedure to identify the 5% false discovery rate (FDR) threshold28.
Analysis of multi-hit sampling variants. Information footprints were gene-rated as described in ref. 9. Briefly, the mRNA/plasmid tag ratios from each transfection experiment were first quantized by partitioning into five equally sized bins. The mutual information values between the bases at each position and the quantized activities were then estimated using the Treves-Panzeri limited sample correction29:
I b f bf b
f b f Nei i
bi
i
i; , log
,log
,m m
mmm
( ) ≈ ( ) ( )( ) ( ) −∑ 2 2
6
where bi is the base at the ith position, µ is the quantized activity, f() gives the corresponding joint and marginal frequency distributions and N is the number of assayed variants.
Error bars on these values were determined by computing uncorrected mutual information estimates I bnaive i
50% ;m( ) for 10,000 random sub-samples

©20
12 N
atu
re A
mer
ica,
Inc.
All
rig
hts
res
erve
d.
nature biotechnologydoi:10.1038/nbt.2137
that each contained 50% of the enhancer variants. The uncertainties in I(bi;µ) were computed from the variance of these estimates:
d m mI b I bi naive i; var ;%( ) = ( )( )12
50
To identify positions with significant information content, empirical null distributions for I bi ;m( ) were generated from 10,000 random permutations of the mapping between the quantized activities and the enhancer variants. The probability of the absence of information at the ith position was estimated as (ni+1)/10,000, where ni is the number of random permutations for which I bi ;m( ) exceeded the original value. The Benjamini-Hochberg procedure was then applied to identify the 5% FDR threshold28.
Quantitative sequence-activity modeling. The method of ordinary least-squares was used to train linear QSAMs of the form
log,
activity A xbi bib i
s( )( ) = ∑
where Abi is the activity contribution of base b at the ith position, and xbi is an indicator variable that is 1 if the enhancer variant σ contains base b at the ith position and 0 otherwise. Other models, including nonlinear QSAMs, are described in the Supplementary Notes.
Model-based optimization of the induced activity of each enhancer was performed by identifying and synthesizing
argmaxs
sactivityinduced ( )
based on the corresponding linear QSAMs (without interaction terms).Model-based optimization of the inducibility of each enhancer was per-
formed by identifying and synthesizing
argmaxs
ss
activityactivity
induced
uninduced( )( )
based on the corresponding linear QSAMs, with the constraints
Ainduced Ainduced
Auninduced Auninducedi WTi
i WTi
s
s
≥
≤
where WTi is the base at the ith position of the wild-type enhancer.
28. Benjamini, Y. & Hochberg, Y. Controlling the false discovery rate: a practical and powerful approach to multiple testing. J.R. Stat. Soc. B 57, 289–300 (1995).
29. Treves, A. & Panzeri, S. The upward bias in measures of information derived from limited samples. Neural Comput. 7, 399–407 (1995).