systematic investigation on swept and leaned transonic compressor
TRANSCRIPT

UNIVERSITA' DEGLI STUDI DI PADOVA Dipartimento di Ingegneria Elettrica
Scuola di Dottorato di Ricerca in Ingegneria Industriale
Indirizzo Energetica
Ciclo XX
SYSTEMATIC INVESTIGATION ON SWEPT AND LEANED TRANSONIC
COMPRESSOR ROTOR BLADES
Direttore della Scuola: Prof. Paolo F. Bariani
Supervisore: Prof. Vittorio Quaggiotti
Correlatore: Prof. Ernesto Benini
Dottorando: Roberto Biollo
31 gennaio 2008


i
INDEX
Sommario 1
Summary 5
Notation 9
Introduction 11
CHAPTER 1 – Transonic compressor rotors 15
1.1 Introduction 15
1.2 The flow field 18
1.3 Technological evolutions 22
CHAPTER 2 – NASA Rotor 37: numerical modeling and validation 33
2.1 NASA Rotor 37 33
2.2 Numerical modeling 36
2.2.1 Validation 39
CHAPTER 3 – Aerodynamic sweep and lean: overall impact 49
3.1 Introduction 49
3.2 Investigated rotor geometries 49
3.3 Aerodynamic impact 52
3.4 Structural impact 63
CHAPTER 4 – Aerodynamic sweep and lean: detailed analyses 69
4.1 On the efficiency improvements induced by aft sweep and forward lean 69
4.1.1 The most promising aft swept and forward leaned rotors 69
4.1.2 A promising locally swept rotor 74

ii
4.1.3 A promising locally leaned rotor 82
4.1.4 Concluding remarks 88
4.2 Rotor stability enhancement using forward lean 89
Conclusions 105
Bibliography 111

1
Sommario
Gli stadi transonici di compressione si stanno diffondendo sempre più nei moderni
motori aeronautici a reazione, grazie alla loro capacità di fornire elevati rapporti di com-
pressione (anche doppi rispetto ad un tradizionale stadio subsonico) mantenendo una buo-
na efficienza operativa. Ciò permette la riduzione di pesi e ingombri dell’intero sistema di
compressione grazie alla riduzione del numero degli stadi. Attualmente si sta investendo
molto nel tentativo di migliorarne ulteriormente le prestazioni, soprattutto in termini di ef-
ficienza operativa. Un piccolo incremento del rendimento può avere un impatto notevole
sul risparmio di combustibile nelle tratte a lungo raggio, potendo quindi rappresentare un
fattore di successo del prodotto.
L’elevato rapporto di compressione fornito dagli stadi transonici è legato all’elevata
velocità periferica di cui vengono dotati i relativi rotori. L’elevata velocità periferica dà o-
rigine ad un flusso relativo supersonico verso la periferia palare, con conseguente forma-
zione di urti aerodinamici. La presenza dell’urto e la sua interazione con i flussi secondari
(strato limite, flussi di estremità palare etc.) complicano notevolmente il campo fluido del
rotore, rendendo particolarmente complesso il processo di ottimizzazione dell’intero sta-
dio.
Oggigiorno si stanno studiando soluzioni tecnologiche innovative per migliorare le
prestazioni di tali rotori. L’adozione di palettature curve (swept and leaned blades) al posto
delle ben più convenzionali palettature a sviluppo radiale, sembra essere una delle soluzio-
ni più promettenti. Tuttavia, l’impatto di una data curvatura palare sul comportamento ae-
rodinamico del rotore non è ancora ben prevedibile, sia per quanto riguarda le caratteristi-
che interne di flusso sia per quel che concerne le prestazioni complessive. Sulla scia di
queste osservazioni, è stata qui condotta con successo un’analisi numerico-sistematica vol-
ta a comprendere meglio gli effetti della curvatura palare sull’assetto aerodinamico dei ro-
tori in oggetto, nonché valutare i benefici ottenibili da un tale approccio di ottimizzazione.
Il lavoro è stato condotto come di seguito descritto.

2
E’ stata dapprima valutata l’accuratezza di un noto codice fluidodinamico commer-
ciale (ANSYS CFX) nel simulare il comportamento aerodinamico di un rotore transonico.
In sostanza, con tale codice sono stati sviluppati e testati alcuni modelli 3-D (diversi per
griglia, schema di discretizzazione, modello di turbolenza etc.) del ben noto NASA Rotor
37 (il rotore di uno stadio di compressione sperimentale ben documentato in letteratura e
che ben rappresenta gli intensi fenomeni di flusso che caratterizzano le palettature transo-
niche). I modelli sono stati testati confrontando le prestazioni complessive e le caratteristi-
che di flusso calcolate con i dati sperimentali disponibili in letteratura.
Verificata l’attendibilità dei risultati forniti dal codice, i modelli più accurati sono
stati utilizzati per valutare l’impatto della curvatura palare sulle performance dello stesso
Rotor 37 (dotato di palette a sviluppo pressoché radiale). A partire dal Rotor 37, sono stati
modellati nuovi rotori agendo semplicemente sulla forma della linea di incernieramento dei
profili, allo scopo di calcolarne il comportamento aerodinamico e confrontarlo con quello
del rotore di base. In particolare, sono stati modellati 26 nuovi rotori con palette curvate sul
piano meridiano (axial sweep) e 26 nuovi rotori con palette curvate sul piano circonferen-
ziale (tangential lean). In breve, la linea di incernieramento del Rotor 37 è stata ridefinita
come una spline passante per tre punti di controllo (posti al 33%, 67% e 100% dell’altezza
palare, ovvero dello “span”) e le nuove palettature sono state ottenute muovendo sistemati-
camente tali punti di controllo da un lato e dall’altro rispetto alla posizione originale (sul
piano meridiano nel caso dello sweep e sul piano circonferenziale nel caso del lean), in po-
sizioni opportunamente definite e mantenendo lo stesso livello di span.
Sulla base delle simulazioni condotte e dei risultati ottenuti, per i quali si rinvia alle
conclusioni della tesi, il lavoro svolto ha messo in luce quanto segue.
a) Il codice adottato ha mostrato una soddisfacente accuratezza nel predire
l’assetto aerodinamico del Rotor 37, sia in termini di prestazioni complessive sia
in termini di caratteristiche di flusso, rivelandosi uno strumento di importanza no-
tevole per una migliore comprensione del complesso campo fluido sviluppato dai
rotori in oggetto e per un più efficace processo di ottimizzazione.

3
b) La forma della linea di incernieramento dei profili ha mostrato un conside-
revole impatto sui vari fenomeni di flusso sviluppati dal rotore (urti aerodinamici,
flussi secondari quali scie palari, strato limite, trafilamenti alla periferia palare
etc.), con la possibilità di poter ridurre gli effetti negativi ad essi associati (dissi-
pazioni energetiche, blockage, instabilità indotte etc.).
c) Il punto precedente conferma la possibilità di poter migliorare in modo ap-
prezzabile le prestazioni di un rotore transonico agendo sulla curvatura palare (una
versione modificata del Rotor 37 simulata in ambiente CFX, ottenuta conferendo
alla linea di incernieramento originale un’appropriata curvatura tridimensionale,
ha mostrato un incremento dell’efficienza complessiva di 1.2 punti percentuali in
prossimità della condizione di progetto e un campo operativo stabile più ampio
del 50% rispetto al rotore di partenza).
Gli effetti specifici indotti dalle differenti linee di incernieramento sul campo fluido
del Rotor 37 sono stati analizzati nel dettaglio e saranno argomentati minuziosamente,
conducendo ad una sintesi degli effetti dello sweep assiale e del lean tangenziale sul com-
portamento aerodinamico del rotore analizzato e, in linea di principio, dei rotori transonici
ad esso non eccessivamente dissimili, fino all’individuazione delle curvature più promet-
tenti. Saranno, inoltre, presentate alcune analisi FEM (Finite Element Method) per valutare
l’impatto di una tale soluzione tecnologica sul comportamento strutturale della palettatura.

4

5
Summary
In modern high-performance aircraft gas-turbine engines, compressor stages must
provide high values of both efficiency and compression ratio. This is important to mini-
mize the fuel consumption (a small increment in efficiency can result in huge savings in
fuel costs and determine a key factor) and decrease the engine weight and size thanks to
the reduction of number of stages (with a positive impact on investment and operational
costs). In response to these requirements, transonic axial-flow compressor stages have been
developed for many years and are today widely used in aircraft engines.
Even though the performance of transonic compressors has today reached a high
level, engine manufactures are oriented toward increasing it further. At the present, the ap-
plication of sweep and lean (in other words, the use of a curvilinear blade stacking line) on
rotor blades is considered one of the most promising technological evolutions to improve
the aerodynamic behavior of such machines. However, the presence of intense shock
waves and their interaction with secondary flows (wall boundary layer, tip clearance flows
etc.) lead to an extremely complex flow field, making the aerodynamic effects of sweep
and lean hardly predictable and the development of three-dimensional shaped transonic ro-
tor blades a difficult task.
In this work, a systematic numerical investigation on the impact of blade stacking
line shape (“blade curvature” in the following) on internal flow features and overall per-
formance of transonic compressor rotors was undertaken, with the aim to give the com-
pressor designers a better understanding of sweep and lean effects. The work was carried
out as follows.
Initially, the capability of the commercial CFD (Computational Fluid Dynamics)
code ANSYS CFX to compute the flow within a transonic rotor was explored in detail.
This was done defining a few numerical models (different for grid, discretization scheme,
turbulence model etc.) of the well-known NASA Rotor 37 (a test compressor rotor well
representative of complex flow structures in transonic bladings) and validating them
against experimental data available in literature. The agreement between computed and ex-

6
perimental results was accurately verified in terms of both overall performance and internal
flow features (shock, tip clearance flows, blade wakes etc.).
Then, the “best” models resulting from validation were used to investigate the impact
of blade curvature on the performance of Rotor 37 (which is a radially-stacked rotor).
Various axially swept and tangentially leaned rotors were developed starting from the Ro-
tor 37 by changing the meridional and circumferential shape of the original stacking line
respectively. In short, the original stacking line was considered as a spline passing through
three control points, located at 33%, 67% and 100% span from the hub. 26 new swept ro-
tors were obtained moving systematically each control point upstream and downstream the
original position (on properly selected axial locations), maintaining the same span level.
Similarly, 26 new leaned rotors were obtained by changing systematically the circumferen-
tial position of the same control points (both in the direction of rotor rotation and against
it). The aerodynamic behavior of all the new rotors was simulated, analyzed in detail and
compared to that of baseline rotor.
On the basis of numerical results obtained (see Conclusions for details), the work led
to the following.
a) The careful evaluation of code CFD capabilities made it possible the defini-
tion of accurate 3-D models for a quite reliable prediction of the aerodynamic be-
havior of transonic compressor rotors (in terms of both overall performance and
internal flow phenomena), providing an important tool for a better understanding
of complex flow structures which take place in these machines (shock, shock-tip
endwall flows interactions, shock-boundary layer interaction etc.) and to give in-
sights on possible optimization techniques.
b) Blade curvature showed a considerable influence on shock waves and sec-
ondary flows, leading to the possibility to reduce the entropy generation and aero-
dynamic losses associated with them.

7
c) The previous point confirms the possibility to improve the overall perform-
ance of a transonic compressor rotor using blade curvature concept (a new version
of Rotor 37, obtained by giving the blade a proper 3-D curvature and simulated
using CFX, gave an efficiency of about 1.2% higher than that of baseline rotor
near the design condition, as well as a stable working range of about 50% wider).
The changes in the flow field of Rotor 37 due to the use of different stacking lines
will be argued accurately, as well as the effects of induced flow changes on the overall per-
formance, leading to a helpful synthesis of the impact of axial sweep and tangential lean on
the aerodynamic behavior of the rotor (and, presumably, on the aerodynamic behavior of
all the transonic compressor rotors similar to the Rotor 37). FEM analyses will be also car-
ried out to evaluate the impact of sweep and lean on the structural behavior of the blade,
with the aim to verify the practical feasibility of curved blades in transonic compressor ro-
tors.

8

9
Notation
k specific heat capacity ratio
p absolute static pressure
t absolute static temperature
P absolute total pressure
T absolute total temperature
Acronyms
CFD Computational Fluid Dynamics
RANS Reynolds-Averaged Navier-Stokes
UDS Upwind Differencing Scheme
LPS Linear Profile Scheme
PAC Physical Advection Correction
SST Shear Stress Transport
FEM Finite Element Method
TE Trailing Edge
PS Pressure Side
SS Suction Side

10

11
Introduction
Transonic axial-flow compressor rotors are today widely used in aircraft engines to
obtain maximum pressure ratios per single stage while maintaining high efficiencies. High
stage pressure ratios are important because make it possible to reduce the engine weight
and size and, therefore, investment and operational costs. Performance of such machines
has today reached a high level but engine manufacturers are oriented toward increasing it
further. A small increment in efficiency, for instance, can result in huge savings in fuel
costs and determine a key factor for product success. Another important target is the im-
provement of rotor stability toward near stall condition, resulting in a wider working range.
Today, the application of sweep and lean (in other words, the use of a curvilinear
stacking line leading to a three-dimensional shaped blade) is considered one of the most
promising technological evolutions to improve the performance of transonic compressor
rotors. Many research efforts were spent in this direction and many hopeful results can be
found in literature. However, the effects of sweep and lean on the aerodynamic behavior of
transonic rotors were not completely understood and further studies are needed. This is
mainly due to the complexity of the flow field inside these machines.
Effectively, the flow field that develops inside a transonic compressor rotor is ex-
tremely complex and presents many challenges to compressor designers, who have to deal
with several and concurring phenomena such as shock waves, secondary flows, shock-
boundary layer interaction etc. This complexity is accentuated if the blade is swept and/or
leaned, due to a mutual interaction among the above phenomena.
The use of CFD (Computational Fluid Dynamics) can be of great help in giving in-
sights on the flow structures and several examples of CFD calculations on transonic rotor
blades can be found in literature. However, the reliability of numerical results has not al-
ways been proven and checked with the required considerations. This is true especially for
commercial codes, which are today widespread among engine manufacturers, but the accu-
racy of which has not always been measured extensively and rigorously.

12
The purposes of this work are the following:
i. to explore the capability of a well-known commercial CFD code (ANSYS
CFX) to compute the flow within a transonic rotor (this will be done carrying
out various numerical models of a transonic compressor rotor, the NASA Ro-
tor 37, and by accurately validating them against experimental data available
in literature);
ii. to use the “best” models, resulting from validation, to study the aerodynamic
impact of blade curvature on the performance of the original compressor
blade of Rotor 37, by changing systematically its shape and by comparing the
new performance with that of the original solution (this will be carried out by
analysing in detail the computed flow within the blade passage of the original
and the new blades and, in particular, the shock wave pattern and the shock
interaction with the main flow as well as with wall boundary layers).
The thesis consists of following main chapters.
o Chapter 1 gives an overview on transonic compressor rotors. It deals with the
fundamentals of flow field, showing the complex flow features which charac-
terize these machines. Some of the most promising technological solutions
recently studied to improve transonic compressor performance are also pre-
sented, including sweep and lean.
o Chapter 2 is concerned with the CFD code validation. A careful assessment
of numerical consistency and accuracy of different models of Rotor 37 is pre-
sented. The chapter ends with the choice of the “best” numerical models
among those evaluated.
13
o Chapter 3 describes the investigated blade curvatures and shows their impact
on the overall performance of Rotor 37. A first understanding on the effects
of sweep and lean on the flow field is also dealt with. In addition, a FEM (Fi-
nite Element Method) analysis is carried out to evaluate the impact of blade
curvature from the structural point of view.
o In Chapter 4, the aerodynamic effects of some among the most interesting
blade curvatures are analyzed in detail, with the aim to better understand the
impact of sweep and lean on the flow features.
o Finally, in Conclusions the main results obtained in this work are summed up.

14

15
CHAPTER 1
Transonic compressor rotors
1.1 Introduction
In modern high-performance aircraft gas turbine engines, compressor stages must
provide high values of both efficiency and total pressure ratio. High values of total pres-
sure ratio are important to decrease the number of stages and, consequently, the compres-
sor weight and size (the compressor section is still 50-60% of the engine length and 40-
50% of the weight). Actually, the current trend is to increase the stage total pressure ratio
by giving the rotor a higher tip speed. This leads to higher relative flow velocities at the
outer span and, consequently, to a transonic flow field (supersonic at the outer span and
subsonic at the inner span). Transonic compressor rotors are the direct consequence of this
trend.
However, transonic compressor rotors have slightly lower efficiency and operating
range than traditional subsonic solutions. This is mainly due to the presence of intense
shock waves close to the blade tip and over part of span. At the outer span, the relative
flow is supersonic and the deflection imposed by the blade pressure side wall gives rise to
a shock wave, which starts from the blade leading edge and propagates into the blade pas-
sage (Figure 1.1(a)). As known, the shock is an irreversible process and induces entropy
generation (i.e. aerodynamic losses in an adiabatic system without thermal sources), which
negatively influences the overall rotor efficiency. Further, the interaction between the
shock and secondary flows, such as tip clearance flows and wall boundary layers, has gen-
erally a negative impact on the local flow field, with detrimental effects on the overall rotor
performance. The shock-tip clearance flows interaction is believed, for instance, to be one
of the main stall-triggers in transonic compressor rotors.

16
Near stall operating condition
Design operating condition
Choking operating condition
(b) Impact of operating condition (constant wheel speed).
Fig. 1.1 Shock wave configuration inside a transonic compressor rotor. (Blade-to-blade views)
Shock wave
Supersonic blade profile
Axial direction and
rotation
Absolute inlet flow direction
(a) Shock configuration – sketch.
PS SS
17
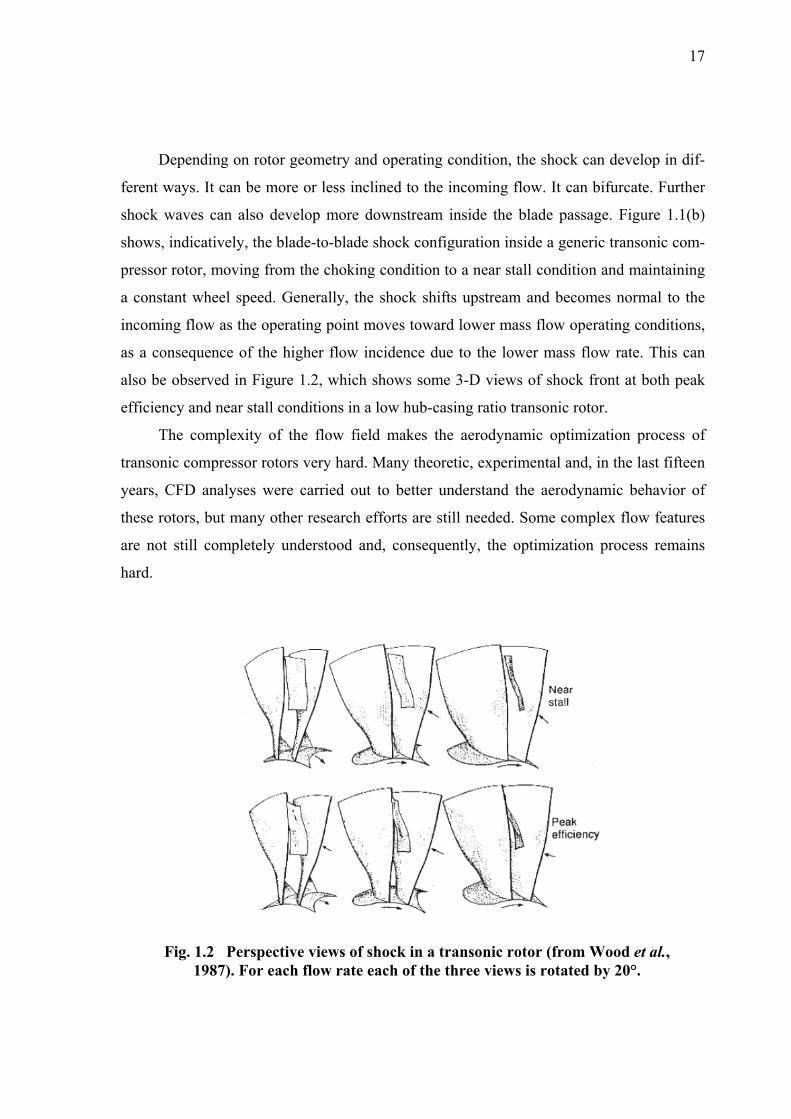
Depending on rotor geometry and operating condition, the shock can develop in dif-
ferent ways. It can be more or less inclined to the incoming flow. It can bifurcate. Further
shock waves can also develop more downstream inside the blade passage. Figure 1.1(b)
shows, indicatively, the blade-to-blade shock configuration inside a generic transonic com-
pressor rotor, moving from the choking condition to a near stall condition and maintaining
a constant wheel speed. Generally, the shock shifts upstream and becomes normal to the
incoming flow as the operating point moves toward lower mass flow operating conditions,
as a consequence of the higher flow incidence due to the lower mass flow rate. This can
also be observed in Figure 1.2, which shows some 3-D views of shock front at both peak
efficiency and near stall conditions in a low hub-casing ratio transonic rotor.
The complexity of the flow field makes the aerodynamic optimization process of
transonic compressor rotors very hard. Many theoretic, experimental and, in the last fifteen
years, CFD analyses were carried out to better understand the aerodynamic behavior of
these rotors, but many other research efforts are still needed. Some complex flow features
are not still completely understood and, consequently, the optimization process remains
hard.
Fig. 1.2 Perspective views of shock in a transonic rotor (from Wood et al., 1987). For each flow rate each of the three views is rotated by 20°.

18
1.2 The flow field The knowledge of internal flow features is fundamental when trying to improve the
aerodynamic behavior of a transonic compressor rotor. In particular, the impact of shock
waves on the overall flow field must be understood clearly.
As said, transonic compressor rotors develop intense shock waves (generally normal
or quasi-normal to the incoming flow), which are irreversible processes and hence source
of entropy (the entropy creation occurs due to heat conduction and high viscous normal
stresses within the shock). It is known, however, that the shock is a diffusion process and
represents the most important diffusion system in these rotors (note that the profile camber
and, consequently, the flow diffusion induced by the profile curvature are generally lower
in transonic bladings than in subsonic ones).
Figure 1.3 shows the isoentropic (or adiabatic) efficiency η of the diffusion process
associated with a normal shock in a one-dimensional flow through a duct with constant
cross-sectional area. An ideal gas (constant specific heat capacities, k = 1.4) was consid-
ered. The parameter M1 is the Mach number upstream the shock. Figure 1.3 was derived
using the following equations (the subscript “1” indicates a section upstream the shock
while the subscript “2” a section downstream):
( )1tt
1pp
12
k1k
12
−−
=
−
)/(/
η (1.1)
( )( )1k
1kkM2pp 2
1
1
2
+−−
= (1.2)
( )( ) ( )( )( ) 2
12
21
21
1
2
M1k1kkM2M1k2
tt
+
−−−+= (1.3)

19
Effi
cien
cy η
Pressure ratio p2/p1
0,75
0,80
0,85
0,90
0,95
1,00
1,0 1,5 2,0 2,5 3,0 3,5 4,0 4,5
M11.4
1.5
1.3
1.61.7
Fig. 1.3 Shock diffusion efficiency.
As shown, the diffusion efficiency decreases with the upstream Mach number, be-
coming unsatisfactory if the upstream Mach number is higher than 1.5. Generally, inlet
relative Mach numbers in axial transonic compressor rotors exceeding about 1.4 are un-
usual and, at this condition, the shock can be considered a satisfactory diffusion mecha-
Fig. 1.4 Blade-to-blade view of measured relative Mach number (from Suder, 1998). (NASA Rotor 37 – design speed – low flow condition)

20
Fig. 1.5 Blade suction side boundary layer radial fluid flow – meridional view.
Passage shock
Blade suction side Hub
Shroud
Strong outward flow inside boundary layer
Flow
nism. Further, if the same pressure rise is accomplished by two oblique shock waves in-
stead of by a single normal shock, the aerodynamic shock losses will be greatly reduced
(further details on shock losses in turbomachines can be found in the 1993 International
Gas Turbine Institute scholar lecture by Denton (1993)). Therefore, the shock can not be
considered a problem in itself. The most serious aspects associated with the shock are due
to its detrimental interactions with secondary flows, as remarked in the following.
At the outer half span region, the shock impacts strongly on the blade suction side
and interacts negatively with the local boundary layer. Due to the adverse pressure gradient
across the shock, a significant increment of boundary layer thickness is induced (Figure
1.4) and a separation bubble can occur. In case of separation, the boundary layer may reat-
tach before the trailing edge or not. If not, larger and deeper blade wakes develop, leading
to a considerable increment of aerodynamic losses.
Further, a strong outward radial fluid migration was generally observed inside the
suction side boundary layer after the shock. This characteristic flow phenomenon is
sketched in Figure 1.5. It induces an accumulation of low momentum fluid at the outer
span region (which is considered to be detrimental for rotor stability) and causes a bound-
ary layer thickening with a negative impact on the blade wake development. Further details
on shock-boundary layer interaction, radial transport and wake development were provided
by Hah and Reid (1992).

21
The most detrimental region in transonic compressor rotors is the tip endwall region.
These rotors are typically unshrouded and the tip gap region develops intense secondary
flows (Figure 1.6). The pressure difference between the suction side and pressure side
drives the fluid through the blade tip gap, inducing a jet which propagates into the main
flow. The interaction between the jet and the main flow gives rise to a vortex (known as
“tip clearance vortex”) which generally starts at the leading edge and develops into the
passage. The complex flow structures arising from the interaction between these tip clear-
ance flows, the casing boundary layer and the passage shock have detrimental effects on
the overall rotor performance, since they induce aerodynamic losses (Fritsch et al., 2000),
blockage (Suder, 1998) and instabilities (Hofmann and Ballmann, 2002). The shock-tip
clearance vortex interaction is believed, in particular, to have a key role on rotor instability.
Interacting with the shock, the vortex is subject to a sudden and strong deceleration; at
lower flow operating conditions, depending on the intensity of the interaction, vortex
breakdown can occur inducing compressor stall (Figure 1.7).
Fig. 1.6 Tip clearance gap secondary flows.
Casing wall
Blade
Pressure side
Suction side
Vortex
Tip clearance flows development – sketch
vortex
Rotation
Blade
Path lines of relative flow crossing tip gap - example
Shock
Tip clearance

22
1.3 Technological evolutions Advanced technological solutions were developed to improve the aerodynamic be-
havior of transonic compressor rotors. Sweep and lean, casing treatment and tip injection
can be considered the most important ones. They are briefly presented into the following.
Sweep and lean
Traditionally, rotor blades are radially-stacked. The application of sweep and/or lean
leads to a curvilinear stacking line, i.e. to a three-dimensional shaped blade. Figure 1.8
gives the common definition of aerodynamic sweep and lean. As shown, sweep is defined
as the movement of blade sections along the local chord direction, while lean the change in
the perpendicular direction.
There are many aspects to be considered when trying to understand how sweep and
lean influence the performance of a transonic blade row. The three-dimensional shock
structure is one of the most important. As aforesaid, the shock starts from the blade leading
edge and propagates into the blade passage. The application of sweep and/or lean modifies
the spatial shape of the blade leading edge and, consequently, the spatial shape of the
shock; an aft swept blade, for instance, develops an aft swept shock, at least far from the
Fig. 1.7 Tip clearance vortex streamlines. (From Hofmann and Ballmann, 2002)

23
tip (at the tip endwall region, the shock shape is influenced also by the presence of the cas-
ing, as explained below). It was also observed that the application of a 3-D blade curvature
can induce the shock to change in two oblique shocks of lesser intensity (Benini, 2004;
Jang et al., 2006). In short, sweep and lean can lead to considerable changes in the overall
shock configuration, influencing not only its shape and strength[1] but also its interactions
with secondary flows.
The influence of sweep on shock structure and secondary flows has been widely ana-
lyzed in the literature and it seems to be of general agreement that forward sweep (i.e. up-
stream sweep) leads to significant benefits. Numerical and experimental analyses con-
ducted by Hah et al. (1998) to evaluate the performance of a conventional unswept rotor, a
[1] The strength of a single shock front depends on both the upstream Mach number and the angle between the incoming flow direction and the shock front; for instance, a normal shock is stronger than an oblique one with the same upstream Mach number. At a higher strength corresponds higher aerodynamic losses.
Chord line
Chord line
Axial direction
Tangential direction
Datum section
Datum section
Swept section
Leaned section
Fig. 1.8 Aerodynamic sweep and lean definition.

24
forward swept rotor and an aft swept rotor showed that the forward swept rotor had a
higher peak efficiency and a substantially larger stall margin than the baseline unswept ro-
tor, and that the aft swept rotor had a similar peak efficiency with a significantly smaller
stall margin. Similar results were obtained by Wadia et al. (1998) in a parallel investiga-
tion. On the other hand, however, Denton and Xu (2002) observed that the global effects of
swept blades on transonic fan efficiency and total pressure ratio are not very remarkable,
but confirmed the possibility to improve the compressor stability using forward sweep.
Near the casing, sweep impacts on shock structure in a particular way. As described
by Hah et al. (1998), the shock must intersect the casing at right angles (a phenomenon
known as “endwall effect”). This fact induces the shock to move upstream in an aft swept
rotor and downstream in a forward swept rotor (Figure 1.9). The high stability generally
observed in forward swept rotors seems actually to be associated with the shock located
more downstream near the casing.
In addition, sweep seems to have a considerable influence on the accumulation of
low momentum fluid near the tip endwall region, a flow phenomenon described by Figure
1.5. Yamaguchi et al. (1991) found that in forward swept rotors this phenomenon is of
lesser importance than in conventional radial rotor blades. The reason of that can be asso-
ciated with a redistribution of pressure field around the blade, which contrasts the radial
Fig. 1.9 Endwall effect on shock structure near the casing (from Hah et al., 1998).

25
migration of boundary layer fluid particles, as schematically shown in Figure 1.10 for a
subsonic compressor rotor.
Moreover, as observed by Denton and Xu (1999), sweep influences the loading on
the blade near the walls; in particular, forward sweep can reduce the blade loading in the
front area of the tip region, where the loading rapidly falls down to zero (no blade) as one
moves radially from the tip to a lower span (Figure 1.11). This helps to reduce the sensitiv-
ity to changes in incidence and the intensity of the tip leakage flows in this area.
The influence of lean in transonic compressor rotors is not extensively described in
literature. However, some researches were carried out to investigate the use of a blade
Fig. 1.11 Impact of sweep on blade loading in the front area near the casing.
Fig. 1.10 Impact of sweep on radial migration of boundary layer fluid particles. (From Yamaguchi et al., 1991)

26
curved in the tangential direction. Bergner et al. (2002) observed that the use of a stacking
line curved in the tangential plane can induce a significant change in the shock pattern
within the blade passage. Ahn and Kim (2002) used an optimization technique for the well-
known NASA Rotor 37 and showed the possibility to increase the overall rotor efficiency
by skewing the blade toward the direction of rotor rotation. Benini (2004) performed a
multi-objective design optimization on the same rotor and obtained similar results. The
positive impact of this kind of blade curvature was confirmed recently also by Jang et al.
(2006) and Yi et al. (2006). It seems that the better performance induced by such a curva-
ture of stacking line is associated with a favorable modification of the three-dimensional
shock structure; however, in general, the induced flow fields were not studied in depth and
detailed information about the flow mechanisms that lead to the aerodynamic improve-
ments were not provided.
Casing treatment
Hollow structures in the casing that aim to improve the tip endwall flow field of ax-
ial-flow compressors are commonly referred to as “casing treatments”. Figure 1.12 shows
some examples of casing treatments investigated in the 1970’s. The interaction of the main
flow with the flow circulating in these cavities seems to have a positive impact on the rotor
stability. However, early studies did not reach a detailed understanding of the phenome-
non, since experimental investigations were too expensive and only few configurations
could be tested (Cumpsty, 1989). Only in the past ten years numerical simulations made it
possible to investigate a larger number of casing treatments and their effects on different
compressors. Many researches were carried out on transonic compressor rotors (Thompson
et al., 1997; Qing et al., 2002; Rabe and Hah, 2002) and the potential of this kind of pas-
sive devices was revealed: a proper treatment can not only widen the stable working range
of a transonic compressor rotor, but also improve its efficiency.
Recently, for instance, Beheshti et al. (2004) conducted a numerical parametric study
of tip clearance coupled with casing treatment for the transonic axial-flow compressor
NASA Rotor 37. Figure 1.13(a) shows the configuration of the solution adopted (circum-
ferential groove) and Figure 1.13(b) depicts the position of the casing treatment with re-

27
spect to one of the compressor rotor blade. It seems that such a casing treatment provides a
means for fluid to exit the flow path where the blade loading is severe, migrate circumfer-
entially, and re-enter the flow path at a location where the pressure is more moderate. This
can lead to stability improvement since the flow relocation helps to relieve the locally se-
vere blade loading. Using this device, the authors showed the possibility to improve both
the efficiency and the stall margin.
On the other side, Wilke and Kau (2004) analyzed the impact of axial slots on the
flow field of a transonic rotor blade row. Figure 1.14 shows a representation of the casing
treatments tested. They consist of four identical axial slots per blade passage and have an
open area of 50% in the circumferential direction. The slots are parallel to the rotation axis
of the rotor and are inclined by 45° against a meridional plane in the direction of blade ro-
tation. The slot shape is designed as a semi-circle. In configuration 1, the position of the
Fig. 1.12 Examples of various casing treatments investigated in the 1970’s. (From the open literature)

28
slots is centered above the rotor blade tip reaching from 7.5% to 92.5% of the chord length.
In configuration 2, the slots are moved upstream so that only 25% of the blade chord
length remains covered by the casing treatment. The study was numerically carried out.
For both configurations, the simulations showed a significant increment in flow sta-
bility near surge compared to the solid wall. It was observed that the stabilizing effects are
based on the positive impact of casing treatments on the tip leakage flow and its resulting
vortex. Configuration 1 leads to a massive destruction of the tip leakage vortex, whereas
configuration 2 weakens the rolling-up of the tip leakage flow. Configuration 2, gave also a
positive impact on the overall efficiency.
Configuration 1 Configuration 2
Fig. 1.14 Casing treatments (from Wilke and Kau, 2004).
Fig. 1.13 Casing treatments (from Beheshti et al., 2004).

29
Tip injection
Mass flow injection at the tip endwall region of a high-speed axial compressor rotor
is a stability enhancement approach which can be effective in suppressing stall in tip-
critical rotors.
Numerical simulations and experimental measurements conducted by Suder et al.
(2001) showed that the range extension can be achieved by injecting air through discrete
wall jets upstream of the tip region in a transonic rotor operating in isolation (Fig. 1.15).
The analysis was conducted for a range of injection rates and distributions of injectors
around the annulus. It was observed that tip injection can help to decrease incidence and
blade loading at the tip, allowing increased loading at lower blade spans before the blade
stalls. With tip injection present, the blade stalls when the loading at the tip reaches the
level equal to that for which the blade stalls with no injection.
Beheshti et al. (2006) presented a state of the art design for the blade tip injection.
The design includes the means to inject high pressure air jet directly into a circumferential
groove formed in the casing over the blade tip (Fig. 1.16). Different injection mass flow
rates and injection angles were considered in order to explore the key role parameters for
Fig. 1.15 Casing-mounted injector (from Suder et al., 2001).

30
Fig. 1.16 Tip injection design (from Beheshti et al., 2006).
an optimum design. Compared to classical designs for casing-mounted injectors (Fig.
1.15), this design can lead to more advantageous effects on the compressor stability, thanks
to the direct injection of flow over the rotor tip. It was observed that the air injected can
beneficially affect the stall margin by energizing the decelerated flow which arises down-
stream the shock-vortex interaction point at low flow operating conditions (a detrimental
flow feature associated with the flow phenomenon illustrated in Fig. 1.7). It was also ob-
served that for a constant injection mass flow rate the stall margin enhancement is the
highest when the injected air in the rotating frame is set aligned with the camber line at the
blade leading edge.
A natural and intended follow on to the development of tip injection technology is to
couple the injectors to a high pressure bled source within the compression system rather
than providing injection by an external air source (as supposed in previous examples). This
solution is commonly referred to as “endwall recirculation”. The idea of endwall recircula-
tion is certainly not new and is schematically presented in Fig. 1.17. Both rotor recircula-
tion (confined to the rotor tip region) and stage recirculation (which can encompass one or
multiple stages) were investigated by Strazisar et al. (2004) and Hathaway (2000, 2002).
These two endwall recirculation concepts present some advantages and disadvan-
tages in terms of design trades. Compared to the rotor recirculation, some advantages of
the stage recirculation are the higher pressure and the reduced swirl of the bled fluid flow

31
downstream the stator. A disadvantage of stage recirculation is finding an appropriate re-
circulation path to circumvent the casing hardware. On the other hand, the main advantage
of the rotor recirculation is that it can be more easily integrated with the case, while its
biggest disadvantages are that the injector supply pressure is limited by the rotor tip pres-
sure rise and that the high rotor exit swirl must be removed in an efficient compact flow
path. In both cases, the air can be injected upstream of the rotor tip (thereby reducing the
rotor tip incidence) or it can be directly targeted at the rotor tip leakage flow (or other flow
feature considered detrimental for rotor stability).
An important characteristic of endwall recirculation concept is that it removes fluid
from the power stream, thereby preventing it from passing through the combustor and tur-
bine where it would otherwise produce thrust. It is therefore evermore important to reduce
the mass flow rate of the recirculated air as it can adversely impact on aircraft gas turbine
performance.
Fig. 1.17 Endwall recirculation.
Stage recirculation Rotor recirculation

32
33
CHAPTER 2
NASA Rotor 37: numerical modeling and vali-
dation
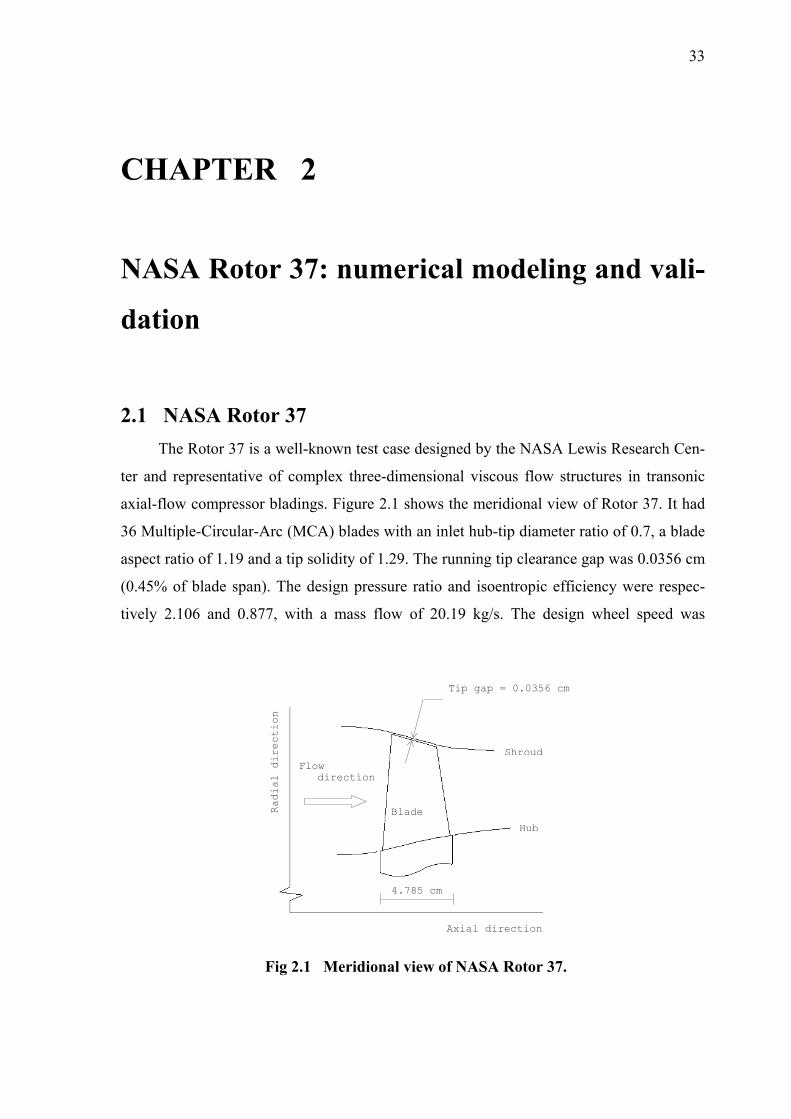
2.1 NASA Rotor 37
The Rotor 37 is a well-known test case designed by the NASA Lewis Research Cen-
ter and representative of complex three-dimensional viscous flow structures in transonic
axial-flow compressor bladings. Figure 2.1 shows the meridional view of Rotor 37. It had
36 Multiple-Circular-Arc (MCA) blades with an inlet hub-tip diameter ratio of 0.7, a blade
aspect ratio of 1.19 and a tip solidity of 1.29. The running tip clearance gap was 0.0356 cm
(0.45% of blade span). The design pressure ratio and isoentropic efficiency were respec-
tively 2.106 and 0.877, with a mass flow of 20.19 kg/s. The design wheel speed was
4.785 cm
Tip gap = 0.0356 cm
Flow direction
Radial direction
Axial direction
Blade
Shroud
Hub
Fig 2.1 Meridional view of NASA Rotor 37.

34
17,188.7 rpm (1800 rad/s), with a nominal tip speed of 454 m/s.
The Rotor 37 was designed and initially tested in the 1970’s as part of a research pro-
gramme involving four axial-flow compressor stages; one of them, the Stage 37, involved
actually the Rotor 37. These stages were intended to cover a range of design parameters
typical of aircraft turbine engine high-pressure (core) compressor inlet stages. Some design
information and overall performance of Stage 37 came from Reid and Moore (1978). More
detailed measurement data were successively provided by Moore and Reid (1980).
Next to the tests of Moore and Reid (1980), the rotor (the Rotor 37) of Stage 37 was
tested again as an isolated component. A brief description of the related test facility was
given by Suder et al. (1995), and Suder and Celestina (1996). Figure 2.2 shows the axial
location of some measurement stations. Measurement results are available in many pub-
lished research works and were used here to validate a three-dimensional RANS (Rey-
nolds-averaged Navier-Stokes) model for the Rotor 37 and, more in general, for transonic
compressor rotors.
Figure 2.3 shows the Rotor 37 measured speed line at the design wheel speed in the
form of total pressure ratio P4/Pref and adiabatic efficiency, against the normalized mass
flow rate. The adiabatic efficiency was calculated as follows:
Fig. 2.2 Axial location of measurement stations.

35
1TT
1PP
1
4
k1k
1
4
−
−⎟⎟⎠
⎞⎜⎜⎝
⎛
=
−
η (2.1)
The subscripts “1” and “4” indicate the measurement sections (Figure 2.2), while the sub-
script “ref” indicates the corresponding sea-level standard atmosphere value (Pref = 101325
Pa). The mass flow rates were normalized using the mass flow rate at the choking condi-
tion. Measurements provided a choking mass flow of 20.93 ± 0.14 kg/s.
Figure 2.4 shows the spanwise distributions of pitchwise mass-averaged performance
at Station 4 for 98% of choking mass flow (Tref = 288.15 K). It is possible to observe a se-
vere reduction of isoentropic efficiency over the 80% span, associated with a considerable
1,90
1,95
2,00
2,05
2,10
2,15
2,20
0,92 0,93 0,94 0,95 0,96 0,97 0,98 0,99 1,00
Normalized mass flow
P4/P
ref
1800 rad/s
0,80
0,82
0,84
0,86
0,88
0,90
0,92
0,92 0,93 0,94 0,95 0,96 0,97 0,98 0,99 1,00
Normalized mass flow
Adi
abat
ic e
ffici
ency
1800 rad/s
Fig. 2.3 Measured speed line of Rotor 37 (data from AGARD (1998)).
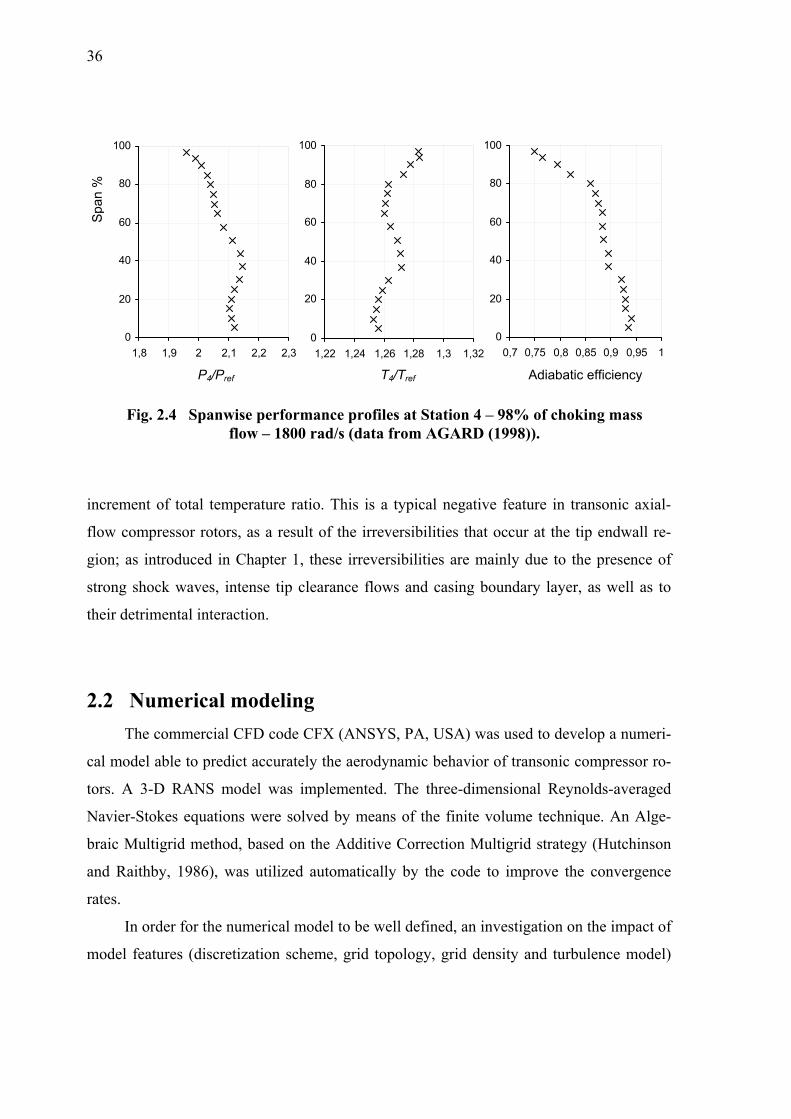
36
increment of total temperature ratio. This is a typical negative feature in transonic axial-
flow compressor rotors, as a result of the irreversibilities that occur at the tip endwall re-
gion; as introduced in Chapter 1, these irreversibilities are mainly due to the presence of
strong shock waves, intense tip clearance flows and casing boundary layer, as well as to
their detrimental interaction.
2.2 Numerical modeling The commercial CFD code CFX (ANSYS, PA, USA) was used to develop a numeri-
cal model able to predict accurately the aerodynamic behavior of transonic compressor ro-
tors. A 3-D RANS model was implemented. The three-dimensional Reynolds-averaged
Navier-Stokes equations were solved by means of the finite volume technique. An Alge-
braic Multigrid method, based on the Additive Correction Multigrid strategy (Hutchinson
and Raithby, 1986), was utilized automatically by the code to improve the convergence
rates.
In order for the numerical model to be well defined, an investigation on the impact of
model features (discretization scheme, grid topology, grid density and turbulence model)
0
20
40
60
80
100
0,7 0,75 0,8 0,85 0,9 0,95 10
20
40
60
80
100
1,22 1,24 1,26 1,28 1,3 1,320
20
40
60
80
100
1,8 1,9 2 2,1 2,2 2,3
Span
%
P4/Pref T4/Tref Adiabatic efficiency
Fig. 2.4 Spanwise performance profiles at Station 4 – 98% of choking mass flow – 1800 rad/s (data from AGARD (1998)).

37
Inlet block
Passage block Outlet block
Fig. 2.5 Computational domain (Model 3) – TurboGrid (ANSYS, PA, USA).
on the accuracy of predictions was carried out. This was done simulating the flow field of
Rotor 37 using five different models (see Table 2.1) and comparing predictions with ex-
perimental data available in literature. Comparisons were made in terms of both rotor per-
formance (performance maps and downstream radial profiles) and internal flow features
(Mach number distributions, tip clearance flows, blade wakes etc.).
For each model, a multi-block structured grid was used to discretize the computa-
tional domain (Figure 2.5). The computational domain regards a single blade passage (pe-
riodic boundary conditions were applied on the lateral faces). Inlet and outlet boundaries
correspond to Station 1 and Station 4 of Figure 2.2 respectively. The total pressure, total
temperature, and absolute flow angle of the incoming flow were fixed at the inlet bound-
ary, while the average static pressure of the delivered flow was imposed at the outlet (the
boundary pressure profile is a result of the computation). In order to reproduce the bound-
ary conditions of the above mentioned Rotor 37 test facility (Suder et al., 1995; Suder and
Celestina, 1996), which provided the experimental data used here, the inlet total pressure
and total temperature were fixed at P1 = 101325 Pa and T1 = 288.15 K. The tip clearance

38
gap was modeled (Figure 2.6) including the relative motion between the rotor and the cas-
ing. The walls were treated as smooth and adiabatic. An angular velocity corresponding to
the nominal rotational speed of Rotor 37 was applied. For each simulation, the conver-
gence criterion was established when normalized RMS (root mean square) residuals were
less than 10-6.
Table 2.1 gives the main features of the five models tested. As shown, two different
discretization schemes, among those implemented in the code, were considered: the con-
ventional Upwind Differencing Scheme (UDS) in Model 1 and the more accurate Modified
Tab. 2.1 Models tested.
Model No. Discretiz. scheme
Passage grid
topology
Cells number
Turbul. model
1 UDS+PAC H/O grid 500,000 ca. k-ε
2 LPS+PAC H/O grid 500,000 ca. k-ε
3 LPS+PAC J/O grid 500,000 ca. k-ε
4 LPS+PAC J/O grid 1,000,000 ca. k-ε
5 LPS+PAC J/O grid 1,200,000 ca. SST k-ω
Fig. 2.6 Tip gap grid near the leading edge (Model 1).
39
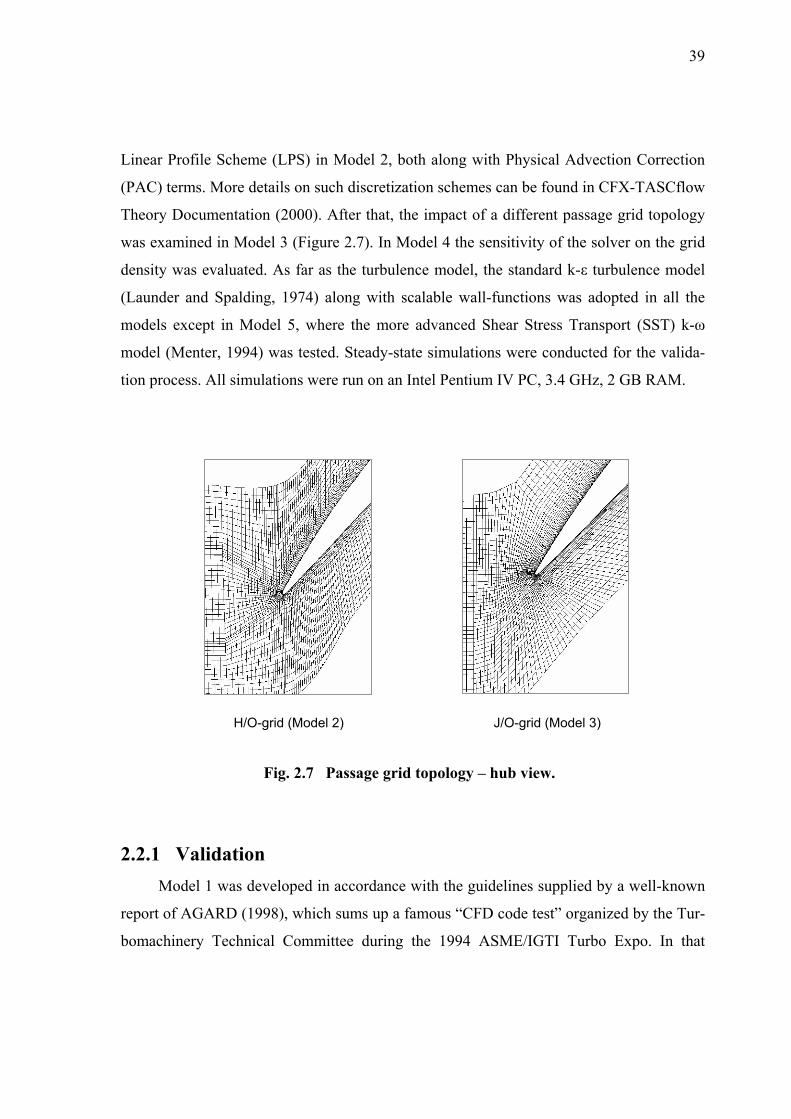
Linear Profile Scheme (LPS) in Model 2, both along with Physical Advection Correction
(PAC) terms. More details on such discretization schemes can be found in CFX-TASCflow
Theory Documentation (2000). After that, the impact of a different passage grid topology
was examined in Model 3 (Figure 2.7). In Model 4 the sensitivity of the solver on the grid
density was evaluated. As far as the turbulence model, the standard k-ε turbulence model
(Launder and Spalding, 1974) along with scalable wall-functions was adopted in all the
models except in Model 5, where the more advanced Shear Stress Transport (SST) k-ω
model (Menter, 1994) was tested. Steady-state simulations were conducted for the valida-
tion process. All simulations were run on an Intel Pentium IV PC, 3.4 GHz, 2 GB RAM.
2.2.1 Validation
Model 1 was developed in accordance with the guidelines supplied by a well-known
report of AGARD (1998), which sums up a famous “CFD code test” organized by the Tur-
bomachinery Technical Committee during the 1994 ASME/IGTI Turbo Expo. In that
Fig. 2.7 Passage grid topology – hub view.
H/O-grid (Model 2) J/O-grid (Model 3)

40
event, both CFD users and developers were invited to submit numerical solutions for a
“blind test case” to the organizers; the test case was actually the Rotor 37.
Model 1 provided satisfactory predictions of overall rotor performance. The grid had
about 500,000 hexahedral cells clustered near the walls, giving a y+[1] at the walls ranging
from 20 to 300. The blade tip gap region was model using 8 cells in the spanwise direction
(Figure 2.6). Calculations gave a choking mass flow rate of 20.64 kg/s, against the meas-
ured value of 20.93 ± 0.14 kg/s. The choking operating condition was run by imposing a
low back pressure. Figure 2.8 compares the calculated and measured performance down-
stream profiles at 98% normalized mass flow (that is, 98% of choking mass flow). In this
work, the calculated mass flows were normalized using the choking mass flow rate pre-
dicted by the respective model, as well as the experimental mass flows were normalized
[1] Yplus (y+) is the dimensionless distance from the wall. It is used to check the location of the first node away from a wall. This was more important when standard wall-functions were used, as one had to avoid y+ values smaller than approximately 20. With the scalable wall-functions, these values are only provided for in-formation on the near-wall resolution.
1.8 2 2.20
20
40
60
80
100
Total pressure ratio
Spa
n (%
)
CFDExp
1.1 1.2 1.3 1.40
20
40
60
80
100
Total temperature ratio0.6 0.8 10
20
40
60
80
100
Adiabatic efficiency
Fig. 2.8 Performance radial profiles at Station 4. (98% choking mass flow – Model 1)
41
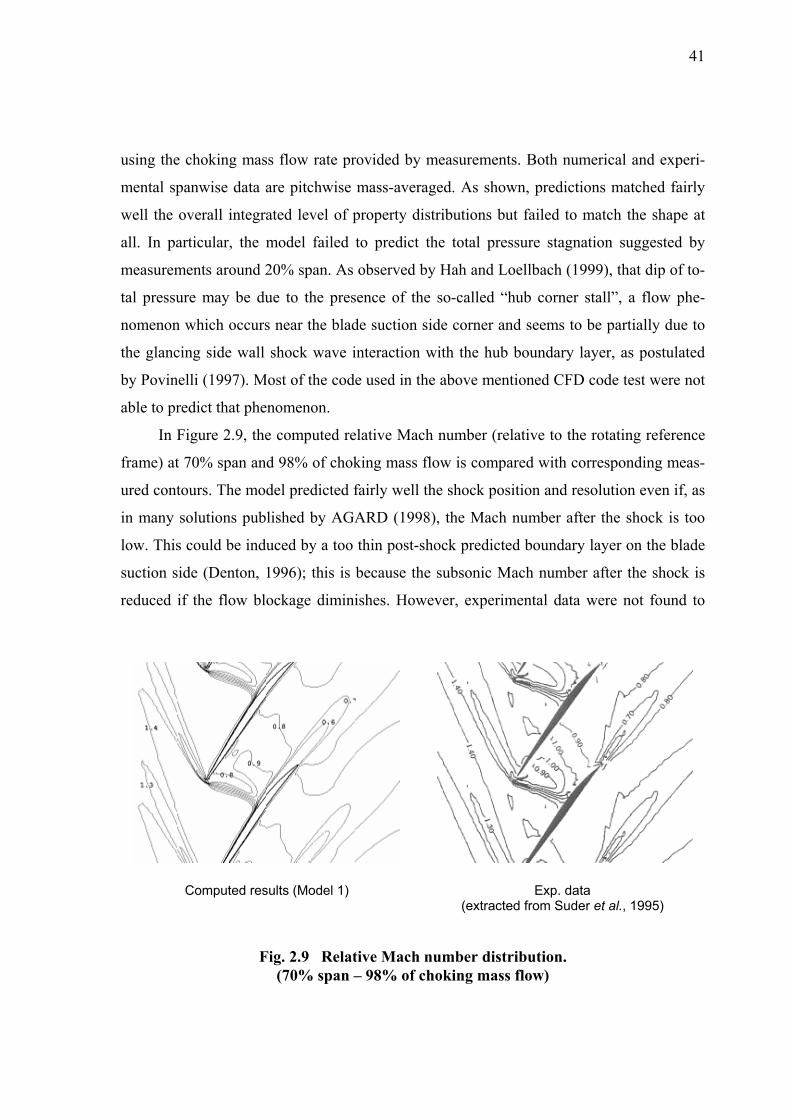
Computed results (Model 1) Exp. data (extracted from Suder et al., 1995)
Fig. 2.9 Relative Mach number distribution. (70% span – 98% of choking mass flow)
using the choking mass flow rate provided by measurements. Both numerical and experi-
mental spanwise data are pitchwise mass-averaged. As shown, predictions matched fairly
well the overall integrated level of property distributions but failed to match the shape at
all. In particular, the model failed to predict the total pressure stagnation suggested by
measurements around 20% span. As observed by Hah and Loellbach (1999), that dip of to-
tal pressure may be due to the presence of the so-called “hub corner stall”, a flow phe-
nomenon which occurs near the blade suction side corner and seems to be partially due to
the glancing side wall shock wave interaction with the hub boundary layer, as postulated
by Povinelli (1997). Most of the code used in the above mentioned CFD code test were not
able to predict that phenomenon.
In Figure 2.9, the computed relative Mach number (relative to the rotating reference
frame) at 70% span and 98% of choking mass flow is compared with corresponding meas-
ured contours. The model predicted fairly well the shock position and resolution even if, as
in many solutions published by AGARD (1998), the Mach number after the shock is too
low. This could be induced by a too thin post-shock predicted boundary layer on the blade
suction side (Denton, 1996); this is because the subsonic Mach number after the shock is
reduced if the flow blockage diminishes. However, experimental data were not found to

42
1.2 1.25 1.30
20
40
60
80
100
Total temperature ratio1.8 2 2.2
0
20
40
60
80
100
Span
(%)
Total Pressure Ratio
ModelNo. 1
ModelNo. 2
ModelNo. 3
Exp
Fig. 2.10 Performance radial profiles at Station 4 (98% of choking mass flow).
Fig. 2.11 Influence of grid topology. (CFD relative Mach number contours – 98% of choking mass flow – 70% span)
Model 2 – H/O-grid Model 3 – J/O-grid
confirm this hypothesis.
Model 1 required about 600 iterations to reach the convergence criterion, taking
about 10 hours and using about 0.7 GB RAM.

43
The use of a more accurate discretization scheme (adopted in Model 2) did not pro-
vide substantial improvements in predictions. Performance downstream profiles (Figure
2.10) and interblade relative Mach number distribution (Figure 2.11 left) are very similar
to the corresponding ones of Model 1. However, it is possible to note a slightly less
smeared and better defined shock front (cf. Figures 2.9 left and 2.11 left).
With respect to Model 2, Model 3 is characterized by a more regular and less skewed
passage grid. This led to better predictions. As shown in Figure 2.10, the computed span-
wise profile of total pressure ratio matches rather well the experimental data. In addition,
with respect to the two previous models, a better agreement with measured Mach number
contours was obtained (cf. Figures 2.9 right and 2.11 right). This model predicted a chok-
ing mass flow rate of 20.96 kg/s against the experimental value of 20.93 kg/s.
Compared to Model 3, Model 4 is characterized by a finer grid of about 1,000,000
cells, while all the other features were kept constant. Model 4 computed the same choking
mass flow of Model 3. As shown in Figure 2.12, changes in the calculated performance
profiles due to the grid refinement are negligible. The predicted Mach number distribution
is also similar to that of Model 3 (cf. Figures 2.11 right and 2.13 left). This does not mean
that grid density is not important for the accuracy of a CFD solution, but only that a finer
0
20
40
60
80
100
1,2 1,25 1,3
Total Temperature Ratio
0
20
40
60
80
100
1,8 2 2,2
ModelNo. 3ModelNo. 4
ModelNo. 5Exp
Total Pressure Ratio
Spa
n (%
)
Fig. 2.12 Performance radial profiles at Station 4 (98% of choking mass flow).

44
grid is not necessary in Model 3, at least for a preliminary prediction of overall rotor be-
havior.
Finally, the Shear Stress Transport k-ω turbulence model, designed to give highly
accurate predictions of the onset and the amount of flow separation under adverse pressure
gradients, was adopted and tested in Model 5. A grid similar to that of Model 4 was used,
but refined at the walls to have a near-wall grid resolution of at least y+ < 1, needed to
guarantee a strict low-Reynolds number model implementation. Automatic near-wall treat-
ment, which switches from low-Reynolds near-wall formulation to scalable wall-functions
as the mesh is not sufficiently refined, was also adopted. Model 5 provided correctly the
choking flow rate but underestimated the total pressure ratio at 98% of choking mass flow,
as shown in Figure 2.12. The relative Mach number distribution was instead well pre-
dicted. Figure 2.13 (right) shows a good agreement with measurement data (Figure 2.9
right), especially after the shock, where previous models failed. This model took about 24
hours to reach the convergence criterion, using about 1.7 GB RAM.
Model 4 (k-ε) Model 5 (SST k-ω)
Fig. 2.13 Influence of turbulence model. (CFD relative Mach number contours – 98% of choking mass flow – 70% span)

45
Fig. 2.14 Calculated and measured adiabatic efficiency (Rotor 37).
0,80
0,82
0,84
0,86
0,88
0,90
0,90 0,92 0,94 0,96 0,98 1,00
Exp
Model 3
Model 5
Normalized mass flow
Adi
abat
ic e
ffici
ency
1800 rad/s
Among the five models evaluated, Model 3 and Model 5 can be considered the most
interesting ones. The first one showed fairly good predictions of overall rotor behavior, re-
quiring no excessive computing resources; it can be used for a preliminary prevision of
overall performance. The second one seems to predict more accurately the internal flow
features of a transonic flow field and could be used for detailed flow analyses. Model 3 and
Model 5 were validated more in detail in the following.
Measured and calculated maps of adiabatic efficiency are shown in Figure 2.14. The
calculated operating points were obtained by varying the back pressure. The lower mass
flow operating point in the predicted speed lines corresponds to the last point for which the
steady-state model implemented was able to converge (a further increment of about 500 Pa
in the back pressure boundary condition leads to a not converging solution). As shown,
Model 5 underestimated the overall efficiency along the entire operating range, while
Model 3 only around the peak efficiency condition. At 98% normalized mass flow, Model
5 and Model 3 gave an efficiency of 0.858 and 0.866 respectively, against the experimental
value of 0.879. The working range was slightly overestimated by both models.
Figure 2.15 compares the computed and experimental relative Mach number distribu-
tions at the 70% span for a low flow operating condition (about 93% normalized mass
flow). Model 3 provided slightly low values of Mach number after the shock; Model 5
gave a very realistic prediction.

46
Fig. 2.15 Contours of relative Mach number at 70% span. Low flow operating condition.
Model 3 calculations
Model 5 calculations
Experimental data (from Suder, 1998).

47
Fig. 2.16 Normalized axial velocity (95% span – 98% of choking mass flow).
Model 3 calculations
Model 5 calculations
Experimental data (from Chima, 1998)

48
Figure 2.16 shows the calculated and measured contours of normalized axial velocity
(normalized using blade tip velocity) at 95% span for the 98% of choking mass flow. The
agreement with experimental results is quite good for both Model 3 and Model 5.
Figure 2.17 compares the computed and experimental relative Mach number at 95%
span, Station 2 (located at 20% of profile chord from leading edge) and 98% normalized
mass flow. Some disagreements in the profile shape and shock location can be observed
between numerical and experimental data. As underlined by Chima (1998), at 95% span
the fluid is well within the casing boundary layer and computations are, probably, strongly
influenced by approximations due to current turbulence modeling in RANS computations.
0,2
0,4
0,6
0,8
1,0
1,2
1,4
1,6
1,8
0 20 40 60 80 100
Pitch [%]
M odel No. 3
M odel No. 5
Exp
Fig. 2.17 Blade-to-blade relative Mach number (exp data extracted from Chima (1998)). (98% choking flow rate – 95% span – Station 2)
Rel
ativ
e M
ach
num
ber
49
CHAPTER 3
Aerodynamic sweep and lean: overall impact
3.1 Introduction
As introduced in Chapter 1 (Section 1.3), the application of a three-dimensional cur-
vature to the blade stacking line (in other words, sweep and lean) can have considerable ef-
fects on the overall performance of a transonic compressor rotor. In this chapter, a system-
atic numerical investigation was conducted to better understand the impact of sweep and
lean on the aerodynamic behavior of these rotors, with particular regard to the overall effi-
ciency. That being stated, the following specification is now needed. As shown in Section
1.3 (see Figure 1.8), a common choice in compressor community is to define sweep the
movement of blade sections along the local chord direction and lean the change in the per-
pendicular direction. In the present work, instead, sweep and lean were defined relative to
the axial and tangential directions respectively (Figure 3.1). In this way, the effects induced
by the use of a stacking line curved in the meridional plane and/or in the circumferential
plane were analyzed, leading to the definition of another point of view on the study of the
influence of blade shape in transonic compressor rotors. Clearly, following results can not
be directly compared with those obtained starting from the common definition of sweep
and lean.
3.2 Investigated rotor geometries
New swept and leaned rotors were modeled starting from the baseline radially-
stacked Rotor 37 (see Chapter 2), by changing the curvature of the original stacking line in
the meridional and circumferential plane respectively. As schematically shown in Figure

50
3.2, the radial stacking line of Rotor 37 (the solid vertical line) was systematically modi-
fied by moving three control points (located on 33%, 67% and 100% span from the hub,
signed as black circles) on predefined positions (the x-marked locations)[1]. All possible
combinations were considered (26 for sweep and 26 for lean). Dashed lines represent some
of all the new stacking lines so obtained. Figures 3.3(a) and 3.3(b) show, for instance, the
blades obtained using the stacking lines signed as “A” and “B” in Figure 3.2 respectively.
Being the radial position of casing line not constant along the axial direction and the
tip endwall region characterized by very complex flow structures, it was preferred not to
change the meridional position of the tip blade profile, with the aim to avoid any other
variables of influence. Therefore, the curvature of the new swept stacking lines was ap-
plied to the blade starting always from the tip section instead from the hub section, as
shown in Figure 3.4 for the swept stacking line “C” of Figure 3.2.
As shown in Figure 3.1, the adjective of “forward” was given to lean when the blade
is skewed toward the direction of rotation and to sweep when the blade is curved upstream.
[1] The positions where to move the control points (the x-marked locations in Figure 3.2) were chosen with the aim to give the blade a reasonable curvature, that is a curvature not excessively pronounced but able to impact noticeably on the flow field.
Fig. 3.1 Sweep and lean definition used in this work.

51
MERIDIONAL PLANESweep
Upstream Downstream
0
20
40
60
80
100
-0,8 -0,4 0 0,4 0,8
Axial displacement [cm]
Spa
n %
Rotor 37 stacking line
Control points can be moved on corresponding x-marked locations
New swept stacking lines
A
C
CIRCUMFERENTIAL PLANELean
0
20
40
60
80
100
-3 -1 1 3
Tangential displacement [deg]
Spa
n % New leaned
stacking lines
B
Direction of rotation
D
Fig. 3.2 Swept and leaned stacking line definition.
Meridional view
Rotor 37 New swept rotor
Application of new stacking line
New leaned rotor
Rotor 37
Front view
Application of new stacking line
Fig. 3.3(a) Application of swept stacking line “A” of Figure 3.2.
Fig. 3.3(b) Application of leaned stacking line “B” of Figure 3.2.

52
MERIDIONAL PLANESweep
Upstream Downstream
0
20
40
60
80
100
-0,8 -0,4 0 0,4 0,8
Axial displacement [cm]
Spa
n %
Curvature definition
Curvature application
Fig. 3.4 The curvature of new swept stacking lines was applied to the origi-nal blade maintaining the axial position of tip profile.
3.3 Aerodynamic impact
All the modeled rotors were simulated using the numerical model identified as
“Model 3” in Chapter 2 (see Table 2.1). As shown in Chapter 2, the model was success-
fully validated.
Steady-state simulations were conducted imposing the same static pressure (129000
Pa) at the outlet boundary of each modeled rotor. Even if this is not the appropriate bound-
ary condition for consistently comparing the performance of different designs (each rotor
can be at a different aerodynamic loading level), this approach makes it possible a direct
comparison with the baseline rotor performance (Figure 3.6).
Figure 3.6 compares the predicted efficiency of each new rotor to the computed one
of Rotor 37 at the same normalized mass flow. For each rotor, the mass flow was normal-
ized using the corresponding computed choking mass flow rate. For completeness, Figure
3.7 shows the predicted choking mass flow rate of different designs. The rotors named as
“others” in Figures 3.6 and 3.7 correspond to those modeled rotors which can not simply
Flow direction
Baseline blade
Swept blade

53
classified as “forward or backward curved”, such as the rotor derived from the application
of stacking line “D” in Figure 3.2.
An observation is important at this point about sweep application. When swept rotors
were modeled, no attempt was made to redesign the blade profiles at each stack option to
retain the cascade area ratios of Rotor 37 in terms of throat margin (ratio of the throat area
to the upstream inlet area, see Figure 3.5), internal contraction (ratio of the throat area to
the mouth area) and effective camber (ratio of the throat area to the discharge area). Each
cascade area of Figure 3.5 is to be considered as a quasi-three-dimensional flow area, that
is the product of the two-dimensional passage width times a streamtube lamina thickness
determined from an axisymmetric flow calculation. The cascade area ratios above men-
tioned can have a considerable influence on transonic airfoil performance (Wadia and Co-
penhaver, 1996) and can be significantly altered by sweep application. The idea is to obtain
a first overview of performance of modeled swept rotors and adjust, if it is worthwhile do-
ing it, the most promising of them later, according to the procedure suggested by Wadia
and Copenhaver (1996). Therefore, while the results in Figure 3.6(b) can be considered a
direct consequence of the stacking line shape (no changes in cascade area ratios are in-
duced by the application of lean), the perceived performance changes with the swept rotors
(Figure 3.6(a)) could not be an effect of blade curvature only.
Fig. 3.5 Definition of cascade areas (from Wadia and Copenhawer, 1996).

54
In Figure 3.6(a), all the rotors with a blade regularly curved downstream (aft swept)
are marked with red triangles, while blue rhombuses indicate all the rotors with a blade sig-
nificantly turned upstream (forward swept). Among swept rotors, the highest efficiencies
were obtained by the aft swept rotors, which showed an efficiency of about 0.5-0.6%
higher than that of Rotor 37 considering the same working condition. They gave also the
highest choking mass flows, up to 4% higher compared to that of baseline rotor. Similar
results were obtained by Abdelhamid et al. (1998). The application of forward sweep, in-
stead, did not provide substantial improvements in the overall efficiency, inducing also a
significant reduction of choking mass flow.
Forward leaned rotor blades (light blue square in Figure 3.6(b)) showed the most
promising results. Some of them gave an efficiency increment of 1.2% with respect to the
baseline blade. Backward leaned curvature, instead, was detrimental in most cases (pink
rhombuses). All the leaned rotors produced a choking mass flow very similar to that of Ro-
tor 37 (see Figure 3.7).
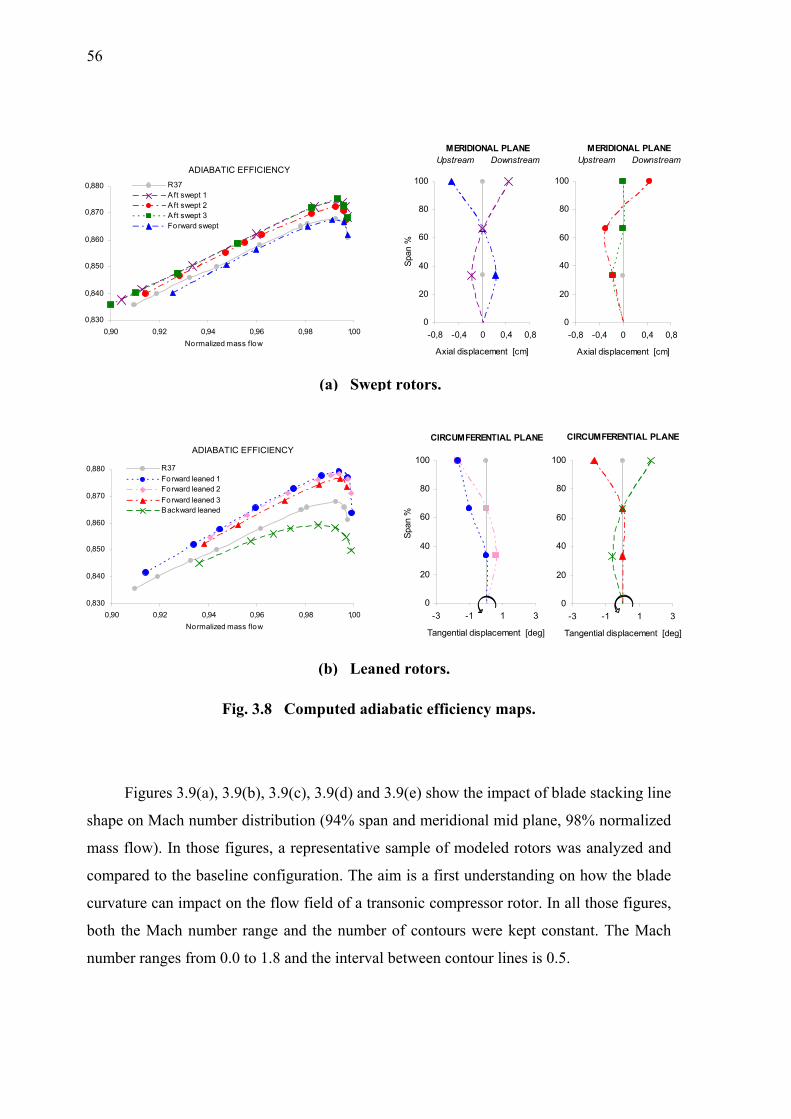
The aerodynamic behavior of the most interesting rotors (including the most promis-
ing rotors) was then simulated imposing different values of back pressure. Figure 3.8
shows some of the efficiency maps so obtained. For each map, the lower mass flow operat-
ing point corresponds to the last point for which the steady-state model implemented was
able to converge. Note the impact of sweep and lean on the operating range. The possibil-
ity to widen the operating range using blade curvature will be argued in Chapter 4 (Section
4.2). As far as the overall efficiency, Figure 3.8 confirms observations made about Figure
3.6. Note the efficiency improvements induced using forward lean. Note also the disap-
pointing performance shown by the selected forward swept rotor. In general, all the for-
ward swept rotors did not show promising results. This seems to be in opposition with the
general opinion that forward sweep can improve transonic compressor rotor performance
(Wadia et al., 1998; Hah et al., 1998; Denton and Xu, 2002). Really, this is due to the dif-
ferent definition of “sweep” used here. As underlined in the introduction of this chapter
(Section 3.1), here sweep was defined relative to the axial direction while compressor
community generally defines it relative to the local chord direction. Therefore, a direct
comparison is not possible.

55
Fig. 3.6 Computed adiabatic efficiency (1800 rad/s).
Adi
abat
icef
ficie
ncy
0,830
0,840
0,850
0,860
0,870
0,880
0,90 0,92 0,94 0,96 0,98 1,00
Rotor 37
Forward leaned ro to rs
Backward leaned ro torsOthers
Normalized mass flow
(b) Leaned rotors.
Adi
abat
ic e
ffici
ency
Normalized mass flow
(a) Swept rotors.
0,830
0,840
0,850
0,860
0,870
0,880
0,90 0,92 0,94 0,96 0,98 1,00
Rotor 37
Forward-swept ro tors
Aft-swept ro tors
Others
19,9
20,1
20,3
20,5
20,7
20,9
21,1
21,3
21,5
21,7
Cho
king
flow
rate
[kg/
s]
Rotor 37
Aft-
swep
t
Forw
ard
swep
t
Oth
ers
Backward leaned
Forward leaned
Fig. 3.7 Computed choking mass flows of new designs (1800 rad/s).
56
MERIDIONAL PLANE Upstream Downstream
0
20
40
60
80
100
-0,8 -0,4 0 0,4 0,8
Axial displacement [cm]
Span
%
MERIDIONAL PLANE Upstream Downstream
0
20
40
60
80
100
-0,8 -0,4 0 0,4 0,8
Axial displacement [cm]
p
ADIABATIC EFFICIENCY
0,830
0,840
0,850
0,860
0,870
0,880
0,90 0,92 0,94 0,96 0,98 1,00Normalized mass flow
R37Aft swept 1Aft swept 2Aft swept 3Forward swept
CIRCUMFERENTIAL PLANE
0
20
40
60
80
100
-3 -1 1 3
Tangential displacement [deg]
Span
%
CIRCUMFERENTIAL PLANE
0
20
40
60
80
100
-3 -1 1 3
Tangential displacement [deg]
ADIABATIC EFFICIENCY
0,830
0,840
0,850
0,860
0,870
0,880
0,90 0,92 0,94 0,96 0,98 1,00Normalized mass flow
R37Forward leaned 1Forward leaned 2Forward leaned 3Backward leaned
(a) Swept rotors.
(b) Leaned rotors.
Fig. 3.8 Computed adiabatic efficiency maps.
Figures 3.9(a), 3.9(b), 3.9(c), 3.9(d) and 3.9(e) show the impact of blade stacking line
shape on Mach number distribution (94% span and meridional mid plane, 98% normalized
mass flow). In those figures, a representative sample of modeled rotors was analyzed and
compared to the baseline configuration. The aim is a first understanding on how the blade
curvature can impact on the flow field of a transonic compressor rotor. In all those figures,
both the Mach number range and the number of contours were kept constant. The Mach
number ranges from 0.0 to 1.8 and the interval between contour lines is 0.5.

57
Fig. 3.9(a) Relative Mach number contours – Rotor 37 (98% ch. mass flow).
Blade-to-blade view – 94% span Meridional view – Mid pitch
1.50
0.95
Attached shock
The impact of blade curvature on the three-dimensional shock structure is clearly
visible. As far as the swept rotors (Figures 3.9(b) and 3.9(c)), the applied blade curvatures
impacted considerably on the meridional shape of shock front, which clearly tends to fol-
low the meridional blade leading edge curvature. This shows the possibility to influence
the inclination of shock front to the incoming flow in the meridional plane and, conse-
quently, to act on the shock strength (which depends on both the upstream Mach number
and the angle between the impacting flow direction and the local shock front surface). No
significant changes were instead induced by sweep on the blade-to-blade shock structure
inside the blade passage. It is interesting, however, to underline the impact on the shock
bow departing from the blade leading edge and moving upstream. With respect to the base-
line configuration, its strength is lower when the blade is locally curved upstream (cases (i)
and (ii) of Figure 3.9(b), case (ii) of Figure 3.9(c)) and slightly higher when the blade is lo-
cally curved downstream (case (iii) of Figure 3.9(b), cases (i) and (iii) of Figure 3.9(c)).
As well as the swept rotors, also the leaned rotors (Figures 3.9(d) and 3.9(e)) showed
a meridional shock front considerably influenced by the applied blade curvatures. In the
case of lean, however, this is not due to a change in the meridional blade leading edge
shape (which is equal to that of baseline configuration), but is a direct consequence of a
strong modification of blade-to-blade shock structure.

58
MERIDIONAL PLANESweep
Upstream Downstream
0
20
40
60
80
100
-0,8 -0,4 0 0,4 0,8
Axial displacement [cm]
Span
%
MERIDIONAL PLANESweep
Upstream Downstream
0
20
40
60
80
100
-0,8 -0,4 0 0,4 0,8
Axial displacement [cm]
Span
%
MERIDIONAL PLANESweep
Upstream Downstream
0
20
40
60
80
100
-0,8 -0,4 0 0,4 0,8
Axial displacement [cm]
Span
%
Fig. 3.9(b) Swept rotors.
Blade-to-blade view – 94% span Meridional view – Mid pitch Stacking line
(i)
(ii)
(iii)
Lower strength of bow shock
Higher strength of bow shock
1.50
0.95
1.50
0.95
1.50
0.90 Reduced blade wake

59
MERIDIONAL PLANESweep
Upstream Downstream
0
20
40
60
80
100
-0,8 -0,4 0 0,4 0,8
Axial displacement [cm]
Span
%
MERIDIONAL PLANESweep
Upstream Downstream
0
20
40
60
80
100
-0,8 -0,4 0 0,4 0,8
Axial displacement [cm]
Span
%
MERIDIONAL PLANESweep
Upstream Downstream
0
20
40
60
80
100
-0,8 -0,4 0 0,4 0,8
Axial displacement [cm]
Span
%
Blade-to-blade view – 94% span Meridional view – Mid pitch Stacking line
Fig. 3.9(c) Swept rotors.
(i)
(ii)
(iii)
1.50
0.95
1.50
0.95
1.50
0.95

60
CIRCUMFERENTIAL PLANELean
0
20
40
60
80
100
-3 -1 1 3
Tangential displacement [deg]
Span
%
CIRCUMFERENTIAL PLANELean
0
20
40
60
80
100
-3 -1 1 3
Tangential displacement [deg]
Span
%
CIRCUMFERENTIAL PLANELean
0
20
40
60
80
100
-3 -1 1 3
Tangential displacement [deg]
Span
%
Fig. 3.9(d) Leaned rotors.
Blade-to-blade view – 94% span Meridional view – Mid pitch Stacking line
(i)
(ii)
(iii)
Shock located more downstream
1.50
0.95
1.50
0.95
1.50
0.95
Detached shock

61
CIRCUMFERENTIAL PLANELean
0
20
40
60
80
100
-3 -1 1 3
Tangential displacement [deg]
Span
%
CIRCUMFERENTIAL PLANELean
0
20
40
60
80
100
-3 -1 1 3
Tangential displacement [deg]
Span
%
CIRCUMFERENTIAL PLANELean
0
20
40
60
80
100
-3 -1 1 3
Tangential displacement [deg]
Span
%
Blade-to-blade view – 94% span Meridional view – Mid pitch Stacking line
Fig. 3.9(e) Leaned rotors.
(i)
(ii)
(iii)
1.50
0.95
1.50
0.95
1.50
0.95

62
shape (which is equal to that of baseline configuration), but is a direct consequence of a
considerable modification of blade-to-blade shock structure. In fact, when the blade is lo-
cally curved toward the direction of rotor rotation (see cases (i) and (ii) of Figure 3.9(d),
case (ii) of Figure 3.9(e)) the shock undergoes a turning toward a more oblique pattern on
the blade-to-blade view and then turns again, becoming orthogonal to the suction surface
of the adjacent profile. Instead, when the blade is contrarily curved (case (iii) of Figure
3.9(d), cases (i) and (iii) of Figure 3.9(e)) the blade-to-blade shock front moves slightly up-
stream, detaching from the blade leading edge. All this impacts on the blade-to-blade
shock location and, consequently, on the meridional shock shape. Note also the impact of
lean on the shock bow that develops outside the vanes. It does not appear when the blade is
curved toward the direction of rotor rotation, while becomes stronger when the blade is
contrarily curved.
A strong impact of blade stacking line curvature on blade wakes was also observed.
At 94% span, for instance, a significant reduction of wideness and deepness of blade wake
was observed in locally aft swept rotors (case (iii) of Figure 3.9(b) and cases (i) and (iii) of
Figure 3.9(c)) and locally forward leaned rotors (cases (i) and (ii) of Figure 3.9(d), case (ii)
of Figure 3.9(e)).
In short, the applied blade curvatures showed a significant impact on the flow field of
Rotor 37. As described above, the three-dimensional shock structure was considerably in-
fluenced and a significant impact on blade wakes was also observed. Both shock and blade
wakes are source of entropy and induce aerodynamic losses, therefore changes in their
structure can have a great influence on rotor performance. Effectively, a noticeable impact
on overall efficiency was observed. Forward lean and aft sweep, in particular, allowed to
obtain significant increments in the rotor efficiency, up to 1.2 percentage points at the de-
sign working condition.
In the first part of Chapter 4 (Section 4.1), the aerodynamic behavior of some swept
and leaned blades will be analyzed in detail with the aim to understand the relationships
between the induced changes in the flow field and the calculated overall efficiency, as well
as to investigate the aerodynamic reasons for the induced flow changes.

63
3.4 Structural impact Sweep and lean were investigated also from the structural point of view. The struc-
tural behavior of two among the most promising rotor blades (a leaned one and a swept one
which showed good aerodynamic performance) was numerically calculated. Figure 3.10
shows the geometry of the selected blades.
0
20
40
60
80
100
-0,8 -0,4 0 0,4 0,8
Meridional plane Upstream Downstream
Axial displacement [cm]
Spa
n %
Stacking line of
new swept rotor
R37 original
stacking line
Meridional view
Rotor 37 Swept rotor
0
20
40
60
80
100
-3 -1 1 3
Spa
n %
Tangential displacement [deg]
Circumferential plane
Stacking line of
new leaned rotor
R37 original
stacking line
Direction of rotation
Rotor 37 Leaned rotor
Front view
Fig. 3.10 Swept (top) and leaned (bottom) selected blades for FEM analysis.

64
Fig. 3.11 Blade FEM mesh (Rotor 37).
Meridional view
The structural behavior of the selected blades was compared to that of baseline con-
figuration at the design operating condition (98% normalized mass flow, 1800 rad/s). The
FEM package “ANSYS Structural” was used. Both static and modal responses were evalu-
ated. A mapped mesh with hexahedral-shaped (brick) elements was utilized (Figure 3.11).
Both aerodynamic and centrifugal loads were considered in the analysis. No displacements
were permitted at the hub section.
A predefined unidirectional “ANSYS CFX” to “ANSYS Structural” load transfer
method was utilized to transfer the static pressure distribution around the blade (calculated
Fig. 3.12 One-way fluid-structure interface.
FEM mesh CFD mesh

65
Table 3.1 – Computed natural frequencies (Hz).
using Model 3 of Table 2.1) from the CFD mesh to the FEM mesh of the structural model
(Figure 3.12).
First of all, the computed modal response of selected blades was compared to that of
baseline blade. The analysis did not show significant changes due to the applied blade cur-
vatures in the vibration natural frequencies (Table 3.1) or in vibration mode shapes (not re-
ported here for brevity).
A considerable impact of blade curvature on the structural behavior was instead ob-
served in terms of static response. Differently from the baseline blade, both the swept blade
and the leaned blade showed a central region characterized by high values of Von Mises
stress. This is shown in Figures 3.13 and 3.14.
It was observed that the blade curvature has not a significant impact on the static re-
sponse if the pressure load is the only load applied. Therefore, the structural behavior
shown by new blades in Figures 3.13 and 3.14 is due fundamentally to the action of cen-
trifugal load. The phenomenon can be simply explained as follows. If the blade is radially-
stacked, such as the baseline blade, the centrifugal load gives rise to a tensile stress only;
but if the blade is curved, such as the new blades analyzed, the centrifugal load gives rise
to both a tensile stress and a bending stress (Figure 3.15). In transonic compressor rotors
the centrifugal load is very strong (due to the high blade tip velocity) and considerable
bending stresses can arise, leading to the static structural response shown in Figures 3.13
Mode number Baseline blade Swept blade Leaned blade
1 827 784 774
2 2320 2047 2131
3 2962 2829 2907
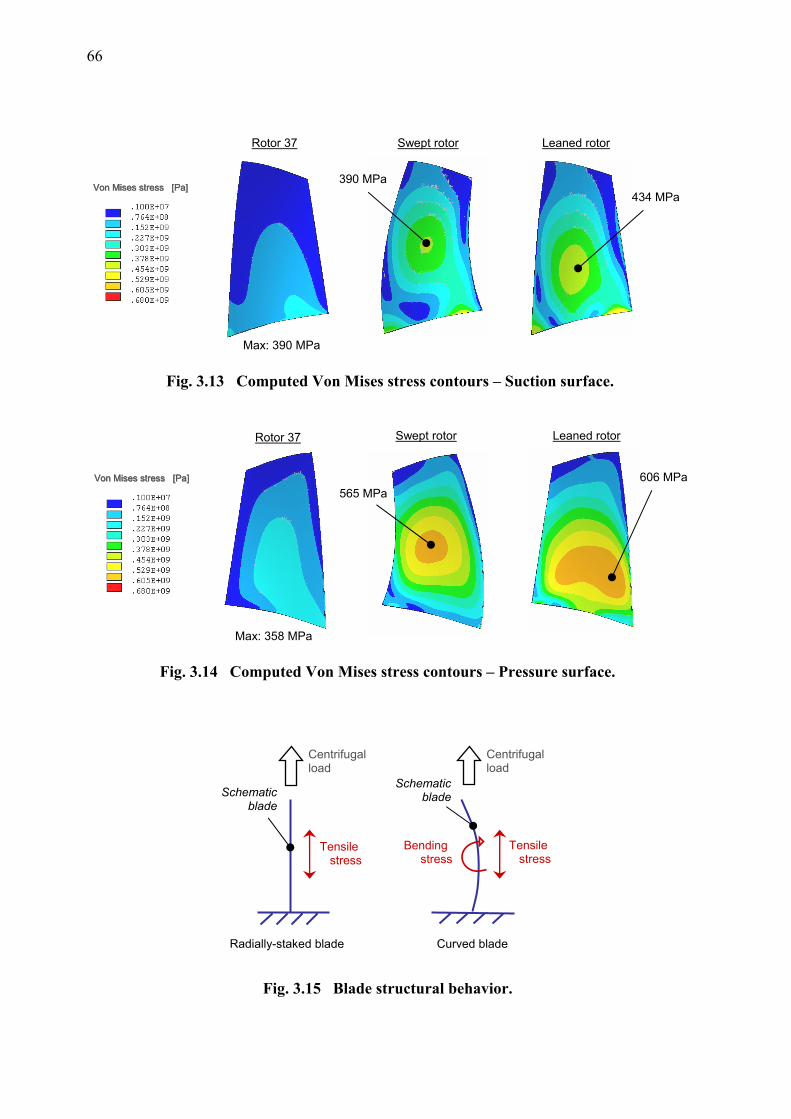
66
and 3.14. This does not mean that the concepts of sweep and lean can not be used in tran-
sonic rotors, but that the aerodynamic design of a swept and/or leaned transonic rotor blade
must be developed also from the structural point of view.
Von Mises stress [Pa]Von Mises stress [Pa]Von Mises stress [Pa]Von Mises stress [Pa]
Rotor 37 Swept rotor Leaned rotor
390 MPa 434 MPa
Max: 390 MPa
Fig. 3.13 Computed Von Mises stress contours – Suction surface.
Von Mises stress [Pa]Von Mises stress [Pa]Von Mises stress [Pa]Von Mises stress [Pa]
Rotor 37 Swept rotor Leaned rotor
565 MPa 606 MPa
Max: 358 MPa
Fig. 3.14 Computed Von Mises stress contours – Pressure surface.
Centrifugal load
Tensile stress
Schematic blade
Bending stress
Centrifugal load
Tensile stress
Schematic blade
Radially-staked blade Curved blade
Fig. 3.15 Blade structural behavior.

67
and 3.14. This does not mean that the concepts of sweep and lean can not be used in tran-
sonic rotors, but that the aerodynamic design of a swept and/or leaned transonic rotor blade
must be developed also from the structural point of view.

68

85
leaned rotors have absolutely the same blade-to-blade section (same profile, same stagger
angle etc.). Detailed investigations showed also that the relative Mach number upstream
the blade is quite similar into the two rotors, as well as the relative flow direction.
Therefore, on the basis of a quasi-three-dimensional (Q3D) blade-to-blade calculation, the
shock structure should be comparable in the two cases (the shock structure depends on the
imposed deviation and the upstream Mach number only). For that reason, the change in the
shock structure must be associated with a three-dimensional flow feature. This was
confirmed by Figure 4.19 (right), which shows the relative velocity vectors near the blade
pressure side at the outer span (where the blade is leaned). While in the baseline rotor the
flow moves around the leading edge without any evident spanwise velocity component, in
the leaned rotor the flow clearly deviates radially inward. This changes the flow pattern
around the blade and, consequently, the deviation imposed by the blade pressure side wall
to the flow, with a unavoidable impact on the shock structure.
15% span
Blade tip Leading edge
Relative velocity vectors near blade pressure side wall
Streamlines near blade pressure side wall
Meridional view
Fig. 4.20(a) Rotor 37 – 98% of choking mass flow rate.
Blade-to-blade relative Mach number contours (90% span)

86
Fig. 4.20(b) Leaned rotors – 98% of choking mass flow rate.
15% span
Blade tip Leading edge
Meridional view
CIRCUMFERENTIAL PLANELean
0
20
40
60
80
100
-3 -1 1 3
Tangential displacement [deg]
Span
%
Meridional view
15% span
Blade tip Leading edge
CIRCUMFERENTIAL PLANELean
0
20
40
60
80
100
-3 -1 1 3
Tangential displacement [deg]
Span
%(i)
(ii)

87
CIRCUMFERENTIAL PLANELean
0
20
40
60
80
100
-3 -1 1 3
Tangential displacement [deg]
Span
%
CIRCUMFERENTIAL PLANELean
0
20
40
60
80
100
-3 -1 1 3
Tangential displacement [deg]
Span
%
Fig. 4.21 Local impact of lean on flow pattern at leading edge (pressure side). (98% choking mass flow)

88
around the blade and, consequently, the deviation imposed by the blade pressure side wall
to the flow, with a unavoidable impact on the shock structure.
All the forward leaned rotors gave the same flow feature at the blade leading edge
(see, for instance, case (i) of Figure 4.20(b)). The backward leaned rotors, instead, gave the
flow an outward spanwise velocity component at the blade leading edge near the pressure
side, as shown by case (ii) of Figure 4.20(b); this led to a stronger shock and, consequently,
to higher shock losses and stronger interactions between the shock and secondary flows,
with a negative impact on the overall rotor efficiency.
More in general, it was observed that where the blade is inclined toward the direction
of rotor rotation the flow is deviated radially inward by the pressure side leading edge,
while where the blade is curved contrarily the flow is induced to move radially outward, as
clearly shown in Figure 4.21.
4.1.4 Concluding remarks All the aft swept rotors developed in this work showed an aerodynamic behavior
similar to that gave by the aft swept rotors analyzed in detail in this chapter, as well as all
the forward leaned rotors showed the same flow features observed in the forward leaned
rotors considered above. On the basis of that, the impact of aft sweep and forward lean on
the aerodynamic behavior of Rotor 37 can be summed up as follows.
Aft sweep showed clearly an impact on the shock structure as far as its shape on the
meridional view, in consequence of the impact of sweep on the blade leading edge shape.
However, this did not show a great effect on the overall rotor performance. The efficiency
improvements gave by all the aft swept blades are mainly associated with a less
detrimental blade wake development, thanks to a reduction of the radial outward flow
migration which arises inside the blade suction side boundary layer after the interaction
with the shock. It was observed, in fact, that a downstream blade curvature can help to
reduce such radial fluid flow, with a positive impact on the boundary layer thickness and
blade wake development.
Forward lean impacted considerably and prevalently on the three-dimensional shock
structure. All the forward leaned blades showed a shock front more inclined downstream

89
than the baseline radially-stacked blade, both in the blade-to-blade and meridional views.
This helps to reduce the shock strength and, consequently, the entropy generation and the
aerodynamic losses associated with the shock. It was observed that this is due to a change
in the flow incidence in consequence of an unusual flow pattern around the blade leading
edge. A blade curved toward the direction of rotor rotation seems to induce the flow to
move radially inward when reaches the blade pressure side leading edge.
A last observation is needed as far as lean effects. Lean showed some impacts also
on the strength of the above mentioned radial outward flow of fluid particles inside the
blade suction side boundary layer. In particular, such flow phenomenon seems to be
relieved using forward lean. This is the reason for the thin wake shown by the leaned rotor
of case (ii) in Figure 3.9(e) at 94% span (where the blade is curved toward the direction of
rotor rotation). Backward lean, instead, seems to increase the strength of such fluid flow
migration. It was observed, however, that in leaned rotors this effect is of lesser importance
than in swept rotors (in the case of forward leaned blades, in particular, it does not aid
significantly in changing the rotor performance) and for that reason it was not argued here.
4.2 Rotor stability enhancement using forward lean In this section, a study on the possibility to widen the working range of a transonic
compressor rotor using blade curvature was carried out. As mentioned in Chapter 1
(Section 1.2), it seems that stall in these rotors is associated with the interaction between
the tip clearance vortex and the passage shock. Interacting with the shock, the vortex is
subject to a sudden and strong deceleration; at lower flow operating conditions vortex
breakdown can occur, generating a low momentum fluid blocking the passage and
inducing rotor stall. As observed by Kablitz et al. (2003), vortex breakdown occurs when
the relative total pressure in vortex core is lower than the static pressure downstream of the
shock. After reaching a local minimum, the relative total pressure inside the vortex core is
increased by a mixing process between the low momentum core and the higher momentum
outer parts of the vortex and also with the main flow. It depends on the axial distance
which is available for this “reenergization” whether it remains possible for the vortex to get

90
past the passage shock. On the basis of numerical observations made up to now, forward
lean can help to increase the axial distance between the vortex start point and the shock-
vortex interaction point, since it induces the shock to move downstream at the outer span.
Therefore, forward lean could be helpful for reenergizing the vortex core and increasing
the rotor stability at throttled operating conditions.
However, all the forward leaned rotors previously investigated did not show a higher
stall margin compared to the baseline rotor (see, for instance, Figure 3.8(b)). This could be
due to numerical reasons (numerical instabilities of solver in the computing of the flow
field toward stall condition using a steady-state model) or, alternatively, the above
considerations could be ill founded. With the aim to make clear on the effects of forward
lean on the stability of a transonic compressor rotor, the impact of a promising forward
leaned blade curvature on the tip endwall flow field of Rotor 37 was investigated in detail.
Investigated rotor geometry and numerical model
Figures 4.22 and 4.23 show the blade geometry of the rotor analyzed in this section.
Just as all previous leaned and swept rotors were obtained, the new rotor considered here
was modeled starting from the Rotor 37 by changing the shape of the original stacking line.
In this case, however, the stacking line was modified both in the meridional and
circumferential planes. The circumferential shape (which gives the blade a forward leaned
curvature) was given because promising from the aerodynamic point of view. The
meridional shape, instead, was added for structural reasons.
FEM analyses showed a detrimental blade structural behavior when a noticeable
forward leaned curvature is applied. It was observed, in particular, an intensification of
blade structural stresses due to strong bending loads arising from the action of centrifugal
forces (see Section 3.4 for details). The meridional curvature was added actually to verify
the possibility of relieving the negative structural effects induced by forward lean, without
impacting considerably on the aerodynamic performance. Figure 4.24 shows the structural
benefits induced by the applied meridional curvature (it gives the Von Mises stress
distribution on the blade pressure side due to the centrifugal loading in the case of baseline

91
blade (a), the new blade without meridional curvature (b) and the new blade with
meridional curvature (c)).
Fig. 4.22 Baseline (Rotor 37) and modified (new rotor) stacking lines.
Fig. 4.23 Baseline (Rotor 37) and modified (new rotor) blades.

92
blade (a), the new blade without meridional curvature (b) and the new blade with
meridional curvature (c)).
The aerodynamic behavior of the new rotor was calculated and compared to that of
baseline configuration using a modified version of Model 3 (see Table 2.1). Steady-state
simulations were carried out. With respect to Model 3, the model used here is characterized
by a finer grid (about 1 million cells in all) at the outer span region for a more detailed
prediction of the tip endwall flow field. In particular, to make the code able to solve
accurately the wall boundary layer formed by the relative motion between the overtip
leakage flow and the casing, which seems to have a considerable impact on the
development of tip clearance flows (Van Zante et al., 2000), the tip clearance gap was
modeled using 20 (instead of 9 as in Model 3) radial grid points. The model was
successfully validated against Rotor 37 experimental data, as shown in Figure 4.25.
Similarly to Model 3, it gave a choking mass flow of 20.96 kg/s against the experimental
value of 20.93 ± 0.14 kg/s.
Fig. 4.24 Von Mises stress distribution due to wheel speed (1800 rad/s). (ANSYS Structural)
(a) Rotor 37 (b) Only leaned rotor (c) New rotor
[Pa]
Pressure surface
Pressure surface
Pressure surface

93
(a) Speed line.
(b) Downstream performance profiles. (c) Contours of normalized axial velocity. (95% span – 98% normalized mass flow)
Fig. 4.25 Numerical model validation (Rotor 37 – 1800 rad/s).
CFD results
Exp data (Chima, 1998)

94
Flow analysis
Figure 4.26 compares the computed speed line of new rotor to that of baseline
configuration. For each rotor, the calculated mass flows were normalized using the
computed mass flow at choking condition (the new rotor gave a choking mass flow of
20.88 kg/s against 20.96 kg/s of Rotor 37). With respect to the baseline configuration, the
new rotor gave a higher overall efficiency, a similar total pressure ratio and a lower
operating range. The efficiency increment is of about 0.8 percentage points around the
peak efficiency condition.
The flow fields of the two rotors were analyzed and compared at both the high
efficiency and low flow working conditions indicated in Figure 4.26.
Figure 4.27 shows the spanwise profile of adiabatic efficiency calculated at the
outflow boundary of the computational domain, for both the high efficiency and the low
flow operating conditions. It will be considered later.
Fig. 4.26 Rotor 37 and new rotor calculated speed lines.

95
As expected, the applied circumferential blade curvature induced the fluid to move
radially inward near the pressure side of the blade leading edge (Figure 4.28(a)). This led
to a change in the flow pattern (i.e. in the flow deviation imposed by the blade wall)
influencing not only the blade-to-blade shock structure but also the blade loading.
Compared to the radially-stacked rotor, at the outer span the new rotor gave a shock
located more downstream and a lower blade loading at the leading edge (Figures 4.28(b)
and 4.28(c)).
Figure 4.29 shows the relative Mach number distribution at the blade tip span (about
99.4% span) for the high efficiency operating condition. The black dashed line points out
the tip clearance vortex core (or primary vortex core). Note that the shock-tip clearance
vortex interaction point is located more downstream in the new rotor, thanks to the more
oblique blade-to-blade shock front. However, while in the baseline rotor the vortex starts at
the leading edge, in the new rotor it starts at about 10% chord, in consequence of the lower
blade loading at the leading edge; therefore, the axial distance between the vortex start
point and the shock-vortex interaction point is similar in the two rotors and the idea to
increase the vortex core energy using forward lean failed at this working condition. Note
that the low momentum region after the shock is almost the same in the two cases, in terms
of both size and Mach number values, and that the efficiency is comparable near the casing
(Figure 4.27, 98%). On the whole, the applied forward lean did not improve the tip endwall
flow field at the high efficiency operating condition.
Fig. 4.27 Spanwise profiles of efficiency at the outlet.

96
Blade tip
Leading edge
30% span
Rotor37
Blade tip
New Rotor
30% span
Leading edge
(a) Relative velocity vectors near pressure side.
Rotor 37 New rotor
(b) Relative Mach number contours – 85% span.
Fig. 4.28 R37 and new rotor comparisons – high efficiency condition.
(c) Static pressure distribution around the blade – 85% span.

97
A better aerodynamic behavior near the casing was observed in the new rotor
actually at low flow operating conditions. Figure 4.30 shows the relative Mach number
distribution at the blade tip for the 93% of choking mass flow (see Figure 4.26). At this
operating condition, the tip clearance vortex starts at the leading edge in both rotors, but in
the new rotor the shock front remains located more downstream (still attached to the blade
leading edge). This led to a higher distance between the vortex start point and the shock-
vortex interaction point and, as expected, to a less detrimental shock-vortex interaction
(note the less unfavorable low momentum region after the shock developed by the new
rotor).
Detailed numerical flow visualizations (not reported here) showed some interesting
aspects concerning such low momentum region. It was observed that, at the blade tip span,
it is formed mainly with fluid from the casing boundary layer, coming from the tip
clearance gap (this was observed in both rotors). Therefore, it can not be considered as a
consequence of the shock-vortex interaction only; it must be seen, more in general, as a
consequence of the shock-tip clearance flows-casing boundary layer interaction. However,
such low momentum fluid region has a spanwise dimension and flow visualizations
showed that at lower span levels it is mostly formed with fluid coming directly from the
vortex.
Figure 4.31 shows some three-dimensional streamlines released at midheight in the
tip clearance gap, along with the relative Mach number distributions at blade tip span and
96% span. The tip clearance vortex (or primary vortex) is clearly visible. A secondary
vortex arising after the shock can also be seen in both rotors. Being the streamlines
released from the tip clearance gap, the secondary vortices shown in Figure 4.31 arise from
the pressure difference between the pressure and suction blade side. Really, it was
observed that they arise also from the radial outward migration of fluid particles which
takes place inside the blade suction side boundary layer after the shock (see Section 4.1.2
for details on the mentioned radial fluid flow).
Compared to the new rotor, the low momentum region after the shock developed by
the baseline rotor is considerably wider in the spanwise direction. As shown in Figure
4.31, at 96% span it is still visible inside the Rotor 37, while it does not appear in the new

98
Rotor 37 New rotor
rotor. It is also interesting to observe the difference in the blade wake development near the
casing. The baseline rotor gave a considerably wider and deeper blade wake than the new
rotor.
Fig. 4.29 Blade-to-blade relative Mach number distribution. (Blade tip span – high efficiency condition)
Fig. 4.30 Blade-to-blade relative Mach number distribution. (Blade tip span – low flow condition)
New rotor Rotor 37
Primary vortex core
Low momentum region
Leading edge
Vortex start point

99
Primary vortex
Secondary vortex
Rotor 37
Mach distribution at blade tip
Rotor 37
Mach distribution 96% span
New rotor
Mach distribution at blade tip
New rotor
Mach distribution 96% span
Fig. 4.31 Flow visualizations – 93% normalized mass flow.

100
rotor. It is also interesting to observe the difference in the blade wake development near the
casing. The baseline rotor gave a considerably wider and deeper blade wake than the new
rotor.
On the whole, at low flow operating conditions the new blade gave a better
aerodynamic behavior at the tip endwall region compared to the baseline blade. As
expected, the applied curvature led to a less detrimental shock-vortex interaction, along
with a considerable reduction of local aerodynamic losses (see Figure 4.27 (93%)). Flow
visualizations showed a clear improvement in the stall margin. Despite of this, the new
rotor gave an unjustified limited operating range. For both rotors, the lower mass flow
operating point in the calculated speed lines represents the last point for which the model
implemented was able to converge. For lower normalized mass flow rates the solver
diverged or, more in general, was not able to give a converging solution. In the case of the
new rotor, the difficult of the model to converge at lower mass flows was associated with a
numerical instability instead of a flow instability. This was confirmed by the following.
Blade tip
New Rotor
30% span
Leading edge Leading edge
30% span
Rotor37
Blade tip
(b) Static pressure distribution around the blade – 85% span.
(a) Relative velocity vectors near pressure side.
Fig. 4.32 R37 and new rotor comparisons – 98% normalized mass flow. (k-ω turbulence model)

101
Rotor 37
Rotor 37
New rotor
New rotor
(90% span)
(95% span)
Shock-tip clearance vortex interaction
Fig. 4.33 R37 and new rotor comparisons – 92% normalized mass flow. (k-ω turbulence model)

102
visualizations showed a clear improvement in the peripheral flow stability. Despite of this,
the new rotor gave an unjustified limited stable working range (see Figure 4.26). For both
rotors, the lower mass flow operating point in the calculated speed line represents the last
point for which the steady-state model implemented was able to converge. For lower mass
flows the solver diverged or, more in general, was not able to give a converging solution.
Generally, this is assumed as an indication of aerodynamic instability. In the case of the
new rotor, however, the difficult of the model to converge at lower mass flows is unlikely
compatible with a flow instability; it could be instead associated with a numerical
instability. This was corroborated by the following analysis, where the use of a different
numerical model confirmed the higher flow stability of the new rotor with respect to the
baseline one and gave also a wider operating range.
Briefly, both the baseline and new version of Rotor 37 were simulated again using
the more accurate Shear Stress Transport k-ω turbulence model instead of the k-ε
turbulence model. In particular, Model 5 of Table 2.1 was used. Model 5 was accurately
validated in Chapter 2 (Section 2.2.1), showing high-quality predictions of internal flow
features.
Model 5 confirmed the impact of the applied blade curvature on the flow field. It
predicted, for instance, the unusual flow pattern near the pressure side of the blade leading
0,81
0,82
0,83
0,84
0,85
0,86
0,87
0,87 0,88 0,89 0,90 0,91 0,92 0,93 0,94 0,95 0,96 0,97 0,98 0,99 1,00
Rotor 37
New rotor
Efficiency increment of about 1.2%
High efficiency operating points (≈ 98%)
Normalized mass flow
Adi
abat
ic e
ffici
ency
1800 rad/s
Low flow operating points (≈ 92%)
Fig. 4.34 Computed adiabatic efficiency. (k-ω turbulence model)

103
edge (Fig. 4.32(a)), the displacement of the shock toward the rear and the change in the
blade loading at the leading edge (Fig. 4.32(b)), the positive impact on the tip endwall flow
field at low flow operating conditions (Fig. 4.33) etc. In addition, Model 5 confirmed the
apparent higher stall margin of the new rotor giving a working range considerably wider
than that of Rotor 37 (of about 50%), as shown in Fig. 4.34.
Concluding remarks
Besides the improvements in the overall efficiency, forward lean showed a positive
impact also on the tip endwall region at low flow operating conditions, making it possible
to increase the flow stability and, consequently, the stall margin.
The negative impact of forward lean on the structural behavior of the blade can be
relieved adding a proper swept curvature without compromising the aerodynamic
performance.
The steady-state model implemented (the modified version of Model 3) showed an
unjustified limited operating range in the case of the new rotor, giving the last stable
operating point at a mass flow rate for which the calculated flow field seems to have still
stall margin. On the basis of this observation, the operating ranges of Figure 3.8 could be
not realistic, as well as all the other ones computed here using the k-ε turbulence model.

104