systems engineering affordability tracking (seat) system · presented at the 2008 scea-ispa joint...
TRANSCRIPT

BOEING is a trademark of Boeing Management Company.Copyright © 2007 Boeing. All rights reserved. SEAT SCEA .ppt |
Systems Engineering Affordability Tracking
(SEAT) System
Karen MourikasAMSE Experimentation - Integrated Defense Systems
Denise NelsonSP&A Affordability – Phantom Works
June 2008
Presented at the 2008 SCEA-ISPA Joint Annual Conference and Training Workshop - www.iceaaonline.com

Copyright © 2007 Boeing. All rights reserved.
5/12/2008SEAT SCEA .ppt | 2
Overview
Systems Engineering Affordability Tracking (SEAT) SystemAffordability OverviewImplementationThe ModelReports and AnalysesNext StepsSummary
Presented at the 2008 SCEA-ISPA Joint Annual Conference and Training Workshop - www.iceaaonline.com
Copyright © 2007 Boeing. All rights reserved.
5/12/2008SEAT SCEA .ppt | 3
Systems Engineering Affordability Tracking (SEAT) System
Presented at the 2008 SCEA-ISPA Joint Annual Conference and Training Workshop - www.iceaaonline.com
Copyright © 2007 Boeing. All rights reserved.
5/12/2008SEAT SCEA .ppt | 4
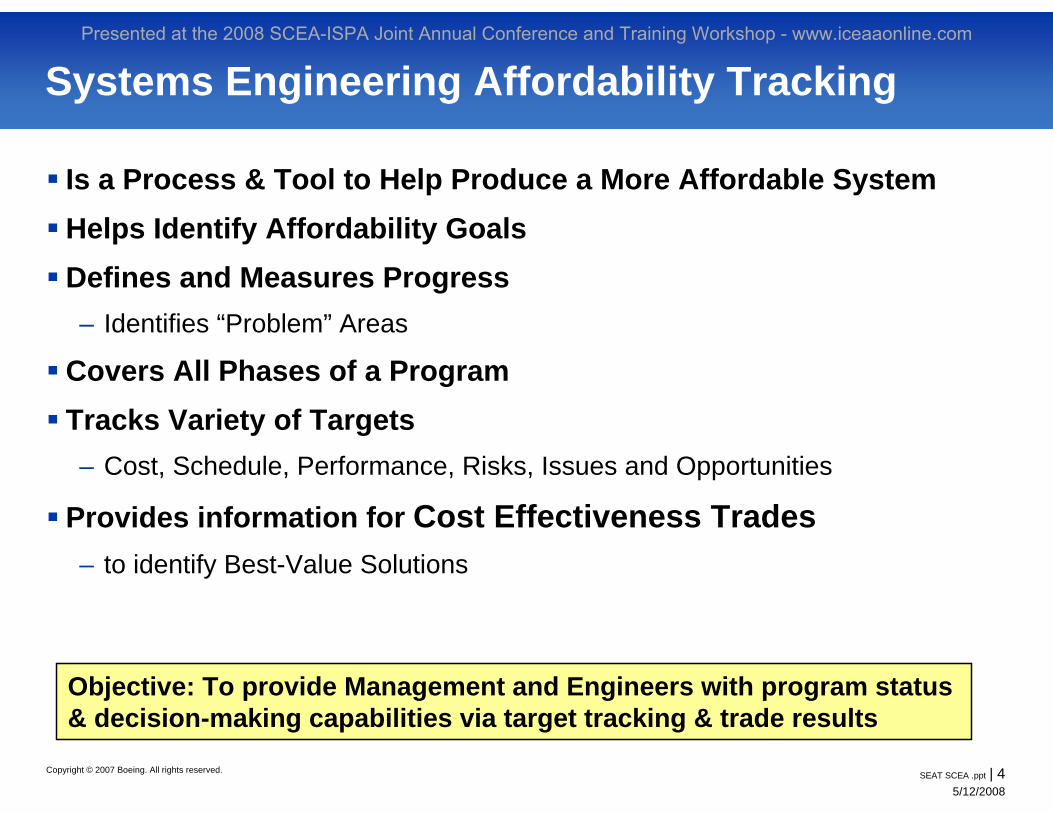
Systems Engineering Affordability Tracking
Is a Process & Tool to Help Produce a More Affordable SystemHelps Identify Affordability GoalsDefines and Measures Progress– Identifies “Problem” Areas
Covers All Phases of a ProgramTracks Variety of Targets– Cost, Schedule, Performance, Risks, Issues and Opportunities
Provides information for Cost Effectiveness Trades– to identify Best-Value Solutions
Objective: To provide Management and Engineers with program status & decision-making capabilities via target tracking & trade results
Presented at the 2008 SCEA-ISPA Joint Annual Conference and Training Workshop - www.iceaaonline.com

Copyright © 2007 Boeing. All rights reserved.
5/12/2008SEAT SCEA .ppt | 5
Benefits of SEAT
Differs from Cost Tracking & Earned Value Management– Expanded Duration
Can cover entire program from early conception through operations and disposalHas the ability to highlight ripple effects of current situation to future phases of program
– Broad Target SetCost, Schedule, Performance, Risks, Issues and Opportunities
– Is Easily Integrated with Trade Studies and Risk Management ProcessesPerformance/Design Targets
– Such as via Cost Effectiveness Modeling ToolsRisk, Issue, Opportunity
– Affordability FocusConsiders “best value” instead of lowest cost
Presented at the 2008 SCEA-ISPA Joint Annual Conference and Training Workshop - www.iceaaonline.com

Copyright © 2007 Boeing. All rights reserved.
5/12/2008SEAT SCEA .ppt | 6
Affordability Overview
Presented at the 2008 SCEA-ISPA Joint Annual Conference and Training Workshop - www.iceaaonline.com

Copyright © 2007 Boeing. All rights reserved.
5/12/2008SEAT SCEA .ppt | 7
What is Affordability?
Ongoing assessment of a program to ensure it is “in consonance with the long-range investment … plans”* – Meets funding guidelines– Satisfies requirements – Sufficient resources exist
A process that helps – Arrive at cost objectives– Set performance objectives with the requirements community– Define and integrate a balanced set of requirements
Cost, schedule, performance, and risk
Includes CAIV (Cost as an Independent Variable)
Effectiveness Objective
Cos
t O
bjec
tive
*DAU Glossary of Defense Acquisition Acronyms and Terms, 12th Edition
Presented at the 2008 SCEA-ISPA Joint Annual Conference and Training Workshop - www.iceaaonline.com

Copyright © 2007 Boeing. All rights reserved.
5/12/2008SEAT SCEA .ppt | 8
Affordability Helps Manage your Program
Assists with trade studies– Thoroughly surveys and assesses trade space
Not point designs
– Identifies “best-value” candidates or “Biggest Bang for the Buck”Quantitative assessment of optimal solutions of effectiveness and cost
give
s w
ay to
yielding
Effectiveness = f (Performance)Effectiveness = f (Performance)
Cost = f (Performance)Cost = f (Performance)
100,000 Random Cases
Presented at the 2008 SCEA-ISPA Joint Annual Conference and Training Workshop - www.iceaaonline.com
Copyright © 2007 Boeing. All rights reserved.
5/12/2008SEAT SCEA .ppt | 9
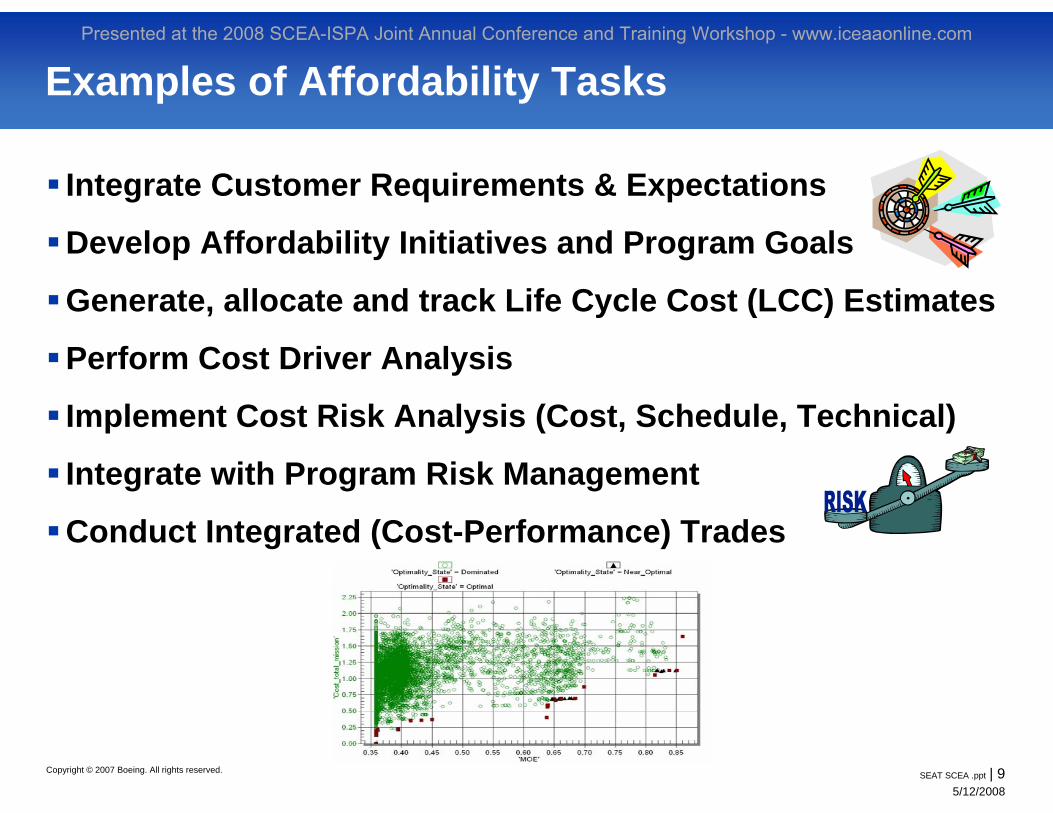
Integrate Customer Requirements & Expectations
Develop Affordability Initiatives and Program Goals
Generate, allocate and track Life Cycle Cost (LCC) Estimates
Perform Cost Driver Analysis
Implement Cost Risk Analysis (Cost, Schedule, Technical)
Integrate with Program Risk Management
Conduct Integrated (Cost-Performance) Trades
Examples of Affordability TasksPresented at the 2008 SCEA-ISPA Joint Annual Conference and Training Workshop - www.iceaaonline.com

Copyright © 2007 Boeing. All rights reserved.
5/12/2008SEAT SCEA .ppt | 10
Affordability Targets
Cost Targets $$$– Are Derived from Estimates
Estimates provide the starting point
Schedule Targets (Deadlines)– Percent Ahead/Behind– Milestones, IOC, FOC, First Launch– Schedule Variance (SV, SPI)
Risks, Issues, and Opportunities (RIOs) Impacts– Increased Costs / Savings– Schedule Delays / Acceleration– Technical/Design Modifications & Maturity Levels– Risk Reduction Efforts– Demonstrations
Presented at the 2008 SCEA-ISPA Joint Annual Conference and Training Workshop - www.iceaaonline.com
Copyright © 2007 Boeing. All rights reserved.
5/12/2008SEAT SCEA .ppt | 11
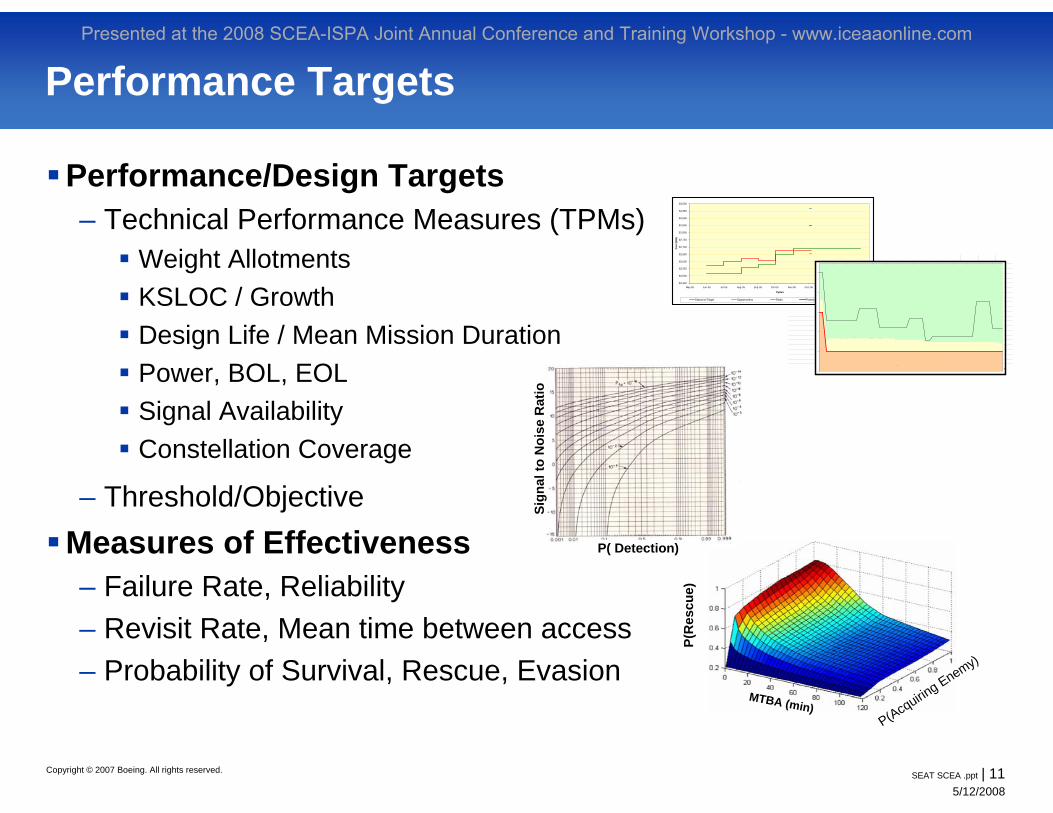
Performance Targets
Performance/Design Targets– Technical Performance Measures (TPMs)
Weight AllotmentsKSLOC / GrowthDesign Life / Mean Mission DurationPower, BOL, EOLSignal AvailabilityConstellation Coverage
– Threshold/ObjectiveMeasures of Effectiveness– Failure Rate, Reliability– Revisit Rate, Mean time between access– Probability of Survival, Rescue, Evasion
P(R
escu
e)MTBA (min)
P(Acquiring Enemy)
$2,450
$2,500
$2,550
$2,600
$2,650
$2,700
$2,750
$2,800
$2,850
$2,900
$2,950
$3,000
May-05 Jun-05 Jul-05 Aug-05 Sep-05 Oct-05 Nov-05 Dec-05 Jan-06 Feb-06 Mar-06
Cycles
Cos
t ($M
)
Status-to-Target Opportunities Risks Potentials Net E(v) Target
P(R
escu
e)
INSERT C
HART
. Feb Mar Apr May Jun Jul Aug Sep Oct Nov De
INSERT C
HART
Worst Case Scenario, Status: -160.42 dB
Requirement: -161 dB
Changes: -Requirement (Flex Power)-Allocations
P(R
escu
e)
INSERT C
HART
. Feb Mar Apr May Jun Jul Aug Sep Oct Nov De
INSERT C
HART
Worst Case Scenario, Status: -160.42 dB
Requirement: -161 dB
Changes: -Requirement (Flex Power)-Allocations
Sign
al to
Noi
se R
atio
P( Detection)
Presented at the 2008 SCEA-ISPA Joint Annual Conference and Training Workshop - www.iceaaonline.com

Copyright © 2007 Boeing. All rights reserved.
5/12/2008SEAT SCEA .ppt | 12
SEAT Implementation
Presented at the 2008 SCEA-ISPA Joint Annual Conference and Training Workshop - www.iceaaonline.com

Copyright © 2007 Boeing. All rights reserved.
5/12/2008SEAT SCEA .ppt | 13
Steps to Implement SEAT
DetermineSEAT
Requirements
DevelopSEATModel
PerformSEAT
Analysis
– Goals– Data– Reports
– Toolset– Data Handling– Reporting
– Analyze results– Identify Issues– Propose
Initiatives
Trade Space Evaluation
Risk MgmtAnalysis
Presented at the 2008 SCEA-ISPA Joint Annual Conference and Training Workshop - www.iceaaonline.com
Copyright © 2007 Boeing. All rights reserved.
5/12/2008SEAT SCEA .ppt | 14
SEAT – Determine Requirements
What are the goals?– Define Goals & Set Targets
Program Cost of $100KSchedule acceleration of 6 monthsIncrease “Y” MOE by 5%Implement 2 Risk Reduction Demos
Are goals feasible?– Format of Data
May need to modify goals
How to measure progress against goals?– Reports: type, data, frequency
Presented at the 2008 SCEA-ISPA Joint Annual Conference and Training Workshop - www.iceaaonline.com

Copyright © 2007 Boeing. All rights reserved.
5/12/2008SEAT SCEA .ppt | 15
SEAT – Develop Model
Create Model– Toolset
Excel, ACEIT, Design Sheet, Homegrown, etc.– Reports
Canned, Customizable, Templates– Training / documentation
Pre-existing, Experts, Learning Curve
Data Collection– Data handling & storage
Import, key in, cut & paste, automatedExcel columns, Data Bases, GUIs
– UpdatesOverride existing dataKeep historical trends
Create reports
Presented at the 2008 SCEA-ISPA Joint Annual Conference and Training Workshop - www.iceaaonline.com
Copyright © 2007 Boeing. All rights reserved.
5/12/2008SEAT SCEA .ppt | 16
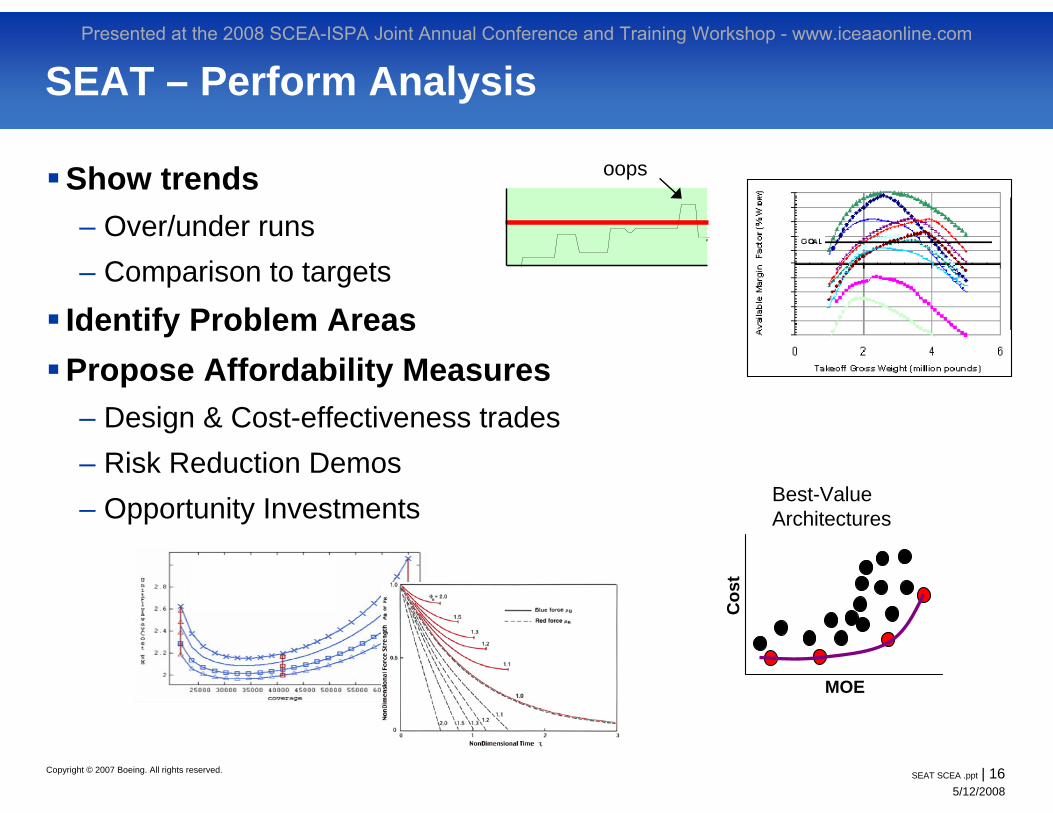
SEAT – Perform Analysis
Show trends– Over/under runs– Comparison to targets
Identify Problem AreasPropose Affordability Measures – Design & Cost-effectiveness trades– Risk Reduction Demos– Opportunity Investments
INSERT CHART
INSERT CHART
Wost Case Scenario, Status: -157.2 dB
oops
MOE
Cos
t
Best-Value Architectures
Presented at the 2008 SCEA-ISPA Joint Annual Conference and Training Workshop - www.iceaaonline.com

Copyright © 2007 Boeing. All rights reserved.
5/12/2008SEAT SCEA .ppt | 17
The Model
Presented at the 2008 SCEA-ISPA Joint Annual Conference and Training Workshop - www.iceaaonline.com
Copyright © 2007 Boeing. All rights reserved.
5/12/2008SEAT SCEA .ppt | 18
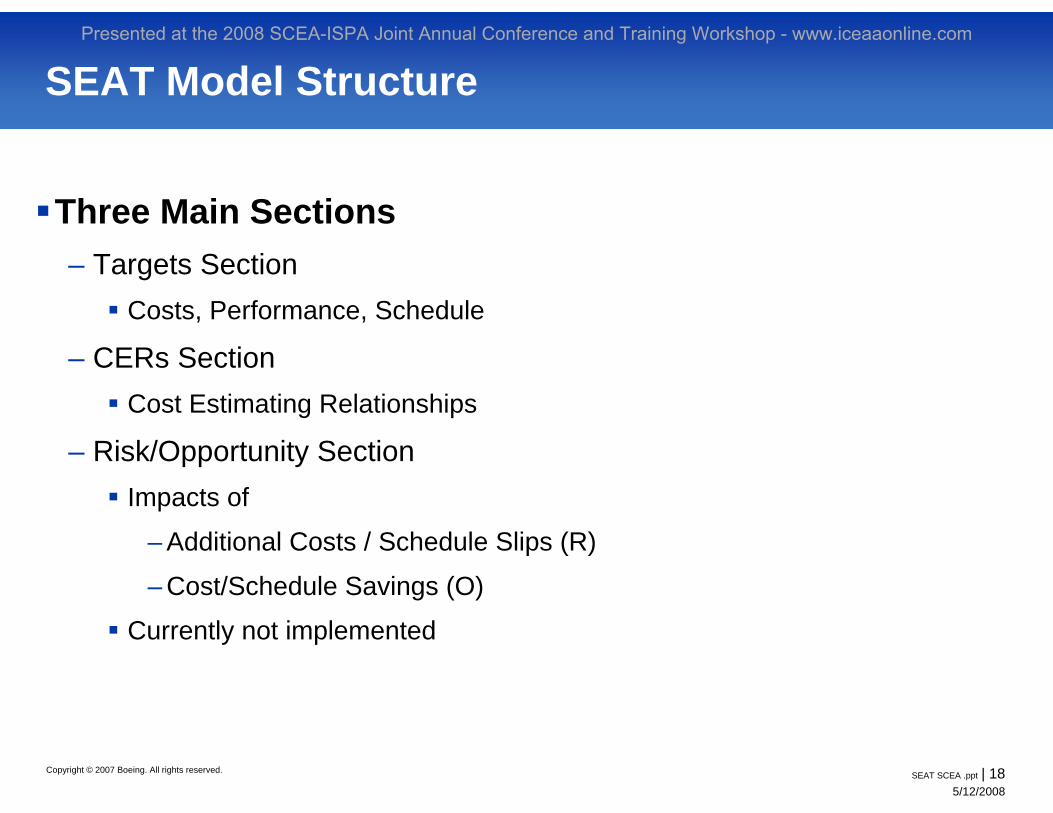
SEAT Model Structure
Three Main Sections– Targets Section
Costs, Performance, Schedule
– CERs SectionCost Estimating Relationships
– Risk/Opportunity SectionImpacts of
– Additional Costs / Schedule Slips (R)
– Cost/Schedule Savings (O)
Currently not implemented
Presented at the 2008 SCEA-ISPA Joint Annual Conference and Training Workshop - www.iceaaonline.com

Copyright © 2007 Boeing. All rights reserved.
5/12/2008SEAT SCEA .ppt | 19
Targets Section
Targets Section contains targets and updated projections of– Costs (EACs) organized by WBS at Subsystem level
Phased and Total– Design & Performance Parameters by applicable WBS– Schedule Data
Targets / Projections Assumptions– Targets Fixed
Not expected to change, but may be re-baselinedTargets saved as baseline case and act as Point of Departure
– Projections Updated PeriodicallyThroughout life cycleProjections Configuration Controlled by Review Boards Each update stored separately to allow for case by case analysis
Presented at the 2008 SCEA-ISPA Joint Annual Conference and Training Workshop - www.iceaaonline.com
Copyright © 2007 Boeing. All rights reserved.
5/12/2008SEAT SCEA .ppt | 20
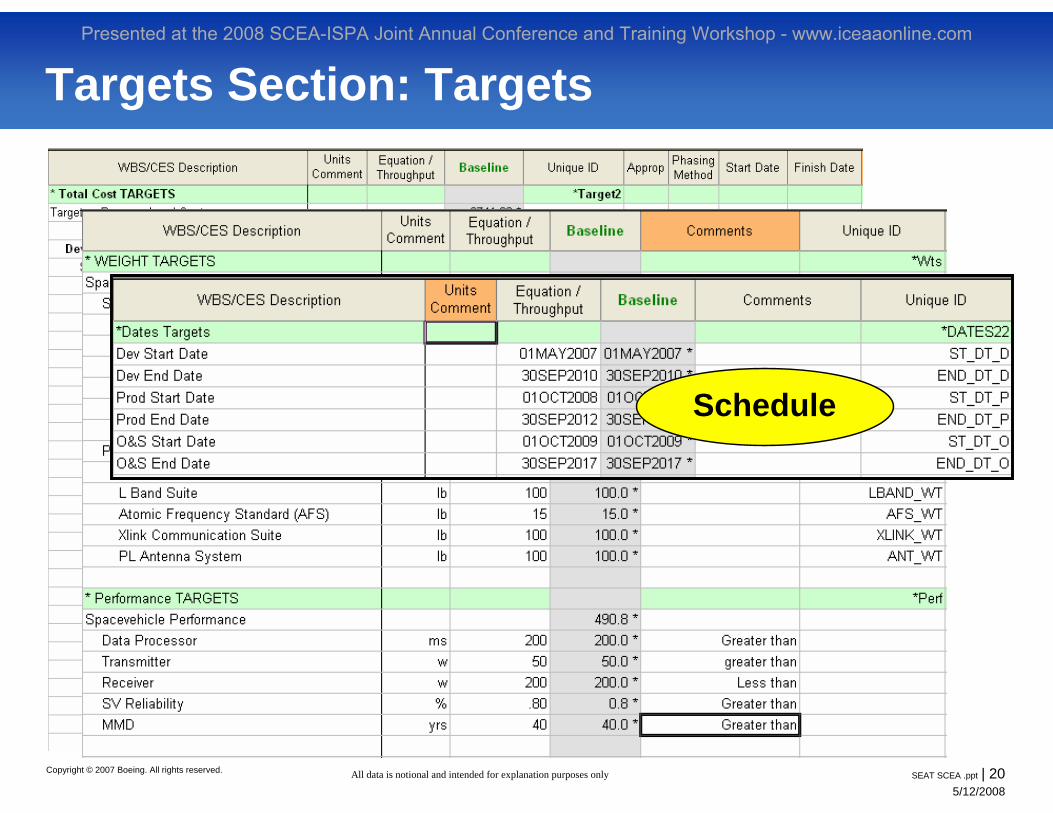
Targets Section: Targets
costsPerformance Schedule
All data is notional and intended for explanation purposes only
Presented at the 2008 SCEA-ISPA Joint Annual Conference and Training Workshop - www.iceaaonline.com

Copyright © 2007 Boeing. All rights reserved.
5/12/2008SEAT SCEA .ppt | 21
Targets Section: Projections (Total)
Periodic UpdatesIn columns
All data is notional and intended for explanation purposes only
Presented at the 2008 SCEA-ISPA Joint Annual Conference and Training Workshop - www.iceaaonline.com

Copyright © 2007 Boeing. All rights reserved.
5/12/2008SEAT SCEA .ppt | 22
CERs Section
CERs Section contains – Performance (weight/power) based CERs – Cost on cost equations– To show relative impacts of design changes on cost
Expected cost delta with weight increase on Weight-based CERsExpected cost of refresh decrease with life expectancy increase
– To promote analytical thinking and CER developmentDo the above impacts reflect the updated projections?
CERs Assumptions– CERs in model accurately estimate the targets
All data is notional and intended for explanation purposes only
Presented at the 2008 SCEA-ISPA Joint Annual Conference and Training Workshop - www.iceaaonline.com

Copyright © 2007 Boeing. All rights reserved.
5/12/2008SEAT SCEA .ppt | 23
CERs Section
CERs
Targets
All data is notional and intended for explanation purposes only
Presented at the 2008 SCEA-ISPA Joint Annual Conference and Training Workshop - www.iceaaonline.com

Copyright © 2007 Boeing. All rights reserved.
5/12/2008SEAT SCEA .ppt | 24
Data Analysis
Periodic Updates Stored as Sensitivity CasesSensitivity Cases Can Be Compared to Baseline Targets– EACs Compared to Cost Targets– Weights/Power Updates Compared to Baseline Parameters– Schedule Changes Compared to Baseline Schedule
Sensitivity Cases Compared to Parametric Costs (CERs)– EACs Compared to Updated CER Costs based on Updated Parameters
Risk/Opportunity Impacts Compared to Baseline/EACs– Acts as a Check-and-Balance
Risk Impacts / Cost Savings Reflected in EACs?
Presented at the 2008 SCEA-ISPA Joint Annual Conference and Training Workshop - www.iceaaonline.com

Copyright © 2007 Boeing. All rights reserved.
5/12/2008SEAT SCEA .ppt | 25
SEAT Reports and Analyses
Presented at the 2008 SCEA-ISPA Joint Annual Conference and Training Workshop - www.iceaaonline.com

Copyright © 2007 Boeing. All rights reserved.
5/12/2008SEAT SCEA .ppt | 26
Sample Cost Targets – Phased
Development Phase ShownBy WBS At Subsystem LevelPhased over 4 years
– According to program schedule
Then Year $Color Coding:
– Yellow – child– White – parent
Cost Element Total FY2007 FY2008 FY2009 FY2010 Development Target 99.9 6.2 40.9 38.5 14.3 Space Vehicle 99.9 6.2 40.9 38.5 14.3 Space Vehicle PMSE 13.9 0.9 5.7 5.4 2.0 Space Vehicle Program Management 6.6 0.4 2.7 2.5 0.9 Space Vehicle System Engineering 7.3 0.5 3.0 2.8 1.0 Space Vehicle AIT 5.1 0.3 2.1 2.0 0.7 Spacecraft Bus 38 2.4 15.6 14.6 5.4 Spacecraft Bus SEPM, I&T 3.1 0.2 1.3 1.2 0.4 Structures and Mechanisms 6.4 0.4 2.6 2.5 0.9 Thermal Control 2.7 0.2 1.1 1.0 0.4 Electric Power System (EPS) 5.7 0.4 2.3 2.2 0.8 Attitude Determination & Control (ADC) 2.3 0.1 0.9 0.9 0.3 Propulsion Sub System 1.3 0.1 0.5 0.5 0.2 Tracking, Telemetry & Command (TT&C) 6.5 0.4 2.7 2.5 0.9 Bus SW 10 0.6 4.1 3.9 1.4 Payloads 26.1 1.6 10.7 10.0 3.7 PL SEPM, I&T 4.2 0.3 1.7 1.6 0.6 Data Processor 12.4 0.8 5.1 4.8 1.8 L Band Suite 5.4 0.3 2.2 2.1 0.8 Atomic Frequency Standard (AFS) 0.6 0.0 0.2 0.2 0.1 Xlink Communication Suite 1.5 0.1 0.6 0.6 0.2 PL Antenna System 2 0.1 0.8 0.8 0.3 ILS 11.3 0.7 4.6 4.4 1.6 Space Vehicle Storage 1.2 0.1 0.5 0.5 0.2 Training 6.2 0.4 2.5 2.4 0.9 Support Equipment 3.9 0.2 1.6 1.5 0.6 LV Integration 2.1 0.1 0.9 0.8 0.3 Launch Ops 3.4 0.2 1.4 1.3 0.5
All data is notional and intended for explanation purposes only
Presented at the 2008 SCEA-ISPA Joint Annual Conference and Training Workshop - www.iceaaonline.com

Copyright © 2007 Boeing. All rights reserved.
5/12/2008SEAT SCEA .ppt | 27
Sample Development Cost Projection
Dated March 2007– Month End Data– 3 months after ATP
EAC Data– Then Yr $
Can be compared to– Phased Cost Targets– Unphased Totals
$K BY 2007
Cost Element FY 2007 FY 2008 FY 2009 FY 2010 TotalProgram Level Projection Development Projection 8.64 43.96 40.96 14.99 108.54 Space Vehicle Space Vehicle PMSE Space Vehicle Program Management 0.66 2.90 2.71 0.99 7.26 Space Vehicle System Engineering 0.73 3.21 2.99 1.10 8.03 Space Vehicle AIT 0.46 2.24 2.09 0.77 5.56 Spacecraft Bus Spacecraft Bus SEPM, I&T 0.31 1.36 1.27 0.47 3.41 Structures and Mechanisms 0.58 2.82 2.62 0.96 6.98 Thermal Control 0.24 1.19 1.11 0.41 2.94 Electric Power System (EPS) 0.57 2.51 2.34 0.86 6.27 Attitude Determination & Control (ADC) 0.16 1.01 0.94 0.35 2.46 Propulsion Sub System 0.09 0.57 0.53 0.20 1.39 Tracking, Telemetry & Command (TT&C 0.59 2.86 2.67 0.98 7.09 Bus SW 0.90 4.40 4.10 1.50 10.90 Payloads PL SEPM, I&T 0.42 1.85 1.72 0.63 4.62 Data Processor 0.87 5.46 5.08 1.86 13.27 L Band Suite 0.49 2.38 2.21 0.81 5.89 Atomic Frequency Standard (AFS) 0.04 0.26 0.25 0.09 0.64 Xlink Communication Suite 0.11 0.66 0.62 0.23 1.61 PL Antenna System 0.14 0.88 0.82 0.30 2.14 ILS Space Vehicle Storage 0.10 0.53 0.49 0.18 1.30 Training 0.50 2.73 2.54 0.93 6.70 Support Equipment 0.31 1.72 1.60 0.59 4.21 LV Integration 0.15 0.92 0.86 0.32 2.25 Launch Ops 0.24 1.50 1.39 0.51 3.64
Mar 2007 Projection
All data is notional and intended for explanation purposes only
Presented at the 2008 SCEA-ISPA Joint Annual Conference and Training Workshop - www.iceaaonline.com
Copyright © 2007 Boeing. All rights reserved.
5/12/2008SEAT SCEA .ppt | 28
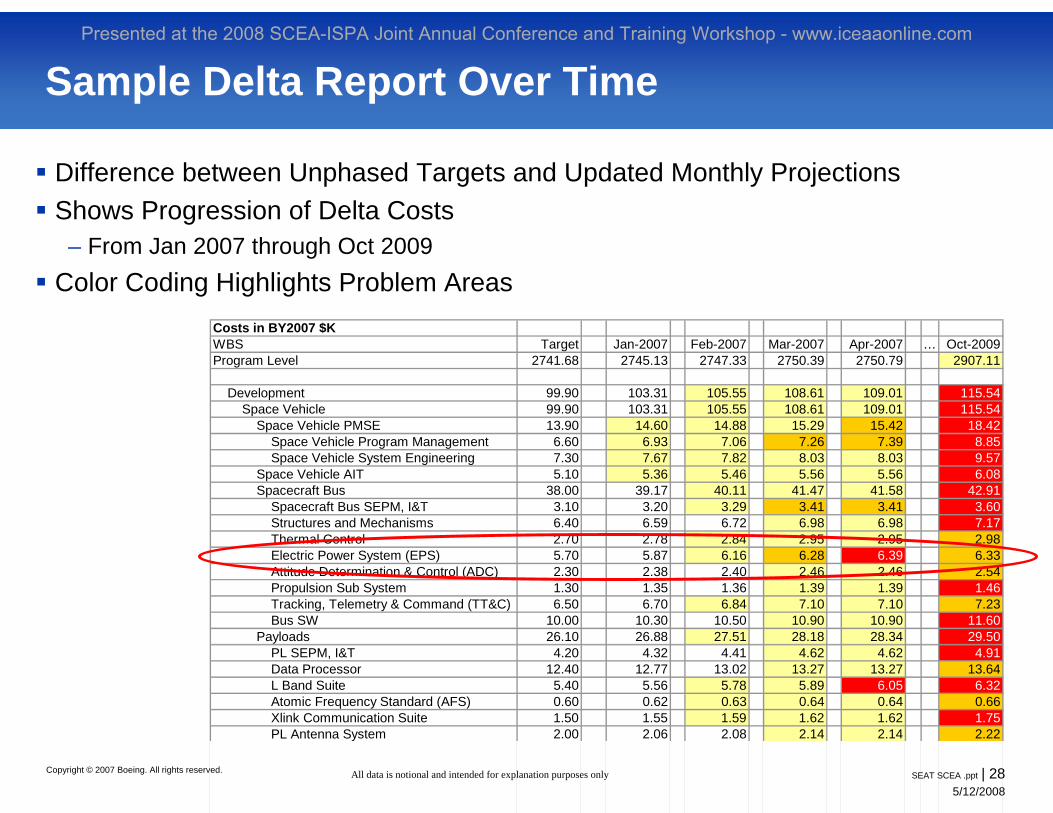
Sample Delta Report Over Time
Difference between Unphased Targets and Updated Monthly ProjectionsShows Progression of Delta Costs
– From Jan 2007 through Oct 2009Color Coding Highlights Problem Areas
Costs in BY2007 $KWBS Target Jan-2007 Feb-2007 Mar-2007 Apr-2007 … Oct-2009Program Level 2741.68 2745.13 2747.33 2750.39 2750.79 2907.11 Development 99.90 103.31 105.55 108.61 109.01 115.54 Space Vehicle 99.90 103.31 105.55 108.61 109.01 115.54 Space Vehicle PMSE 13.90 14.60 14.88 15.29 15.42 18.42 Space Vehicle Program Management 6.60 6.93 7.06 7.26 7.39 8.85 Space Vehicle System Engineering 7.30 7.67 7.82 8.03 8.03 9.57 Space Vehicle AIT 5.10 5.36 5.46 5.56 5.56 6.08 Spacecraft Bus 38.00 39.17 40.11 41.47 41.58 42.91 Spacecraft Bus SEPM, I&T 3.10 3.20 3.29 3.41 3.41 3.60 Structures and Mechanisms 6.40 6.59 6.72 6.98 6.98 7.17 Thermal Control 2.70 2.78 2.84 2.95 2.95 2.98 Electric Power System (EPS) 5.70 5.87 6.16 6.28 6.39 6.33 Attitude Determination & Control (ADC) 2.30 2.38 2.40 2.46 2.46 2.54 Propulsion Sub System 1.30 1.35 1.36 1.39 1.39 1.46 Tracking, Telemetry & Command (TT&C) 6.50 6.70 6.84 7.10 7.10 7.23 Bus SW 10.00 10.30 10.50 10.90 10.90 11.60 Payloads 26.10 26.88 27.51 28.18 28.34 29.50 PL SEPM, I&T 4.20 4.32 4.41 4.62 4.62 4.91 Data Processor 12.40 12.77 13.02 13.27 13.27 13.64 L Band Suite 5.40 5.56 5.78 5.89 6.05 6.32 Atomic Frequency Standard (AFS) 0.60 0.62 0.63 0.64 0.64 0.66 Xlink Communication Suite 1.50 1.55 1.59 1.62 1.62 1.75 PL Antenna System 2.00 2.06 2.08 2.14 2.14 2.22
All data is notional and intended for explanation purposes only
Presented at the 2008 SCEA-ISPA Joint Annual Conference and Training Workshop - www.iceaaonline.com

Copyright © 2007 Boeing. All rights reserved.
5/12/2008SEAT SCEA .ppt | 29
Sample Phased Development Cost Reports
Shows Annual Projections Comparing Target to Monthly Updates
Development Target
0.00
5.00
10.00
15.00
20.00
25.00
30.00
35.00
40.00
45.00
50.00
2007 2008 2009 2010
BY20
07 $
K BaselineJan-07Feb-07Mar-07
Development Target
0.00
5.00
10.00
15.00
20.00
25.00
30.00
35.00
40.00
45.00
50.00
2007 2008 2009 2010 2011
BY2
007
$K
BaselineJan-07Feb-07Mar-07Apr-07Oct-09Jan-10
Development Target
0.00
5.00
10.00
15.00
20.00
25.00
30.00
35.00
40.00
45.00
2007 2008 2009 2010 2011
BY2
007
$K
BaselineJan-10
3 Months of Data
6 Months of Data
Most Recent Month
All data is notional and intended for explanation purposes only
Presented at the 2008 SCEA-ISPA Joint Annual Conference and Training Workshop - www.iceaaonline.com

Copyright © 2007 Boeing. All rights reserved.
5/12/2008SEAT SCEA .ppt | 30
Sample Performance ComparisonsWBS Baseline Jan-07 Feb-07 Mar-07 Apr-07 Oct-09 Jan-10*WEIGHT TARGETSSpacevehicle development dry weight total 2515.0 3479.0 3279.0 3263.0 2981.0 2869.0 2628.0 Spacecraft Bus 2150.0 2975.0 2790.0 2765.0 2499.0 2425.0 2212.0 Structures and Mechanisms 500.0 600.0 585.0 580.0 540.0 530.0 515.0 Thermal Control 200.0 300.0 330.0 320.0 299.0 290.0 250.0 Electric Power System (EPS) 1000.0 1600.0 1400.0 1400.0 1200.0 1150.0 1000.0 Attitude Determination & Control (ADC) 150.0 150.0 150.0 150.0 150.0 150.0 150.0 Propulsion Sub System 250.0 245.0 245.0 240.0 240.0 240.0 242.0 Tracking, Telemetry & Command (TT&C) 50.0 80.0 80.0 75.0 70.0 65.0 55.0 Payloads 365.0 504.0 489.0 498.0 482.0 444.0 416.0 Data Processor 50.0 100.0 95.0 90.0 85.0 75.0 65.0 L Band Suite 100.0 130.0 115.0 135.0 140.0 132.0 120.0 Atomic Frequency Standard (AFS) 15.0 19.0 19.0 18.0 22.0 16.0 15.0 Xlink Communication Suite 100.0 135.0 140.0 150.0 130.0 120.0 115.0 PL Antenna System 100.0 120.0 120.0 105.0 105.0 101.0 101.0*Performance TARGETSSpacevehicle Performance 490.8 455.4 445.5 486.6 497.5 484.7 476.7 Data Processor 200.0 150.0 160.0 170.0 180.0 190.0 200.0 Transmitter 50.0 30.0 40.0 41.0 42.0 44.0 47.0 Receiver 200.0 250.0 210.0 225.0 230.0 210.0 190.0 SV Reliability 0.8 0.4 0.5 0.6 0.5 0.7 0.7 MMD 40.0 25.0 35.0 50.0 45.0 40.0 39.0
WBS/CES Description Units Comments Value* Performance TARGETSSpacevehicle Performance Data Processor ms Greater than 200 Transmitter w greater than 50 Receiver w Less than 200 SV Reliability % Greater than 0.8 MMD yrs Greater than 40
Interpretation of Targets
All data is notional and intended for explanation purposes only
Second Level of Visibility for Spacevehicle Performance
0.0
50.0
100.0
150.0
200.0
250.0
300.0
Data Processor Transmitter Receiver SV Reliability MMD
Units
Baseline
Jan-07
Jan-10
Presented at the 2008 SCEA-ISPA Joint Annual Conference and Training Workshop - www.iceaaonline.com
Copyright © 2007 Boeing. All rights reserved.
5/12/2008SEAT SCEA .ppt | 31
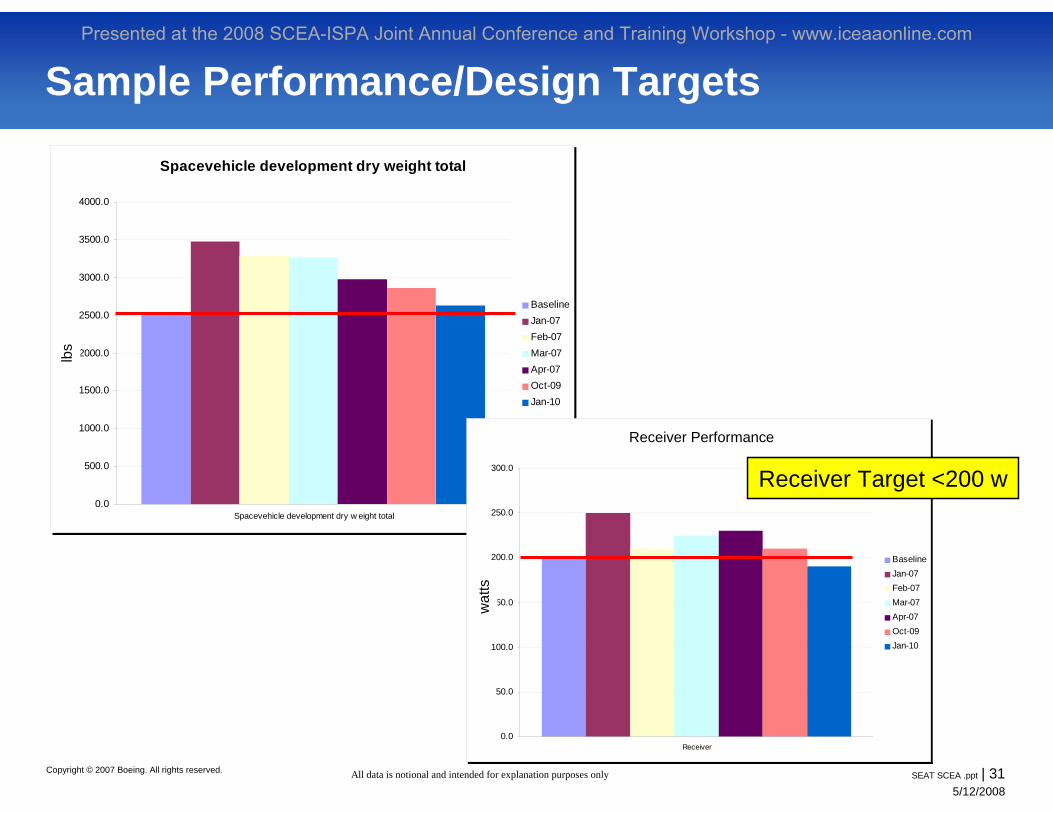
Sample Performance/Design Targets
Spacevehicle development dry weight total
0.0
500.0
1000.0
1500.0
2000.0
2500.0
3000.0
3500.0
4000.0
Spacevehicle development dry w eight total
Units
BaselineJan-07Feb-07Mar-07Apr-07Oct-09Jan-10
Second Level of Visibility for Receiver
0.0
50.0
100.0
150.0
200.0
250.0
300.0
Receiver
Units
BaselineJan-07Feb-07Mar-07Apr-07Oct-09Jan-10
lbs
wat
ts
All data is notional and intended for explanation purposes only
Receiver Performance
Receiver Target <200 w
Presented at the 2008 SCEA-ISPA Joint Annual Conference and Training Workshop - www.iceaaonline.com
Copyright © 2007 Boeing. All rights reserved.
5/12/2008SEAT SCEA .ppt | 32
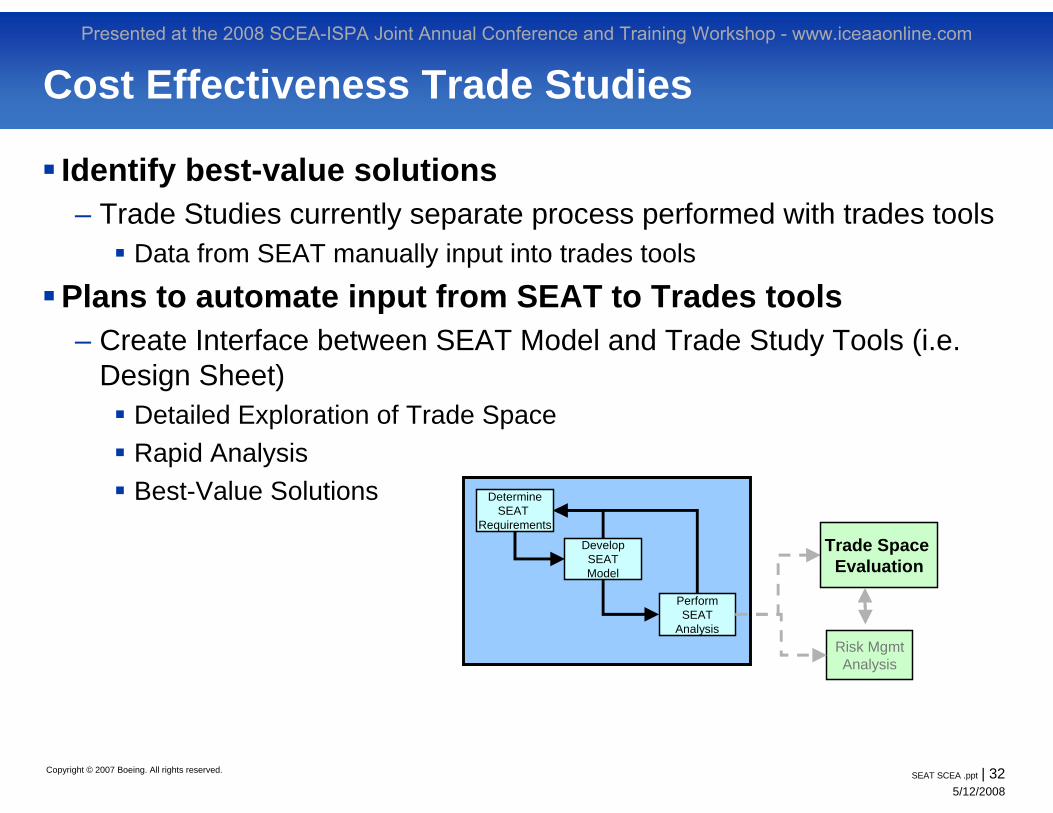
Cost Effectiveness Trade Studies
Identify best-value solutions– Trade Studies currently separate process performed with trades tools
Data from SEAT manually input into trades tools
Plans to automate input from SEAT to Trades tools– Create Interface between SEAT Model and Trade Study Tools (i.e.
Design Sheet) Detailed Exploration of Trade SpaceRapid AnalysisBest-Value Solutions Determine
SEAT Requirements
DevelopSEATModel
PerformSEAT
Analysis
Trade Space Evaluation
Risk MgmtAnalysis
Presented at the 2008 SCEA-ISPA Joint Annual Conference and Training Workshop - www.iceaaonline.com

Copyright © 2007 Boeing. All rights reserved.
5/12/2008SEAT SCEA .ppt | 33
Next Steps
Automate linkage between SEAT and Trade Study Tools– For further analytical studies
Implement Risk/Opportunities in SEAT– Update Model– Perform RIO (Risks, Issues, Opportunities) Analysis– Evaluate Risk Reduction Candidates– Integrate Cost Risk Analysis with Risk Management
Presented at the 2008 SCEA-ISPA Joint Annual Conference and Training Workshop - www.iceaaonline.com

Copyright © 2007 Boeing. All rights reserved.
5/12/2008SEAT SCEA .ppt | 34
Summary
Presented at the 2008 SCEA-ISPA Joint Annual Conference and Training Workshop - www.iceaaonline.com
Copyright © 2007 Boeing. All rights reserved.
5/12/2008SEAT SCEA .ppt | 35
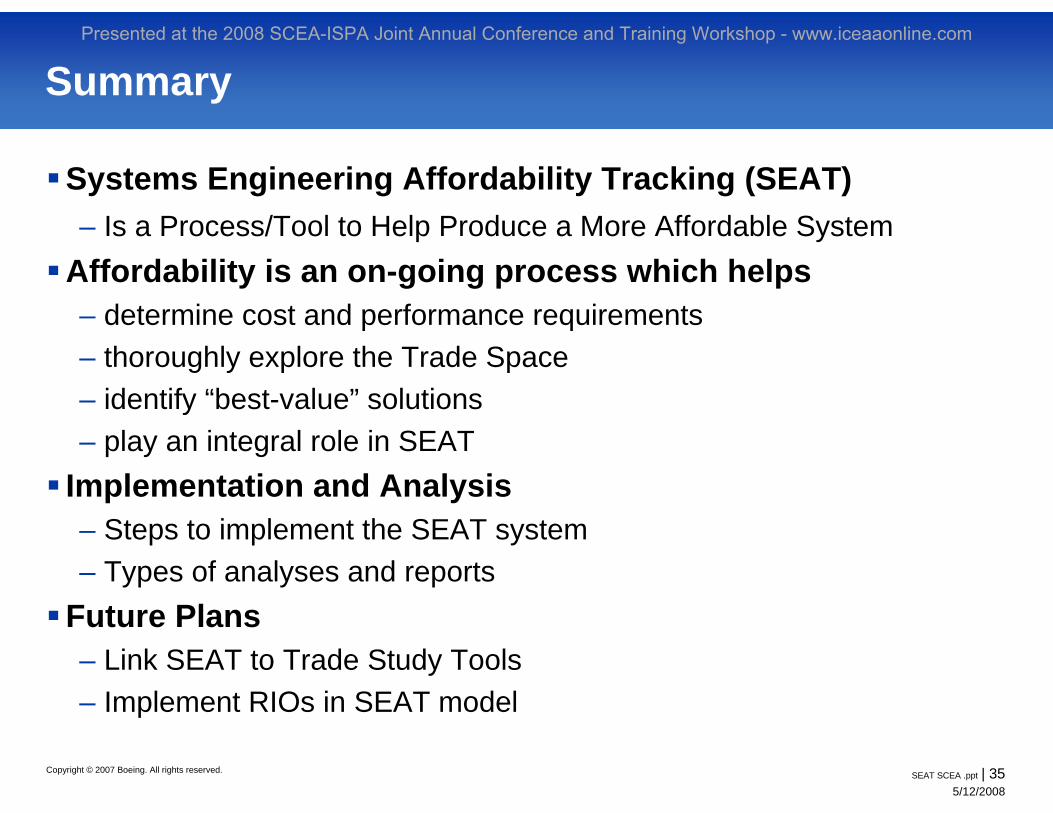
Summary
Systems Engineering Affordability Tracking (SEAT) – Is a Process/Tool to Help Produce a More Affordable System
Affordability is an on-going process which helps– determine cost and performance requirements– thoroughly explore the Trade Space– identify “best-value” solutions– play an integral role in SEAT
Implementation and Analysis– Steps to implement the SEAT system– Types of analyses and reports
Future Plans– Link SEAT to Trade Study Tools– Implement RIOs in SEAT model
Presented at the 2008 SCEA-ISPA Joint Annual Conference and Training Workshop - www.iceaaonline.com

Copyright © 2007 Boeing. All rights reserved.
5/12/2008SEAT SCEA .ppt | 36
Presented at the 2008 SCEA-ISPA Joint Annual Conference and Training Workshop - www.iceaaonline.com