systems parasitology: effects of fasciola hepatica on the...
TRANSCRIPT

REPORT
Systems parasitology: effects of Fasciola hepaticaon the neurochemical profile in the rat brain
Jasmina Saric1,2,8,*, Jia V Li1,2,8, Jurg Utzinger2,3, Yulan Wang4, Jennifer Keiser3,5, Stephan Dirnhofer6, Olaf Beckonert1,Mansour TA Sharabiani7, Judith M Fonville1, Jeremy K Nicholson1 and Elaine Holmes1,*
1 Biomolecular Medicine, Department of Surgery and Cancer, Faculty of Medicine, Imperial College London, London, UK, 2 Department of Epidemiologyand Public Health, Swiss Tropical and Public Health Institute, Basel, Switzerland, 3 University of Basel, Basel, Switzerland, 4 State Key Laboratory of MagneticResonance and Atomic and Molecular Physics, Wuhan Center for Magnetic Resonance, Wuhan Institute of Physics and Mathematics, Chinese Academy of Sciences,Wuhan, People’s Republic of China, 5 Department of Medical Parasitology and Infection Biology, Swiss Tropical and Public Health Institute, Basel, Switzerland,6 Institute of Pathology, University Hospital Basel, Basel, Switzerland and 7 Department of Epidemiology and Biostatistics, School of Public Health, Faculty of Medicine,Imperial College London, London, UK8 These authors contributed equally to this work* Corresponding authors. J Saric or E Holmes, Biomolecular Medicine, Department of Surgery and Cancer, Faculty of Medicine, Imperial College London, Sir AlexanderFleming Building, South Kensington, London SW7 2AZ, UK. Tel.: þ 44 20 7594 3899; Fax: þ 44 20 7595 3221; E-mail: [email protected] Tel.: þ 44 20 7594 3220; Fax: þ 44 20 7595 3221; E-mail: [email protected]
Received 5.2.10; accepted 31.5.10
We characterize the integrated response of a rat host to the liver fluke Fasciola hepatica using acombination of 1H nuclear magnetic resonance spectroscopic profiles (liver, kidney, intestine, brain,spleen, plasma, urine, feces) and multiplex cytokine markers of systemic inflammation. Multi-variate mathematical models were built to describe the main features of the infection at the systemslevel. In addition to the expected modulation of hepatic choline and energy metabolism, we foundsignificant perturbations of the nucleotide balance in the brain, together with increased plasma IL-13, suggesting a shift toward modulation of immune reactions to minimize inflammatory damage,which may favor the co-existence of the parasite in the host. Subsequent analysis of brain extractsfrom other trematode infection models (i.e. Schistosoma mansoni, and Echinostoma caproni) did notelicit a change in neural nucleotide levels, indicating that the neural effects of F. hepatica infectionare specific. We propose that the topographically extended response to invasion of the host ascharacterized by the modulated global metabolic phenotype is stratified across several bio-organizational levels and reflects the direct manipulation of host–nucleotide balance.Molecular Systems Biology 6: 396; published online 27 July 2010; doi:10.1038/msb.2010.49Subject Categories: cellular metabolism; molecular biology of diseaseKeywords: brain; Fasciola hepatica; immunology; metabolic profiling; nuclear magnetic resonancespectroscopy
This is an open-access article distributed under the terms of the Creative Commons AttributionNoncommercial Share Alike 3.0 Unported License, which allows readers to alter, transform, or build uponthe article and thendistribute the resultingwork under the sameorsimilar license to thisone. Thework mustbe attributed back to the original author and commercial use is not permitted without specific permission.
Introduction
Fascioliasis is a re-emerging zoonotic disease caused by twoliver fluke species, Fasciola hepatica and F. gigantica. As manyas 17 million people might be infected with Fasciola spp.(Keiser and Utzinger, 2009) and the disease is of considerableeconomic and public health importance. At present, tricla-bendazole is the only drug available for treatment of infectedhuman beings and livestock and worryingly, parasite resis-tance to triclabendazole is already widespread in farm animals(Fairweather, 2009). Hence, a deeper understanding of the
biology of this parasite is warranted to uncover noveltherapeutic targets. Fundamental investigations in well-controlled host–parasite models hold promise for recovery ofmetabolic biomarkers, at different bio-organizational levels.This may promote the mechanistic understanding of the hostresponse to infection at the systems level with a view toidentifying drug targets.
The regulation of any mammalian system is such that eventsoriginating in a discrete tissue or organ can trigger a cascade ofconsequent events throughout the host system as the hostattempts to maintain homeostatic equilibrium (Lederberg,
Molecular Systems Biology 6; Article number 396; doi:10.1038/msb.2010.49Citation: Molecular Systems Biology 6:396& 2010 EMBO and Macmillan Publishers Limited All rights reserved 1744-4292/10www.molecularsystemsbiology.com
& 2010 EMBO and Macmillan Publishers Limited Molecular Systems Biology 2010 1
2000; Nicholson et al, 2002). Thus, the effects of a parasiticinfection are rarely confined to a single target tissue; instead anetwork of molecular events can generally be detectedthroughout the host system. Top-down systems biology drivenby metabolic phenotyping and metabonomics (Nicholsonet al, 1999; Holmes et al, 2008a; Li et al, 2008a, b; Tsanget al, 2009) has been shown to be a useful tool for studyinghost–parasite (Saric et al, 2008; Wang et al, 2008; Li et al, 2009)and host–symbiont interactions (Nicholson et al, 2005; Martinet al, 2007; Holmes et al, 2008b), and it is clear that anytransgenomic interaction can only be studied in vivo, as theeffects of microbial or parasitic modulations are panorganis-mal (Wang et al, 2008; Saric et al, 2009).
In this study, we characterize and interpret the system-wideeffect of F. hepatica in the rat, using a metabolic profilingstrategy to develop mechanistic hypotheses. A multilevelstatistical approach was applied to the analysis of 1H nuclearmagnetic resonance (NMR) spectroscopy-generated data toobtain an integrative profile of the global response of the hostbased on differential metabolic, immunological, and bio-metric responses across multiple tissues. We report novelfindings regarding the effect of F. hepatica on the neuralmetabolite profile of the rat and show metabolic connectionsbetween the liver, gut, and brain, which we compare with themetabolic effects elicited by two separately assessed trematodeinfections, namely Schistosoma mansoni and Echinostomacaproni in a mouse model. Although F. hepatica-induced liverdamage has been described in detail before (Lim et al, 2007;Marcos et al, 2008), no direct association with the centralnervous system has been found in the extant literature. Thefindings from this study expose a potential mechanism ofparasite-induced immune modulation and exemplify the valueof top-down systems approaches based on metabolic profilingfor recovering mechanistic information from a system withouta priori knowledge.
Results and discussion
Parasite burden, physiological monitoring,and histology
Patent infection of rats with F. hepatica resulted in a meanparasite burden of 5.5 (range¼2–10; s.d.¼2.6) on day 77postinfection and a significant reduction of the mean packedcell volume (PCV) at day 71 postinfection (uninfected controlrats: mean¼50.8%, s.d.¼2.8%; infected: mean¼42.0%, s.d.¼3.8%). The mean bodyweight did not significantly differbetween infected and uninfected rats at any of the investigatedtime points. Clear evidence of hepatic necrosis was found inF. hepatica-infected rats (Supplementary Figure S1) togetherwith follicular hyperplasia of splenic white pulp and interstitiallymphoplasmocytic inflammatory infiltrates in the kidney.
Multivariate statistical modeling of F. hepaticainfection
Assignment of metabolic components in the tissues andbiofluid profiles for both uninfected and infected rats weremade on the basis of extant literature (Coen et al, 2003; Holmeset al, 2006; Beckonert et al, 2007; Li et al, 2009; Saric et al,
2009; Tsang et al, 2009), and in the case of the brain extractspectra, from addition of authentic standards (assignmentsprovided in Supplementary Figure S2; SupplementaryTable SI).
The metabolic changes in the rat caused by patent infectionwith F. hepatica were modeled separately for each biologicalmatrix through principal component analysis (PCA) andprojection to latent structure discriminant analysis (PLS-DA).In brief, the metabolic profiles of F. hepatica-infected rats couldbe differentiated from those of uninfected control rats throughPCA for all assessed biological compartments except the ileumand the renal medulla. A list of important infection-discrimi-natory metabolites is given in Table I together with the P-values, validated by permutation testing, Figure 1.
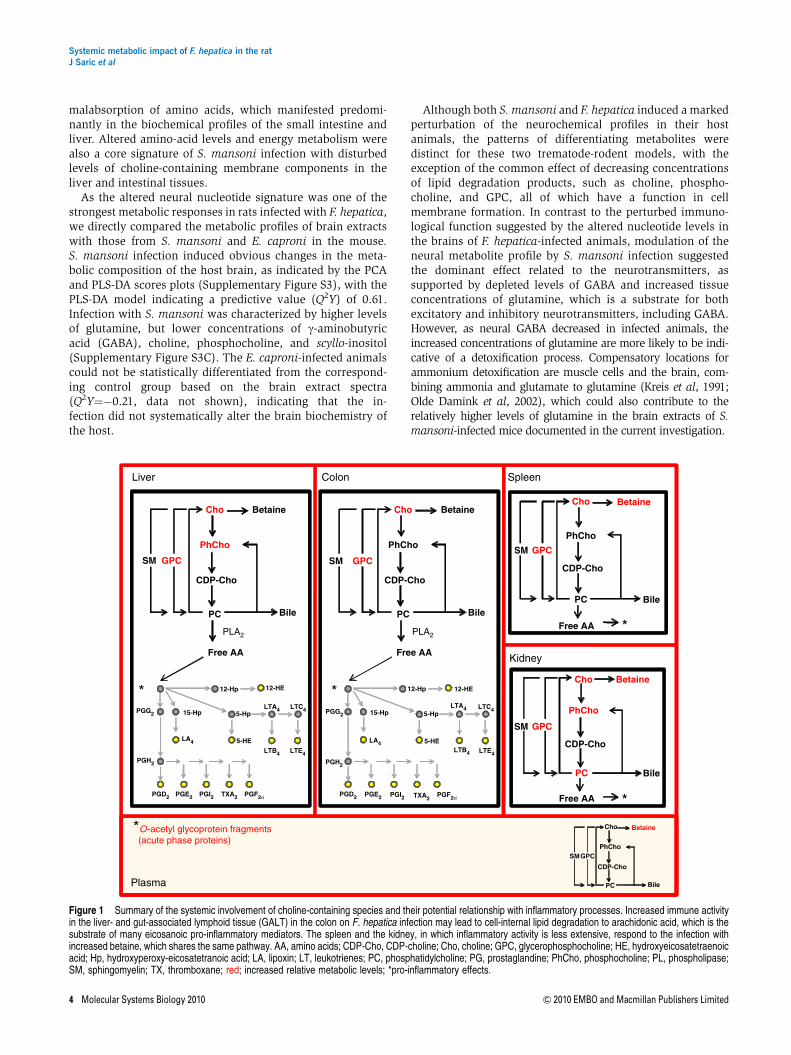
Consistent changes in lipid metabolism, including elevatedcholine and/or choline derivatives such as betaine, phospho-choline, and glycerophosphocholine (GPC) occurred through-out most tissues (Figure 1; Table I). This indicates a generallyincreased usage of choline-derived metabolites that can befurther converted to phosphocholine (Zeisel et al, 2003; Li andVance, 2008), a basic component of membrane anabolism, orused for the production of polyunsaturated fatty acids such asarachidonic acid, which gives rise to pro-inflammatoryeicosanoic mediators (Calder, 2008, 2009). Prostaglandins,for instance, exert multiple pro-inflammatory effects, suchas chemotaxis of neutrophils, which are typically thefirst infiltrating cells at sites of tissue damage. Evidence ofinflammatory infiltrates was detected in the histologicaland metabolic profiles of the liver, spleen, and kidney(Supplementary Figure S1) and inflammation was implicatedbiochemically in the colon and plasma. Increasedplasma intensities of O- and N-acetyl glycoprotein signalswere noted in F. hepatica-infected rats. Increased concentra-tions of acetylated glycoproteins have been earlier identifiedin Trichinella spiralis- and Trypanosoma brucei brucei-infectedmice (Martin et al, 2006; Wang et al, 2008) as inflammatorymarkers and include acute phase reaction proteins, suchas a1 acid glycoprotein, haptoglobin, and transferrin,which are produced in the liver and which show markedlyincreased serum levels during such systemic responses toinflammation (Schreiber et al, 1982; Bell et al, 1987a, b)(Figure 1; Table I).
Other features of F. hepatica infection were specific to asingle biological compartment; for example hippurate, whichis only observed in the urine, was found to be decreased ininfected rats, reflecting a parasite-induced disturbance of thegut-microbial composition or activity (Nicholls et al, 2003; Liet al, 2008a, b). The liver, spleen and plasma showed thegreatest changes at the low molecular weight level, consistentwith the direct damage caused by the migrating larvae of F.hepatica during the acute stage of an infection in the hepatictissue and the immunological activity in the spleen (Supple-mentary Figure S1). The proliferation of B cells in the spleenprimary follicles as response to blood-borne antigens usesamino acids and lipid fractions for the new cellular membranebilayers and organelles and may account for the major changesin the metabolic profile of the spleen, and perhaps in othertissue compartments. The depletion in hepatic glucose is morelikely to be related to the direct damage of the energy storesand is consistent with elevated glucose levels in plasma.
Systemic metabolic impact of F. hepatica in the ratJ Saric et al
2 Molecular Systems Biology 2010 & 2010 EMBO and Macmillan Publishers Limited

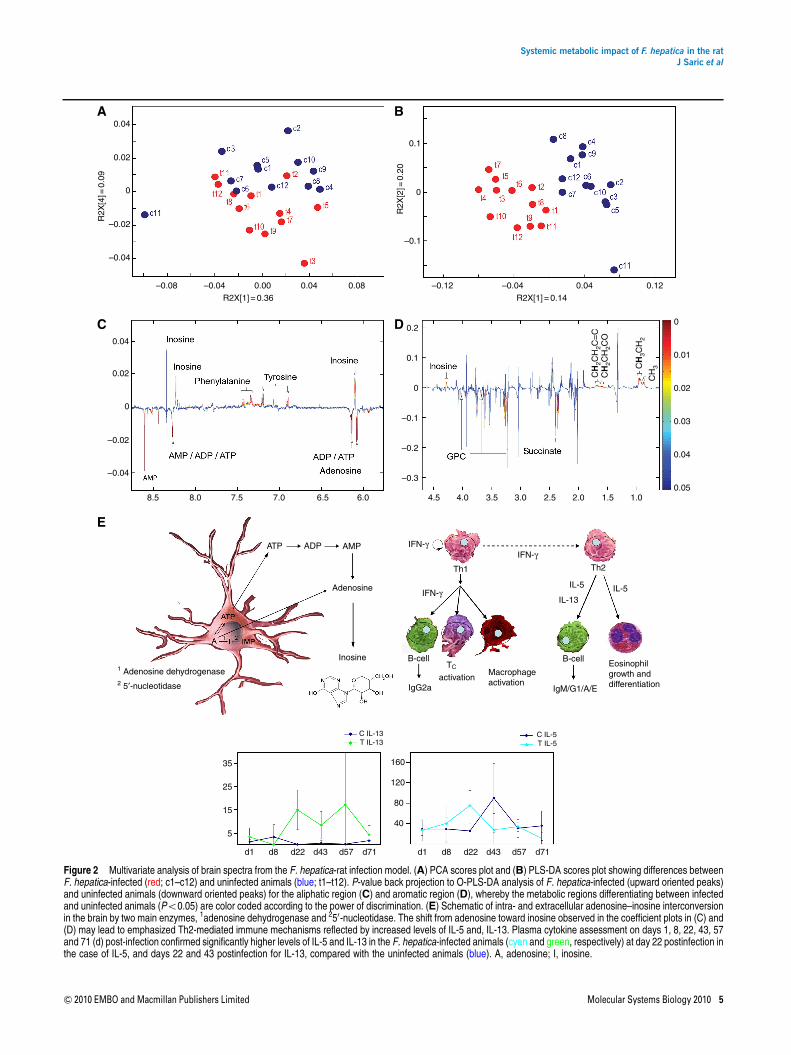
One of the strongest effects of infection with F. hepaticamanifested in the neurochemical profiles, further highlightingthe ability of the parasite to impact on remote tissue. Clearvisual separation of the infected and uninfected animalswas achieved in the PCA and PLS-DA scores plots (Figure 2Aand B) of the neural profiles, with a model predictivity (Q2Y)of 0.46. The pattern of differentiating metabolites in theneurochemical profiles as extracted from the orthogonalPLS-DA (O-PLS-DA) coefficients was composed of a signif-icant increase in the relative levels of inosine, tyrosine, andphenylalanine. Conversely, the relative tissue concentrationsof GPC, succinate, inosine mono-, di-, and triphosphate,adenosine, and adenosine mono-, di-, and triphosphatewere lower in the brains of infected animals (Figure 2Cand D).
Secretion of nucleotide-degrading enzymes occurs in avariety of ecto- and endoparasitic organisms, such as ticks,blood sucking insects, and helminths and serves the primarypurpose of minimizing immune reactions in the host organismto prolong their survival (Parshad and Guraya, 1977; Ribeiroand Francischetti, 2003). For example, adenosine deaminaseand 50-nucleotidase have been found in secretory channels ofT. spiralis and F. gigantica (Gounaris, 2002; Ali, 2008). Theformer catalyzes the intracellular conversion of adenosine toinosine, whereas the latter hydrolyzes inosine monophosphate(Figure 2E).
We observed a substantial shift of adenosine and phos-phorylated nucleotides to inosine in the host brain, whichindicates an attenuated inflammatory response and may besuggestive that F. hepatica, similarly to F. gigantica, secretesnucleotide-degrading enzymes. Both inosine and adenosineinduce mast cell degranulation, an event that has a centralfunction in localized inflammatory response, an importantmediator of type I hypersensitivity reactions, with adenosinebeing the more potent activator (Marquardt et al, 1978;
Tilley et al, 2000). Furthermore, inosine, which was believedto be inert for a long time, has been proven to effectivelysuppress pro-inflammatory cytokines such as IFN-g,TNF-a, and IL-12 (Hasko et al, 2000, 2004; Mabley et al,2003) in vitro and in vivo.
We assessed the concentrations of selected plasma cyto-kines and found the levels of both IL-13 and IL-5 to besignificantly higher in F. hepatica-infected rats compared withthe control group on day 22 postinfection. IL-13 maintained asignificant increase on day 43 postinfection (Figure 2E). Anenhanced Th2 immune response such as that suggested by theincrease in both IL-5 and IL-13 would serve to counteractmechanisms of inflammation. IL-13 is also an importantdirect negative regulator of inflammatory cytokines in macro-phages (Minty et al, 1993). Minimization of such an intenseimmune reaction, and hence prolongation of the periodin which the parasite can remain undetected by the host atearlier stages of infection, is clearly beneficial for the survivalof the worms.
Comparison of the systemic effects of F. hepaticawith S. mansoni and E. caproni
To ascertain the specificity of the global metabolic response ofthe rat to F. hepatica across different tissue compartments,particularly with respect to the observed modulation of theneural nucleotide balance, two further rodent-trematodemodels were compared, namely S. mansoni and E. caproni,in a murine host. Both trematodes induced a biochemicalresponse across a range of biological compartments, butwhereas S. mansoni caused pathology in the spleen and liver(Li et al, 2009), no overt necrosis was found in any tissue afterE. caproni infection (Saric et al, 2009). At a global level,E. caproni infection was predominantly characterized by
Table I Candidate biomarkers extracted through O-PLS-DA of F. hepatica-infected and uninfected rats within selected tissue compartments
pl, plasma; ur, urine; fw, fecal water; li, liver; sp, spleen; rc, renal cortex; je, jejenum; co, colon; red: relatively increased; blue: decreased levels caused by infection withF. hepatica; *o0.001.Corresponding P-values are listed.
Systemic metabolic impact of F. hepatica in the ratJ Saric et al
& 2010 EMBO and Macmillan Publishers Limited Molecular Systems Biology 2010 3
malabsorption of amino acids, which manifested predomi-nantly in the biochemical profiles of the small intestine andliver. Altered amino-acid levels and energy metabolism werealso a core signature of S. mansoni infection with disturbedlevels of choline-containing membrane components in theliver and intestinal tissues.
As the altered neural nucleotide signature was one of thestrongest metabolic responses in rats infected with F. hepatica,we directly compared the metabolic profiles of brain extractswith those from S. mansoni and E. caproni in the mouse.S. mansoni infection induced obvious changes in the meta-bolic composition of the host brain, as indicated by the PCAand PLS-DA scores plots (Supplementary Figure S3), with thePLS-DA model indicating a predictive value (Q2Y) of 0.61.Infection with S. mansoni was characterized by higher levelsof glutamine, but lower concentrations of g-aminobutyricacid (GABA), choline, phosphocholine, and scyllo-inositol(Supplementary Figure S3C). The E. caproni-infected animalscould not be statistically differentiated from the correspond-ing control group based on the brain extract spectra(Q2Y¼�0.21, data not shown), indicating that the in-fection did not systematically alter the brain biochemistry ofthe host.
Although both S. mansoni and F. hepatica induced a markedperturbation of the neurochemical profiles in their hostanimals, the patterns of differentiating metabolites weredistinct for these two trematode-rodent models, with theexception of the common effect of decreasing concentrationsof lipid degradation products, such as choline, phospho-choline, and GPC, all of which have a function in cellmembrane formation. In contrast to the perturbed immuno-logical function suggested by the altered nucleotide levels inthe brains of F. hepatica-infected animals, modulation of theneural metabolite profile by S. mansoni infection suggestedthe dominant effect related to the neurotransmitters, assupported by depleted levels of GABA and increased tissueconcentrations of glutamine, which is a substrate for bothexcitatory and inhibitory neurotransmitters, including GABA.However, as neural GABA decreased in infected animals, theincreased concentrations of glutamine are more likely to be indi-cative of a detoxification process. Compensatory locations forammonium detoxification are muscle cells and the brain, com-bining ammonia and glutamate to glutamine (Kreis et al, 1991;Olde Damink et al, 2002), which could also contribute to therelatively higher levels of glutamine in the brain extracts of S.mansoni-infected mice documented in the current investigation.
Betaine
PhCho
Cho Betaine
PhCho
CDP-Cho
PC Bile
SMGPC
Liver
Kidney
Colon
Cho
Spleen
Free AA Free AA
Free AA
Free AA
Cho ChoBetaine
PhCho
CDP-Cho CDP-ChoCDP-Cho
CDP-Cho
PC PC
PC
PLA2 PLA2
Bile BileBile
Bile
*
*
SM GPC
BetaineBetaine
PhChoPhCho
* *
*O-acetyl glycoprotein fragments (acute phase proteins)
12-Hp 12-Hp
15-Hp 15-Hp5-Hp 5-Hp
12-HE 12-HE
5-HE 5-HE
LTA4LTA4
LTB4LTB4
LA4 LA4
PGG2 PGG2
PGH2 PGH2
PGD2 TXA2 PGF2α PGF2αTXA2PGI2PGE2 PGD2 PGI2PGE2
LTE4 LTE4
LTC4 LTC4
Plasma
PC
Cho
GPCGPC
GPC
SMSM
SM
Figure 1 Summary of the systemic involvement of choline-containing species and their potential relationship with inflammatory processes. Increased immune activityin the liver- and gut-associated lymphoid tissue (GALT) in the colon on F. hepatica infection may lead to cell-internal lipid degradation to arachidonic acid, which is thesubstrate of many eicosanoic pro-inflammatory mediators. The spleen and the kidney, in which inflammatory activity is less extensive, respond to the infection withincreased betaine, which shares the same pathway. AA, amino acids; CDP-Cho, CDP-choline; Cho, choline; GPC, glycerophosphocholine; HE, hydroxyeicosatetraenoicacid; Hp, hydroxyperoxy-eicosatetranoic acid; LA, lipoxin; LT, leukotrienes; PC, phosphatidylcholine; PG, prostaglandine; PhCho, phosphocholine; PL, phospholipase;SM, sphingomyelin; TX, thromboxane; red; increased relative metabolic levels; *pro-inflammatory effects.
Systemic metabolic impact of F. hepatica in the ratJ Saric et al
4 Molecular Systems Biology 2010 & 2010 EMBO and Macmillan Publishers Limited
0.04
0.02
0
–0.02
–0.04
0.04
8.5 7.5 6.57.0 6.08.0 4.5 3.5 2.5 1.52.0 1.04.0 3.0
0.02
0
–0.02
–0.04
–0.08 –0.04 0.00 0.04 0.08
R2X
[4]=
0.09
R2X[1] = 0.36 R2X[1] = 0.14
R2X
[2]=
0.20
0.1
0
–0.1
0.1
0.2
0
–0.2
–0.3
–0.1
–0.12 –0.04 0.04 0.12
0
0.01
CH
2CH
2C=
CC
H2C
H2C
O
CH
3CH
2
CH
3
0.02
0.03
0.04
0.05
ATP ADP AMP
Adenosine
Inosine1 Adenosine dehydrogenase2 5′-nucleotidase
IFN-γIFN-γ
IFN-γ
Th1 Th2
IL-5
IL-13IL-5
B-cell B-cell
IgG2a
TC
activationMacrophageactivation
IgM/G1/A/E
Eosinophilgrowth anddifferentiation
C IL-13T IL-13
C IL-5T IL-5
35
25
15
5
d1 d8 d22 d43 d57 d71 d1 d8 d22 d43 d57 d71
160
120
80
40
A
C
E
D
B
Figure 2 Multivariate analysis of brain spectra from the F. hepatica-rat infection model. (A) PCA scores plot and (B) PLS-DA scores plot showing differences betweenF. hepatica-infected (red; c1–c12) and uninfected animals (blue; t1–t12). P-value back projection to O-PLS-DA analysis of F. hepatica-infected (upward oriented peaks)and uninfected animals (downward oriented peaks) for the aliphatic region (C) and aromatic region (D), whereby the metabolic regions differentiating between infectedand uninfected animals (Po0.05) are color coded according to the power of discrimination. (E) Schematic of intra- and extracellular adenosine–inosine interconversionin the brain by two main enzymes, 1adenosine dehydrogenase and 250-nucleotidase. The shift from adenosine toward inosine observed in the coefficient plots in (C) and(D) may lead to emphasized Th2-mediated immune mechanisms reflected by increased levels of IL-5 and, IL-13. Plasma cytokine assessment on days 1, 8, 22, 43, 57and 71 (d) post-infection confirmed significantly higher levels of IL-5 and IL-13 in the F. hepatica-infected animals (cyan and green, respectively) at day 22 postinfection inthe case of IL-5, and days 22 and 43 postinfection for IL-13, compared with the uninfected animals (blue). A, adenosine; I, inosine.
Systemic metabolic impact of F. hepatica in the ratJ Saric et al
& 2010 EMBO and Macmillan Publishers Limited Molecular Systems Biology 2010 5

Systems impact of the modulation of the neuralmetabolic phenotype of F. hepatica infection:multivariate modeling and integration ofphysiological compartments
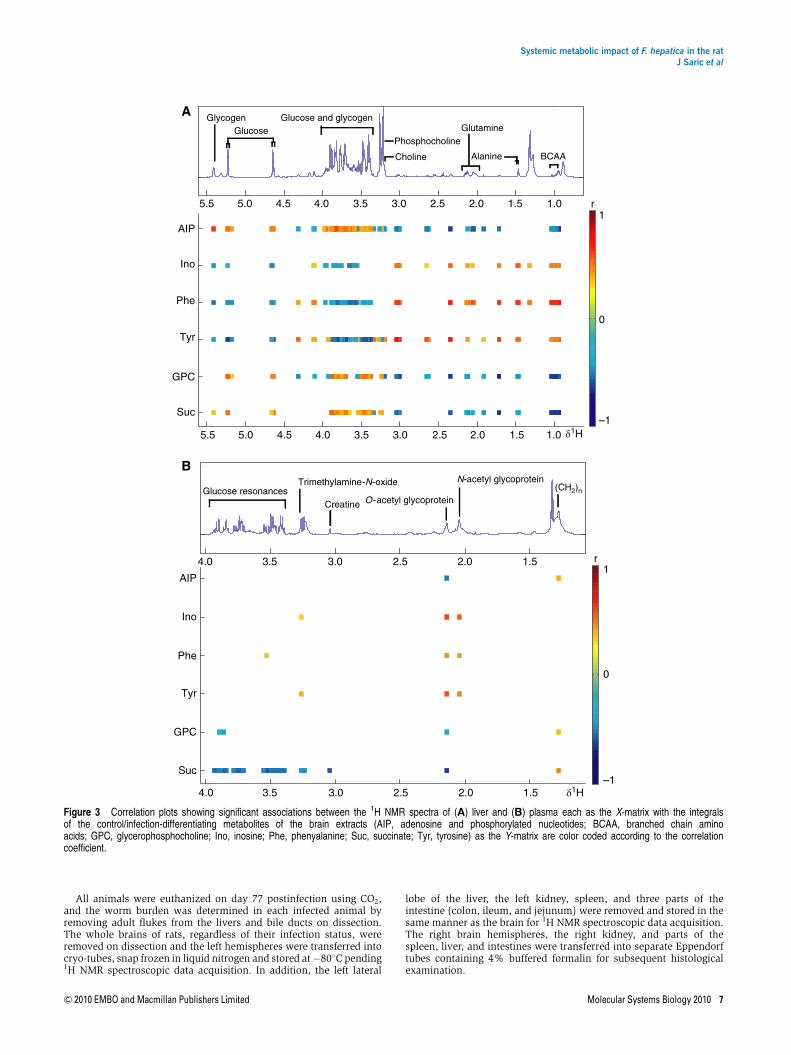
Metabolic correlates of the six important discriminatoryspectral regions containing inosine, GPC, succinate, tyrosine,phenylalanine, and the overlapped regions containingadenosine and the phosphorylated nucleotides in the braintissue of F. hepatica-infected rats were identified in each of theother tissue or biofluid matrices. Sequential correlationsbetween the integrated-discriminatory signals in the brainspectra tissue were made with the whole spectra from eachtissue and with the spectra from biofluids obtained at day 71postinfection (Figure 3; Supplementary Table SII). Here,univariate correlation of single signals was preferredover a multivariate approach to maximize informationrecovery and to infer direct inter-compartmental links betweenthe metabolites. A comprehensive list of compartment-specificcorrelations with the neural metabolites is provided inSupplementary Table SII. The liver, urine, and spleen showedthe highest number of components correlated with the selectedbrain metabolites. The high degree of correlation between themetabolic markers in the brain and the liver spectra acrossthe tissue compartments (Figure 3A) may simply relate to themagnitude of spectral changes in both organs and doesnot necessarily imply any causal relationships betweenmetabolites. The gross changes in the hepatic metaboliteprofile are reflective of direct mechanical damage of the livertissue by the migration and feeding of the juvenile fluke,whereas the effect of the parasite on remote organs such as thebrain is more difficult to rationalize. Hepatic dysfunction inF. hepatica infection is known to result in increased circulatingtoxins, such as ammonia, thiols, and phenols (Zaki et al,1983), which are typically released after hepatic failure,because of reduced ability to degrade aromatic amino acidsand ammonia. Animals infected with F. hepatica showedincreased neural concentrations of phenylalanine and tyro-sine. Indeed, it has been shown that hepatic failure induces anincreased passive permeability of the blood–brain barrier forseveral substances, among which phenylalanine and tyrosinewere found to increase up to 30% in the host brain (Zaki et al,1984).
A recurrent theme across multiple levels of this host–parasitesystem was the inflammatory response, which manifested atboth the level of structural damage and that of the metabolitesignature. The increased signal intensities of plasma acetylglycoprotein fragments were statistically associated with allsix cerebral markers of infection underscoring the presenceand global effect of a strong infection-induced inflammatoryresponse (Figure 3B; Supplementary Table SII). Interestingly, ashift has been observed in the brain nucleotides inosine andadenosine in favor of inosine, which has been shown to haveanti-inflammatory effects at the posttranscriptional level(Hasko et al, 2000), including suppression of pro-inflamma-tory cytokines (e.g. IFN-g and TNF-a) and minimizingmacrophage-mediated mechanisms of inflammation (Haskoet al, 2000, 2004; Liaudet et al, 2002). This shift may be directlyinduced by nucleotide-degrading secretory enzymes ofF. hepatica. Significant direct correlations between the selected
neural indices of F. hepatica infection and compoundsinvolved in lipid metabolism were detected.
In addition to the correlations driven by the liver pathology,direct metabolic interactions such as plasma glucose beinganti-correlated with brain succinate and 2-ketoglutarate,suggestive of an interaction through glycolysis and thetricarboxylic acid cycle, were found. Another example of suchco-variation is the inverse correlation between cerebraltyrosine and urinary hippurate, deriving from gut-microbial/mammalian co-metabolism. Direct alteration of urinarymetabolite signatures through gut-microbial species seems tobe a common feature of many host–parasite models(Martin et al, 2006; Li et al, 2008a; Saric et al, 2008; Wanget al, 2008). Here, the negative correlations of cerebraladenosine with urinary dimethylglycine and the bile acids,which are co-metabolized by gut microbiota, strengthens thenotion of a bidirectional communication between gut andbrain (gut–brain axis). This leads to the hypothesisthat nucleotide-initiated immunoactivity has a function inthe changed gut-microbial dynamics observed in parasiticinfections.
In conclusion, we have characterized the global metabolicphenotype of a host–parasite system and have shown a cleareffect of a trematode infection on the biochemical compositionof the host brain using a metabolic profiling strategy to developand pursue hypotheses relating to the observed neurochemicalchanges in the rat. F. hepatica induced a focussed response,primarily associated with the hypothesized worm-inducedshift from adenosine toward inosine and the subsequentinduction of anti-inflammatory cytokines. The coherenceof the histological, metabolic, and cytokine data furtherfacilitated elucidation of general and specific metabolic eventsand provided a means of probing inter-compartmental co-variation of metabolites. Thus, the application of a top-downsystems approach has been shown to be of value in driving thearticulation of novel mechanistic hypotheses relating to parasiticinvasion and has wide application in molecular parasitology.
Materials and methods
F. hepatica-rat model and experimental design
Experimental procedures were carried out at the Swiss Tropical andPublic Health Institute (Swiss TPH; Basel, Switzerland), adhering tolocal and national guidelines of animal welfare (permission no. 2070and 2081). A total of 24 Wistar female rats were purchased from RCC(Itingen, Switzerland) and kept under environmentally controlledconditions (temperature: 251C; relative humidity: 60–70%; light/darkcycle: 12/12 h). Rats were acclimatized for 1 week and all animals hadfree access to commercially available rodent diet obtained from Nafag(Gossau, Switzerland) and community tap water.
Rats were individually marked and group housed with four animalsper cage. Twelve rats were orally infected with 20–25 F. hepaticametacercariae each (Cullompton isolate) obtained from Mr G Graham(Addleston, UK). The remaining 12 rats were left uninfected andserved as controls.
The body weight of each animal was measured throughout theexperiment. On day 1 pre-infection and days 1, 4, 8, 15, 22, 28, 36, 43,57, and 71 postinfection, urine and feces were collected into Petridishes by rubbing the abdomen of the rats gently. Approximately 50mlof blood was collected from the tail tips collected into hematocritcapillaries (Sodium [Na] heparin coated) and spun at 10 500 g for4 min. The PCV was calculated and expressed as a percentage of theplasma ratio to red blood cells (Li et al, 2008a).
Systemic metabolic impact of F. hepatica in the ratJ Saric et al
6 Molecular Systems Biology 2010 & 2010 EMBO and Macmillan Publishers Limited
All animals were euthanized on day 77 postinfection using CO2,and the worm burden was determined in each infected animal byremoving adult flukes from the livers and bile ducts on dissection.The whole brains of rats, regardless of their infection status, wereremoved on dissection and the left hemispheres were transferred intocryo-tubes, snap frozen in liquid nitrogen and stored at�801C pending1H NMR spectroscopic data acquisition. In addition, the left lateral
lobe of the liver, the left kidney, spleen, and three parts of theintestine (colon, ileum, and jejunum) were removed and stored in thesame manner as the brain for 1H NMR spectroscopic data acquisition.The right brain hemispheres, the right kidney, and parts of thespleen, liver, and intestines were transferred into separate Eppendorftubes containing 4% buffered formalin for subsequent histologicalexamination.
1.52.53.54.5 1.02.03.04.05.05.5
r1.52.53.54.5 1.02.03.04.05.05.5
A
B
–1
0
1
δ1H
AIP
Ino
Phe
Tyr
GPC
Suc
Glucose and glycogenGlycogenGlucose
Choline
Phosphocholine
BCAAAlanine
Glutamine
1.52.53.5 2.03.04.0
AIP
Ino
Phe
Tyr
GPC
Suc
r
–1
0
11.52.53.5 2.03.04.0
δ1H
O-acetyl glycoprotein
N-acetyl glycoprotein(CH2)n
Trimethylamine-N-oxide
CreatineGlucose resonances
Figure 3 Correlation plots showing significant associations between the 1H NMR spectra of (A) liver and (B) plasma each as the X-matrix with the integralsof the control/infection-differentiating metabolites of the brain extracts (AIP, adenosine and phosphorylated nucleotides; BCAA, branched chain aminoacids; GPC, glycerophosphocholine; Ino, inosine; Phe, phenyalanine; Suc, succinate; Tyr, tyrosine) as the Y-matrix are color coded according to the correlationcoefficient.
Systemic metabolic impact of F. hepatica in the ratJ Saric et al
& 2010 EMBO and Macmillan Publishers Limited Molecular Systems Biology 2010 7

Methodology relating to the S. mansoni- and E. caproni-mousemodels has been described earlier (Saric et al, 2008, 2009; Li et al,2009) and followed a similar protocol to that described for F. hepaticainfection in the rat.
Sample preparation for 1H NMR spectroscopy
Each brain sample was placed in a mortar, mashed using a 1 mlmixture of H2O and acetonitrile (1:1, v:v) and transferred into a glasstube. Another 2 ml of the solvent mixture was used to rinse the mortartwice and transferred into the same glass tube. The brain homogenatewas centrifuged for 6 min at 10 000 g. The supernatant was collectedinto a new glass vial, evaporated overnight and lyophilized. Theresultant dry mass was resuspended into 0.55 ml of D2O untilcompletely dissolved and transferred into a 5 mm-outer-diameterNMR tube for subsequent analyses. Urine, plasma, and fecal pelletswere prepared for conventional high-resolution 1H NMR dataacquisition as described earlier (Saric et al, 2008), whereas tissuemetabolic fingerprints were acquired through magic angle spinning(MAS) 1H NMR (Saric et al, 2009).
The extraction protocol for the S. mansoni-mouse model wasslightly extended to gain additional information regarding potentialchanges in the lipid metabolic profile, as a pharmacological interven-tion was involved in the original study protocol. Each brain sampleobtained from mice infected with S. mansoni and the correspondinguninfected control mice was transferred into a 2 ml Eppendorf tubecontaining a metal bead, 0.75 ml of water, and 0.75 ml of methanol.The Eppendorf tube was placed in the tissue lyser and shaken for 5 minat the speed of 22 Hz. The resulting brain homogenate was transferredinto a glass tube. A further 0.75 ml of each liquid was used to rinse theEppendorf tube and transferred into the same glass tube. A total of1.5 ml of chloroform was added into the mixture and centrifuged at2500 g for 30 min. The aqueous and the chloroform phases weretransferred into a new glass tube each and both were left to evaporateovernight and lyophilized. Before 1H NMR analysis, the powderobtained from the aqueous phase was dissolved in 0.55 ml phosphatebuffer (D2O:H2O¼9:1, v:v, 0.01% of sodium 3-(trimethylsilyl) propionate-2,2,3,3-d4 ([TSP)], pH¼7.4), whereas the dry mass of the chloroformfraction was dissolved in deuterated chloroform (CDCl3).
Acquisition of 1H NMR spectral data
All 1H NMR spectra from rat and mouse brain extracts, urine, plasma,and fecal water were recorded on a Bruker Avance 600 NMRspectrometer (Bruker; Rheinstetten, Germany), operating at600.13 MHz for proton frequency. A 5-mm triple resonance probewith inverse detection for proton frequency was used (Bruker), using astandard one-dimensional NMR experiment with pulse sequence(recycle delay (RD)-901-t1-901-tm-901-acquisition time). Optimal watersuppression was achieved by irradiating the water frequency duringthe RD set to 2 s and the mixing time of 100 ms. The 901 pulse lengthwas adjusted to 10.62ms for the brain extracts of both the F. hepatica ratand the E. caproni-mouse models and 13.5ms for the S. mansoni-mouse model. A total of 128 scans were acquired for each sample into32k data points using a spectral width of 20 p.p.m. All free inductiondecays were multiplied by an exponential function equivalent to a0.3 Hz line-broadening factor before Fourier transformation. Liver,spleen, kidney, and intestinal samples were acquired by an MASmprobe, an NMR semi-solid state method using the parametersdescribed elsewhere (Saric et al, 2009).
Assignments of the spectral peaks were made from the literature(Nicholson et al, 1995; Coen et al, 2003; Li et al, 2008a, 2009; Saricet al, 2008) and confirmed through statistical total correlationspectroscopy (STOCSY) (Cloarec et al, 2005), and through standardtwo-dimensional NMR experiments conducted on selected samples,including correlation spectroscopy (Ernst et al, 1986), total correlationspectroscopy (Bax and Davies, 1985), and J-resolved NMR spectro-scopy (Foxall et al, 1993). For selected brain samples, high-performance liquid chromatography (HPLC) was performed to isolatechemical components relating to unidentified-discriminatory metabo-lites with spectral regions at chemical shifts of d 6.15 (doublet), d 8.60(singlet), d 8.27 (singlet), and d 4.02 (multiplet). For this purpose,
fractions were separated using an Agilent 1100 HPLC with Eclipse XDB-C18 column, 5mm, 4.6�150 mm (Agilent), attached to an Esquire6000 mass spectrometer (MS; Bruker; Rheinstetten, Germany). Analiquot of 100ml of brain extract was injected at a flow rate of 1 ml/minand signals were detected by UVat 214 nm and by MS in positive mode.A gradient of 98% water to 2% acetonitrile was used for the first 25 minand a standard gradient sequence was applied for the remaining25 min. Fractions were collected over the first 8 min and thenlyophilized and resuspended in D2O for NMR analysis. Inosine,inosine monophosphate, inosine diphosphate, inosine triphosphate,adenosine, adenosine monophosphate, adenosine diphosphate, andadenosine triphosphate were confirmed by adding authentic standardspurchased from Sigma Aldrich (Gilingham; Dorset, UK).
Data processing and analysis
The raw spectra were processed with an in-house developed MATLABscript to reduce phase and baseline distortions and manuallycalibrated to the lactate CH3 signal at d 1.33 (spectra of brain extracts,plasma, and tissue) or automatically to sodium 3-(trimethylsilyl)[2,2,3,3-2H4] propionate (TSP) at a spectral position d 0.00 (urine andfecal water). The region containing the residual water resonance wasremoved to avoid any interference with the analysis (i.e. d 4.55–5.40 inbrain extracts, d 4.2–8.0 in plasma, d 4.63–5.15 in fecal extracts, d4.23–5.32 in urine, and a similar region of Bd 4.7–5.2 was removed ineach tissue spectral dataset). Before statistical analysis, probabilisticquotient normalization was applied to all spectra and a peak alignmentscript was implemented in MATLAB to minimize chemical shiftvariation (Veselkov et al, 2009).
In a first step, PCAwas applied to the processed spectral data to gainan overview of the degree of differentiation between infected anduninfected animals or inherent groupings in each tissue and biofluidspectral dataset (Eriksson et al, 2001). PCA reduces the multivariatedata to a lower-dimensionality scores plot, without requiring anyearlier class information and delivers a snapshot of the similaritybetween observations (i.e. brain spectra) based on the linearcombination of the spectral components. In a second step, PLS-DAwas applied, as a supervised method, which uses earlier information ofclass membership, and hence optimizes separation (Eriksson et al,2001) and extraction of biomarkers associated with the infection.
O-PLS-DA is a further development of PLS-DA applied for optimalrecovery of biomarkers (Trygg and Wold, 2002), and removes systematicvariation unrelated to infection status through an orthogonal filter.The O-PLS-DA model was built by using an X-matrix containing allspectral information and a binary dummy matrix, as Y-determiningclass affiliation, for example infected or controls. Sevenfold cross-validation was applied (Bro et al, 2008) to validate the models andcalculate the goodness of prediction Q2. To validate the statisticalpower of the discriminatory metabolites, the P-values were calculatedfor each data point using 10 000 permutations and back projected tothe O-PLS-DA plot, whereby regions that significantly differentiateinfected from non-infected animals at a level of Pp0.05 are coded inred (Pitman, 1938).
For assessing the direct impact of the cerebral metabolic changescaused by F. hepatica infection, a further development of the STOCSY(Cloarec et al, 2005) and the statistical heterospectroscopy (Crockfordet al, 2006) method has been applied between two data matriceswhereby the selected regions occupied by each of the eight cerebralbiomarkers were integrated in MATLAB and represent theY-matrix. The spectral information of each other biological matrix(e.g. biofluids and all other tissues) constituted the second matrix (X)for calculating correlation structures between the spectral peaks andthe integrated metabolite information. To reduce the display complex-ity and to avoid including artifacts and noise, spectral peaks werepicked by applying a threshold of 100� the s.d. calculated from thefirst 500 data points, which consist of noise only. A 10 000-foldpermutation was embedded in the correlation script and onlycorrelations with Pp0.05 are displayed.
Cytokine multiplex quantification
Plasma from five F. hepatica-infected rats and five uninfected rats fromearlier NMR spectral preparation (e.g. 0.9% saline (NaCl) in
Systemic metabolic impact of F. hepatica in the ratJ Saric et al
8 Molecular Systems Biology 2010 & 2010 EMBO and Macmillan Publishers Limited

D2O:H2O¼1:1), over six different time points, were tested by a‘Mesoscale Multiplex Assay’ (MS6000 Rat Demonstration 7-Plex Ultra-Sensitive kit, Meso Scale Discovery). The rat demonstration ‘7-PlexUltra-Sensitivity kit’ was used for this purpose, which includes IFN-g,IL-1b, IL-4, IL-5, IL-13, KC/GRO, and TNF-a. Each sample was assessedusing duplicates and split in 15ml per well in a 96-well plate. Themethod was used according to the manufacturer’s specifications(Meso Scale Discovery, Rat cytokine assays: Rat demonstration 7-PlexUltra-Sensitive kit), with the exception of the incubation time, whichwas extended to 4 h to counteract the 1:1 dilution. An MSD Sectorimager was used to read the plates (Meso Scale Discovery, SectorImager 6000).
Supplementary information
Supplementary information is available at the Molecular SystemsBiology website (http://www.nature.com/msb).
AcknowledgementsWe thank Dr K Veselkov, S Robinette, and Dr I Yap for providing in-house software and G Calvert from Meso Scale Discovery for providingexpertise on the cytokine assay. This study received financial supportfrom the Swiss National Science Foundation to JS, JVL, JU (project no.PPOOB-102883 and PPOOB-119129), and JK (project no. PPOOA-114941), and from Chinese Academy of Sciences to YW (project no.KJCX2-YW-W11). Additional support was provided for JS by the SirHenry Wellcome Fellowship (Wellcome Trust award number P23665).
Conflict of interestThe authors declare that they have no conflict of interest.
References
Ali EM (2008) Fasciola gigantica: purification and characterization ofadenosine deaminase. Exp Parasitol 119: 285–290
Bax A, Davies DG (1985) MLEV-17-based two-dimensional homo-nuclear magnetization transfer spectroscopy. J Magn Reson 65:355–360
Beckonert O, Keun HC, Ebbels TM, Bundy J, Holmes E, Lindon JC,Nicholson JK (2007) Metabolic profiling, metabolomic andmetabonomic procedures for NMR spectroscopy of urine, plasma,serum and tissue extracts. Nat Protoc 2: 2692–2703
Bell JD, Brown JC, Nicholson JK, Sadler PJ (1987a) Assignmentof resonances for ‘acute-phase’ glycoproteins in high resolutionproton NMR spectra of human blood plasma. FEBS Lett 215: 311–315
Bell JD, Sadler PJ, Macleod AF, Turner PR, La Ville A (1987b) 1H NMRstudies of human blood plasma. Assignment of resonances forlipoproteins. FEBS Lett 219: 239–243
Bro R, Kjeldahl K, Smilde AK, Kiers HA (2008) Cross-validation ofcomponent models: a critical look at current methods. AnalBioanal Chem 390: 1241–1251
Calder PC (2008) Polyunsaturated fatty acids, inflammatory processesand inflammatory bowel diseases. Mol Nutr Food Res 52: 885–897
Calder PC (2009) Polyunsaturated fatty acids and inflammatoryprocesses: new twists in an old tale. Biochimie 91: 791–795
Cloarec O, Dumas ME, Craig A, Barton RH, Trygg J, Hudson J, BlancherC, Gauguier D, Lindon JC, Holmes E, Nicholson J (2005) Statisticaltotal correlation spectroscopy: an exploratory approach for latentbiomarker identification from metabolic 1H NMR data sets. AnalChem 77: 1282–1289
Coen M, Lenz EM, Nicholson JK, Wilson ID, Pognan F, Lindon JC(2003) An integrated metabonomic investigation of acetaminophentoxicity in the mouse using NMR spectroscopy. Chem Res Toxicol16: 295–303
Crockford DJ, Holmes E, Lindon JC, Plumb RS, Zirah S, Bruce SJ,Rainville P, Stumpf CL, Nicholson JK (2006) Statisticalheterospectroscopy, an approach to the integrated analysis ofNMR and UPLC-MS data sets: application in metabonomictoxicology studies. Anal Chem 78: 363–371
Eriksson L, Johansson E, Kettaneh-Wold N, Trygg J, Wikstrom C (2001)Multi and Megavariate Data Analysis Part I: Basic Principles andApplications. Umea, Sweden: Umetrics Academy
Ernst RRBG, Bodenhauser G, Wokaun A (1986) Principles of NuclearMagnetic Resonance in One and Two Dimensions. Oxford:Clarendon
Fairweather I (2009) Triclabendazole progress report, 2005–2009: anadvancement of learning? J Helminthol 83: 139–150
Foxall PJ, Parkinson JA, Sadler IH, Lindon JC, Nicholson JK (1993)Analysis of biological fluids using 600 MHz proton NMRspectroscopy: application of homonuclear two-dimensionalJ-resolved spectroscopy to urine and blood plasma for spectralsimplification and assignment. J Pharm Biomed Anal 11: 21–31
Gounaris K (2002) Nucleotidase cascades are catalyzed by secretedproteins of the parasitic nematode Trichinella spiralis. Infect Immun70: 4917–4924
Hasko G, Kuhel DG, Nemeth ZH, Mabley JG, Stachlewitz RF, Virag L,Lohinai Z, Southan GJ, Salzman AL, Szabo C (2000) Inosineinhibits inflammatory cytokine production by a posttranscriptionalmechanism and protects against endotoxin-induced shock.J Immunol 164: 1013–1019
Hasko G, Sitkovsky MV, Szabo C (2004) Immunomodulatory andneuroprotective effects of inosine. Trends Pharmacol Sci 25: 152–157
Holmes E, Loo RL, Stamler J, Bictash M, Yap IKS, Chan Q, Ebbels T,De Iorio M, Brown IJ, Veselkov KA, Daviglus ML, Kesteloot H,Ueshima H, Zhao L, Nicholson JK, Elliott P (2008a) Humanmetabolic phenotype diversity and its association with diet andblood pressure. Nature 453: 396–400
Holmes E, Tsang TM, Tabrizi SJ (2006) The application of NMR-basedmetabonomics in neurological disorders. NeuroRx 3: 358–372
Holmes E, Wilson ID, Nicholson JK (2008b) Metabolic phenotyping inhealth and disease. Cell 134: 714–717
Keiser J, Utzinger J (2009) Food-borne trematodiases. Clin MicrobiolRev 22: 466–483
Kreis R, Farrow N, Ross BD (1991) Localized 1H NMR spectroscopy inpatients with chronic hepatic encephalopathy. Analysis of changes incerebral glutamine, choline and inositols. NMR Biomed 4: 109–116
Lederberg J (2000) Infectious history. Science 288: 287–293Li JV, Holmes E, Saric J, Keiser J, Dirnhofer S, Utzinger J, Wang Y
(2009) Metabolic profiling of a Schistosoma mansoni infection inmouse tissues using magic angle spinning-nuclear magneticresonance spectroscopy. Int J Parasitol 39: 547–558
Li JV, Wang Y, Saric J, Nicholson JK, Dirnhofer S, Singer BH, Tanner M,Wittlin S, Holmes E, Utzinger J (2008a) Global metabolic responsesof NMRI mice to an experimental Plasmodium berghei infection.J Proteome Res 7: 3948–3956
Li M, Wang B, Zhang M, Rantalainen M, Wang S, Zhou H, Zhang Y,Shen J, Pang X, Wei H, Chen Y, Lu H, Zuo J, Su M, Qiu Y, Jia W, XiaoC, Smith LM, Yang S, Holmes E et al (2008b) Symbiotic gutmicrobes modulate human metabolic phenotypes. Proc Natl AcadSci USA 105: 2117–2122
Li Z, Vance DE (2008) Phosphatidylcholine and choline homeostasis.J Lipid Res 49: 1187–1194
Liaudet L, Mabley JG, Pacher P, Virag L, Soriano FG, Marton A, HaskoG, Deitch EA, Szabo C (2002) Inosine exerts a broad range ofantiinflammatory effects in a murine model of acute lung injury.Ann Surg 235: 568–578
Lim JH, Kim SY, Park CM (2007) Parasitic diseases of the biliary tract.Am J Roentgenol 188: 1596–1603
Mabley JG, Rabinovitch A, Suarez-Pinzon W, Hasko G, Pacher P,Power R, Southan G, Salzman A, Szabo C (2003) Inosine protectsagainst the development of diabetes in multiple-low-dose strepto-zotocin and nonobese diabetic mouse models of type 1 diabetes. MolMed 9: 96–104
Systemic metabolic impact of F. hepatica in the ratJ Saric et al
& 2010 EMBO and Macmillan Publishers Limited Molecular Systems Biology 2010 9
Marcos LA, Terashima A, Gotuzzo E (2008) Update on hepatobiliaryflukes: fascioliasis, opisthorchiasis and clonorchiasis. Curr OpinInfect Dis 21: 523–530
Marquardt DL, Parker CW, Sullivan TJ (1978) Potentiation of mast cellmediator release by adenosine. J Immunol 120: 871–878
Martin FPJ, Dumas ME, Wang Y, Legido-Quigley C, Yap IKS, Tang H,Zirah S, Murphy GM, Cloarec O, Lindon JC, Sprenger N, Fay LB,Kochhar S, van Bladeren P, Holmes E, Nicholson JK (2007) A top-down systems biology view of microbiome-mammalian metabolicinteractions in a mouse model. Mol Syst Biol 3: 112
Martin FPJ, Verdu EF, Wang Y, Dumas ME, Yap IKS, Cloarec O,Bergonzelli GE, Corthesy-Theulaz I, Kochhar S, Holmes E, LindonJC, Collins SM, Nicholson JK (2006) Transgenomic metabolicinteractions in a mouse disease model: interactions of Trichinellaspiralis infection with dietary Lactobacillus paracaseisupplementation. J Proteome Res 5: 2185–2193
Minty A, Chalon P, Derocq JM, Dumont X, Guillemot JC, Kaghad M,Labit C, Leplatois P, Liauzun P, Miloux B (1993) Interleukin-13 is anew human lymphokine regulating inflammatory and immuneresponses. Nature 362: 248–250
Nicholls AW, Mortishire-Smith RJ, Nicholson JK (2003) NMRspectroscopic-based metabonomic studies of urinary metabolitevariation in acclimatizing germ-free rats. Chem Res Toxicol 16:1395–1404
Nicholson JK, Connelly J, Lindon JC, Holmes E (2002) Metabonomics:a platform for studying drug toxicity and gene function. Nat RevDrug Discov 1: 153–161
Nicholson JK, Foxall PJ, Spraul M, Farrant RD, Lindon JC (1995)750 MHz 1H and 1H-13C NMR spectroscopy of human blood plasma.Anal Chem 67: 793–811
Nicholson JK, Holmes E, Wilson ID (2005) Gut microorganisms,mammalian metabolism and personalized health care. Nat RevMicrobiol 3: 431–438
Nicholson JK, Lindon JC, Holmes E (1999) ‘Metabonomics’understanding the metabolic responses of living systems topathophysiological stimuli via multivariate statistical analysis ofbiological NMR spectroscopic data. Xenobiotica 29: 1181–1189
Olde Damink SW, Deutz NE, Dejong CH, Soeters PB, Jalan R (2002)Interorgan ammonia metabolism in liver failure. Neurochem Int 41:177–188
Parshad VR, Guraya SS (1977) Comparative histochemicalobservations on the excretory system of helminth parasites. ZParasitenkd 52: 81–89
Pitman EJG (1938) Significance tests which may be applied to samplesfrom any populations III. The analysis of variance test. Biometrika29: 322–335
Ribeiro JM, Francischetti IM (2003) Role of arthropod saliva in bloodfeeding: sialome and post-sialome perspectives. Annu Rev Entomol48: 73–88
Saric J, Li JV, Wang Y, Keiser J, Bundy JG, Holmes E, Utzinger J(2008) Metabolic profiling of an Echinostoma caproni infection inthe mouse for biomarker discovery. PLoS Negl Trop Dis 2: e254
Saric J, Li JV, Wang Y, Keiser J, Veselkov K, Dirnhofer S, Yap IKS,Nicholson JK, Holmes E, Utzinger J (2009) Panorganismalmetabolic response modeling of an experimental Echinostomacaproni infection in the mouse. J Proteome Res 8: 3899–3911
Schreiber G, Howlett G, Nagashima M, Millership A, Martin H, UrbanJ, Kotler L (1982) The acute phase response of plasma proteinsynthesis during experimental inflammation. J Biol Chem 257:10271–10277
Tilley SL, Wagoner VA, Salvatore CA, Jacobson MA, Koller BH (2000)Adenosine and inosine increase cutaneous vasopermeability byactivating A(3) receptors on mast cells. J Clin Invest 105: 361–367
Trygg J, Wold S (2002) Orthogonal projections to latent structures(OPLS). J Chemom 16: 119–128
Tsang TM, Haselden JN, Holmes E (2009) Metabonomiccharacterization of the 3-nitropropionic acid rat model ofHuntington’s disease. Neurochem Res 34: 1261–1271
Veselkov KA, Lindon JC, Ebbels TM, Crockford D, Volynkin VV,Holmes E, Davies DB, Nicholson JK (2009) Recursive segment-wisepeak alignment of biological (1)H NMR spectra for improvedmetabolic biomarker recovery. Anal Chem 81: 56–66
Wang Y, Utzinger J, Saric J, Li JV, Burckhardt J, Dirnhofer S, NicholsonJK, Singer BH, Brun R, Holmes E (2008) Global metabolic responsesof mice to Trypanosoma brucei brucei infection. Proc Natl Acad SciUSA 105: 6127–6132
Zaki AE, Ede RJ, Davis M, Williams R (1984) Experimental studies ofblood brain barrier permeability in acute hepatic failure.Hepatology 4: 359–363
Zaki AE, Wardle EN, Canalese J, Ede RJ, Williams R (1983) Potentialtoxins of acute liver failure and their effects on blood-brain barrierpermeability. Experientia 39: 988–991
Zeisel SH, Mar MH, Howe JC, Holden JM (2003) Concentrations ofcholine-containing compounds and betaine in common foods.J Nutr 133: 1302–1307
Molecular Systems Biology is an open-access journalpublished by European Molecular Biology Organiza-
tion and Nature Publishing Group. This work is licensed under aCreative Commons Attribution-Noncommercial-Share Alike 3.0Unported License.
Systemic metabolic impact of F. hepatica in the ratJ Saric et al
10 Molecular Systems Biology 2010 & 2010 EMBO and Macmillan Publishers Limited