systems pharmacology augments drug safety surveillance
TRANSCRIPT
UC San FranciscoUC San Francisco Previously Published Works
TitleSystems pharmacology augments drug safety surveillance
Permalinkhttps://escholarship.org/uc/item/73f0w5b0
JournalClinical Pharmacology and Therapeutics, 97(2)
ISSN0009-9236
AuthorsLorberbaum, TNasir, MKeiser, MJet al.
Publication Date2015-02-01
DOI10.1002/cpt.2 Peer reviewed
eScholarship.org Powered by the California Digital LibraryUniversity of California
Systems pharmacology augments drug safety surveillance
Tal Lorberbaum1,2,3, Mavra Nasir2,3, Michael J. Keiser4,5,6, Santiago Vilar2,3, George Hripcsak2,7, and Nicholas P. Tatonetti2,3,7
1Department of Physiology and Cellular Biophysics, Columbia University, New York, NY
2Department of Biomedical Informatics, Columbia University, New York, NY
3Departments of Systems Biology and Medicine, Columbia University, New York, NY
4Department of Pharmaceutical Chemistry, University of California, San Francisco; San Francisco, CA
5Department of Bioengineering and Therapeutic Sciences, University of California, San Francisco; San Francisco, CA
6Institute for Neurodegenerative Diseases, University of California, San Francisco; San Francisco, CA
7Observational Health Data Science and Informatics, New York, NY
Abstract
Small molecule drugs are the foundation of modern medical practice yet their use is limited by the
onset of unexpected and severe adverse events (AEs). Regulatory agencies rely on post-marketing
surveillance to monitor safety once drugs are approved for clinical use. Despite advances in
pharmacovigilance methods that address issues of confounding bias, clinical data of AEs are
inherently noisy. Systems pharmacology– the integration of systems biology and chemical
genomics – can illuminate drug mechanisms of action. We hypothesize that these data can
improve drug safety surveillance by highlighting drugs with a mechanistic connection to the target
phenotype (enriching true positives) and filtering those that do not (depleting false positives). We
present an algorithm, the modular assembly of drug safety subnetworks (MADSS), to combine
systems pharmacology and pharmacovigilance data and significantly improve drug safety
monitoring for four clinically relevant adverse drug reactions.
Users may view, print, copy, and download text and data-mine the content in such documents, for the purposes of academic research, subject always to the full Conditions of use:http://www.nature.com/authors/editorial_policies/license.html#terms
Corresponding [email protected].
All supplementary materials can also be found at http://tatonettilab.org/sm/madss.
Author ContributionsTL and NPT designed the research. TL, MN, MJK, and SV performed the research. TL and NPT analyzed the data. GH and NPT contributed new reagents/ analytical tools. TL and NPT wrote the manuscript.
The authors declare that they have no conflict of interest.
HHS Public AccessAuthor manuscriptClin Pharmacol Ther. Author manuscript; available in PMC 2016 February 01.
Published in final edited form as:Clin Pharmacol Ther. 2015 February ; 97(2): 151–158. doi:10.1002/cpt.2.
Author M
anuscriptA
uthor Manuscript
Author M
anuscriptA
uthor Manuscript
Introduction
Small molecule drugs are essential in modern medical practice. However, all drugs have the
potential to cause severe side effects and even the most efficacious drugs can turn out to be
dangerous (e.g. Vioxx, Avandia).1,2 Indeed, one of the primary reasons drugs fail during
clinical trials is that they are found to cause adverse events (AEs).3 While clinical trials aim
to address drug safety issues, their inherent limitations (including number of patients,
duration of study, and homogeneity of the study population) lead to new AEs often being
discovered only after a drug has been approved.4,5 The FDA relies on pharmacovigilance
methods to monitor drug safety in the post-marketing phase. These methods primarily rely
on spontaneous reporting systems (SRSs), such as the FDA Adverse Event Reporting
System (FAERS), that collect voluntary submissions from healthcare providers and patients
as well as mandatory submissions from pharmaceutical companies. However, because these
data are passive collections of events their use is limited in cases where reporting lags
behind safety events. Interest has shifted to Medicare claims data (e.g. Observational
Medical Outcomes Partnership) and the electronic health records (e.g. FDA’s Mini-Sentinel)
where adverse drug events may potentially be detected in near real time.
Multiple quantitative signal detection algorithms have been developed to mine observational
health data for adverse drug events.6,7 These methods are primarily based on
disproportionality analysis, wherein a ratio of the observed occurrence of a drug-AE
combination to the expected occurrence for other drugs is calculated to quantify the
combination’s “unexpectedness”.8 In spite of the utility of these methods, they suffer from
known limitations due to both sampling variance (e.g. under- or over-reporting of events
depending on how established the drug-event relationship is) and reporting biases (such as
reporting disease symptoms as adverse events).8,9 Pharmacovigilance methods, such as the
multi-item gamma Poisson shrinker (MGPS) currently used by the FDA, correct for
sampling variance by estimating confidence intervals for the disproportionality statistics to
dampen unsubstantiated drug-event signals.10,11 High-dimensional propensity scoring
techniques5 and self-controlled case series12 have been developed to address issues of
reporting biases. Both of these methods work by defining a well-matched set of controls.
Despite these advances, however, pharmacovigilance methods continue to suffer from both
high false positive and false negative rates.7,8,10
These persistent limitations suggest that biological data regarding a drug’s targeted proteins
and pathways may represent a complementary avenue for predicting drug safety. In addition,
it has become increasingly apparent that the traditional pharmacological paradigm of “one
drug one target” has broken down,13 with off-target, unknown interactions leading to
unintended consequences. It is imperative, therefore, to investigate drug effects in a more
holistic context.14
Systems pharmacology (also referred to as chemical systems biology) is an emerging field
integrating physiological, biochemical, genomic, and chemical data to analyze drug actions
and side effects in the context of the molecular interactions in the cell (the “interactome”).15
For example, chemical data (e.g. a drug’s chemical structure) and biological data (e.g. a
drug’s protein targets) were recently integrated to explore common mechanisms of adverse
Lorberbaum et al. Page 2
Clin Pharmacol Ther. Author manuscript; available in PMC 2016 February 01.
Author M
anuscriptA
uthor Manuscript
Author M
anuscriptA
uthor Manuscript
events.16 To do so the authors looked for common chemical substructures or protein features
across drugs or their targets for a subset of drugs known to cause a given side effect. A
typical approach in systems pharmacology is to convert these data to a “network” consisting
of nodes and edges. Nodes represent biological entities, such as proteins or small molecules,
and edges represent relationships between these entities, such as protein-protein interactions
or drug-target binding affinities. This representation enables the application of graph theory
– a mature sub-domain of mathematics – to systems pharmacology data.14 Graph theoretic
approaches were used to discover that proteins commonly form highly intra-connected sub-
networks called modules according to shared biological function.14 These modules have
been used to identify pathways that mediate the therapeutic and adverse effects of drugs17,18
and to predict previously unknown AEs.19 While systems pharmacology data has been used
in specific cases to predict drug side effects, it has not yet been established that integrating
these approaches would improve pharmacovigilance.
We hypothesized that incorporating systems pharmacology data into drug safety
surveillance would improve pharmacovigilance by reducing the rate of false positives while
simultaneously enriching for true positives. Here we present a method called the Modular
Assembly of Drug Safety Subnetworks (MADSS). For a given adverse event, MADSS
integrates multiple chemical and biological data sources into a common network and
identifies a module, which we refer to as an “AE neighborhood,” representing a putative AE
mechanistic pathway. The AE-module and the network are then used to evaluate each drug
for its potential relationship to the AE. Our hypothesis is that drugs targeting proteins in this
“AE neighborhood” are more likely to cause the AE. A recent “medication-wide association
study” (MWAS) performed a multivariate analysis to generate pharmacovigilance statistics
for four clinically important adverse events - upper gastrointestinal bleeding, acute liver
failure, acute myocardial infarction, and acute kidney failure - but was unable to eliminate
many false positives and false negatives.20 We validate MADSS by showing that the
combination of systems pharmacology models and MWAS statistics leads to significant
improvements in safety predictions for all four AEs individually and combined compared to
MWAS alone. We evaluate multiple network analysis parameters to demonstrate the
flexibility of the method in evaluating either an individual or combination of AEs. Finally,
using the chemical and biological data integrated in MADSS we investigate the potential
mechanisms of drug AEs and show that multiple drug classes can act through shared
functional clusters to elicit AEs.
Results
We used the Modular Assembly of Drug Safety Subnetworks (MADSS) algorithm (Figure
1) to integrate human protein-protein interaction (PPI) data from the Search Tool for the
Retrieval of Interacting Genes/Proteins (STRING)21 with genetic data for four adverse
events: gastrointestinal bleeding (GI), acute liver failure (LF), acute myocardial infarction
(MI), and acute kidney failure (KF). The PPI network from STRING contains 13,926
proteins (nodes) and 217,823 interactions (edges) derived from physical interaction
experiments, co-expression data, literature co-mentions, and molecular pathway databases.
We curated a set of proteins with primary data linking them to each of the four conditions
irrespective of drug involvement (8, 58, 320, and 41 genes for GI, LF, MI, and KF,
Lorberbaum et al. Page 3
Clin Pharmacol Ther. Author manuscript; available in PMC 2016 February 01.
Author M
anuscriptA
uthor Manuscript
Author M
anuscriptA
uthor Manuscript
respectively; see Materials and Methods). We pared down these protein sets to ensure high
interconnectivity (Materials and Methods), resulting in 8, 15, 10, and 35 proteins in our “AE
seed sets” for GI, LF, MI, and KF, respectively (Supplementary Table S1).
Our hypothesis is that drugs targeting proteins with high connectivity to the seed sets will be
more likely to cause the adverse event. We scored all 13,926 proteins for their connectivity
to each AE seed set using four functions (Supplementary Figure S1; see Materials and
Methods). We then used a reference standard containing a total of 149 positive and negative
control drugs for each of the four adverse events (GI, LF, MI, and KF) created by combining
literature review and natural language processing of product labels.20 Of 149 total drugs,
there were 77, 95, 79, and 53 controls for GI, LF, MI, and KF, respectively.
We assigned each drug the score of its most highly connected target protein that was itself
not a seed protein (Supplementary Figure S2). This results in a dataset with each drug being
represented by four scores of connectivity functions. We used these connectivity scores to
train two machine learning algorithms, logistic regression and random forests. This results in
four drug safety subnetwork (SubNet) models (one for each AE). In addition, we also
grouped all AEs together to build a global model of adverse effects (Materials and
Methods). We found that the random forest algorithm significantly outperformed logistic
regression at linking drugs to their known side effects for each of the four events
(Supplementary Figure S3).
Improving drug safety predictions using systems pharmacology
We investigated the additive contribution of systems pharmacology models (SubNet) to
pharmacovigilance statistics (MWAS) in predicting drug safety. We found that, individually,
both MWAS (β=0.79 ±0.18, P = 1.05e−5) and SubNet (β=4.34 ±0.58, P = 7.42e−14) were
significant predictors of adverse events. In addition, we found the combined model
outperformed the univariate models (χ2= 75.9, P< 1 ×10⁻¹⁵). The Area Under the Receiver
Operating Characteristic Curve (AUROC) is the probability of successfully differentiating
two randomly chosen drugs, one that causes the AE and one that does not. For the combined
model we found an AUROC of 0.85 compared to 0.81 and 0.69 for SubNet-alone and
MWAS-alone, respectively (Figure 2A). In addition to outperforming overall, the combined
model also outperformed for each adverse event individually (Figure 2B) with
improvements in AUROC of 6.2% (P = 0.10), 33.9% (P = 0.047), 15.3% (P = 0.01), and
27.3% (P = 0.007) for GI, LF, MI, and KF, respectively. We found these results are reliable
across different performance measures (Figure 2C). Finally, we observed improvements in
both sensitivity and specificity in MWAS+SubNet compared to MWAS and SubNet alone
for each AE (Table 1, Supplementary Table S4). At a false positive rate of 20%, sensitivity
(i.e. recall) improves from 42%, for MWAS alone, to 70% when drug safety statistics are
combined with systems pharmacology data.
Evaluating choice of model parameters
MADSS has many parameters (network connectivity function, validated versus predicted
drug targets, PPI confidence, PPI relationship, PPI data source, and drug target type) (Figure
1). We evaluated the effects of each of these parameters on model performance for each AE
Lorberbaum et al. Page 4
Clin Pharmacol Ther. Author manuscript; available in PMC 2016 February 01.
Author M
anuscriptA
uthor Manuscript
Author M
anuscriptA
uthor Manuscript
while holding all other parameters constant (Supplementary Material, Supplementary Figure
S4). We found the best performance when using all PPIs of “medium” confidence and above
and all known drug targets (see Supplementary Material).
Exploring mechanisms of adverse events
To interrogate potential mechanisms of adverse events, we investigated the interactions
between high-scoring drug targets and seed proteins. While some drug targets were direct
neighbors of seeds, others were linked to seed proteins through intermediates. We calculated
the shortest paths from high-scoring drug targets to all seeds and mapped the AE
neighborhood by clustering drugs, drug targets, and intermediate proteins into functional
groups (Figure 3, Supplementary Figures S5, S6, S7). The AE neighborhood for MI is
enriched for drug targets involved in G-protein signaling coupled to cyclic nucleotide
second messengers (P = 3.4E−7) (HTR1A, HTR1B, ADRB2, CHRM2, and DRD2; see Figure
3). Intermediate proteins connecting targets to MI seeds are involved in cAMP biosynthesis
(P = 1.9E−17) and inflammatory responses (P = 7.2E−17). Seeds integrating the greatest
number of shortest paths were the beta-1 adrenergic receptor (ADRB1) and interleukin 6
(IL6) (61 and 52 shortest paths (sp), respectively).
We found enrichment for cytochrome P450 enzymes for both GI and LF high-scoring
targets (P = 2.4E−7 and P = 5.5E−4, respectively) (Supplementary Figures S5 and S6).
Intermediates in the AE neighborhood for GI were enriched for proteins involved in
arachidonic acid metabolism (P = 4.3E−37), and the seeds integrating the majority of
shortest paths were COX-1 and COX-2 (PTGS1 (97 sp) and PTGS2 (108 sp), respectively).
In the AE neighborhood for LF, we observed enrichment of intermediates involved in
cellular calcium ion homeostasis (P = 2.8E−27), with the seeds liver activation regulated
chemokine (CCL20, 115 sp) and corticotropin (POMC, 124 sp) integrating most of the
shortest paths. Lastly, high-scoring drug targets within the AE neighborhood for KF were
enriched for proteins involved in blood pressure regulation (P = 1.3E−5) (Supplementary
Figure S7). Intermediates consisted mainly of organic ion transporters (P = 1.4E−3), with
renin (REN, 6 sp), albumin (ALB, 4 sp), kinogen-1 (KNG1, 4 sp), and hepatocyte growth
factor (HGF, 4 sp) acting as the most highly integrative seeds.
Discussion
Drug safety surveillance resources (e.g. spontaneous adverse event reports and electronic
health records) suffer from issues of confounding bias, noise, and missing data. These
challenges limit the usefulness of pharmacovigilance algorithms because they lead to
inadvertently flagging false signals and hiding true ones. We reasoned that incorporation of
an approach never exposed to these biases –systems pharmacology models of the molecular
connections between drugs and AEs – could help alleviate these shortcomings. Furthermore,
with ever-growing resources of interaction data on the horizon,22 a mechanistically driven
method that scales to large and diverse data sets has the potential to shape the drug safety
landscape. We demonstrate this potential by successfully combining our systems
pharmacology approach (MADSS) with traditional pharmacovigilance statistics to
significantly improve the prediction of four serious adverse drug events.
Lorberbaum et al. Page 5
Clin Pharmacol Ther. Author manuscript; available in PMC 2016 February 01.
Author M
anuscriptA
uthor Manuscript
Author M
anuscriptA
uthor Manuscript
High-scoring targets are biologically relevant mediators of adverse events
Many of the high-scoring drug targets in our AE neighborhoods received support in the
literature for their involvement in mediating adverse events. For example, decreases in
prostacyclin synthesis due to COX-2 (PTGS2) inhibition is well-known to increase risk of
myocardial infarction.23 Serotonin has also been implicated in coronary artery disease,24 a
major cause of myocardial infarction,25 and serotonin 5-HT1B receptors (HTR1B) mediate
coronary vasoconstriction.26 HTR1A and HTR1B ranked 245 and 269 (top 2%), respectively
in the AE neighborhood for MI constructed using mean first passage time (MFPT);
activation of another serotonin receptor (HTR2A, rank 379) is known to increase synthesis of
interleukin-6 (IL6, one of the MI seeds) in vascular smooth muscle, contributing to pro-
inflammatory pathways.27
Other high-scoring targets such as RXRA suggest less-characterized potential mechanisms of
adverse events. Etodolac, a non-steroidal anti-inflammatory drug (NSAID), binds to the
retinoid X receptor-α (RXRα), leading to its degradation.28 Complexes of peroxisome
proliferator-activated receptors (PPARs) and RXRα are thought to play anti-inflammatory
and anti-atherogenic roles in coronary artery disease.29 Additionally, decreased expression
of RXRαhas been associated with more pronounced carotid atherosclerotic disease
progression;30 carotid atherosclerosis has been shown to be predictive of future MI.31
AE neighborhood intermediates are important transducers of drug action
Pathways enriched in our AE neighborhoods are also supported in the literature. For MI,
inflammatory pathways are a key element of coronary artery disease progression.32 The role
of cAMP biosynthesis by adenylyl cyclase downstream of beta adrenergic receptor
activation during heart failure is also well-established.33 In the AE neighborhood for GI,
genes related to arachidonic acid metabolism have long been recognized to be involved in
NSAID-induced gastric bleeding.34 Additionally, perturbations to calcium ion homeostasis
have been implicated as a mechanism of drug-induced liver injury.35
Limitations of method
There are several existing limitations to the method described. First, the method is
dependent on the existence of a seed set of proteins that are, ideally, causally linked to the
adverse event. Except for a few instances, such genes are largely unavailable for adverse
events. To address this issue in this study we used genes linked to the 4 conditions (i.e.,
gastrointestinal bleeding, acute liver failure, acute myocardial infarction, and acute kidney
failure) irrespective of drug association. In addition, we currently assume a single
mechanism of action for each AE. Off-target screening and quantitative structure-activity
relationship (QSAR) models would complement our approach in cases when drug target
information is lacking or absent.
The results of our model evaluation showed that optimization across multiple AEs
occasionally involved making sacrifices to the quality of an individual AE’s predictions. For
example, we observed better performance for MI alone when only protein-protein
interactions related to expression were used. Additionally, the performance for GI was lower
than for the other three AEs; allowing the use of seeds for drug scoring led to an increase in
Lorberbaum et al. Page 6
Clin Pharmacol Ther. Author manuscript; available in PMC 2016 February 01.
Author M
anuscriptA
uthor Manuscript
Author M
anuscriptA
uthor Manuscript
performance for GI with no comparable improvement for the other AEs, suggesting that
more drugs in the GI reference standard (such as non-steroidal anti-inflammatory agents) act
mechanistically through the seeds than through alternative targets (Supplementary Figure
S2). Future applications of MADSS can benefit from the flexibility of optimizing across
multiple or individual AEs.
We were unable to completely eliminate incidence of false positives using MADSS,
although we observed improvements in both sensitivity and specificity compared to MWAS
for each AE (Table 1, Supplementary Table S4). In addition, the performance of our
approach may suffer when there is little known about a drug, as is the case when a drug is
“first-in-class.” We evaluated the performance under this situation (Supplementary Material)
and found that MADSS was still able to eliminate many of the false positives found using
traditional drug safety statistics (Supplementary Table S5).
In addition to predicting single drug adverse events, systems pharmacology is also poised to
help identify drug-drug interactions (DDIs).36–38 Future iterations of MADSS could
combine network-based predictions of DDIs with statistical predictions.5
In conclusion, we present a new method leveraging protein-protein interaction network
analysis to improve pharmacovigilance. The method is by design modular, allowing for the
incorporation of diverse data sets and optimization for the desired adverse event(s). While
we elected to use the self-controlled case series statistics used in the MWAS study in
combination with SubNet, an individual or regulatory agency using MADSS can easily
substitute any desired pharmacovigilance statistic. In addition, seed sets for new adverse
events can be generated with minimal input, and new drugs can quickly be evaluated using
predicted targets. Regulatory agencies can flag signals enriched using our method for
follow-up study. We demonstrate that combining systems pharmacology models with
pharmacovigilance leads to significant and meaningful improvements in predicting drug
safety.
Materials and Methods
Modular Assembly of Drug Safety Subnetworks (MADSS)
An outline of MADSS (Modular Assembly of Drug Safety Subnetworks) can be found in
Figure 1. We applied MADSS to four pathological conditions, which may be drug-induced
adverse events (AEs) –upper gastrointestinal bleeding (GI), acute liver failure (LF), acute
myocardial infarction (MI), and acute kidney failure (KF).
Pruning network
We first pruned an initial protein-protein interaction (PPI) network representative of a
composite human cell to eliminate low-confidence interactions. We used STRING 9.1
(Search Tool for the Retrieval of Interacting Genes/Proteins), a meta-database of PPIs
including data from BioGRID, MINT, KEGG, HPRD, and Reactome, as well as co-
occurrence and natural language processing text mining.21 Beginning with all PPIs in
humans, we pruned the network to only utilize PPIs with a confidence score ≥700 (out of a
Lorberbaum et al. Page 7
Clin Pharmacol Ther. Author manuscript; available in PMC 2016 February 01.
Author M
anuscriptA
uthor Manuscript
Author M
anuscriptA
uthor Manuscript
maximum score of 1000; see Supplementary Material). We refer to this pruned network as
the interactome.
Assigning adverse event (AE) seeds
We identified a small set of proteins with established relationships to each of these four
conditions and annotated these proteins as AE seeds. In general, the molecular etiology of
adverse events is not well understood. Therefore, we curated initial lists of seed proteins by
manually mining GeneCards39 and PubMed for gene or protein names and aliases co-
occurring with these four conditions irrespective of drug involvement (Supplementary Table
S2). We then refined these lists to a core set of interconnected proteins which we call the
“AE seed set” (see Supplementary Material).
Building AE neighborhoods
Multiple metrics exist for characterizing the connectivity between two nodes in a given
network. These include mean first passage time (which measures the proximity of two
nodes); betweenness centrality (the fraction of shortest paths containing a node of interest);
shared neighbors (the fraction of shared adjacent nodes between two nodes of interest); and
inverse shortest path (the smallest number of edges connecting two nodes). We adapted each
of these functions to score proteins in the interactome on the basis of their connectivity to
the seed proteins. Proteins receiving high connectivity scores are on average more connected
to the seeds than to the rest of the network and thus constitute a subnetwork of the global
interactome which we call an AE neighborhood. See Supplementary Material for equations
and descriptions of each of the four connectivity functions.
Connecting drugs to their targets
We downloaded DrugBank 3.0, a manually annotated database connecting 1691 approved
drugs to 2074 protein targets.40 Only those drugs in the reference standard which could be
mapped to DrugBank IDs (143 of 149) were used in this analysis. For a given adverse event
and reference standard drug, we compared the connectivity scores of each protein target and
assigned the drug to its highest scoring non-seed target. The result of this is a data matrix for
each adverse event where each row represents a drug and each column represents one of the
four connectivity functions. The value at a given row and column is the connectivity score
for the given drug’s highest scoring target (Supplementary Table S3).
Fitting subnetwork model (SubNet) and predicting drug safety
For each adverse event, we trained a random forest (RF) classifier using the drug scores for
the four network functions as input parameters (or “features”). The classifier uses patterns
within these features to predict whether a given drug will or will not cause an AE. We
utilized out-of-bag (OOB) scores to get an unbiased estimate of classifier performance (for a
primer on machine learning approaches, see Supplementary Material). To account for the
stochastic nature of random forests we used the mean and standard deviation of 20 replicates
to characterize performance. We refer to these systems pharmacology subnetwork models as
SubNet. SubNet defines a network link between a drug, target proteins, AE neighborhood
proteins, and AE.
Lorberbaum et al. Page 8
Clin Pharmacol Ther. Author manuscript; available in PMC 2016 February 01.
Author M
anuscriptA
uthor Manuscript
Author M
anuscriptA
uthor Manuscript
To determine the combined performance of SubNet models and pharmacovigilance statistics
(MWAS), we trained a logistic regression classifier on the predictions (OOB estimates) from
the final SubNet models and the MWAS drug scores as features. We characterized the
generalization error using mean and standard deviation 10-fold cross-validation (MWAS
+SubNet). We used an analysis of variance (ANOVA) to determine the additive contribution
of the systems pharmacology models (SubNet) with the statistical pharmacovigilance
methods (MWAS).
Evaluating the subnetwork (SubNet) models
We performed two sets of evaluations: (i) evaluating the overall performance combining all
four adverse events and (ii) evaluating the performance for each of the four adverse events
independently. In either case we generated receiver operating characteristic (ROC) curves
for MWAS alone, SubNet alone, and then for MWAS and SubNet combined. In addition we
also calculated the mean and 95% confidence intervals for area under ROC curve
(AUROC), F1 score (a measure combining both precision and recall), and accuracy. We
evaluated “first-in-class” performance using drugs in the reference standard which were
alone in their Anatomical Therapeutic Chemical (ATC) level 2 classification category
(Supplementary Table S5). All evaluations were conducted using estimates derived from
OOB predictions or cross-validation.
Identifying shared mechanisms of adverse events
For each adverse event, we calculated shortest paths through our derived systems
pharmacology AE neighborhoods to each of the seeds from the drug targets receiving high
mean first passage time connectivity scores. We manually grouped intermediate proteins
(those between drug targets and AE seed proteins) by their connectivity profiles in this
network and performed enrichment analysis to assign functional labels. We consolidated
edges from multiple targets to the same intermediate or seed. We weighted edges between a
seed and the adverse event by the number of shortest paths that were integrated by that
particular seed. All intermediate proteins involved in shortest paths from targets to seeds
were used to generate the representation in Figure 3.
Implementation
All scripts were written in Python 2.7.5. Network analysis was performed using custom
scripts and NetworkX.41 Machine learning was performed using Scikit-learn.42 Logistic
regression and ANOVA were performed using glm in R 3.0.3. AUROC comparison
(DeLong’s test) was performed using pROC in R 3.0.3.43 Enrichment analysis was
performed using DAVID Functional Annotation.44 Network representations were created
using Cytoscape 3.0.2 and 3.1.0.45
Supplementary Material
Refer to Web version on PubMed Central for supplementary material.
Lorberbaum et al. Page 9
Clin Pharmacol Ther. Author manuscript; available in PMC 2016 February 01.
Author M
anuscriptA
uthor Manuscript
Author M
anuscriptA
uthor Manuscript
Acknowledgements
TL is supported by the National Heart, Lung, and Blood Institute (T32HL120826). SV and GH are supported by the National Library of Medicine (R01 LM006910). MJK is supported by NIH grants GM93456 and MH099712. TL and NPT are supported by the National Institute of General Medical Sciences (R01GM107145) and a PhRMA Foundation Research Starter Award.
References
1. Graham DJ, et al. Risk of acute myocardial infarction and sudden cardiac death in patients treated with cyclo-oxygenase 2 selective and non-selective non-steroidal anti-inflammatory drugs: nested case-control study. Lancet. 2005; 365:475–481. [PubMed: 15705456]
2. Nissen SE, Nissen SE, Wolski K, Wolski K. Effect of Rosiglitazone on the Risk of Myocardial Infarction and Death from Cardiovascular Causes. N. Engl. J. Med. 2007; 356:2457–2471. [PubMed: 17517853]
3. Kola I, Landis J. Can the pharmaceutical industry reduce attrition rates? Nat. Rev. Drug. Discov. 2004; 3:711–715. [PubMed: 15286737]
4. Berlin JA, et al. Adverse event detection in drug development: recommendations and obligations beyond phase 3. Am. J. Public Health. 2008; 98:1366–1371. [PubMed: 18556607]
5. Tatonetti NP, Ye PP, Daneshjou R, Altman RB. Data-Driven Prediction of Drug Effects and Interactions. Science Translational Medicine. 2012; 4:125ra31–125ra31.
6. Harpaz R, et al. Novel Data-Mining Methodologies for Adverse Drug Event Discovery and Analysis. Clin. Pharmacol. Ther. 2012; 91:1010–1021. [PubMed: 22549283]
7. Ryan PB, et al. Empirical assessment of methods for risk identification in healthcare data: results from the experiments of the Observational Medical Outcomes Partnership. Statist. Med. 2012; 31:4401–4415.
8. Bate A, Evans SJW. Quantitative signal detection using spontaneous ADR reporting. Pharmacoepidem. Drug Safe. 2009; 18:427–436.
9. Stephenson WP, Hauben M. Data mining for signals in spontaneous reporting databases: proceed with caution. Pharmacoepidem. Drug Safe. 2007; 16:359–365.
10. DuMouchel W. Bayesian data mining in large frequency tables, with an application to the FDA spontaneous reporting system. The American Statistician. 1999; 53:177–190.
11. Szarfman A, Machado SG, O’Neill RT. Use of screening algorithms and computer systems to efficiently signal higher-than-expected combinations of drugs and events in the US FDA’s spontaneous reports database. Drug Saf. 2002; 25:381–392. [PubMed: 12071774]
12. Simpson SE. A Positive Event Dependence Model for Self-Controlled Case Series with Applications in Postmarketing Surveillance. BIOM. 2012; 69:128–136.
13. Hopkins AL. Network pharmacology: the next paradigm in drug discovery. Nat. Chem. Biol. 2008; 4:682–690. [PubMed: 18936753]
14. Jacunski A, Tatonetti NP. Connecting the Dots: Applications of Network Medicine in Pharmacology and Disease. Clin. Pharmacol. Ther. 2013
15. Berger SI, Iyengar R. Network analyses in systems pharmacology. Bioinformatics. 2009; 25:2466–2472. [PubMed: 19648136]
16. Duran-Frigola M, Aloy P. Analysis of Chemical and Biological Features Yields Mechanistic Insights into Drug Side Effects. Chemistry & Biology. 2013; 20:594–603. [PubMed: 23601648]
17. Berger SI, Ma'ayan A, Iyengar R. Systems Pharmacology of Arrhythmias. Science Signaling. 2010; 3:ra30–ra30. [PubMed: 20407125]
18. Gottlieb A, Altman RB. Integrating systems biology sources illuminates drug action. Clin. Pharmacol. Ther. 2014
19. Cami A, Arnold A, Manzi S, Reis B. Predicting Adverse Drug Events Using Pharmacological Network Models. Science Translational Medicine. 2011; 3:114ra127–114ra127.
20. Ryan PB, Madigan D, Stang PE, Schuemie MJ, Hripcsak G. Medication-Wide Association Studies. CPT: Pharmacomet. Syst. Pharmacol. 2013; 2:e76.
Lorberbaum et al. Page 10
Clin Pharmacol Ther. Author manuscript; available in PMC 2016 February 01.
Author M
anuscriptA
uthor Manuscript
Author M
anuscriptA
uthor Manuscript
21. Franceschini A, et al. STRING v9.1: protein-protein interaction networks, with increased coverage and integration. Nucleic Acids Research. 2012; 41:D808–D815. [PubMed: 23203871]
22. Law V, et al. DrugBank 4.0: shedding new light on drug metabolism. Nucleic Acids Research. 2013; 42:D1091–D1097. [PubMed: 24203711]
23. Krotz F, et al. Selective COX-2 inhibitors and risk of myocardial infarction. J. Vasc. Res. 2005; 42:312–324. [PubMed: 15976506]
24. Vikenes K, Farstad M, Nordrehaug JE. Serotonin Is Associated with Coronary Artery Disease and Cardiac Events. Circulation. 1999; 100:483–489. [PubMed: 10430761]
25. Nabel EG, Nabel EG, Braunwald E, Braunwald E. A Tale of Coronary Artery Disease and Myocardial Infarction. N. Engl. J. Med. 2012; 366:54–63. [PubMed: 22216842]
26. Nilsson T, et al. Characterisation of 5-HT receptors in human coronary arteries by molecular and pharmacological techniques. Eur. J. Pharmacol. 1999; 372:49–56. [PubMed: 10374714]
27. Ito T, Ikeda U, Shimpo M, Yamamoto K, Shimada K. Serotonin Increases Interleukin-6 Synthesis in Human Vascular Smooth Muscle Cells. Circulation. 2000; 102:2522–2527. [PubMed: 11076827]
28. Kolluri SK, et al. The R-enantiomer of the nonsteroidal antiinflammatory drug etodolac binds retinoid X receptor and induces tumor-selective apoptosis. Proceedings of the National Academy of Sciences. 2005; 102:2525–2530.
29. Libby P. Current Concepts of the Pathogenesis of the Acute Coronary Syndromes. Circulation. 2001; 104:365–372. [PubMed: 11457759]
30. Giaginis C, et al. Correlation of Peroxisome Proliferator-Activated Receptor-gamma (PPAR-gamma) and Retinoid X Receptor-alpha (RXR-alpha) expression with clinical risk factors in patients with advanced carotid atherosclerosis. Med. Sci. Monit. 2011; 17:CR381–CR391. [PubMed: 21709632]
31. Hald EM, et al. Carotid Atherosclerosis Predicts Future Myocardial Infarction But Not Venous Thromboembolism: The Tromso Study. Arteriosclerosis, Thrombosis, and Vascular Biology. 2013; 34:226–230.
32. Hansson GK. Inflammation, atherosclerosis, and coronary artery disease. N. Engl. J. Med. 2005; 352:1685–1695. [PubMed: 15843671]
33. Marks AR. Calcium cycling proteins and heart failure: mechanisms and therapeutics. J. Clin. Invest. 2013; 123:46–52. [PubMed: 23281409]
34. Langenbach R, et al. Prostaglandin synthase 1 gene disruption in mice reduces arachidonic acid-induced inflammation and indomethacin-induced gastric ulceration. Cell. 1995; 83:483–492. [PubMed: 8521478]
35. Sturgill MG, Lambert GH. Xenobiotic-induced hepatotoxicity: mechanisms of liver injury and methods of monitoring hepatic function. Clin. Chem. 1997; 43:1512–1526. [PubMed: 9265903]
36. Zhao X-M, et al. Prediction of Drug Combinations by Integrating Molecular and Pharmacological Data. PLoS Comput. Biol. 2011; 7:e1002323. [PubMed: 22219721]
37. Wang Y-Y, et al. Exploring drug combinations in genetic interaction network. BMC Bioinformatics. 2012; 13:S7.
38. Cheng F, Zhao Z. Machine learning-based prediction of drug-drug interactions by integrating drug phenotypic, therapeutic, chemical, and genomic properties. Journal of the American Medical Informatics Association. 2014
39. Stelzer G, et al. In-silico human genomics with GeneCards. Hum. Genomics. 2011; 5:709–717. [PubMed: 22155609]
40. Knox C, et al. DrugBank 3.0: a comprehensive resource for ‘Omics’ research on drugs. Nucleic Acids Research. 2010; 39:D1035–D1041. [PubMed: 21059682]
41. Hagberg A, Swart P, S Chult D. Exploring network structure, dynamics, and function using NetworkX. 2008
42. Pedregosa F, et al. Scikit-learn: Machine learning in Python. The Journal of Machine Learning Research. 2011; 12:2825–2830.
43. Robin X, et al. pROC: an open-source package for R and S+ to analyze and compare ROC curves. BMC Bioinformatics. 2011; 12:77. [PubMed: 21414208]
Lorberbaum et al. Page 11
Clin Pharmacol Ther. Author manuscript; available in PMC 2016 February 01.
Author M
anuscriptA
uthor Manuscript
Author M
anuscriptA
uthor Manuscript
44. Huang DW, Sherman BT, Lempicki RA. Systematic and integrative analysis of large gene lists using DAVID bioinformatics resources. Nat. Protoc. 2008; 4:44–57.
45. Smoot ME, Ono K, Ruscheinski J, Wang PL, Ideker T. Cytoscape 2.8: new features for data integration and network visualization. Bioinformatics. 2011; 27:431–432. [PubMed: 21149340]
Lorberbaum et al. Page 12
Clin Pharmacol Ther. Author manuscript; available in PMC 2016 February 01.
Author M
anuscriptA
uthor Manuscript
Author M
anuscriptA
uthor Manuscript
Study Highlights
• What is the current knowledge on the topic?
State-of-the-art pharmacovigilance algorithms suffer from high false positive and false
negative rates. Systems pharmacology and network analysis offer complementary
approaches for integrating biological data towards mechanistic insight of drug action.
• What question did this study address?
Will the combination of systems pharmacology models and pharmacovigilance statistics
improve drug safety surveillance?
• What this study adds to our knowledge?
Through the modular assembly of drug safety subnetworks, we demonstrate that systems
pharmacology models can be successfully combined with current pharmacovigilance
statistics across a range of etiologically diverse adverse events to improve predictive
power.
• How this might change clinical pharmacology and therapeutics?
Post-marketing surveillance strategies should incorporate systems pharmacology models
to enrich for potentially dangerous candidate drugs for follow-up study, ultimately
reducing the health and economic impact of adverse events.
Lorberbaum et al. Page 13
Clin Pharmacol Ther. Author manuscript; available in PMC 2016 February 01.
Author M
anuscriptA
uthor Manuscript
Author M
anuscriptA
uthor Manuscript

Figure 1. Overview of Modular Assembly of Drug Safety Subnetworks (MADSS). Orange boxes
indicate data sources used in this analysis. Gray boxes indicate additional data sources not
used in this study but supported by the method. Beginning with a human protein-protein
interaction network (interactome) built from such data as experimental evidence, metabolic
pathway databases, text mining, and interactions predicted from co-expression data, we
isolate all medium-confidence interactions and above. Seed proteins with demonstrated
genetic links to the adverse event (AE) are subsequently annotated. We next apply four
adapted network analysis functions to score all proteins in the interactome on their
connectivity to the seed set. Proteins with high scores embody an AE neighborhood (gray
dotted circle); drugs targeting proteins in this subnetwork are predicted to elicit AEs. We
assign positive and negative control drugs to their highest-scoring target. We then combine
the four AE neighborhoods (one for each pairwise network function) by training a random
forest classifier to generate a subnetwork (SubNet) model (red dotted circle). We integrate
MWAS and systems pharmacology (SubNet) models using a logistic regression classifier to
predict drug safety.
Lorberbaum et al. Page 14
Clin Pharmacol Ther. Author manuscript; available in PMC 2016 February 01.
Author M
anuscriptA
uthor Manuscript
Author M
anuscriptA
uthor Manuscript
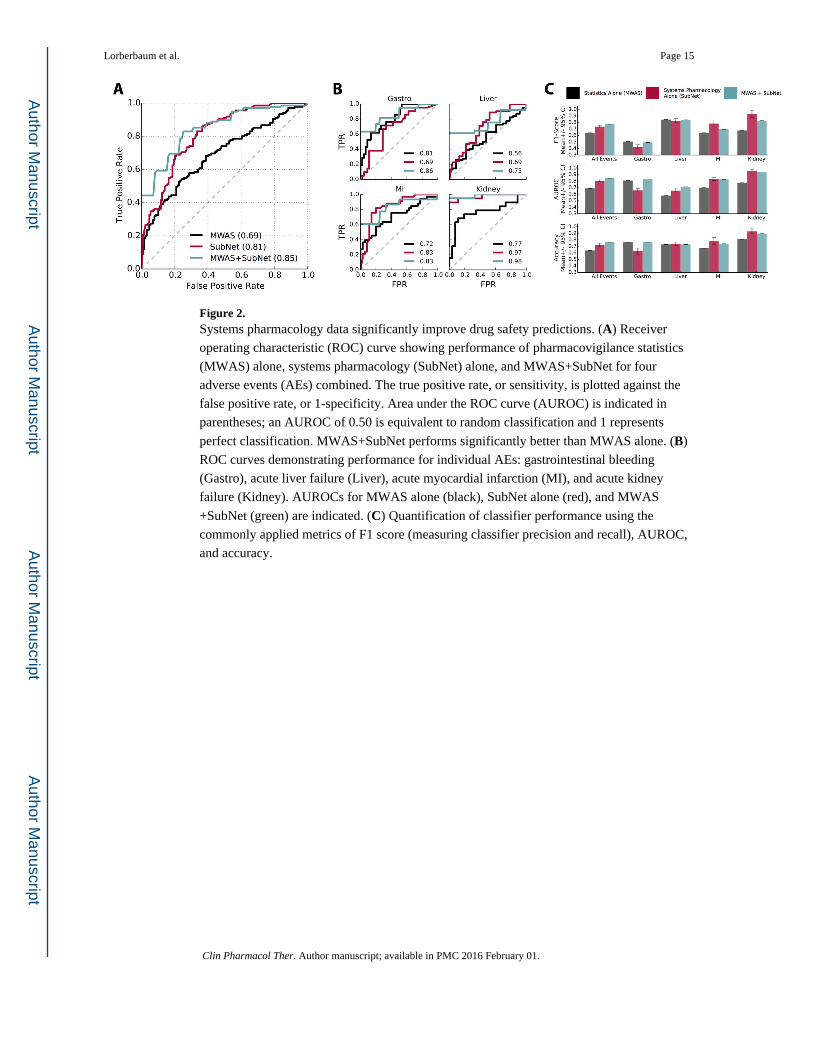
Figure 2. Systems pharmacology data significantly improve drug safety predictions. (A) Receiver
operating characteristic (ROC) curve showing performance of pharmacovigilance statistics
(MWAS) alone, systems pharmacology (SubNet) alone, and MWAS+SubNet for four
adverse events (AEs) combined. The true positive rate, or sensitivity, is plotted against the
false positive rate, or 1-specificity. Area under the ROC curve (AUROC) is indicated in
parentheses; an AUROC of 0.50 is equivalent to random classification and 1 represents
perfect classification. MWAS+SubNet performs significantly better than MWAS alone. (B)
ROC curves demonstrating performance for individual AEs: gastrointestinal bleeding
(Gastro), acute liver failure (Liver), acute myocardial infarction (MI), and acute kidney
failure (Kidney). AUROCs for MWAS alone (black), SubNet alone (red), and MWAS
+SubNet (green) are indicated. (C) Quantification of classifier performance using the
commonly applied metrics of F1 score (measuring classifier precision and recall), AUROC,
and accuracy.
Lorberbaum et al. Page 15
Clin Pharmacol Ther. Author manuscript; available in PMC 2016 February 01.
Author M
anuscriptA
uthor Manuscript
Author M
anuscriptA
uthor Manuscript
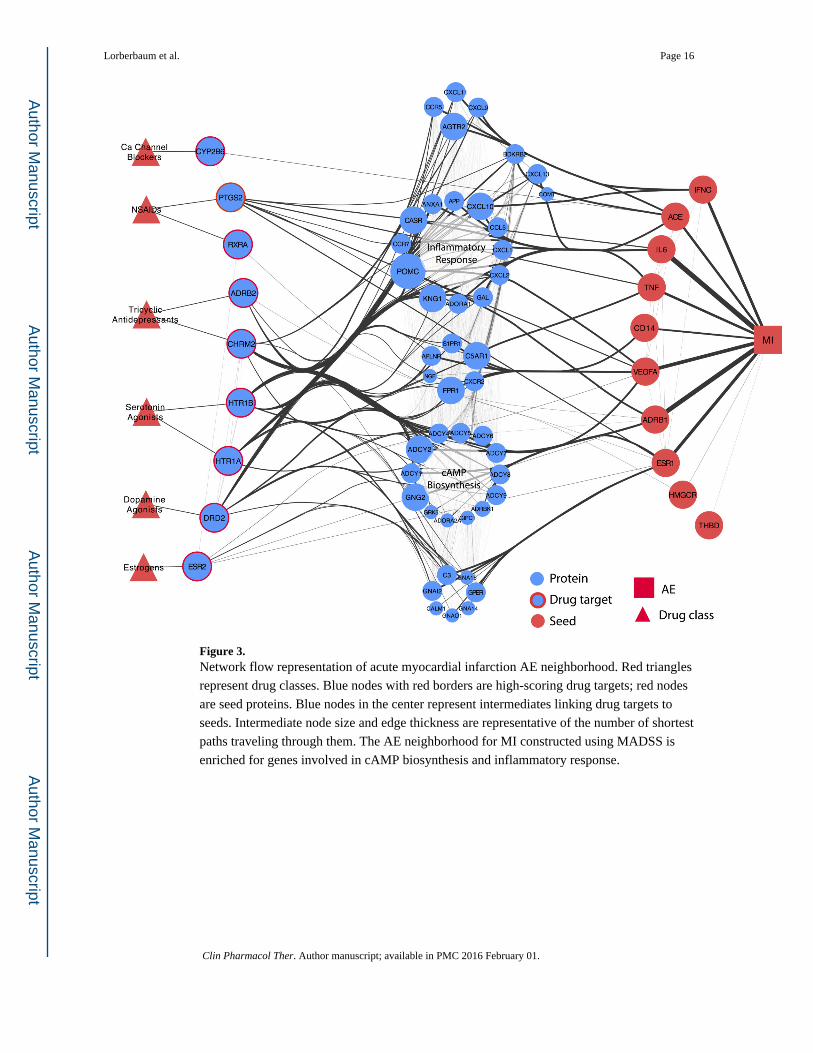
Figure 3. Network flow representation of acute myocardial infarction AE neighborhood. Red triangles
represent drug classes. Blue nodes with red borders are high-scoring drug targets; red nodes
are seed proteins. Blue nodes in the center represent intermediates linking drug targets to
seeds. Intermediate node size and edge thickness are representative of the number of shortest
paths traveling through them. The AE neighborhood for MI constructed using MADSS is
enriched for genes involved in cAMP biosynthesis and inflammatory response.
Lorberbaum et al. Page 16
Clin Pharmacol Ther. Author manuscript; available in PMC 2016 February 01.
Author M
anuscriptA
uthor Manuscript
Author M
anuscriptA
uthor Manuscript

Author M
anuscriptA
uthor Manuscript
Author M
anuscriptA
uthor Manuscript
Lorberbaum et al. Page 17
Tab
le 1
Com
pari
son
of s
ensi
tivity
(tr
ue p
ositi
ve r
ate,
TPR
) an
d sp
ecif
icity
(tr
ue n
egat
ive
rate
, TN
R)
for
drug
s re
ceiv
ing
high
MW
AS+
SubN
et (
Bot
h) s
core
s
acro
ss a
ll fo
ur a
dver
se e
vent
s (A
Es)
. GI:
gas
troi
ntes
tinal
ble
edin
g; L
F: a
cute
live
r fa
ilure
; MI:
acu
te m
yoca
rdia
l inf
arct
ion;
KF:
acu
te k
idne
y fa
ilure
.
Dru
gA
EC
ause
dM
WA
SSe
nsit
ivit
ySu
bNet
Sens
itiv
ity
Bot
hSe
nsit
ivit
yM
WA
SSp
ecif
icit
ySu
bNet
Spec
ific
ity
Bot
hSp
ecif
icit
y
Dif
luni
sal
GI
62%
62%
100%
87%
71%
100%
Ibup
rofe
nG
I52
%57
%10
0%91
%71
%10
0%
Flur
bipr
ofen
GI
10%
33%
100%
100%
89%
100%
Indo
met
haci
nG
I24
%29
%50
%98
%89
%10
0%
Oxa
proz
inG
I19
%19
%50
%10
0%89
%10
0%
Lam
otri
gine
LF
87%
87%
100%
13%
48%
100%
Nev
irap
ine
LF
39%
90%
100%
78%
39%
100%
Ofl
oxac
inL
F66
%79
%83
%39
%52
%10
0%
Stav
udin
eL
F58
%66
%83
%52
%61
%10
0%
Ace
tazo
lam
ide
LF
52%
68%
71%
52%
61%
100%
Des
ipra
min
eM
I70
%85
%10
0%60
%74
%10
0%
Dar
bepo
etin
alfa
MI
49%
73%
100%
80%
86%
100%
Est
radi
olM
I67
%52
%75
%60
%89
%10
0%
Frov
atri
ptan
MI
42%
64%
75%
89%
86%
100%
Imip
ram
ine
MI
64%
58%
67%
71%
89%
100%
Cap
topr
ilK
F84
%84
%10
0%35
%10
0%10
0%
Cyc
losp
orin
eK
F63
%90
%10
0%92
%10
0%10
0%
Lis
inop
ril
KF
47%
79%
100%
92%
100%
100%
Eto
dola
cK
F37
%32
%10
0%92
%10
0%10
0%
Hyd
roch
loro
thia
zide
KF
5%95
%10
0%10
0%89
%10
0%
Clin Pharmacol Ther. Author manuscript; available in PMC 2016 February 01.