t cell assays differentiate clinical and subclinical sars
TRANSCRIPT

ARTICLE
T cell assays differentiate clinical and subclinicalSARS-CoV-2 infections from cross-reactiveantiviral responsesAne Ogbe 1,31, Barbara Kronsteiner1,2,31, Donal T. Skelly 1,3,4,31, Matthew Pace1,31, Anthony Brown 1,31,
Emily Adland1,31, Kareena Adair5, Hossain Delowar Akhter1, Mohammad Ali 1,2, Serat-E Ali5, Adrienn Angyal6,
M. Azim Ansari1, Carolina V. Arancibia-Cárcamo4,7, Helen Brown1, Senthil Chinnakannan 1,
Christopher Conlon 2,3, Catherine de Lara1, Thushan de Silva6, Christina Dold8,9, Tao Dong10,11,
Timothy Donnison 1, David Eyre3,12, Amy Flaxman 13, Helen Fletcher 14, Joshua Gardner5,
James T. Grist9,15,16, Carl-Philipp Hackstein1, Kanoot Jaruthamsophon 5, Katie Jeffery 3, Teresa Lambe 13,
Lian Lee 1, Wenqin Li1, Nicholas Lim1, Philippa C. Matthews 1,3, Alexander J. Mentzer 3,17,
Shona C. Moore 18, Dean J. Naisbitt5, Monday Ogese5, Graham Ogg3,9,10, Peter Openshaw 19,
Munir Pirmohamed5, Andrew J. Pollard 8,9, Narayan Ramamurthy1, Patpong Rongkard1,2,20,
Sarah Rowland-Jones6,21, Oliver Sampson 1, Gavin Screaton17, Alessandro Sette22,23, Lizzie Stafford3,
Craig Thompson 24, Paul J. Thomson5, Ryan Thwaites 19, Vinicius Vieira 1,25, Daniela Weiskopf22,23,
Panagiota Zacharopoulou1, Oxford Immunology Network Covid-19 Response T Cell Consortium*, Oxford
Protective T Cell Immunology for COVID-19 (OPTIC) Clinical Team*, Lance Turtle 18,26,32,
Paul Klenerman 1,3,7,9,32✉, Philip Goulder25,32, John Frater 1,3,9,32, Eleanor Barnes 1,3,9,32 &
Susanna Dunachie 1,2,3,9,20,32
Identification of protective T cell responses against SARS-CoV-2 requires distinguishing
people infected with SARS-CoV-2 from those with cross-reactive immunity to other cor-
onaviruses. Here we show a range of T cell assays that differentially capture immune function
to characterise SARS-CoV-2 responses. Strong ex vivo ELISpot and proliferation responses to
multiple antigens (including M, NP and ORF3) are found in 168 PCR-confirmed SARS-CoV-2
infected volunteers, but are rare in 119 uninfected volunteers. Highly exposed seronegative
healthcare workers with recent COVID-19-compatible illness show T cell response patterns
characteristic of infection. By contrast, >90% of convalescent or unexposed people show
proliferation and cellular lactate responses to spike subunits S1/S2, indicating pre-existing
cross-reactive T cell populations. The detection of T cell responses to SARS-CoV-2 is
therefore critically dependent on assay and antigen selection. Memory responses to specific
non-spike proteins provide a method to distinguish recent infection from pre-existing
immunity in exposed populations.
https://doi.org/10.1038/s41467-021-21856-3 OPEN
A full list of author affiliations appears at the end of the paper.
NATURE COMMUNICATIONS | (2021) 12:2055 | https://doi.org/10.1038/s41467-021-21856-3 | www.nature.com/naturecommunications 1
1234
5678
90():,;

In late 2019, the new virus severe acute respiratory syndromecoronavirus 2 (SARS-CoV-2) emerged, causing the range ofclinical diseases known as COVID-191,2. While the majority of
SARS-CoV-2 infections are either asymptomatic or result in milddisease, some individuals develop severe respiratory symptomswhich may result in hospital admission and death leading to highglobal mortality3,4, especially older adults and those withcomorbidities5. Understanding the immune responses resultingfrom exposure to SARS-CoV-2 and distinguishing these from theresponses made to seasonal coronaviruses, is a pre-requisite todefining immune correlates of infection and protection againstsubsequent SARS-CoV-2 disease. This in turn is centrallyimportant in comparing with protective vaccine-induced immu-nity and may contribute to future public health policies includingshielding advice.
Antibody responses to SARS-CoV-2 are important but remaincomplex. In a recent large-scale study of healthcare workers,PCR-confirmed SARS-CoV-2 infection resulted in measurableantibodies after 20 days in nearly all participants, with highspecificity6. However, there is wide variability. Other studies havereported that antibodies may be absent early in the disease, levelsof neutralising antibodies are highly variable7, and antibody titreswane over time8. In contrast, studies of SARS-CoV infectionindicate that T cell responses may be more durable9. A number ofstudies have demonstrated the presence of T cell responses to thevirus during acute disease and in recovery. Using in silico-predicted HLA-class I and II peptide pools, CD4+ T cellresponses to SARS-CoV-2 were demonstrated in all volunteerswho had recovered from COVID-19 and CD8+ responses weredemonstrated in 70%10. This study also found T cell reactivity toSARS-CoV-2 epitopes in 50% of archived samples from pre-pandemic (2015–2018) volunteers using a 24-h activation-induced markers (AIM) assay. Additionally, a Swedish studydemonstrated a highly activated cytotoxic phenotype in acutedisease and vigorous polyfunctional T cell responses in con-valescent patients11. Interestingly, the latter study reported T cellresponses to SARS-CoV-2 in seronegative household contacts,which may represent either infection without seroconversionor pre-existing cross-reactive immune memory to seasonalcoronaviruses.
The role of prior exposure to human seasonal coronavirusesincluding alpha coronaviruses (HCoV-NL63 and HCoV-229E),and beta coronaviruses (HCoV-HKU1 and HCoV-OC43) as wellas SARS-CoV and MERS-CoV, that may generate SARS-CoV-2cross-reactive T cell immune responses, is of substantial interest.Whilst prior exposure to the original SARS-CoV and to MERS-CoV is rare and restricted to outbreaks, exposure to the seasonalhuman coronaviruses is widespread. Population sero-surveyshave shown that detectable baseline levels of IgG against at leastone of the four known HCoV is near universal12–14, but there isevidence that re-infection with the same virus can occur15,16. Tcell immunity to other coronaviruses is less well studied prior tothe 2020 pandemic, but a recent study from Singapore demon-strated the presence of reactive responses to SARS-CoV-2 inpeople who had recovered from the SARS-CoV epidemic 17 yearsearlier, which are likely to represent cross-reactive memory9. Suchcross-reactive responses to other CoV may be protective againstSARS-CoV-2, be irrelevant, or could in theory contribute toimmunopathology. The role of pre-existing cross-reactive T cellresponses in immunity has been studied for other virusesincluding influenza and flaviviruses. In one study where suchresponses were fine-mapped, we observed that pre-existing cross-reactive responses to the dengue virus were linked to diseaseprotection from Japanese Encephalitis, while symptomatic diseasewas linked to the emergence of strain-specific T cells17.
Divergent data regarding SARS-CoV-2 T cell cross-reactivityhave emerged so far: recent studies of T cell immunity to SARS-CoV-2 have reported levels of cross-reactive immunity to HCoVin SARS-CoV-2 unexposed populations of up to 50%9–11,18–21
using a variety of immune assays. One such study from ourcentre20 did not find significant ex vivo IFN-γ ELISpot responsesto SARS-CoV-2 in uninfected, seronegative volunteers. The dif-ferences between these results might reflect the use of differentassays employing a range of antigenic targets, peptide con-centrations and proliferation times.
Here we set out to address two questions using a panel of T cellassays. First, do COVID-19 patients and seronegative controlsshow different levels of responsiveness in distinct assays of T cellfunction? Second, can T cell responses distinguish persons pre-viously infected by SARS-CoV-2 from those previously infectedby seasonal coronaviruses? We find—in a large cohort of peoplewith a range of viral exposures—that cross-reactive memoryresponses to spike protein are almost universally detected usingmore sensitive assays, but that increasing viral exposure leads toan increase in magnitude and breadth of both effector andmemory responses. These data have implications for our under-standing of T cell cross-protection and for future studies ofmemory following the pandemic.
ResultsStrong and broad IFN-γ ELISpot responses in convalescence.We first examined the T cell response to SARS-CoV-2 in freshlyisolated peripheral blood mononuclear cells (PBMC) using anex vivo IFN-γ ELISpot assay from 168 volunteers with PCR-confirmed SARS-CoV-2 infection, and 112 negative controlswithout evidence of SARS-CoV-2 infection (SupplementaryTable 1). IgG antibody responses to spike measured by ELISA areshown in Fig. 1a and neutralising antibodies measured by apseudoparticle assay are shown in Supplementary Fig. 1a. Firstly,we evaluated the magnitude of the T cell response to SARS-CoV-2 to assess the effector T cell response following stimulation ofPBMCs with pools of overlapping peptides spanning all SARS-CoV-2 proteins except the non-structural ORF1 (Fig. 1b andSupplementary Table 2). We found responses to summed poolscovering SARS-CoV-2 spike protein (12 minipools of 15-mersoverlapping by 10 peptides referred to as P1–P12) (Fig. 1b, c), andthe structural and accessory proteins (7 pools of 18-mers over-lapping by 11 peptides covering E, M, NP, ORF3, ORF6, ORF7and ORF8) (Fig. 1b, d). We also screened PBMCs with poolscontaining predicted optimal peptides targeting MHC Class IIepitopes on the SARS-CoV-2 spike protein (CD4S), and otherviral proteins (CD4All), and predicted Class I binding peptidessplit into CD8A and CD8B described in Grifoni et al.13 (Fig. 1band Supplementary Fig. 1c).
IFN-γ responses to spike (S) pools were seen in PBMC from34/75 (45%) of convalescent volunteers tested (Fig. 1c) with highand frequent responses to some individual minipools includingP2 (up to 313 SFC/106 PBMC) and P8 (up to 353 SFC/106
PBMC). We identified IFN-γ responses to the structural andaccessory proteins in 65/103 (63%) of convalescent volunteers,with especially high-magnitude responses to the membrane (M)and nucleocapsid (NP) proteins (Fig. 1d). Combined, there wasvariation in the breadth and magnitude of SARS-CoV-2-specificresponses (Supplementary Fig. 1b), and longitudinal follow-upstudies underway will define the dynamics of the T cell responseover time. IFN-γ responses were also seen in 24/29 (83%) ofconvalescent volunteers following stimulation with the four poolsof predicted epitopes. Interestingly, we found especially high-frequency responses to the CD8A pool which comprises predicted
ARTICLE NATURE COMMUNICATIONS | https://doi.org/10.1038/s41467-021-21856-3
2 NATURE COMMUNICATIONS | (2021) 12:2055 | https://doi.org/10.1038/s41467-021-21856-3 | www.nature.com/naturecommunications

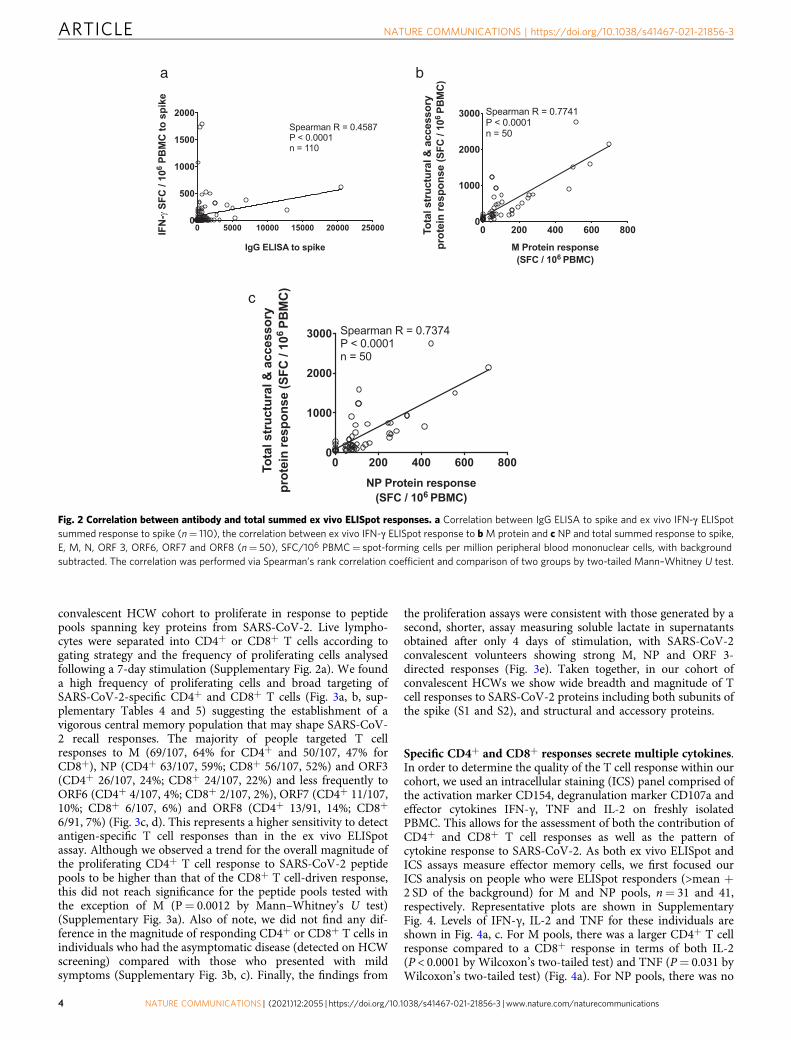
epitopes predominantly from the large ORF113 highlighting theneed for further exploration of immune responses to this region(Supplementary Fig. 1c). Correlation analysis between the IFN-γresponses to spike peptide pools measured by ELISpot and anti-spike IgG measured by ELISA showed a significant positivecorrelation (Spearman’s R= 0.4587; P < 0.0001) (Fig. 2a).
IFN-γ responses to either M or NP correlate with total T cellresponses. There was a correlation between summed responses tospike and non-spike structural proteins (Spearman R= 0.579, P< 0.0001, Supplementary Fig. 1d), as well as the structural andaccessory proteins and the predicted pools, indicating that whenan individual mounted a T cell response to one part of the pro-teome they were likely to respond to another part, and responsesdeclined with time from symptoms (Supplementary Fig. 1e, 1f).IFN-γ responses to either M or NP were correlates of the globalresponse to spike, structural and accessory proteins (Fig. 2b, c),indicating that an assay to measure responses to M or NP couldreflect the global effector T cell response.
We did not find a significant difference between IFN-γ ELISpotresponse and either age or sex (Supplementary Fig. 1g, h), but
larger studies including older adults are needed for furtherexploration.
Sensitive proliferation assays demonstrate memory responses.As our ELISpots assays were performed on total PBMCs, dis-crimination between distinct T cell lineages inducing the responsewas not possible. Moreover, the sensitivity of the ELISpot did notallow detection of responses in all COVID-19 recovered people.We, therefore, used a sensitive and functional flow cytometer-based assay capable of distinguishing the CD4+ and CD8+ T cellresponses. For this, we used a T cell proliferation assay to gainfurther insights into the contribution and relative proficiency ofthe CD4+ or CD8+ T cell compartments to drive a proliferativeanti-SARS-CoV-2 immune response in our convalescent HCWcohort. We first validated our assays on a small cohort of healthycontrol volunteers recruited for a hepatitis C virus (HCV) vaccineclinical trial pre-COVID1922. We showed that HCV seronegativecontrol volunteers made strong proliferative responses to pools ofoptimal peptides covering Influenza, EBV, CMV and Tetanus(FEC-T) but as expected, not to peptides covering HCV NS3 orcore proteins (Supplementary Fig. 2a–e). We then evaluated theability of CD4+ and CD8+ T cells from the COVID-19
Fig. 1 Magnitude and breadth of SARS-CoV-2-specific immune response. a Total anti-SARS-CoV-2 spike IgG antibody titres by indirect ELISA29 in22 seronegative controls, 24 asymptomatic and 82 mildly symptomatic healthcare workers (HCWs) with PCR-confirmed SARS-CoV-2 infection, 7hospitalised patients with severe or critical PCR-confirmed SARS-CoV-2 infection, 9 PCR-negative inpatient controls, and 11 pre-pandemic controls. b Exvivo IFN-γ ELISpot showing the effector T cell responses to summed SARS-CoV-2 peptide pools spanning spike, accessory and structural proteins (E, M,NP, ORF 3, ORF6, ORF7 and ORF8), in silico-predicted pools10 and the CEF T cell control panel in cohort groups as in a. c Ex vivo IFN-γ ELISpot showing themagnitude and breadth of effector T cell responses in 54 individual volunteers to 12 SARS-CoV-2 spike peptide pools (numbered P1 to P12) and d M, NPand accessory proteins ORF 3, ORF6, ORF7 and ORF8 in 73 HCWs convalescent with mildly symptomatic SARS-CoV-2 infection. X axis shows number ofdays from onset of symptoms (not to scale), with blank columns representing zero response in the individual tested at that time-point. SFC/106 PBMC=spot-forming cells per million peripheral blood mononuclear cells, with background subtracted. Plots show median with error bars indicating ± IQR.Kruskal–Wallis one-way ANOVA, with Dunn’s multiple comparisons test, was performed. Two-tailed P-values < 0.05 are shown on plots withSupplementary Table 3 showing full Kruskal–Wallis one-way ANOVA, with Dunn’s multiple comparisons test for b. Source data are available in the sourcedata file.
NATURE COMMUNICATIONS | https://doi.org/10.1038/s41467-021-21856-3 ARTICLE
NATURE COMMUNICATIONS | (2021) 12:2055 | https://doi.org/10.1038/s41467-021-21856-3 | www.nature.com/naturecommunications 3
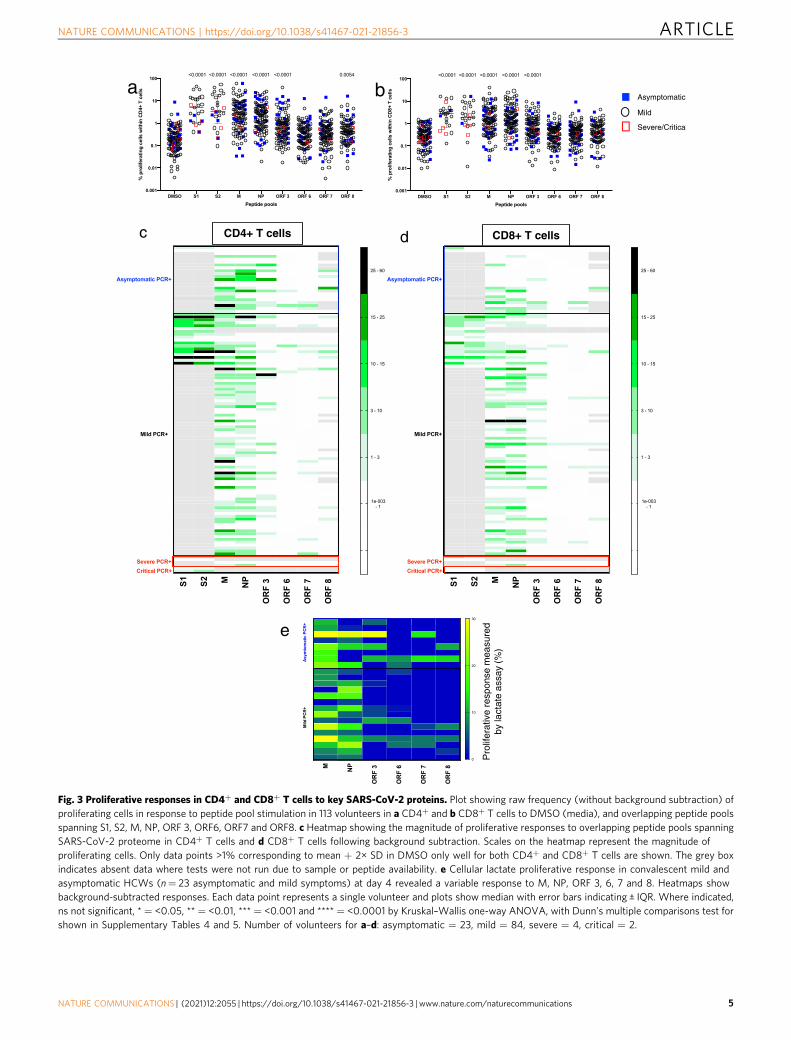
convalescent HCW cohort to proliferate in response to peptidepools spanning key proteins from SARS-CoV-2. Live lympho-cytes were separated into CD4+ or CD8+ T cells according togating strategy and the frequency of proliferating cells analysedfollowing a 7-day stimulation (Supplementary Fig. 2a). We founda high frequency of proliferating cells and broad targeting ofSARS-CoV-2-specific CD4+ and CD8+ T cells (Fig. 3a, b, sup-plementary Tables 4 and 5) suggesting the establishment of avigorous central memory population that may shape SARS-CoV-2 recall responses. The majority of people targeted T cellresponses to M (69/107, 64% for CD4+ and 50/107, 47% forCD8+), NP (CD4+ 63/107, 59%; CD8+ 56/107, 52%) and ORF3(CD4+ 26/107, 24%; CD8+ 24/107, 22%) and less frequently toORF6 (CD4+ 4/107, 4%; CD8+ 2/107, 2%), ORF7 (CD4+ 11/107,10%; CD8+ 6/107, 6%) and ORF8 (CD4+ 13/91, 14%; CD8+
6/91, 7%) (Fig. 3c, d). This represents a higher sensitivity to detectantigen-specific T cell responses than in the ex vivo ELISpotassay. Although we observed a trend for the overall magnitude ofthe proliferating CD4+ T cell response to SARS-CoV-2 peptidepools to be higher than that of the CD8+ T cell-driven response,this did not reach significance for the peptide pools tested withthe exception of M (P= 0.0012 by Mann–Whitney’s U test)(Supplementary Fig. 3a). Also of note, we did not find any dif-ference in the magnitude of responding CD4+ or CD8+ T cells inindividuals who had the asymptomatic disease (detected on HCWscreening) compared with those who presented with mildsymptoms (Supplementary Fig. 3b, c). Finally, the findings from
the proliferation assays were consistent with those generated by asecond, shorter, assay measuring soluble lactate in supernatantsobtained after only 4 days of stimulation, with SARS-CoV-2convalescent volunteers showing strong M, NP and ORF 3-directed responses (Fig. 3e). Taken together, in our cohort ofconvalescent HCWs we show wide breadth and magnitude of Tcell responses to SARS-CoV-2 proteins including both subunits ofthe spike (S1 and S2), and structural and accessory proteins.
Specific CD4+ and CD8+ responses secrete multiple cytokines.In order to determine the quality of the T cell response within ourcohort, we used an intracellular staining (ICS) panel comprised ofthe activation marker CD154, degranulation marker CD107a andeffector cytokines IFN-γ, TNF and IL-2 on freshly isolatedPBMC. This allows for the assessment of both the contribution ofCD4+ and CD8+ T cell responses as well as the pattern ofcytokine response to SARS-CoV-2. As both ex vivo ELISpot andICS assays measure effector memory cells, we first focused ourICS analysis on people who were ELISpot responders (>mean +2 SD of the background) for M and NP pools, n= 31 and 41,respectively. Representative plots are shown in SupplementaryFig. 4. Levels of IFN-γ, IL-2 and TNF for these individuals areshown in Fig. 4a, c. For M pools, there was a larger CD4+ T cellresponse compared to a CD8+ response in terms of both IL-2(P < 0.0001 by Wilcoxon’s two-tailed test) and TNF (P= 0.031 byWilcoxon’s two-tailed test) (Fig. 4a). For NP pools, there was no
Fig. 2 Correlation between antibody and total summed ex vivo ELISpot responses. a Correlation between IgG ELISA to spike and ex vivo IFN-γ ELISpotsummed response to spike (n= 110), the correlation between ex vivo IFN-γ ELISpot response to bM protein and c NP and total summed response to spike,E, M, N, ORF 3, ORF6, ORF7 and ORF8 (n= 50), SFC/106 PBMC= spot-forming cells per million peripheral blood mononuclear cells, with backgroundsubtracted. The correlation was performed via Spearman’s rank correlation coefficient and comparison of two groups by two-tailed Mann–Whitney U test.
ARTICLE NATURE COMMUNICATIONS | https://doi.org/10.1038/s41467-021-21856-3
4 NATURE COMMUNICATIONS | (2021) 12:2055 | https://doi.org/10.1038/s41467-021-21856-3 | www.nature.com/naturecommunications
c CD4+ T cells d CD8+ T cells
S1 S2 M NP
OR
F 3
OR
F 6
OR
F 7
OR
F 8
1e-003 - 1
1 - 3
3 - 10
10 - 15
15 - 25
25 - 60
Mild PCR+
Asymptomatic PCR+
Severe PCR+Critical PCR+
S1 S2 M NP
OR
F 3
OR
F 6
OR
F 7
OR
F 8
1e-003 - 1
1 - 3
3 - 10
10 - 15
15 - 25
25 - 60
Mild PCR+
Asymptomatic PCR+
Severe PCR+Critical PCR+
Fig. 3 Proliferative responses in CD4+ and CD8+ T cells to key SARS-CoV-2 proteins. Plot showing raw frequency (without background subtraction) ofproliferating cells in response to peptide pool stimulation in 113 volunteers in a CD4+ and b CD8+ T cells to DMSO (media), and overlapping peptide poolsspanning S1, S2, M, NP, ORF 3, ORF6, ORF7 and ORF8. c Heatmap showing the magnitude of proliferative responses to overlapping peptide pools spanningSARS-CoV-2 proteome in CD4+ T cells and d CD8+ T cells following background subtraction. Scales on the heatmap represent the magnitude ofproliferating cells. Only data points >1% corresponding to mean + 2× SD in DMSO only well for both CD4+ and CD8+ T cells are shown. The grey boxindicates absent data where tests were not run due to sample or peptide availability. e Cellular lactate proliferative response in convalescent mild andasymptomatic HCWs (n= 23 asymptomatic and mild symptoms) at day 4 revealed a variable response to M, NP, ORF 3, 6, 7 and 8. Heatmaps showbackground-subtracted responses. Each data point represents a single volunteer and plots show median with error bars indicating ± IQR. Where indicated,ns not significant, * = <0.05, ** = <0.01, *** = <0.001 and **** = <0.0001 by Kruskal–Wallis one-way ANOVA, with Dunn’s multiple comparisons test forshown in Supplementary Tables 4 and 5. Number of volunteers for a–d: asymptomatic = 23, mild = 84, severe = 4, critical = 2.
NATURE COMMUNICATIONS | https://doi.org/10.1038/s41467-021-21856-3 ARTICLE
NATURE COMMUNICATIONS | (2021) 12:2055 | https://doi.org/10.1038/s41467-021-21856-3 | www.nature.com/naturecommunications 5
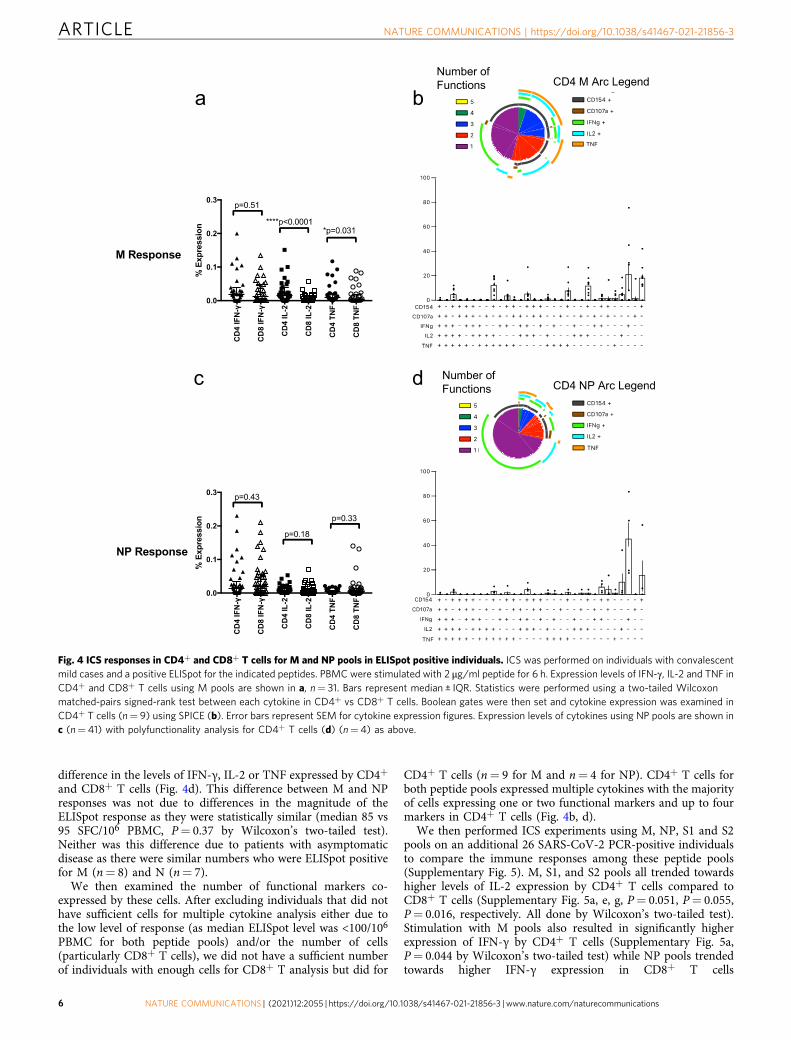
difference in the levels of IFN-γ, IL-2 or TNF expressed by CD4+
and CD8+ T cells (Fig. 4d). This difference between M and NPresponses was not due to differences in the magnitude of theELISpot response as they were statistically similar (median 85 vs95 SFC/106 PBMC, P= 0.37 by Wilcoxon’s two-tailed test).Neither was this difference due to patients with asymptomaticdisease as there were similar numbers who were ELISpot positivefor M (n= 8) and N (n= 7).
We then examined the number of functional markers co-expressed by these cells. After excluding individuals that did nothave sufficient cells for multiple cytokine analysis either due tothe low level of response (as median ELISpot level was <100/106
PBMC for both peptide pools) and/or the number of cells(particularly CD8+ T cells), we did not have a sufficient numberof individuals with enough cells for CD8+ T analysis but did for
CD4+ T cells (n= 9 for M and n= 4 for NP). CD4+ T cells forboth peptide pools expressed multiple cytokines with the majorityof cells expressing one or two functional markers and up to fourmarkers in CD4+ T cells (Fig. 4b, d).
We then performed ICS experiments using M, NP, S1 and S2pools on an additional 26 SARS-CoV-2 PCR-positive individualsto compare the immune responses among these peptide pools(Supplementary Fig. 5). M, S1, and S2 pools all trended towardshigher levels of IL-2 expression by CD4+ T cells compared toCD8+ T cells (Supplementary Fig. 5a, e, g, P= 0.051, P= 0.055,P= 0.016, respectively. All done by Wilcoxon’s two-tailed test).Stimulation with M pools also resulted in significantly higherexpression of IFN-γ by CD4+ T cells (Supplementary Fig. 5a,P= 0.044 by Wilcoxon’s two-tailed test) while NP pools trendedtowards higher IFN-γ expression in CD8+ T cells
Fig. 4 ICS responses in CD4+ and CD8+ T cells for M and NP pools in ELISpot positive individuals. ICS was performed on individuals with convalescentmild cases and a positive ELISpot for the indicated peptides. PBMC were stimulated with 2 μg/ml peptide for 6 h. Expression levels of IFN-γ, IL-2 and TNF inCD4+ and CD8+ T cells using M pools are shown in a, n= 31. Bars represent median ± IQR. Statistics were performed using a two-tailed Wilcoxonmatched-pairs signed-rank test between each cytokine in CD4+ vs CD8+ T cells. Boolean gates were then set and cytokine expression was examined inCD4+ T cells (n= 9) using SPICE (b). Error bars represent SEM for cytokine expression figures. Expression levels of cytokines using NP pools are shown inc (n= 41) with polyfunctionality analysis for CD4+ T cells (d) (n= 4) as above.
ARTICLE NATURE COMMUNICATIONS | https://doi.org/10.1038/s41467-021-21856-3
6 NATURE COMMUNICATIONS | (2021) 12:2055 | https://doi.org/10.1038/s41467-021-21856-3 | www.nature.com/naturecommunications

(Supplementary Fig. 5d, P= 0.066 by Wilcoxon’s two-tailed test).We again examined cytokine expression in these patients. Thelow level of responses, as these individuals were not screenedusing ELISpot, prevented us from effectively examining CD8+ Tcell cytokine expression. However, there were sufficient indivi-duals with enough responding cells to examine CD4+ T cytokineexpression for M (n= 10), NP (n= 4), S1 (n= 6) and S2 (n= 3).The vast majority of cells expressed 1–2 functional markers (withsimilar patterns), with small populations of cells expressing 3 or 4(Supplementary Fig. 5). These results were similar to the ELISpotpositive individuals mentioned above.
Uninfected show strong proliferative responses to spike. Westudied SARS-CoV-2 seronegative controls (Fig. 1a) for whom wealso evaluated T cell responses to SARS-CoV-2 peptides usingIFN-γ ELISpot, ICS and proliferation assay. In contrast to con-valescent HCWs, SARS-CoV-2-specific IFN-γ responses werescarcely seen in any of the SARS-CoV-2 peptide pools as mea-sured by ex vivo ELISpot assays in 23 seronegative healthy controlvolunteers (Fig. 1b). Responsiveness to common antigens(CEF-T) in these control volunteers indicated that there were noinherent defects in the ability of PBMCs from these donors tomount an antigen-driven immune response. This finding of a lackof response to SARS-CoV-2 peptides in seronegative controlvolunteers by an 18-h ex vivo IFN-γ ELISpot assay was confirmedin 13 volunteers by an independent laboratory in Sheffield, UK(Fig. 5a). We also evaluated cryopreserved PBMC from pre-pandemic healthy control archives and found minimal responsesto spike, structural and accessory proteins in 19 volunteers inOxford (Fig. 5b) and in the predicted epitope pools10 in 48 peoplein Liverpool, UK (Fig. 5c).
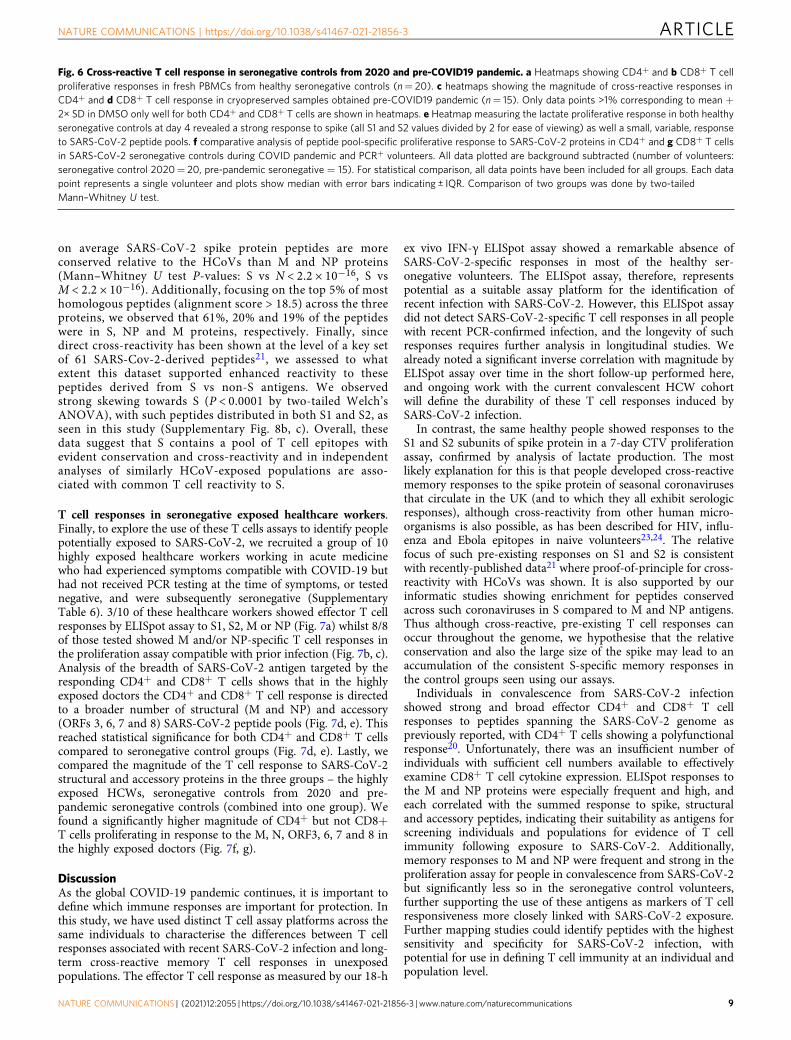
However, using cellular proliferation assays on 20 seronegativevolunteers, we show a high frequency of proliferating CD4+ andCD8+ T cells responding to the S1 and S2 subunit of the spikeprotein with a CD4+ T cell response detected in 17/20 (85%) anda CD8+ T cell response in 10/20 (50%) (Fig. 6a, b). In contrast,we observed weak or no CD4+ and CD8+ T cell proliferativeresponses to the structural and accessory proteins studied (M,NP, ORF3, ORF6, ORF7 and ORF8) (Fig. 6a, b). As the20 seronegative participants were sampled in early 2020, we alsoanalysed 15 cryopreserved samples from 2008 to 2019 (pre-UKCOVID19 pandemic) to exclude the possibility of asymptomaticand undetected prior infection. Similar to the pandemicseronegative controls, we found no or low effector T cellresponses by ELISpot assay to any of the spike, structural oraccessory proteins (Fig. 5b), but as for the pandemic seronegativecontrols we detected robust T cell responses by proliferation assayto spike proteins S1 and S2, which was of greater breadth in theCD4+ T cells compared to their CD8+ T cell counterparts(Fig. 6c, d). The responses show a CD4+ skew with 15/15 showinga CD4+ T cell response and only 8/15 showing a CD8+ T cellresponse above background level. Most importantly, there wasvery limited cross-reactivity to the structural and accessoryproteins as measured by the proliferation assay. As with theconvalescent HCW cohort, we also performed a cellular lactateassay using supernatants obtained after 4 days of stimulation on 8of these people. We confirm cross-reactive responses to spike S1and S2 subunits, and non-existent or minimal responses insupernatants obtained from M, NP and accessory protein-stimulated PBMCs (Fig. 6e). We compared the magnitude ofthe proliferative responses to the different SARS-COV-2 peptidepools in seronegative controls from 2020, symptomatic andasymptomatic SARS-COV-2 PCR+ volunteers (Fig. 6f, g). Wefound no difference in the spike—S1 and S2—responses but thehigher magnitude of proliferative responses to M and NP in bothCD4+ and CD8+ T cells and ORF3 and ORF8 in CD8+ T cellsalone in people who had tested positive to SARS-COV-2 (Fig. 6f,g). For confirmation, we also compared the magnitude ofproliferative T cell responses in SARS-COV-2 seronegativecontrols from 2020 with the cryopreserved pre-pandemicseronegative controls and found the magnitude of proliferativecells in these two seronegative groups to be similar (Supplemen-tary Fig. 6a, b). These results, in addition to our earlier resultsfrom people who did not generate effector T cell responses tospike peptides in the IFN-γ ELISpot assay (Figs. 1b and 5a, c),demonstrate the consistent evidence of proliferative T cellmemory to spike protein in the pre-existing T cell repertoire ofpeople naive to SARS-CoV-2.
S pike E M NPOR F3
OR F6OR F7
OR F8CE F
0
200
400
600
800
SFC
/106 P
BM
C
S 1 S 2 E M NPOR F3
OR F6OR F7
OR F8CE F
0
200
400
600
800
1000
1200
SF
C /
106 P
BM
C
C D4SCD4R
CD8ACD8B
Con A
0
200
400
600
800
1000
200040006000
SFC
/ 10
6 PB
MC
a
b
c
Healthy pre-pandemic controls (cryopreserved, Oxford)
Healthy pre-pandemic controls (cryopreserved, Liverpool)
Healthy seronegative controls 2020 (fresh, Sheffield)
Fig. 5 Ex vivo ELISpot responses in seronegative controls. Ex vivo IFN-γELISpot responses to summed SARS-CoV-2 peptide pools spanning spike,accessory and structural proteins (E, M, NP, ORF 3, ORF6, ORF7 and ORF8)and CEF T cell control panel in a freshly isolated peripheral bloodmononuclear cells (PBMC) from seronegative controls in Sheffield, UK(n= 13), and b cryopreserved PBMC from pre-pandemic healthy controls inOxford, UK (n= 19). c Ex vivo IFN-γ ELISpot responses to in silico-predictedepitope pools10 cryopreserved PBMC from pre-pandemic healthy controlsin Liverpool, UK (n= 48). Responses are shown with backgroundsubtracted, a line represents mean +2 stand deviations of responses to thebackground.
NATURE COMMUNICATIONS | https://doi.org/10.1038/s41467-021-21856-3 ARTICLE
NATURE COMMUNICATIONS | (2021) 12:2055 | https://doi.org/10.1038/s41467-021-21856-3 | www.nature.com/naturecommunications 7

The robust T cell memory responses in the control groupsto spike protein are clear in our data, and consistent with arecent study that assessed cross-reactivity using a differentassay system21 addressing the issue of whether this reflectsprior exposure to HCoVs. To explore this further, we firsttested our cohort using serologic assays and found universally
high exposure to four circulating HCoVs, as also seen in otherstudies9–11,18–21 (Supplementary Fig. 7). We next addressedthe homology between S and HCoVs at the level of 9-merpeptides and compared this to M and NP (SupplementaryFig. 8a) The median alignment score for each spike, NP and Mproteins was 8.5, 7.5 and 6.5, respectively, which indicates that
a c CD4+ T cells CD8+ T cells b CD4+ T cells CD8+ T cells d
SARS-CoV-2 controls – Seronegative control 2020
SARS-CoV-2 controls – Pre-pandemic seronegative†
S1 S 2 M NP
OR
F 3
OR
F 6
OR
F 7
OR
F 8 S 1 S2 M NP
OR
F 3
OR
F 6
OR
F 7
OR
F 8
1e-003 - 1
1 - 3
3 - 10
10 - 15
15 - 25
25 - 60
S1 S2 M NP
OR
F 3
OR
F 6
OR
F 7
OR
F 8 S1 S2 M NP
OR
F 3
OR
F 6
OR
F 7
OR
F 8
1e-003 - 1
1 - 3
3 - 10
10 - 15
15 - 25
25 - 60
Seronegative control 2020
Asymptomatic
Mild
Severe/Critical
e
S1 S2 M NP ORF 3 ORF 6 ORF 7 ORF 8 0
20
40
60
Pro
lifer
ativ
e re
spon
se
mea
sure
d by
lact
ate
assa
y (%
)
CD
4 T
cel
ls
f
CD
8 T
cel
ls
g
Seroneg Ctrl 2020 Asympt/Mild0.1
1
10
100
PCR+
% p
rolif
e rat
ing
cells
with
in C
D4
Seroneg Ctrl 2020 Asymptomatic Mild0.001
0.01
0.1
1
10
100
PCR+
% p
rolif
erat
ing
c el ls
wi th
in C
D4
<0.0001
<0.0001
Seroneg Ctrl 2020 Asympt/Mild0.01
0.1
1
10
100
PCR+
% p
rolif
e rat
ing
cells
with
in C
D4
Seroneg Ctrl 2020 Asymptomatic Mild0.001
0.01
0.1
1
10
100
PCR+
% p
r ol if
erat
ing
c el ls
with
i n C
D4
Seroneg Ctrl 2020 Asymptomatic Mild0.01
0.1
1
10
100
PCR+
0.0008
% p
rolif
e ra t
ing
cells
with
in C
D4
<0.0001
Seroneg Ctrl 2020 Asymptomatic Mild0.001
0.01
0.1
1
10
100
PCR+
% p
rolif
era t
ing
cells
with
in C
D4
S1 S2 M
NP ORF3 ORF8
Seroneg Ctrl 2020 Asympt/Mild0.001
0.01
0.1
1
10
100
PCR+
% p
r olif
era t
i ng
cel ls
wi th
in C
D8
Seroneg Ctrl 2020 Asymptomatic Mild0.001
0.01
0.1
1
10
100
PCR+
% p
r ol if
e rat
i ng
cell s
wi th
in C
D8
<0.0001<0.0001
Seroneg Ctrl 2020 Asympt/Mild0.001
0.01
0.1
1
10
100
PCR+
% p
rolif
erat
ing
cells
with
in C
D8
Seroneg Ctrl 2020 Asymptomatic Mild0.001
0.01
0.1
1
10
PCR+
% p
r olif
erat
ing
cells
with
in C
D8
0.01860.0480
Seroneg Ctrl 2020 Asymptomatic Mild0.001
0.01
0.1
1
10
100
PCR+
% p
rolif
erat
ing
cells
with
in C
D8
0.0022
Seroneg Ctrl 2020 Asymptomatic Mild0.001
0.01
0.1
1
10
PCR+
% p
rolif
erat
i ng
cells
with
i n C
D8
0.0007
S1 S2 M
NP ORF3 ORF8
ARTICLE NATURE COMMUNICATIONS | https://doi.org/10.1038/s41467-021-21856-3
8 NATURE COMMUNICATIONS | (2021) 12:2055 | https://doi.org/10.1038/s41467-021-21856-3 | www.nature.com/naturecommunications
on average SARS-CoV-2 spike protein peptides are moreconserved relative to the HCoVs than M and NP proteins(Mann–Whitney U test P-values: S vs N < 2.2 × 10⁻¹⁶, S vsM < 2.2 × 10⁻¹⁶). Additionally, focusing on the top 5% of mosthomologous peptides (alignment score > 18.5) across the threeproteins, we observed that 61%, 20% and 19% of the peptideswere in S, NP and M proteins, respectively. Finally, sincedirect cross-reactivity has been shown at the level of a key setof 61 SARS-Cov-2-derived peptides21, we assessed to whatextent this dataset supported enhanced reactivity to thesepeptides derived from S vs non-S antigens. We observedstrong skewing towards S (P < 0.0001 by two-tailed Welch’sANOVA), with such peptides distributed in both S1 and S2, asseen in this study (Supplementary Fig. 8b, c). Overall, thesedata suggest that S contains a pool of T cell epitopes withevident conservation and cross-reactivity and in independentanalyses of similarly HCoV-exposed populations are asso-ciated with common T cell reactivity to S.
T cell responses in seronegative exposed healthcare workers.Finally, to explore the use of these T cells assays to identify peoplepotentially exposed to SARS-CoV-2, we recruited a group of 10highly exposed healthcare workers working in acute medicinewho had experienced symptoms compatible with COVID-19 buthad not received PCR testing at the time of symptoms, or testednegative, and were subsequently seronegative (SupplementaryTable 6). 3/10 of these healthcare workers showed effector T cellresponses by ELISpot assay to S1, S2, M or NP (Fig. 7a) whilst 8/8of those tested showed M and/or NP-specific T cell responses inthe proliferation assay compatible with prior infection (Fig. 7b, c).Analysis of the breadth of SARS-CoV-2 antigen targeted by theresponding CD4+ and CD8+ T cells shows that in the highlyexposed doctors the CD4+ and CD8+ T cell response is directedto a broader number of structural (M and NP) and accessory(ORFs 3, 6, 7 and 8) SARS-CoV-2 peptide pools (Fig. 7d, e). Thisreached statistical significance for both CD4+ and CD8+ T cellscompared to seronegative control groups (Fig. 7d, e). Lastly, wecompared the magnitude of the T cell response to SARS-CoV-2structural and accessory proteins in the three groups – the highlyexposed HCWs, seronegative controls from 2020 and pre-pandemic seronegative controls (combined into one group). Wefound a significantly higher magnitude of CD4+ but not CD8+T cells proliferating in response to the M, N, ORF3, 6, 7 and 8 inthe highly exposed doctors (Fig. 7f, g).
DiscussionAs the global COVID-19 pandemic continues, it is important todefine which immune responses are important for protection. Inthis study, we have used distinct T cell assay platforms across thesame individuals to characterise the differences between T cellresponses associated with recent SARS-CoV-2 infection and long-term cross-reactive memory T cell responses in unexposedpopulations. The effector T cell response as measured by our 18-h
ex vivo IFN-γ ELISpot assay showed a remarkable absence ofSARS-CoV-2-specific responses in most of the healthy ser-onegative volunteers. The ELISpot assay, therefore, representspotential as a suitable assay platform for the identification ofrecent infection with SARS-CoV-2. However, this ELISpot assaydid not detect SARS-CoV-2-specific T cell responses in all peoplewith recent PCR-confirmed infection, and the longevity of suchresponses requires further analysis in longitudinal studies. Wealready noted a significant inverse correlation with magnitude byELISpot assay over time in the short follow-up performed here,and ongoing work with the current convalescent HCW cohortwill define the durability of these T cell responses induced bySARS-CoV-2 infection.
In contrast, the same healthy people showed responses to theS1 and S2 subunits of spike protein in a 7-day CTV proliferationassay, confirmed by analysis of lactate production. The mostlikely explanation for this is that people developed cross-reactivememory responses to the spike protein of seasonal coronavirusesthat circulate in the UK (and to which they all exhibit serologicresponses), although cross-reactivity from other human micro-organisms is also possible, as has been described for HIV, influ-enza and Ebola epitopes in naive volunteers23,24. The relativefocus of such pre-existing responses on S1 and S2 is consistentwith recently-published data21 where proof-of-principle for cross-reactivity with HCoVs was shown. It is also supported by ourinformatic studies showing enrichment for peptides conservedacross such coronaviruses in S compared to M and NP antigens.Thus although cross-reactive, pre-existing T cell responses canoccur throughout the genome, we hypothesise that the relativeconservation and also the large size of the spike may lead to anaccumulation of the consistent S-specific memory responses inthe control groups seen using our assays.
Individuals in convalescence from SARS-CoV-2 infectionshowed strong and broad effector CD4+ and CD8+ T cellresponses to peptides spanning the SARS-CoV-2 genome aspreviously reported, with CD4+ T cells showing a polyfunctionalresponse20. Unfortunately, there was an insufficient number ofindividuals with sufficient cell numbers available to effectivelyexamine CD8+ T cell cytokine expression. ELISpot responses tothe M and NP proteins were especially frequent and high, andeach correlated with the summed response to spike, structuraland accessory peptides, indicating their suitability as antigens forscreening individuals and populations for evidence of T cellimmunity following exposure to SARS-CoV-2. Additionally,memory responses to M and NP were frequent and strong in theproliferation assay for people in convalescence from SARS-CoV-2but significantly less so in the seronegative control volunteers,further supporting the use of these antigens as markers of T cellresponsiveness more closely linked with SARS-CoV-2 exposure.Further mapping studies could identify peptides with the highestsensitivity and specificity for SARS-CoV-2 infection, withpotential for use in defining T cell immunity at an individual andpopulation level.
Fig. 6 Cross-reactive T cell response in seronegative controls from 2020 and pre-COVID19 pandemic. a Heatmaps showing CD4+ and b CD8+ T cellproliferative responses in fresh PBMCs from healthy seronegative controls (n= 20). c heatmaps showing the magnitude of cross-reactive responses inCD4+ and d CD8+ T cell response in cryopreserved samples obtained pre-COVID19 pandemic (n= 15). Only data points >1% corresponding to mean +2× SD in DMSO only well for both CD4+ and CD8+ T cells are shown in heatmaps. e Heatmap measuring the lactate proliferative response in both healthyseronegative controls at day 4 revealed a strong response to spike (all S1 and S2 values divided by 2 for ease of viewing) as well a small, variable, responseto SARS-CoV-2 peptide pools. f comparative analysis of peptide pool-specific proliferative response to SARS-CoV-2 proteins in CD4+ and g CD8+ T cellsin SARS-CoV-2 seronegative controls during COVID pandemic and PCR+ volunteers. All data plotted are background subtracted (number of volunteers:seronegative control 2020= 20, pre-pandemic seronegative = 15). For statistical comparison, all data points have been included for all groups. Each datapoint represents a single volunteer and plots show median with error bars indicating ± IQR. Comparison of two groups was done by two-tailedMann–Whitney U test.
NATURE COMMUNICATIONS | https://doi.org/10.1038/s41467-021-21856-3 ARTICLE
NATURE COMMUNICATIONS | (2021) 12:2055 | https://doi.org/10.1038/s41467-021-21856-3 | www.nature.com/naturecommunications 9

The existence of substantial T cell cross-reactivity to SARS-CoV-2 from prior HCoV exposure has been demonstrated innon-SARS-CoV-2 infected populations from a range of geo-graphical locations9–11,18,19,21. Here, we demonstrate the use ofthe ELISpot assay to identify SARS-CoV-2-specific responses, andour finding of absent T cell responses in unexposed volunteers
was confirmed by similar results in our three independentlaboratories (Universities of Oxford, Liverpool and Sheffield). Tcell assays vary in their sensitivity, influenced by cell number,incubation time, antigen choice and concentration and markersof T cell activity measured. Our ELISpot assay does not detect theT cell responses in unexposed populations to spike and other
Highly Exp combined Ctrls0
2
4
6
Num
ber o
f pep
tide
p ool
s C
D4 +
T c
e ll s
in e
ach
s ub j
e ct
resp
onds
to
0.0004
Highly Exp combined Ctrls0
5
10
15
% p
rolif
erat
ing
CD
4+ T
cel
ls
to a
ll s t
rucu
r al a
n d a
cces
sory
pr
o tei
ns
<0.0001
Highly Exp combined Ctrls0
2
4
6
Num
ber o
f pep
tide
poo l
s C
D8+
T c
ells
i n e
ach
subj
e ct
resp
onds
to 0.0118
Highly Exp combined Ctrls0
2
4
6
% p
rolif
erat
ing
CD
8+ T
cel
ls
to a
l l s t
rucu
ral a
nd a
cces
sor y
pr
otei
ns
a
1 2 3 4 5 6 7 8 9 100
500
1000
1500
2000
IFN
-SF
C /
106 P
BM
C
S-1S-2
E ProteinM ProteinN ProteinORF3ORF6ORF7ORF8
Study ID
d e
f g
b c CD8 T cells CD4 T cells Study ID Study ID
S1 S2 M NP
OR
F 3
OR
F 6
OR
F 7
OR
F 8
1†
2
3
4†
5†
6†
8
9
1e-003 - 1
1 - 3
3 - 10
10 - 15
15 - 25
25 - 60
S1 S2 M NP
OR
F 3
OR
F 6
OR
F 7
OR
F 8
1†
2
3
4†
5†
6†
8
9
1e-003 - 1
1 - 3
3 - 10
10 - 15
15 - 25
25 - 60
Highly exposed doctors
Seronegative control 2020
Pre-Pandemic controls †
ARTICLE NATURE COMMUNICATIONS | https://doi.org/10.1038/s41467-021-21856-3
10 NATURE COMMUNICATIONS | (2021) 12:2055 | https://doi.org/10.1038/s41467-021-21856-3 | www.nature.com/naturecommunications

SARS-CoV-2 proteins reported elsewhere. This may be due to therelatively low cell number used in our assay (200,000 per well) butmost likely the focus on IFN-γ release rather than detection of cellactivation markers.
Most convalescent people in the study made antibodies, asdetected by IgG ELISA and pseudoparticle neutralisation assay.Emerging literature suggests that SARS-CoV-2 IgG titres meetingthe threshold for positivity may be relatively short-lived8,25. Thecurrent study represents a cross-sectional ‘snapshot’ in time ofhuman T cell responses to SARS-CoV-2 after infection. Ongoingfollow-up studies of this cohort and surveillance26 for re-infectionaligned to the UK SIREN study27 will allow further delineation ofthe time course of T cell responses in parallel with humoralresponses, and the timing of any assay must be taken into accountin defining its utility. While an association is seen betweenantibody and ELISpot in the PCR-positive cohort, a disjunctexists between the antibodies and memory responses, since strongspike responses can be seen in the PCR-negative/unexposed andpre-pandemic groups. We need to assess in future whether anyrelationship exists between the levels of these responses and levelsof seroreactivity to HCoVs.
Our study of the large ORF1 was restricted to the use of the insilico-predicted pool CD8A10, where a high magnitude ofresponses was seen. Further work will characterise the timecourse of T cell responses observed in this cohort, evaluate theability of our assays to correctly distinguish individuals withconfirmed SARS-CoV-2 infection from unexposed controls, andprospectively seek to identify the relationship between measurableT cell immunity to the SARS-CoV-2 proteome and subsequentprimary or secondary infection with SARS-CoV-2.
Overall, we have shown that assessments of T cell immunityusing different assays but with the same antigens give very dif-ferent results. Our ELISpot measure of ex vivo IFN-γ release isvaluable in defining the potential role of T cell immunity inrecently infected donors without cross-reactivity in unexposedpeople. In contrast, our proliferation assay allows dissecting outpre-existing vs SARS-CoV-2 induced immune responses byexamining responses to different antigens. Our proliferation assaydemonstrates widespread T cell memory responses to spike inboth SARS-CoV-2 infected and unexposed people, whilst T cellmemory responses to M and NP are more characteristic of pre-vious SARS-CoV-2 infection. These two assays, in combinationwith the panel of antigens, can now allow us to address criticalquestions about dissecting the role of T cells—induced by SARS-CoV-2, and possibly HCoVs and other antigens—in immuneprotection in the future.
MethodsEthics statement. Human study protocols were approved by the research ethicscommittee (REC) at Yorkshire & The Humber— Sheffield (GI Biobank Study 16/YH/0247). The study was conducted in compliance with all relevant ethical reg-ulations for work with human participants, and according to the principles of theDeclaration of Helsinki (2008) and the International Conference on Harmoniza-tion (ICH) Good Clinical Practice (GCP) guidelines. Written informed consent wasobtained for all patients enrolled in the study.
Study volunteers. SARS-CoV-2 positive individuals: Healthcare workers atOxford University Hospitals NHS Foundation Trust who tested positive for SARS-CoV-2 following either presentation to the hospital’s Occupational HealthDepartment with symptoms or having a positive PCR test on the staff screeningprogramme26 were asked to indicate whether they were willing to be contacted byresearchers. Individuals who agreed to be contacted received an email invitation toparticipate in the study. Volunteers recruited from the staff screening programmewere classified as asymptomatic if they did not report any symptoms of COVID-19(including fever, shortness of breath, cough, loss of taste or smell, sore throat,coryza or diarrhoea), either prior to staff screening or in the seven days followingtesting positive. In total 126 symptomatic and 33 asymptomatic people wererecruited for this study. In addition, 9 hospitalised PCR-positive patients withWHO severe or critical COVID-19 were studied.
SARS-CoV-2 negative individuals (healthy controls): 30 healthy controlvolunteers in Oxford and 13 in Sheffield with no history of COVID-19 symptomsand no antibodies to SARS-CoV-2 spike protein detected by IgG ELISA wererecruited. In addition, archived samples from 19 healthy control volunteers inOxford who donated blood in the pre-pandemic period (2008–2019) were studied,alongside 48 healthy control volunteers from the pre-pandemic period inLiverpool. In addition, 9 hospitalised PCR-negative patients with other medicalconditions were studied.
Highly exposed seronegative individuals (highly exposed HCWs): 10 acutemedicine doctors, who worked in patient-facing services during the pandemic andexperienced symptoms compatible with COVID-19, but did not receive PCRtesting at the time of symptoms or tested negative, and were anti-spike IgGnegative two months after the pandemic peak, were recruited as highly exposedseronegative HCW participants.
Peripheral blood mononuclear cells. Peripheral blood mononuclear cells wereisolated by density gradient centrifugation using LymphoprepTM (1.077 g/ml, StemCell Technologies)28. Plasma was collected and spun at 2000 × g for 10 min toremove platelets before freezing at −80 °C for later use. PBMC were collected andwashed twice with pre-warmed R10 media: RPMI 1640 (Sigma, St. Louis, MO,USA) supplemented with 10% heat-inactivated FCS (Sigma), 1 mM Pen/Strep and2mM L-Glutamine (both from Sigma). After the second centrifugation, cells wereresuspended in R10 and counted using the Guava® ViaCountTM assay on the MuseCell Analyzer (Luminex Cooperation). The majority of assays were performed onfreshly isolated PBMC during the first peak of the pandemic using availableresources, and it was not possible to test all samples with all antigens. Assaysperformed on frozen samples are indicated in the manuscript.
Antigens. For functional assays, PBMC were stimulated with three groups ofpeptide pool for SARS-CoV-2: (1) Spike: 15-mers overlapping by 10 amino acidresidues for spike (S), divided into 12 ‘minipools’ P1–P12 (Proimmune)29, andgrouped into pools S1 (P1-6) and S2 (P7-12) for some assays (2) Structural andaccessory proteins: 12-20-mer peptides overlapping by 10 amino acid residues formembrane protein (M), nucleoprotein (NP), envelope (E) protein, open readingframe (ORF) 3, 6, 7 and 8 (Proimmune)20 and (3) Predicted epitope pools: pre-dicted CD4+ and CD8+ pools10 from the Sette laboratory, La Jolla Institute, CA, allused at a final concentration of 1–2 μg/ml per peptide depending on the assay.Lyophilised peptides were reconstituted in DMSO (Sigma).
IFN-γ ELISpot assay. The kinetics and magnitude of the cellular responses toSARS-CoV-2 were assessed by ex vivo IFN-γ ELISpot28. Fresh PBMC were used inall ELISpot assays unless otherwise indicated in figure legends. Briefly, 96-wellMultiscreen-I plates (Millipore, UK) were coated for 3 h with 10 μg/ml GZ-4 anti-human IFN-γ (Mabtech, AB, Sweden) at room temperature. Fresh PBMC wereadded in duplicate wells at 2 × 10⁵ cells in 50 μl per well and stimulated with 50 μlof SARS-CoV-2 peptide pools (2 μg/ml per peptide) as indicated in the figurelegends and controls. R10 with DMSO (final concentration 0.4%, Sigma) was usedas negative control and the following reagents were used as positive controls: CEFTpeptide pool (2 µg/ml, Proimmune) and Concanavalin A (5 µg/ml final con-centration, Sigma). After 16–18 h at 37 °C, 5% CO2, 95% humidity, cells wereremoved and secreted IFN-γ was detected by adding 1 μg/ml anti-IFN-γ biotiny-lated mAb (7-B6-1-biotin, Mabtech) for 2–3 h, followed by 1 μg/ml streptavidin
Fig. 7 T cell response in highly exposed seronegative controls. a Ex vivo IFN-γ ELISpot responses to summed SARS-CoV-2 peptide pools spanning spike,accessory and structural proteins (E, M, NP, ORF 3, ORF6, ORF7 and ORF8) in highly exposed HCWs working in acute medical care who experienced aCOVID-19-compatible illness without PCR testing and were subsequently seronegative. Responses are shown with background subtracted, n= 10.b Heatmaps showing CD4+ and c CD8+ T cell proliferative responses in the same population of highly exposed HCWs. All data plotted are backgroundsubtracted, n= 8 (cells unavailable for 2). d Breadth of responses to structural and accessory proteins from SARS-COV-2 in CD4+ and e CD8+
proliferating T cells. f Magnitude of responding CD4+ and g CD8+ T cells to structural and accessory proteins from SARS-CoV-2 (M, NP, ORF3, 6, 7, 8).Each data point represents a single volunteer and plots show median with error bars indicating ± IQR. Comparison of two groups was done by two-tailedMann–Whitney U test. Study ID with † was assessed from cryopreserved samples. Proliferation assay for individuals 7 and 10 was not performed. N= 35for combined control.
NATURE COMMUNICATIONS | https://doi.org/10.1038/s41467-021-21856-3 ARTICLE
NATURE COMMUNICATIONS | (2021) 12:2055 | https://doi.org/10.1038/s41467-021-21856-3 | www.nature.com/naturecommunications 11

alkaline phosphatase for 1–2 h (SP-3020, Vector Labs). The plates were developedusing BCIP/NBT substrate (Pierce) according to the manufacturer’s instructions.ELISpot plates were scanned on an AID ELISpot Reader (v.4.0) using the followingsettings: intensity min 12, size min 22, gradient min 4. Results were reported asspot-forming units (SFU) per million PBMC. The unspecific background (meanSFU from negative control wells) was always less than 50 SFU/106 PBMC andsubtracted from experimental readings.
Intracellular cytokine stimulation assay. PBMC resuspended in R10 were platedat 1 × 10⁶ live cells/well into 96-well round-bottom plates and stimulated withSARS-CoV-2 peptide pools (2 μg/ml per peptide) as indicated in the figure legends.Media containing DMSO (0.1%, Sigma) was used as negative control and PMA(0.05 μg/ml) with ionomycin (0.5 μg/ml, Sigma) as a positive control. CD107aBV421 (BD Biosciences), monensin (Biolegend) and Brefeldin A (MP Biomedicals)were added to cultures at a final concentration of 0.04 μg/ml, 0.16 μM, and 10 μg/ml, respectively, and cells were incubated for 6 h at 37 °C, 5% CO2, 95% humidity.Plates were placed at 4 °C overnight and subjected to flow cytometry staining asdescribed below. In addition to the three cytokines, CD107a was examined as wasCD154 in CD4+ T cells.
Proliferation assay. PBMCs from freshly isolated blood samples or cryopreservedsamples (denoted with †) were twice washed with 1× PBS and stained usingCellTrace® Violet (CTV, Life Technologies) at a final concentration of 2.5 μM for10 min at room temperature. The reaction was quenched by adding cold FBS.CTV-labelled PBMC in RPMI containing 10% human AB serum (Sigma), 1 mMPen/Strep and 2mM L-Glut were plated in 48 or 96-well round-bottom plates at500,000 and 250,000 cells, respectively, and stimulated with peptide pools fromSARS-CoV-2, FEC-T, HCV NS3 or HCV core protein (1 μg/ml per peptide). Mediacontaining 0.1% DMSO (Sigma) representing DMSO content in peptide pools wereused as negative control and 2 μg/ml phytohemagglutinin L (PHA-L, Sigma) asused as a positive control. Cells were subsequently incubated at 37 °C, 5% CO2,95% humidity for 5 days without media change or 7 days with media change onday 4 if cultures were kept beyond 5 days. At the end of incubation, cells weresubjected to flow cytometry staining as described below. Responses above 1% wereconsidered true positive. To determine the breadth of antigenic response targetedby T cells, the number of peptide pools that each volunteer responded to wascounted. To determine the magnitude of the total response to structural andaccessory proteins, the average number of cells proliferating in response to anyof the peptides M, N, ORF3, 6, 7, 8 was obtained as a function of their respectiveCD4+ or CD8+ T cell population and then expressed as a percentage. Thebackground was then subtracted from the total response for each volunteer.
Flow cytometry staining. A MIFlowCyt file (minimum information about a flowcytometry experiment) was created as per Section VI. 4 of ‘Guidelines for the use offlow cytometry and cell sorting in immunological studies’30 and recommended bythe International Society for Advancement of Cytometry31. The file contains detailsof antibodies, reagents, instrument settings, gating strategies and controls used forflow cytometry experiments and is provided in the Supplementary Information ofthis manuscript. PBMC were resuspended in cell staining buffer (Biolegend) in caseof proliferation assays or 1×PBS in case of ICS assays and incubated for 20 minwith near-infra-red live/dead or aqua fixable stain, respectively (Invitrogen,Carlsbad, CA, USA). Cells from proliferation assays were incubated withfluorochrome-conjugated primary human-specific antibodies for CD3, CD4 andCD8 in cell staining buffer (Biolegend) containing serum for 30 min at 4 °C,washed with cell staining buffer, fixed with 4% paraformaldehyde (PFA, Sigma)and stored at 4 °C in the dark until data acquisition. Cells from ICS assays werefixed with fixation/permeabilization solution (BD Biosciences) for 20 min at 4 °C,washed with permeabilization buffer (BD Biosciences) followed by incubation withfluorochrome-conjugated human-specific antibodies. After washing with permea-bilization buffer, the samples were resuspended in 1×PBS and stored at 4 °C in thedark until data acquisition. Data were acquired on an LSRII (BD Biosciences) orMACSquant analyser 10 (Miltenyi) flow cytometer and analysis was performedwith FlowJo Version 10.7.1 (BD Biosciences). Specific gating strategies can befound in the Supporting information.
Lactate measurements. Supernatants from the proliferation assay were analysedusing a published cellular lactate assay32. Briefly, colorimetric L-lactate assay kits(Abcam, Cambridge, UK) were used as per the manufacturer’s instructions. Astandard concentration curve was defined, and the lactate concentration in eachday 4 supernatant from the proliferation assay was calculated using a 96-well platereader.
The lactate proliferation index was calculated on a per-well basis using thefollowing Eq. 1:
Proliferation %ð Þ ¼ 100 ´ TStim �mean TDMSOð Þð Þ=TStim ð1Þ
where TStim is the concentration of lactate for a given well with either PHA orSARS-CoV-2 peptides, and mean (TDMSO) is the average background lactateproduction from negative control wells.
A significant proliferative response to a given peptide was greater than 0, asdetermined by Eq. 2:
Significance ¼ mean TStimð Þ � 3 ´ std TStimð Þ ð2Þ
where mean(TStim) is the mean % proliferative response of a specific participant toa stimulus, and std(TStim) is the standard deviation of the participant to a givenstimulus.
Standardised ELISA for detection of spike-specific total IgG in plasma. Totalanti-SARS-CoV-2 spike antibodies were determined using an indirect ELISA29,which is based on the Krammer assay33 using a standard curve derived from a poolof SARS-COV-2 convalescent plasma samples on every plate. Standardised EUswere determined from a single dilution of each sample against the standard curvewhich was plotted using the 4-Parameter logistic model (Gen5 v3.09, BioTek). Eachassay plate consisted of samples and controls plated in triplicate, with ten standardpoints in duplicate and four blank wells.
SARS-CoV-2 pseudotype micro-neutralisation assay. Frozen plasma sampleswere thawed, heat-inactivated at 56 °C for 30 min, and assayed for neutralisation ofa lentivirus-based viral particle carrying a luciferase reporter and pseudotyped withfull-length SARS-CoV-2 spike (Accession No: YP_009724390.1)l34. Briefly, neu-tralising antibody titres were determined by incubating serial two-fold plasmadilutions with ~105 RLU pseudotyped virus for 2 h before the addition of 104
HEK293T cells transfected with full-length human ACE2 24 h prior. After 72 hincubation at 37 °C, luciferase expression was quantified using BrightGlow (Pro-mega Corp.), readouts were normalised, and −Log(IC50) determined via non-linear regression using GraphPad Prism 8 (GraphPad Software).
Enzyme-linked immunosorbent assay for coronaviruses. 229E, NL63, HKU1and OC43 spike antibody responses were measured using ELISAs. 229E, NL63,HKU1 and OC43 spike antigens were bought from Sino Biological, China. Nunc-Immuno 96-well plates (ThermoFischer Scientific, USA) were coated with 2.0 μg/ml of antigen in PBS buffer and left overnight at 4 °C. Plates were washed with 3×with 0.1% PBS–Tween (PBS/T), then blocked with casein in PBS for 1 h at roomtemperature (RT). Serum or plasma was diluted in casein–PBS solution at 1:100dilutions before being added to Nunc-Immuno 96-well plates in triplicate. Plateswere incubated for 2 h before being washed with 6× with PBS/T. Secondary anti-body rabbit anti-human whole IgG conjugated to alkaline phosphatase (Sigma,USA) was added at a dilution of 1:1000 in casein–PBS solution and incubated for1 h at RT. After a final wash, plates were developed by adding 4-nitrophenylphosphate substrate in diethanolamine buffer (Pierce, Loughborough, UK), andoptical density OD was read at 405 nm using a BMG Labtech microplate reader. Areference standard comprising of pooled cross-reactive serum and naive serum oneach plate served as positive and negative controls, respectively. The positivereference standard was used on each plate to produce a standard curve from which‘relative ELISA units’ were derived. Pooled HCoV highly reactive sera were used asa standard for the HCoV spike ELISAs.
Alignment score analysis. SARS-CoV-2 sequence was downloaded from Gen-Bank (accession number: NC_045512). All spike, M and NP protein sequences ofeach of the HCoV species (OC43, HKU1, NL63 and 229E) were downloaded fromNCBI using a protein blast. For each protein of each species, all sequences werealigned using MAFFT server (https://mafft.cbrc.jp/alignment/server/) and a con-sensus sequence was constructed. The clinical sample with the least number ofmismatches relative to the consensus sequence was chosen as a representativesequence for each protein of each HCoV species (see Supplementary Table 7, usehttps://www.ncbi.nlm.nih.gov/protein/ for search). Matlab version R2018b wasused to align each SARS-CoV-2 peptide against HCoV proteins.Needleman–Wunsch algorithm as implemented in Matlab (nwalign function) wasused to perform a semi-global alignment of each peptide and the alignment scorewas recorded.
Statistical analyses. Statistical analysis was performed with IBM SPSS Statistics 25and figures were made with GraphPad Prism 8. Chi-square was used to compare theratio difference between the two groups. After testing for normality usingKolmogorov–Smirnov test, independent-samples t-test or Mann–Whitney U testwas employed to compare variables between two groups, andKruskal–Wallis–ANOVA with Dunn’s multiple comparisons test was performed tocompare variables between three or more groups with a non-parametric distribu-tion. The correlation was performed via Spearman’s rank correlation coefficient. ForICS cytokine expression analyses, data were prepared using PESTEL v2.0 for for-matting and baseline subtraction, followed by the export of data to SPICE v6.0 foranalysis. Statistical significance was set at P < 0.05 and all tests were two-tailed.
ARTICLE NATURE COMMUNICATIONS | https://doi.org/10.1038/s41467-021-21856-3
12 NATURE COMMUNICATIONS | (2021) 12:2055 | https://doi.org/10.1038/s41467-021-21856-3 | www.nature.com/naturecommunications

Reporting summary. Further information on research design is available in the NatureResearch Reporting Summary linked to this article.
Data availabilityThe SARS-CoV-2 sequence was accessed in the NCBI Gene database under accessioncode NC_045512. All other data are present in the article and its SupplementaryInformation files or from the corresponding author upon reasonable request. Source dataare provided with this paper.
Received: 2 October 2020; Accepted: 15 February 2021;
References1. Gorbalenya, A. E. et al. Coronaviridae Study Group of the International
Committee on Taxonomy of Viruses. The species Severe acute respiratorysyndrome-related coronavirus: classifying 2019-nCoV and naming it SARS-CoV-2. Nat. Microbiol. 5, 536–544 (2020).
2. Lu, R. et al. Genomic characterisation and epidemiology of 2019 novelcoronavirus: implications for virus origins and receptor binding. Lancet 395,565–574 (2020).
3. Guan, W. J. et al. China Medical Treatment Expert Group for Covid. Clinicalcharacteristics of coronavirus disease 2019 in China. N. Engl. J. Med. 382,1708–1720 (2020).
4. Wu, Z. & McGoogan, J. M. Characteristics of and important lessons from thecoronavirus disease 2019 (COVID-19) outbreak in China: summary of areport of 72314 cases from the chinese center for disease control andprevention. JAMA 323, 1239–1242 (2020).
5. Docherty, A. B. et al. Features of 20133 UK patients in hospital with covid-19using the ISARIC WHO clinical characterisation protocol: prospectiveobservational cohort study. BMJ 369, m1985 (2020).
6. Ainsworth, M. et al. Performance characteristics of five immunoassays forSARS-CoV-2: a head-to-head benchmark comparison. Lancet Infect. Dis. 20,1390–1400 (2020).
7. Wu, F. et al. Evaluating the association of clinical characteristics withneutralizing antibody levels in patients who have recovered from mildCOVID-19 in Shanghai, China. JAMA Intern. Med. 180, 1356–1362(2020).
8. Seow, J. et al. Longitudinal observations and decline of neutralising antibodyresponses in the three months following SARS-CoV-2 infection in humans.Nat. Microbiol. 5, 1598–1607 (2020).
9. Le Bert, N. et al. SARS-CoV-2-specific T cell immunity in cases of COVID-19and SARS, and uninfected controls. Nature 584, 457–462 (2020).
10. Grifoni, A. et al. Targets of T cell responses to SARS-CoV-2 coronavirus inhumans with COVID-19 disease and unexposed individuals. Cell 181,1489–1501 (2020).
11. Sekine, T. et al. Robust T cell immunity in convalescent individuals withasymptomatic or mild COVID-19. Cell 183, 158–168 (2020).
12. Zhou, W. et al. First infection by all four non-severe acute respiratorysyndrome human coronaviruses takes place during childhood. BMC Infect.Dis. 13, 433 (2013).
13. Severance, E. G. et al. Development of a nucleocapsid-based humancoronavirus immunoassay and estimates of individuals exposed to coronavirusin a U.S. metropolitan population. Clin. Vaccin. Immunol. 15, 1805–1810(2008).
14. Gorse, G. J. et al. Prevalence of antibodies to four human coronaviruses islower in nasal secretions than in serum. Clin. Vaccin. Immunol. 17, 1875–1880(2010).
15. Galanti, M. & Shaman, J. Direct observation of repeated infections withendemic coronaviruses. J. Infect. Dis. 223, 409–415 (2020).
16. Kiyuka, P. K. et al. Human coronavirus NL63 molecular epidemiology andevolutionary patterns in rural coastal Kenya. J. Infect. Dis. 217, 1728–1739(2018).
17. Turtle, L. et al. Human T cell responses to Japanese encephalitis virus in healthand disease. J. Exp. Med. 213, 1331–1352 (2016).
18. Weiskopf, D. et al. Phenotype and kinetics of SARS-CoV-2–specific T cells inCOVID-19 patients with acute respiratory distress syndrome. Sci. Immunol. 5,eabd2071 (2020).
19. Braun, J. et al. SARS-CoV-2-reactive T cells in healthy donors and patientswith COVID-19. Nature 587, 270–274 (2020).
20. Peng, Y. et al. Broad and strong memory CD4(+) and CD8(+) T cells inducedby SARS-CoV-2 in UK convalescent individuals following COVID-19. Nat.Immunol. 21, 1336–1345 (2020).
21. Mateus, J. et al. Selective and cross-reactive SARS-CoV-2 T cell epitopes inunexposed humans. Science 370, 89–94 (2020).
22. Swadling, L. et al. A human vaccine strategy based on chimpanzee adenoviraland MVA vectors that primes, boosts, and sustains functional HCV-specific Tcell memory. Sci. Transl. Med. 6, 261ra153 (2014).
23. Campion, S. L. et al. Proteome-wide analysis of HIV-specific naive andmemory CD4(+) T cells in unexposed blood donors. J. Exp. Med. 211,1273–1280 (2014).
24. Su, LauraF. et al. Virus-specific CD4(+) memory-phenotype T cells areabundant in unexposed adults. Immunity 38, 373–383 (2013).
25. Adams, E. R. et al. Antibody testing for COVID-19: a report from the NationalCOVID Scientific Advisory Panel. Wellcome Open Res. 5, 139 (2020).
26. Eyre, D. W. et al. Differential occupational risks to healthcare workers fromSARS-CoV-2 observed during a prospective observational study. eLife 9,e60675 (2020).
27. Public Health England. SIREN (Sarscov2 Immunity & REinfectionEvaluatioN): The Impact of Detectable Anti SARS-COV2 Antibody on theIncidence of COVID-19 in Healthcare Workers. https://snapsurvey.phe.org.uk/siren/ (2020)
28. Jenjaroen, K. et al. T-cell responses are associated with survival in acutemelioidosis patients. PLoS Negl. Trop. Dis. 9, e0004152 (2015).
29. Folegatti, P. M. et al. Safety and immunogenicity of the ChAdOx1 nCoV-19vaccine against SARS-CoV-2: a preliminary report of a phase 1/2, single-blind,randomised controlled trial. Lancet 396, 467–478 (2020).
30. Cossarizza, A. et al. Guidelines for the use of flow cytometry and cell sorting inimmunological studies. Eur. J. Immunol. 49, 1584–1797 (2017).
31. Lee, J. A. et al. MIFlowCyt: the minimum information about a Flow CytometryExperiment. Cytom. Part A J. Int. Soc. Anal. Cytol. 73, 926–930 (2008).
32. Grist, J. T. et al. Extracellular lactate: a novel measure of T cell proliferation. J.Immunol. 200, 1220–1226 (2017).
33. Amanat, F. et al. A serological assay to detect SARS-CoV-2 seroconversion inhumans. Nat. Med. 26, 1033–1036 (2020).
34. Thompson, C. et al. Detection of neutralising antibodies to SARS coronavirus2 to determine population exposure in Scottish blood donors between Marchand May 2020. Eurosurveillance 25, 2000685 (2020).
AcknowledgementsWe wish to thank Kathryn Southey and Suki Kenth for administrative support, and ourmedical student volunteers Julie Dequaire, Rory Fairhead, Shayan Fassih, Thomas Foord,David Kim, Thomas Ritter, Adan Taylor and Rebecca Young for logistical assistance. Theviews expressed in this article are those of the authors and not necessarily those of theNational Health Service (NHS), the National Institutes for Health Research (NIHR) orthe Medical Research Council (MRC). This work was supported by the UK Departmentof Health and Social Care as part of the PITCH (Protective Immunity from T cells toCovid-19 in Health workers) Consortium, the UK Coronavirus Immunology Consortium(UK-CIC), the Huo Family Foundation and the National Core Study: Immunity (NCSi4Pprogramme) ‘Optimal cellular assays for SARS-CoV-2 T cell, B cell and innate immu-nity’. M.A.A. is supported by a Wellcome Trust Sir Henry Dale Fellowship (220171/Z/20/Z). E.B. and P.K. are NIHR Senior Investigators and PK is funded by WT109965MA andNIH (U19 I082360). S.J.D. is supported by an NIHR Global Research Professorship. T.D.is funded by the Medical Research Council (MRC), UK: Chinese Academy of MedicalSciences (CAMS) Innovation Fund for Medical Sciences (CIFMS), China (grant number:2018-I2M-2-002). D.W.E. is a Robertson Foundation Fellow. A.J.M. was supported bythe Medical Research Council [grant MC_PC_19059] and the National Institutes forHealth and Oxford Biomedical Research Centre. P.C.M. is funded by a Wellcomeintermediate fellowship, ref. 110110/Z/15/Z. The work by A.S. and D.W. was funded bythe National Institutes of Health contract Nr. 75N9301900065. D.S. is supported by theNIHR Academic Clinical Fellow programme in Oxford. O.S. is funded by the WellcomeTrust Infection, Immunology, and Translational Medicine programme (Grant: 108869/Z/15/Z). L.T. is supported by the Wellcome Trust (grant number 205228/Z/16/Z). L.T. andP.K. are in the National Institute for Health Research Health Protection Research Unit(NIHR HPRU) in Emerging and Zoonotic Infections (NIHR200907) at the University ofLiverpool in partnership with Public Health England (PHE), in collaboration withLiverpool School of Tropical Medicine and the University of Oxford. P.K. is funded byDepartment of Health and Social Care (DHSC)/UKRI/NIHR COVID-19 Rapid ResponseGrant (COV19-RECPLA). The views expressed are those of the author(s) and notnecessarily those of the NHS, the NIHR, the Department of Health or Public HealthEngland.
Author contributionsS.J.D., P.K., E.B., J.F., P.G., A.J.M. and H.A.F. conceptualised the project. S.J.D., P.K., E.B.,J.F., P.G., H.A.F., A.O., B.K., A.B., J.T.G., M.Pace, E.A., L.L., L.T., M.O., P.T., D.J.N.,T.d.S., S.R.J. and M.Pirmohamed designed and supervised T cell experiments. A.J.P., G.S.,T.L., C.D., C.T., O.L.S. and N.L. designed and supervised antibody experiments. A.O.,A.B., J.T.G., M.Pace, E.A., L.L., M.O., P.T., M.P P.R., M.A., H.B., S.C., P.Z., V.V., C.d.L.,T.D., J.G., C.-P.H., W.L., K.J., S.-E.A., A.A., K.A. and H.D.A. performed T cell experi-ments. T.L., C.D., A.F., O.L.S. and N.L. performed antibody experiments. A.E.B., S.J.D.,J.F., D.T.S, K.J., C.P.C., A.J.M., D.W.E., L.S., C.V.A.-C. and P.Z. and the Oxford
NATURE COMMUNICATIONS | https://doi.org/10.1038/s41467-021-21856-3 ARTICLE
NATURE COMMUNICATIONS | (2021) 12:2055 | https://doi.org/10.1038/s41467-021-21856-3 | www.nature.com/naturecommunications 13

Protective T cell Immunology for COVID-19 (OPTIC) Clinical team established theclinical cohorts and collected the clinical samples and data. G.O., T.D., P.C.M., C.T., A.S.,D.W., M.A.A., S.C.M., N.R., P.O., R.T. and the Oxford Immunology Network Covid-19Response T cell Consortium provided critical reagents, technical and intellectualexpertise. E.B., S.J.D., J.F., D.T.S, A.O., B.K., A.B., J.T.G., M.Pace, O.L.S., L.T., T.d.S.,M.O., P.J.T. and D.J.N. analysed the data. S.J.D., P.K., A.O. B.K., M.Pace and J.T.G., wrotethe original draft. S.J.D., P.K., A.O., E.B., J.T., P.G., L.T., T.d.S., A.B., M.Pace, J.T.G., C.D.,T.L., G.O., T.D., P.C.M. and P.O. reviewed and edited manuscript and figures.
Competing interestsD.W.E. declares lecture fees from Gilead. A.S. is listed as an inventor on patent appli-cation no. 63/012,902, submitted by La Jolla Institute for Immunology, covers the use ofthe megapools and peptides thereof for therapeutic and diagnostic purposes. A.S. is aconsultant for Gritstone and Flow Pharma and Avalia. The remaining authors declare nocompeting interests.
Additional informationSupplementary information The online version contains supplementary materialavailable at https://doi.org/10.1038/s41467-021-21856-3.
Correspondence and requests for materials should be addressed to P.K.
Peer review information Nature Communications thanks the anonymous reviewers fortheir contribution to the peer review of this work. Peer review reports are available.
Reprints and permission information is available at http://www.nature.com/reprints
Publisher’s note Springer Nature remains neutral with regard to jurisdictional claims inpublished maps and institutional affiliations.
Open Access This article is licensed under a Creative Commons Attri-bution 4.0 International License, which permits use, sharing, adaptation,
distribution and reproduction in any medium or format, as long as you give appropriatecredit to the original author(s) and the source, provide a link to the Creative Commonslicense, and indicate if changes were made. The images or other third party material in thisarticle are included in the article’s Creative Commons license, unless indicated otherwise ina credit line to the material. If material is not included in the article’s Creative Commonslicense and your intended use is not permitted by statutory regulation or exceeds thepermitted use, you will need to obtain permission directly from the copyright holder. Toview a copy of this license, visit http://creativecommons.org/licenses/by/4.0/.
© The Author(s) 2021
1Nuffield Department of Clinical Medicine, Peter Medawar Building for Pathogen Research, University of Oxford, Oxford, UK. 2NuffieldDepartment of Clinical Medicine, Centre for Tropical Medicine and Global Health, University of Oxford, Oxford, UK. 3Oxford University HospitalsNHS Foundation Trust, Oxford, UK. 4Nuffield Department of Clinical Neurosciences, University of Oxford, Oxford, UK. 5Department of Molecularand Clinical Pharmacology, MRC Centre for Drug Safety Science, University of Liverpool, Liverpool, UK. 6The Florey Institute for Host-PathogenInteractions and Department of Infection, Immunity and Cardiovascular Disease, Medical School, University of Sheffield, Sheffield, UK.7Translational Gastroenterology Unit, University of Oxford, Oxford, UK. 8Oxford Vaccine Group, Department of Paediatrics, University of Oxford,Oxford, UK. 9NIHR Oxford Biomedical Research Centre, University of Oxford, Oxford, UK. 10MRC Human Immunology Unit, MRC WeatherallInstitute of Molecular Medicine, University of Oxford, Oxford, UK. 11Chinese Academy of Medical Science Oxford Institute (COI), University ofOxford, Oxford, UK. 12Big Data Institute, Nuffield Department. of Population Health, University of Oxford, Oxford, UK. 13Jenner Institute,University of Oxford, Oxford, UK. 14Department of Infection Biology, Faculty of Infectious and Tropical Diseases, London School of Hygiene andTropical Medicine, London, UK. 15Department of Physiology, Anatomy, and Genetics, University of Oxford, Oxford, UK. 16Institute of Cancer andGenomic Sciences, University of Birmingham, Birmingham, UK. 17Wellcome Centre for Human Genetics, University of Oxford, Oxford, UK.18HPRU in Emerging and Zoonotic Infections, Institute of Infection, Veterinary and Ecological Sciences, University of Liverpool, Liverpool, UK.19Faculty of Medicine, National Heart and Lung institute, Imperial College, London, UK. 20Mahidol-Oxford Tropical Medicine Research Unit,Bangkok, Thailand. 21Nuffield Department. of Clinical Medicine, University of Oxford, Oxford, UK. 22Center for Infectious Disease and VaccineResearch, La Jolla Institute for Immunology, La Jolla, CA, USA. 23Department of Medicine, Division of Infectious Diseases and Global PublicHealth, University of California, Los Angeles, California, USA. 24Peter Medawar Building for Pathogen Research, Department of Zoology,University of Oxford, Oxford, UK. 25Peter Medawar Building for Pathogen Research, Department of Paediatrics, University of Oxford, Oxford, UK.26Tropical and Infectious Disease Unit, Liverpool University Hospitals NHS Foundation Trust, Member of Liverpool Health Partners, Liverpool, UK.27Diabetes Trials unit, Radcliff Department of Medicine, University of Oxford, Oxford, UK. 28Nuffield Department of Clinical Medicine, Universityof Oxford, Oxford, UK. 29Experimental Medicine, Nuffield Department of Clinical Medicine, University of Oxford, Oxford, UK. 30Oxford UniversityMedical School, University of Oxford, Oxford, UK. 31These authors contributed equally: Ane Ogbe, Barbara Kronsteiner, Donal T. Skelly, MatthewPace, Anthony Brown, Emily Adland. 32These authors jointly supervised this work: Lance Turtle, Paul Klenerman, Philip Goulder, John Frater,Eleanor Barnes, Susanna Dunachie. *Lists of authors and their affiliations appear at the end of the paper. ✉email: [email protected]
Oxford Immunology Network Covid-19 Response T Cell Consortium
Graham Ogg3,9,10, Jeremy Chalk27, Georgina Kerr28, Prabhjeet Phalora1, Anna Csala1, Mathew Jones1,
Nicola Robinson1, Rachael Brown1, Claire Hutchings1, Nicholas Provine29, Jeremy Ratcliff1 & Ali Amini29
Oxford Protective T Cell Immunology for COVID-19 (OPTIC) Clinical Team
Susanna Dunachie 1,2,3,9,20,32, Martyna Borak7, Stavros Dimitriadis30, Thomas Fordwoh30, Bryn Horsington7,
Sile Johnson30, Jordan Morrow7, Yolanda Warren7 & Charlie Wells3
ARTICLE NATURE COMMUNICATIONS | https://doi.org/10.1038/s41467-021-21856-3
14 NATURE COMMUNICATIONS | (2021) 12:2055 | https://doi.org/10.1038/s41467-021-21856-3 | www.nature.com/naturecommunications