t economic impacts of the btop program - … · study sample 5 ntia selected 8 pcc, 7 sba and 12...
TRANSCRIPT

1
THE ECONOMIC IMPACTS OF THE BTOP PROGRAM
Summary of Evaluation Study Results
ASR Analytics Stephen Rhody April 14, 2014

BTOP Background
• The Recovery Act (ARRA) instructed NTIA to implement BTOP in order to improve broadband availability, access, and adoption
• NTIA initially selected 233 projects for grant funding, benefiting all 50 states, 5 territories, and DC.
• The types of projects BTOP funded included: – Public Computer Centers (PCC)
– Sustainable Broadband Adoption (SBA), and
– Comprehensive Community Infrastructure (CCI)
• Grantee budgets were composed of both federal funds and non-federal matching funds. – NTIA had allocated approx. 3.6 billion federal dollars to the BTOP grantees as of
September 2013.
– Grantees provided approx. $1.2 billion in non-federal matching funding.
– NTIA used a portion of Recovery Act funds to develop and maintain a nationwide map containing information on broadband service, and to implement the State Broadband Data Act and the Broadband Data Improvement Act.
April 14, 2015
2

About the BTOP Evaluation Study
Summary Results from ASR’s Final Report, submitted to NTIA
September 15, 2014
April 14, 2015 3

Project Timeline
• Project Kickoff
• Project Plan
Q1 (9/2010-12/2010)
• Study Design
• Methodology Conference
Q2-Q3 (1/2011-6/2011)
• 15 PCC and SBA Round 1 Reports
Q4-Q6 (7/2011-3/2012)
• Interim Report 1
Q7-Q8 (4/2012-9/2012)
•15 PCC and SBA Round 2 Reports
Q9-Q11 (10/2012-6/2013)
•Short-Term Economic Impacts Report
•12 CCI Reports
Q12-Q13 (7/2013-12/2013)
•Interim Report 2
Q14 (1/2014-3/2014)
•Final Report
•Raw Data
Q15-Q16 (4/2014-9/2014)
4 April 14, 2015

Grantee Locations, Evaluation Study Sample
5
NTIA selected 8 PCC, 7 SBA and 12 CCI grants for inclusion in the evaluation study sample. These projects took place in 20 different states.
April 14, 2015

Complexities Measuring Long-Term Impacts
Long timescale of many BTOP infrastructure projects
Public use data sources are expected to lag by at least a year and perhaps more
Delays between infrastructure availability and broadband adoption
Last mile changes / construction
Upgrades to hardware or software on the part of users
Training or education of user communities
Organizational planning delays
Contractual restrictions
April 14, 2015 6
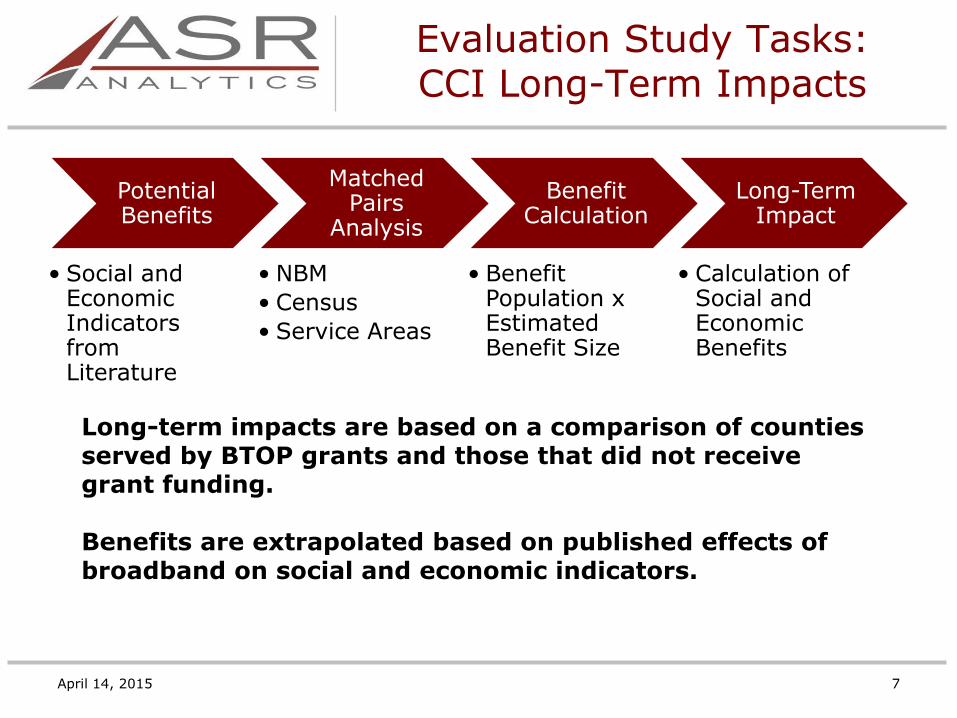
Evaluation Study Tasks: CCI Long-Term Impacts
Potential Benefits
• Social and Economic Indicators from Literature
Matched Pairs
Analysis
• NBM
• Census
• Service Areas
Benefit Calculation
• Benefit Population x Estimated Benefit Size
Long-Term Impact
• Calculation of Social and Economic Benefits
7
Long-term impacts are based on a comparison of counties served by BTOP grants and those that did not receive grant funding. Benefits are extrapolated based on published effects of broadband on social and economic indicators.
April 14, 2015

408 Treatment Counties
CAI Locations
APRs, PPRs, Fact
Sheets
Grantee Applications
Grantee Feedback
Long-Term Economic Impacts
April 14, 2015 8
Treatment counties designated based on multiple data sources and validated by grantees. Control counties selected based on BTOP applications.

Treatment and Matched Control Counties
April 14, 2015 9

Estimated Effects of BTOP on Availability
April 14, 2015 10
NBM Data Calculations
Year Population Availability Availability Rate
Treatment Counties
2011 31,961,430 29,253,140 91.5%
2013 32,354,865 30,543,410 94.4%
Difference 2.9%
Control Counties
2011 32,005,404 29,535,198 92.3%
2013 32,653,752 30,420,799 93.2%
Difference 0.9%
Difference-in-Differences = Treatment Difference –
Control Difference
2.9% - 0.9% = 2.0% Increase in
Availability due to BTOP

Improved Availability
Estimated Effect of BTOP on Broadband Availability in the CCI Evaluation Study Sample Service Area for Different Populations of
Interest
April 14, 2015 11
In the study sample, residents of rural census blocks received the greatest gain in broadband availability from June 30, 2011 to June 30, 2013.

Improved Availability
Population Gaining Availability Due to BTOP
April 14, 2015 12
Population Overall
Population
Without Availability
(2011)
Estimated Effect
Gained Broadband
Due to BTOP
BTOP counties 217,567,674 10,679,287 2.00% 4,340,677
Rural 35,869,465 7,976,972 4.58% 1,641,921
Poverty 34,030,031 2,083,457 2.39% 812,159
Over 60 44,647,552 2,623,955 2.07% 925,657
Minority 66,680,588 2,596,642 0.54% 361,013
Non-English 21,747,513 1,072,802 0.18% 39,599
Based on the estimated 2.0% broadband availability increase from BTOP infrastructure projects, more than 4.3 million people across the U.S. gained broadband availability from June 30, 2011 to June 30, 2013.

Increased Economic Output
•
April 14, 2015 13
annual increase in GDP due to BTOP = programmatic BTOP effect on availability × study coefficient ×
∑Gross County Products for BTOP counties
For a 2.0 percent increase in broadband availability, BTOP infrastructure spending would be expected to yield:
$5.7 billion (annual)
Czernich et al. (2011)
$21.0 billion (annual)
LECG Ltd. (2009)

Other Economic Benefits
• Federal and non-federal match spending:
– generated approx. 79,000 year-long jobs (ASR 2014)
– produced a short-term GDP increase of $7 billion
– produced about $1.50 in increased GDP for each $1 of federal or non-federal money spent on BTOP projects
• Potential long-term increases in employment
– 22,949 long-term jobs, annual benefit of $1B (Kolko 2010)
– 27,913 jobs over a four-year period, annual benefit $1.3B (Gillett et al. 2006)
• Potential for greatly reduced broadband prices at Community Anchor Institutions
April 14, 2015 14

Link to Evaluation Study
Reports and case studies are available online:
http://www2.ntia.doc.gov/Broadband-Resources#evaluation
April 14, 2015 15