t h e e x p o s u r e t r i a n g l e · the landscape photography journals video series documents...
TRANSCRIPT

THE EXPOSURE TRIANGLE
SHUTTER SPEED | ISO | APERTURE
FROM DAVE MORROW PHOTOGRAPHY
www.DaveMorrowPhotography.com Page 2
Table of Contents
This PDF contains Volumes 3-6 of my Photography Fundamentals Tutorial Series.
Visit the linked page for the latest & most up to date photo guides.
The Landscape Photography Journals Video Series documents my travels in the wilderness & teaches the photography & outdoor skills used on these trips.
SHUTTER SPEED GUIDE 6
Shutter Speed Chart & Exposure Time Basics 6 What is a Camera Shutter? 7 Shutter Speed Vs. Exposure Time 7 What is Motion Blur in Photography? 8
Exposure Stops & Shutter Speed 10 Adjusting Shutter Speed Using Stops 10 Shooting Example - Using Stops & Shutter Speed 15
Example Images & Creative Control 17 Shutter Speed Image Attributes 17
Shutter Speed Range: 1/8000th - 1/1000th Second 18 Shutter Speed Range: 1/500th - 1/250th Second 18 Shutter Speed Range: 1/125th - 1/15th Second 19 Shutter Speed Range: 1/8th - 10 Seconds 20 Shutter Speed Range: 15 Seconds - 2 Minutes 22
Max Shutter Speed for Handheld Photos 24 Image Quality & Shutter Speed 24
Expose to the Right Example & Histogram 26 Expose to the Right RAW File Darkened in Post Processing 28
Test & Compare Shutter Speeds 28
APERTURE, F-STOP, & DEPTH OF FIELD GUIDE 30
START HERE | LEARN PHOTOGRAPHY | VIEW PHOTOS | WORKSHOPS & TOURS

www.DaveMorrowPhotography.com Page 3
Aperture & Depth of Field Photography Basics 30 What is Aperture in Photography? 31 What is Depth of Field in Photography? 33 What is Focal Length in Photography? 36
Example Images - Focal Length & Field of View 37 Wide Angle, Standard, & Zoom Lenses 39 How to Read a Camera Lens 39
Reading a Camera Lens: Focal Length 39 Effective Focal Length 41 Reading a Camera Lens: F-Stop Value 43
Lens Speed, Explained 44 Exposure Stops & F-Stops 45
Aperture Diameter & Exposure Stops 50 Shooting Example - Aperture & Exposure Stops 51
Example Photos: Depth of Field & F-Stop 53 Focal Point & Depth of Field 53 F-Stop & Depth of Field 55
Small F-Stop Values & Image Attributes 56 Mid-Range F-Stop Values & Image Attributes 58 Large F-Stop Values & Image Attributes 59
Focal Length & Depth of Field 62 Example Photos: Depth of Field Vs. Focal Length 62
ISO PHOTOGRAPHY GUIDE 65
ISO Photography Basics 66 ISO, Noise, & Image Quality 66
How Does ISO Affect Exposure? 70 Exposure Stops & ISO Settings 72 Shooting Examples - When to Increase ISO Settings? 76
Requirement 1: Faster Shutter Speed 77 Requirement 2: Increase Image Brightness 79
START HERE | LEARN PHOTOGRAPHY | VIEW PHOTOS | WORKSHOPS & TOURS

www.DaveMorrowPhotography.com Page 4
Requirement 3: Increase F-Stop Value & Depth of Field 82 How ISO Works - Technical Details 85 Technical Shooting Example 87
Step 1: Determine the F-Stop 90 Step 2: Determine the Shutter Speed 90 Step 3: Fine Tune ISO Settings 90
Test Your Camera - ISO Performance 94 ISO, Noise & Dynamic Range 95
EXPOSURE TRIANGLE GUIDE 97
Exposure Triangle Camera Technique Videos 97 The 4 Factors Controlling the Exposure Triangle 98 The 2 Requirements of Successful Photographs 99
Requirement 1: Exposure / Image Brightness 99 Example Images - Under & Overexposed 99
Requirement 2: Visual Image Attributes 101 Shutter Speed Image Attributes 102 ISO Image Attributes 103 F-Stop Image Attributes 105
Section Review 106 Exposure Stops - Shutter Speed, F-Stop & ISO 107 Exposure Value (EV) Basics 108
Reference - Common Scene Light Values for Landscapes 109 Absolute Exposure Value 110
Example Calculations & Discussion 110 Absolute Exposure Value Chart 111
Settings Light Value 112 Shooting Examples - Settings Light Value 113
Histograms, Tones, & Luminosity 118 Luminosity Histograms Basics 119
Shooting Example - Histograms & Exposure Value 123
START HERE | LEARN PHOTOGRAPHY | VIEW PHOTOS | WORKSHOPS & TOURS

www.DaveMorrowPhotography.com Page 5
How Relative Exposure Value Works 124 Settings Light Value > Scene Light Value = +EV 124 Settings Light Value < Scene Light Value = -EV 127 Settings Light Level = Scene Light Level = 0EV 129
Manual Mode Vs. Aperture Priority Mode 131 Aperture Priority Shooting Mode (AP) 132 Manual Shooting Mode (M) 132
Step by Step Shooting Technique 133 Step by Step Shooting Workflow 134 1. Select Base ISO Setting 135 2. Select Composition & Focus the Lens 135 3. Camera Meter Determines Scene Light Value 135 4. Determine Minimum F-Stop Setting 136
Exposure Triangle Relationships for F-Stop: 136 5. Determine Shutter Speed Settings 138 6. ISO & Final Adjustments 140
Understanding Exposure - Technical Details 145 What is Exposure in Photography? 145 Pixels, Color & the Exposure Triangle 146 Technical Examples of Exposure 148
Example 1 - Correct Photography Exposure 149 Example 2 - Underexposure 150 Example 3: Overexposure 151
Why ISO Matters 153 Matching Exposure with ISO 154
Final Tips - The Exposure Triangle 155 Useful Links & Information 156
START HERE | LEARN PHOTOGRAPHY | VIEW PHOTOS | WORKSHOPS & TOURS
www.DaveMorrowPhotography.com Page 6
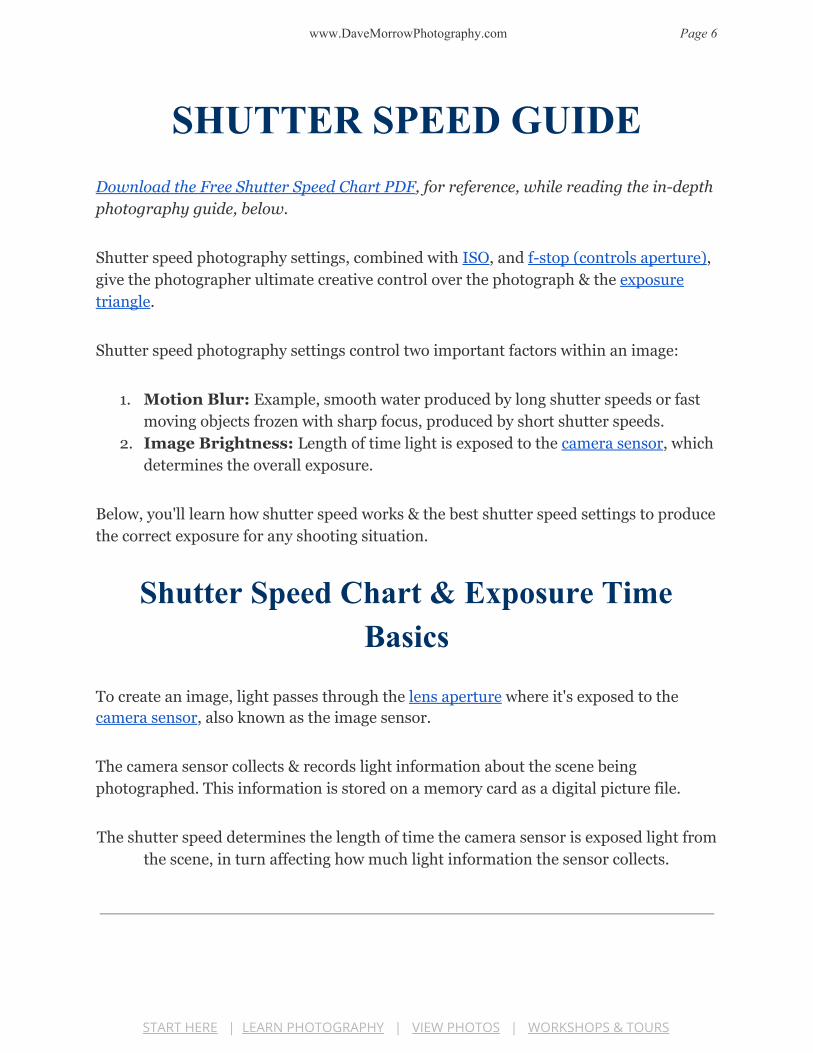
SHUTTER SPEED GUIDE Download the Free Shutter Speed Chart PDF, for reference, while reading the in-depth
photography guide, below.
Shutter speed photography settings, combined with ISO, and f-stop (controls aperture), give the photographer ultimate creative control over the photograph & the exposure
triangle.
Shutter speed photography settings control two important factors within an image:
1. Motion Blur: Example, smooth water produced by long shutter speeds or fast
moving objects frozen with sharp focus, produced by short shutter speeds.
2. Image Brightness: Length of time light is exposed to the camera sensor, which
determines the overall exposure.
Below, you'll learn how shutter speed works & the best shutter speed settings to produce
the correct exposure for any shooting situation.
Shutter Speed Chart & Exposure Time Basics
To create an image, light passes through the lens aperture where it's exposed to the
camera sensor, also known as the image sensor.
The camera sensor collects & records light information about the scene being
photographed. This information is stored on a memory card as a digital picture file.
The shutter speed determines the length of time the camera sensor is exposed light from
the scene, in turn affecting how much light information the sensor collects.
START HERE | LEARN PHOTOGRAPHY | VIEW PHOTOS | WORKSHOPS & TOURS

www.DaveMorrowPhotography.com Page 7
What is a Camera Shutter?
Think of a camera shutter as a door, inside the camera body, that covers the camera
sensor.
● When the shutter (door) is closed, the sensor does not collect light information
about the scene being photographed.
● When the shutter (door) is open the sensor starts collecting light information
about the scene being photographed.
When you press the "shutter button" to take an image, the shutter opens and the sensor
is exposed to light for the amount of time denoted by the shutter speed setting.
Technical Note: DSLR cameras have a physical shutter. Mirrorless cameras do not.
Other than this fact shutter speed works in the same manner for both.
Shutter Speed Vs. Exposure Time
Shutter speed controls the exposure time. For example, a shutter speed of 2 seconds,
exposes the image sensor to light for 2 seconds. This is known as a 2 second exposure
time.
The photographer selects the shutter speed, which controls the exposure time, during
which the sensor is exposed to light.
Once this exposure time has elapsed, the shutter closes and the sensor is no longer
exposed to light, thus stops capturing information about the scene.
START HERE | LEARN PHOTOGRAPHY | VIEW PHOTOS | WORKSHOPS & TOURS

www.DaveMorrowPhotography.com Page 8
What is Motion Blur in Photography?
If different elements in a composition move over the exposure time, such as water, tree
leaves, animals or stars, each pixel will show an average of the color and light intensity
collected by that pixel.
Using different shutter speeds allows the photographer to add interesting detail showing
dynamic movement in a still frame picture.
The following images are used to isolate the effects of motion blur making them easily
apparent.
Actual landscape images & examples provided in the next section.
1/1000 s. Shutter Speed, No Motion Blur
START HERE | LEARN PHOTOGRAPHY | VIEW PHOTOS | WORKSHOPS & TOURS

www.DaveMorrowPhotography.com Page 9
1 s. Shutter Speed, Motion Blur
The image photographed at 1/1000 second shutter speed, shows no motion blur. The
water looks as it would to your eye.
The image photographed at 1 second shutter speed, shows slight motion blur. The water
is much smoother with less detail.
Each pixel shows the average of the color and light it collects over the given shutter
speed.
Motion blur is a function of shutter speed, focal length, and speed of the object moving
through the composition.
Experimentation is key to learning about motion blur. In the following sections, we will
discuss this topic in detail.
START HERE | LEARN PHOTOGRAPHY | VIEW PHOTOS | WORKSHOPS & TOURS

www.DaveMorrowPhotography.com Page 10
Exposure Stops & Shutter Speed
An exposure stop, or stop for short, provides a universal scale to measure the increase
and decrease in light, exposed to the image sensor, due to changes in shutter speed &
f-stop.
For ISO, exposure stops provide the increase or decrease in signal (light information)
amplification, thus how much light is required to produce the optimal exposure.
Overall, stops provide an easy way for the photographer to increase or decrease image
brightness or adjust specific f-stop, ISO, and shutter speed settings while balancing the
exposure triangle.
To make things clear the following examples discuss stops for shutter
speed, while assuming f-stop & ISO settings stay constant.
Upon understanding the concept, read the Photography Exposure Triangle Guide and
learn to adjust all settings simultaneously, using stops.
Adjusting Shutter Speed Using Stops
Click Here & download the Shutter Speed Chart PDF to reference while reading.
START HERE | LEARN PHOTOGRAPHY | VIEW PHOTOS | WORKSHOPS & TOURS
www.DaveMorrowPhotography.com Page 11
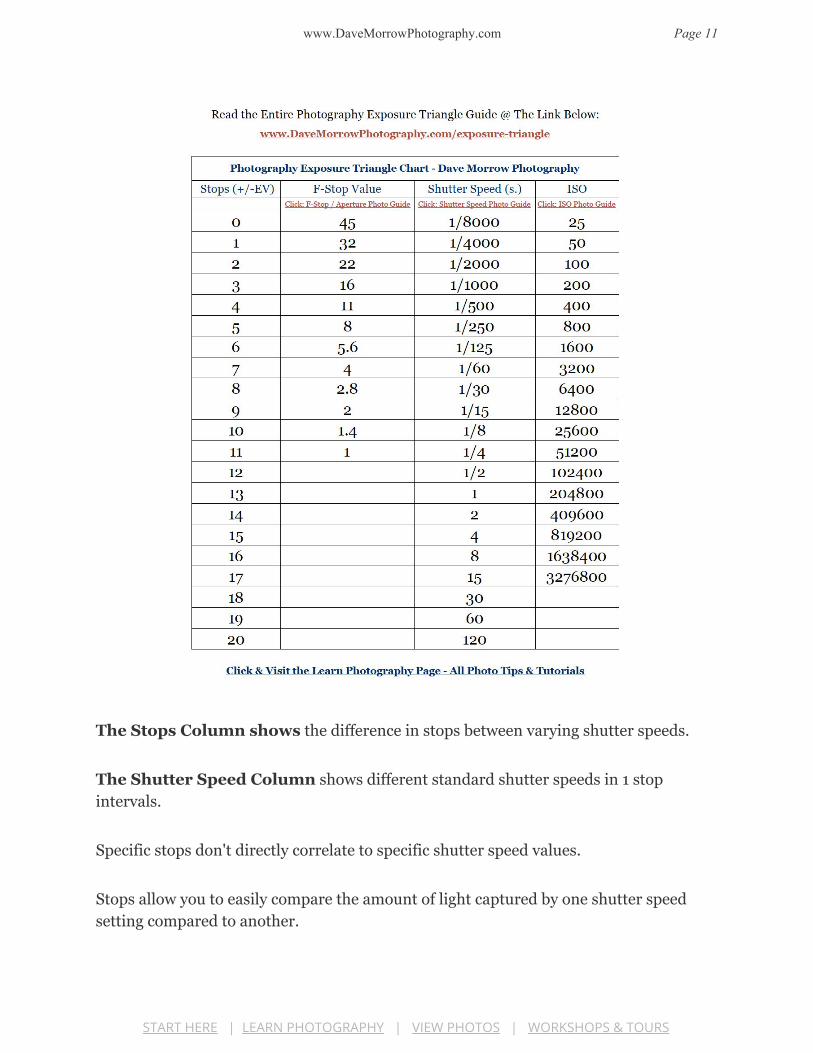
The Stops Column shows the difference in stops between varying shutter speeds.
The Shutter Speed Column shows different standard shutter speeds in 1 stop
intervals.
Specific stops don't directly correlate to specific shutter speed values.
Stops allow you to easily compare the amount of light captured by one shutter speed
setting compared to another.
START HERE | LEARN PHOTOGRAPHY | VIEW PHOTOS | WORKSHOPS & TOURS
www.DaveMorrowPhotography.com Page 12
This makes it easy to increase or decrease the image brightness & balance the exposure
triangle without guessing.
Lengthening / increasing the shutter speed , thus producing a longer exposure
time, allows the image sensor to collect more light information, producing a brighter
image with increased motion blur. This is known as stopping up.
Shortening / decreasing the shutter speed, thus producing a shorter exposure
time, forces the image sensor to collect less light information, producing a darker image
with less motion blur. This is known as stopping down.
TECHNICAL NOTE: Shutter speed is measured in seconds, therefore increasing the shutter speed
increases the exposure time. The opposite applies for a decrease in shutter speed.
In reality and physics speed is provided in distance or units per second. The concept of shutter speed can
be confusing since it works in the opposite direction of how we usually think of “speed”.
The shutter speed, provided in seconds, controlled through camera settings, is not a true speed. Knowing
the information from the camera input shutter speed the photographer could calculate the actual speed of
the shutter, although this is not required.
For example, a 1/1000 second “shutter speed” could theoretically take 1000 shots per second. 1000 shots
per second is a true shutter speed.
For Shutter Speed, Exposure Stops Work as Follows:
● An increase of 1 stop doubles the amount of light exposed to the image sensor,
creating a brighter exposure with more motion blur.
● A decrease of 1 stop decreases the amount of light by half, creating a darker
exposure with less motion blur.
The following example images show 1 stop increases in shutter speed with no changes to
ISO or f-stop.
As the images progress, stopping up in shutter speed, they become brighter with
increased motion blur.
As motion blur & shutter speed increases the water becomes less and less detailed, with
increased smoothness.
START HERE | LEARN PHOTOGRAPHY | VIEW PHOTOS | WORKSHOPS & TOURS

www.DaveMorrowPhotography.com Page 13
Settings: 1/15 second, f/11, ISO50
Settings: 1/8 second, f/11, ISO50
START HERE | LEARN PHOTOGRAPHY | VIEW PHOTOS | WORKSHOPS & TOURS

www.DaveMorrowPhotography.com Page 14
Settings: 1/4 second, f/11, ISO50
Settings: 1/2 second, f/11, ISO50
START HERE | LEARN PHOTOGRAPHY | VIEW PHOTOS | WORKSHOPS & TOURS

www.DaveMorrowPhotography.com Page 15
To maintain constant image brightness, while increasing or decreasing shutter speed,
changes in ISO or f-stop must be made by the same number of stops in the opposite
direction.
For example, a stop up in shutter speed would require a stop down in ISO, f-stop, or a
combination of both, to maintain the same image brightness.
This is taught in the Exposure Triangle Photography Guide.
Shooting Example - Using Stops & Shutter Speed
Let's say you took an image with a shutter speed of 4 seconds, f/8, ISO100, and noticed
it was too bright.
Remember, all other settings are currently arbitrary and remain
constant.
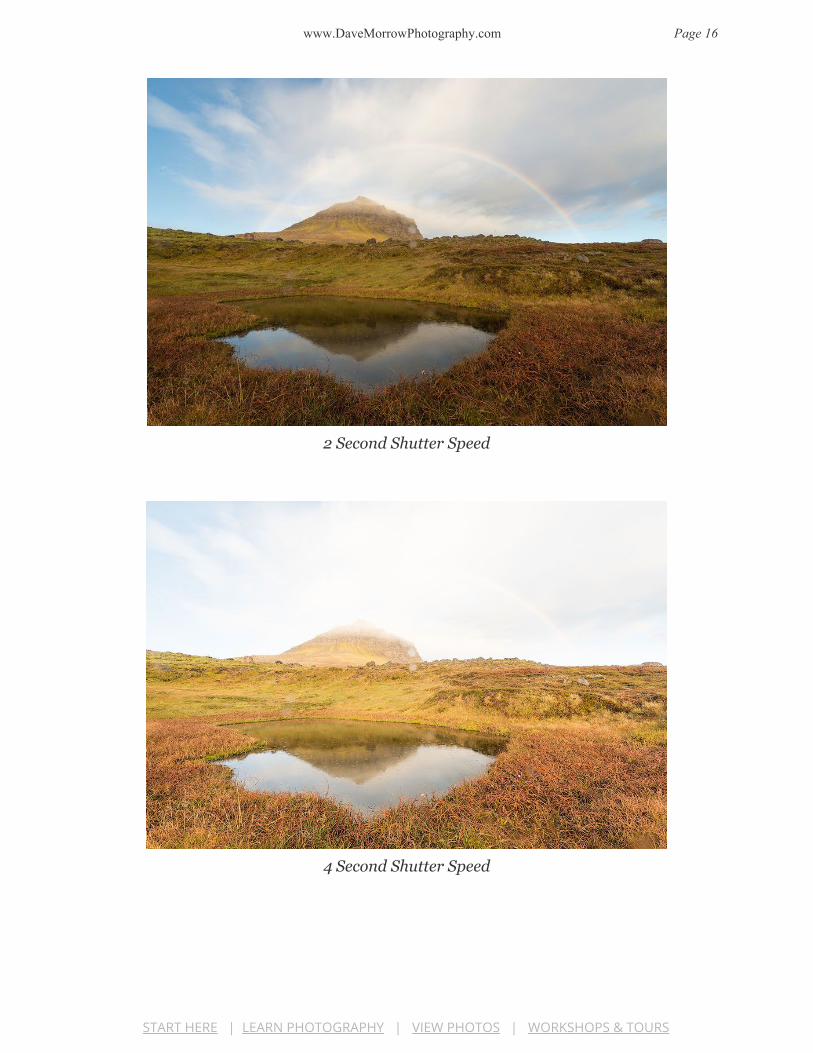
You thought to yourself, "If only this image contained half the amount of light it would
be perfect.". Reference the example images below.
1. You knew that a 1 stop decrease in shutter speed would reduce the light collected
by half, creating the photo you wanted.
2. Instead of guessing at the best shutter speed, you referenced the chart & saw that
a 1 stop decrease in shutter speed from 4 seconds was 2 seconds.
3. You selected this new shutter speed in your camera and pressed the shutter
button.
4. Due to your knowledge of stops & shutter speeds, the new image exhibited exactly
half the light as the previous image.
5. There was no need to guess at the ideal shutter speed or take test images! You're
done.
Technical Note: Most cameras allow you to change your shutter speeds, ISO and
f-stop values in intervals of 1/3, 1/2 or 1 stop. This is a user selected setting providing
in camera. I prefer to use 1/3 stop intervals for precise control.
START HERE | LEARN PHOTOGRAPHY | VIEW PHOTOS | WORKSHOPS & TOURS
www.DaveMorrowPhotography.com Page 16
2 Second Shutter Speed
4 Second Shutter Speed
START HERE | LEARN PHOTOGRAPHY | VIEW PHOTOS | WORKSHOPS & TOURS

www.DaveMorrowPhotography.com Page 17
Example Images & Creative Control
Click Here & Download the
Exposure Triangle Cheat Sheet,
including shutter speed image
attributes.
Varying shutter speeds can be
utilized to provide detail, dynamic
movement, and desired image
attributes in a photo.
An image attribute is a specific
visual effect obtained from
different camera settings such as
f-stop, ISO & shutter speed.
The photographer can control
image attributes by varying shutter
speeds. This is where creativity, practice & foresight really come into play!
Shutter Speed Image Attributes
The following shutter speed ranges are provided to help you visualize varying exposure
times & their corresponding image attributes.
Only by testing each of these with your camera setup will you actually learn and
understand the concepts.
The following images are unedited RAW files showing actual outcomes of varying
shutter speeds without changes due to photo editing.
START HERE | LEARN PHOTOGRAPHY | VIEW PHOTOS | WORKSHOPS & TOURS

www.DaveMorrowPhotography.com Page 18
Shutter Speed Range: 1/8000th - 1/1000th Second
Best for Quickly Moving Objects & High Scene Luminance
● This range of fast shutter speeds is great for photographing fast moving objects
where everything needs to be in focus, without motion blur.
● Fast shutter speeds require large levels of scene luminance, low f-stop values,
and/or high ISO values to produce the optimal exposure.
1/1000th Second Shutter Speed - Backpacking in the Canyonlands of Utah
Shutter Speed Range: 1/500th - 1/250th Second
Best for Moving Objects & Intermediate Scene Luminance
● This range of fast shutter speeds is used to photograph quickly moving objects,
achieving sharp focus, without motion blur, with less ambient light in the scene.
START HERE | LEARN PHOTOGRAPHY | VIEW PHOTOS | WORKSHOPS & TOURS

www.DaveMorrowPhotography.com Page 19
● They usually work well for overcast or partly cloudy days.
1/250th Second Shutter Speed - Glacier Climbing in Iceland
Shutter Speed Range: 1/125th - 1/15th Second
Best for Sunrise & Sunset, Slightly Blurred Moving Objects, Intermediate to Low Scene
Luminance
This range of shutter speeds is used to photograph landscapes, with a tripod, in low
light, including sunrises and sunsets.
The image below shows the movement of crashing waves with motion blur.
Due to the shutter speed of 1/15th of a second, in the image below, water movement
details are visible, producing a dynamic effect.
START HERE | LEARN PHOTOGRAPHY | VIEW PHOTOS | WORKSHOPS & TOURS

www.DaveMorrowPhotography.com Page 20
1/15th Second Shutter Speed - Sunset on the Pacific Coast
Shutter Speed Range: 1/8th - 10 Seconds
Best for Sunrise & Sunset, Twilight, Blurred Moving Objects, Low Scene Luminance
These long shutter speeds are used to create motion blur in landscape, street and travel
photography.
They also work well for capturing light trails behind vehicles, water movement, and
cloud movement.
Compared to the image above, the following two images show water movement with
increased motion blur but decreased overall detail in the water.
START HERE | LEARN PHOTOGRAPHY | VIEW PHOTOS | WORKSHOPS & TOURS

www.DaveMorrowPhotography.com Page 21
They excel at moving the viewer's eyes through the composition with image attributes
that would not have existed at shorter shutter speeds.
This method works well for showing movement in a subtle & calm manner.
Cool colors, as shown below, and taught in the Color Theory Photography Guide, also
produce calming effects on the overall mood.
1/2 Second Shutter Speed - Twilight in Kauai, Hawaii
START HERE | LEARN PHOTOGRAPHY | VIEW PHOTOS | WORKSHOPS & TOURS

www.DaveMorrowPhotography.com Page 22
1 Second Shutter Speed - Exploring the Waterfalls of Oregon
Shutter Speed Range: 15 Seconds - 2 Minutes
Best for Long Exposure Night Photography, Star Trails, Milky Way, Very Low Scene
Luminance
These slow shutter speeds are used for long exposure low light conditions including,
milky way, star trail, and northern lights photography.
They also work well for long exposure photography of moving objects producing a
motion blur effect in clouds and water.
START HERE | LEARN PHOTOGRAPHY | VIEW PHOTOS | WORKSHOPS & TOURS

www.DaveMorrowPhotography.com Page 23
15 Second Shutter Speed - Level 8 Aurora Activity in Iceland
25 Second Shutter Speed - The Milky Way Over Crater Lake
START HERE | LEARN PHOTOGRAPHY | VIEW PHOTOS | WORKSHOPS & TOURS

www.DaveMorrowPhotography.com Page 24
Max Shutter Speed for Handheld Photos
As stated above, objects which move across the composition produce motion blur. The
same holds true if the camera moves due to hand "shake" while shooting.
This hand movement can produce very slight motion blur which causes the image to be
out of focus.
For the sharpest images, a tripod is recommended.
When a tripod can't be used this trick helps to approximate the required shutter speed.
To approximate the maximum shutter speed required for handheld shooting, without
motion blur, take 1 and divide it by the effective focal length.
This value will provide the longest shutter speed that will still produce sharp images.
Max Handheld Exposure Time = 1 / Effective Focal Length
For example, a 50mm effective focal length would require a 1/50th-second shutter speed
or faster.
Anything longer than 1/50th-second shutter speed would yield a blurry image.
This is an approximation, but it works well.
Image Quality & Shutter Speed
This section contains a more advanced concept. If you're new to photography, skip on
to the next section and come back later.
As more light information is collected by the image sensor, over the allotted exposure
time, more detail & data are displayed in the final image, resulting in less image noise.
START HERE | LEARN PHOTOGRAPHY | VIEW PHOTOS | WORKSHOPS & TOURS

www.DaveMorrowPhotography.com Page 25
There is a maximum amount of light information each pixel can collect, known as full
well capacity.
When this value is exceeded, too much light is collected, and the pixel becomes
"clipped", also known as, "overexposed", or "blown out".
When this happens, the pixel's color becomes pure white. All light information
previously collected by this pixel is gone forever. This is a bad thing.
Keep the following key points in mind:
● As the sensor collects more light the image quality increases, provided individual
pixels are not "clipped" for the Red, Green, Blue & luminchannels.
● In nature, some things are very close to pure white, such as direct sunlight. If a
few pixels become "clipped" it's not a big deal.
● Higher quality images, which collect more light information, produce optimal
color and detail.
● The goal is to maximize the amount of light collected by the sensor without
clipping the brightest individual pixels.
Balancing image brightness and quality with desired visual image attributes is key to
mastering photography shutter speed.
By slightly over-exposing the image below, without "clipping" the RGB Histogram, I was
able to capture more data in the dark parts of the photo, while still controlling the
brightest portions.
The technique is called Expose to the Right (ETTR).
Click Here & Learn about the RGB Histogram
START HERE | LEARN PHOTOGRAPHY | VIEW PHOTOS | WORKSHOPS & TOURS

www.DaveMorrowPhotography.com Page 26
Expose to the Right Example & Histogram
Grey Area - RGB Histogram
START HERE | LEARN PHOTOGRAPHY | VIEW PHOTOS | WORKSHOPS & TOURS

www.DaveMorrowPhotography.com Page 27
In post processing, I can take the slightly over exposed image above, and darken it to the
actual levels produced by the scene.
ETTR allows the photographer to capture the most image data possible, especially in the
dark tonal range, without losing any from clipping or blowing out the brightest portions
of the image.
Without slightly overexposing the highlights, I would have lost data in the dark parts of
the image, as shown in the following histogram.
The following image shows the RAW file above, with a 1 stop post processing decrease,
matching what was actually seen in reality.
By slightly overexposing I was able to capture more dark detail, while still retaining all
of the light details.
START HERE | LEARN PHOTOGRAPHY | VIEW PHOTOS | WORKSHOPS & TOURS

www.DaveMorrowPhotography.com Page 28
Expose to the Right RAW File Darkened in Post Processing
Test & Compare Shutter Speeds
Reading and learning new information is great. Taking your camera outside and
experimenting is the only way to master the camera techniques.
To thoroughly understand shutter speed & the photography exposure triangle it's
necessary to master f-stop settings, which control aperture diameter, and ISO settings
which control signal amplification.
● The key to learning any complex topic is breaking it down into the smallest
isolated sub-topics & fully understanding each these sub-topics.
● Upon doing so, the main topic is inherently learned & less overall work is
necessary as a whole.
● This is the bottom-up approach.
START HERE | LEARN PHOTOGRAPHY | VIEW PHOTOS | WORKSHOPS & TOURS

www.DaveMorrowPhotography.com Page 29
In short, don't try to learn the exposure triangle, until you understand shutter speed,
ISO, and f-stop individually.
In this case, shutter speed is a sub-topic of the exposure triangle, here is
how to master it:
1. Without changing any other settings, take varying shots at varying shutter
speeds, for a single composition, isolating the final effects on the visual image
attributes.
2. Prior to taking the image, take a mental guess at the image attribute a specific
shutter speed may produce for a specific shooting scenario.
3. Take 10 of these images, at varying shutter speeds, for an in-depth visual study.
4. Repeat steps 1-3 for varying shooting scenarios, subject speed, and lighting
conditions.
5. Upon doing so, load your images into Lightroom (or Camera RAW) and view
each image, side by side.
6. Zoom in on the pictures at 100% and notice the different visual image attributes
that varying shutter speeds produce.
7. Take mental and physical notes of these outcomes and how they may apply to
future images.
8. Ask yourself WHY, until there are no more WHYs to answer.
9. Experiment, question & repeat.
The question, "What Shutter Speed Do I Use?", leads down the path of
dependence, without an actual understanding of the topic.
Instead, try asking yourself, "What Image Attribute Do I Want to Produce?" &
"What Shutter Speed is Required to Produce It?".
These questions lead down the path of independence and problem-solving. This is
where true learning takes place.
START HERE | LEARN PHOTOGRAPHY | VIEW PHOTOS | WORKSHOPS & TOURS
www.DaveMorrowPhotography.com Page 30
APERTURE, F-STOP, & DEPTH OF FIELD GUIDE
Learn the best depth of field photography settings for aperture, f-stop, and lens focal
length, while balancing the exposure triangle with shutter speed, and ISO.
In photography, aperture diameter, determined by f-stop, controls two important
factors:
1. Depth of Field (DOF) determines the closest and farthest objects in an image,
both of which are in focus. The entire image between these objects also maintains
sharp focus.
2. Amount of Light exposed to the image sensor, which controls the image
brightness, rated in stops.
Below, you'll learn the correct f-stop, aperture & lens settings to produce the optimal
depth of field for any shooting scenario.
Aperture & Depth of Field Photography Basics
Understanding aperture & depth of field requires a strong foundation in the basics of a
camera lens, along with the vocabulary used to describe them, such as f-stop, focal
length, focus range, and field of view.
This section provides an overview of the basics.
The following sections provide technical details allowing you to apply these concepts to
your own photography.
START HERE | LEARN PHOTOGRAPHY | VIEW PHOTOS | WORKSHOPS & TOURS

www.DaveMorrowPhotography.com Page 31
What is Aperture in Photography?
The terms f-stop and aperture are often used interchangeably, this is
incorrect.
● Aperture refers to aperture diameter, where light enters the front of the lens.
● F-stop is the ratio of lens focal length to aperture diameter.
● F-stop can be referred to as f-number or f-stop value. They are the same.
F-stop is a dimensionless number, denoted by a hooked “ f ”, with an underlying
number denoting the f-stop value.
The hooked "f" is shorthand for f-stop, like the ''s." after a shutter speed is short for
seconds.
f/2.8 and f/8 are two examples of common f-stop settings, where 2.8 & 8 are the f-stop
values, respectively.
F-Stop = Lens Focal Length (mm) / Aperture Diameter (mm)
The aperture diameter is the straight line distance from one side of the aperture to
the other side of the aperture, crossing directly through the aperture’s center.
The lens focal length determines the composition, magnification, & field of view, as
described in the section below.
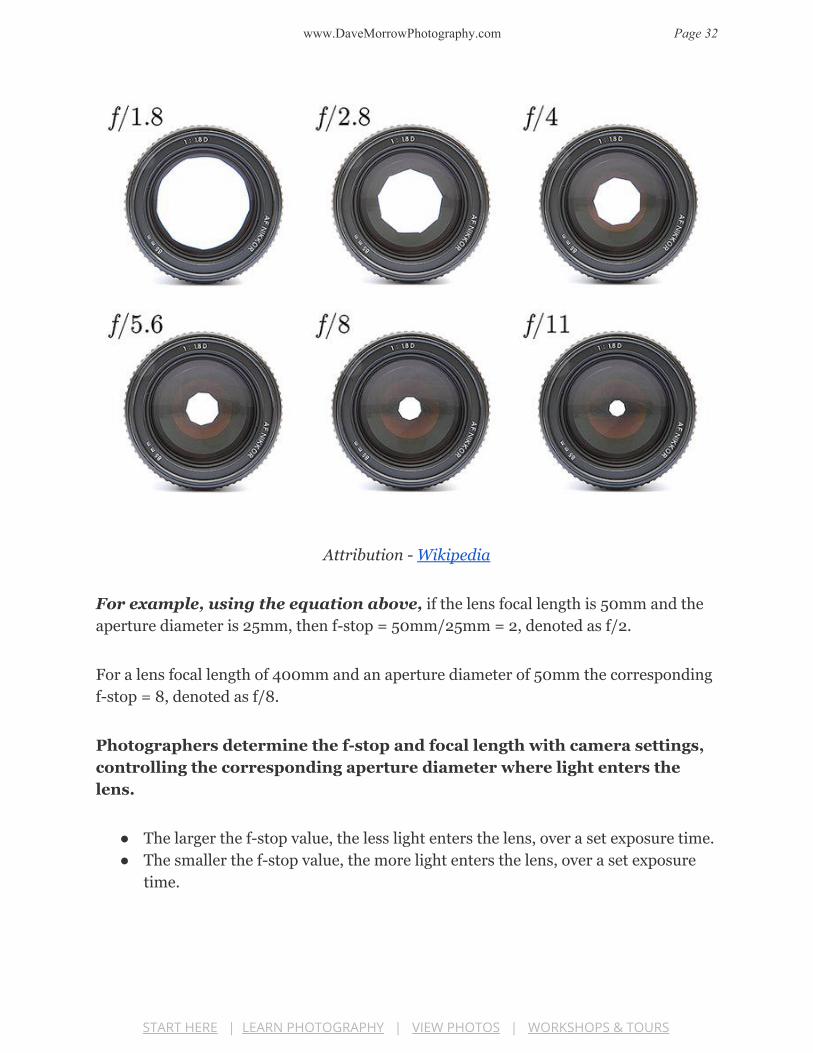
The graphic shows increasing f-stop values with decreasing aperture diameters.
START HERE | LEARN PHOTOGRAPHY | VIEW PHOTOS | WORKSHOPS & TOURS
www.DaveMorrowPhotography.com Page 32
Attribution - Wikipedia
For example, using the equation above, if the lens focal length is 50mm and the
aperture diameter is 25mm, then f-stop = 50mm/25mm = 2, denoted as f/2.
For a lens focal length of 400mm and an aperture diameter of 50mm the corresponding
f-stop = 8, denoted as f/8.
Photographers determine the f-stop and focal length with camera settings,
controlling the corresponding aperture diameter where light enters the
lens.
● The larger the f-stop value, the less light enters the lens, over a set exposure time.
● The smaller the f-stop value, the more light enters the lens, over a set exposure
time.
START HERE | LEARN PHOTOGRAPHY | VIEW PHOTOS | WORKSHOPS & TOURS
www.DaveMorrowPhotography.com Page 33
What is Depth of Field in Photography?
Depth of Focus vs Depth of Field (DOF) - To clear up any confusion, these terms
mean the same thing. They can be used interchangeably with focus range and DOF.
● Depth of field or focus range is the distance between the closest and farthest
objects in an image, both of which are in focus.
● All objects between these closest and farthest objects are also in focus
● The photographer can adjust the f-stop value, in turn, controlling the depth of
field.
Smaller f-stop value = larger aperture diameter = smaller DOF
Larger f-stop value = smaller aperture diameter = larger DOF
The following examples show small or shallow depth of field vs large or deep depth of
field, in photography.
Use these examples to visualize the concept. Detailed explanations are provided below.
The first image was photographed at f/5.6 & the second image at f/16.
The example photos, rocks on a beach, show depth of field in a drastic manner, making
it easy to discern.
START HERE | LEARN PHOTOGRAPHY | VIEW PHOTOS | WORKSHOPS & TOURS

www.DaveMorrowPhotography.com Page 34
Photographed at f/5.6
Photographed at f/16
The red lines denote the closest (bottom) and furthest (top) objects which are in focus.
All objects between these closest and furthest points are also in focus.
START HERE | LEARN PHOTOGRAPHY | VIEW PHOTOS | WORKSHOPS & TOURS
www.DaveMorrowPhotography.com Page 35
The red box denotes the focal point within the image. This is the location which I
focused on to take the shots. The focal point always lies within the focal range, or depth
of field.
In the images above, the focal point, denoted by the red box, stays at approximately the
same location. The depth of
The depth of field or focus range extends beyond the focal point, as the f-stop increases
from f/5.6 to f/16.
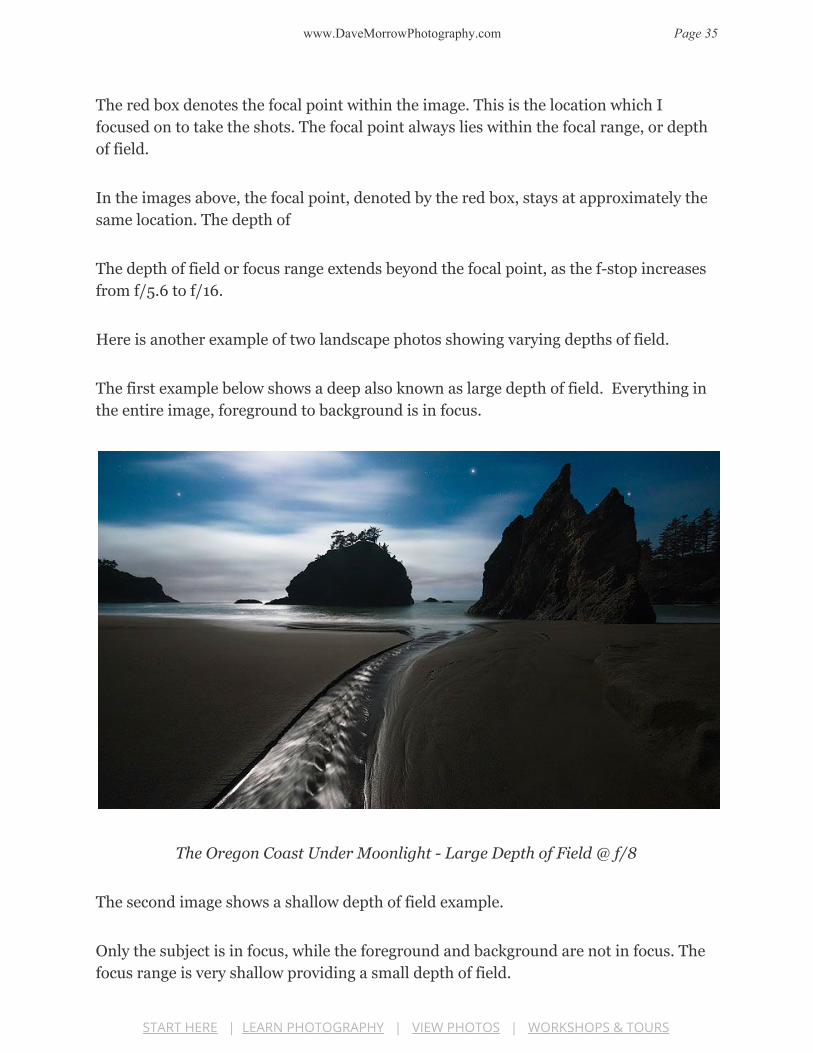
Here is another example of two landscape photos showing varying depths of field.
The first example below shows a deep also known as large depth of field. Everything in
the entire image, foreground to background is in focus.
The Oregon Coast Under Moonlight - Large Depth of Field @ f/8
The second image shows a shallow depth of field example.
Only the subject is in focus, while the foreground and background are not in focus. The
focus range is very shallow providing a small depth of field.
START HERE | LEARN PHOTOGRAPHY | VIEW PHOTOS | WORKSHOPS & TOURS

www.DaveMorrowPhotography.com Page 36
Cormorant Fisherman in China - Shallow Depth of Field @ f/4
What is Focal Length in Photography?
The lens focal length, provided in millimeters, is a setting selected by the photographer,
which determines the field of view.
The Field of View, F.O.V for short, includes everything seen through the viewfinder for a
given focal length.
● Larger focal lengths, producing smaller fields of view, zoom in or magnify the
subject, isolating it in the composition, such as a close-up of an animal in nature.
● Smaller focal lengths, producing larger fields of view, zoom out, showing more of
a scene. For example, a broad & distant landscape.
● Focal length also has an effect on depth of field, as taught below.
The photographer can adjust the focal length to select the desired field of view. Doing so
determines outside boundaries of the image composition.
START HERE | LEARN PHOTOGRAPHY | VIEW PHOTOS | WORKSHOPS & TOURS

www.DaveMorrowPhotography.com Page 37
The focal length range provides the maximum and minimum focal lengths the
photographer can select for a given lens.
The following photos are unedited RAW files straight out of the camera, without
editing. This allows the viewer to see the actual picture qualities discussed, without
possible changes due to editing.
Example Images - Focal Length & Field of View
The following 3 RAW picture files show, top to bottom, 14mm, 24mm and 80mm focal
lengths, all photographed from the same location.
As the focal length increases the field of view decreases and the subjects in the image
become magnified.
14mm Focal Length
START HERE | LEARN PHOTOGRAPHY | VIEW PHOTOS | WORKSHOPS & TOURS

www.DaveMorrowPhotography.com Page 38
24mm Focal Length
80mm Focal Length
START HERE | LEARN PHOTOGRAPHY | VIEW PHOTOS | WORKSHOPS & TOURS

www.DaveMorrowPhotography.com Page 39
Wide Angle, Standard, & Zoom Lenses
Human vision is approximately 50mm focal length. Compared to standard vision, focal
lengths larger than 50mm will magnify a scene, producing a smaller field of view.
Focal lengths smaller than 50mm will produce a "wide angle view". This creates a field
of view wider than normal human vision.
Objects in this field of view tend to become smaller and slightly distorted, compared to
what we are used to seeing.
● Wide Angle Lenses produce a field of view larger than our standard vision &
usually range from 8mm to 35mm in focal length.
● Standard Lenses produce a field of view similar to our standard vision &
usually range from 40mm to 60mm in focal length.
● Zoom Lenses produce a field of view smaller than our standard vision & usually
exceed 70mm in focal length.
How to Read a Camera Lens
Prior to selecting the correct f-stop & focal length settings, producing the desired depth
of field, the basics of a camera lens must be understood.
Reading a Camera Lens: Focal Length
The concepts taught below can be used to read any camera lens. The lens brand is
arbitrary.
A Nikkor 28-300mm, shown in the graphic below, has a focal length range of 28mm to
300mm. This is known as a Wide Angle Zoom Lens since it covers the entire field of
view from wide angle to zoom.
This focal length range is noted on the side of each lens.
START HERE | LEARN PHOTOGRAPHY | VIEW PHOTOS | WORKSHOPS & TOURS

www.DaveMorrowPhotography.com Page 40
The focal length range for this specific lens is labeled in gold letters as 28-300mm, seen
just above the "AF-S NIKKOR" label.
The photographer can select any focal length in the range of 28mm all the way to 300
mm, in turn changing the field of view.
The photographer’s currently selected focal length, which must fall within the focal
length range, is provided on the adjustable barrel of the lens.
For this specific lens, the currently selected focal length, as noted on the adjustable
barrel ( marked with a white dot ), is 28mm.
This means the photographer is currently shooting at a 28mm focal length.
The Nikkor 14-24mm is known as a wide angle lens. The field of view is greater than the
human eye can view.
START HERE | LEARN PHOTOGRAPHY | VIEW PHOTOS | WORKSHOPS & TOURS

www.DaveMorrowPhotography.com Page 41
The wide angle lenses have smaller focal lengths such as 14mm. Zoom lenses have larger
focal lengths such as 300mm.
● The smaller the focal length the larger the field of view.
● The larger the focal length the smaller the field of view.
Effective Focal Length
Reference Learning Material: Camera Sensor Size & Image Quality, Reference Crop
Factor Section linked.
Shooting with cameras that have crop factors above or below 1 will change the field of
view seen through the lens, effectively changing the focal length.
Using the camera crop factor an effective focal length can be calculated.
A 28-300mm lens used on a 1.6 crop factor camera would have an effective focal length
range of 45mm - 480mm, calculated as follows: ( 28mm X 1.6 ) - (300mm X 1.6 ).
START HERE | LEARN PHOTOGRAPHY | VIEW PHOTOS | WORKSHOPS & TOURS

www.DaveMorrowPhotography.com Page 42
The following RAW file, taken in Iceland, was shot at 14mm on a full frame camera with
a crop factor of 1.
The same image, taken at 14mm on a 1.6 crop factor camera, would produce an image
that appears as though it was taken at 22mm ( 14mm X 1.6 ).
The Red Box denotes what the composition would look like on a 1.6 crop factor camera.
Some pro model cameras have the ability to change their effective sensor sizes, in turn
changing their crop factors, & effective focal lengths
For example, a full frame camera shooting with the 28-300mm lens could change crop
factors to maximize the zoom to 480mm ( 300mm X 1.6 ).
This may work well for scenes requiring a long zoom lens, where the photographer
didn’t want to carry around a heavy 500mm.
START HERE | LEARN PHOTOGRAPHY | VIEW PHOTOS | WORKSHOPS & TOURS

www.DaveMorrowPhotography.com Page 43
Although some of the positive image attributes are lost when increasing crop factors,
this loss could be worth it, given the situation.
Reading a Camera Lens: F-Stop Value
Each camera lens has a minimum f-stop value, or widest aperture diameter, in which it
can operate for any given focal length.
Most lenses are designed so the minimum f-stop value increases as the focal length
increases.
The lenses label shows the focal length range to be 18-35mm. The photographer can
shoot at any focal length, in the range of 18-35mm, producing their desired field of view.
START HERE | LEARN PHOTOGRAPHY | VIEW PHOTOS | WORKSHOPS & TOURS

www.DaveMorrowPhotography.com Page 44
Following the focal length range is the minimum f-stop range of f/3.5 to f/4.5, noted on
this lens and most others as 1:3.5-4.5. The letter "G" following the minimum f-stop
range does not apply to the f-stop values.
The range of f/3.5 to f/4.5 provides the minimum f-stop values (widest aperture
diameters), that this specific lens can maintain while shooting at the minimum and
maximum focal lengths, respectively.
For example, the minimum f-stop value this lens can maintain is f/3.5 while shooting
at 18mm.
As the focal length increases, from 18mm to 35mm, the minimum f-stop also increases,
until it reaches f/4.5 at 35mm.
All focal lengths between 18mm and 35mm will have minimum f-stop values ranging
from f/3.5 to f/4.5.
You can always increase the f-stop to larger values. The noted values are only the
minimums.
Lens Speed, Explained
The minimum f-stop value(s) noted on the lens is/are often referred to as lens speed.
Lens speed is the maximum aperture diameter, or smallest f-stop value, a lens can
operate at, for a given focal length.
As the focal length increases, from 18mm to 35mm, on the lens above, the aperture
diameter becomes smaller, reducing the f-stop from f/3.5 to f/4.5.
In turn, a longer exposure time (controlled by shutter speed) is required to collect the
same amount of light information.
START HERE | LEARN PHOTOGRAPHY | VIEW PHOTOS | WORKSHOPS & TOURS

www.DaveMorrowPhotography.com Page 45
The “faster” the lens, the lower the f-stop value it can maintain over its entire focal
length range. This provides shorter possible exposure times at any given focal length.
Looking at the Nikkor 14-24mm f/2.8 Wide Angle lens above, there is a single minimum
f-stop value given of 1:2.8.
This specific lens can maintain an f-stop of f/2.8 while shooting at any focal length in
the range of 14mm to 24mm.
As the photographer adjusts the focal length this lens has the ability to maintain a
constant minimum f-stop value of f/2.8, if so desired.
Lenses that can maintain a constant minimum f-stop value are usually much more
expensive.
There is also a maximum f-stop value or minimum aperture diameter that each lens can
maintain while shooting at each focal length.
These values are not listed on the lens since they do change the maximum / fastest
limits of “lens speed” and the corresponding minimum exposure times.
Exposure Stops & F-Stops
An exposure stop, stop for short, provides a universal scale to measure the increase and
decrease in light, exposed to the image sensor, due to changes in shutter speed & f-stop.
For ISO, exposure stops provide the increase or decrease in signal (light information)
amplification, thus how much light is required to produce the optimal exposure.
Overall, stops provide an easy way for the photographer to increase or decrease image
brightness or adjust specific f-stop, ISO, and shutter speed settings while balancing the
exposure triangle.
START HERE | LEARN PHOTOGRAPHY | VIEW PHOTOS | WORKSHOPS & TOURS

www.DaveMorrowPhotography.com Page 46
To make things clear the following examples discuss stops for f-stop, while
assuming shutter speed & ISO settings stay constant.
Upon understanding the concept, read the Photography Exposure Triangle Guide and
learn to adjust all settings simultaneously, using stops.
Click Here & Download the
chart as a PDF to reference
while reading.
The Stops Column
shows the difference in
stops between different
f-stop values.
The F-Stop Value
Column shows different
standard f-stops in 1 stop
intervals.
Specific stops don't directly
correlate to specific f-stop
values.
Stops allow you to easily
compare the amount of
light captured by one f-stop
setting compared to
another.
This makes it easy to increase or decrease the image brightness & balance the exposure
triangle without guessing.
Increasing the f-stop, thus producing a smaller aperture diameter, forces the image
sensor to collect less light information, producing a darker image, with increased depth
of field. This is known as stopping down.
START HERE | LEARN PHOTOGRAPHY | VIEW PHOTOS | WORKSHOPS & TOURS

www.DaveMorrowPhotography.com Page 47
Decreasing the f-stop, thus producing a larger aperture diameter, allows the image
sensor to collect more light information, producing a brighter image, with decreased
depth of field. This is known as stopping up.
Download the Exposure Triangle Cheat Sheet which shows the relationships between
f-stop and exposure stops.
For F-Stop, Exposure Stops Work as Follows:
● An increase of 1 stop doubles the amount of light exposed to the image sensor,
creating a brighter exposure and reducing the depth of field.
● A decrease of 1 stop decreases the amount of light by half, creating a darker
exposure, increasing the depth of field.
In the following examples, ISO and shutter speed are constant. Only f-stop changes in 1
stop increments.
The first example was taken at f/11, followed by f/8, f/5.6, and f/4. The focal point stays
in the same location.
The focal point stays in the same location.
As the f-stop decreases, in 1 stop increments, the image becomes brighter and the depth
of field decreases.
An easy place to see the decrease in depth of field is the railing at the bottom left-hand
side of the image.
START HERE | LEARN PHOTOGRAPHY | VIEW PHOTOS | WORKSHOPS & TOURS

www.DaveMorrowPhotography.com Page 48
Settings: f/11, ISO100, 1/5th second
Settings: f/8, ISO100, 1/5th second
START HERE | LEARN PHOTOGRAPHY | VIEW PHOTOS | WORKSHOPS & TOURS

www.DaveMorrowPhotography.com Page 49
Settings: f/5.6, ISO100, 1/5th second
Settings: f/4, ISO100, 1/5th second
START HERE | LEARN PHOTOGRAPHY | VIEW PHOTOS | WORKSHOPS & TOURS

www.DaveMorrowPhotography.com Page 50
To maintain constant image brightness, while increasing or decreasing f-stop, changes
in ISO or shutter speed must be made by the same number of stops, in the opposite
direction.
For example, a stop up in f-stop would require a stop down in ISO, shutter speed, or a
combination of both, to maintain the same image brightness.
This is taught in the Exposure Triangle Photography Guide.
Aperture Diameter & Exposure Stops
F-stop and focal length determine aperture diameter, thus for a set focal length, shutter
speed, and ISO value, the amount of light exposed to the image sensor is only controlled
by f-stop.
The total amount of light exposed to the image sensor, in terms of f-stop, is determined
by the total square area of the aperture opening, found on the far right in the graphic
below.
Aperture Area = Pi*(Aperture Radius^2)
For example, Shooting at an f-stop of f/1.4 provides a 314 square millimeter opening
for light to enter the lens as seen in the Aperture Area Column.
Changing the f-stop to f/2, a single stop difference from f/1.4, cuts the aperture area in
half, to 154 square millimeters.
This reduces the amount of light which can enter by half, equaling a 1 stop decrease.
START HERE | LEARN PHOTOGRAPHY | VIEW PHOTOS | WORKSHOPS & TOURS

www.DaveMorrowPhotography.com Page 51
F/2 allows 77 times more light to hit the image sensor than f/16. This is a 6 stop
increase.
Looking at the Aperture Area Column in the graphic above, 154/2 yields 77.
By rating varying f-stop values on the scale of stops, these calculations are
not required.
Shooting Example - Aperture & Exposure Stops
Let's say you took an image with an f-stop of f/11 and noticed it was much too dark.
Remember, all other settings are currently arbitrary and remain
constant.
Mentally you said, "If this picture captured 2 times as much light it would be perfect".
Reference images below
1. You knew that a 1 stop increase (stopping up) in f-stop would 2X the light
captured, creating the photo you wanted.
2. Instead of guessing at the f-stop to use, you referenced the chart & saw that a 1
stop increase from f/11 was f/8.
3. You selected this new f-stop setting and pressed the shutter button.
4. Due to your knowledge of stops & f-stops the new image exhibited 2X the light of
the previous image.
5. There was no need to guess at the ideal setting or take test images! You're done.
Example images provided on next page.
START HERE | LEARN PHOTOGRAPHY | VIEW PHOTOS | WORKSHOPS & TOURS

www.DaveMorrowPhotography.com Page 52
f/11
f/8
START HERE | LEARN PHOTOGRAPHY | VIEW PHOTOS | WORKSHOPS & TOURS

www.DaveMorrowPhotography.com Page 53
Example Photos: Depth of Field & F-Stop
Depth of field (DOF) or focus range is the distance between the closest and farthest
objects in an image both of which are in focus. All objects between these closest and
farthest objects are also in focus.
Depth of Field is controlled by three factors, each shown with example photos below.
Click & Jump to each or scroll down to view them all:
1. Focal Point Example Images
2. F-Stop Example Images
3. Focal Length Example Images
Focal Point & Depth of Field
The focal point determines the depth of field's location within the image.
I prefer to use manual or single point focus for landscape photography.
Each of the following images was photographed at f/5.6. Only the focal point moves.
As the focal point moves, the depth of field also moves within the image.
Each image outlines the depth of field, or focal range, with red lines. The focal point is
denoted with a small red box.
The first image shows a focal point which was selected very close to the bottom of the
image. The depth of field extends in front of and beyond the focal point.
START HERE | LEARN PHOTOGRAPHY | VIEW PHOTOS | WORKSHOPS & TOURS

www.DaveMorrowPhotography.com Page 54
The following image, all settings remain the same. The focal point was shifted into the
middle of the image, moving the focal range.
The last image shows a new focal point moved even further back in the image.
START HERE | LEARN PHOTOGRAPHY | VIEW PHOTOS | WORKSHOPS & TOURS

www.DaveMorrowPhotography.com Page 55
The photographer's goal is to select the correct combination of focal point location and
f-stop settings to produce an image with their desired outcome, as taught below.
F-Stop & Depth of Field
The following examples show different image attributes which correlate to varying
f-stop values and depth of field.
An image attribute is a specific visual effect obtained from varying camera settings such
as f-stop, ISO & shutter speed.
In this case, we will look at visual image attributes determined by f-stop, providing
varying depths of field.
● As the f-stop value increases, the aperture diameter decreases, allowing less light
into the camera while increasing the depth of field.
● As the f-stop value decreases, the aperture diameter increases, allowing more
light into the camera while decreasing the depth of field.
START HERE | LEARN PHOTOGRAPHY | VIEW PHOTOS | WORKSHOPS & TOURS

www.DaveMorrowPhotography.com Page 56
Small F-Stop Values & Image Attributes
Taken at f/1.4, the following image has a very shallow depth of field. This is great for
isolating a single subject in the composition.
Shooting at f/1.4 produces a very large aperture diameter allowing more light to pass
through the lens.
Using this f-stop value during the day requires a very fast shutter speed to compensate
for the extreme amount of light which passes through the aperture diameter.
Icelandic Puffin - f/1.4
Shooting at slightly larger f-stop values such as f/2.8 provides the same effect with a
slightly larger depth of field, as shown in the following example.
Notice that the fisherman & the boat are in focus but the close foreground and distant
background are out of focus. Shooting at f/2.8 is also great Star, Milky Way & Night Sky
Photography.
START HERE | LEARN PHOTOGRAPHY | VIEW PHOTOS | WORKSHOPS & TOURS

www.DaveMorrowPhotography.com Page 57
Fisherman on the Li River, China - f/2.8
F-Stop values of f/4 through f/5.6 provide a larger depth of field with the added bonus
of an out of focus background or foreground, dependent on focal point location & focal
length.
In the image below, f/5.6 was used, allowing the foreground to stay sharp with the
mid-ground buildings in partial focus and the distance background becoming soft & out
of focus.
The background buildings contained interesting details, thus f/5.6 was used in lieu of
f/2.8, keeping the buildings partially focused & adding "interestingness" to the overall
image.
START HERE | LEARN PHOTOGRAPHY | VIEW PHOTOS | WORKSHOPS & TOURS

www.DaveMorrowPhotography.com Page 58
Exploring Rural China - f/5.6
Mid-Range F-Stop Values & Image Attributes
F-Stop values of f/8 - f/11 are used for 90% of my images.
They provide a large depth of field which is ideal for landscape photography.
The image below is sharp in the immediate foreground and the distant background
when taken at f/11.
START HERE | LEARN PHOTOGRAPHY | VIEW PHOTOS | WORKSHOPS & TOURS

www.DaveMorrowPhotography.com Page 59
Sunrise in the Icelandic Highlands - f/11
Large F-Stop Values & Image Attributes
At times, f-stop values larger than f/11 are necessary when longer exposures or
extremely vast depths of field are required.
To lengthen the shutter speed and produce the "silky water" effect an f-stop value of f/16
was used.
F/16 reduced the light entering the lens requiring a longer shutter speed to maintain the
overall exposure or image brightness.
START HERE | LEARN PHOTOGRAPHY | VIEW PHOTOS | WORKSHOPS & TOURS

www.DaveMorrowPhotography.com Page 60
Waterfall at Sunset - f/16
Shooting at f/22 degrades image quality due to lens diffraction but provides a sun star
due to the optics of the lens.
F/22 is only recommended for the sun star effect or to change the overall exposure, such
as an increase in shutter speed as taught in the Exposure Triangle Photography Guide.
START HERE | LEARN PHOTOGRAPHY | VIEW PHOTOS | WORKSHOPS & TOURS

www.DaveMorrowPhotography.com Page 61
Glacier Rivers of Patagonia - f/22
Morning Fog in the Redwoods - f/22
START HERE | LEARN PHOTOGRAPHY | VIEW PHOTOS | WORKSHOPS & TOURS

www.DaveMorrowPhotography.com Page 62
Focal Length & Depth of Field
Experimentation is key to finding the relationship for depth of field and focal length for
a specific camera & lens setup.
The following statements are approximations or rules of thumb. Test & experiment to
see what works!
● As focal length increases, subjects in the scene become more magnified, thus
depth of field decreases.
● As focal length decreases, subjects in the scene become less magnified, thus depth
of field increases.
Wide angle & standard lenses in the range of 10-100mm see negligible changes in depth
of field due to focal length.
Exceeding 100mm focal length provides slight decreases in depth of field due to
increases in focal length & magnification.
Zoom lenses in the range of 150mm+ start to see extreme decreases in depth of field due
to focal length.
To compensate for these decreases in DOF the photographer can increase f-stop values
or use methods such as focus stacking.
Example Photos: Depth of Field Vs. Focal Length
When shooting at effective focal lengths of roughly 100mm or more increased f-stop
values may be required to provide sharp focus throughout the entire depth of field.
This depends on the distance from the closest to furthest objects in the scene being
photographed and the specific camera & lens being used.
As stated in the previous section, test & experiment!
START HERE | LEARN PHOTOGRAPHY | VIEW PHOTOS | WORKSHOPS & TOURS

www.DaveMorrowPhotography.com Page 63
The first example below shows an image taken at f/9 & 145mm effective focal length.
Even at f/9 the background is out of focus.
Due to the increased focal length the depth of field decreased. If this image was taken at
50mm instead of 145mm, f/9 would have provided sharp focus over the entire depth of
field.
The Brothers Wilderness - Washington State
The next example shows an image taken at f/11 and 250mm effective focal length. At
first glance, it may appear to be focused throughout the entire depth of field.
Looking at the bottom-righthand corner, the image sharpness starts to degrade
significantly.
This is due to the decreased depth of field from increased focal length.
START HERE | LEARN PHOTOGRAPHY | VIEW PHOTOS | WORKSHOPS & TOURS

www.DaveMorrowPhotography.com Page 64
To compensate for this issue the f-stop value could be increased to f/16, slightly
extending the depth of field.
Death Valley Wilderness - California
START HERE | LEARN PHOTOGRAPHY | VIEW PHOTOS | WORKSHOPS & TOURS

www.DaveMorrowPhotography.com Page 65
ISO PHOTOGRAPHY GUIDE
ISO photography settings are required for extreme shooting conditions, where aperture
diameter (controlled by f-stop) & shutter speed alone, can't collect enough light to
produce the optimal exposure.
ISO Photography Settings Control Two Important Factors:
1. Amount of Scene Lighting required to produce the optimal exposure.
2. Image Noise & Image Quality.
Below, you'll learn how ISO works & the best ISO photography settings to produce the
correct exposure for any shooting situation.
Download your free ISO Photography Guide PDF, scroll down, & start learning!
START HERE | LEARN PHOTOGRAPHY | VIEW PHOTOS | WORKSHOPS & TOURS

www.DaveMorrowPhotography.com Page 66
ISO Photography Basics
ISO does not change the light sensitivity of the camera sensor contrary to what many
believe.
The camera sensor always maintains the same sensitivity.
Here's An Overview of How ISO Actually Works:
The camera sensor, also known as an image sensor, is an electronic device that collects
light information from the scene being photographed.
The camera sensor depends on shutter speed, f-stop & ISO to determine the overall
exposure (brightness) of the image.
● F-stop and shutter speed determine how much light information is collected from
the scene being photographed, via aperture diameter & length of exposure time.
● The term signal is used to denote the communication of light information into the
digital world. ● ISO determines the amplification this light information (signal) receives as it’s
conveyed from the real world into the digital world. When light information is
amplified so is image noise. Increased ISO = increased image noise.
ISO is a function of signal amplification, not sensor sensitivity!
Let's discuss...
ISO, Noise, & Image Quality
All cameras have a standard or base ISO which is the value selected for normal
operation.
START HERE | LEARN PHOTOGRAPHY | VIEW PHOTOS | WORKSHOPS & TOURS

www.DaveMorrowPhotography.com Page 67
For most cameras, this is ISO 100 or 250. Professional model cameras often provide ISO
values all the way down to 25.
The lower the ISO value the less noise the image will exhibit.
● Base ISO is used for approximately 90% of images.
● Base ISO provides the optimal image quality with minimum noise and grain (ref
example images below).
Below, you'll learn why Base ISO isn't always the preferred setting & when to increase or
decrease ISO settings.
The following unedited RAW files show the results of Base ISO settings and High ISO
Settings.
Moving the slider to the right shows the entire image. Moving the slider to the left shows
a zoomed-in portion of the image.
The images on the next page are unedited RAW files showing outcomes of varying
camera settings without changes due to photo editing.
START HERE | LEARN PHOTOGRAPHY | VIEW PHOTOS | WORKSHOPS & TOURS

www.DaveMorrowPhotography.com Page 68
Base ISO 100 - Optimal Image Quality - No Grain or Noise
START HERE | LEARN PHOTOGRAPHY | VIEW PHOTOS | WORKSHOPS & TOURS

www.DaveMorrowPhotography.com Page 69
High ISO 3200 - Reduced Image Quality - Increased Grain & Noise
START HERE | LEARN PHOTOGRAPHY | VIEW PHOTOS | WORKSHOPS & TOURS

www.DaveMorrowPhotography.com Page 70
How Does ISO Affect Exposure?
When there isn't enough light information in the scene being photographed, such as the
night sky example above, ISO is increased to amplify the light information in camera, in
turn, producing the same outcome as a scene with more lighting.
Scene lighting is also known as scene luminance.
● All images have a very small amount of inherent noise, even at base ISO.
● Although not the same, this could be compared to the small amount of noise
heard on the radio at very low volumes.
When the light information is amplified by increasing ISO to higher values, the baseline
inherent noise is also amplified.
This is why higher ISO images have more noise.
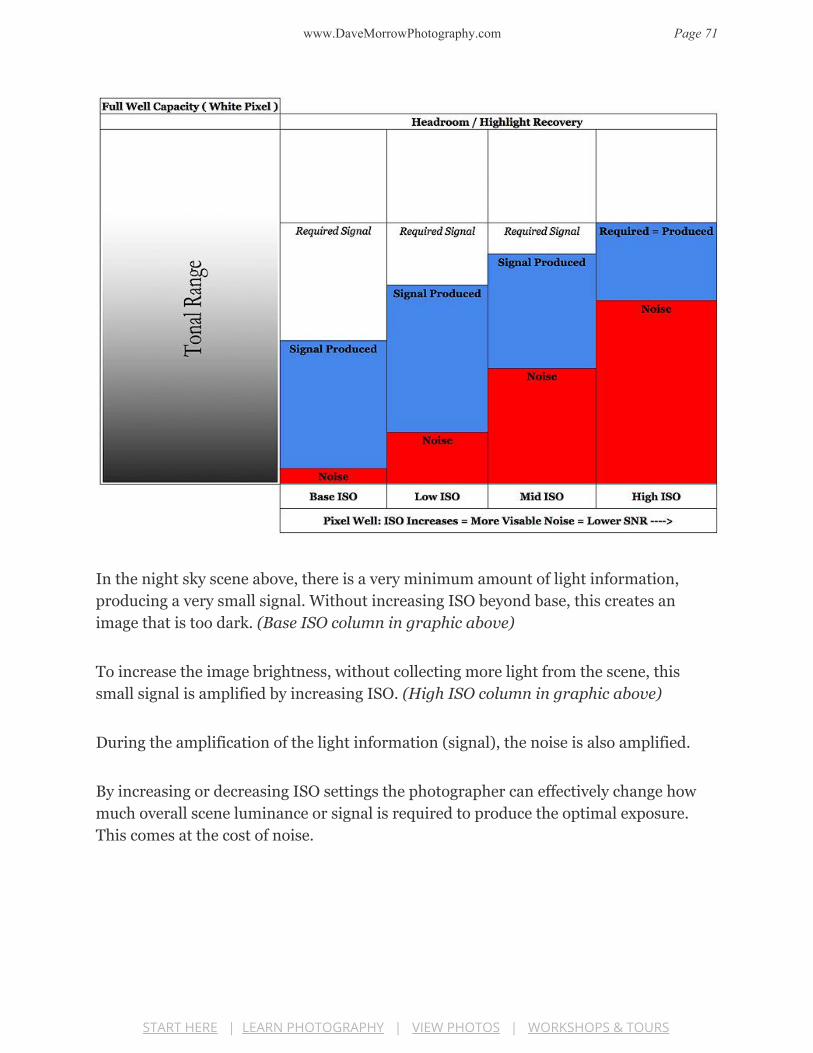
The following graphic is not meant to show exact values, only concepts, as discussed in
the following section.
Visualize the process in this section. Learn the technical details in the next section.
START HERE | LEARN PHOTOGRAPHY | VIEW PHOTOS | WORKSHOPS & TOURS
www.DaveMorrowPhotography.com Page 71
In the night sky scene above, there is a very minimum amount of light information,
producing a very small signal. Without increasing ISO beyond base, this creates an
image that is too dark. (Base ISO column in graphic above)
To increase the image brightness, without collecting more light from the scene, this
small signal is amplified by increasing ISO. (High ISO column in graphic above)
During the amplification of the light information (signal), the noise is also amplified.
By increasing or decreasing ISO settings the photographer can effectively change how
much overall scene luminance or signal is required to produce the optimal exposure.
This comes at the cost of noise.
START HERE | LEARN PHOTOGRAPHY | VIEW PHOTOS | WORKSHOPS & TOURS

www.DaveMorrowPhotography.com Page 72
Exposure Stops & ISO Settings
An exposure stop, stop for short, provides a universal scale to measure the increase and
decrease in light, exposed to the image sensor, due to changes in shutter speed & f-stop.
For ISO, exposure stops provide the increase or decrease in signal (light information)
amplification, thus how much light is required to produce the optimal exposure.
Overall, stops provide an easy way for the photographer to increase or decrease image
brightness or adjust specific f-stop, ISO, and shutter speed settings while balancing the
exposure triangle.
To make things clear the following examples discuss stops for ISO settings,
while assuming shutter speed & f-st0p settings remain constant.
Upon understanding the concept, read the Photography Exposure Triangle Guide and
learn to adjust all settings simultaneously, using stops.
Click Here & Download the chart as
a PDF to reference while reading.
The Stops Column shows the
difference in stops between varying
ISO values.
The ISO Column shows different
standard ISO values in 1 stop
intervals.
Specific stops don't directly correlate
to specific ISO values.
Stops allow you to easily compare
the signal amplification of 1 ISO
setting compared to another, in
START HERE | LEARN PHOTOGRAPHY | VIEW PHOTOS | WORKSHOPS & TOURS

www.DaveMorrowPhotography.com Page 73
turn, the image brightness & overall exposure.
Increasing the ISO, thus producing more noise & higher signal amplification,
produces a brighter image without collecting more light information from the scene.
This is known as stopping up.
Decreasing the ISO, thus producing less noise & lower signal amplification produces
a darker image without a change in light information being collected from the scene.
This is known as stopping down.
For ISO, Exposure Stops Work as Follows:
● A 1 stop increase in ISO doubles the signal amplification producing a brighter
image with more noise.
● A 1 stop decrease in ISO cuts the signal amplification in half producing a darker
image with less noise.
In the following example images, f-stop and shutter speed remain constant while ISO
increases in 1 stop intervals from 200 through 800.
Notice that the ISO setting simply doubles while stopping up and halves while stopping
down.
Each image collects the same amount of light information with constant f-stop and
shutter speed settings. The image brightness is only increased due to the amplification
this light information receives in camera.
The noise also increases as the ISO increases. The noise is very hard to see unless
zooming in full size at 100%. The Nikon D810 used to take these images does not
produce much noise, even at ISO800.
START HERE | LEARN PHOTOGRAPHY | VIEW PHOTOS | WORKSHOPS & TOURS

www.DaveMorrowPhotography.com Page 74
Settings: ISO 200, f/8, 1/1000 second
Settings: ISO 400, f/8, 1/1000 second
START HERE | LEARN PHOTOGRAPHY | VIEW PHOTOS | WORKSHOPS & TOURS

www.DaveMorrowPhotography.com Page 75
Settings: ISO 800, f/8, 1/1000 second
To maintain constant image brightness, while increasing or decreasing ISO, changes in
shutter speed or f-stop must be made by the same number of stops in the opposite
direction.
For example, a stop up in ISO would require a stop down in shutter speed, f-stop, or a
combination of both, to maintain the same image brightness.
This is taught in the Exposure Triangle Photography Guide.
START HERE | LEARN PHOTOGRAPHY | VIEW PHOTOS | WORKSHOPS & TOURS

www.DaveMorrowPhotography.com Page 76
Shooting Examples - When to Increase ISO Settings?
Click Here & download
the Exposure Triangle
Graphic, which contains
tips for selecting the
correct ISO settings.
Base ISO or ISO100 works
very well for 90% of
images.
At times, in extreme
shooting conditions, ISO
must be increased or
decreased to aid f-stop
and shutter speed in
producing the optimal
exposure.
Increasing ISO decreases
image quality, thus ISO
should only be increased when 100% necessary.
There are three specific situations where ISO should be increased. each are covered
in-depth, below:
1. Shooting Requirement: Faster Shutter Speed
○ Action: Increase ISO to Decrease Shutter Speed.
2. Shooting Requirement: Brighter Exposure
○ Action: Increase ISO to Increase Image Brightness.
3. Shooting Requirement: Increased Depth of Field
○ Action: Increase ISO to Increase F-Stop.
START HERE | LEARN PHOTOGRAPHY | VIEW PHOTOS | WORKSHOPS & TOURS
www.DaveMorrowPhotography.com Page 77
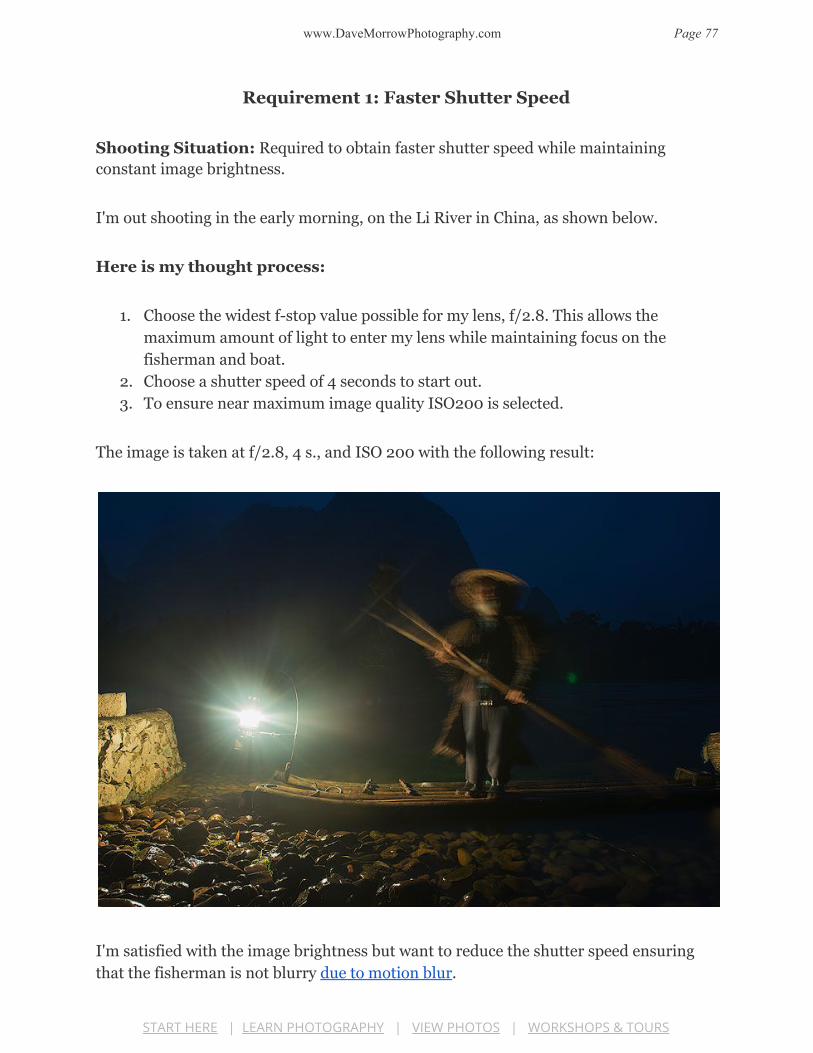
Requirement 1: Faster Shutter Speed
Shooting Situation: Required to obtain faster shutter speed while maintaining
constant image brightness.
I'm out shooting in the early morning, on the Li River in China, as shown below.
Here is my thought process:
1. Choose the widest f-stop value possible for my lens, f/2.8. This allows the
maximum amount of light to enter my lens while maintaining focus on the
fisherman and boat.
2. Choose a shutter speed of 4 seconds to start out.
3. To ensure near maximum image quality ISO200 is selected.
The image is taken at f/2.8, 4 s., and ISO 200 with the following result:
I'm satisfied with the image brightness but want to reduce the shutter speed ensuring
that the fisherman is not blurry due to motion blur.
START HERE | LEARN PHOTOGRAPHY | VIEW PHOTOS | WORKSHOPS & TOURS

www.DaveMorrowPhotography.com Page 78
My goal is to use a 1/4th-second shutter speed, freezing the fisherman in
place, without motion blur.
To reduce the shutter speed while maintaining the same image brightness, I must open
the aperture diameter (decrease f-stop) or increase the ISO.
I can't decrease or change the f-stop, it's at the minimum of f/2.8, producing the widest
aperture diameter possible.
I have to increase the ISO.
Here's How It Works (Reference the Chart):
To maintain the same image brightness, a 1 stop increase in ISO requires a 1 stop
decrease in shutter speed.
● ISO 200 = 4 second shutter speed = Current settings
● ISO 400 = 2 second shutter speed
● ISO 800 = 1 second shutter speed
● ISO 1600 = 1/2 second shutter speed.
● ISO 3200 = 1/4 second shutter speed.
The new settings are, f/2.8, ISO 3200, and 1/4 s. Here are the results.
START HERE | LEARN PHOTOGRAPHY | VIEW PHOTOS | WORKSHOPS & TOURS

www.DaveMorrowPhotography.com Page 79
The image still maintains the same overall brightness which is what I wanted.
The fisherman is no longer blurry. The 1/4 second shutter speed ensures no motion blur
for this specific image.
Since the ISO was increased to 3200 this image will contain much more noise than the
first.
A blurry photo is useless, but a noisy photo can be fixed with Noise Reduction
Techniques.
Requirement 2: Increase Image Brightness
Shooting Situation: Required to increase image brightness while maintaining
constant f-stop and/or shutter speed.
START HERE | LEARN PHOTOGRAPHY | VIEW PHOTOS | WORKSHOPS & TOURS

www.DaveMorrowPhotography.com Page 80
I'm out taking photos at Mount Rainier National Park, at night, under moonlight.
Here is my thought process:
1. Keeping the shutter speed low, and aperture diameter wide, the most amount of
light enters my lens, without producing star trails. In short, I have to maintain
f/2.8 and 25-second shutter speed to get the shot I want, at night, without star
trails for a 14mm focal length.
2. The ISO is kept low attempting to produce the least amount of noise possible.
I take my first exposure at f/2.8, 25 s., & ISO400.
This first image was much too dark as seen below:
Confined by f-stop and shutter speed, as noted above, the only way to increase the
overall image brightness is increasing ISO.
START HERE | LEARN PHOTOGRAPHY | VIEW PHOTOS | WORKSHOPS & TOURS

www.DaveMorrowPhotography.com Page 81
I think to myself, "If this image captured 4 times as much light it would be perfect.".
I know that an increase in 2 stops, from ISO 400 to ISO 1600, will produce an image
with 4X light information amplification, given f-stop and shutter speed remain constant.
This produces the same result as 4X more light information with a slight increase of
image noise.
Here's How It Works (Reference the Chart):
● ISO 400 = Current Image Brightness
● ISO800 = 1 Stop Increase = 2X light information amplification.
● ISO1600 = 2 Stop Increase = 4X light information amplification.
I select my new settings, f/2.8, 25 s. & ISO1600.
The image noise slightly increases, but now I have the correct exposure as seen below.
START HERE | LEARN PHOTOGRAPHY | VIEW PHOTOS | WORKSHOPS & TOURS
www.DaveMorrowPhotography.com Page 82
Due to my knowledge of stops I didn't have to guess and take multiple exposures at
ISO400, ISO600, ISO800 and so on to determine the perfect exposure.
Knowing the final desired outcome prior to shooting it was easy to select the correct
settings for this image.
Always determine the desired final outcome prior to selecting any new
camera setting.
Requirement 3: Increase F-Stop Value & Depth of Field
Shooting Situation: Used to increase the depth of field (focus range) while
maintaining overall image brightness and/or shutter speed.
At times it's required to increase the depth of field (focus range) while maintaining the
same shutter speed and/or image brightness.
For example, in the shot below, I wanted to capture the nice wave movement in the
foreground while extending the depth of field to focus the entire landscape.
The first image was exposed at f/5.6, 1 second, ISO100 with the following result:
START HERE | LEARN PHOTOGRAPHY | VIEW PHOTOS | WORKSHOPS & TOURS

www.DaveMorrowPhotography.com Page 83
The foreground is in focus but the distant background is out of focus.
This is due to the wide aperture diameter and shallow depth of field produced by f/5.6.
My goal is to have the entire landscape in focus, with the same dynamic wave movement
produced by the 1-second shutter speed.
To do so I must increase the f-stop value thus increasing the depth of field.
My goal is to increase the f-stop, from f/5.6 to f/11, while maintaining the same shutter
speed of 1 second.
Referencing the Photography Exposure Triangle Chart above, I know that increasing my
f-stop from f/5.6 to f/11 is a 2 stop decrease in light.
To balance out the exposure triangle while maintaining the same shutter speed I need to
increase my ISO by 2 stops.
START HERE | LEARN PHOTOGRAPHY | VIEW PHOTOS | WORKSHOPS & TOURS

www.DaveMorrowPhotography.com Page 84
Here's How It Works (Reference the Chart):
● ISO 100 = f/5.6 @ 1 second = Current Settings
● ISO200=f/8 @ 1 second
● ISO400 = f/11 @ 1 second = Desired Settings
My final settings are f/11, 1 second, ISO400. here is the image produced.
This image is exactly what I was looking to produce. The foreground and background
are all in focus due to a larger f-stop of f/11 producing an extended depth of field.
The overall image brightness & shutter speed are still the same, producing the same
wave motion as above.
START HERE | LEARN PHOTOGRAPHY | VIEW PHOTOS | WORKSHOPS & TOURS

www.DaveMorrowPhotography.com Page 85
How ISO Works - Technical Details
Prior to reading the following section, it's required to learn How Pixels Work, in the
Camera Sensor Size & Image Quality Photo Guide. For best results, read the entire
guide!
The signal or light information produced by each pixel determines the pixels brightness,
also known as value, on a scale of black to white.
The scale of black to white, known as the tonal range or tonal scale, is seen on the
graphic below:
The more light information a pixel collects from the scene, the larger the
signal it produces.
● The larger the signal a pixel produces the brighter it’s tonal value on the scale of
black to white.
● A white pixel is produced by the maximum signal.
● A black pixel is produced by the minimum signal.
● All signals between maximum and minimum produce greyscale tonal values.
Pixels can also be called pixel wells. They are wells for collecting light information
produced by the scene being photographed.
START HERE | LEARN PHOTOGRAPHY | VIEW PHOTOS | WORKSHOPS & TOURS

www.DaveMorrowPhotography.com Page 86
The following graphic shows 4 different pixel wells, each producing a different signal
(signal produced), thus a different corresponding tonal value, found within the tonal
range of black to white.
Reference the graphic while reading the following section.
The following graphic is not meant to show exact values or ratios, only
concepts.
ISO & Signal Graphic
START HERE | LEARN PHOTOGRAPHY | VIEW PHOTOS | WORKSHOPS & TOURS

www.DaveMorrowPhotography.com Page 87
Technical Shooting Example
(Reference the Graphic Above During this Section)
I’m going to use the same graphics as used in the camera sensor size guide making
things easier to understand.
The first picture below shows the entire scene being photographed as it actually looks
through the photographer’s eyes.
Imagine this is what you're seeing through your camera viewfinder. This is how the
scene actually looks to the eye.
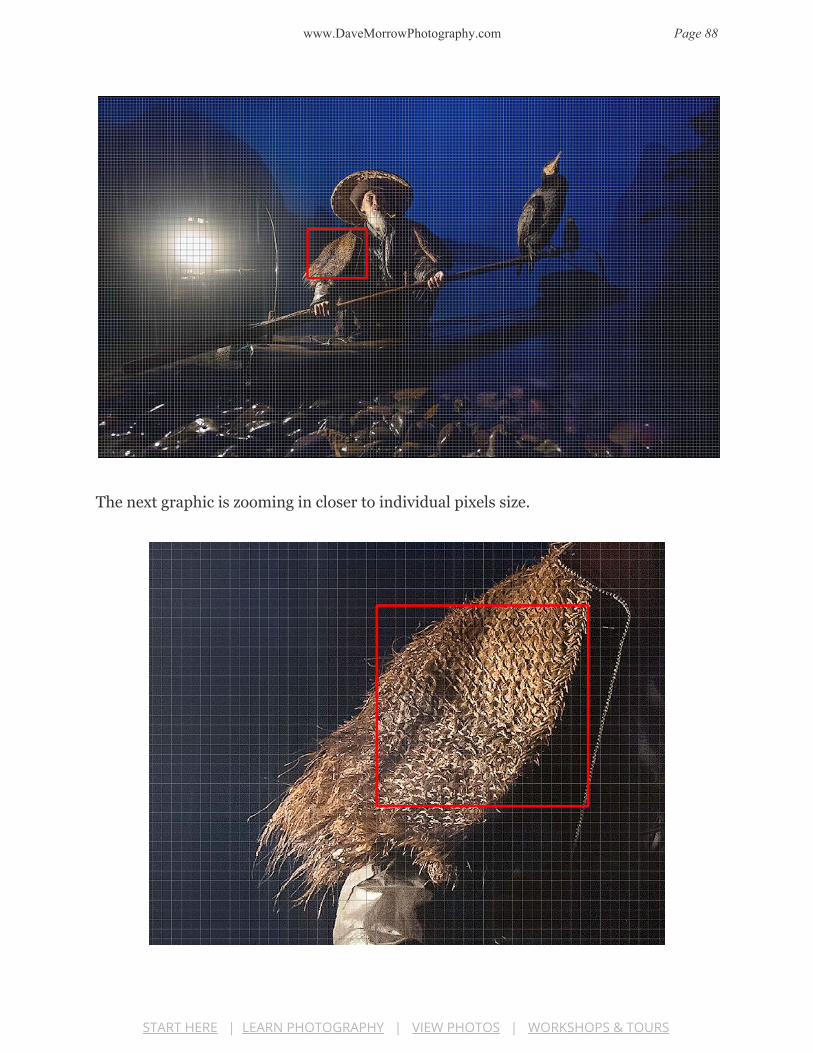
The photo was taken during early twilight, in the pouring rain, on the Li River in China.
There is hardly any light in the scene.
Now imagine the scene has been divided up into individual pixels.
START HERE | LEARN PHOTOGRAPHY | VIEW PHOTOS | WORKSHOPS & TOURS
www.DaveMorrowPhotography.com Page 88
The next graphic is zooming in closer to individual pixels size.
START HERE | LEARN PHOTOGRAPHY | VIEW PHOTOS | WORKSHOPS & TOURS
www.DaveMorrowPhotography.com Page 89
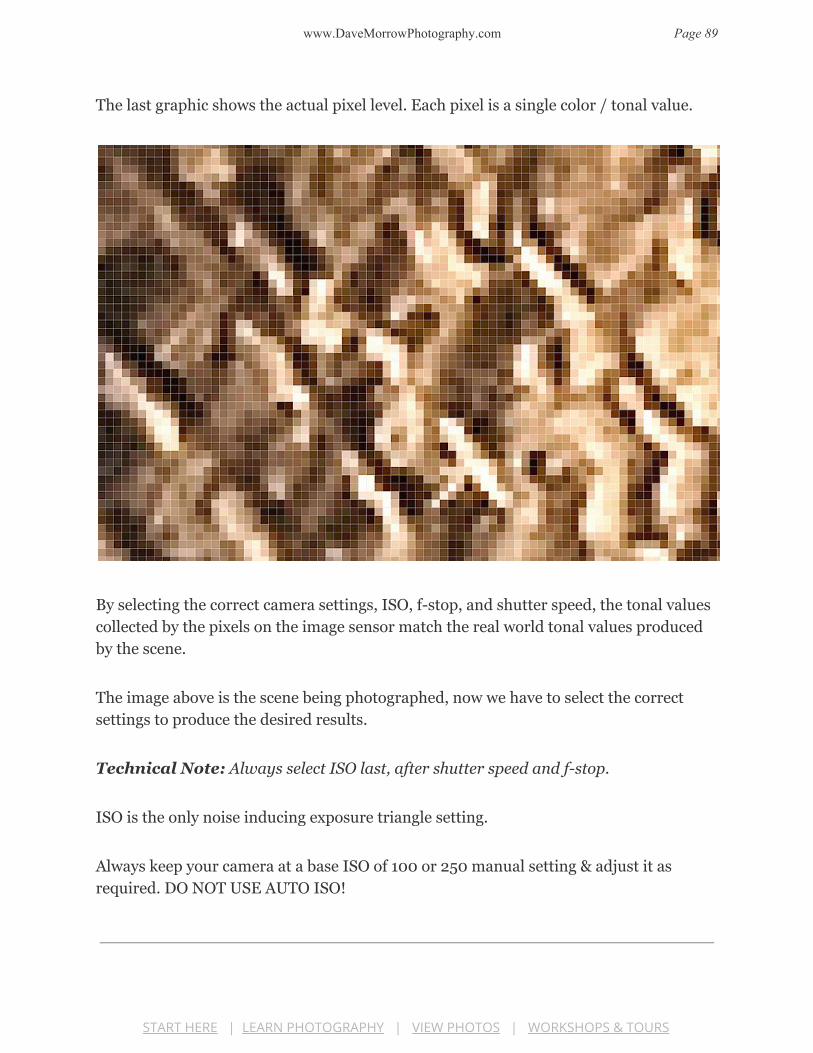
The last graphic shows the actual pixel level. Each pixel is a single color / tonal value.
By selecting the correct camera settings, ISO, f-stop, and shutter speed, the tonal values
collected by the pixels on the image sensor match the real world tonal values produced
by the scene.
The image above is the scene being photographed, now we have to select the correct
settings to produce the desired results.
Technical Note: Always select ISO last, after shutter speed and f-stop.
ISO is the only noise inducing exposure triangle setting.
Always keep your camera at a base ISO of 100 or 250 manual setting & adjust it as
required. DO NOT USE AUTO ISO!
START HERE | LEARN PHOTOGRAPHY | VIEW PHOTOS | WORKSHOPS & TOURS

www.DaveMorrowPhotography.com Page 90
Step 1: Determine the F-Stop
Get in a habit of leaving your ISO at the base of ISO100 or ISO250 to start out with. We
will select & fine tune the ISO later on.
Since there isn't much light in this scene I want to open the aperture diameter to the
maximum value while ensuring the fisherman and his boat, over the entire depth of
field, stays in focus.
If the aperture is too wide then part of the fisherman or his boat may be out of focus.
An f-stop value of f/2.8 is selected.
This allows the maximum amount of light to hit the camera sensor while maintaining a
sharp focus on the fisherman, over the entire depth of field.
This scene has a very small focus range, so f/2.8 is acceptable.
Step 2: Determine the Shutter Speed
If the shutter speed is too long then the moving fisherman on this boat will be out of
focus due to motion blur. If the image is out of focus, then it's worthless!
A shutter speed of 1/6th of a second was selected. Any slower and the fisherman
is blurry. Any faster and we lose out on some of the light in the scene.
Step 3: Fine Tune ISO Settings
Always increase or decrease ISO as the very last step.
For the scene above I start out with the following settings:
f/2.8, 1/6th s, ISO100.
START HERE | LEARN PHOTOGRAPHY | VIEW PHOTOS | WORKSHOPS & TOURS

www.DaveMorrowPhotography.com Page 91
Taking my first exposure of the scene, the following image is produced.
The first graphic is the full scene. The second is the pixel level.
Notice how the image is much too dark & doesn't match the scene we actually see in the
viewfinder above?
The entire image & the pixels are much darker in the image than they are in the actual
scene.
This image represents the ISO & Signal Graphic, Base ISO Column.
START HERE | LEARN PHOTOGRAPHY | VIEW PHOTOS | WORKSHOPS & TOURS

www.DaveMorrowPhotography.com Page 92
Looking at the noted graphic you'll see that the Signal Produced by the settings we
used didn't match the Required Signal for the scene. The image is underexposed.
The tonal values produced by the Signal Produced are much darker than the tonal
values produced by the Required Signal for the scene.
The Next Shot...
Since the image was much too dark, I decided to increase my ISO to 3200.
All other settings remain constant.
Remember, they are held constant by the shooting situation from step 1 & 2!
I take another image at f/2.8, 1/6th s, ISO3200 & here are the results.
START HERE | LEARN PHOTOGRAPHY | VIEW PHOTOS | WORKSHOPS & TOURS

www.DaveMorrowPhotography.com Page 93
This picture is denoted by the ISO & Signal Graphic, High ISO Column.
START HERE | LEARN PHOTOGRAPHY | VIEW PHOTOS | WORKSHOPS & TOURS

www.DaveMorrowPhotography.com Page 94
Using ISO, I was able to amplify the Signal Produced by each pixel, in turn creating a
brighter image that matched the actual scene Required Signal.
Signal Produced = Required Signal = Correct Exposure
By increasing ISO the pixel tonal values now match the tonal values required by the
scene.
This was done without having to capture more scene light information using shutter
speed or f-stop.
There wasn’t enough light in the scene for this specific shooting situation.
ISO was used to amplify the signal, matching the Signal Produced to the Signal
Required, as seen in the High ISO Column of the Graphic.
The image above matches the actual brightness of the scene, at the cost of noise!
In this case, the cost was worth it. The image could not have been captured otherwise.
Test Your Camera - ISO Performance
Knowing the maximum ISO your camera can handle is an essential piece of information.
● In the worst case scenarios, it’s better to increase your ISO & capture a sharp
image with slight noise, than to keep your ISO low & have a blurry image without
noise.
● It’s possible to fix high ISO noise with noise reduction software. It’s impossible to
fix a blurry image.
● Out of focus images are NEVER useable where high ISO images many times are.
Knowing the maximum ISO your camera can handle, while providing acceptable image
quality, will allow you to easily increase your ISO while shooting, without worry.
START HERE | LEARN PHOTOGRAPHY | VIEW PHOTOS | WORKSHOPS & TOURS
www.DaveMorrowPhotography.com Page 95
Here are the steps to find your maximum ISO value:
1. Setup your camera during the day.
2. Pick a random composition.
3. Focus your composition.
4. Take 1 image at your base ISO setting. This varies camera by camera.
5. Take another image at ISO200
6. Take Another Image at ISO400
7. Continue to increase the ISO by 1 stop intervals taking pictures at each.
8. Repeat with 10 or more images until you reach your maximum ISO setting.
9. Load all images into Lightroom or Camera RAW.
10. Compare images at 100% zoom / resolution.
11. Determine the highest ISO which you deem acceptable and remember this value.
12. For all images after the value apply noise reduction. 13. Determine the highest ISO setting which provides acceptable image quality, with
noise reduction applied.
Now you know the maximum ISO, which can be used in the field, without having to
sacrifice image quality.
You also know the maximum worst case ISO, which you can recover using noise
reduction software.
You also know the minimum ISO which your camera provides.
ISO, Noise & Dynamic Range
● As ISO increases the dynamic range of the image decreases.
● As the ISO increases the noise shown in the picture also increases.
The amount of dynamic range decrease and the noise increase, due to ISO, directly
depends on your camera sensor model.
For the technical details of Dynamic Range & Image Noise Vs. ISO, reference the
following sections of my Camera Sensor Size & Image Quality Photography Guide.
START HERE | LEARN PHOTOGRAPHY | VIEW PHOTOS | WORKSHOPS & TOURS

www.DaveMorrowPhotography.com Page 96
● Picture Noise & Sensor Size
● Dynamic Range, ISO & Sensor Size
START HERE | LEARN PHOTOGRAPHY | VIEW PHOTOS | WORKSHOPS & TOURS

www.DaveMorrowPhotography.com Page 97
EXPOSURE TRIANGLE GUIDE The exposure triangle is an essential
tool for selecting the correct
combination of camera settings,
consisting of shutter speed, f-stop
(controls aperture), and ISO, for any
shooting situation.
Shutter Speed, F-Stop & ISO each
represent a point on the exposure
triangle.
Each noted setting also controls image
brightness & visual image attributes
such as motion blur, depth of field, &
image noise.
Below, you'll learn step by step methods for selecting the correct camera settings, for
any shooting scenario, mastering the exposure triangle.
Exposure Triangle Camera Technique Videos
The following videos teach my shooting workflow for selecting the correct exposure, shutter speed, f-stop, ISO, and histogram.
They were created to supplement the writing contained, below, on this page.
CLICK HERE & WATCH THE VIDEOS
START HERE | LEARN PHOTOGRAPHY | VIEW PHOTOS | WORKSHOPS & TOURS

www.DaveMorrowPhotography.com Page 98
The 4 Factors Controlling the Exposure Triangle
This page requires a prior understanding of each setting, f-stop (controls aperture), shutter speed, & ISO, used to control the exposure triangle.
Every photograph is controlled by 4 specific factors, each as important as the next.
The photography exposure triangle provides a methodical, step by step logic. This allows
the photographer to evaluate each of the 4 factors, for any shooting scenario, thus
determining the correct camera settings, producing the optimal image.
The 4 factors are as follows:
1. Scene Luminance (Light Intensity): The amount of light available in the
scene being photographed. Luminance is an absolute value measured in candela
per square meter (cd/m^2). For example, sunny bright days have high scene
luminance and dark scenes like twilight have low scene luminance.
○ Luminance is the only factor the outdoor photographer can’t control. The
remaining three are controlled via the following camera settings:
2. F-Stop: Controls aperture diameter, thus the amount of light passing through
the lens which is then collected by the camera sensor. 3. Shutter Speed: Determines the amount of time the camera sensor is exposed
to light from the scene.
4. ISO: ISO determines the in-camera amplification of light information (signal)
produced by a specific scene luminance, f-stop, and shutter speed.
○ ISO DOES NOT change the sensitivity of the image sensor, EVER.
START HERE | LEARN PHOTOGRAPHY | VIEW PHOTOS | WORKSHOPS & TOURS

www.DaveMorrowPhotography.com Page 99
The 2 Requirements of Successful Photographs
Every successful photograph has 2 fundamental requirements, each dependent of the 4
factors above.
These two requirements provide a "road map" allowing you to create beautiful images
and improve your photography on a consistent basis.
Requirement 1: Exposure / Image Brightness
This is a physical requirement that ensures a picture displays the correct color &
lighting.
Using the correct camera settings, a combination of shutter speed, f-stop, & ISO, the
brightness of the image produced will match that of the scene being photographed,
creating the optimal exposure.
The incorrect camera settings produce underexposure or overexposure, which are simply defined as follows, and technically defined further down the page:
● A photograph is underexposed when it's darker than the scene being
photographed.
● A photograph is overexposed when it's brighter than the scene being
photographed.
Example Images - Under & Overexposed
Technical Note: All pictures on this page are unedited RAW image files compressed
to JPEG format for online viewing. Always use RAW image format for the highest
image quality.
START HERE | LEARN PHOTOGRAPHY | VIEW PHOTOS | WORKSHOPS & TOURS
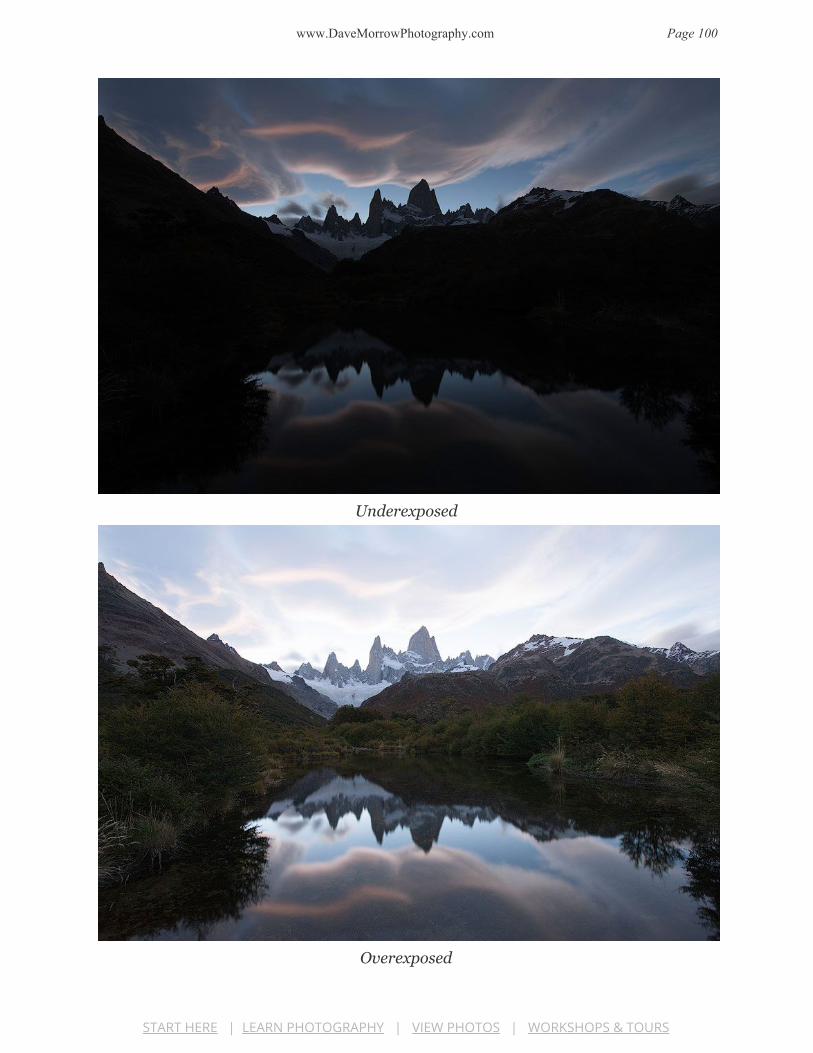
www.DaveMorrowPhotography.com Page 100
Underexposed
Overexposed
START HERE | LEARN PHOTOGRAPHY | VIEW PHOTOS | WORKSHOPS & TOURS

www.DaveMorrowPhotography.com Page 101
The following image shows the correct exposure for the scene, capturing the maximum
amount of highlight & shadow detail in a single exposure.
Twilight in the Andes Mountain Range - Patagonia, Chile
Using a RAW image processor, such as Lightroom or Camera RAW, the dark details can
be recovered from this exposure, matching it to the actual scene.
If the incorrect exposure triangle settings are selected, the RAW file will collect incorrect
color & tonal information about the scene.
Below, you'll learn to select the correct exposure triangle settings producing the optimal
exposure for any scene.
Requirement 2: Visual Image Attributes
This is a creative requirement that allows the photographer to produce the desired
mood, feeling, or visual image attribute within a photograph.
Prior to taking every picture, the photographer has a mental image of the pictures final
outcome. The mental image may consist of one or many image attributes.
START HERE | LEARN PHOTOGRAPHY | VIEW PHOTOS | WORKSHOPS & TOURS

www.DaveMorrowPhotography.com Page 102
An image attribute is a specific visual effect obtained from varying camera settings
such as f-stop, ISO & shutter speed.
After learning the image attributes (shown below) produced by each setting, the
photographer starts to visualize what a photograph of a scene could look like,
instead of seeing what's actually there in the present moment.
The photographer's goal is turning the creative mental picture, containing their desired
image attributes, into a digital photograph that matches.
Shutter Speed Image Attributes
Shutter speed controls the amount of motion blur produced by moving objects within a
composition.
● Longer shutter speeds produce more motion blur.
● Shorter shutter speeds produce less motion blur.
Reference the Shutter Speed Photography Guide for complete details & discussion.
START HERE | LEARN PHOTOGRAPHY | VIEW PHOTOS | WORKSHOPS & TOURS

www.DaveMorrowPhotography.com Page 103
1/30th Second Shutter Speed
5 Second Shutter Speed
ISO Image Attributes
Zooming in and magnifying the example above (shown below) it's possible to see the
effects of low ISO vs. high ISO on image quality.
The image with less motion blur was photographed at a high ISO value of 1600. The
image with more motion blur was photographed at a low ISO value of 100.
The ISO1600 image is very noisy. The colors and details become distorted by the
image noise, significantly reducing color quality, detail, and sharpness.
The ISO100 image contains sharp detail and vivid color with no noise.
● Increasing ISO increases image noise & decreases image quality.
● Decreasing ISO decreases image noise & increases image quality.
Reference the ISO Photography Guide for complete details & discussion.
START HERE | LEARN PHOTOGRAPHY | VIEW PHOTOS | WORKSHOPS & TOURS

www.DaveMorrowPhotography.com Page 104
High ISO, Increased Noise
Low ISO, No Noise
START HERE | LEARN PHOTOGRAPHY | VIEW PHOTOS | WORKSHOPS & TOURS
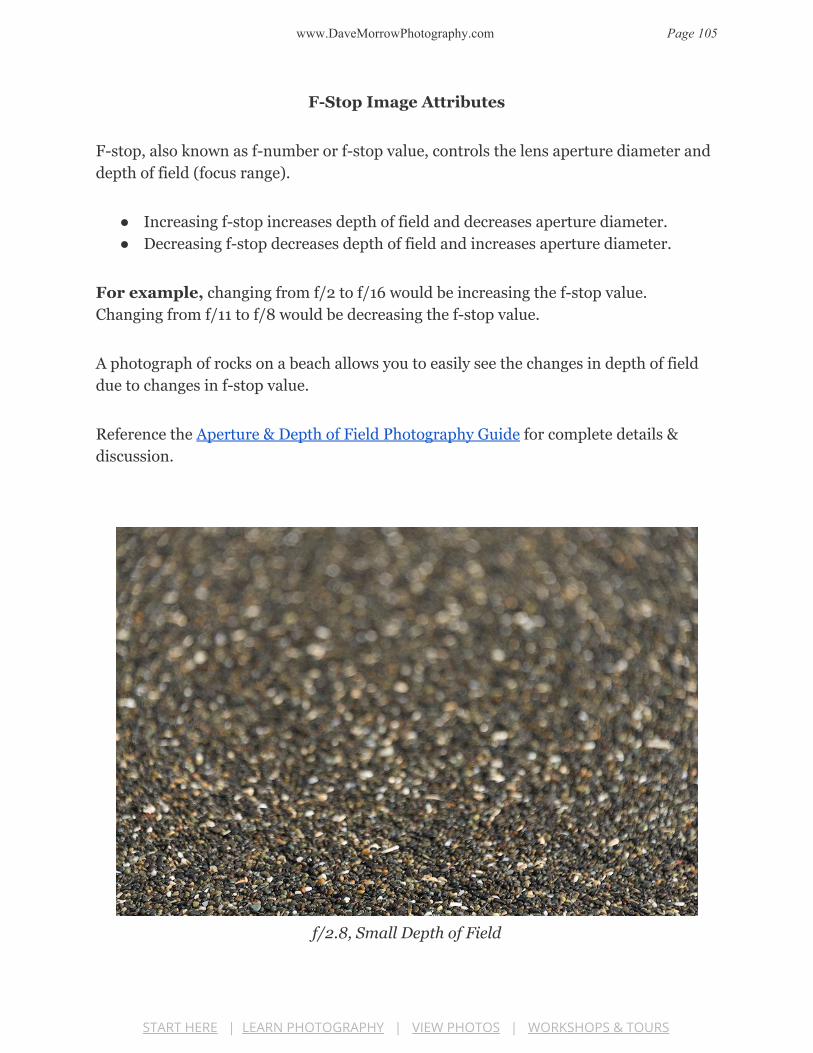
www.DaveMorrowPhotography.com Page 105
F-Stop Image Attributes
F-stop, also known as f-number or f-stop value, controls the lens aperture diameter and
depth of field (focus range).
● Increasing f-stop increases depth of field and decreases aperture diameter.
● Decreasing f-stop decreases depth of field and increases aperture diameter.
For example, changing from f/2 to f/16 would be increasing the f-stop value.
Changing from f/11 to f/8 would be decreasing the f-stop value.
A photograph of rocks on a beach allows you to easily see the changes in depth of field
due to changes in f-stop value.
Reference the Aperture & Depth of Field Photography Guide for complete details &
discussion.
f/2.8, Small Depth of Field
START HERE | LEARN PHOTOGRAPHY | VIEW PHOTOS | WORKSHOPS & TOURS

www.DaveMorrowPhotography.com Page 106
f/16, Large Depth of Field
Section Review
Each photograph is controlled by 4 specific factors, scene luminance, f-stop,
shutter speed, and ISO.
Nature controls scene luminance and the photographer controls f-stop, shutter speed &
ISO.
Each successful photograph has 2 requirements each dependent of the 4 factors
above.
● The first requirement determines the exposure or image brightness.
● The second requirement determines the photographer's desired image attributes
which specify the final outcome of the digital image.
Each of these basics provides a foundation for learning the photography exposure
triangle, as discussed in the following sections.
START HERE | LEARN PHOTOGRAPHY | VIEW PHOTOS | WORKSHOPS & TOURS

www.DaveMorrowPhotography.com Page 107
Exposure Stops - Shutter Speed, F-Stop & ISO
This topic is covered thoroughly for each setting, F-Stop, Shutter Speed and ISO in their
respective in-depth guides, linked at the top of this page.
We will quickly review it in this section. You should already have a good idea of how
exposure stops work, prior to moving on.
Click & download the exposure triangle PDF for reference during the following sections.
Chart Disclaimer: The chart is used to compare changes in individual camera
settings to the correlating change in light, measured in stops or Relative Exposure
Value (+/-EV).
The chart does not compare one specific camera setting to another. The fact that
specific settings line up is arbitrary.
An exposure stop or stop for short, provides a universal scale to measure the increase
and decrease in light, exposed to the image sensor, due to changes in shutter speed &
f-stop.
For ISO, exposure stops provide the increase or decrease in signal (light information)
amplification, thus how much light is required to produce the optimal exposure.
Overall, stops provide an easy way for the photographer to increase or decrease image
brightness or adjust f-stop, ISO, and shutter speed settings, controlling specific image
attributes.
Quick Reference F-Stop & Shutter Speed:
● An increase of 1 stop for f-stop or shutter speed doubles the amount of light
exposed to the image sensor, providing a brighter exposure.
START HERE | LEARN PHOTOGRAPHY | VIEW PHOTOS | WORKSHOPS & TOURS

www.DaveMorrowPhotography.com Page 108
● A decrease of 1 stop reduces the amount of light information collected by half,
providing a darker exposure.
Quick Reference ISO Settings:
● An increase or decrease of 1 stop in ISO does not affect the amount of light
exposed to the image sensor.
● 1 stop increase in ISO amplifies the signal by 2, increasing image noise and
brightness.
● 1 stop decrease cuts the amplification in half, decreasing image noise and
brightness.
Exposure Value (EV) Basics
Digital cameras have a built in "reflected light meter" which approximates the scene
luminance produced by a given composition.
This is the camera's way of "knowing" how much light is coming from a specific scene.
For example, are you photographing a bright sunny day or stars during twilight?
This process is known as metering and can also be called, camera metering or exposure
metering.
Metering does not depend on the current camera settings of f-stop, ISO, and shutter
speed. Metering only depends on the amount of light in a given scene/composition.
● Camera meters make educated guesses at scene luminance using sensors and
algorithms.
● These approximations are not perfect.
START HERE | LEARN PHOTOGRAPHY | VIEW PHOTOS | WORKSHOPS & TOURS

www.DaveMorrowPhotography.com Page 109
● It's the photographer's job to correct for any small errors in the approximations,
as taught below.
Let's call the camera metered amount of scene luminance, for a given composition,
Scene Light Value (Scene LV).
Scene Light Value approximates the scene luminance for a given composition and
assigns it a number, depending on the how much light is present.
The larger the Scene LV the brighter the scene being metered.
Reference - Common Scene Light Values for Landscapes
These values are just approximations for a frame of reference. In most situations, they
prove to be very accurate.
In the following section, you'll learn to integrate them with real world shooting
scenarios.
The scenes below start with the highest scene luminance (brightest) and end with the
lowest (darkest).
Bright Sunny Day, Direct Sunlight: 16
Clear Blue Sky: 15
Just Before Sunset: 12 to 14
Sunset: 11-13
Just After Sunset: 8 to 11
Twilight: 2 to 8
Moon lit landscapes (Dependent of Moon Phase): -2 to 5
START HERE | LEARN PHOTOGRAPHY | VIEW PHOTOS | WORKSHOPS & TOURS

www.DaveMorrowPhotography.com Page 110
Aurora / Northern Lights: -6 to -3
Milky Way & Night Sky: -11 to -7
Now that the camera has metered the scene and determined it's brightness, we will
select the correct camera settings to match, producing the optimal exposure.
Absolute Exposure Value
Absolute Exposure Value (EV) is a rating system which allows the photographer to
compare the "light capturing potential" of one combination of f-stop and shutter speed
compared to another, at ISO100.
Absolute Exposure Value is calculated using the following equation.
This is all calculated automatically by your camera.
To understand exposure and select the correct settings, you need to understand how it
works! I've also provided a chart below for quick reference.
EV = log2 ((f-stop value^2) / shutter speed)
Technical Note: log2 denotes log base 2. Numerical results are rounded to the closest
stop.
Example Calculations & Discussion
Our goal is to select the correct camera settings, producing an EV that matches the scene
light value above, for the scene we are currently photographing.
● Matching the Absolute Exposure Value to the Common Scene Light Values for
Landscapes above, the photographer can easily determine if these specific
settings will produce the correct exposure, for the current amount of scene
lighting.
START HERE | LEARN PHOTOGRAPHY | VIEW PHOTOS | WORKSHOPS & TOURS

www.DaveMorrowPhotography.com Page 111
● EV does not determine if specific settings produce the photographer's desired
Visual Image Attributes. It's only a quick reference for the amount of light
specific settings can "collect" from a scene.
Remember, this is all done automatically by your camera.
Referencing the Common Scene Light Values for Landscapes, above:
Settings: f/8, 1 second, ISO100
EV = Log2((8^2)/1) = 6.
This EV falls in the range of 2-8. This combination of settings would probably produce
the correct exposure for early twilight, as noted in, Reference - Common Scene Light
Values for Landscapes, above.
Settings: f/5.6, 2 second, ISO100
EV = Log2((5.6^2)/2) = 4.
This EV also falls in the range of 2-8. Compared to the setting above, this EV is less, so it
would produce the optimal exposure during a darker part of twilight.
Settings: f/1, 20 second, ISO100
EV = Log2((1^2)/20) = -4.
This EV falls in the range of -6 to -3. It would probably produce the correct exposure for
Aurora / Northern Lights Photography.
Absolute Exposure Value Chart
START HERE | LEARN PHOTOGRAPHY | VIEW PHOTOS | WORKSHOPS & TOURS

www.DaveMorrowPhotography.com Page 112
EV for specific f-stop and shutter speed can also be found on the chart below, modeled
by the equations above. Don't worry about the green lines. They are not needed.
Attribution: Wikipedia
Settings Light Value
Absolute Exposure Value assumes ISO100 only.
Since we often use ISO settings above or below 100, the camera needs a way to factor
this into the equation.
The total value produced from the combination of shutter speed, f-stop, and ISO, is
calculated by your camera automatically.
We will call this camera calculated value, Settings Light Value (Settings LV).
● Settings Light Value combines ISO with Absolute Exposure Value, making it easy
to determine the correct settings for any scene luminance & shooting situation.
● The smaller the Settings Light Value the less scene luminance is required to
produce the optimal exposure. Reference the Common Light Values for
Landscapes section above.
START HERE | LEARN PHOTOGRAPHY | VIEW PHOTOS | WORKSHOPS & TOURS

www.DaveMorrowPhotography.com Page 113
For ISO 100 and greater,
Settings Light Value = EV - log2 (ISO / 100)
For ISO less than 100,
Settings Light Value = EV + log2 (ISO / 100)
Technical Note: At ISO 100, log2(100/100) =0, thus at ISO100, Settings LV = EV.
This is why ISO 100 does not have an effect on the Absolute Exposure Value.
Let's look at some examples of varying camera settings and the Settings Light Value they
produce.
Shooting Examples - Settings Light Value
The following examples compare different settings & images, A, B, C, D, using the
techniques taught above.
Settings A: f/5.6, 2 seconds, ISO100
Settings Light Value A = Log2((5.6^2)/2) - log2 (100/100) = 4. Referencing the
Common Scene Light Values for Landscapes, above, 4 falls into the darker part of
twilight.
The image produced is shown below, photographed in the Mount Baker Wilderness of
Washington State.
START HERE | LEARN PHOTOGRAPHY | VIEW PHOTOS | WORKSHOPS & TOURS

www.DaveMorrowPhotography.com Page 114
The next image was taken seconds after the one above, with different settings.
Settings B: f/8, 1 s. ISO800.
Settings Light Value B = Log2((8^2)/1) - log2 (800/100) = 3.
START HERE | LEARN PHOTOGRAPHY | VIEW PHOTOS | WORKSHOPS & TOURS

www.DaveMorrowPhotography.com Page 115
The difference between the Settings LV A and Settings LV B is 1 exposure stop (4-3=1).
Since B is smaller than A by 1 exposure stop, the settings from B can produce an image
that is 1 exposure stop brighter than A, for fixed scene luminance.
The smaller the Settings LV the more "light capturing" potential these settings contain.
Referencing the Exposure Triangle Chart and settings above, the following logical
progression is performed.
Moving from Settings A to Settings B:
● f/5.6 to f/8 is 1 stop down.
● 2 seconds to 1 second is 1 stop down.
● ISO100 to ISO800 is 3 stops up.
1 stop down, plus 1 stop down, plus 3 stops up, is a 1 stop up increase from A to B, in
turn producing a final image B, that is 1 exposure stop brighter than image A.
START HERE | LEARN PHOTOGRAPHY | VIEW PHOTOS | WORKSHOPS & TOURS

www.DaveMorrowPhotography.com Page 116
Let's look at 2 more examples...
Settings C: f/2.8, 15s, ISO1600
Settings Light Value C = Log2((2.8^2)/15) - log2 (1600/100) = -5.
Referencing the Common Scene Light Values for Landscapes above, the Milky Way is
rated at -7 to -11, which means our current settings will probably produce an image that
is slightly underexposed, by 2 to 6 stops.
The following image is produced, the reflection of the Milky Way in an alpine lake.
Photographed in Oregon's Cascade Range. It's slightly underexposed.
The next image was taken seconds after the one above, with different settings.
START HERE | LEARN PHOTOGRAPHY | VIEW PHOTOS | WORKSHOPS & TOURS

www.DaveMorrowPhotography.com Page 117
The settings were changed to fall within the Scene Light Value range for Milky Way
Photography, -7 to -11.
Settings D: f/2.8, 30 s. ISO3200.
Settings Light Value D = Log2((2.8^2)/30) - log2 (3200/100) = -7.
This is the correct exposure of the scene which also falls within the Scene Light Value
range for Milky Way Photography.
The difference between the Settings LV C and Settings LV D is 2, from -5 to -7.
Since Settings LV D is smaller than C by 2 exposure stops, the settings from D can
produce an image that is 2 exposure stops brighter than C, for a fixed scene luminance.
The smaller the Settings Light Value, the more potential the settings have to create a
brighter exposure for a fixed scene luminance.
START HERE | LEARN PHOTOGRAPHY | VIEW PHOTOS | WORKSHOPS & TOURS
www.DaveMorrowPhotography.com Page 118
Referencing the Exposure Triangle Chart and settings above, the following logical
progression is performed.
Moving From Settings C to Settings D:
● f/2.8 to f/2.8 is a 0 stop change.
● 15 seconds to 30seconds is 1 stop up.
● ISO1600 to ISO3200 is 1 stop up.
A 0 stop change, plus 1 stop up, plus 1 stop up, is a 2 stop increase from C to D. That tells
us that image D is 2 exposure stops brighter than image C.
Now, let's see how this actually applies while taking photos.
Histograms, Tones, & Luminosity There are three important types of histograms which every photographer needs to understand.
● RGB Histogram. ● Specific Color Channels Histograms, Red, Green & Blue. ● Luminosity Histogram.
Your camera displays an RGB histogram, with higher end models displaying the specific, Red, Green and Blue Channels as well.
Lightroom & Adobe Camera RAW also display RGB histograms and individual color channels.
Photoshop has the ability to display RGB, specific color channels & luminosity histograms.
START HERE | LEARN PHOTOGRAPHY | VIEW PHOTOS | WORKSHOPS & TOURS

www.DaveMorrowPhotography.com Page 119
This video explains in more detail. I would recommend watching it, along with the histogram video at the top of the page, prior to moving forward.
Click Here & Watch the Video
Luminosity Histograms Basics
I use the luminosity histogram, more than any other histogram, while editing photos.
The luminosity histogram (read this as supplemental information), shown by the grey area under the curve in the image above, denotes the number of pixels that exist for each tonal value within the image.
START HERE | LEARN PHOTOGRAPHY | VIEW PHOTOS | WORKSHOPS & TOURS

www.DaveMorrowPhotography.com Page 120
Technical Note: Many photographers and computer programs call this a luminance histogram. This is incorrect.
All color pixels within an image have a corresponding greyscale tonal value. This tonal value denotes how our eyes perceive the specific colors brightness, on a scale from black to white.
● Lightness, also known as luminosity, is the perceived brightness of an object when compared to another 100% white object, both illuminated by the same light source.
● Lightness is the human eyes perception of brightness, without color information, on a scale from black to white.
● The lightness or luminosity scale, ranging from black to white, is known as the tonal range or tonal scale.
Looking at the histogram’s horizontal/x-axis, purely black pixels are represented on the far left, and purely white pixels are represented on the far right. 50% grey pixels are represented in the direct center. 50% grey consists of half black and half white.
All pixels that fall between black and white are represented by greyscale tonal values.
Technical Note: There is often confusion between 18% grey & 50% grey. 50% grey has an 18% reflectance in visible light. The correct term is 50% grey.
The vertical or y-axis, shows the number of pixels, within the image, that exist for each of the specific tonal values, ranging from black to white.
When more pixels exist within the image, for each tonal value on the x-axis, the taller the histogram becomes in that area on the y-axis.
Histograms appear to be one continuous curve. They are not!
START HERE | LEARN PHOTOGRAPHY | VIEW PHOTOS | WORKSHOPS & TOURS

www.DaveMorrowPhotography.com Page 121
In reality, it’s 256 vertical columns (bins), shown side by side, which produce a “curve like” appearance. This is known as an 8-bit histogram. Reference this page to learn more about color depth & bit depth.
Technically, there are infinite tones, ranging from black to white.
Photoshop places each tone into one of the corresponding 256 bins. This proves to be a “precise enough” estimation for our needs.
I’ve created a graphic below that shows a made up/arbitrary histogram, making this topic easier to conceptualize.
There are an arbitrary number of pixels on the y-axis. The x-axis is represented by 7
specific tonal values. Technically, these are called "bins".
● The histogram reads every pixel's tonal value in the entire image.
● Every time a pixel exists of a certain tonal value, it's counted and placed into it's
matching bin.
● The taller the vertical columns become on the y-axis the more pixels exists for
that specific tonal value.
This specific histogram tells us information about 7 different tonal values. Each pixel
within the image is placed into one of these specific tonal value bins.
START HERE | LEARN PHOTOGRAPHY | VIEW PHOTOS | WORKSHOPS & TOURS

www.DaveMorrowPhotography.com Page 122
This would not be a very precise histogram for a picture. It only tells us information
about 7 specific tones.
In the graphic above there are 40,000 black pixels, 60,000 50% grey pixels, and 20,000
white pixels. There are also a number pixels in the dark mid-tones (between black and
There are also a number pixels in the dark mid-tones, between black and grey,) and the
light mid-tones, between grey and white.
Looking at this histogram most of the pixels for this image will exist in the dark
mid-tones.
A small portion of pixels are purely white and purely black. There is also a small spike in
the light mid-tones, denoting a small number of pixels in that region as well.
To appear realistic, our eyes require tones & colors in photos to seamlessly transition
into one another, as is the nature of light.
Using 256 different tones, as shown below, the 8-bit histogram can fulfill this
requirement.
Technical Note: The back of your camera screen shows a jpeg rendering of the RAW
file. JPEG is 8-bit. This is why the histogram is 8-bit. The actual raw file contains much
more information. This can only be seen when using a RAW image processor such as
Lightroom or Camera RAW.
Now, we will combine the knowledge of histograms and Exposure Value, taking some
example images.
START HERE | LEARN PHOTOGRAPHY | VIEW PHOTOS | WORKSHOPS & TOURS

www.DaveMorrowPhotography.com Page 123
Shooting Example - Histograms & Exposure Value
Relative Exposure Value (+/-EV) is a scale, measured in exposure stops, showing
the difference between the photographer determined Settings Light Value & the
camera metered Scene Light Value.
This is the most important tool for determining & adjusting the exposure
triangle!
Relative Exposure Value can be
found on all DSLR & mirrorless
cameras, the location and ease of
use vary depending on camera
make and model.
Usually, Relative Exposure Value
can be found on the Live View
Screen, info screen, and
sometimes in the viewfinder.
I prefer to use Live View, as
shown below.
Each large dash mark represents
a single stop of exposure. The
smaller dash marks represent 1/3
stop increments for my specific camera setup.
Many cameras have the ability to change the Relative Exposure Value increments from 1
stop, to 1/2, stop to 1/3 stop. I prefer 1/3 stop for more precision while shooting.
The image above shows a Relative Exposure Value of +2. This is denoted as +2EV.
START HERE | LEARN PHOTOGRAPHY | VIEW PHOTOS | WORKSHOPS & TOURS

www.DaveMorrowPhotography.com Page 124
I'll use the symbols +/-EV to denote Relative Exposure Value during the rest of this
tutorial.
How Relative Exposure Value Works
The camera meters the scene luminance and determines the Scene Light Value.
Next, the camera uses the current settings to calculate the Settings Light Value, using
the equations above.
The difference between the Scene LV & the Settings LV, known as Relative Exposure
Value, is shown in exposure stops, denoted by +EV, -EV or 0EV.
When the Relative Exposure Value scale shows +EV values, as in the graphic above
(+2EV), the Settings Light Value is greater than the Scene Light Value, by that number
of exposure stops. Examples provided below.
By selecting the correct f-stop, shutter speed, and ISO, the photographer can match the
Settings Light Value to the Scene Light Value, producing the camera approximated
optimal exposure.
Relative Exposure Value = 0EV = Camera Metered Optimal Exposure
Let's look at some examples…
Technical Note: The Scene LV is determined by camera metering approximations. It
may not be perfect, but it's close. We will adjust for any errors in metering, below. For
now, learn the concept.
Settings Light Value > Scene Light Value = +EV
The graphic below, shows a +2 on the Relative Exposure Value scale, as seen on the
right-hand side.
START HERE | LEARN PHOTOGRAPHY | VIEW PHOTOS | WORKSHOPS & TOURS

www.DaveMorrowPhotography.com Page 125
The camera has calculated that these specific settings of f/11, 1 s., and ISO 100, will
produce an exposure that is 2 exposure stops brighter than the actual scene being
photographed.
Most of the pixels exist in the tonal values just to the right of center, denoted by a large
vertical hump on the histogram. This region is known as the light mid-tones.
TECHNICAL NOTE: The histogram shown is an RGB Histogram.
This region is representing the light green mosses and some of the water.
There is also a large vertical spike near the very right-hand side of the histogram. This
tells us that many pixels in the image will be pure white.
START HERE | LEARN PHOTOGRAPHY | VIEW PHOTOS | WORKSHOPS & TOURS

www.DaveMorrowPhotography.com Page 126
Some pixels that should show color & detail will instead be pure white. This is known as
"clipping" or "blowing out" pixels.
This region represents the water which is almost white or pure white in the image.
Our histogram tells us that the exposure is too bright.
There is no pure white in the scene being photographed. So the histogram should not
display pure white pixels.
Ideally, for this scene, the histogram should be balanced near the center (50% grey),
with a large portion in the dark-mid-tones, just to the left of center.
The goal is to keep the histogram within the bounds of the very right-hand (represents
pure black pixels) and very left-hand (represents pure white) sides. This ensures no
image data is lost.
The graphic above is a small crop of the graphic below.
The actual scene in front of the camera is much darker than that shown on the back of
the camera.
This difference is approximately 2 exposure stops, denoted by +2EV, on the Relative
Exposure Value scale.
START HERE | LEARN PHOTOGRAPHY | VIEW PHOTOS | WORKSHOPS & TOURS

www.DaveMorrowPhotography.com Page 127
The live view camera screen shows an instantaneous view of what the exposure will look
like if taken with the current settings, f/11, 1 s., ISO100.
+2EV is the camera's way of telling the photographer that their current settings will
produce an exposure that is 2 stops brighter than the actual scene being photographed.
Remember, this is an approximation!
Settings Light Value < Scene Light Value = -EV
The graphic below shows a -2EV, as seen on the right-hand side.
The camera calculated that these specific settings, f/11, 1/13 s., and ISO 100, will
produce an exposure that is 2 exposure stops darker than the actual scene being
photographed.
START HERE | LEARN PHOTOGRAPHY | VIEW PHOTOS | WORKSHOPS & TOURS

www.DaveMorrowPhotography.com Page 128
The actual scene being photographed is approximately 2 stops brighter than the settings
f/11, 1/13th second, ISO100 will produce.
The histogram in the image above is pushed far to the left. Most of the pixels are
represented in the dark region of the histogram.
The water in the scene exists in the light mid-tones. The histogram tells us that the
brightest tonal values in the image barely exceed 50% grey.
Viewing the actual scene with our eyes we know that this can't be the correct exposure.
Most of the tonal values in the actual scene don't exist in the darks region.
START HERE | LEARN PHOTOGRAPHY | VIEW PHOTOS | WORKSHOPS & TOURS

www.DaveMorrowPhotography.com Page 129
This difference can be seen below, comparing the camera's Live View screen with the
actual scene being photographed.
The live view rendering is darker, by 2 exposure stops, than the actual scene being
photographed.
Settings Light Level = Scene Light Level = 0EV
In the last example, the Scene Light Value & Settings Light Value are the same,
producing 0EV.
The camera meter has determined that the current settings, f/11, 1/3 second s., and ISO
100, will produce an exposure that matches the brightness of the scene being
photographed.
START HERE | LEARN PHOTOGRAPHY | VIEW PHOTOS | WORKSHOPS & TOURS

www.DaveMorrowPhotography.com Page 130
Referencing the histogram, most of the pixels exist in the dark mid-tones.
Most of the water, trees, and mosses in this scene have dark mid-tones tonal values.
There aren't any pure black or pure white tonal values in the scene.
There aren't any pure black or pure white tonal values represented in the histogram.
The brightest parts of the water exist in the light mid-tones of the histogram.
This checks out, the histogram matches the scene.
Looking at the full-size image below, the back of the live view screen matches the scene
being photographed.
START HERE | LEARN PHOTOGRAPHY | VIEW PHOTOS | WORKSHOPS & TOURS

www.DaveMorrowPhotography.com Page 131
The current settings, as determined by camera metering, will produce an exposure that
matches the scene being photographed. This is the camera metered optimal exposure!
Now, with a firm understanding of f-stop, shutter speed, ISO, and Exposure Value, it's
time to utilize the exposure triangle and start creating images.
Manual Mode Vs. Aperture Priority Mode
I use, prefer, and recommend Aperture Priority Mode for all landscape photos, less low
light, and night sky photography.
Manual Mode is recommended for Milky Way, Northern Lights & Star Trails.
START HERE | LEARN PHOTOGRAPHY | VIEW PHOTOS | WORKSHOPS & TOURS

www.DaveMorrowPhotography.com Page 132
Aperture Priority Shooting Mode (AP)
AP Mode allows the photographer to select/input the f-stop, ISO, and Relative Exposure
Value (sets image brightness).
Next, the camera automatically calculates the shutter speed to match these values.
If the scene luminance changes, as it always does in landscape photography, the camera
automatically adjusts the shutter speed to match the new scene luminance, without
changing the image brightness.
The image brightness always matters, whereas the shutter speed only matters in some
situations.
Therefore it's much more efficient to weigh the Relative Exposure Value higher than the
shutter speed, as performed with aperture priority mode:
● Aperture Priority Mode allows the photographer to control the camera settings
with just as much precision as Manual Mode, without the downside of constantly
adjusting each setting as the scene luminance changes.
● Aperture Priority Mode starts to fail when the camera can't correctly meter the
scene in low light scenarios.
Manual Shooting Mode (M)
Manual Shooting Mode allows the photographer to select f-stop, shutter speed, and ISO.
The camera meters the Scene Light Level, calculates the Setting Light Level, and
displays the difference in the form of Relative Exposure Value.
The photographer can only control Relative Exposure Value by changing the f-stop,
shutter speed or ISO. There is no direct control of +/-EV.
When the scene luminance changes, as the Earth spins, and the sun, moon or light
sources traverse the sky, the photographer must continue to adjust shutter speed, f-stop
and ISO, to maintain the same image brightness (Relative Exposure Value).
START HERE | LEARN PHOTOGRAPHY | VIEW PHOTOS | WORKSHOPS & TOURS

www.DaveMorrowPhotography.com Page 133
If the photographer doesn't notice the scene luminance change and doesn't make the
subsequent changes in camera settings, the image produced will be over or
underexposed.
If the photographer is taking a series of images, of the same composition, each exposure
may have varying levels of brightness. This becomes very annoying when trying to edit
and blend images in post processing.
Manual Mode does have an upside, it's great for learning the basics of the exposure
triangle and photographing low light scenarios.
Upon learning how to adjust exposure using Manual Mode, Aperture Priority Mode is easy to understand and utilize.
That being said, the following section is taught using Manual Mode.
The Live View Shooting Video at the top of the page teaches my technique for Aperture Priority Mode. It also explains the benefits of Aperture Priority mode for landscape photography. You can click here & jump to that video.
Step by Step Shooting Technique
Download the exposure triangle cheat
sheet pdf while reading the following
section.
To create an image, first, the
photographer must visualize the
photograph's final outcome and
determine the desired visual image
attributes, such as motion blur, depth of
field, and image noise.
START HERE | LEARN PHOTOGRAPHY | VIEW PHOTOS | WORKSHOPS & TOURS
www.DaveMorrowPhotography.com Page 134
After mentally determining the desired image attributes, the correct shutter speed,
f-stop, and ISO settings are selected to produce them.
At times, the photographer may desire a certain image attribute which can't be obtained
with the current amount of scene luminance.
For example, it's impossible to photograph a running animal at 1/4000th second shutter
speed in the middle of the night. There just isn't enough light.
● Using the Exposure Triangle the photographer performs a balancing act between
the highest priority image attributes and the amount of light in the scene, known
as scene luminance.
● The desired image attributes determine theoretical settings of f-stop, shutter
speed, ISO which the photographer would like to use.
● The scene luminance & shooting conditions determine the actual range of
settings for use.
● At times the photographer has to sacrifice the desired theoretical image attributes
for the real world scenarios determined by scene luminance & shooting
conditions.
Step by Step Shooting Workflow
A workflow is a series of steps, followed in order, that produce a specific outcome on a
continual basis.
Using a workflow allows the photographer to determine the steps that are producing
desired results and throw away the steps that are producing unwanted results.
Over time, as the workflow progresses & becomes memorized, the photographer no
longer has to "think" about the "correct settings".
At this level, the subconscious mind takes over and the creative mind has more room to
work.
If you want to learn at a fast pace and improve results on a consistent basis, you need a
workflow.
START HERE | LEARN PHOTOGRAPHY | VIEW PHOTOS | WORKSHOPS & TOURS

www.DaveMorrowPhotography.com Page 135
Without it, you're just guessing and hoping for the best!
Here is the workflow I suggest using when selecting camera settings using Manual
Mode.
1. Select Base ISO Setting
When learning the photography exposure triangle start each photo with the camera's
base ISO, usually 100 or 250.
The lower the better. The final ISO is determined later.
2. Select Composition & Focus the Lens
Select the composition to photograph.
Focus the lens at your desired focal point location. I'd recommend 1/3 to 1/2 way into
the scene. This really depends on camera, lens, and composition.
I use a single point spot focus along with hyperfocal shooting techniques which will be
covered in a later tutorial.
3. Camera Meter Determines Scene Light Value
With a composition and focus point selected, the camera can meter the amount of light
in the given composition, and calculate the Scene Light Value.
This is done automatically by the camera.
Next, the correct camera settings, shutter speed, f-stop and ISO are selected to match
the Settings Light Value to the Scene Light Value.
START HERE | LEARN PHOTOGRAPHY | VIEW PHOTOS | WORKSHOPS & TOURS

www.DaveMorrowPhotography.com Page 136
4. Determine Minimum F-Stop Setting
F-stop determines the depth of field and should always be selected first.
If the incorrect depth of field is selected, leaving important objects in the composition
out of focus, none of the following steps matter.
An out of focus image is worthless, while an image with high ISO or incorrect shutter
speed can at times be salvaged.
● Determine minimum f-stop value required to produce desired depth of field.
● You can always shoot at f-stop values larger than the minimum required, just not
less.
● By selecting the minimum required f-stop value, the amount of light collected is
maximized, improving image quality.
Exposure Triangle Relationships for F-Stop:
● Increase f-stop = larger depth of field = less light = longer shutter speed or higher
ISO to maintain exposure.
● Decrease in f-stop = smaller depth of field = more light = shorter shutter speed or
lower ISO to maintain exposure.
● Increase or decrease in f-stop without a corresponding change in ISO or shutter
speed = change in overall exposure.
● F-stops exceeding f/16 often produce reduced image sharpness due to lens
diffraction.
The scene below required a minimum f-stop value of f/8 to keep the entire composition
in focus, from the front to the back.
START HERE | LEARN PHOTOGRAPHY | VIEW PHOTOS | WORKSHOPS & TOURS

www.DaveMorrowPhotography.com Page 137
Shooting at f/5.6 would produce an undesired image attribute with part of the picture
being out of focus due to a shallow depth of field.
Therefore f/8 is my minimum required f-stop setting.
If required, I could exceed f/8 shooting at f/11 or f/16, for example.
Upon selecting f/8 and ISO100, I increase or decrease the current shutter speed to
match 0EV on my Relative Exposure Value Scale.
This ensures that the Settings Light Value matches the Scene Light Value, producing the
camera approximated optimal exposure.
My initial settings are f/8, 1/8s, ISO100, 0EV.
We will fine tune the shutter speed in the next step.
START HERE | LEARN PHOTOGRAPHY | VIEW PHOTOS | WORKSHOPS & TOURS

www.DaveMorrowPhotography.com Page 138
5. Determine Shutter Speed Settings
Referencing the following while reading this section.
Exposure Triangle Relationships for Shutter Speed Settings:
● Shorter shutter speed = less light = increase f-stop or ISO to maintain exposure.
● Longer shutter speed = more light = decrease f-stop or ISO to maintain exposure.
● Increase or decrease in shutter speed without corresponding change in ISO or
f-stop = change in overall exposure.
The image above, captured at f/8, 1/8th second, ISO 100, came out somewhat boring.
Looking at the image I determined that a different image attribute was desired.
I wanted a motion blur effect in the water to show the movement in the scene. This is
produced by longer shutter speeds.
To maintain the same image brightness at 0EV and lengthen the shutter speed, a
decrease in ISO, increase in f-stop value, or a combination of both was required.
By increasing the f-stop from f/8 to f/22, - 3 stops, the shutter speed could be
lengthened by +3 stops, to 1 second, while maintaining 0EV.
I also maintained my required minimum f-stop value from step 4.
The change in f-stop and shutter speed balanced the exposure triangle.
The image brightness was maintained while changing camera settings to match my
desired image attributes for motion blur.
● Always determine the reason for a change in camera settings, such as a desired
image attribute, prior to changing them.
● Without a direction or reason for changing cameras settings, you're making blind
decisions which lead to bad photos.
START HERE | LEARN PHOTOGRAPHY | VIEW PHOTOS | WORKSHOPS & TOURS

www.DaveMorrowPhotography.com Page 139
After selecting the new settings, I waited for the waves to come in and pushed the
shutter button.
Although I matched the camera metered optimal exposure at 0EV, the image above was
slightly too dark, especially in the large rocks.
This can be seen in the RGB histogram (grey area) for the image above.
START HERE | LEARN PHOTOGRAPHY | VIEW PHOTOS | WORKSHOPS & TOURS

www.DaveMorrowPhotography.com Page 140
Only reference the grey luminance histogram. I'll cover the Red, Green, and Blue
histogram in a future tutorial.
Looking at the left-hand side of the histogram some of the pixels are pure black. There
are no black tonal values in the actual scene being photographed.
Also, some of the clouds in the scene were close to pure white. The brightest pixels in the
histogram fall in the light mid-tones, not close enough to pure white.
Although metering does a well at approximating scene luminance it's not
always perfect.
In the following steps, I'll make slight changes in camera settings to adjust for small
errors in the camera's metering approximation.
6. ISO & Final Adjustments
Increasing or decreasing ISO above or below 100 is only required when f-stop and
shutter speed are already at their maximums for the given shooting situation.
In most cases ISO can stay at 100 or it's base value for the specific camera.
There are three specific situations where ISO should be increased. Each is covered in
depth in the ISO Photography Guide.
1. Shooting Requirement: Shorter Shutter Speed
○ Action: Increase ISO to Decrease Shutter Speed.
2. Shooting Requirement: Brighter Exposure
○ Action: Increase ISO to Increase Image Brightness.
3. Shooting Requirement: Increased Depth of Field
○ Action: Increase ISO to Increase F-Stop.
Reference the following while reading this section.
START HERE | LEARN PHOTOGRAPHY | VIEW PHOTOS | WORKSHOPS & TOURS

www.DaveMorrowPhotography.com Page 141
Exposure Triangle Relationships for ISO:
● Increase in ISO = more image noise = shorter shutter speed or larger f-stop to
maintain exposure.
● Decrease in ISO = less image noise = longer shutter speed or smaller f-stop to
maintain exposure.
● Increase or decrease in ISO without a corresponding change in f-stop or shutter
speed = change in overall exposure.
Back to the shooting example...
I decided to increase the overall exposure by 1 exposure stop to +1EV, in turn recovering
the dark details in the rocks.
I was happy with the current exposure time, so the change in exposure stops could only
come from ISO or f-stop.
Decreasing the f-stop from f/22 to f/16 provided a positive image attribute of less lens
diffraction, while exceeding the minimum required f-stop value for depth of field (step
4).
Instead of changing f-stop, ISO could have been increased from ISO100 to ISO200
slightly increasing noise, yet achieving the same +1EV desired image attribute.
I knew that the f/16 image, at ISO100, would be much sharper than the f/22 image at
ISO200.
Since I had two choices to achieve my +1EV image attribute, increase ISO or decrease
f-stop, I chose that which improved image quality.
Either setting would have worked well, but the reduction in f-stop value was the optimal
choice.
Without changing the shutter speed, the f-stop value was increased by 1 exposure stop to
f/16 from f/22.
START HERE | LEARN PHOTOGRAPHY | VIEW PHOTOS | WORKSHOPS & TOURS

www.DaveMorrowPhotography.com Page 142
This allowed more light to enter the lens thus creating an image that was 1 stop brighter
with the same exposure time.
The final settings read, f/16, 1 second, ISO100 at +1EV.
Although the image is slightly brighter than the scene being photographed, this is the
optimal exposure.
START HERE | LEARN PHOTOGRAPHY | VIEW PHOTOS | WORKSHOPS & TOURS

www.DaveMorrowPhotography.com Page 143
No longer are any pixels pure black on the left-hand side of the histogram. This matches
what I see in the scene.
I did not "clip" or "blow out" any of the brightest portions of the image, while retaining
the maximum amount of image data in the darker portions, such as the rocks.
Although the histogram is almost touching the purely white tonal values at the very far
right, it's not quite there.
I can easily darken this image in post processing, matching it to the actual scene, while
retaining all detail.
This technique is termed, Expose to the Right, or ETTR for short.
The following example shows the image above adjusted in Lightroom for overall image
brightness and color balance.
These two very simple adjustments took less than 1 minute.
The image represents what was actually seen during the shoot. This is not the final edit
of the photo, just an example of how much color and detail are retained in a RAW file.
Technical Note: The
camera's image review
screen shows
"processed" JPEG
representation of the
image & it's histogram.
This can be misleading.
The RAW file contains
much more detail than
will ever be displayed
in camera. Using
Lightroom, Camera
RAW & Photoshop,
allows the photographer to adjust the actual RAW image data.
START HERE | LEARN PHOTOGRAPHY | VIEW PHOTOS | WORKSHOPS & TOURS

www.DaveMorrowPhotography.com Page 144
The histogram for the quick edit of the example above is perfect for the specific scene.
It matches exactly what I saw when shooting.
The clouds and some parts of the sun-touched surf were quite bright, close to white.
The middle ground water and some clouds, making up a small part of the image as a
whole, represent the mid-tones tonal values.
Looking at the center of the x-axis on the histogram, the mid-tones dip down on the
vertical axis.
This tells us that there aren't any many pixels represented by these tonal values.
Looking at the scene this matches up and makes sense.
Finally, much of our image is falls within the dark mid-tones. The rocks, much of the
water and some of the clouds fall within this tonal range.
The very left-hand spike in the histogram, which is tall (y-axis) and fairly wide (x-axis)
represents these tonal values. This matches our scene and makes sense as well.
The image is good to go!
START HERE | LEARN PHOTOGRAPHY | VIEW PHOTOS | WORKSHOPS & TOURS

www.DaveMorrowPhotography.com Page 145
Understanding Exposure - Technical Details
This section is written for those of you that are interested in the science and technical
details behind exposure. Understanding this information provides a much better
mastery of the subject matter as a whole.
Camera Sensor Size & Image Quality is a prerequisite for this material.
What is Exposure in Photography?
Digital photography consists of communicating real world information, carried by light,
into digital information (binary code), understood and processed by machines, then
displayed in the form of pictures.
The photographer determines, via camera settings, if this information is conveyed
precisely, producing a digital image that matches the scene being photographed.
Scene luminance is a measured value, denoting the light intensity produced by the scene
being photographed.
The brighter the scene being photographed, the larger the scene luminance, the more
intense the light.
Photons are small packets or particles for carrying light information. They are the single
basic ingredient of light.
The number of Photons carried by light is proportional to the intensity or brightness of
that light.
Larger Scene Luminance = More Light = More Photons = More Light Information
START HERE | LEARN PHOTOGRAPHY | VIEW PHOTOS | WORKSHOPS & TOURS
www.DaveMorrowPhotography.com Page 146
Pixels, Color & the Exposure Triangle
Imagine looking through the camera viewfinder at a scene you're about to photograph.
You select the composition, focus, select your settings then press the shutter button.
What Actually Happens Next?
Inside your camera body, there is a camera sensor, consisting of millions of tiny squares
called pixels.
A pixel is a small bucket or well for collecting light information conveyed from the scene
being photographed.
Each of the millions of pixels contained on the image sensor collects light information
from a very small sample of your image composition as a whole.
Think of the image composition divided up into millions of tiny squares. A specific pixel
collects light information conveyed by each specific tiny square.
When photons collide with the camera sensor free electrons are produced via the
Photoelectric Effect.
Each free electron carries a small charge which is collected by a corresponding pixel well
contained on the sensor.
As more light hits each pixel, more electrons are collected, producing larger values of
charge.
The more charge each pixel contains, the brighter it's corresponding tonal value, on a
scale of black to white, known as the tonal scale or tonal range, as shown below.
START HERE | LEARN PHOTOGRAPHY | VIEW PHOTOS | WORKSHOPS & TOURS

www.DaveMorrowPhotography.com Page 147
● Pixels containing maximum charge produce white.
● Pixels containing no charge produce black.
● All charge values between maximum and minimum produce varying tones of
gray.
Color Filters, such as the Bayer Filter, are placed over each pixel to determine it's color.
Using the tonal values and color values, found above, camera's process the information
using algorithms, producing a single specific color for each pixel.
Combine all the pixels, each producing a single color, and a photo is created.
The amount of light information exposed to each pixel, and the sensor as a whole, is
determined by the combination of f-stop and shutter speed.
ISO is used to increase (amplify) or decrease (compress) the light information (signal)
conveyed by specific f-stop and shutter speed settings, matching Settings Light Value to
Scene Light Value.
ISO is a signal & noise scaling factor.
An image is overexposed when too much light information is collected by the pixels
on the image sensor. The image produced is much brighter than the scene being
photographed.
START HERE | LEARN PHOTOGRAPHY | VIEW PHOTOS | WORKSHOPS & TOURS

www.DaveMorrowPhotography.com Page 148
An image is underexposed when not enough light information is collected by each
pixel on the image sensor. The image produced is much darker than the scene being
photographed.
The optimal exposure is produced when the amount of light information collected
by each pixel, thus the image sensor, matches the amount being produced by the scene
being photographed. The image produced matches the scene being photographed.
Technical Examples of Exposure
Each pixel must collect enough light information, in the form of electrons, to produce
tonal values matching those produced by the scene luminance levels.
Each pixel's job is to collect light information for a very very small sample of the image
composition as a whole.
The graphics below show a small amount of noise contained in each pixel well.
Like a radio at very low volume, electronic devices, producing signals, always produce a
small baseline amount of noise.
Although noise is not important in the examples below, it becomes very important when
determining ISO settings later on this page.
It is important to introduce the inherent pixel noise now since it comes with all digital
signals.
For the graphics below assume the following:
● ISO stays constant as at a Base ISO of 100.
● The f-stop and shutter speed (Absolute Exposure Value) are arbitrary, yet can
change.
START HERE | LEARN PHOTOGRAPHY | VIEW PHOTOS | WORKSHOPS & TOURS

www.DaveMorrowPhotography.com Page 149
The graphics are not to scale for noise vs. signal or any other values. It's only purpose
is to teach the concept.
Example 1 - Correct Photography Exposure
The graphic below shows 4 different pixel wells all part of a single image sensor. Each
pixel shown below has correct exposure.
Well 1 corresponds to part of the scene with a low luminance, which produces a dark
tonal value, between 50% grey and black.
Only a small signal is required to produce the corresponding tonal value.
START HERE | LEARN PHOTOGRAPHY | VIEW PHOTOS | WORKSHOPS & TOURS

www.DaveMorrowPhotography.com Page 150
Well 2 corresponds to part of the scene with a slightly higher luminance level, producing
a tonal value close to 50% grey.
To produce this tonal value, the pixel must collect enough electrons to produce the
corresponding signal, relaying this information into the digital world.
Well 3 and 4 correspond to even lighter scene luminance levels, closer to white.
Lighter tonal values require more light information to be collected in the form of
electrons, which produce the corresponding charge and signal.
Example 2 - Underexposure
The next graphic depicts a different scene being photographed. Pixel wells 1, 2 and 3,
have low signal creating underexposed tonal values.
The light blue color denotes the difference between the actual signal produced by each
pixel, and the signal required to produce the real world/scene tonal values.
START HERE | LEARN PHOTOGRAPHY | VIEW PHOTOS | WORKSHOPS & TOURS
www.DaveMorrowPhotography.com Page 151
Well 4 is still correctly exposed since the signal produced matches the real world/scene
tonal value required.
Well 1 - 3 all correspond to different portions of the scene, each with different luminance
levels, which exhibit different real world tonal values.
Well 1 corresponds to part of the scene which has medium luminance levels & a tonal
value close to 50% grey.
Well 2 and well 3 correspond to slightly brighter portions of the scene which have tonal
values closer to white.
Well 1, 2 and 3 did not collect enough electrons to produce a signal large enough to
match the real world tonal values required by the scene.
The actual signal communicated by each pixel well will produce a pixel tonal value that
is darker than the real world tonal value, known as underexposure.
The actual pixel tonal value each low signal will produce is found on the tonal scale at
the same height.
Example 3: Overexposure
The next example shows a new scene, with different luminance levels.
The pixel wells produced a signal that was too large, due to the collection of too many
electrons.
The difference between the scene tonal value and the actual signal produced is shown in
pink.
The signal produced by each pixel exceeds the requirements to match the real world
tonal values.
START HERE | LEARN PHOTOGRAPHY | VIEW PHOTOS | WORKSHOPS & TOURS

www.DaveMorrowPhotography.com Page 152
The portion of the scene which pixel well 1 represents, only required a dark tonal value,
halfway between pure black and 50% grey.
The actual signal produced a tonal value close to 50% grey.
Pixel well 1 is slightly overexposed. The same concept applies to well 2 and well 3.
The scene luminance corresponding to pixel well 4 required a tonal value of light grey,
slightly darker than white.
The actual signal produced a tonal value of pure white.
Since each pixel produced more than enough signal, without overflowing, this is
technically the ideal exposure.
START HERE | LEARN PHOTOGRAPHY | VIEW PHOTOS | WORKSHOPS & TOURS

www.DaveMorrowPhotography.com Page 153
Signal size correlates to the amount of light information (electrons) collected by each
pixel.
Each pixel collected more information than required to match the scene tonal values.
Although this overload of information was collected none of the pixels reached full well
capacity, thus no information was thrown away.
Exceeding full well capacity and throwing away information is known as "blowing out",
"clipping" or "overexposing" part of the image.
Using photo editing software the image can be darkened to match the actual scene tonal
values, while retaining dark tonal value information that would not have been captured
with a regular exposure.
This technique is termed Expose to the Right or ETTR.
Cameras have a built in headroom or highlight recovery area which provides a small
margin of safety for highlight recovery.
The goal is to watch the Luminosity, Red, Green & Blue histogram channels ensuring
none of them are "blown out", retaining all image data.
Why ISO Matters
F-stop, shutter speed & scene luminance determine the amount of light exposed to the
image sensor.
Each pixel contained in the image sensor collects information from this light, in the
form of color and tonal values, producing a single specific color for each pixel.
If too much or not enough light is exposed to the sensor, due to varying values of scene
luminance, shutter speed or aperture diameter, ISO is used to increase or decrease the
overall signal amplification, creating the optimal exposure.
START HERE | LEARN PHOTOGRAPHY | VIEW PHOTOS | WORKSHOPS & TOURS

www.DaveMorrowPhotography.com Page 154
ISO is used to scale the signal, determined by f-stop & shutter speed, up and down, to
matching it to the luminance levels produced by the scene.
Matching Exposure with ISO
The following graphic shows 4 different pixel wells with varying ISO values.
Assume the scene luminance stays the same for each example.
The base or standard ISO is seen on the far left, with the corresponding tonal value
which it will produce.
To maintain the same overall exposure (image brightness) while increasing f-stop values
or decreasing shutter speed, the ISO could be increased to match the same overall
signal, at the cost of additional noise.
From the section above, this is the same as maintaining a constant Settings Light Value
while increasing Absolute Exposure Value.
The ratio of total signal to noise is exaggerated to show the overall effect.
START HERE | LEARN PHOTOGRAPHY | VIEW PHOTOS | WORKSHOPS & TOURS

www.DaveMorrowPhotography.com Page 155
Lower ISO values produce less image noise but require much more light information
(signal), denoted by blue in the graphic above, to produce the same overall exposure.
Higher ISO values require less light information at the cost of image noise.
As you move from Base ISO to High ISO, in the graphic above, there is less overall light
information being collected, with a constant tonal value being produced.
This means that the aperture diameter is becoming smaller, the shutter speed shorter,
or a combination of both, provided fixed scene luminance.
The Signal to Noise Ratio (SNR) determines the overall image quality & dynamic range.
High SNR, as seen in the base ISO example, produces higher image quality than low
SNR, as seen in the high ISO example.
Final Tips - The Exposure Triangle
Constantly shooting & experimenting with these techniques is the only way to learn
them.
● While learning, take as many images as possible. Don't take these images
randomly, without reason.
● Question each setting change and try to predict the results it will produce.
● Have a clear mental picture of the image you want to produce. Next, select the
correct settings to produce it.
If you have live view on your camera I would highly suggest using it. This is a very
powerful tool, especially with the RGB histogram displayed on the screen.
Live View allows you to see, real time, how the changes in camera settings affect the
exposure & RGB histogram. This is a great learning tool!
START HERE | LEARN PHOTOGRAPHY | VIEW PHOTOS | WORKSHOPS & TOURS

www.DaveMorrowPhotography.com Page 156
● Live View also allows you to see your composition, framed as it would be hanging
on the wall, instead of the fully immersive experience that comes from looking
through a view finder.
● I find live view to improve my image quality as well as composition.
The exposure triangle will become second nature after mastering ISO, shutter speed, and f-stop.
You can also check out my Learn Photography Page which contains all of the tutorials on
this website.
In the future, I'll release another tutorial teaching my complete photography workflow,
which I use for 95% of images, using Aperture Priority Mode.
Have fun out there & thanks for reading!
Dave Morrow - About Me Page
Useful Links & Information
● The Learn Photography Page - Complete Tutorial Library ● The Landscape Photography Journals ● Photography Workshops & Tours
START HERE | LEARN PHOTOGRAPHY | VIEW PHOTOS | WORKSHOPS & TOURS