t h e lu m in esc en ce ef f ic ien c y r esp on se of 3: c,...
TRANSCRIPT
Oklahoma State University
The luminescence efficiency response of Al2O3:C, LiF:Mg,Ti and CaF2:Tm detectors to high-energy heavy charged particles:
Results from 6th ICCHIBAN
Ramona Gaza1, Eduardo G. Yukihara & Stephen W.S. McKeever
Department of Physics, OSU, OK, USA1Now at SRAG, JSC, NASA, Houston, TX, USA
Oklahoma State University
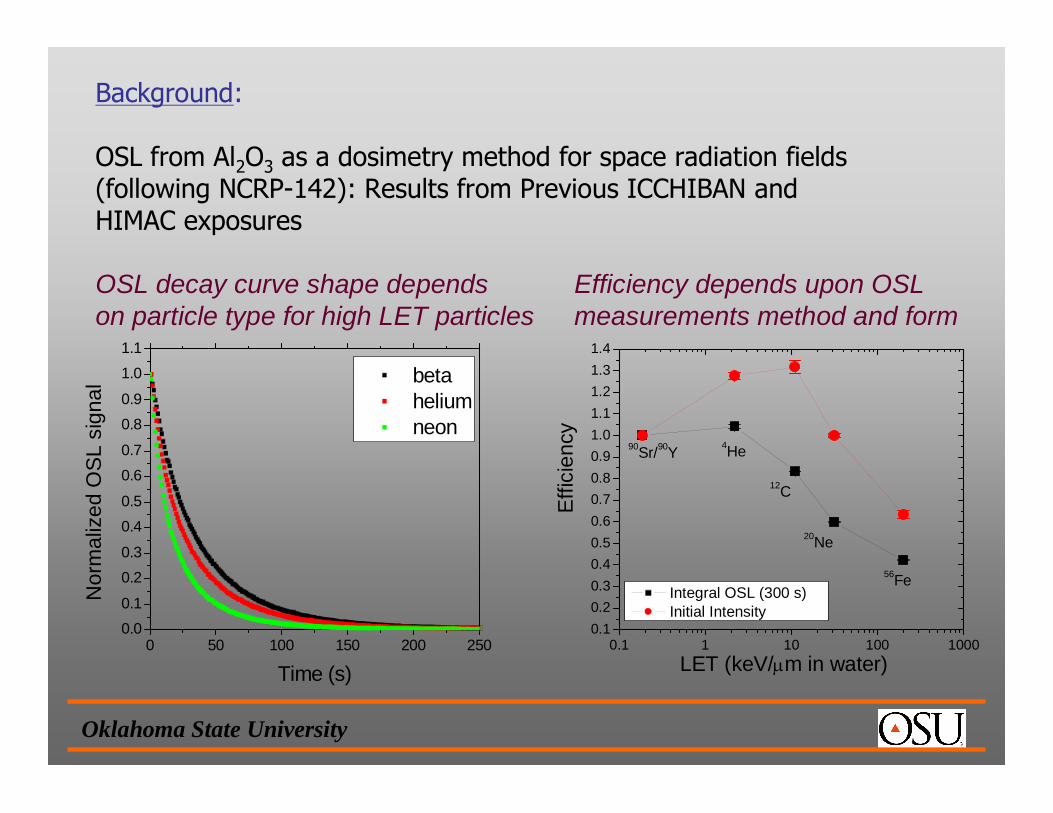
Background:
OSL from Al2O3 as a dosimetry method for space radiation fields (following NCRP-142): Results from Previous ICCHIBAN and HIMAC exposures
OSL decay curve shape depends Efficiency depends upon OSLon particle type for high LET particles measurements method and form
0 50 100 150 200 2500.00.1
0.20.3
0.40.5
0.60.7
0.80.9
1.01.1
Nor
mal
ized
OSL
sig
nal
Time (s)
beta helium neon
0.1 1 10 100 10000.10.20.30.40.50.60.70.80.91.01.11.21.31.4
56Fe
20Ne
12C
4He
Effic
ienc
y
LET (keV/mm in water)
Integral OSL (300 s) Initial Intensity
90Sr/90Y
Oklahoma State University
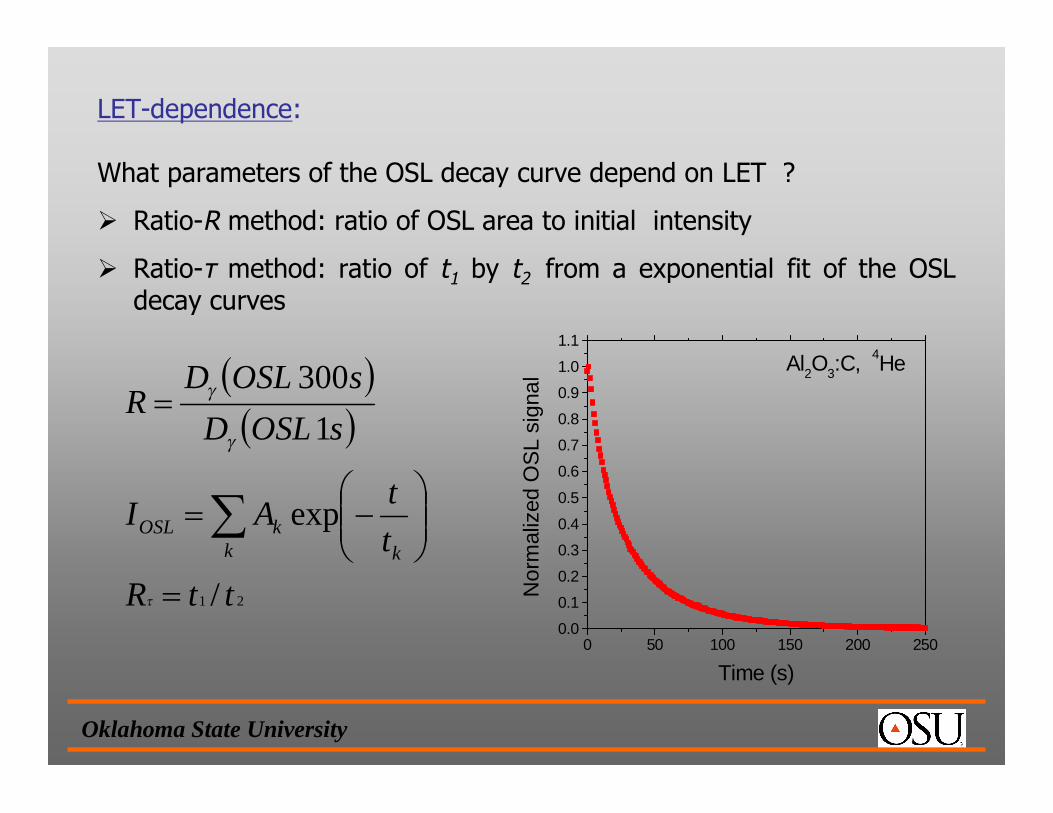
LET-dependence:
What parameters of the OSL decay curve depend on LET ?
Ratio-R method: ratio of OSL area to initial intensity
Ratio-τ method: ratio of t1 by t2 from a exponential fit of the OSL decay curves
0 50 100 150 200 2500.0
0.1
0.2
0.3
0.4
0.5
0.6
0.7
0.8
0.9
1.0
1.1
Nor
mal
ized
OSL
sig
nal
Time (s)
Al2O3:C, 4He( )( )sOSLD
sOSLDR
1300
g
g=
21 /
exp
ttRttAI
k kkOSL
=
÷÷ø
öççè
æ-=å
t

Oklahoma State University
5045140040Kr
5093.950040Ar
5024.413512C
Nominal Dose(mGy)
LET(keV/μm in H2O)
Nominal Energy (MeV/n)Particle
ICCHIBAN 6: Irradiations:
(a) Single particles
(b) Fragmentation:
5 mg/cm2 PMMA filter; 50 mGy nominal dose
(c) Blinds:
6 unknown exposures
Oklahoma State University
hgD
D =
R
HCPR I
IDD ´=g
HCPRR
HCPHCP
DD
DIDI gh ==
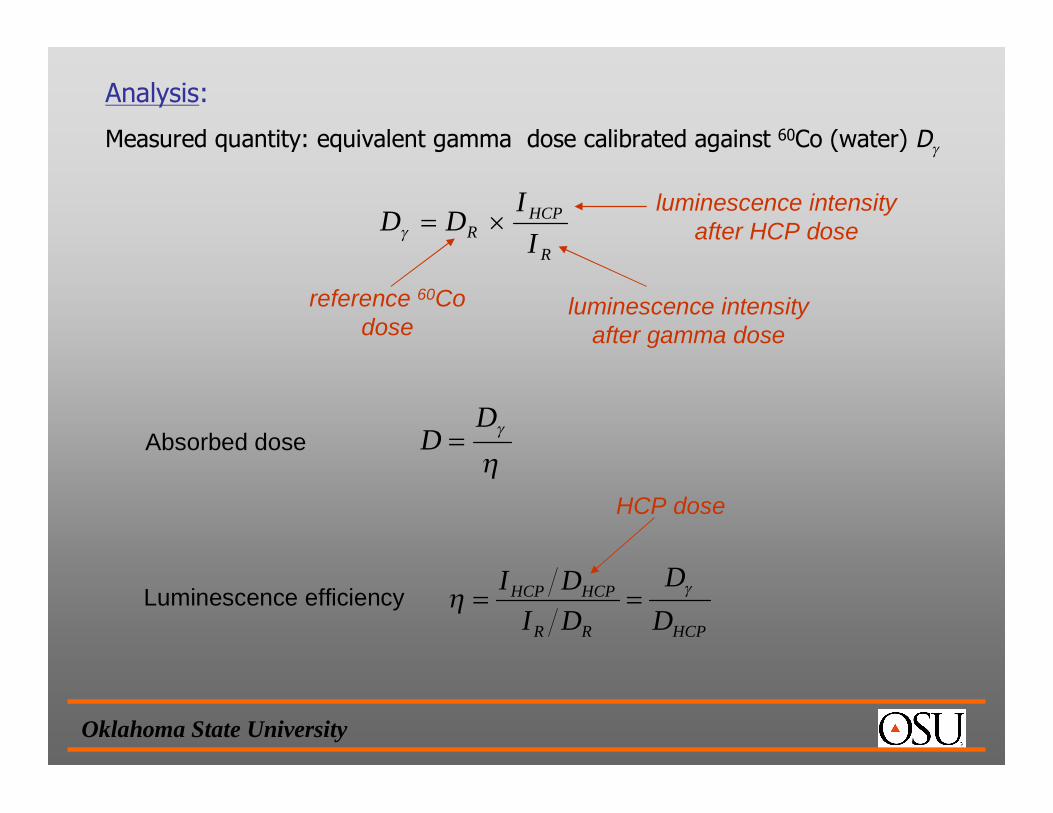
Analysis:
Measured quantity: equivalent gamma dose calibrated against 60Co (water) Dg
reference 60Codose
luminescence intensityafter HCP dose
luminescence intensityafter gamma dose
Absorbed dose
Luminescence efficiency
HCP dose
Oklahoma State University
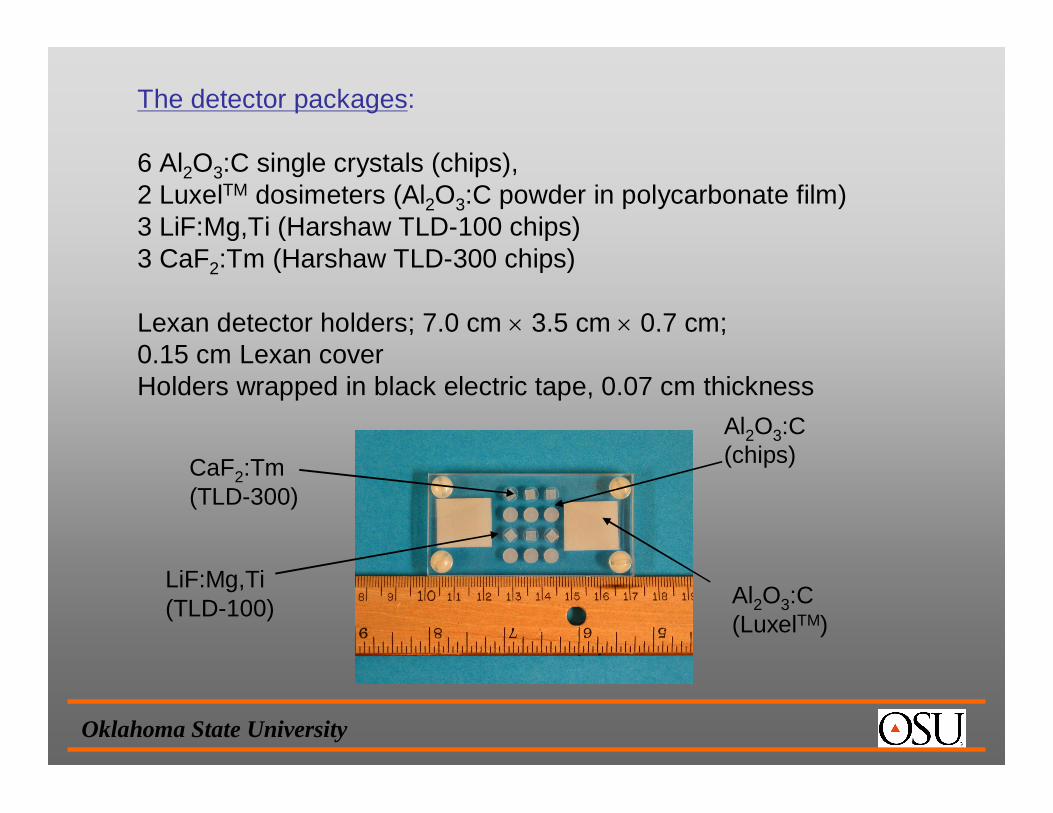
The detector packages:
6 Al2O3:C single crystals (chips), 2 LuxelTM dosimeters (Al2O3:C powder in polycarbonate film)3 LiF:Mg,Ti (Harshaw TLD-100 chips) 3 CaF2:Tm (Harshaw TLD-300 chips)
Lexan detector holders; 7.0 cm ´ 3.5 cm ´ 0.7 cm;0.15 cm Lexan coverHolders wrapped in black electric tape, 0.07 cm thickness
Al2O3:C (chips)
Al2O3:C (LuxelTM)
LiF:Mg,Ti(TLD-100)
CaF2:Tm (TLD-300)
Oklahoma State University
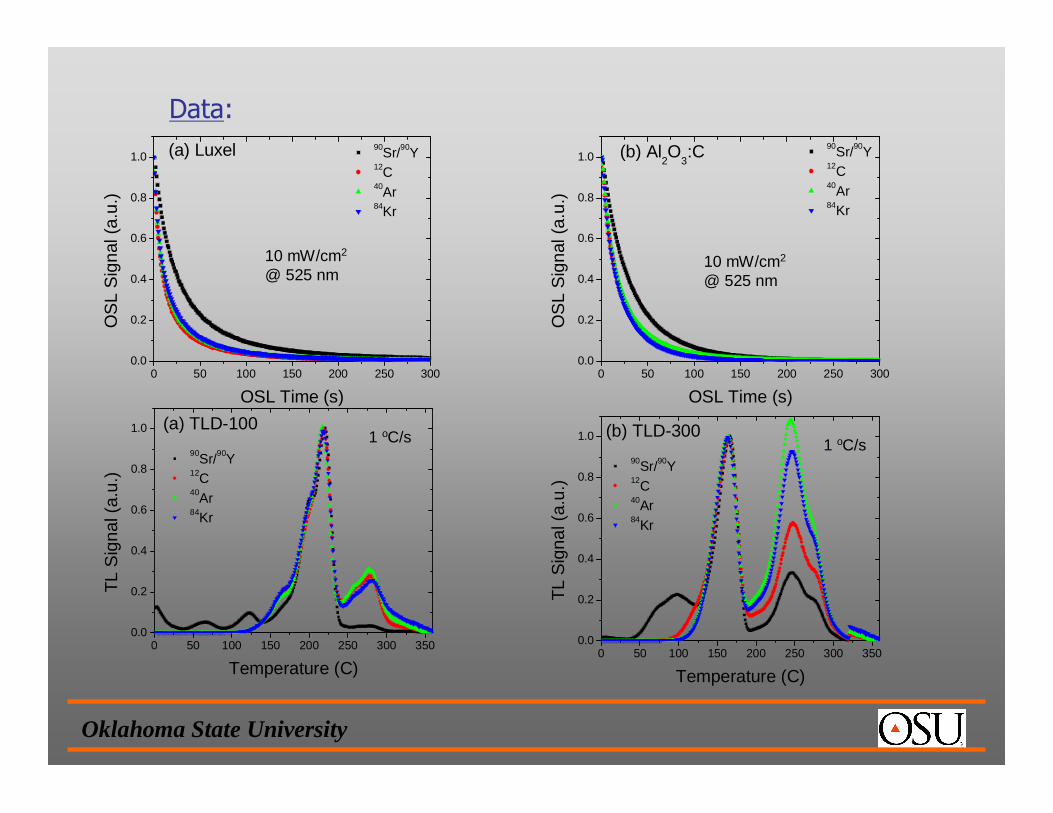
Data:
0 50 100 150 200 250 3000.0
0.2
0.4
0.6
0.8
1.0
O
SL
Sig
nal (
a.u.
)
OSL Time (s)
90Sr/90Y12C 40Ar 84Kr
(a) Luxel
0 50 100 150 200 250 3000.0
0.2
0.4
0.6
0.8
1.0
OS
L S
igna
l (a.
u.)
OSL Time (s)
90Sr/90Y12C40Ar84Kr
(b) Al2O
3:C
0 50 100 150 200 250 300 3500.0
0.2
0.4
0.6
0.8
1.0
TL S
igna
l (a.
u.)
Temperature (C)
90Sr/90Y12C40Ar84Kr
(a) TLD-100
0 50 100 150 200 250 300 3500.0
0.2
0.4
0.6
0.8
1.0
TL S
igna
l (a.
u.)
Temperature (C)
90Sr/90Y12C40Ar84Kr
(b) TLD-300
10 mW/cm2
@ 525 nm10 mW/cm2
@ 525 nm
1 oC/s 1 oC/s

Oklahoma State University
Efficiencies: (includes all data from ICCHIBAN 2, 4 & 6, & Proton)
0.1 1 10 100 10000.00.10.20.30.40.50.60.70.80.91.01.11.2
Effic
ienc
y
LET (keV/mm in water)
Luxel (a)
0.1 1 10 100 10000.00.10.20.30.40.50.60.70.80.91.01.11.2
Effi
cien
cy
LET (keV/mm in water)
Al2O3:C (b)
0.1 1 10 100 10000.00.10.20.30.40.50.60.70.80.91.01.11.2
Effi
cien
cy
LET (keV/mm in water)
TLD-100(c)
0.1 1 10 100 10000.00.10.20.30.40.50.60.70.80.91.01.11.2
Effic
ienc
y
LET (keV/mm in water)
TLD-300(d)
integral integral
peak 5 peak 3

Oklahoma State University
Fragmentation Results: (Equivalent gamma doses to water; uncorrected)
54.6± 0.5
20.2± 0.1
154.7± 3.8
21.1± 0.2
24.3± 1.9
17.8± 0.5
32.0± 0.3
21.5± 0.1
84Kr
60.0± 0.9
20.1± 0.3
224.5± 15.5
28.3± 3.5
24.4± 2.7
18.5± 0.8
38.4± 0.2
23.9± 0.1
40Ar
104.0± 1.3
27.9± 0.3
336.7± 13.5
41.0± 1.3
48.3± 5.6
30.2± 1.3
69.3± 0.4
38.2± 0.0*
12C
AreaHT Peak
Peak 3 height
AreaHT Peak
Peak 5 height
OSL Initial
Intensity
Integral OSL
(300 s)
OSL Initial
Intensity
Integral OSL
(300 s)Ion
CaF2:Tm(TLD-300)
LiF:Mg,Ti(TLD-100)
Al2O3:C (chips)LuxelTM
(* smaller than 0.05)
0.1 1 10 100 10000.10.20.30.40.50.60.70.80.91.01.11.21.31.4
56Fe
20Ne
12C
4He
Effic
ienc
y
LET (keV/mm in water)
Integral OSL (300 s) Initial Intensity
90Sr/90Y

Oklahoma State University
Fragmentation Results: (Equivalent gamma doses to water; uncorrected)
54.6± 0.5
20.2± 0.1
154.7± 3.8
21.1± 0.2
24.3± 1.9
17.8± 0.56453.784Kr/BF
60.0± 0.9
20.1± 0.3
224.5± 15.5
28.3± 3.5
24.4± 2.7
18.5± 0.851.253.340Ar/BF
104.0± 1.3
27.9± 0.3
336.7± 13.5
41.0± 1.3
48.3± 5.6
30.2± 1.353.847.712C/BF
AreaHT Peak
Peak 3 height
AreaHT Peak
Peak 5 height
OSL Initial
Intensity
Integral OSL
(300 s)
OSL Initial
Intensity
Integral OSL
(300 s)Ion
CaF2:Tm(TLD-300)
LiF:Mg,Ti(TLD-100)
Al2O3:C (chips)LuxelTM
(* smaller than 0.05)
if doses corrected using LET and efficiency ofthe primary particle
0.1 1 10 100 10000.10.20.30.40.50.60.70.80.91.01.11.21.31.4
56Fe
20Ne
12C
4He
Effic
ienc
y
LET (keV/mm in water)
Integral OSL (300 s) Initial Intensity
90Sr/90Y
Oklahoma State University
Fragmentation Results: (Equivalent gamma doses to water; uncorrected)
Dose
Dose
Distance
Signal
Net OSL due to contributions from regions of different dose, over a wide dose range
54.6± 0.5
20.2± 0.1
154.7± 3.8
21.1± 0.2
24.3± 1.9
17.8± 0.5
32.0± 0.3
21.5± 0.1
84Kr
60.0± 0.9
20.1± 0.3
224.5± 15.5
28.3± 3.5
24.4± 2.7
18.5± 0.8
38.4± 0.2
23.9± 0.1
40Ar
104.0± 1.3
27.9± 0.3
336.7± 13.5
41.0± 1.3
48.3± 5.6
30.2± 1.3
69.3± 0.4
38.2± 0.0*
12C
AreaHT Peak
Peak 3 height
AreaHT Peak
Peak 5 height
OSL Initial
Intensity
Integral OSL
(300 s)
OSL Initial
Intensity
Integral OSL
(300 s)Ion
CaF2:Tm(TLD-300)
LiF:Mg,Ti(TLD-100)
Al2O3:C (chips)LuxelTM
0.1 1 10 100 10000.10.20.30.40.50.60.70.80.91.01.11.21.31.4
56Fe
20Ne
12C
4He
Effic
ienc
y
LET (keV/mm in water)
Integral OSL (300 s) Initial Intensity
90Sr/90Y
(* smaller than 0.05)

Oklahoma State University
Blind Exposures: (Equivalent gamma doses to water; uncorrected)
196.1± 0.7
141.4± 0.9
191.9± 7.8
121.3± 4.2
142.2± 18.3
124.1± 12.2
160.3± 4.5
139.9± 3.7#6
135.6± 0.9
126.7± 0.8
132.5± 8.3
100.9± 12.5
121.6± 1.1
110.6± 1.4
115.1± 08
103.2± 0.4#5
122.0± 1.1
89.1± 0.6
107.7± 10.3
66.9± 2.1
104.1± 7.2
85.1± 3.6
105.5± 0.4
91.8± 0.3#4
135.1± 1.5
125.9± 0.9
116.1± 9.5
105.2± 12.5
129.8± 15.5
109.7± 6.6
117.1± 0.4
107.0± 0.3#3
136.9± 1.4
127.5± 0.7
122.6± 6.5
110.7± 9.1
116.6± 11.7
103.1± 4.9
117.9± 0.2
107.0± 0.3#2
137.4± 1.0
128.9± 1.1
112.1± 3.5
88.0± 1.3
114.0± 11.7
104.1± 8.6
120.2± 1.7
107.1± 0.5#1
AreaHT Peak
peak 3 height
AreaHT Peak
peak 5 height
Initial Intensity
Integral OSL
Initial Intensity
Integral OSLBlind
CaF2:Tm(TLD-300)
LiF:Mg,Ti(TLD-100)
Al2O3:C (chips)Luxel

Oklahoma State University
0.1 1 10 100 10000123456789
1011
(c) TLD-100-----blind #1 -----blind #4-----blind #2 -----blind #5-----blind #3 -----blind #6
Rat
io H
TR
LET (keV/ mm in water)
0.1 1 10 100 10000.5
0.6
0.7
0.8
0.9
1.0
1.1
1.2-----blind #1 -----blind #4-----blind #2 -----blind #5-----blind #3 -----blind #6
Rat
io R
LET (keV/ mm in water)
(a) Luxel
0.1 1 10 100 10000.00.51.01.52.02.53.03.54.04.55.0
(d) TLD-300-----blind #1 -----blind #4-----blind #2 -----blind #5-----blind #3 -----blind #6
Rat
io P
eak(
5+6)
/Pea
k3
LET (keV/mm in water)
0.1 1 10 100 10000.5
0.6
0.7
0.8
0.9
1.0
1.1
1.2(b) Al2O3:C -----blind #1 -----blind #4
-----blind #2 -----blind #5-----blind #3 -----blind #6
Rat
io R
LET (keV/ mm in water)

Oklahoma State University
Blind Exposures: (Equivalent gamma doses to water; uncorrected)
196.1± 0.7
141.4± 0.9
191.9± 7.8
121.3± 4.2
142.2± 18.3
124.1± 12.2
160.3± 4.5
139.9± 3.7#6
135.6± 0.9
126.7± 0.8
132.5± 8.3
100.9± 12.5
121.6± 1.1
110.6± 1.4
115.1± 08
103.2± 0.4#5
122.0± 1.1
89.1± 0.6
107.7± 10.3
66.9± 2.1
104.1± 7.2
85.1± 3.6
105.5± 0.4
91.8± 0.3#4
135.1± 1.5
125.9± 0.9
116.1± 9.5
105.2± 12.5
129.8± 15.5
109.7± 6.6
117.1± 0.4
107.0± 0.3#3
136.9± 1.4
127.5± 0.7
122.6± 6.5
110.7± 9.1
116.6± 11.7
103.1± 4.9
117.9± 0.2
107.0± 0.3#2
137.4± 1.0
128.9± 1.1
112.1± 3.5
88.0± 1.3
114.0± 11.7
104.1± 8.6
120.2± 1.7
107.1± 0.5#1
AreaHT Peak
peak 3 height
AreaHT Peak
peak 5 height
Initial Intensity
Integral OSL
Initial Intensity
Integral OSLBlind
CaF2:Tm(TLD-300)
LiF:Mg,Ti(TLD-100)
Al2O3:C (chips)Luxel
• Primarily low-LET blind exposures
• Blind #4 higher LET mix than others
• Need greater definition of efficiency values at low LET
Oklahoma State University
Conclusions:
1. Efficiencies depend upon material, physical form, readout method, and data analysis.
2. OSL decay-curve shape contains information about LET.3. For single particle irradiation, can use this to determine
corrected absorbed dose (and therefore dose equivalent).4. For mixed fields, difficult to determine “mean LET” (and
therefore corrected absorbed dose and dose equivalent) when strong contribution to the OSL signal from high-LET components.
5. OSL signal from blind exposures dominated by low-LET components.
6. Future experiments: need (1) greater definition of efficiency in low-LET region; (2) information from CR-39.