t he best agricultural land use in the study area of the
TRANSCRIPT

*Corresponding author: e-mail: [email protected]: 10.21608/ejss.2020.19523.1325Received : 14/11/2019 ; Accepted: 13/01/2020 ©2020 National Information and Documentation Centre (NIDOC)
Introduction
Desert and uninhabited land represent approximately 95% of the total area of Egypt. Consequently, the majority of the population is concentrated around the Nile River (Shalaby and Moghanm, 2015). Land evaluation is a vital link in the chain leading to sustainable management of land resources. It is assigned the indispensable task of translating the data on land resources into terms and categories, which can be understood and used by all those concerned with land improvement and land use planning. The different types and procedures in land evaluation are gradually being developed. Interpreting soil qualities and site information for the agricultural use and management practices is integrated using
geographical information system (Abowaly et al., 2018 and FAO, 2007).
Thus, the scarcity of cultivated land in Egypt in the Nile Valley and Delta poses a major challenge to land resource planners and managers. The total irrigated area is approximately 5% of the total area of Egyptian land. Population growth requires increased utilization of existing cropland resources to meet the population needs and feed the population, as the rate of population increase is more than 2.1% annually, which is one of the obstacles to sustainable development. Considering the rapid growth of the world’s population, which is in turn a limiting factor to the arable lands around the world, the need for effective and efficient application of croplands is
T he best agricultural land use in the study area of the Banger El-Sokkar region is the aim of this study which was determined by evaluating the characteristics of the soil using a
geographic information system (GIS) and the ALES-arid evaluation program. This information plays an important role in choosing the most suitable crops that can be grown in this study area. The ALES-arid program aims to evaluate the fitness of different land types to produce different crops (field crops, vegetables, forage crops, and fruit trees) to identify the optimum land use based on some pedological variables, such as soil salinity, soil depth, soil reaction (pH), calcium carbonate and soil texture, which are mandatory input factors for crop cultivation. A total of forty-six soil observations were made, covering a total area of 7074.34 ha. The results indicated that the investigated soils were mainly classified as C2, C3 and C4. The quantitative approach given by (FAO, 1976) has also been used to classify areas on the basis of their capability, ranging from good capability (5700.2 ha) to poor capability (500.62 ha) to very poor capability (443.77 ha). Different land suitability classes and indices for several crops were predicted based on the matching between the land qualities and characteristics and crop standard requirements using the ALES-arid program. Classifying the lands on the basis of their suitability, the ranked classes were S1, S2, S3, S4, NS1 and NS2. Finally, all the data obtained were input into ArcGIS software to map the spatial distributions of the different suitability classes.
Key words: Land suitability, Land capability, ALES-arid program, GIS, Pedological variables
Land Evaluation for Crop Production in the Banger El-Sokkar Region of Egypt Using A Geographic Information System and ALES-arid Model Hoda A. Mahmoud1, Ahmed M. A. Binmiskeen1 and Farahat S. Moghanm2*
1Soil and Agriculture Chemistry, Faculty of Agriculture- Saba Basha, Alexandria University2Soil and Water Department, Faculty of Agriculture, Kafr El-Sheikh University, Egypt
Egyptian Journal of Soil Science http://ejss.journals.ekb.eg/
Egypt. J. Soil. Sci. Vol. 60, No. 2, pp. 129-143 (2020)10

130
Egypt. J. Soil. Sci. 60, No. 2 (2020)
HODA A. MAHMOUD et al.
being felt more than ever (Teklu, 2005, Behzad et al., 2009, Moghanm, 2014 and Ahmed, 2016).
Data layers in multi-criteria to evaluate soils and crops, which can be handily, achieved using geographic information system (GIS). Remote sensing and GIS were used in several studies for land capability and suitability mapping (Mohamed et al., 2013, 2014; Saleh and Belal, 2014). Part of the solution to land use problems is land evaluation in support of rational land use planning and appropriate and sustainable use of natural and human resources (Moghanm, et al. 2018 and Rossiter, 1996). Land evaluation is focused on the assessment of land performance when used for specified purposes (FAO, 1976). The main product of land evaluation investigations is a land classification that indicates the suitability of various kinds of land for specific land uses, usually depicted on maps with accompanying reports (FAO, 2008). The using of geographic information system and ALES-arid model capable of analyzing a large number of variables has better the land evaluation (Pereira et al. 2018)
Advanced technologies, such as geographical information systems (GIS) and database management systems (DBMS), are now widely available for data input, analysis, simulation,
and dissemination, which will help planners and decision makers organize information and understand its spatial distribution and hence will provide powerful tools for analysing and synthesizing information (Moghanm 2014 and Yousif, 2014). The Banger El-Sokkar region (approximately 113750 feddans) of western coastal Egypt has recently received attention for increasing agricultural land use. The main goals of this study are to characterize the main soil units and evaluate the land for different land uses throughout the region by coupling GIS and modelling.
Materials and Methods
The El Banger region is located 55 km southwest of Alexandria city. It is surrounded by the Alex-Cairo Desert Road from the east, El-Nasr Canal from the south and the west, and Bahig Canal from the north. This region lies between latitudes 30° 45’ and 30° 55’ N and longitudes 29° 30’ and 29° 50’ E. The El Banger region runs west and northwest, covering approximately 113,750 feddans. The study area is located between latitudes 30° 46’ 30” and 30° 50’ 45” N and longitudes 29° 40’ 15” and 29° 49’ 15” E covering an area of 7074.34 ha (16906.86 acres) (Map 1). The study area includes Bangar El-Sokar Districts, Behira Governorate, Egypt.
Map 1. General location of the study area boundary on a rectified ETM+ Landsat image (2015)

131
Egypt. J. Soil. Sci. 60, No. 2 (2020)
LAND EVALUATION FOR CROP PRODUCTION IN THE BANGER EL-SOKKAR REGION
Forty-six auger samples were georeferenced using GPS to cover the area, and then, they dug out of the ground. The soil samples were collected, and in the laboratory, they were analysed in terms of the soil’s physical, chemical and fertility properties. The locations of the augers are shown in Map 2. The soil physical, chemical and fertility analyses were carried out according to the methods described in (Soil Survey Staff, 2014). The tested soil properties are presented in Table 1.
A Landsat 8 Enhanced Thematic Mapper plus (ETM+) image was acquired in May. The year 2015 was selected to represent the study area as shown in Map (1). Image registration was the first step carried out before any further image processing was conducted. This step assigned coordinate systems to the image and linked it to its location on the ground. The ETM+ image captured in May 2015 was geometrically rectified to the digitized topographic maps using the image-to-map procedure in ENVI 4.8 software (ENVI, 2008). These techniques are often used to produce high resolution, multispectral imagery. Resolution Merge offers three techniques: multiplicative, principal components and Brovey transform (ERDAS, 2008). The study area is covered by topographic map sheets at a scale of 1:50000. ArcGIS software was used to georeference the model in the spatial analysis extension to project a topographic map to the Universal Transverse Mercator (UTM) coordinates (Easting-Northing) system. The digitized contour lines and spot heights were utilized by Contour Gridder extension to generate the digital elevation model (DEM) within the ArcGIS 10.3 environment. The DEM was analysed to generate the
degree of the slope classes and aspect. The data input process involved entering the spatial and non-spatial data into GIS using ArcGIS 10.3 software. Each soil observation was georeferenced using the GPS and digitized. The different soil attributes were coded, and new fields were added to the profile database file in ArcView software. Surface interpolated grids were constructed for soil salinity, soil depth, and CaCO3% using module Arc Scripts in ArcGIS 10.3 (ESRI, 2014).
Soil unitsMap overlay is the hallmark of GIS. It can be
performed in two ways, either using a vector or raster data. In comparison to using a vector, using the raster operation is preferred because it involves an easier calculation using a map calculator. An additional operation was used to overlay the reclassified maps of soil salinity, calcium carbonate content, soil texture, and profile depth to explain soil complexity and variability and to evaluate the land for specific uses.
Land evaluationThe applied land evaluation system for arid
regions (ALES-arid) is a new approach for assessing land capability and suitability. The ALES-Arid is described as a land use decision support system that is linked directly with integrated databases and coupled indirectly (loose coupling) with GIS. Through the ALES-arid program, land evaluation algorithms are expressed in notation form that can be understood by a calculating device. Optimization tools based on land evaluation models are considered very important to formulating decision alternatives. The calculation of the capability index by ALES-arid is an indication
Map 2. Soil auger sample distribution in the districts of the study area

132
Egypt. J. Soil. Sci. 60, No. 2 (2020)
HODA A. MAHMOUD et al.
of land capability according to the multiplication method. Three main groups of parameters were included: soil physical and chemical parameters, soil fertility parameters, and water irrigation parameters. Land capability and suitability evaluations have been performed using ALES-arid as shown in Fig. 1 (Abd El-Kawy et al., 2010 and Sharififar, 2012).
Loose coupling of GIS and the ALES-arid model involved the use of GIS for the task for which it is best suited: generation and organization of input
data as well as display of output data (Fig. 1). In this strategy, output from GIS was organized as input to the model, and output from the model was subsequently submitted to the GIS for display (Tim, 1996, Ismail, Yacoub, 2012 and Elsheikh et al. 2013).
Descriptive statistical parametersThe minimum, maximum, mean, standard
deviation and coefficient of variance were calculated using SPSS for Windows Ver. 12 (SPSS, 2003).
Fig. 1. The structure of ALES-arid GIS. Shows the model steps (Land evaluation processes), and the represents the GIS framework (ArcMap platform)

133
Egypt. J. Soil. Sci. 60, No. 2 (2020)
LAND EVALUATION FOR CROP PRODUCTION IN THE BANGER EL-SOKKAR REGION
Results and Discussion
Land surface analysesThe DEM of the studied area contributed to
the storage of elevation data as a digital and 3-D map (Map 3). The primary advantage of GIS is its ability to process elevation data in a digital format and obtain valuable information about the land surface (Carter, 1988). The DEM was obtained from the digital contour map using an interpolation technique. The elevation of the study area ranged from 16 m A.S.L. at the eastern part to 65 m A.S.L. at the centre and west of the study area.
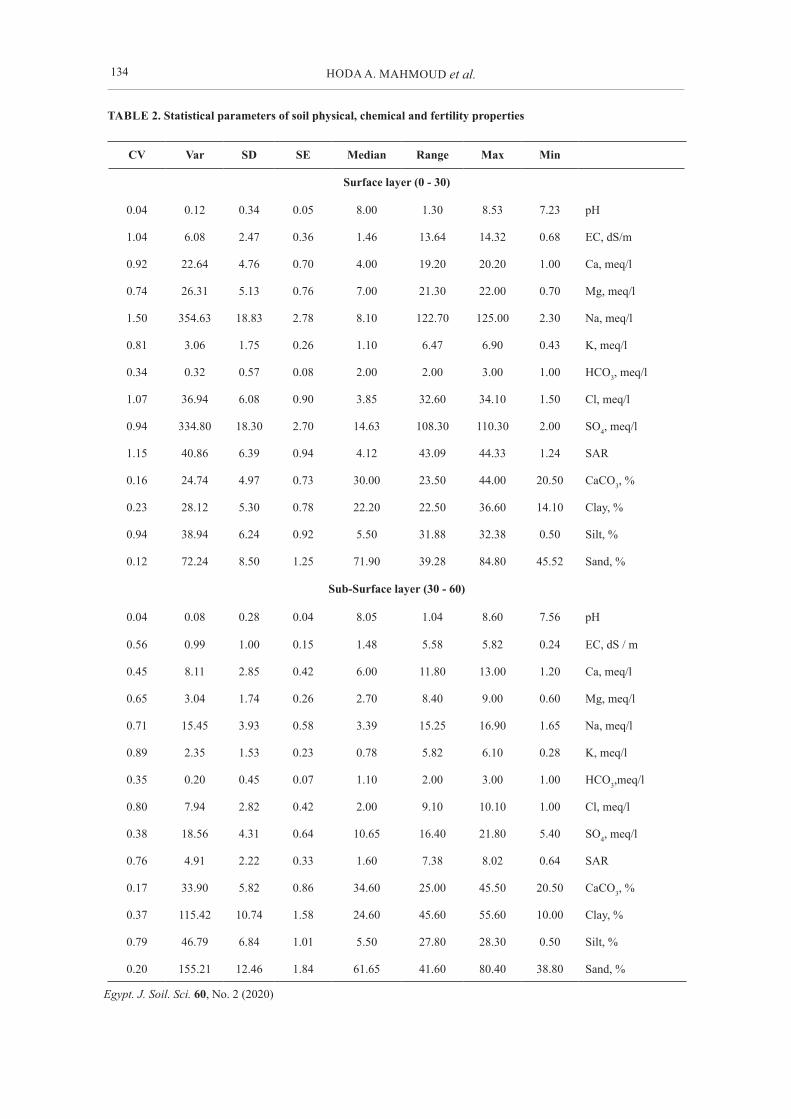
Descriptive statistical estimatesThe descriptive statistical analysis for the main
variables in the studied area is summarized in
Tables 1 and 2. The soil depth ranged from 40 cm to 120 cm, with a median value of approximately 70 cm. The coefficient of variation for the soil depth (0.30) shows that the soil depth was homogeneous in the study area. The soil salinity ranged from 0.68 to 14.32 dS/m and 0.24 to 5.82 dS/m in the surface and sub-surface layers, with median values of 1.46 and 1.48 dS/m, respectively. On the other hand, the coefficient of variation was less homogeneous for surface soil salinity and the sub-surface layer (1.04 and 0.56, respectively). Homogeneity properties were observed with sand%, clay%, and CaCO3% (0.12, 0.23, and 0.16, respectively) for the surface layer and (0.20, 0.37, and 0.17) for the sub-surface layer. In comparison to the other soil types, silt had less homogeneity (0.94 and 0.79) in the surface and sub-surface layers, respectively.
Map 3. Digital elevation model (DEM) of the study area.
TABLE 1. Statistical parameters of soil depth.
PropertiesMinMaxRangeMedianSESDVarCV
Soil depth, cm4012080703.49523.702561.80.30
134
Egypt. J. Soil. Sci. 60, No. 2 (2020)
HODA A. MAHMOUD et al.
TABLE 2. Statistical parameters of soil physical, chemical and fertility properties
MinMaxRangeMedianSESDVarCV
Surface layer (0 - 30)
pH7.238.531.308.000.050.340.120.04
EC, dS/m0.6814.3213.641.460.362.476.081.04
Ca, meq/l1.0020.2019.204.000.704.7622.640.92
Mg, meq/l0.7022.0021.307.000.765.1326.310.74
Na, meq/l2.30125.00122.708.102.7818.83354.631.50
K, meq/l0.436.906.471.100.261.753.060.81
HCO3, meq/l1.003.002.002.000.080.570.320.34
Cl, meq/l1.5034.1032.603.850.906.0836.941.07
SO4, meq/l2.00110.30108.3014.632.7018.30334.800.94
SAR1.2444.3343.094.120.946.3940.861.15
CaCO3, %20.5044.0023.5030.000.734.9724.740.16
Clay, %14.1036.6022.5022.200.785.3028.120.23
Silt, %0.5032.3831.885.500.926.2438.940.94
Sand, %45.5284.8039.2871.901.258.5072.240.12
Sub-Surface layer (30 - 60)
pH7.568.601.048.050.040.280.080.04
EC, dS / m0.245.825.581.480.151.000.990.56
Ca, meq/l1.2013.0011.806.000.422.858.110.45
Mg, meq/l0.609.008.402.700.261.743.040.65
Na, meq/l1.6516.9015.253.390.583.9315.450.71
K, meq/l0.286.105.820.780.231.532.350.89
HCO3,meq/l1.003.002.001.100.070.450.200.35
Cl, meq/l1.0010.109.102.000.422.827.940.80
SO4, meq/l5.4021.8016.4010.650.644.3118.560.38
SAR0.648.027.381.600.332.224.910.76
CaCO3, %20.5045.5025.0034.600.865.8233.900.17
Clay, %10.0055.6045.6024.601.5810.74115.420.37
Silt, %0.5028.3027.805.501.016.8446.790.79
Sand, %38.8080.4041.6061.651.8412.46155.210.20

135
Egypt. J. Soil. Sci. 60, No. 2 (2020)
LAND EVALUATION FOR CROP PRODUCTION IN THE BANGER EL-SOKKAR REGION
Soil units of the studied areaSoil mapping units of the study area were
extracted from the overlay of the main soil properties, such as soil depth, soil salinity and total calcium carbonate, in ArcGIS 10.3. Eleven soil units were identified in the studied area as shown in Map 4, and Table 3 includes the area in terms of the hectares, percentage of each soil unit.
The soils were classified into four main soil units and eleven sub-units based on diagnostic
horizons and variability, soil salinity, calcium carbonate content, soil texture, and profile depth as follows:
1- The non-saline soil unit was 45.62%, and the saline soil unit was 5.44% of the studied area.
2- The extremely calcareous, deep soil sub-unit was (2196.04 ha) 31.02%, and the highly calcareous, deep soil sub-unit was (80.14 ha) 1.13%, as shown in Table 3 and Map 4.
Map 4. Soil mapping unit distribution in the study area
TABLE 3. Soil units of the studied area
CodeDescriptionArea (ha)%
Non-saline 1101Highly calcareous, Modestly deep225.0713.181102Highly calcareous, Deep1247.0017.622101Extremely calcareous, Deep1509.3421.322102Extremely calcareous, Modestly deep247.843.50
Total 3229.25145.62 Slightly Saline
1201Highly calcareous, Modestly deep275.553.89
1202Highly calcareous, Deep419.845.932201Extremely calcareous, Modestly deep129.371.832202Extremely calcareous, Deep2196.0431.02
Total3020.842.67 Saline
1302Highly calcareous, Deep80.141.132302Extremely calcareous, Deep305.064.31
Total690.265.44 Highly Saline
2401Extremely calcareous, Modestly deep443.776.27

136
Egypt. J. Soil. Sci. 60, No. 2 (2020)
HODA A. MAHMOUD et al.
Evaluation parametersLand capability classesThe ALES (applied land evaluation system)
model provides predictions for general land use capabilities for a broad series of possible uses and indicates the limiting factors on the covered area. Map 5) shows the distribution of each land use capability class in the studied area. According to the model prediction, most of the study area was classified as (C2, C2 (ca)), which indicated good capability with a high calcium carbonate percentage as a limiting factor that covered approximately 5700.2 ha, followed by (C2 (sd)), which indicated very good capability with soil depth class as a limiting factor that covered approximately 500.62 ha. On the other hand, 443.77 ha are (C4 (ca, al, ece)), which indicated a poor capability with a high calcium carbonate percentage, alkalinity and soil salinity as limiting factors.
Land suitability classes for specific land usesThe ALES model was used to predict soil
suitability for some common crops cultivated in the study area, including wheat, maize, alfalfa, fava bean, onion, tomato, banana, citrus, fig and watermelon. The soil suitability class and sub-class data are presented in Maps 6, 7, 8, 9, 10, 11, 12 and 13 and Table (4), which indicates the distribution of suggested cultivated crops for each soil unit in the studied area.
The suitability maps have five proposed suitability categories, namely, S1, S2, S3, S4 and Ns. From the obtained maps for the different crops, the obtained results can be summarized as follows:a. Field crops
1- Suitability classes of sunflower were S1 (3785.52 ha) (53.38%) and S3 (443.77 ha) (6.27%).
2- Suitability classes of wheat were S1 (1247.0) (17.62%), S1 (t) (5388.25) (76.12%), and S2 (ece, t) (433.70 ha) (6.13%).
b. Vegetables1- Suitability classes of tomato were S1 (6330.19
ha) (89.42%), S2 ece (305.06 ha) (4.31%) and S4 (ece, Ca) (443.77 ha) (6.27%).
2- Suitability classes of watermelon were S1 (6200.82 ha) (87.59%), S2 (129.37 ha) (1.83%), S2 (ece) (305.06 ha) (4.31%) and S4 (ece) (443.77 ha) (6.27%).
c. Fruit trees:1- Suitability classes of banana were S3 (t, Ca)
(2276.18 ha) (32.15%), S3 (t, Ca, sd) (1509.34 ha) (21.32%), S4 (ece, t, Ca) (305.06 ha) (4.31%), Ns2 (sd) (2544.67 ha) (35.95%) and Ns2 (sd, Ca) (443.77 ha) (6.27%).
2- Olive suitability classes were S1 (2581.24 ha) (36.46%), S1 (sd) (1509.34 ha) (21.32%), S4 (ece, sd) (443.77 ha) (6.27%) and Ns2 (sd) (2544.67 ha) (35.95%).
3- Grape suitability classes were S1 (3785.52 ha) (53.48%), S2 (sd) (1914.68 ha) (27.05%), S2 (ece) (305.06 ha) (4.33%) and Ns2 (1073.76 ha) (15.17%).
4- Suitability classes of apple were S1 (2196.04 ha) (31.02%), S2 (80.14 ha) (1.13%), S2 (ece) (305.06 ha) (4.31%) and Ns2 (sd) (2988.44 ha) (42.22%).
Map 5. Land capability classes in the study area.

137
Egypt. J. Soil. Sci. 60, No. 2 (2020)
LAND EVALUATION FOR CROP PRODUCTION IN THE BANGER EL-SOKKAR REGION
TABLE 4. Land suitability classes for specific usesUnit code11011102210121021201120222012202130223022401
Soil _ClassC2(sd)
C2C2(ca)
C2(ca)
C2(sd)
C2C3(sd, ca)
C2(ca)
C2C2(t, ca,ece)
C4(ca, al, ece)
WheatS1(t)
S1S1(t)
S1(t)
S1(t)
S1(t)
S1(t)
S1(t)
S1(t)
S1(t)
S2(ece, t)
BarleyS1(t)
S1S1(t)
S1(t)
S1(t)
S1(t)
S1(t)
S1(t)
S1(t)
S2(t)
S2(t)
Fava_beanS2S1S2S1S2S2S2S1S2(ece)S3 (ece, t)S4
(ece)
Sugar beetS1S1S1S1S1S1S1S1S1S2(t)S3
SunflowerS3(sd)
S1(sd)
S2(sd)
S1S3(sd)
S2(sd)
S3(sd)
S1S1S1(t)
S2(sd)
RiceS1(t)
S1S1(t)
S1(t)
S1(t)
S1(t)
S1(t)
S1(t)
S1(t)
NS2(t)
S3(ece, t)
MaizeS1S1S1S1S1S1S2S1S1S2(ece, t)
S4(ece)
Soy beanS3(sd)
S2(sd)
S2(sd)
S2S3(sd)
S2(sd)
S3(sd)
S1S2(ece)
S3(ece, t)
S4(ece, sd)
PeanutS3(ca)
S3(ca)
S3(ca)
S3(ca)
S3(ca)
S3(ca)
S3(ca)
S3(ca)
S3(ca)
S4(ece, ca)
S4(ece, ca)
CottonS3(sd)
S1(sd)
S2(sd)
S1S3(sd)
S2(sd)
S3(sd)
S1S1S2(t)
S3(sd)
SugarcaneS3(sd, t)
S2(sd)
S2(sd, t)
S2(t)
S3(sd, t)
S2 (sd,
t)
S3(sd, t)
S1(t)
S1(t)
S2(t)
S3 (ece, sd, t)
CitrusNS2(sd, ca)
NS2(sd,ca)
NS2(sd, ca)
NS2(ca)
NS2(sd,ca)
NS2
sd,ca)
NS2 (sd, ca)
NS2(ca)
NS2 (ca)
NS2(ca)
NS2(sd, ca)
BananaNS2(sd)
NS2(sd)
NS2(sd)
S3(sd, t, ca)
NS2(sd)
NS2(sd)
NS2(sd)
S3(t, ca)
S3(t, ca)
S4(ece, t, ca)
NS2(sd)
GrapeNS2(sd)
S2(sd)
S2(sd)
S1NS2(sd)
S2(sd)
NS2(sd)
S1S1S2(ece)
S4 (ece, sd)
OliveNS2(sd)
NS2(sd)
NS2(sd)
S1(sd)
NS2(sd)
NS2(sd)
NS2(sd)
S1S1S1NS2(sd)
AppleNS2(sd)
NS2(sd)
NS2(sd)
S2(sd)
NS2(sd)
NS2(sd)
NS2(sd)
S1S2S3(ece, t)
NS2(sd)
PearNS2(sd)
NS2(sd)
NS2(sd)
S2 (sd, t)
NS2(sd)
NS2(sd)
NS2(sd)
S2(t)
S2(t)
S3(ece, t)
NS2(sd)
FigNS2(sd)
NS2(sd)
NS2(sd)
S1(sd)
NS2(sd)
NS2(sd)
NS2(sd)
S1S1S1NS2(sd)
Date_palmNS2(sd)
NS2(sd)
NS2(sd)
S1(sd)
NS2(sd)
NS2(sd)
NS2(sd)
S1S1S1NS2(sd)
OnionS1S1S2S1S1S2S2S1S2 (ece)
S3(ece, t)
S3(ece)
CabbageS1S1S1S1S1S1S2S1S1S2(ece, t)
S3(ece)
PeaS2S1S2S1S2S2S2S1S2(ece)
S3(ece, t)
S3(ece)
PotatoS3(ca)
S3(ca)
S3(ca)
S3(ca)
S3(ca)
S3(ca)
S3(ca)
S3(ca)
S3(ca)
S3(ece, ca)
S4(ece, ca)
TomatoS1S1S1S1S1S1S1S1S1S2(ece)S3(ece)
PepperS1S1S1S1S1S1S1S1S1S2 (ece)S4 (ece)
WatermelonS1S1S1S1S1S1S2S1S1S2(ece)
S4(ece)
AlfalfaS1S1S1S1S1S1S1S1S1S1S2(ece)
SorghumS1S1S1S1S1S1S2S1S1S2(t)
S4(ece)

138
Egypt. J. Soil. Sci. 60, No. 2 (2020)
HODA A. MAHMOUD et al.
Unit code11011102210121021201120222012202130223022401
Soil _ClassC2(sd)
C2C2(ca)
C2(ca)
C2(sd)
C2C3(sd, ca)
C2(ca)
C2C2(t, ca,ece)
C4(ca, al, ece)
WheatS1(t)
S1S1(t)
S1(t)
S1(t)
S1(t)
S1(t)
S1(t)
S1(t)
S1(t)
S2(ece, t)
BarleyS1(t)
S1S1(t)
S1(t)
S1(t)
S1(t)
S1(t)
S1(t)
S1(t)
S2(t)
S2(t)
Fava_beanS2S1S2S1S2S2S2S1S2(ece)S3 (ece, t)S4
(ece)
Sugar beetS1S1S1S1S1S1S1S1S1S2(t)S3
SunflowerS3(sd)
S1(sd)
S2(sd)
S1S3(sd)
S2(sd)
S3(sd)
S1S1S1(t)
S2(sd)
RiceS1(t)
S1S1(t)
S1(t)
S1(t)
S1(t)
S1(t)
S1(t)
S1(t)
NS2(t)
S3(ece, t)
MaizeS1S1S1S1S1S1S2S1S1S2(ece, t)
S4(ece)
Soy beanS3(sd)
S2(sd)
S2(sd)
S2S3(sd)
S2(sd)
S3(sd)
S1S2(ece)
S3(ece, t)
S4(ece, sd)
PeanutS3(ca)
S3(ca)
S3(ca)
S3(ca)
S3(ca)
S3(ca)
S3(ca)
S3(ca)
S3(ca)
S4(ece, ca)
S4(ece, ca)
CottonS3(sd)
S1(sd)
S2(sd)
S1S3(sd)
S2(sd)
S3(sd)
S1S1S2(t)
S3(sd)
SugarcaneS3(sd, t)
S2(sd)
S2(sd, t)
S2(t)
S3(sd, t)
S2 (sd,
t)
S3(sd, t)
S1(t)
S1(t)
S2(t)
S3 (ece, sd, t)
CitrusNS2(sd, ca)
NS2(sd,ca)
NS2(sd, ca)
NS2(ca)
NS2(sd,ca)
NS2
sd,ca)
NS2 (sd, ca)
NS2(ca)
NS2 (ca)
NS2(ca)
NS2(sd, ca)
BananaNS2(sd)
NS2(sd)
NS2(sd)
S3(sd, t, ca)
NS2(sd)
NS2(sd)
NS2(sd)
S3(t, ca)
S3(t, ca)
S4(ece, t, ca)
NS2(sd)
GrapeNS2(sd)
S2(sd)
S2(sd)
S1NS2(sd)
S2(sd)
NS2(sd)
S1S1S2(ece)
S4 (ece, sd)
OliveNS2(sd)
NS2(sd)
NS2(sd)
S1(sd)
NS2(sd)
NS2(sd)
NS2(sd)
S1S1S1NS2(sd)
AppleNS2(sd)
NS2(sd)
NS2(sd)
S2(sd)
NS2(sd)
NS2(sd)
NS2(sd)
S1S2S3(ece, t)
NS2(sd)
PearNS2(sd)
NS2(sd)
NS2(sd)
S2 (sd, t)
NS2(sd)
NS2(sd)
NS2(sd)
S2(t)
S2(t)
S3(ece, t)
NS2(sd)
FigNS2(sd)
NS2(sd)
NS2(sd)
S1(sd)
NS2(sd)
NS2(sd)
NS2(sd)
S1S1S1NS2(sd)
Date_palmNS2(sd)
NS2(sd)
NS2(sd)
S1(sd)
NS2(sd)
NS2(sd)
NS2(sd)
S1S1S1NS2(sd)
OnionS1S1S2S1S1S2S2S1S2 (ece)
S3(ece, t)
S3(ece)
CabbageS1S1S1S1S1S1S2S1S1S2(ece, t)
S3(ece)
PeaS2S1S2S1S2S2S2S1S2(ece)
S3(ece, t)
S3(ece)
PotatoS3(ca)
S3(ca)
S3(ca)
S3(ca)
S3(ca)
S3(ca)
S3(ca)
S3(ca)
S3(ca)
S3(ece, ca)
S4(ece, ca)
TomatoS1S1S1S1S1S1S1S1S1S2(ece)S3(ece)
PepperS1S1S1S1S1S1S1S1S1S2 (ece)S4 (ece)
WatermelonS1S1S1S1S1S1S2S1S1S2(ece)
S4(ece)
AlfalfaS1S1S1S1S1S1S1S1S1S1S2(ece)
SorghumS1S1S1S1S1S1S2S1S1S2(t)
S4(ece)
(Classes): C1=Excellent, C2=Good, C3=Fair, C4=Poor, C5=Very poor, C6=Non-agriculture. S1=Highly suitable, S2=Moderately suitable, S3=Marginally suitable, S4=Conditionally suitable. NS1=Potentially suitable, NS2= Actually unsuitable.(Soil Sub-Classes): t=Clay, sd=Soil depth, ca=CaCo3, ece=Soil salinity.
TABLE 4. Cont.

139
Egypt. J. Soil. Sci. 60, No. 2 (2020)
LAND EVALUATION FOR CROP PRODUCTION IN THE BANGER EL-SOKKAR REGION
Map 6. Land suitability for sunflower
Map 7. Land suitability for tomato
Map 8. Land suitability for wheat

140
Egypt. J. Soil. Sci. 60, No. 2 (2020)
HODA A. MAHMOUD et al.
Map 9. Land suitability for watermelon.
Map 10. Land suitability for banana.
Map 11. Land suitability for grape.

141
Egypt. J. Soil. Sci. 60, No. 2 (2020)
LAND EVALUATION FOR CROP PRODUCTION IN THE BANGER EL-SOKKAR REGION
Conclusion
The target of this study was to evaluate the soil evaluation include soil capability and suitability of Banger El-Sokkar region for crop production and recognize the causes that prevent the cultivation progression. Geographic Information System (GIS) and ALES-arid model were significant to identify soil evaluation for crop production throw compute system that intended to automate the evaluation progress. The most of studied soils were classified into two capability classes (C2 and C3) according to the results of ALES-Arid program. The common dominant limitation soil capability factors were soil depth, calcium carbonate, soil salinity and clay. The obtained results play an essential role in indicating the most suitable crops in this study area. Land evaluation helps decision makers in sustainable management of agricultural resources.
References
Abd El-Kawy OR, Ismail HA, Rod JK, Suliman AS. (2010) A developed GIS-based land evaluation model for agricultural land suitability assessments in arid and semi arid regions. Res. J. Agric. Biological Sci., 6 (5), 589-599.
Abowaly M.E., Moghanm F.S., El Nahry A.H., Shalaby A., and Khedr H.S. (2018) Assessment of land use changes and its impact on Agricultural soils in North Nile Delta region of Egypt using GIS and remote sensing. Egyptian Journal of Soil Science, 58, 3, pp. 359-372,
Ahmed, M.A.E. (2016) Land Evaluation of Gharb El-Mawhob Area, El Dakhla Oasis, New Valley, Egypt. M.Sc. Thesis, Faculty of Agriculture, Assiut University, Assiut, Egypt.
Map 12. Land suitability for olive
Map 13. Land suitability for apple

142
Egypt. J. Soil. Sci. 60, No. 2 (2020)
HODA A. MAHMOUD et al.
Behzad M, Algaji M, Papan P, Boroomand S, Naseri AA, Bavi A. (2009) Qualitative Evaluation of Land Suitability for Principal Crops in the Gargar Region, Khuzestan Province, Southwest Iran. Asian J. Plant Sci., 8 (1), 28-34.
Carter JR. (1988) Digital representation of topographic surfaces. PE&RS., 54 (11), 1577-1580.
Elsheikh, R., Abdul Rashid, B., Shariff, M., Amiri, F., Noordin, B.A., Balasundram, S. K., Mohd Soom, M.A. (2013) Agriculture Land Suitability Evaluator (ALSE): A decision and planning support tool for tropical and subtropical crops. Computers and Electronics in Agriculture, 93, 98-110.
ENVI. (2008) The Environment for visualizing images, version 4, Colorado, USA.
ERDAS. (2008) Geographic imaging Made Simplesm. ERDAS Version 8.50 Inc. Atlanta, Georgia.
ESRI. (2014) Arc-GIS 10.3 spatial analyst. Redlands. CA, USA.
FAO (1976) framework for land evaluation. Soils Bulletin No. 32. FAO, Rome.
FAO (2007) “Land Evaluation, Towards A Revised Framework”
FAO (2008) Guidelines: land evaluation for irrigated agriculture, Natural Resources Management and Environment Department. http://www.fao.org/.
Ismail, M., Yacoub, R.K. (2012) Digital soil map using the capability of new technology in Sugar Beet area, Nubariya, Egypt. The Egyptian Journal of Remote Sensing and Space Sciences, 15, 113-124.
Moghanm, F.S. (2015) Assessment of Sustainable Agricultural Land Management by Using GIS Techniques in North Delta, Egypt. Egypt. J. Soil Sci. 55 No. 4, pp. 409-424.
Moghanm, F.S. (2014) Land Capability Assessment by Using Geographic Information System in North Delta, Egypt. Egypt. J. Soil Sci. 54 (3), 209-227
Moghanm F.S., Darwish A.Y., Ekhlas M. Elwakel1, El Shahawy M.I. and A. Shalaby (2018) Sustainable Land Management Using Spatial Analyst in North Nile Delta Soil, Egypt. Egypt. J. Soil. Sci. 58, 4, pp. 435-442.
Mohamed, E.S., Belal, A.A., Saleh, A.M. (2013)Assessment of land degradation east of the Nile Delta, Egypt, using remote sensing and GIS techniques. Arabian J. Geosci. 6 (8), 2843-2853.
Pereira, P., Brevik, E., Trevisani, S. (2018) Mapping the Environment. Sci. Total Environ. 610, 17-23.
Rossiter DG. (1996) A theoretical frame work for land evaluation. Geoderma, 72 (3-4), 165-190.
Saleh, A.M., Belal, A.A. (2014) Delineation of site-specific management zones by fuzzy clustering of soil and topographic attributes: a case study of East Nile Delta, Egypt. In: 8th International Symposium of the Digital Earth (ISDE8). IOP Conf. Series: Earth and Environmental Science 18, (2014) 012046. IOP Publishing.
Shalaby, A. and Moghanm, F.S. (2015) Assessment of urban sprawl on agricultural soil of northern Nile Delta of Egypt using RS and GIS. Chinese Geogr. Sci., 25, 274-282.
Sharififar, A. (2012) Assessment of different methods of soil suitability classification for wheat cultivation. J. Agrobiol., 29, 47-54.
SPSS (2003) for windows. Copyright, Version (12), standard license.
Teklu EJ. (2005) Land Preparation Methods and Soil Quality of a Vertisol Area in the Central Highlands of Ethiopia. PhD Thesis Universitat Hohenheim; (310), D- 70593 Stuttgart.
Tim US. (1996) Coupling vadoz zone with GIS: emerging trends and potential bottlenecks. J. Environmental Quality, 25 (3), 535-544.
Soil Survey Staff, (2014) Soil Survey Field and Laboratory Methods Manual. Soil Survey Investigations Report No. 51, Version 2.0. Manual, Natural Resources Conservation Service, U.S. Department of Agriculture.
Yousif, I.A.H. (2014) Land Evaluation and Sustainable Development of Some Areas of Dakhla Oasis, Egypt. Ph.D. Thesis, Faculty of Agriculture, Cairo University, Egypt.

143
Egypt. J. Soil. Sci. 60, No. 2 (2020)
LAND EVALUATION FOR CROP PRODUCTION IN THE BANGER EL-SOKKAR REGION
تقييم الأراضي لإنتاج المحاصيل في منطقة بنجر السكر - مصر باستخدام نظام المعلومات ALES-arid الجغرافية ونموذج
هدى محمود1 ، أحمد محمد بن مسكين1 و فرحات مغنم21قسم الاراضى والكيمياء الزراعية - كلية الزراعة سابا باشا - جامعة الإسكندرية - مصر
2قسم الاراضي والمياه - كلية الزراعة - جامعة كفر الشيخ - مصر
السكر بنجر منطقة الدراسة وهى منطقة في الزراعية للأراضي استخدام أفضل تحديد تم ، الدراسة هذه في ALES-arid التقييم الجغرافية (GIS) وبرنامج المعلومات باستخدام نظام التربة تقييم خصائص من خلال . تلعب هذه المعلومات دورًا مهمًا في اختيار أنسب أنواع المحاصيل التي يمكن زراعتها في منطقة الدراسة. برنامج ALES-arid يهدف إلى تقييم مدى ملاءمة أنواع الأراضي المختلفة لإنتاج محاصيل مختلفة )المحاصيل الحقلية ومحاصيل الخضروات والأعلاف وأشجار الفاكهة( لتحديد الاستخدام الأمثل للأراضي بناءً على بعض المتغيرات البيدولوجية، مثل ملوحة وعمق التربة ، تفاعل التربة )الرقم الهيدروجيني( ، كربونات الكالسيوم وقوام التربة، والتي تعتبر عوامل المدخلات إلالزامية لزراعة المحاصيل. تم تحديد ست وأربعين نقطة ملاحظة للتربة ، تغطي مساحة إجمالية قدرها 7074.34 هكتار. أشارت النتائج إلى أن التربة التي تم فحصها قد تم تصنيفها بشكل أساسي على أنها C2 و C3 و C4 . كما تم استخدام النهج الكمي الذي قدمته )منظمة الأغذية والزراعة ، 1976( لتصنيف المناطق على أساس قدرتها الانتاجية، والتي تتراوح من القدرة الجيدة )5700.2 هكتار( إلى القدرة الفقيرة )500.62 هكتار( إلى القدرة الفقيرة جدا )443.77 هكتار(. تم التنبؤ بفئات مختلفة وعوامل ملاءمة الأرض للعديد من المحاصيل بناءً على المواءمة بين قدرة الأرض وخصائصها والمتطلبات المعيارية للمحاصيل باستخدام برنامجALES-arid . تصنيف الأراضي على أساس ملاءمتها للمحاصيل المختلفة، وكانت المراتب التقسيمية NS1 ، S4 ، S3 ، S2 ، S1وNS2 . أخيرًا ، تم إدخال جميع البيانات التي تم الحصول عليها من تقييم مدى ملاءمة الأرض للمحاصيل المختلفة في برنامج ArcGIS لرسم خرائط التوزيعات المكانية
للمحاصيل لمختلف درجات الملاءمة.