t kege - aquatic commonsaquaticcommons.org/20808/1/annual reports on fish.pdf · t ric t s h a...
TRANSCRIPT
t .~ •
• f
. .;
,-\ \ :.; CAL R[ POp. I 0 \ [' I_~_t1 PEO DleT T0 \ L AKEG E0 RGE . ED~ARD A\Q KAZI\G.\
CHA\ \ El ( I'~ I CH. ~,' ,\:Vl P-\__. Rt GI 0 ~ j 1 9 9 J I 9.+. ._____.. ...__ .__~i. "_______
INTRODUCTION: ,J.!. (R~ I:l00;).. "
This report gives details of catch assessment statistics of Lakes
George, Edward and Kazinga channel plus minor Lakes in western
Cganda. Eight districts are covered namely:- Kasese,Bushenyi,
Rukungiri, Kabarole, Ntungamo, Nbarara, Kabale and Kisoro. Of the
eight districts major lake fishery is in the first four, the rest
, have minor lake fishery as shown below:- \tunagmo- I Nyabihoko
and Nyakiyanja), Mbarara- Mburo, Kachere and \akivalel,
Kisolo-I Mutanda, ~ulehe, Chahafi and Kayumbu) and Kabale I Lake
Bun}o ny i ) . Da tao n La ke Bun yon y i was not a vail a b1e for bot h
1993/94; howe verr e p 0 r t s say f e \'1 C1a ria s \\ a s c augh t us i ng bas ke t
traps and hooks.
METHODOLOGY USED TO ARRIVE AT THE ESTIMATES:
For every dist.rict and for each year the monthly data in L~eld
m0 nth 1:-.-' rep 0 r t s \'i a s comput e d for \'1 e i gh tand val ue, a \. era geKe i g h t
and value for each specie was calculated. ,-\verages for each
s pe c i e I,' ere mu1 tip 1 i e d b:-." t weI vet 0 get the ann ua 1 :--' i e 1d s I I': e i g h t
and value). The annual yields for each specie were summed to ge;:
P,L I {J1.Z.o5 (& ~b!J N-..~~
f\CC- . 2q b ir
the estimatc!c! dnnual total. (:!stimated annual totals for ::he IOu'
d .i. s t ric t s s h a l' 1. ng ~ a k e s Ge 0 l' g e , E(11: a t dand K E", Z i ng a c han n e 1 ,iere
sUl1imt:!d to get annual production for the ;najor lake fisber~';
totals for all the districts ,:ere summed to getEstimated arlnual
an estimation for the ,·:hole region( major and minor lake
fi~)het':\l) .
RESULTS ( Fish production by District)- MAJOR LAKE FISHERY:
The major fish species in the region are Tilapia, Bagrus,
Clarias, Barbus, Labeo and MOrW\Tus. Bagrus dominated the catches
in almost all the four districts, followed by Tilapia. Labeo and
found at Rwenshama landing inMormyrus are rare and mostly
Overall Bagrus produced .+1 %,Rukrgiri district. (see figure 1).
I .
foljO\\'ed by Oreochromis 31.8 %, Protopterus 19.2 %, Clarias 7.3 %
of the totaland others 0.34% Rukungiri produced 42.3 %
while Kasese produced 21 %,Bagrus produced in the region
Comparing EH"oduction fromKabarole 20 ~~ alld Bushenyi 15.7 %
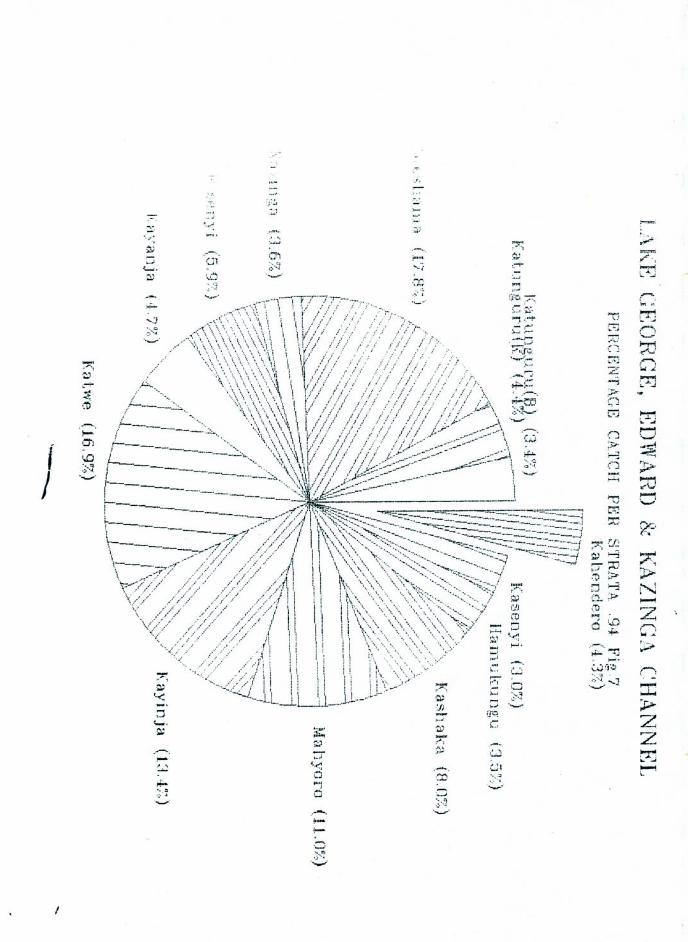
Edward and Kazingathe four districts surrounding Lakes George,
Channel, percentage catch per district shows that Kasese district
produced b:--' the lakesproduced 37.3 % of the total fish
% , Bushenyi 20.7 and Rukungiri 17.8 %followed by Kabarole 24.1
I see fig.6 and table 71g I.
2
/
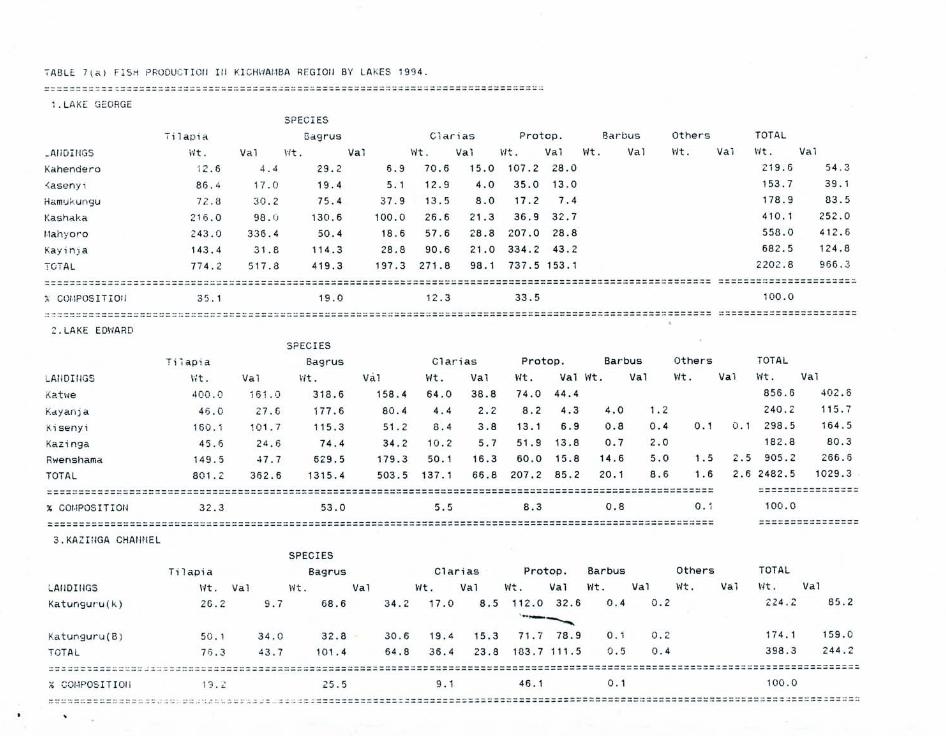
Lake George alone produced 2,202.8 tonnes valued at 966 million
l:g..tnJa shillings, La ke Ed \"i a r d p r oJ d uc e d :2, 482 .:; t (l nne s val ue d a t
102~1.3 million Cganda shil"lings. and Kazinga channel produced
398.3 t,)nnes valued at 244.2 million Cganda shillings.
The do min ant s pee i e i n La keGe 0 r g e ~..' a s Til apia \'i i t h 3 5 . :2 %
species composition, follov;ed b~' Protopterus 33.5 %, Bagru5 19 %
, Clarias 12.3 % ( see Fig. 8 l.
The dominant specie in Lake Edward was Bagrus 'idth 53 % species
composition, followed by Tilapia 32.3 %, Protopterus 8.3 % , and
Barbus 0.8 % ( see Fig. 9 l.
The dominant specie in Kazinga channel was Protopterus 46 %
species composition, followed by Bagrus 25.5 % , Tilapia 19.2 %
Bar~s and others 0.1 %(see Fig.10 l.
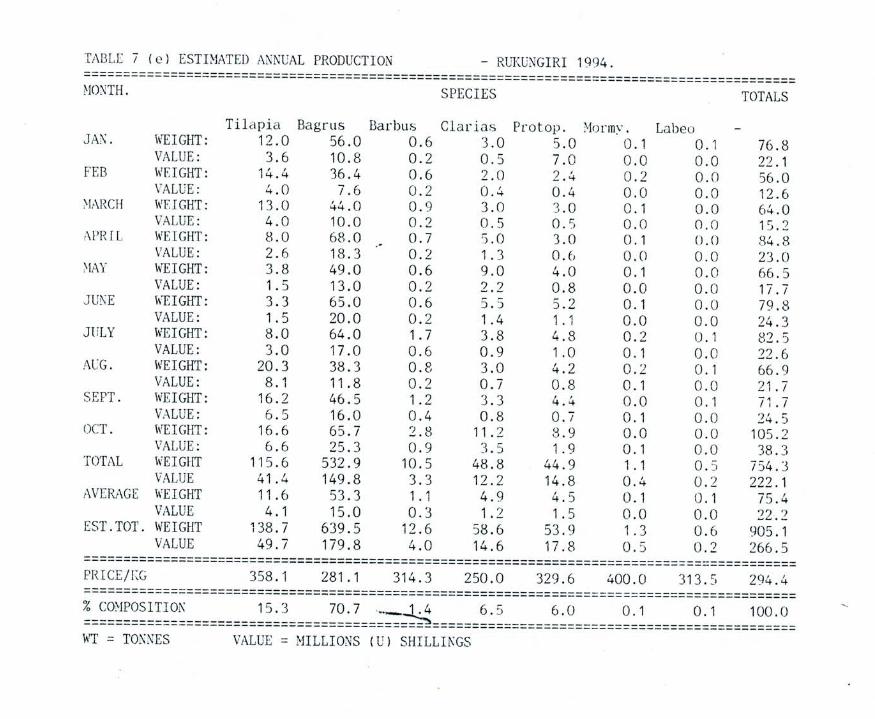
J RUKUNGIRI DISTRICT:
The district produced a total of 905 tonnes valued at 266 million
Cganda shillings in 1994, compared to 1,177 tonnes valued at 220
million Uganda shillings in 1993.
The major fish specie was Bagrus which contributed more than
three quarters of the total fish produced 70.7 % species
composi t ion) , £ollo~ed by Oreochromis ~i[h 15.3 % , Clarias 6.5
%s, Prolopterus 6 %, and Barbus 1.:' % (see Table 7(e) and figure
2. l
3
The r e \.. a '5 dec 1 i ne i n f ish y i e 1d b ~i :2 7 :2 ton ne s b 11 t increase Ii!
\alue by 46 million Uganda shillings, The decline in yield LS
attrlbuted to poor fishermen's v:elfare as most of them ...;," I·e
t·eported suffering from recurrent Malaria. Also net thef,s
increased due to many- illegal fish Landings on the Zaire side and
attacks by Zaire ~arine soldiers. The registered increase In
value due to continued increased fish smuggling to
neighbouring Zaire which increased demand and hence prices .
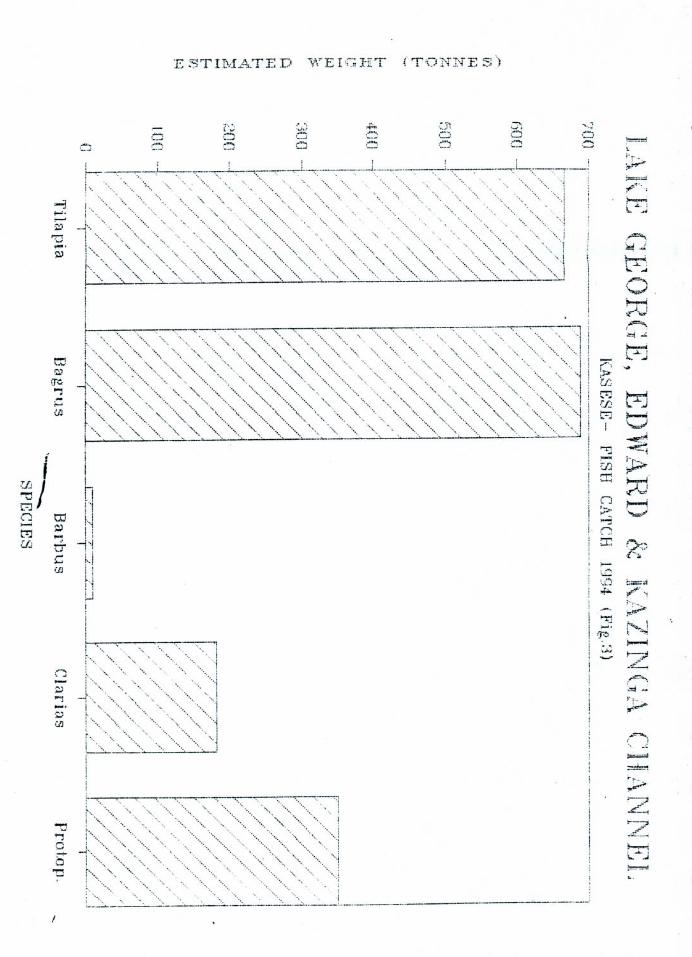
KASESE DISTRICT:
The district produced a total of 1,895 tonnes valued at 901
million Uganda shillings in 1994, compared to 2,383 tonnes valued
at 9~0 million Uganda shillings in 1993.
J The dominant fish specie was Bagrus which contributed 36.3 % of
the total fish produced followed by Oreochromis ~ith 35.1 % of
the total fish production, Protopterus 18.5 %, Clarias 9.6 % and
Barbus 0.5% . There was decline in fish yield by 488 tonnes and
decline in value by 29 million ~ganda shillings. (see table I(C)
and Figure 3). The decline in yi81d is attributed to recurrent
earthquake tremors and flood disasters which claimed lives and
mad e pe 0 p 1e ( inc III din g f ish e rIlle 11) \iO ft- i e d .
4

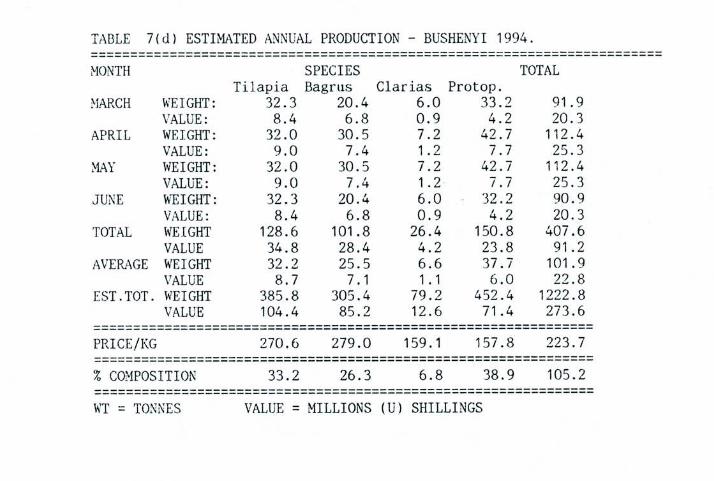
BUSHENYI DISTRICT:
The district pI"oduced a total of 1 ,0:; 6 ton ne s val ue d at 78 t~
illi~l.ion Lganda shillings in 1994, compared to 787 tonnes valued
at 408 million Cganda shillings in 1993. The dominant fish specj(~
was Protopterus which contributed 40 % of the total fish
produced followed by Oreochromis with 33.2 %, Bagrus 26.3 % and
Clarias 6.8 % ( See table ltd) and Fig.~ ). There was increase
in fish catch by 269 tonnes and value by 308 million 19anda
shillings. The increase in value is attributed fish smuggling to
Zaire that led to increase in demand and hence average price per I '
kilogram. Cnlike in Rukungiri district the fishing atmosphere was
conctlcive hence increase in catch.
J
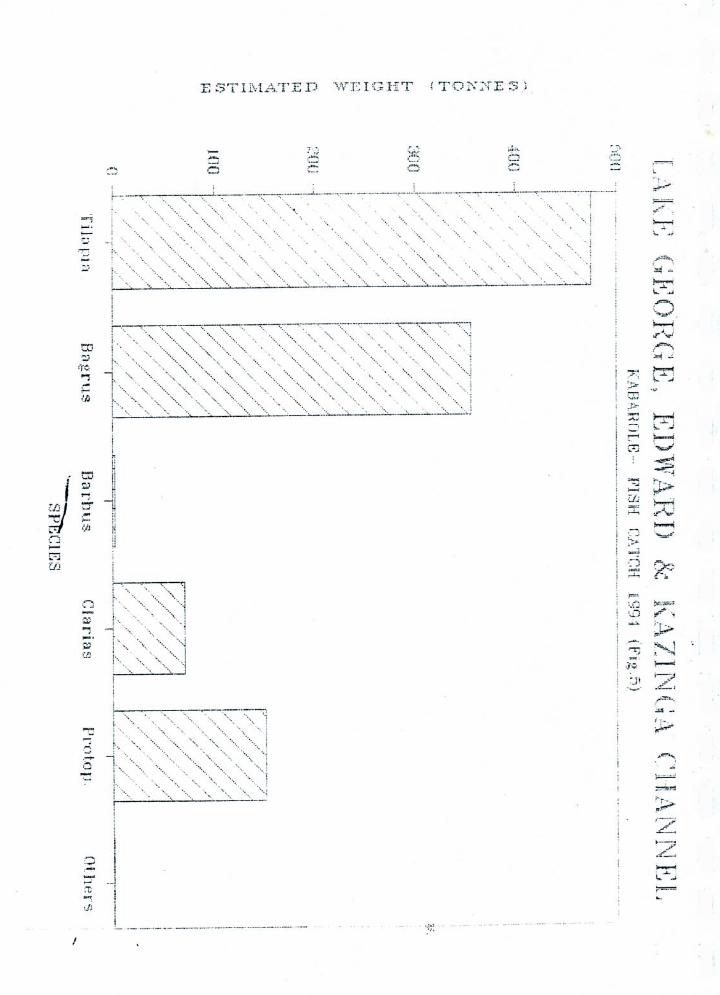
KABAROLE DISTRICT:
The district produced a total of 1,222 tonnes valued at 273 11111
lion 19anda shillings in 1994, compared to 947 tonnes valued at
186 million liganda shillings in 1993. The dominant fish speci~
~i a s 0 reo c h rom i S F h i c h can t rib ute d 4 S % a f the total fish
produced followed bv Bagrus with 33.7 %, Protopterus 1':'. 4 ~~ and
Clarias 6./ % . ( See table 7(£) and r-ig.3 ).
I'

Theu: ,-idS increase in fish catch b:-' 275 tonnes and valL;e Ln- f:7
million Uganda shillings. The increase in catch was attr~buted
guod monitoring of illegal fishing by' the fisheries staff during
Its also reported that in 19q3 10\-; prices viere bejng
offered at Landings as demand for fish was 101;; compared to 19Q4.
RESULTS ( Fish production by District)- MINOR LAKE FISHERY:
The total annual production from minor lakes in western Uganda
Kas 871 tonnes '-alued at 151 million Uganda shillings in 1994
compared to 1,119 tonnes valued at 533 million [ganda shillings
in 1993. There has been decline in yield cause being closure of
Lakes Chahafi and Mulehe during the period. Oreochromis was the
major" specie caught folloKed by Clarias and Protopterus . ~1barara
lakls produced more than three quarters of the total minor lake
production. Generally there has been decline in all the minor
lakes and looks they are getting depleted.
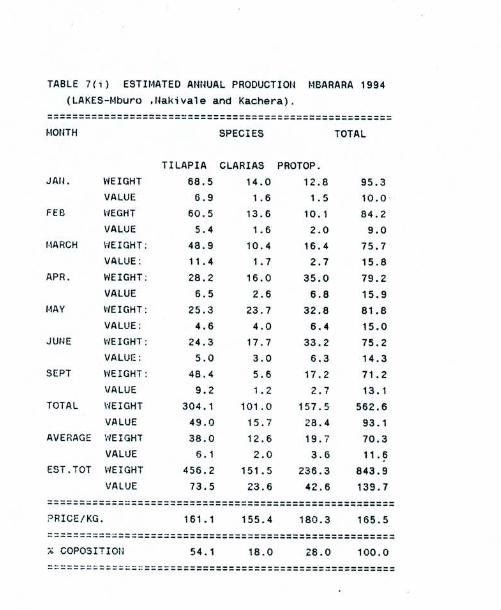
MBARARA DISTRICT:
The district produced a total of 844 tonnes valued at 139 million
19anda shillings in 1994, compared to 1,047 tonnes valued at 499
million Uganda shillings in 1993. The dominant fish specie ~as
Oreochromis vchich contributed 54.1 % of the total fish prodLl<~ed
followed by Protopterus 28 % and Clarias 18 % . There has been
decrease in catch by 203 tonnes and value by 260 million Uganda
6

shill ings ( See table 7(i) l. The decrease can be attributed to
factors reported which inclllde disturbances by floating islands
un lake \akivale, lack of logistical equipment and hea\-:-- rains
that hindered fishing activities.
NTUNGAMO DISTRICT:
The district produced a total of 21 tonnes valued at 8.8 million
Uganda shillings in 1994, compared to 52 tonnes valued at 33
million Uganda shillings in 1993. The dominant fish specie was
Oreochromis which contributed 38.6 % of the total fish produced
followed by Clarias 16.4 % . There has been decrease ill catch by
31 tonnes and value by 24.2 million Uganda shillings (See table .
71j) I). There has been no viable fisheries staff till 1994 hence
difflcult to trace the causes of the decline but generally minor
lakes are getting depleted.
KISORO DISTRICT:
The district produced a total of 5.9 tonnes valued at 2.2 million
l:ganda shillings in 1994, compared to 20 tonnes valued at 1.3
million Uganda shillings in 1993. The dominant fish specie was
Clarias which contributed 23.1 % of the total fish produced
follo\-;ecl b:.-- Oreochromis 25.1 % I see table 7 (h) ) . There has
been decrease In catch by 14.1 tonnes due to closure of lakes
I
Chahafi and ~lulehe but increase in value by 0.9 million 19anda
shillings. \'/hich can be attributed 10\'/ :-;ields leading to iil
creased dellJ.:1nd hence increase in a\"l:~rage pr iCl~ per ki;.o.
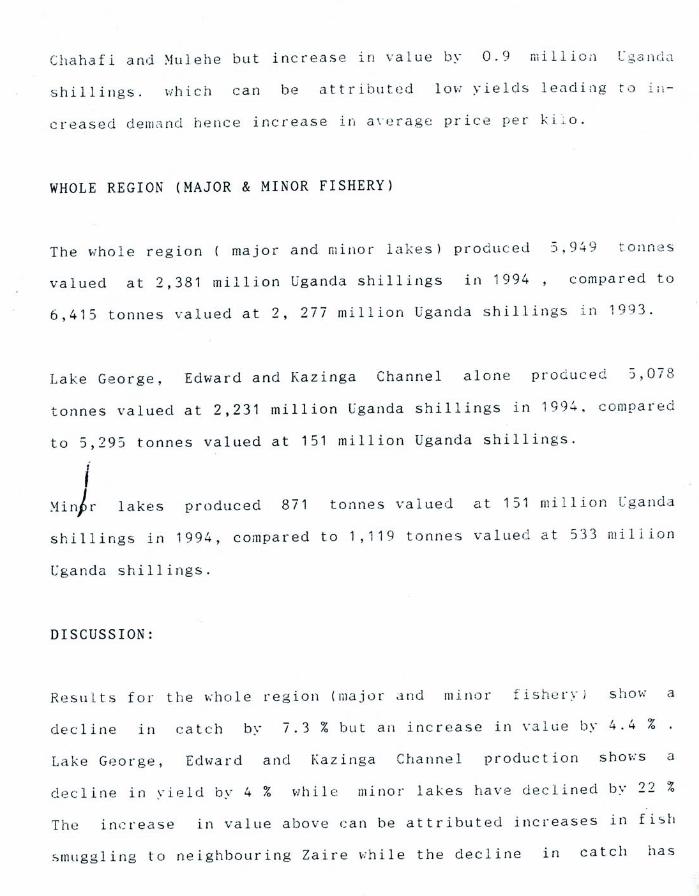
WHOLE REGION (MAJOR & MINOR FISHERY)
The whole region major and minor lakes) produced :),9':'9 tonnes
valued at 2,381 million Uganda shillings in 1994 , compared to
6,415 tonnes valued at 2, 277 million Uganda shillings in 1993.
Lake George, Edward and Kazinga Channel alone produced 5,078
tonnes valued at 2,231 million Gganda shillings in 199':'. compared
to 5,295 tonnes valued at 151 million Uganda shillings.
i ~'1in)r lakes produced 871 tonnes valued at 151 million Cganda
shillings in 1994, compared to 1,119 tonnes valued at 533 million
Uganda shillings.
DISCUSSION:
Results for the v;hole region (major dnd minor fishery) show a
decline in catch by 7.3 % but an increase in value by 4.4 %
Lake George, Ed wardand Ka z i nga Chan ne 1 pro du c t ion s h 0 \'; s a
decline in yield by 4 % while minor lakes have declined b~' ?? %
The increase in value above can be attributed increases in fish
smuggling to neighbouring Zaire ....hile the decline in catch has
I

mainl:,; been due to problems like l'alnpant ":ater pirac~- b~' Zaire
marine soldiers. scarcity of new gear in open market leading tl)
night thefts of nets and closure of som':? fishing \'illages to
check dlegal fishing canoes as reported i;1 l~abarole clistr.i.ct,
c los ureo f so III e III i nor 1a k e s due to f ish i ng 0 f i mm a t lIr e f ish, poor
fisherll1en/fish(~ries staff welfare leading to fragmentar~' daUt
and earthquake tremors and flood disasters claiming peoples
lives. Production by each separate lake shows that lake Ed~ard
produced more than half of the total fish produced. This is f01
lowed by Lake George and lastly Kazinga channel (see table 7(a)
Fish production by strata or landing had production as follows in
descending order: Rwenshama, Katwe, Kayinja, Hahyoro, Kashaka,
Ki sepy i , Ka t unguru ( k ) , Kahendero, Kaz inga , Hamukungu,
Kat~lgUru(b) and lastly Kasenyi (see table 7(b) and figure 7).

CONCLUSION/ RECOMMENDATIONS:
The t~stimated quantity' of fish catch for Lake George, Eclv.:ard and
r a z i nga c han neli s bela v! the ant i c i pat e d q II ant i tie s for 1993/94
of 6,200 and 6,400 tonnes respectively ( Source ~ational targets
for fish production 1992/95 - Ministry of Finance and Economic
Planning J. This breakes the apparent average illcrease of 4 % .
There is need for the following:- Visiting the field fOl" data
quality checking so that the reliability of the results can be
tested . .
A sfandard format for presentation of monthly reports should be
adorfted which must include all specifications of fishing gear.
Measure should be taken to ensure timely submission of monthly
reports to anable the processing of data at quarterly and annual
levels.
Carry out a frame survey and other biological research on minor
lakes and stock them with appropriate fish species.
SOCRCE OF DATA: [FD DISTRICT MO~THLY REPORTS 1993/9~.
04J' RlKUU~YA EDWARD ( F.O Statistics)
10f"r.L; b~q, 2 ,05LGtG, f) ~ 'U1b~
'-ABLE 7(,,) FISri PRODUCTICIJ III KIeHI·IAr·IBA REGIOII 8Y LAKES 1994.
===========~=========================~====~===========~================~======::
1. LAKE GEORGE
SPECIES
Tilapia Sagrus Clarias Pratap. Barbus Others TOTAL
_AIlDHIGS \'It . Val lit. Val l'it. Val \/t. Val I'lt. Val \·It. Vai I'lt. Val
Kahendera 12.6 4.4 29.2 6.9 70.6 15.0 107.2 28.0 219.6 54.3
-<aseny1 86.4 17.0 19.4 5.1 12.9 4.0 35.0 13.0 153.7 39.1
Hamui\ungu n.ll 30.2 75.4 37.9 13.5 8.0 17.2 7.4 178.9 03.5
Kashaka 216.0 98.1) 130.6 100.0 26.6 21.3 36.9 32.7 410.1 252.0
r'lahyara 243.0 336.4 50.4 18.6 57.6 28.8 207.0 28.8 558.0 412.6
KayinJa 143.4 31. B 114.3 28.8 90.6 21. 0 334.2 43.2 682.5 124.8
TOTAL 774.2 517 .8 419.3 1'37.3 271.8 98.1 737.5 153.1 2202.8 966.3
===========~====================================================~===============================================~:=============~
::; COI·1POSITIOii 35.1 19.0 12.3 33.5 100.0
==~===============~==::=================~============= ==========================================================================
Z.LAKE EOI'IARD
SPECIES
Tiiapia Bagrus Clarias Pratap. 8arbus Others TOTAL
LArlOIIlGS lit. Val \'It. Val lit. Val lit. Val l'it. Val 1·lt. Val l'it. Val
Katwe 400.0 161.0 318.6 158.4 64.0 38.8 74.0 44.4 856.6 402.6
Kdyanja 415.0 27.6 177 .6 80.4 4.4 2.2 8.2 4.3 4.0 1.2 240.2 115.7
isenyi 160.1 101.7 115.3 51. 2 6.4 3.8 13.1 6.9 0.8 0.4 0.1 0.1 298.5 164.5
Kazinga 45.6 24.5 74.4 34.2 10.2 5.7 51.9 13.8 0.7 2.0 182.8 80.3
Rwensllama 149.5 47.7 629.5 179.3 50.1 16.3 60.0 15.8 14.6 5.0 1.5 2.5 905.2 266.6
TOTAL 801.2 362.6 1315.4 503.5 137.1 66.8 207.2 85.2 20.1 8.6 1.6 2.6 2482.5 1029.3
========================================================================================================= ================ " COt.1POSITIOH 32.3 53.0 5.5 8.3 0.8 0.1 100.0
========================================================================================================= ================ 3. KAZIijGA CHAHNEL
SPECIES
Tilapia Bagrus Clarias Pratap. 8arbus Others TOTAL
LAllDIr~GS \'It. Val l'it. Val \'It. Val \·It. Val \'It. Val lit. Val ~It . Val
Ka t ungur'u ( k ) 26.2 9.7 68.6 34.2 17.0 8.5 112.0 32.6 0.4 0.2 ;:24.2 65.2 ..._-
Katunguru(B) 50.1 34.0 32.8 30.6 19.4 15.3 71.7 78.9 0.1 0.2 174.1 159.0
TOTAL 76.3 43.7 101.4 64.8 36.4 23.8 163.7 111. 5 0.5 0.4 398.3 244.2
===~==~=====~=~~=~============~=================================================================================================
X COl·1POSITIOIi 25.5 9.1 46.1 0.1 100.0
==~===========~==.:=~:.~=.:':~~~=====~============== =====~===================.. ======================================================

HULE jlbl fhH PHODUCTIO!' IS IdCHWAMIlA T,EGIOS Ill' STRATA ILA/;DINGS) 1994.
============================================================================
STRATUM SPECIES
(LANDING)
Ti lapia Bagrus Clarias ProtoI'. Barbus Others TOTAL
We. Val Wt. Val Wt. Val Wt. Val Wt. Val Wt. \-al Wt. Val
f\ahendero 1:l.6 4.4 29.2 b.9 70.6 15.0 107.2 :l8.0 219. (, 34.3
Kasenyi 86.4 17.0 19.4 5. I 12.9 4.0 35.0 13.0 153.7 39. I
Hamukungu 72.S 30.2 75.4 37.9 13.5 8.0 17.2 7.4 178.9 S.3.3
Ka.<,haka 21(,.0 <;0.0 125.6 100.0 26.6 21.3 36.9 32.7 40S. I 244.0
Mahyol'o 243.0 336.4 50.4 18.6 57.6 23.3 207.0 28.S 55S.0 412.6
Kayinja I-D.4 31.3 114.3 28.8 90.6 21.0 334.2 43.2 682.5 124.S
Katwe .. 00.0 161. 0 318.6 158.4 64.0 38.3 74.0 44.4 836.6 402.(,
l\.ayanja 4G.0 27.6 177.6 SO.4 4.4 2.2 S.2 4.3 4.0 1.2 240.2 115.7
Kisenyi 160. I 101.7 115.3 51.2 8.4 3.8 13. I 6.9 O.S 0.4 0.1 O. I 29S.5 16,L 5
Kazinga 45. G 24.6 74.4 34.2 10.2 5.7 51.9 13.8 0.7 2.0 182.8 80.3
l\weshama 149.5 47.7 629.5 179.3 50.1 16.3 60.0 15.S 14.6 5.0 1.5 2.5 905.2 266.6
KaLunguruek) 26.2 9.7 68.6 34.2 17.0 8.5 112.0 32.6 0.4 0.2 224.2 85.2
KatunguruIBI 50. 1 34.0 32.8 30.6 19.4 15.3 71. 7 78.9 O. 1 0.2 0.0 0.0 174 .1 159.0
======================================================================================================================= TOT-'\L 16S 1. j 916. 1 1831 . 1 765.6 445.3 188. 7 112S.4 349.8 20.5 9.0 1.6 2.6 5078.7 22Jl.S
======================================================================================================================= "; COMPOSITIOt\ 32.5 36.1 8.8 22.2 0.4 0.0 100.0
=======================================================================================================================
.0"1 TON~ES A:<D VALUE MILLIONS eU) SHILLINGS
,._--
..

------------------------------------------------------------------------------------------------------------------------------
------------------------------------------------------------------------------------------------------------------------------------------------
------------------------------------------------------------------------------------------------------------------------------------------------
-------------------------------------------------------------------------------------------------------------------------------------------------
TABLE 7 (e) ESTIMATED ANNUAL PRODUCTION - EASESE 1994.
~10NTH. SPECIES TOTAL
Tilapia Bagrus Barbus Clarias Protop. JAN. WEIGHT: 30.1 60.6 2.1 16.7 30.8 140.3
VALUE: 13.0 26.7 1.2 6.9 11 .9 59.7 FEB WEIGHT: 31.0 44.0 0.6 13.3 25.8 114.7
VALUE 14.0 18.5 0.3 4.7 7.9 45.4 ~1ARCH WEIGHT: 47.0 63.0 0.6 12.5 25.0 148.1
VALUE: 19.0 30.3 0.4 5.2 8.9 63.8 APRIL w'EIGHT: 64.0 72.4 0.6 13.0 30.0 180.0
VALUE: 30.7 38.5 0.2 5.3 9.5 84.2 HAY WEIGHT: 50.0 59.0 0.6 20.4 30.2 160.2
VALUE: 23.0 30.5 0.1 9.7 13.0 76.2 JUNE WEIGHT: 111 .0 45.1 0.0 15.0 33.4 204.5
VALUE: 22.5 17.2 0.0 66.8 15.0 121 .5 TOTAL WEIGHT 333.1 344.1 4.5 90.9 175.2 947.8
VALUE 122.2 161.7 2.2 98.6 66.2 450.8 AVEP.AGE WEIGHT 55.5 57.4 0.8 15.2 29.2 158.0
VALUE 20.4 27.0 0.4 16.4 11.0 75.1 EST.TOT. WEIGHT 666.2 688.2 9.0 181.8 350.4 1895.6
VALUE 244.4 323.4 4.3 197.2 132.4 901.7
PRICE/KG 366.9 469.9 480.1 1084.5 377.9 2779.2
% COMPOSITION 35.1 36.3 0.5 9.6 18.5 100.0
WT = TONr:ES VALUE = MILLIONS (U) SHILLINGS
,"
------------------------------------------------------------------------------------------------------------------------------------------------TABLE 7(d) ESTIMATED ANNUAL PRODUCTION - BUSHENYI 1994.
HONTH SPECIES TOTAL Tilapia Bagrus Clarias Pratop.
riARCH WEIGHT: 32.3 20.4 6.0 33.2 91.9 VALUE: 8.4 6.8 0.9 4.2 20.3
APRIL WEIGHT: 32.0 30.5 7.2 42.7 112.4 VALUE: 9.0 7.4 1.2 7.7 25.3
MAY WEIGHT: 32.0 30.5 7.2 42.7 112.4 VALUE: 9.0 7.4 1 ? 7.7 25.3.~
JUNE WEIGHT: 32.3 20.4 6.0 32.2 90.9 VALUE: 8.4 6.8 0.9 4.2 20.3
TOTAL WEIGHT 128.6 101.8 26.4 150.8 407.6 VALUE 34.8 28.4 4.2 23.8 91.2
AVERAGE WEIGHT 32.2 25.5 6.6 37.7 101.9 VALUE 8.7 7.1 1. 1 6.0 22.8
EST.TOT. WEIGHT 385.8 305.4 79.2 452.4 1222.8 VALUE 104.4 85.2 12.6 71.4 273.6
=============================================================== PRICE/KG 270.6 279.0 159.1 157.8 223.7 =============================================================== % COMPOSITION 33.2 26.3 6.8 38.9 105.2 =============================================================== WT = TONNES VALUE = MILLIONS (U) SHILLINGS
------------------------------------------------------------------------------------------------------------------------------------------------------------------------------------
------------------------------------------------------------------------------------------------------------------------------------------------------------------------------------
TADLE 7 (e) ESTn1ATED t\~. 'VAL PRODUCTION - RillZUNGIRI 1994. ========================================================================================== 1'10NTH. SPECIES TOTALS
Tilapia Bagrus Barbus Clarias Protop. Mormy. Labeo JM. \v'EIGHT: 12.0 56.0 0.6 3.0 5.0 0.1 0.1 76.8
VALUE: 3.6 10.8 0.2 0.5 7.0 0.0 0.0 22.1 FEB WEIGHT: 14.4 36.4 0.6 2.0 2.4 0.2 0.0 56.0
VALUE: 4.0 7.6 0.2 0.4 0.4 0.0 0.0 12.6 ~·.IARCH WF.IGHT: 13.0 44.0 0.9 3.0 3.0 0.1 0.0 M.O
VALUE: 4.0 10.0 0.2 0.5 0.5 0.0 0.0 15.2 i\PR[L WEIGHT: 8.0 68.0 0.7 5.0 3.0 0.1 O.n 84.8
VALUE: 2.6 18.3 0.2 1.3 0.6 0.0 0.0 23.0 ~'IAY \'lEIGHT: 3.8 49.0 0.6 9.0 4.0 0.1 0.0 66.5
VALUE: 1.5 13.0 0.2 2.2 0.8 0.0 0.0 17.7 JU1\E \\'EIGHT: 3.3 65.0 0.6 5.5 5.2 0.1 0.0 79.8
VALUE: 1.5 20.0 0.2 1.4 1.1 0.0 0.0 24.3 JULY \fEIGHT: 8.0 64.0 1.7 3.8 4.8 0.2 0.1 82.5
VALUE: 3.0 17.0 0.6 0.9 1.0 0.1 0.0 22.6 ACG. WEIGHT: 20.3 38.3 0.8 3.0 4.2 0.2 0.1 66.9
VALUE: 8.1 11.8 0.2 0.7 0.8 0.1 0.0 21.7 SEPT. WEIGHT: 16.2 46.5 1.2 3.3 4.~ 0.0 0.1 71 .7
V.-\LUE: 6.5 16.0 0.4 0.8 0.7 0.1 0.0 ?' ~4.J
OCT. WEIGHT: 16.6 65.7 2.8 11.2 8.9 0.0 0.0 105.2 VALUE: 6.6 25.3 0.9 3.5 1.9 0.1 0.0 38.3
TOTAL WEIGHT 115.6 532.9 10.5 48.8 44.9 1.1 0.5 754.3 VALUE 41.4 149.8 3.3 12.2 14.8 0.4 0.2 222.1
AVERAGE WEIGHT 11 .6 53.3 1 . 1 4.9 4. 5 O. 1 0.1 75.4 VALUE 4.1 15.0 0.3 1.2 1.5 0.0 0.0 22.2
EST. TOT. WEIGHT 138.7 639.5 12.6 58.6 53.9 1.3 0.6 905.1 VALUE 49.7 179.8 4.0 14.6 17.8 0.5 0.2 266.5
PRICEjI:G 358.1 281.1 314.3 250.0 329.6 400.0 313.5 294.4
% C01vJPOSlTIOt\ 15.3 70.7 ,.._1.4 6.5 6.0 0.1 0,1 100.0 ========================================~============================================== "7 = TOt\~ES VALUE = MILLIONS (Vl SHILLIt\GS

------------------------------------------------------------------------------------------------------------------------------------------------------------------
---------------------------------------------------------------------------------
------------------------------------------------------------------------------------------------------------------------------------------------------------------
TABLE 7(f) ESTH1ATED ANNUAL PRODUCTION - KABAROLE 1994. =============================================================== MONTH SPECIES TOTAL
Tilapla Bagrus Barbus Clarias Protop. Others JAN. WEIGHT: 37.7 28.0 0.2 5.5 13.2 0.1 84.6
VALUE: 24.2 22.4 0.2 5.2 14.2 0.1 66.3 FEB WEIGHT: 38.2 25.4 0.2 4.8 12.5 81.1
VALUE 26.5 21.8 0.2 4.5 12.3 65.3 ~1ARCH WEIGHT: 38.3 26.4 0.2 4.9 12.6 0.0 82.4
VALUE: 24.5 21 .1 0.1 3.9 12.6 0.1 62.4 APRIL WEIGHT: 44.1 38.8 0.2 8.5 12.3 103.9
VALUE: 25.6 23.6 0.1 6.6 10.4 66.3 TOTAL WEIGHT 158.3 118.6 0.7 23.7 50.6 0.1 351.9
VALUE 100.8 88.9 0.6 20.2 49.5 0.2 260.2 AVERAGE WEIGHT 39.6 29.7 0.2 5.9 12.7 0.0 88.0
VALCE 25.2 22.2 0.2 :5.1 12.4 0.1 65.1 EST. TOT. WEIGHT 474.9 355.8 2.0 71.1 151 .8 0.2 1055.8
VALUE 302.4 266.7 1.9 60.6 148.5 0.6 780.7
PRICE/KG 636.8 749.6 969.2 852.3 978.3 2625.0 739.5 ----------------------------------------------------------------_._--------------
% COHPOSITION 45.0 33.7 0.2 6.7 14.4 0.0 100.0
WI = TO~~ES VALUE = MILLIONS (U) SHILLINGS
, .._--

TADLE 71g) TOTAL MONTHLY CATCH BY DISTRICTS -. KICHWAMBA REGION 1994
=================================================================================== MONTH DISTRICT
RUKUNGIRI KASESE K:\BAROLE BUSHE!'YI TOTAL
WT VAL WT VAL WT VAL WT VAL WT \'Ai
JAN. 76.8 22.1 140.3 59.7 84.6 66.3 301.7 148.1
FEll 56.0 12.6 114.7 45.4 81.1 65.3 251.8 123.3
\fARCH 64.0 15.2 148.1 63.8 91.9 20.3 82.4 62.4 336.4 1(, l. 7
APRIL 84.8 23.0 180.0 &4.2 112.4 25.3 103.9 66.3 4& 1.1 198.8
MAY 66.5 17.7 160.2 76.2 112.4 25.3 339.1 119. ~
JUH. 79.S 24.3 204.5 121. 5 90.9 20.3 375.2 1(.6.1
JULY 82.5 22.6 82.5 22.6
AUG 66.9 J1.7 66.9 21. 7
SEP 7.1.7 24.5 71.7 24.5
OC"( 105.0 38.3 105.0 38.3
========================================================================================== TOTAL 754.0 222.0 947.8 450.8 407.6 91.2 352.0 260.3 2461.4 1024.3
========================================================================================== EST. TOTAL 904.8 266.4 1895.6 901.6 1222.8 273.6 1056.0 780.9 5079.2 2231.8
========================================================================================== ~; CATCII/DISTRICT 17.3 11.9 37.3 40.4 24.1 12.3 10.8 35.0 100.0 100.0
========================================================================================== WT = TO~~£S A~D VALUE = MILLIONS (V) SHILLINGS

TABLE ~lh) ESTIMATED A~hUAL PRODUCT IOS KISORO 1994
I LAKES - Chahaf i. Kayumbu and t.lut.alHu\}
====================================================== MO!'TH SPECIES TOTAL
1ILApiA CLARIAS MIRROI\'
CARP
HApCROM. RED
SHRIMPS
EDDIBLE
FROGS
JAN. WEIGHT 0.01 O. IS 0.24 0.43
VALUE 0.02 0.40 0.02 0.44
FEB WEGHT 0.12 0.12 0.01 O.OS 0.33
VALUE 0.04 0.02 0.00 0.01 0.07
MARCH WEIGHT: 0.20 0.12 0.07 0.06 0.01 0.07 0.52
VALUE: 0.02 0.00 0.01 0.00 0.01 0.01 0.05
APR. WEIGHT: 0.25 0.14 0.17 0.25 0.01 0.01 0.S3
VALl'E 0.05 0.03 O.OS 0.02 0.01 0.00 0.20
JUNE WEIGIIT: 0.07 0.21 0.05 0.33
VALl;E: 0.03 0.04 0.01 0.08
JULY WEIGHT: 0.10 0.1.3 0.14 0.14 0.02 0.01 0.54
VALLE: 0.09 0.03 0.03 0.03 0.00 0.00 O. IS
TOTAL WEIGHT 0.75 0.90 0.39 0.77 0.04 0.14 2.99
VALUE 0.29 0.54 0.13 0.09 0.02 0.02 1.09
AVERAGE WEIGHT 0.12 0.15 0.07 0.13 0.01 0.02 0.50
VALLIE 0.05 0.09 0.02 0.01 0.00 0.00 o.IS £I;1.10T. WEIGH1 1. 50 1. 80 0.78 1. 54 0.08 0.27 5.9~
VALUE 0.5S 1. AS 0.26 0.18 0.04 0.04 2.1S
================================================================================= PRICE/KG. 3S7.2 602.2 330.S 115.3 552.6 139.7 J6S.::!
================================================================================= ~ COl-'OSITIO~ 25. I 30.2 13. 1 25.9 1.3 4.6 100.0
~=================================.===============================================
._--
TA8LE 7 (i) ESTII4ATED ANIWAL PRODUCTION ~'BARARA 1994
(LAKES-~lburo ,Ilakivale and Kachera).
====================================================== 140l-lTH
JAIl. WEIGHT VALUE
FEB \'IEGHT
VALUE I·IARCH HEIGHT;
VALUE;
APR. WEIGHT;
VALUE 1,lAY HEIGHT;
VALUE;
JUNE \'/EIGHT;
VALUE: SEPT \~EIGHT :
IIALUE
TOTAL \'/EIGHT
VALUE AVERAGE \'IEIGHT
VALUE EST.TOT \~EIGHT
VALUE
TILAPIA
68.5
6.9 60.5
5.4
48.9
11.4
28.2
6.5
25.3
4.6 24.3
5.0
48.4
9.2
304.1
49.0 38.0
6.1
456.2
73.5
SPECIES
CLARIAS 14.0
1.6
13.6 1.6
10.4
1.7
16.0 2.6
23.7
4.0
17.7
3.0
5.6
1 .2
101.0
15.7
12.6
2.0
151.5
23.6
PROTOP.
12.8
1.5 10.1
2.0
16.4
2.7
35.0
6.8
32.8
6.4
33.2
6.3
17.2
2.7
157.5
28.4
19.7
3.6
236.3 42.6
TOTAL
95.3 10.0
84.2
9.0
75.7 15.8
79.2
15.9
81.8 15.0
75.2 14.3
71.2
13.1
562.6
93.1
70.3
11. 6
843.9
139.7
============~=========================================
PRICE/KG. 161.1 155.4 180.3 165.5
====================================================== ::.: COPOSITION 54.1 18.0 28.0 100.0
=~~=========~=~=======================================
.._-

Tr'\BLE 7( j) ESTIMATED ANNUAL PRODUCTION- NTL;:JGMIO 1994 ( LAKES- Nyabihoko and Nyakiyanja).
====================================================== MONTH TILAPIA CLARIAS TOTAL
JA1\. WEIGHT VALUE
MARCH WEIGHT: VALUE:
APR. WEIGHT: VALUE
t-1AY WEIGHT: VALUE:
JUNE WEIGHT: VALUE:
TOTAL WEIGHT VALUE
AVERAGE WEIGHT VALUE
EST. TOT. \vEI GHT VALUE
1.5 0.3 1.8 0.5 0.9 1.4
3 0.1 J.1 0.9 0.3 1.2 1.2 0.4 1.6
0.35 0.1 0.45 1 0.6 1.6
0.3 0.1 0.4 0.7 0.05 0.75 0.2 0.01 0.21 7.4 1.45 8.85
2.25 1.41 3.66 1.48 0.29 1.77 0.45 0.282 0.732
17.76 3.48 21.24 5.4 3.334 8.734
============================================= PRICE/KG. 304.1 972.4 413.6 ============================================= % copas IT ION 83.6 16.4 100.0 =============================================
"--

lJ
'''-1 t·:.
, ..:._..._ ...i...._...~::.i._._-:::....L.•~. __;-:::-_.-::;._.._-:.:.i._._::-:__J._~ __.~l. •. '--._!.__-'-__•._ ...... : .
;.._--l.-...__L-:--l._._+~_.._.i_._...;..
j ..• ".'" "
-,! ". '"''
....\'";
"" .. .·..;..~c..·1
........ . ..... ~.:::.' ".
'-'.....
'-. .:.._-.::~ __::.-.~:::._:=- __.:--__...._._._.,_._~:l-_'_' _ ....::.....~.~~__.....::...:
r-""',
~.
:r.i.~
~~,
~-:! ~
l~...i
..;...~(-"'1'~:r
~-r_~
-e~ ~.!.-.
~.~
~J :
~.t=I
r.. '. "",. "\1J. "..... . '- ~ '"\..."- j
i,····..... ........ "'. i~ ....... .•..••. ".!
~i·· '. '.;~'''"''l
~~~~~ 't~"'1
>!."'" '. .......',.. .,'.'..... "', '.,,, ..:~:--~'.~~-~.... .....J r;~~
r··· '. '. .,.... ........... ..... "'''-~ '. " ". .... "", '\,,,~
I ~ ! ". '. ....',
I r--;;i
r'" \ .... ", .-'..... '\, .... ...•~ •.zt:-:
''0''''
......:..."'!!u.~!
'. ...... ". ". "'.. ! .~., .;.'
L~~~_~~:-~ ..:.-~~_~ ..~~~~~::...~~ ..-:~i
Ij
....~."
j :~~1!
''';~~ ~ ..... ;
~'- ..~_.-:
i..
~.._- - ----._-_ _._-------_ _-_._._ _.-.-._..__..- .._ _.__._._._._---_.

.."..., ........
" .-...., :••• .J
.__J__ __ __ .w••••••••; ••• ... _ ;_...... . _ _ .._.._L_ .._ ..•... _.. _ L. _
'. j
.:.) '. ! ' •• 1
'-"::'~" :. I
~~ ...ci
~ k~"';-(~,
1 J ; :r'~
,;.-~~
'>=j -'
j 1 hI'j , I
~-_!I .~
-j·.. l';
N.......
",.r •••
.....,...
UJ
~ l----i
'!1'
m ~ ... ;......; ~...,i
~ ~
> ~ :r""t='!'
~ '---,~'
...... ~ ,.'j;
:5' j
! ;
r""',,'" ~ i'" ....., i
... ; ~. '1
", :_'-_--:.:
.:....;
'J.:,
.....,.
>. r-~.j, '."
~
,-.~ _.0
.. ~.....
'1 ! i -'-------_._---_.__..-.--- .._._---_.__._ .. _.. _..._......_-....__.__ .._....._._.
•-·"C ..,.... L._~
'--i ...r
ff_ .
.......... :... j
I
•• ••
:~ ........ .• tt"., ........� .-"'"
l : ; ;r--o:- .-..--.-...--.:--:---.-::-----:::---'-:-----:::..-...-~-.--"t:- ....--:;:"" ..R _ ...R __......._.; ....._ ...,._......__• __••::--:_~--_.-__- _ __:-l...-":;~-.-~...--'�
:....� .......�
!".
.........�
'."
_.j... -'""'" .... ..... "'-.\. ! "". \""- . . '.
'.I..... ". "-. . "'"" .. .... '. ..,'.....~ '\. '.. '''\ ". ......I ........ '"... "..... "" "'" .... ..... ....�r··."".' , .. " ..... "'-. '. ...... . .
......., '. ..........�1 '" ' .., ". . _._,-'-_'-.__-' _........."-, . ....... ". .....� -~----'. '.
...-.,
~--·'·-·i " , '.1
'j....... ".
•...� !
". ". '. '•.J'. . " I
" '. '" '!
,", .....'. i··.... .... " . ". " ~. ....
, '" " !jj .•.•. "'" ".i" ..... ". -"-.
'.".-1"'"
~ ..... .... r·,. .... '.'"
....."; .... ". '. ..;"
j~~
~~ M···....: :""e~· .
~
l ~...J
....~r~.
~ ..1 ~. t -'- . .. -4
,..-='".......,;�
~ ...~.... '=i...l
L---j
tIj ~ ..........,;� ~~
~ ~ ,...
'"":J1 ~"'"
~ '-'"'
~~~ >--i t----.... , ...~... 6~~
----:...... ~..!:~
:----:-; ........:.i::_-i
~ ..&.. 1t- ....
.............� : ". ;---~---_._. _'-::_--"_.~:- .~.._.:.._... __.._..__:..-.-._...:.,.. .._..._--_._..._----------

--
'I ....;
:..~~ Ul .....": .....": ,"",":
i-.--:- ! ..:..._•. .;~.- ..-._:.-.--..:...---.....-...--.-.-i......__.. _.__. .L .__._...::._...;_-:--_~._-:-----J.._._ ..__._._._..i._.._. ......;
.•..
". .~~!~...
''';; }.-i J.r-o...... i
,
". ........... ~ l~j
''--''
.... i.....,... '\" ....... ...... ',:;.� i -'" '.j: ..... ......,. ................ .........". i ~~
.~.~.,f'· ". ". i '" ". .... ..... '- ~ 1---:-_"-,-"-'_..:::..._-~_._._...-::.._..~._ ..-.__.._.--. ..._.::...._...::.._.-_....-..__:..._.__ .~.~_ .._....::..._...:._-...----.: ~
~)..~.! ,....'!'::'.Ir,\
~ ..1 >-,,~
l~.J
..... ..•. .•.. . . .•..,�
k ". -, '- . ",� j""".".i! "'. . "' ":.. ". L~...! ".,. .....
! '"'' .".................. . ~. ", i--i�'....~-.ir-., ... ... "0.. "". "'. •..•••, ..... .••.
.--l ..... """ "............. '\'" ......... \... ..... ....,. ~~ '" c t°'- " """"" '\. '''''' "'. .... '\c...., <
i '. "" .t .(JJ . i 1' ''. '.,,'" ~.,.,,". \',,~_ ' ~ " "" , '..! :>
UVJ l '\.. .... '.... "-. ' ".," ". ..~ 1 ~ ~ : , " . ". ", " "......... . . "" ...;., ,r-....� tr " ! "" """) 'I~~'~~~--"--'--'.. ~
l:-'J'• .J..p.,.
~ ~ [lj ..~
<.! ....., '.~ i
l ~ -~....""" "'. '..1
! ....... ...................... i ~""
i.. ........ ."...... "'"'' .....~ :~ ! .'.... ......,.... -'"" ! >
~\-- --i ..... 'i i. ",'"~''' •••. i, >--!". 'i�
.•..,� 1....··· ......... i r-;j�
.~. ....·i ~::_~ f····
.......� ..•.. ....~. "1i···.. ".
~..::~~._-~
~~-~,.--. _.-t::._-_ __.H._.--.:::-._.."t:' H.._:_ :- .. _.H.":...•- : _.."' ~ _-: - ,,:- : __..,:-.~._ _----:••_.. _.·':'"'.._..·..··__··..t .~
1";... ".�
L� ".f···.! ......
",
I.
_ _
•....... r�
I~::J ........ ........�I:::;
...- _ -::: _ - :.........•": -_....., _.-:--._._._.__ ;.::.__ __ _ ,.. ...�_._-~._..- : ~_~ _.••. i
",.... ..•.
~.
. " .~ , '. '.~ .-~:.......
t~ Q'.... -'" \, '. . '.. "'. '. ~~ '- . : !---'-_""--"_-'--_'.~.._.:.----'~..o..',._...::::~:::,._~.:.~-.:::..._..::::..._-'::~::::..._....::.-:~_.::...__... ,_-,,-_-,,---.::.J ~
i.. .... ,.~..;.,
.•-."a+-t'"
!.-..--..~-,~;.--..:._~:~_.~ ..._~;: ..- .....:..... __ .or::--.....•:::~ .... .....:.. ...._.:-_....-::-._..-::-·_··..7··_··..~:-·-1
~ .... ..... ........... , . :.t-;·...._i'. ..... ", ". ' .
".~"
--;;
" '.....f',. ". '.
-.". " .! '-" "'. ". ....
" """. ", ". "",,! ',"':' :-"'..~. .... '"'' ..... " ..
.~::..-..:::--::.:..._-_._-~._,_.-=-----=--_._:..:
~ !!lo:. .wi
~ ;
""="'
~ ~ r-r__
Jj:....iJ"., i r ~.~~
,-: :..i:"'....
[.;
~..::. ~;
;, . ~.
~-r ''1
~" ..:.. • -" ~, ! I .~
.~. 1 ;r."f~ ~
".
, 'i ""- ;". ~ •-=--:'. f!.... . !! ~. ~". ~ ;--.
~J! . .:"~
"--' -~-;
."7-....:~~~. ...~.._-.~J
"'. -"~ ..! ". ......... '1�
"," '. I� \" .... ,"-....
...~... ;". "...... ,. ".:........�
".
"'-......... '.�
j" .... ". ....~ .........�; ''''.
r-

--
t'tt,,; ;....... J-' .• ...-. ,. ,
hl -.l I j
( .~~ ~-. .....~
~J ....
.... , I ""'"V
V': "... ,
> N ~ Zr,"", >�
>�
0
~l
..-..;
...-:; F": .•• ,...... ~f'''.~.~
,,_..J.,.jat.... :::-.: ==.... ,. :..-+
~
.......�, . ;..: II.
....\...,i
"L":: ..~
>::....'! ~:
( J
---_\
--~--=--:::-_::-::=_==--:::'-:-':::":_=J--.-=-.-------.~---.--·-··---__ .i
-.,:
~' .. ~ ../
;....
5...J
_. ,,..,
'.. .~.
~,::n .... .,- ...~
" G..........� :;-·1,.--.. ........� "
:;~ rJ.~
~~ ~ :~ :-"'!:-:l ~ ......-''"': ;";;r.
,~.. 'w ..A.
r-,
= ;p. Z Z
I

.-.
'-.
..... :....
>( /
.----- .,:"
\'" - ---------_. ------- ------ -_-:l~ -- ".--------- _..------_._------- ..'
_--~.-.-~--~----.--••- ~-T ,.(:<::~~~~~>~:~(~~.~~~:(~(~~(::~,~~.::::.:~._--
.,', " \. " \, \ \ 'I. " ... \ \ \. " \. \ .~ "\. \ \ \ " 'I, 'I, \. \ \ "\. \. '. '1/.~;:----~-
'\;~:~;/ .I
'.::- " .-,
-·-..~....:~.l:·,..:~·::..i.::L~-·~- ..··
-o-! "",.-;:Ii ~
-~,
~ \"il
~.r- ' a;;: 'I

i/
-. ,-.... I;:;.'-.; ~
~
~ 1:;.' :~
'"'t !"O~ ~: i-t--.
~i
~~ ',/i
--~_
Cl;"/1
~ll
. ~
.'
~....i.""-....
"""c=:~;z-3
i~
>- "',...,41t-.,
m~'"'" """'"/,'<.,
(j:.::ri..j(~ rTj.~ I"""'!
'...,itt1-<. <-'
-e ~.Cfj ?'
- '""?"f~ ~-d,-.. ~J
~ ell
l~
!..C-~
11.(j)
-D

".
o
...
} r------'
-ft,,- --i
~._. -0i-!
~. ....~~
-'~~.
~
..�
\
~
~ ~ ~.....\.;~~
~ ;.....'-7
,iF ~l~ \ ...'",,1
~ ~-:l,'"M_.·....
r~ ~'-'