t manufacturing sector in · pdf file2 the manufacturing sector in tanzania a study by the...
TRANSCRIPT

1
THE MANUFACTURING SECTOR IN TANZANIA Final Report A study by the Confederation of Tanzania Industries (CTI) and the Confederation of Danish Industries (DI) Sponsored by DANIDA

2
THE MANUFACTURING SECTOR IN TANZANIA
A study by the Confederation of Tanzania Industries (CTI)
and
the Confederation of Danish Industries (DI)
in association with
Dr. A. V. Y. Mbelle
of the
Economics Department,
University of Dar es Salaam.
December 2000
3
ACKNOWLEDGEMENTS In accomplishing this study we benefited from many people/institutions. Space does not allow us to mention all of them. We therefore take this opportunity to express our sincere gratitude to all of them. However, CTI and DI would like to thank DANIDA, without whose support this document would not have been possible. We would also like to thank the 248 companies that responded to our questionnaire for this study. We would also like to acknowledge the contribution of: Dr. A. V. Y. Mbelle, for doing the data capture and processing; BRELA for providing us with a comprehensive list of manufacturing establishments; and National Bureau of Statistics for its assistance in providing some of the macro-economic data.

1
Table of Content 1. Introduction...........................................................................................................................................................3 2. Tanzania in General Terms .................................................................................................................................4
2.1 Background.....................................................................................................................................................4 2.2 Population and Resources ............................................................................................................................4 2.3 Political Background.....................................................................................................................................5
2.3.1 History (Pre/post Independence) ........................................................................................................5 2.3.2 Constitution and Government..............................................................................................................6 2.3.3 Political Forces......................................................................................................................................7 2.3.4 International Relations.........................................................................................................................7
2.4 The Economy ..................................................................................................................................................8 2.4.1 Preamble .................................................................................................................................................8 2.4.2 Gross Domestic Product (GDP) .........................................................................................................9 2.4.3 Labour Force........................................................................................................................................10 2.4.4 Key Sectors............................................................................................................................................11 2.4.5 Inflation, Money Supply and Interest Rates ....................................................................................14 2.4.6 Foreign Trade.......................................................................................................................................15
3. The Manufacturing Sector and the National Economy ................................................................................16 3.1 Background...................................................................................................................................................16 3.2 Manufacturing and GDP.............................................................................................................................16 3.3 Investment.....................................................................................................................................................18 3.4 Employment..................................................................................................................................................20 3.5 Foreign Trade ...............................................................................................................................................21
4. The Manufacturing Sector – Broad Sectoral Evaluation.............................................................................24 4.1 Background...................................................................................................................................................24 4.2 Size and Composition of the Manufacturing Sector..............................................................................24
4.2.1 Location.................................................................................................................................................26 4.3 Ownership Structure ....................................................................................................................................27 4.4 Employment..................................................................................................................................................28 4.5 Company Performance................................................................................................................................30
4.5.1 Success Rate and Turnover ................................................................................................................30 4.5.2 Capacity.................................................................................................................................................32 4.5.3 Domestic Competition and Exporters ..............................................................................................33
4.6 Investment.....................................................................................................................................................34 4.7 Competitiveness...........................................................................................................................................35
4.7.1 Constraining Government Policies...................................................................................................36 4.7.2 Constraining Social Factors..............................................................................................................37
4.8 Capitalization................................................................................................................................................39 4.9 Summary and Ranking of Broad Sectoral Performance .......................................................................41
5. The Manufacturing Sector – Sub-sectoral Evaluation .................................................................................43 5.1 Background...................................................................................................................................................43 5.2 Food Products (ISIC 311/2).......................................................................................................................44 5.3 Beverages (ISIC 313) ..................................................................................................................................45 5.4 Textiles (ISIC 321)......................................................................................................................................46 5.5 Wood Products Except Furniture (ISIC 331)..........................................................................................47 5.6 Paper and Paper Products (341) ................................................................................................................48 5.7 Other Chemicals (ISIC 352) ......................................................................................................................49 5.8 Rubber products (ISIC 355) .......................................................................................................................50 5.9 Iron and Steel (ISIC 371) ...........................................................................................................................51 5.10 Fabricated Metal Products (ISIC 381) ...................................................................................................52 5.11 Summary and Ranking of Sub-sectoral Performance .........................................................................53
6. Tanzania in a Comparative Perspective..........................................................................................................55 6.1 Background...................................................................................................................................................55 6.2 The Manufacturing Sector in a Regional Perspective ...........................................................................55
6.2.1 Key Comparative Indicators..............................................................................................................55 6.2.2 Regional Manufacturing Performance ............................................................................................57 6.2.3 Employment ..........................................................................................................................................58 6.2.4 Intra Regional Trade...........................................................................................................................59

2
6.2.5 Regional Competitiveness ..................................................................................................................61 6.3 Global Dimensions......................................................................................................................................62
6.3.1. Value-added in Global Manufacturing...........................................................................................62 6.3.2 Structure of Manufacturing................................................................................................................63 6.3.3 Manufacturing Exports.......................................................................................................................64 6.3.4 Imports ...................................................................................................................................................66
6.4 Tanzania in Trade Agreements..................................................................................................................67 6.4.1 The EAC ................................................................................................................................................67 6.4.2 SADC and COMESA ...........................................................................................................................68
Annex A Manufacturing Survey Questionnaire ................................................................................................72 Annex B Standard Industrial Classification......................................................................................................78 References................................................................................................................................................................80

3
1. Introduction Fragility and inefficiency have long characterized Tanzania’s manufacturing sector. In previous times the problems were predominantly related to government failures in developing an economy on the basis of a centrally planned structure. In recent years the main problems have been related to adjusting not only the manufacturing sector but the whole Tanzanian economy to the fierce demands of globalization. The challenge has hence mainly been affiliated with creating an enabling environment for the productive sectors in the economy, most notably the manufacturing sector, in order to expand Tanzania’s present low level of competitiveness. This study is looking into the current process by examining important aspects concerning the recent developments in Tanzania’s manufacturing sector. The aim is to add to the existing knowledge base regarding current aspects of manufacturing in Tanzania such as size and composition of the sector, company performance, employment development, and external constraining impact on the sector. The study has been conducted in collaboration between the Confederation of Tanzanian Industries (CTI) and its sister organization in Denmark, the Confederation of Danish Industries (DI) and funded by DANIDA. A major component of the exercise entailed carrying out a detailed survey. The results of the survey have and will be used for two purposes. Firstly, the data was processed for appliance in the report. Secondly, the data is to form the basic material for a database for use by the Confederation of Tanzanian Industries, who will be responsible for updating and expanding the data in the future. The report consists of six chapters. The first chapter is the introduction presented here. Chapter Two is a short description of the main characteristics of Tanzania’s society. It offers information about population, resources, history, political background and economic development. Chapter Three is a description of the manufacturing sector in the context of the national economy. It looks into manufacturing’s contribution to key areas in the economy such as GDP, investment, employment, and foreign trade. Chapter Four and Five present the survey findings. The issues examined are size and composition, ownership structure, employment pattern, company performance, foreign trade, investment, and competitiveness. Chapter Four entails the survey results on a broad sector level. Chapter Five evaluates the findings on specific industries. Chapter Six sets the condition of Tanzania’s manufacturing sector in a comparative context. The main indicators of the sector are compared on an international level, from a regional and global perspective.
4
2. Tanzania in General Terms 2.1 Background Tanzania is located in the eastern part of Africa between Mozambique and Kenya. It is bordered by Rwanda, Kenya, Uganda, Malawi, Burundi, and Democratic Republic of Congo. Climate conditions vary from tropical along the coastal region to temperate in the highlands. The country is gifted with a broad range of valuable natural resources, including gold, gemstones, diamonds, coal, phosphate, natural gas, nickel etc. It has also significant hydropower potential. The 945,087 km2 of the United Republic of Tanzania (incorporating mainland Tanganyika and a number of offshore islands, including Zanzibar, Pemba, Latham, and Mafia) have a wide variety of landforms and people. The country includes the highest and lowest points in Africa with the summit of Mount Kilimanjaro (5,895 m above sea level) and the floor of Lake Tanganyika (358 m below sea level). With the exception of the high mountain areas, temperatures in Tanzania are not a major limiting factor for crop growth, although the range of altitude produces a corresponding range of temperature regimes from tropical to temperate. Rainfall is variable, geographically as well as in time, and is generally lower than might be expected for the latitude. The most fertile soils in Tanzania are the reddish-brown soils derived from the volcanic rocks, although elsewhere mbuga and other alluvial soils have good potential. The interior plateaus are covered with tropical looms of moderate fertility. The natural vegetation of the country has been considerably modified by human occupation. In the south and west-central areas there are large tracts of woodland covering about 30 percent of the country, while on the uplands small but important areas of tropical rain forest can be found. Clearly marked latitudinal variations in vegetation occur around the upland areas and some distinctive mountain flora is found. Tanzania has set aside about one-third of its land for national parks and game and forest reserves. 2.2 Population and Resources The population of Tanzania is estimated at 31 million with a growth rate of 2.8 percent per annum. Life expectancy in Tanzania is 51 years, which is one of the lowest in the world. The largest ethnic group is Bantu. There are approximately 120 tribes, each with their own culture. Other ethnic groups include Asians, Caucasians, and Arabs. Official languages are Kiswahili and English (mother tongue to only 8.8 percent of the population, but used as a lingua franca by 90 percent). Agriculture, which employs about four-fifth of the economically active population, is geared in large part towards subsistence farming. The main cash crops are coffee, cotton, and cashew nuts, cloves (Zanzibar’s principal export, cultivated mainly on the island of Pemba), tobacco, tea, sisal, pyrethrum, coconuts, sugar, cardamom, and groundnuts. Exports of cut flowers commenced in the mid-1990s.

5
Tanzania’s mineral resources include diamonds, other gemstones, gold, salt, phosphate, coal, gypsum, kaolin, tin, limestone, and graphite, all of which are exploited. There are also reserves of nickel, silver, copper, cobalt, lead, soda ash, iron ore, tungsten, pyrochlore, magnetise, niobium, titanium, vanadium, uranium, and natural gas. Dar es Salaam is the main port area as well as the dominant industrial centre. It is also the focus of government and commercial activity, although the administrative functions of the capital city are scheduled to be transferred to Dodoma by 2005. Dar es Salaam has been growing at a substantial rate and attempts are being made to decentralise industrial development to other centres. Arusha has also been growing rapidly in recent years, partly because of its importance to tourism. Considerable variation in the pattern of development occurs within Tanzania. In some areas agriculture is becoming much more orientated towards cash crops. In a country of Tanzania’s geographical magnitude distance to market is an important factor, and in successive development plans major attempts have been made to improve the main and subsidiary communication networks. The TanZam road and Tazara railway are important additions, leaving only the far west and the south-east without good surface links to the rest of the country. 2.3 Political Background
2.3.1 History (Pre/post Independence) The 19th century history of the area that is now the United Republic of Tanzania was shaped by the extension of the caravan trade from Zanzibar into the far interior to the eastern Congo and Buganda. It was this traffic, dominated by Omanis, which carried the Swahili language from the coast and established it as the commercial lingua franca of the region. By the same agency, Islam was conveyed inland. On 9 December 1961 Tanganyika became a sovereign independent state, and exactly one year later the country adopted a republican form of government. In 1964 the Zanzibar Sultanate was overthrown by a revolt of the Afro Shiraz Party leaders, who established the People’s Republic of Zanzibar. On 26 April 1964 Tanganyika, Zanzibar, and Pemba combined to form the United Republic of Tanzania. Prior to independence the East Africa High Commission had been administering services of an inter-territorial nature for Kenya, Tanzania, and Uganda and this continued after independence. The arrangement was changed to the East African Community in 1967. The community practically ceased to function after 30 June 1977, chiefly because of the failure to reach a budget agreement and the refusal of President Nyerere to negotiate with President Iddi Amin of Uganda. A new deal to re-establish the defunct EAC was signed on 30 November 1999 by the heads of state of Kenya, Tanzania, and Uganda.
6
Following the union of Tanganyika and Zanzibar a new constitution was introduced in July 1965 providing for a one-party state (although, until 1977, TANU and the ASP remained the respective official parties of mainland Tanzania and Zanzibar, and co-operated in affairs of state). In September 1965, Nyerere returned to power in the first one-party election. Nyerere was re-elected president in 1970, 1975, and 1980, which he announced would be his last. Early in 1967, TANU accepted a programme of socialism and self-reliance, known as the Arusha Declaration. A number of new initiatives were immediately implemented. Party leaders were required to divest themselves of private sources of income. Rural development was to be achieved, not through large farms but through community (Ujamaa) villages. The small urban sector was to be completely re-organised in order to serve the mass of the population rather than to train a privileged few. Commercial banks and many industries were immediately nationalised. A wide variety of other new measures were introduced but proved difficult to implement as they ran counter to existing trends of social change. Consequently, the socialist programme never materialised in raising standards for Tanzania’s people and it was gradually abolished throughout the 1980s and 1990s.
2.3.2 Constitution and Government The United Republic of Tanzania was established on 26 April 1964 when Tanganyika and Zanzibar, hitherto separate independent countries merged. The interim Constitution of 1965 was replaced on 25 April 1977, by a permanent constitution for the United Republic. In October 1979 the Revolutionary Council of Zanzibar adopted a separate Constitution, governing Zanzibar’s internal administration, with provisions for a popularly elected President and a legislative House of Representatives elected by delegates of the ruling party at the time. A new Constitution for Zanzibar, which came into force in January 1985, provided for direct elections to the Zanzibar House of Representatives. Although at present under the same Constitution as Tanzania, Zanzibar has in fact been ruled by decree since 1964. The Union Constitution provides for the President as the Head of State, Head of the Government and Commander- in-Chief of the armed forces. The Prime Minister is the Leader of Government Business in the National Assembly. Legislative power is exercised by the Bunge (Parliament) of the United Republic, which is vested by the constitution with complete governing powers. The Parliament comprises both directly elected and nominated members and has a term of five years. The accent of the President is necessary before any law is passed in the National Assembly. The President presides over the Cabinet, which comprises the Prime Minister and other ministers who are appointed from among members of Parliament.
7
The Legal System of Tanzania is based on English common law. The Judicial Branch is made up of the Court of Appeal, the High Court, the District Courts, and the Primary Courts. The Independence of Judges is secured by provisions, which prevent their removal except on account of misbehaviour or incapacity, for which they may be dismissed at the discretion of the President.
2.3.3 Political Forces The Nyerere period from 1959-85 was marked by a one-party state and a centrally planned economy. In this First Phase Government all major means of production were owned by the Government. The Mwinyi Presidency (Second Phase Government) coincided with a worsening economic crisis, which forced the new administration to alter the direction of its economic policy. Greater encouragement was given to the private sector, and acceptance of proposals from the IMF on budgeting, agricultural reform, and management of the shilling persuaded donors to sponsor the country with large disbursements of aid. In December 1991 the presidential commission that was established to ascertain public opinion on possible electoral reform published recommendations for the establishment of a multi-party political system. The constitution was amended to this effect and it stipulates that all new political parties should command support in both Zanzibar and mainland Tanzania, and should be free of tribal, religious, and racial bias in order to protect national unity. In October 1995 multi-party legislative elections were held for the first time, concurrently with presidential elections, both in Zanzibar and throughout the Tanzania union. The ruling party, CCM, achieved a convincing majority at the national legislative elections, winning 186 of the 232 elective seats in the national assembly. The Civic United Frond (CUF) – a party favouring Zanzibar autonomy – secured 24 seats, NCCR-Mageuzi 16, and Chadema and the UDP took 3 seats each. Apart from CUF, which has a strong establishment in Zanzibar, the rest of the opposition parties are generally very weak and fragmented. This has been evidenced in several by-elections since 1995 in which the ruling party won every time. A main cause for the weakness of the opposition parties has been the constant internal power struggle and embezzlement of funds provided by the government.
2.3.4 International Relations Tanzania is a member of the United Nations (and its specialised agencies including UNIDO, World Bank, IMF, WHO etc), the Organization of African Unity, the Commonwealth, SADC, and EAC, and is one of ACP states for purposes of co-operation into the EU. Being an active member of the Non Aligned Movement, Tanzania has a good and stable relationship with most countries in the world. There are over 50 diplomatic representations (Embassies and High Commissions) in Tanzania. The country also maintains more than 30 diplomatic representations abroad.
8
2.4 The Economy
2.4.1 Preamble Following independence in 1961 Tanzania embarked on a socialist path that placed wide emphasis on social development (alleviation of illiteracy, poverty, and disease) at the expense of the productive sectors. A politically determined direction, which had the adverse effect of leading the domestic economy into a very strained condition. The Arusha Declaration of 1967 envisaged the elimination of the economic ills by way of a programme based on central planning and self- reliance. The new measures did not, however, result in greater prosperity. On the contrary; after more than a decade of severe economic decline – from the late 1970s onwards – the country was brought to a condition of economic collapse. Consequently, in order to preserve a constant flow of aid from international donors, the government adopted a more pragmatic approach to economic planning, starting from the mid-1980s. But into the 1990s the aims of the Arusha Declaration still had not been fully achieved, just as the economy was continuously in a poor state. Tanzania performed significantly worse than its northern neighbour, not only in terms of production and trade but also when it came to social factors such as education and public health. The new administration, headed by President Mkapa, acknowledged that improvement within these areas would have to be based on sustainable economic growth, which in turn should be achieved on the basis of a full-blown market economy. Hence, Mkapa implemented a tight monetary and fiscal policy, which soon brought inflation under control. The policy move was followed by the introduction of the Sustainable Industrial Development Policy 1996-2020 (SIDP). The main objective of the SIDP is (1) to contribute towards the achievement of the overall national long-term development goals as stipulated in the national mission, and (2) to enhance sustainable development of the industrial sector. With regard to the latter, a number of objectives have been defined. They include human development and creation of employment opportunities, economic transformation for achieving sustainable economic growth through the private sector, and obtaining external balance of payments. In order to implement the SIDP, the following general policy strategies have been proposed:
• To re-define the role of government to concentrate on policy formulation and provision of enabling environment rather than direct involvement in industrial production
• To encourage private sector participation through increased private sector investment in the industrial sector
• To encourage fair trade practices and competition in the industrial sector • To improve the trade regime so that it will stimulate exports of industrial
products • To improve the economic infrastructures which have direct connection to
industrial activities
9
On the concrete level the SIDP articulates objectives for short, medium, and long-term implementation phases of the strategies. In the first phase from 1996 to 2000, the plan is to implement the following activities:
• Consolidation and rehabilitation of the existing industrial capacities • Reactivating commercial efficiency and optimum utilisation of existing
industrial capacities • Placing top priority on resource based industries in which Tanzania has
potential to develop competitive advantage, particularly agro-allied industries • Finalisation of privatisation of public enterprises and ironing out of
bottlenecks which impede industrial production • Provision of fiscal and monetary incentives to facilitate development of the
sector
During the medium term phase (2001-2010), a set of additional strategies will be pursued. They include:
• Creation of new industrial production capacities • Promotion of intermediate goods, light capital goods, and machinery
industries, preparation for the exploitation of the country’s iron ore deposits
On the basis of the two initial strategy plans the third phase strategy, which is to be implemented in 2011-2020, will be to:
• Use domestic capital and capability earned over the first two phases to go into investments in capital goods industries
The Tanzanian government hence launched the SIDP in order to promote private sector- led industrialisation and to stimulate a competitive industrial sector. However, the private sector stakeholders have recognised the absence of a year-on-year implementation schedule for SIDP as a major shortfall of the document. The private sector also believes that the policy is inadequate and that strategic targets for industrial development are not clearly defined. Both the public and private sector stakeholders agree on the need for an in-depth analysis of the industrial sector focusing on growth potentials, competitiveness analysis and investment opportunities in key sub-sectors to support policy analysis and formulation. Despite the shortcomings of the policy document, first measures have been undertaken as part of the short-term priority programme.
2.4.2 Gross Domestic Product (GDP) In 1998 the GDP at factor cost for Mainland Tanzania reached TZS 5,048 billion (US$ 7,594 million) - equivalent of TZS 170,835 per capita. In constant 1992 prices GDP grew by 4.0 percent in 1998, compared with a growth rate of 3.3 percent in 1997. Given the annual population growth rate of 2.8 percent, real per capita income in Tanzania mainland grew at a higher rate of 1.2 percent in 1998, compared to a rate of 0.5 percent recorded in 1997.

10
The GDP growth rate of 4.0 percent attained in 1998 was above the targeted growth of 3.5 percent for the period1. The mining and construction sectors experienced strongest growth in 1998 recording rates of 27.4 percent and 12.0 percent respectively. Table 2.1 Summary of Economic Growth Indicators (for Mainland Tanzania only)
1992 1993 1994 1995 1996 1997 1998 GDP at factor cost – billion TZS in current prices
1,276 1,608 2,125 2,797 3,453 4,281 5,125
GDP at factor cost – million US$ in current pric es
4,285 3,967 4,170 4,865 5,952.9 6,994.7 7,594.4
GDP – TZS per capita in current prices
50,431 61,837 79,600 101,696 121,998 147,134 170,843
GDP at factor cost – billion TZS in 1992 prices
1,276 1,281 1,299 1,345 1,402 1,448 1,506
GDP – TZS per capita in 1992 prices
50,432 49,269 48,650 48,918 49,530 49,767 50,194
Population – in million
25.3 26.0 26.7 27.5 28.3 29.1 30.0
GDP – annual growth rate
1.8 0.4 1.4 3.6 4.2 3.3 4.0
Source: Bank of Tanzania, 1999
2.4.3 Labour Force The development of the labour force has been characterised by rapid growth from 1980 to 1997. The increase from 9 to 16 million represents an annual growth rate of 3.1 percent, which is considerably higher than world average. Estimates for the next ten years are also pointing to a higher growth rate for the labour force in Tanzania than the global mean level, although not quite as high as in the period 1980-1997. Table 2.2 Labour Force (population – aged 15-64)
Millions Average annual growth rate (%)
1980 1997 2010 80-97 97-2010 9 16 21 3.1 2.2
World Development Indicators, 1999
Even though the industrial sector with a total of about 5.0-5.5 percent only contributes very limited to the national employment, the sector has the highest level of labour productivity of the three main sectors in Tanzania. In 1997 the industrial sector as a whole (manufacturing, mining, construction, and utilities) contributed about 19 percent of total output in Tanzania, which is four times higher than the sector’s share of total employment (i.e. output/employment rate). While services only accounted for a 3:1 rate and the agricultural sector generated output at a volume half of the level, which the sector contributed to the labour force. In this respect, it is interesting to note that Tanzania in fact has a higher than world average output/employment rate for all three sectors, which suggests that the productivity level in Tanzania is not as bad as could be expected from an economy with an otherwise profound developing profile.
1 The GDP growth rate for 1999 is estimated at 5.0 percent but no exact figures are available.
11
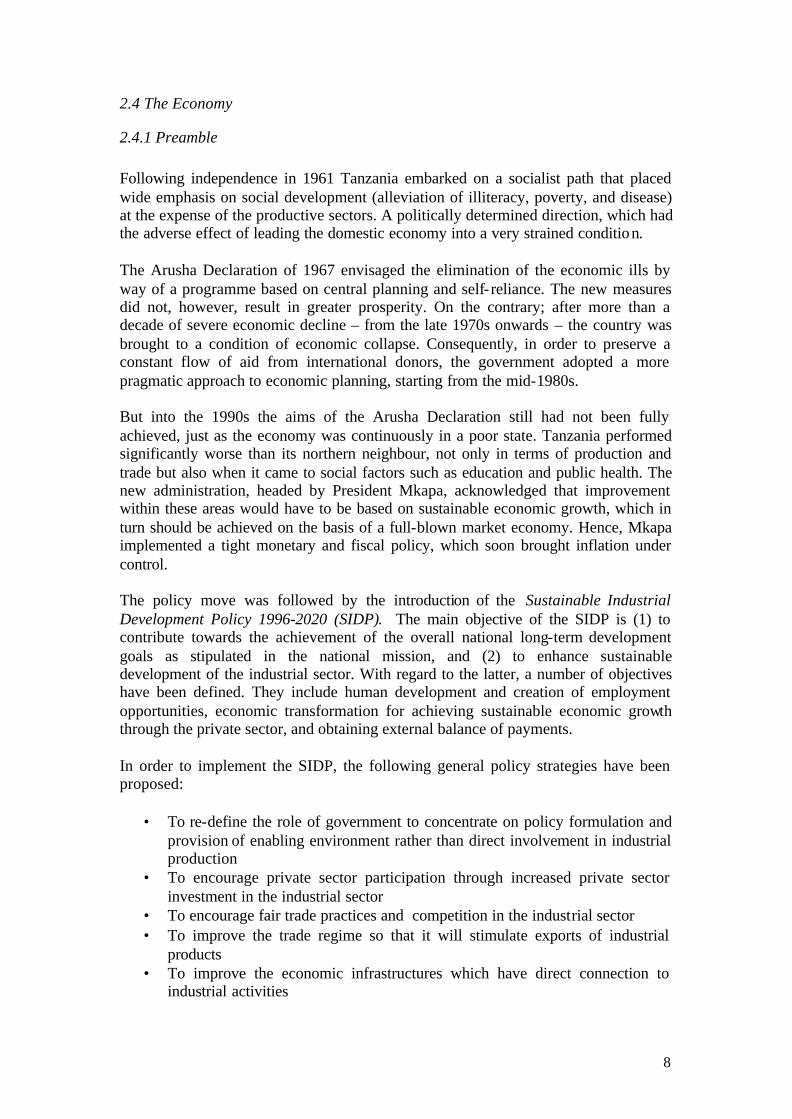
Table 2.3 Output/Employment Distribution Agriculture Industry Services Total 1980 1997 1980 1980 1997 1997 1980 1997 Output –Tanzania
50 47 22 19 28 31 100 97
Output – World average
7 4 38 32 56 61 101 97
Employment – Tanzania
86 85 5 5 10 11 101 101
Employment – World average
54 50 19 19 25 29 98 98
Source: World Development Indicators, 1999/CTI-DI estimates
2.4.4 Key Sectors According to projections from the Bureau of Statistics the agricultural sector is projected to register a real GDP growth of 3.3 percent in 2000. The same level of growth will be maintained through to the year 2002. 2.4.4.1 Agriculture The agricultural sector is the mainstay of Tanzania’s economy, providing a livelihood for about 85 percent of the economically active rural population and accounting for 60 percent of export earnings in 1997. Subsistence farming accounts for about one-half of total agricultural output. Only about eight percent of the country’s land area is cultivated, and only about four percent of the cultivated land is irrigated. The main food crop is maize followed by cassava, sorghum, rice, millet, and plantains. The main export crops in 1996 were coffee beans and raw cotton, followed by cashew nuts, cloves (from Zanzibar), tobacco, tea, and sisal. The performance of the agricultural sector has been modest over the past several years. Agricultural GDP has grown at 3.3 percent per year since 1985 and production of the main food crops has only increased by 3.5 percent and export crops at about 5.4 percent. Today, the agricultural sector is consequently confronted by numerous constraints, such as low technology, poor credit facilities, poor infrastructure, as well as high transport costs, multiple taxes and levies, poor marketing and distribution systems, and inadequate post harvest processing. The agricultural production in Tanzania can increase if it supports local value-addition through agro-processing and improves marketing and distribution of agricultural crops. The government has accordingly placed top priority on forming a strategy for the development of the necessary links to agriculture: infrastructure, legal framework, taxation, affordable credit, and investment incentives. By dealing with constraints that affect the agricultural sector it is the ambition that production will increase and subsequently lead to new investments in agro-processing and other related industries.

12
2.4.4.2 Mining Tanzania has diverse mineral deposits. These can be classified as precious minerals (gold, diamonds, tanzanite, and rubies), industrial minerals (iron, tin, copper, phosphate, limestone, and gypsum) and fuels (coal and natural gas). During the pre-independence period gold and diamonds alone generated more than ten percent of the GDP. But due to the unfavourable investment climate of the central planning era, the mining sector gradually lost its generating capacity, reaching an absolute low of 1.1 percent of total GDP in 1992. Since then the sector has regained some of its dynamics. In 1998 mining contributed two percent to GDP, based on significant growth rates of 27.4 percent in 1998 and 17.1 percent in 1997. The improvement in performance can mainly be attributed to increased mineral exploration activities, following the introduction of investor friendly mining policies and the relaxed financial regime, which have been instituted in recent years. Whereas polices prior to 1990 discouraged private investment in exploration for minerals the new policy incentives include: • A lift on the ban on mining of gemstones in the country • The abolition of export levies and stamp duties on foreign sale • A year- long tax-break incentive to new investors. Despite its still limited contribution to the total GDP, mining contributes a significant share of export earnings. As a result of current investment activities, it is expected that the mining sector will increase Tanzania’s foreign exchange earnings by 50 percent over the next three years. 2.4.4.3 Tourism Tanzania has a significant tourist potential. About 15 percent of its total landmass is reserved for tourism. The tourist potential of Tanzania with its magnificent game parks, reserves, and unspoiled beaches, has not been fully developed. National parks and protected areas cover an estimated area of 142,000 km2. This is three times the size of Kenya’s total tourism area. After many years of neglect, tourism has been declared a high priority sector and private sector involvement is on the rise. Tanzania has finally managed to reverse the traditional image of being an unknown tourist destination. The country is now considered to be one of the best tourist destinations in Africa. With tourism earnings increasing each year the sector is already registering considerable growth. This has been made possible following the trade liberalisation policy, which attracted private investment in the sector, and also efforts made to advertise Tanzania’s tourism potentials. The future policy strategy is geared towards promoting “low volume, high yield tourism”.

13
Tourist arrivals increased by 78 percent between 1992 and 1997. Consequently total earnings shot up by 227 percent. The average expenditure per tourist climbed by an impressive 84 percent. Data from the Ministry of Natural Resources and Tourism show that during 1998 a total of 482,331 tourists visited the country spending more than US$ 570 million. During the same period, the sector employed 132,000 people. 2.4.4.4 Manufacturing Despite numerous efforts to create a dynamic industrial environment Tanzania persistently has a small and underdeve loped manufacturing sector. Most initiated manufacturing investments have not survived for long, mainly because of insufficient infrastructure and inefficient macroeconomic policies. The sector has continuously been dominated by under-funded and mismanaged parastatal ventures – leftovers from the central planning system – which are now being privatised, but will need a near complete overhaul before a substantial growth can be expected. As such there is a residual manufacturing capacity present that could be assisted to survive and over time compete with imports. It will, however, require heavy capital investments and new technology. A much encouraged mean in this direction is the establishment of joint ventures with foreign partners, who can supply capital and technology, or outright privatisation through direct private investment. Currently, the span of Tanzania’s manufacturing industry is relatively narrow. It comprises processing and packaging, textiles and garments, steel and steel products, petroleum and chemicals, and non-metallic products. After many years of poor performance most of these sectors have started to grow, predominantly as a result of foreign investment in existing but underachieving domestic companies. New joint ventures include cement companies, Tanzania Breweries, Tanzania Cigarette Company, and Kilombero Sugar Company. It is expected that more private investment will come forth as more manufacturing parastatals are privatised. Despite the somewhat positive development the manufactur ing sector is still facing difficulties. The sector is picking up slowly and is expected to do so for the foreseeable future. Following years of negative growth rates positive signs have been noticed since the mid-1990s. A growth rate of 1.6 percent was recorded in 1995, increasing to 4.8 percent in 1996, 5.0 in 1997 and 8.1 percent growth in 1998. Hence, the sectors’ share of GDP has increased slightly from 7.9 percent in 1995 to 8.4 percent in 1998. The growth was mainly attributed to the economic liberalisation measures, notably the restructuring of the parastatal sector, implemented by the Presidential Parastatal Sector Reform Commission. During the period between August 1993 and June 1999, a total of 191 entities were privatised out of 410 earmarked under the privatisation programme. Notable improvement has been recorded in the production of beer (15 percent) Konyagi (7.8 percent), wheat flour (13 percent) pyrethrum extract (182.4 percent) cement (28.8 percent). However, due to lack of working capital low production was recorded in fishnets, kibuku, cigarettes, textiles, rolled steel, and radios.

14
Scope for private sector investment and major industry players The turn-around of the manufacturing industry to some extent rests on investment by foreign companies. Opportunities exist in the chemical industries sub sector as there is local demand for fertilisers, pesticides, pharmaceuticals, and petro-chemicals, which is currently met through imports. Other opportunities exist in the production of building materials, metal working, and local assembly. Despite the current poor state of the sector, some industries have already registered increased production. According to a study that was recently conducted by Economic and Social Research Foundation (ESRF) a good number of small and medium sized new private companies have already started displaying a good performance. It is further anticipated that the improvement of the water and power situation will make a positive contribution to this growth. There have also been some notable and high profile successes involving major international investors. These include among many others: • The sale of 50 percent of the shares in Tanzania Breweries to South African
Breweries for US$ 19 million worth of equipment and services and a US$ 3.5 million cash injection. This was followed in 1998 by the flotation of 20 percent of the remaining government shares on the local stock exchange
• The sale of Tanga Cement Company, 60 percent going to Holderbank. • The sale of a 51 percent stake in the Tanzania Cigarette Company to RJ Reynolds • The sale of 75 percent of shares of Kilombero sugar to Illovo of South Africa and
IDF and M of England • The construction and subsequent commissioning of a $35 million Coca-Cola
bottling plant in Dar es Salaam • The set up of several fish processing plants in Mwanza
2.4.5 Inflation, Money Supply and Interest Rates Inflation, as measured by the consumer price index, slowed down substantially from levels of 25 percent during early 1996 to single digit levels during the first half of 1999, whilst the inflation rate for June 1999 was measured at 7.7 percent. Non food inflation, with a weight of only 28.8 percent was slightly lower at 7.3 percent. However, large price increases still occurred in sectors such as clothing and footwear (13.4 percent) and fuel, electricity, and water with increases of 11.2 percent compared to the same month a year ago. The average inflation for the first six months of 2000 (8.5 percent) is the lowest inflation rate over the past twenty years. Growth in M3 is in line with the target range of 10 percent to 12.4 percent as determined by the Bank of Tanzania. Policy measures applied by the Bank of Tanzania to achieve certain monetary targets include foreign exchange interventions, minimum reserve requirements, and repurchase agreements.

15
The nominal discount rate is also on the decline with a rate of 12.2 percent in June 1999, resulting in a real rate of 4.5 percent.
2.4.6 Foreign Trade Tanzania’s dependency on imported goods is reflected in the deficit on its trade balance. The economy’s inability to be self-sufficient in terms of consumer goods is a major obstacle as more than 35 percent of merchandise imports are consumer goods, of which nearly half is accounted for by the demand for food products. During the first half of 1999 the trade deficit was TZS 345 billion as exports declined from almost TZS 170 billion in the last quarter of 1998 to a mere TZS 135 billion. Imports, however, are still on the increase, totalling TZS 481 billion in the first half of 1999. Table 2.4 Foreign Trade (in million TZS) Period Total Exports Total Imports Trade Balance 1993 181,147 531,741 - 350,594 1994 265,176 666,258 - 401,081 1995 390,378 770,778 - 380,400 1996 455,419 702,440 - 247,021 1997 459,549 703,106 - 243,557 1998 391,804 907,494 - 515,690 1999 (1st half) 135,737 481,171 - 345,433 Source: Bank of Tanzania, 1999
With regards to the balance of payments the large trade deficit was the main factor behind a significant overall balance deficit of TZS 417 billion in 1998. The services and investment account balances are also in the red, whereas the capital account shows a surplus. The gross reserves of the Bank of Tanzania increased by almost 10 percent to TZS 445.8 billion during the first half of this year and represent an improvement in import cover to five months. However, this is still below the level of six months of import cover recorded during the fourth quarter of 1997. Furthermore, should imports of services be included, this ration could decrease substantially as services imports account for a significant share of total imports. Overall foreign reserves at the end of June 1999 totalled just more than TZS 472.3 billion of which the commercial banking sector contributed almost 60 percent. Table 2.5 Balance of Payments (in TZS)
1994 1995 1996 1997 1998 Trade account - 401,081 - 380,400 - 247,021 - 243,557 - 515,689 Services (net) - 43,354 - 124,584 - 161,793 - 187,375 - 288,333 Investment Income - 62,430 - 63,378 - 36,921 - 75,602 - 75,319 Transfers (net) 146,020 194,389 196,341 162,973 259,992 Current account - 360,845 - 373,974 - 249,394 - 343,562 - 619,350 Capital account 133,845 109,693 110,794 102,180 183,117 Financial Account - 54,466 61,302 11,900 - 74,647 34,161 Errors and omission 53,814 - 11,671 - 3,218 - 71,153 - 15,152 Overall balance - 227,652 - 214,649 - 129,917 - 387,182 - 417,223 Source: Bank of Tanzania, 1999

16
3. The Manufacturing Sector and the National Economy 3.1 Background Tanzania’s manufacturing sector has long suffered serious constraints. In the 1970s and 1980s they predominantly consisted of external shocks such as high oil prices and interest rates. In recent years focus has been more on infrastructure difficulties as well as a disability to keep track with a changing global order. The problems in infrastructure are illustrated by the repeated water-supply crises in the capital area, which generates as much as 70-80 percent of total industrial output in the country. The lack of stable water supplies is first of all affecting the breweries and distillers in Dar es Salaam. Moreover, irregular power supplies from the Tanzania Electricity Supply Company (Tanesco) are continuously causing troubles for the local manufacturers. With regard to the problems of adjusting the manufacturing sector to the structures of globalization, this situation reflects especially two negative conditions: 1) inability to compete in world markets; 2) inability to promote the Tanzanian industry and attract foreign investors. Tanzania’s share of international industrial markets is almost non-existent, as documented by a foreign exchange earning on manufactures of only US$ 72 million in 1998. If not counting the foreign participation in the three largest manufacturing companies in the country foreign direct investments to Tanzania’s manufacturing industry is also very limited, especially compared to other transition economies. The problems of inadequate infrastructure and adjusting to globalisation – which could be said to constitute an internal and external dimension respectively – are intimately related. Hence, the fact that the cost of electricity currently exceeds that of most countries in Sub-Saharan Africa by as much as 30-50 percent is generally presented as the main barrier to potential foreign investors to Tanzania. The following section of the report is looking into the current condition of the manufacturing sector in the context of the national economy. The manufacturing sector is examined on the basis of key economic indicators such as GDP, investment allocation, employment, and foreign trade. 3.2 Manufacturing and GDP Given the severity of past and present obstacles it is hardly surprising that the manufacturing sector contributes a very small share of nationa l income. As table 3.1 shows the agricultural sector was by far the largest sector and generated altogether 739 billion TZS (monetary and non-monetary sector) of national income in 1998 (in 1992 prices), up from 532 billion in 1988. Manufacturing only accounted for 126 billion in 1998, an increase of 29 billion compared to 1988.

17
Table 3.1 GDP at Sector Level in 1992 prices (100 million TZS) Sector 1992 1993 1994 1995 1996 1997 1998Agriculture 612 631 644 680 708 725 739Manufacturing 104 105 105 106 111 117 126Electricity and water supply 19 19 20 21 23 24 25Construction 68 58 59 50 54 58 65Mining and quarrying 13 15 17 19 20 24 30Industry 214 197 201 196 208 223 246Public administration and other services 117 112 112 109 111 115 118Trade, restaurants and hotels 202 201 203 210 218 229 239Transport, and communication 66 66 66 70 71 75 79Financial and business services 72 76 78 77 75 84 91Less: Financial services indirectly measured -56 -63 -68 -65 -58 -72 -78Services 401 392 391 401 417 431 449Owner of occupied dwellings 55 57 59 61 63 65 66Total GDP at factor cost 1,272 1,277 1,295 1,338 1,396 1,444 1,500Source: Bank of Tanzania, 1999 / CTI-DI calculations Data for Mainland Tanzania only
In percentage figures this means that the manufacturing sector generated only 8.4 percent of total GDP - a marginal increase from 1992 - whereas the agricultural sector accounted for a total share of 49.1 percent of GDP. Table 3.2 GDP at Sector Level in 1992 prices (%) Sector 1992 1993 1994 1995 1996 1997 1998Agriculture 48.0 49.3 49.6 50.7 50.6 50.1 49.1Manufacturing 8.2 8.2 8.1 7.9 8.0 8.1 8.4Electricity and water supply 1.5 1.6 1.6 1.6 1.7 1.7 1.7Construction 5.4 4.6 4.6 3.8 3.9 4.1 4.4Mining and quarrying 1.1 1.1 1.3 1.4 1.5 1.7 2.0Industry 16.2 15.5 15.6 14.7 15.1 15.6 16.5Public administration and other services 9.2 8.8 8.7 8.2 8.0 7.9 7.8Trade, restaurants and hotels 15.8 15.7 15.7 15.7 15.6 15.8 15.9Transport, and communication 5.2 5.2 5.1 5.3 5.1 5.2 5.3Financial and business services 5.7 6.0 6.0 5.7 5.4 5.9 6.1Less: Financial services indirectly measured -4.5 -5.0 -5.3 -4.8 -4.2 -5.0 -5.2Services 31.4 30.7 30.2 30.1 29.9 29.8 29.9Owner of occupied dwellings 4.4. 4.5 4.6 4.5 4.4 4.5 4.4Total GDP at factor cost (in %) 100.0 100.0 100.0 100.0 100.0 100.0 100.0Total GDP at factor cost (100 million TZS) 1,272 1,277 1,295 1,338 1,396 1,444 1,500Source: Bank of Tanzania Data for Mainland Tanzania only Although still only contributing very limited to the total GDP, the development of the manufacturing sector has more or less resembled that of the economy in general. The performance of the manufacturing sector in comparison to other important sectors is depicted in table 3.3 and chart 3A. From the table distribution it can be observed that manufacturing recorded the highest growth rates in the years where the economy in general expanded the most.
18
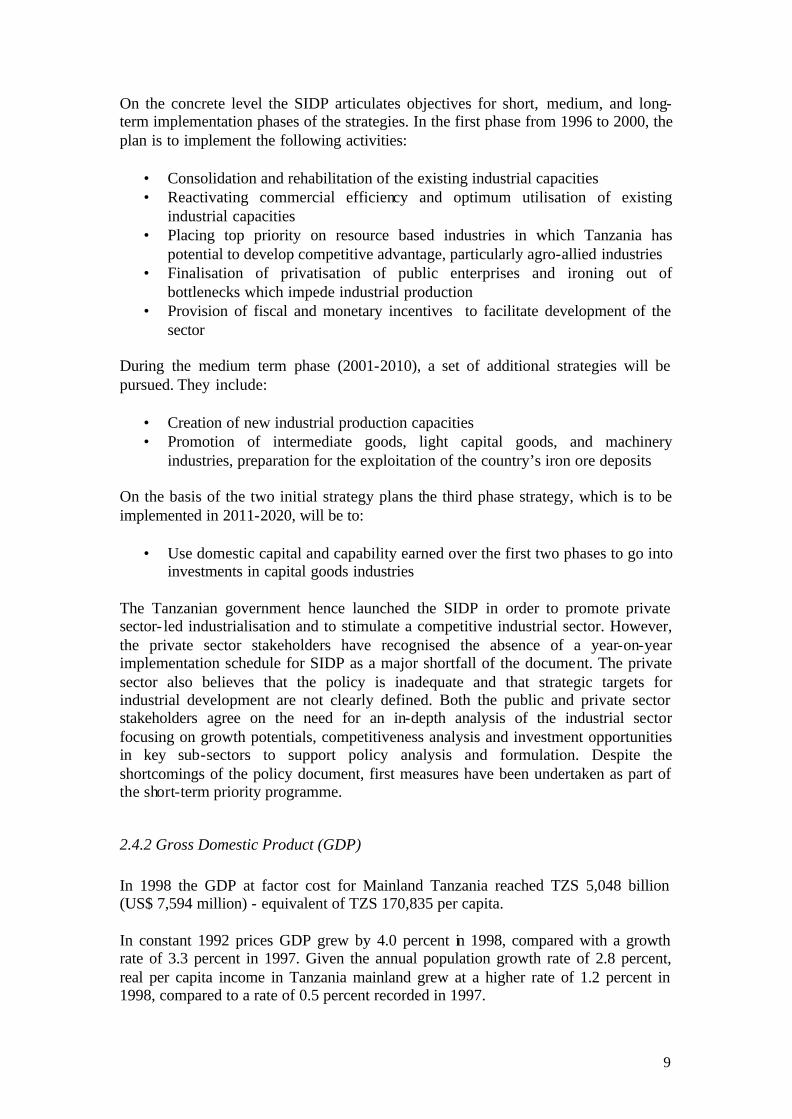
Table 3.3 Growth Rates by Sector in Monetary GDP (1992 prices) Sector 1992 1993 1994 1995 1996 1997 1998 Agriculture 0.4 3.0 2.4 6.6 4.5 1.5 2.3 Mining and quarrying 7.7 8.2 15.0 11.7 9.6 17.1 27.4 Manufacturing -0.4 0.6 -0.2 1.6 4.8 5.0 8.0 Electricity and water -1.3 0.9 2.0 6.1 11.1 2.2 5.5 Construction 6.6 -17.7 1.3 -18.9 9.4 10.0 12.0 Trade, restaurants and hotels -0.7 -0.4 1.1 3.5 3.5 5.0 4.7 Transport/communication 14.2 0.1 0.9 5.9 1.1 4.9 6.2 Financial/business services 4.3 6.1 2.4 -1.4 -1.7 11.5 7.7 Public administration 5.6 -3.9 -0.1 -2.7 1.6 3.2 2.7 Total Monetary GDP 1.6 -0.6 1.2 3.2 4.6 3.2 4.9 Total GDP (monetary and non-monetary)
1.8 0.4 1.4 3.6 4.2 3.3 4.0
Source: Bank of Tanzania, 1999
Chart 3A illustrates the same findings as table 3.3, but on the basis of index numbers. From the chart it is evident that whereas the development of the agricultural sector has been almost similar to manufacturing, services and total GDP, it is the mining and quarrying sector that has experienced the by far most positive development in recent years. Chart 3A
3.3 Investment Up until the reforms in the mid-1980s Tanzania’s economic policies encouraged public sector investment. Private sector investment was actively discouraged through the introduction of a complex system of regulations and licenses. There was also preferential treatment of the public sector in credit allocation.
50
100
150
200
1992 1993 1994 1995 1996 1997 1998
Agriculture
Mining and quarrying
Manufacturing
Electricity and water supply
Construction
Trade, restaurants, and hotels
Transport and communication
Financial and business services
Other services

19
Hence, the public sector heavily influenced domestic investment activity and came to dominate major parts of the economy. The government preference was mainly for large and capital intensive investment project – most often in infrastructure – rather than in smaller but more directly productive investments. The result was that public sector investment superseded private investments all the way up to the early 1980s. However, with the introduction of the market-based reforms the development has changed to the benefit of private investment. This trend has been accentuated throughout the 1990s, not only as a consequence of the shift in policy but also because a increasing lack of public resources has hampered new public infrastructure investments. The development is illustrated in table 3.4. Table 3.4 Private and Public Sector Investment 1967-1995 Shares of GDP Shares of GFCF2 1967-80 1981-85 1986-95 1967-80 1981-85 1986-95 Public investment 13.2 8.1 10.3 54.1 39.3 37.6 Private investment 11.3 12.5 17.6 45.9 60.7 62.4 Source: Bigsten & Danielsson When it comes to the sector level the development in the manufacturing sector has not followed the general trend. After a constant increase throughout the 1970s and the early 1980s, manufacturing gradually dropped its share of investments from 1984 to 1995. Reaching its peak with 27 percent of total investments in 1981, the manufacturing share decreased to a low of 10.1 percent in 1995. Table 3.5 Sector Level Investment (% of GFCF) Sector (origin/destination) 1981-1985 1986-1995 Agriculture 10.9 48.7 Mining and quarrying 0.3 0.2 Manufacturing 24.2 10.2 Electricity and water 8.8 4.9 Construction 9.4 8.2 Trade, restaurants, and hotels 2.3 1.5 Transport and communication 24.8 17.4 Financial and business services 3.8 1.0 Public administration and other services 15.2 7.9 Total percentage 100.0 100.0 Source: Likwelie, 1998
Since then there have, however, again been signs of growing investor focus on manufacturing. Although no exact figures are available it is estimated that investments into the manufacturing sector is now at a level of 15-20 percent of total investment. The resurgence of manufacturing investment is amplified by a significant increase in investment in equipment and machinery, which can be explained by an easier access to foreign exchange. The improved access to foreign exchange follows the introduction of various schemes, such as the Export Retention Scheme, Own Funded Import Scheme, Open General License System and Commodity Import Scheme.
2 GFCF = Gross Fixed Capital Formation
20
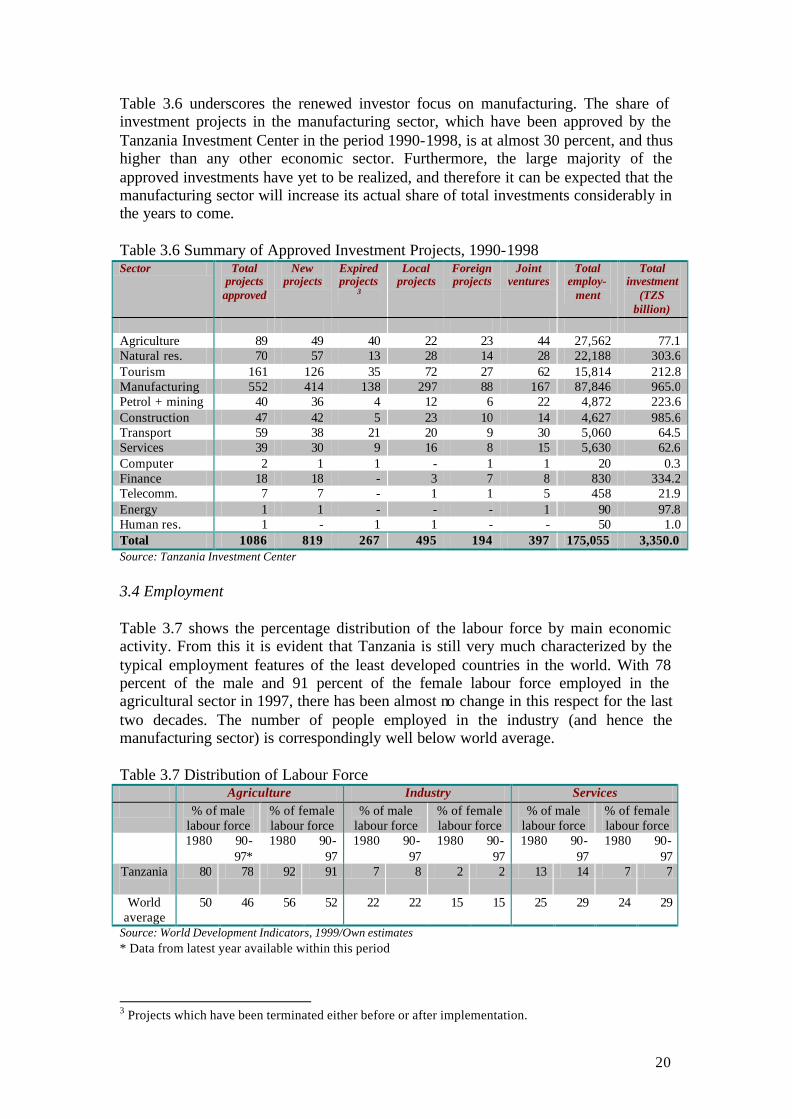
Table 3.6 underscores the renewed investor focus on manufacturing. The share of investment projects in the manufacturing sector, which have been approved by the Tanzania Investment Center in the period 1990-1998, is at almost 30 percent, and thus higher than any other economic sector. Furthermore, the large majority of the approved investments have yet to be realized, and therefore it can be expected that the manufacturing sector will increase its actual share of total investments considerably in the years to come. Table 3.6 Summary of Approved Investment Projects, 1990-1998 Sector Total
projects approved
New projects
Expiredprojects
3
Local projects
Foreign projects
Joint ventures
Total employ-
ment
Total investment
(TZS billion)
Agriculture 89 49 40 22 23 44 27,562 77.1 Natural res. 70 57 13 28 14 28 22,188 303.6 Tourism 161 126 35 72 27 62 15,814 212.8 Manufacturing 552 414 138 297 88 167 87,846 965.0 Petrol + mining 40 36 4 12 6 22 4,872 223.6 Construction 47 42 5 23 10 14 4,627 985.6 Transport 59 38 21 20 9 30 5,060 64.5 Services 39 30 9 16 8 15 5,630 62.6 Computer 2 1 1 - 1 1 20 0.3 Finance 18 18 - 3 7 8 830 334.2 Telecomm. 7 7 - 1 1 5 458 21.9 Energy 1 1 - - - 1 90 97.8 Human res. 1 - 1 1 - - 50 1.0 Total 1086 819 267 495 194 397 175,055 3,350.0 Source: Tanzania Investment Center
3.4 Employment Table 3.7 shows the percentage distribution of the labour force by main economic activity. From this it is evident that Tanzania is still very much characterized by the typical employment features of the least developed countries in the world. With 78 percent of the male and 91 percent of the female labour force employed in the agricultural sector in 1997, there has been almost no change in this respect for the last two decades. The number of people employed in the industry (and hence the manufacturing sector) is correspondingly well below world average. Table 3.7 Distribution of Labour Force
Agriculture Industry Services % of male
labour force % of female labour force
% of male labour force
% of female labour force
% of male labour force
% of female labour force
1980 90-97*
1980 90-97
1980 90-97
1980 90-97
1980 90-97
1980 90-97
Tanzania
80 78 92 91 7 8 2 2 13 14 7 7
World average
50 46 56 52 22 22 15 15 25 29 24 29
Source: World Development Indicators, 1999/Own estimates * Data from latest year available within this period
3 Projects which have been terminated either before or after implementation.

21
With about 145,000 people employed in 1999, the manufacturing sector’s share of total employment in the industrial sector is about 30 percent. Employment in manufacturing has been increasing in recent years, going up from 129,000 in 1996. The formal sector employs the large majority of workers.
Chart 3B Employment in Manufacturing
Source: Customs Department, 2000 3.5 Foreign Trade After a period of constant growth in the mid-1990s the export earnings for Tanzania’s manufacturing sector fell dramatically in 1998. In just one year total manufacturing exports dropped from 67 billion TZS in 1997 to 23 billion TZS in 1998 - a significant drop of 65 percent. The negative development continued in the first three quarters of 1999, where manufacturing exports only accounted for a total of 17.2 billion TZS, which was a small drop compared to the first three quarters of 1998. The fall in manufacturing export earnings is largely a reflection of the inability of the sector to compete in world markets. This will be elaborated on in a later section of the report. But the problems can also be traced to a general decrease in import volumes among Tanzania’s neighbours and closest trading partners. Moreover, considerable fluctuations in export prices throughout the whole of 1998 convinced many manufacturers to focus more on the domestic market, where the tight fiscal and monetary policies led to a more stable price/inflation development than experienced in many years. Hence, the negative development in Tanzania’s export earnings is not only confined to the manufacturing sector. Total commodity export earnings dropped by almost 15 percent from 1997 to 1998 (459 to 391 billion TZS) and continued to decline in the three first quarters of 1999.
1995 1996 1997 1998 1999110 000
115 000
120 000
125 000
130 000
135 000
140 000
145 000
150 000Formalsector
Non-formalsector

22
Table 3.8 Exports by Major Commodity Groups (percentage distribution) Cotton Coffee Sisal Tea Tobac-
co Cashewnuts
Petro-leum
Mineral Manu-factures
Other Total (billion. TZS)
1990 22.2 24.1 4.7 6.3 3.1 1.5 1.5 5.4 4.7 26.4 66.6
1994 20.1 22.2 1.0 7.6 4.0 10.0 1.1 5.8 14.7 13.5 265.2
1995 17.7 20.8 0.9 3.4 3.9 9.2 1.6 6.5 16.1 19.6 390.4
1996 17.5 18.8 0.7 3.3 6.2 10.4 1.7 6.9 14.2 20.4 455.4
1997 17.3 15.8 1.2 4.2 7.2 12.1 0.9 6.8 14.8 19.6 459.5
1998 8.1 18.4 1.2 6.3 9.4 18.3 0.0 4.5 6.1 29.0 391.9 1999* 210.0
Source: Bank of Tanzania, 1999 * First three quarters of the year Although the decline in exports has been general for all sectors, manufacturing has been the worst affected. In 1998 manufactures accounted for 6.1 percent of total commodity exports, less than half of the level from 1997. Thus the sector was only the seventh largest export sector in 1998 – a sharp decline from the year before when manufacturing was the fourth largest export sector. The majority of the manufactured exports are food products and textiles. In 1998 fish and other aquatic products accounted for almost 30 percent of Tanzania’s manufacturing exports. The predominant export destinations are Western Europe and a number of African former COMESA partners. In light of Tanzania’s recent move from COMESA to SADC the latter part of export destinations can probably be expected to change towards more focus on countries with high growth industries, such as South Africa and Botswana. Chart 3C Primary Export/Import Destinations (% of total – 3rd quarter 2000)4
4 Observe that the data in this chart merely reflects a quarterly development. No complete and recent data based on annual developments have been available for the purpose of this report.
0% 2% 4% 6% 8% 10% 12% 14% 16%
India
Kenya
United Kingdom
Japan
South Africa
United Kingdom
Kenya
Belgium
Ireland
Netherlands
% of Total
Source: Customs Department
Destination of Exports
Origin of Imports

23
On the import side manufactured products are strongly dominating. Manufactures and manufacturing inputs accounted for an estimated 75-805 percent of total commodity imports in 1998. With an estimated value of about 800 billion TZS manufacturing imports hence superseded manufacturing exports by a margin of approximately 33:1 in 19996. The main category of manufactured commodities is machinery, contributing about 25 percent of total imports. Also equipment and materials for the transportation and construction sectors are in high demand among Tanzanian importers. Table 3.9 Imports by Major Commodity Groups (percentage distribution)
Machines Ind. raw materials
Transp. equip.
Constr. equip.
Food Other cons. goods
Ferti-lizers
Oil Misc. goods
Total (billion TZS)
1990 15.7 25.2 13.5 14.4 4.6 11.2 0.6 14.3 0.13 265.8 1994 20.3 8.6 16.0 7.1 8.5 15.4 0.8 9.9 13.5 765.8 1995 19.0 26.2 13.6 3.2 2.9 21.7 0.8 12.6 0.0 885.9 1996 18.4 25.0 14.5 2.8 3.8 22.2 1.7 11.5 0.0 807.3 1997 17.1 14.1 19.3 6.5 7.4 20.9 1.7 13.1 0.0 808.2 1998 24.8 9.8 15.4 8.4 14.5 19.8 0.7 6.5 0.0 1043.1 Source: Bank of Tanzania, 1999 / CTI-DI calculations As for the origin of the imports it is mainly the closest neighbours and a number of industrialized countries that supply Tanzania’s manufacturing sector. Chart 3D shows that Japan in the third quarter of 1999 generated over 16 percent of Tanzania’s manufactured imports, of which the large majority were vehicles and electronic consumer goods. The largest regional trade partner, South Africa, predominantly supplies Tanzania with chemicals, foods, and machinery for industrial production.
5 An exact distribution between manufactured and non-manufactured products in some of the commodity groups (most notably food and foodstuffs) is difficult to find. Hence the estimation instead of precise figures. 6 It is worth noticing that whereas the total merchandise import figure, as measured in terms of aggregate commodity imports, was 1043 billion TZS in 1998 the import posting on Tanzania’s 1998 Balance of Payment account is only at 908 billion TZS. The reason for the discrepancy is that the Balance of Payment posting is calculated in net figures, while the merchandise import figure is based on estimations from the Customs Department and consequently includes c.i.f. (cost, insurance, freight) value in the total amount.

24
4. The Manufacturing Sector – Broad Sectoral Evaluation 4.1 Background The analysis carried out in this and the following chapter is based on the findings of a comprehensive survey of 203 manufacturing companies in Tanzania. The survey was conducted in the last half of 2000. A total of 400 questionnaires were distributed among manufacturing and related companies in Tanzania 7. Of this number, 248 were returned in a completed form. 203 of the 248 respondents are manufacturing enterprises, 27 are service-oriented enterprises, 14 are pure trading companies and 4 fall under the category “others.” The following section only concentrates on the findings among the manufacturing companies. The survey was stratified according to two main principles: a) all membership companies of the Confederation of Tanzanian Industries were issued a questionnaire; b) companies in a representative sub-sectoral pattern were randomly selected. The starting point of the survey was hence a list of 400 members and non-members of CTI, which were initially sent a questionnaire, either by post or e-mail. Afterwards a consultancy team performed the follow-up activities. This included personal visits and re-visits to respondents that either had not returned the questionnaire in time, or had not filled it out in a satisfactory manner. The questionnaire is attached in the appendix. In addition to the findings of the survey this section also includes information computed on the basis of material from other domestic and international sources. In this respect it is predominantly recent studies and surveys performed by Bureau of Statistics and UNIDO that are referred to. 4.2 Size and Composition of the Manufacturing Sector Determining the exact size of the manufacturing sector in Tanzania is difficult. Various recognized sources – such as the Bureau of Statistics, Tanzania Investment Center, the Company Registrar, Tanzania Revenue Authority, and others – have offered estimations but all admit not to have the complete information. The most recent census performed regarding industry quantities was a Bureau of Statistics investigation in 1996. This concluded that a total of 827 companies with a turnover above TZS 10 million constituted the manufacturing sector at the time of the data collection. Since the census was undertaken the Bureau of Statistics estimate that a net total (amount of new registered companies minus amount of liquidated companies) of about 170 companies have been added, making the current total of companies in the sector about 990. Valid data on liquidated enterprises is, however, very difficult to come by due to loose registration procedures. Consequently, the real number of currently operating manufacturing establishments may be considerably smaller.
7 300 questionnaires were sent to companies in Dar es Salaam; 40 to Arusha; 30 to Mwanza; and 30 to the rest of Tanzania.
25
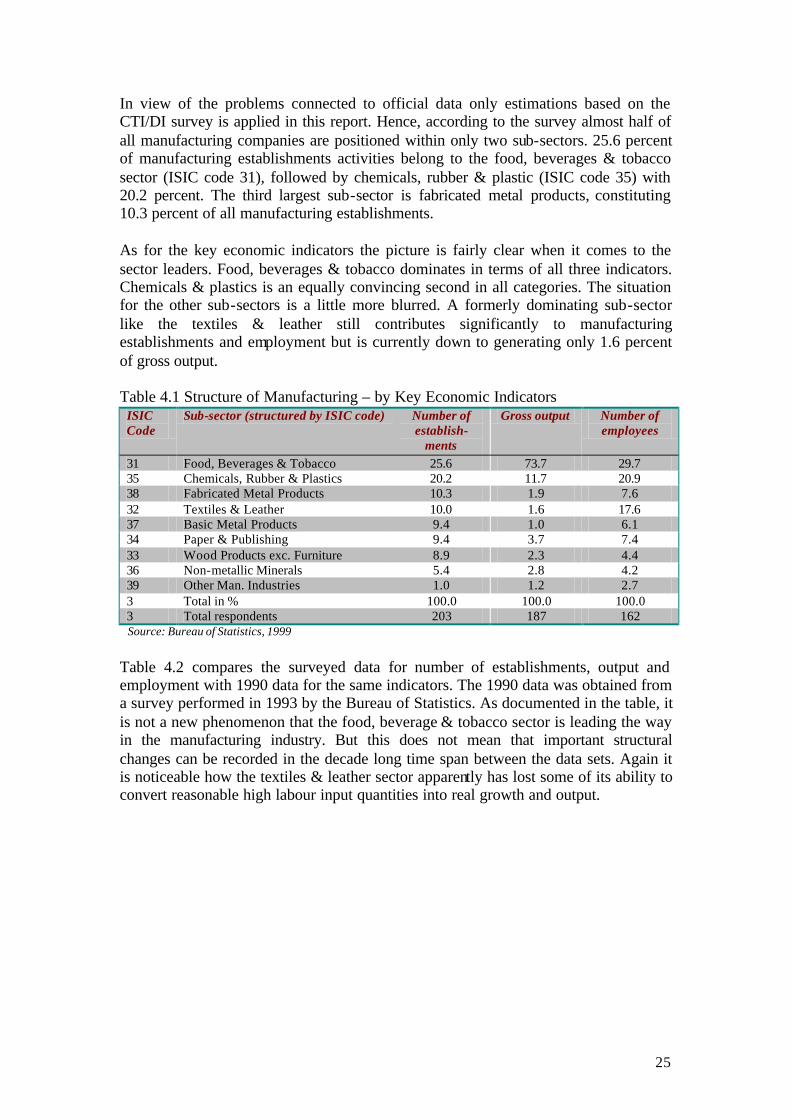
In view of the problems connected to official data only estimations based on the CTI/DI survey is applied in this report. Hence, according to the survey almost half of all manufacturing companies are positioned within only two sub-sectors. 25.6 percent of manufacturing establishments activities belong to the food, beverages & tobacco sector (ISIC code 31), followed by chemicals, rubber & plastic (ISIC code 35) with 20.2 percent. The third largest sub-sector is fabricated metal products, constituting 10.3 percent of all manufacturing establishments. As for the key economic indicators the picture is fairly clear when it comes to the sector leaders. Food, beverages & tobacco dominates in terms of all three indicators. Chemicals & plastics is an equally convincing second in all categories. The situation for the other sub-sectors is a little more blurred. A formerly dominating sub-sector like the textiles & leather still contributes significantly to manufacturing establishments and employment but is currently down to generating only 1.6 percent of gross output. Table 4.1 Structure of Manufacturing – by Key Economic Indicators
ISIC Code
Sub-sector (structured by ISIC code) Number of establish-
ments
Gross output Number of employees
31 Food, Beverages & Tobacco 25.6 73.7 29.7 35 Chemicals, Rubber & Plastics 20.2 11.7 20.9 38 Fabricated Metal Products 10.3 1.9 7.6 32 Textiles & Leather 10.0 1.6 17.6 37 Basic Metal Products 9.4 1.0 6.1 34 Paper & Publishing 9.4 3.7 7.4 33 Wood Products exc. Furniture 8.9 2.3 4.4 36 Non-metallic Minerals 5.4 2.8 4.2 39 Other Man. Industries 1.0 1.2 2.7 3 Total in % 100.0 100.0 100.0 3 Total respondents 203 187 162
Source: Bureau of Statistics, 1999
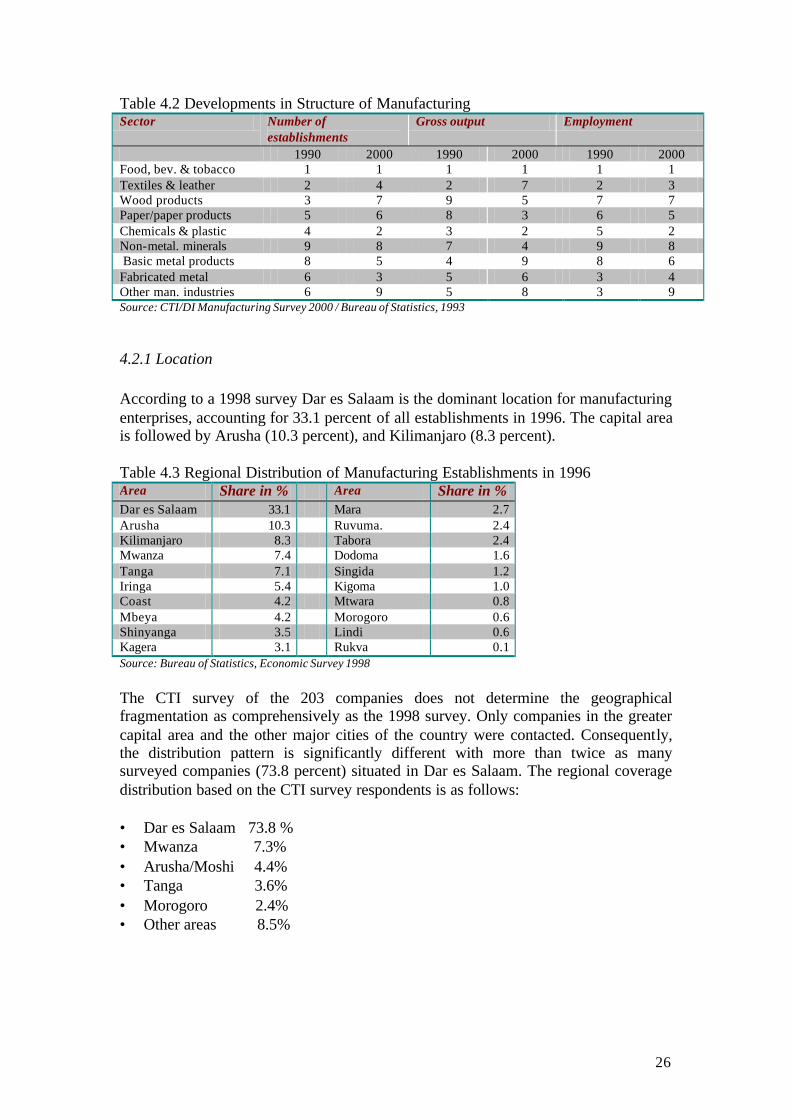
Table 4.2 compares the surveyed data for number of establishments, output and employment with 1990 data for the same indicators. The 1990 data was obtained from a survey performed in 1993 by the Bureau of Statistics. As documented in the table, it is not a new phenomenon that the food, beverage & tobacco sector is leading the way in the manufacturing industry. But this does not mean that important structural changes can be recorded in the decade long time span between the data sets. Again it is noticeable how the textiles & leather sector apparently has lost some of its ability to convert reasonable high labour input quantities into real growth and output.
26
Table 4.2 Developments in Structure of Manufacturing Sector Number of
establishments Gross output Employment
1990 2000 1990 2000 1990 2000 Food, bev. & tobacco 1 1 1 1 1 1 Textiles & leather 2 4 2 7 2 3 Wood products 3 7 9 5 7 7 Paper/paper products 5 6 8 3 6 5 Chemicals & plastic 4 2 3 2 5 2 Non-metal. minerals 9 8 7 4 9 8 Basic metal products 8 5 4 9 8 6 Fabricated metal 6 3 5 6 3 4 Other man. industries 6 9 5 8 3 9 Source: CTI/DI Manufacturing Survey 2000 / Bureau of Statistics, 1993
4.2.1 Location According to a 1998 survey Dar es Salaam is the dominant location for manufacturing enterprises, accounting for 33.1 percent of all establishments in 1996. The capital area is followed by Arusha (10.3 percent), and Kilimanjaro (8.3 percent). Table 4.3 Regional Distribution of Manufacturing Establishments in 1996 Area Share in % Area Share in % Dar es Salaam 33.1 Mara 2.7 Arusha 10.3 Ruvuma. 2.4 Kilimanjaro 8.3 Tabora 2.4 Mwanza 7.4 Dodoma 1.6 Tanga 7.1 Singida 1.2 Iringa 5.4 Kigoma 1.0 Coast 4.2 Mtwara 0.8 Mbeya 4.2 Morogoro 0.6 Shinyanga 3.5 Lindi 0.6 Kagera 3.1 Rukva 0.1 Source: Bureau of Statistics, Economic Survey 1998 The CTI survey of the 203 companies does not determine the geographical fragmentation as comprehensively as the 1998 survey. Only companies in the greater capital area and the other major cities of the country were contacted. Consequently, the distribution pattern is significantly different with more than twice as many surveyed companies (73.8 percent) situated in Dar es Salaam. The regional coverage distribution based on the CTI survey respondents is as follows: • Dar es Salaam 73.8 % • Mwanza 7.3% • Arusha/Moshi 4.4% • Tanga 3.6% • Morogoro 2.4% • Other areas 8.5%
27
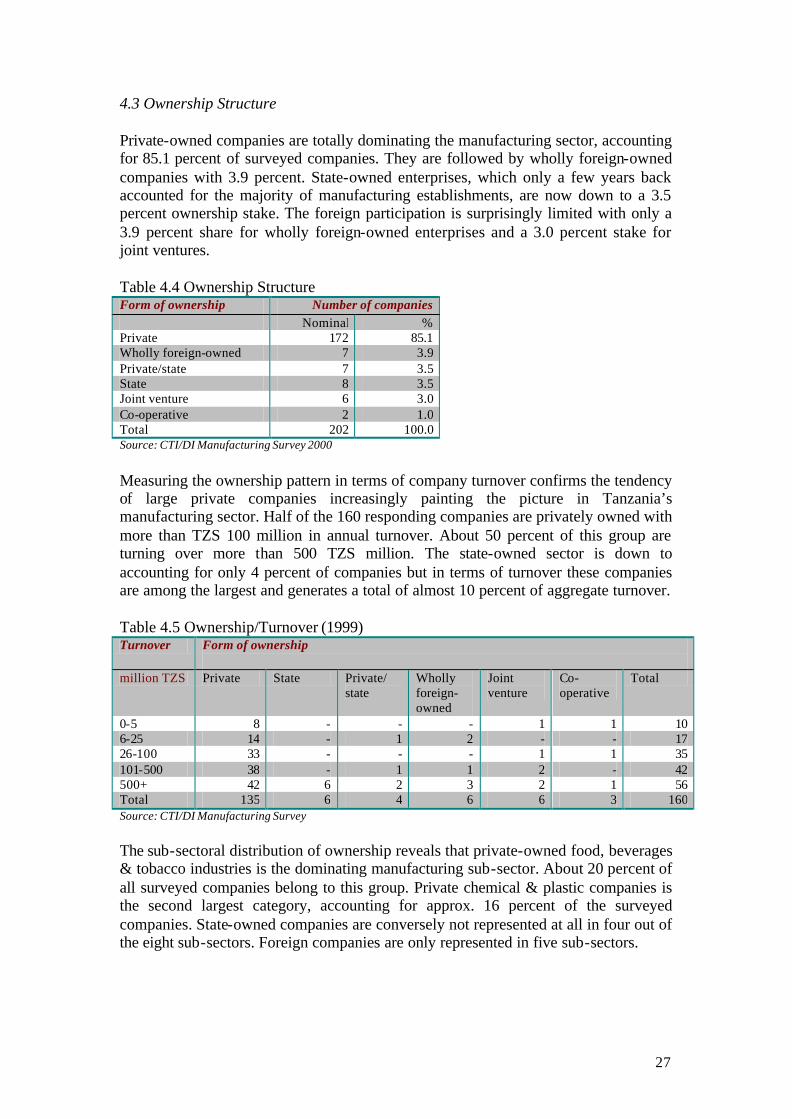
4.3 Ownership Structure Private-owned companies are totally dominating the manufacturing sector, accounting for 85.1 percent of surveyed companies. They are followed by wholly foreign-owned companies with 3.9 percent. State-owned enterprises, which only a few years back accounted for the majority of manufacturing establishments, are now down to a 3.5 percent ownership stake. The foreign participation is surprisingly limited with only a 3.9 percent share for wholly foreign-owned enterprises and a 3.0 percent stake for joint ventures. Table 4.4 Ownership Structure Form of ownership Number of companies Nominal % Private 172 85.1 Wholly foreign-owned 7 3.9 Private/state 7 3.5 State 8 3.5 Joint venture 6 3.0 Co-operative 2 1.0 Total 202 100.0 Source: CTI/DI Manufacturing Survey 2000
Measuring the ownership pattern in terms of company turnover confirms the tendency of large private companies increasingly painting the picture in Tanzania’s manufacturing sector. Half of the 160 responding companies are privately owned with more than TZS 100 million in annual turnover. About 50 percent of this group are turning over more than 500 TZS million. The state-owned sector is down to accounting for only 4 percent of companies but in terms of turnover these companies are among the largest and generates a total of almost 10 percent of aggregate turnover. Table 4.5 Ownership/Turnover (1999) Turnover Form of ownership
million TZS Private State Private/
state Wholly foreign-owned
Joint venture
Co-operative
Total
0-5 8 - - - 1 1 10 6-25 14 - 1 2 - - 17 26-100 33 - - - 1 1 35 101-500 38 - 1 1 2 - 42 500+ 42 6 2 3 2 1 56 Total 135 6 4 6 6 3 160 Source: CTI/DI Manufacturing Survey
The sub-sectoral distribution of ownership reveals that private-owned food, beverages & tobacco industries is the dominating manufacturing sub-sector. About 20 percent of all surveyed companies belong to this group. Private chemical & plastic companies is the second largest category, accounting for approx. 16 percent of the surveyed companies. State-owned companies are conversely not represented at all in four out of the eight sub-sectors. Foreign companies are only represented in five sub-sectors.

28
Table 4.6 Ownership by Sector Sub-sector Form of ownership Private State Private/
state Wholly foreign-owned
Joint venture
Co-oper.
Total
Food , Beverages & Tobacco 40 5 1 3 1 1 51 Textiles & Leather 19 - - - 1 - 20 Wood & Furniture 18 - - - - - 18 Paper & Publishing 18 1 - - - - 19 Chemicals & Plastics 33 - 3 2 3 - 41 Non-metallic Minerals 10 - 1 - - - 11 Metal 16 - 1 1 - 1 19 Machinery & Other Industries 18 1 1 2 1 - 23 Total 172 7 7 8 6 2 202 Source: CTI/DI Manufacturing Survey 2000
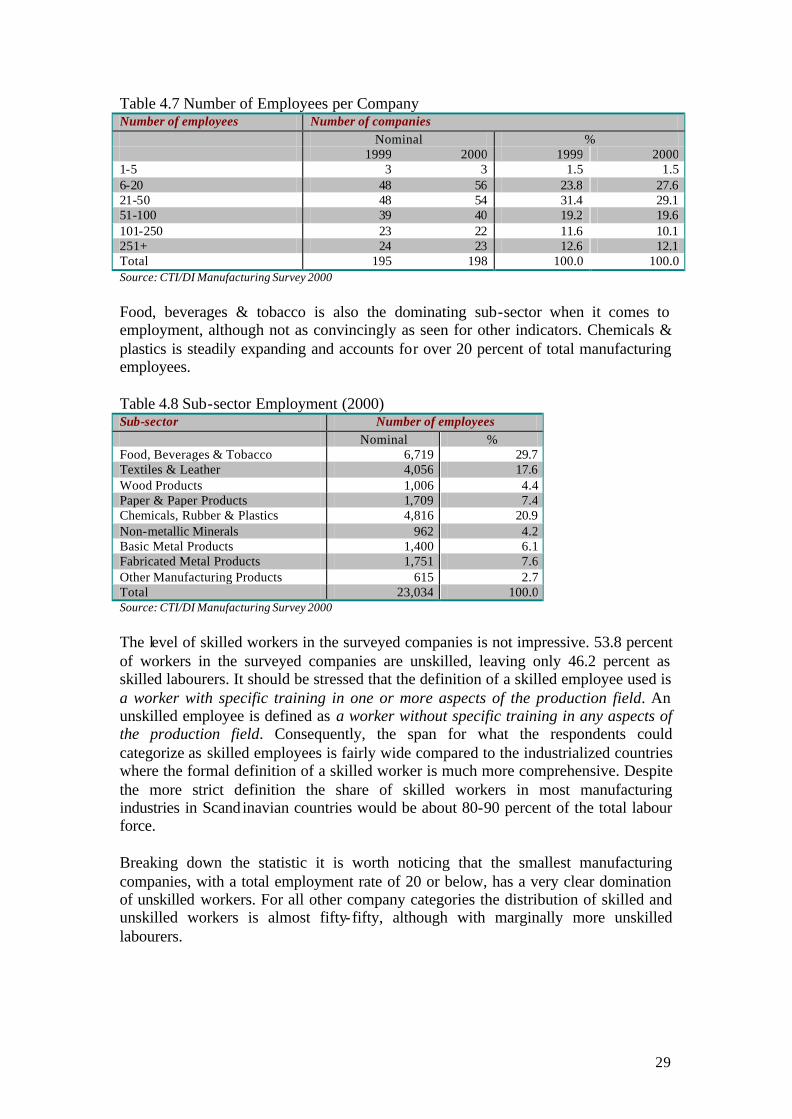
4.4 Employment The survey shows that a total of 23,034 people are currently employed in 194 out of the 203 manufacturing companies, which offered information about their employment situation in 2000. This is 538 less employees than the aggregate surveyed amount of employees in 1999. But since the total number of 23,572 employees in 1999 is compiled on the basis of 198 responding companies (four more than for year 2000) it is difficult to determine whether the employment rate in Tanzania’s manufacturing sector is de facto decreasing. The general employment development for manufacturing in the late part of the 1990s has – as illustrated previously in the report – been positive with a total of 145,000 people employed in manufacturing companies by the end of 1999, compared to only about 129,000 in 1996. Regardless of the exact size of employment in manufacturing the survey shows clear evidence of employment decline among a number of the large enterprises. 40 percent of the 45 largest enterprises reduced their staff (management, administration and worker labour force) between 1999 and 2000 and in fact four companies were relegated to SME status in this period. The remaining 60 percent of the large enterprises either slightly increased or remained at the same level of employment. The drop in total employment among respondents from 1999 to 2000 is supported by the fact that companies with 6-20 employees have increased their share of aggregate employment from 23.8 to 27.6 percent. Correspondingly, large companies with 100 or more employees have dropped from 24.2 to 22.2 percent of total number of companies. The majority of manufacturing companies have between 6 and 50 employees (56.7 percent in 2000).
29
Table 4.7 Number of Employees per Company Number of employees Number of companies
Nominal % 1999 2000 1999 2000 1-5 3 3 1.5 1.5 6-20 48 56 23.8 27.6 21-50 48 54 31.4 29.1 51-100 39 40 19.2 19.6 101-250 23 22 11.6 10.1 251+ 24 23 12.6 12.1 Total 195 198 100.0 100.0 Source: CTI/DI Manufacturing Survey 2000
Food, beverages & tobacco is also the dominating sub-sector when it comes to employment, although not as convincingly as seen for other indicators. Chemicals & plastics is steadily expanding and accounts for over 20 percent of total manufacturing employees. Table 4.8 Sub-sector Employment (2000) Sub-sector Number of employees Nominal % Food, Beverages & Tobacco 6,719 29.7 Textiles & Leather 4,056 17.6 Wood Products 1,006 4.4 Paper & Paper Products 1,709 7.4 Chemicals, Rubber & Plastics 4,816 20.9 Non-metallic Minerals 962 4.2 Basic Metal Products 1,400 6.1 Fabricated Metal Products 1,751 7.6 Other Manufacturing Products 615 2.7 Total 23,034 100.0 Source: CTI/DI Manufacturing Survey 2000
The level of skilled workers in the surveyed companies is not impressive. 53.8 percent of workers in the surveyed companies are unskilled, leaving only 46.2 percent as skilled labourers. It should be stressed that the definition of a skilled employee used is a worker with specific training in one or more aspects of the production field. An unskilled employee is defined as a worker without specific training in any aspects of the production field. Consequently, the span for what the respondents could categorize as skilled employees is fairly wide compared to the industrialized countries where the formal definition of a skilled worker is much more comprehensive. Despite the more strict definition the share of skilled workers in most manufacturing industries in Scandinavian countries would be about 80-90 percent of the total labour force. Breaking down the statistic it is worth noticing that the smallest manufacturing companies, with a total employment rate of 20 or below, has a very clear domination of unskilled workers. For all other company categories the distribution of skilled and unskilled workers is almost fifty-fifty, although with marginally more unskilled labourers.
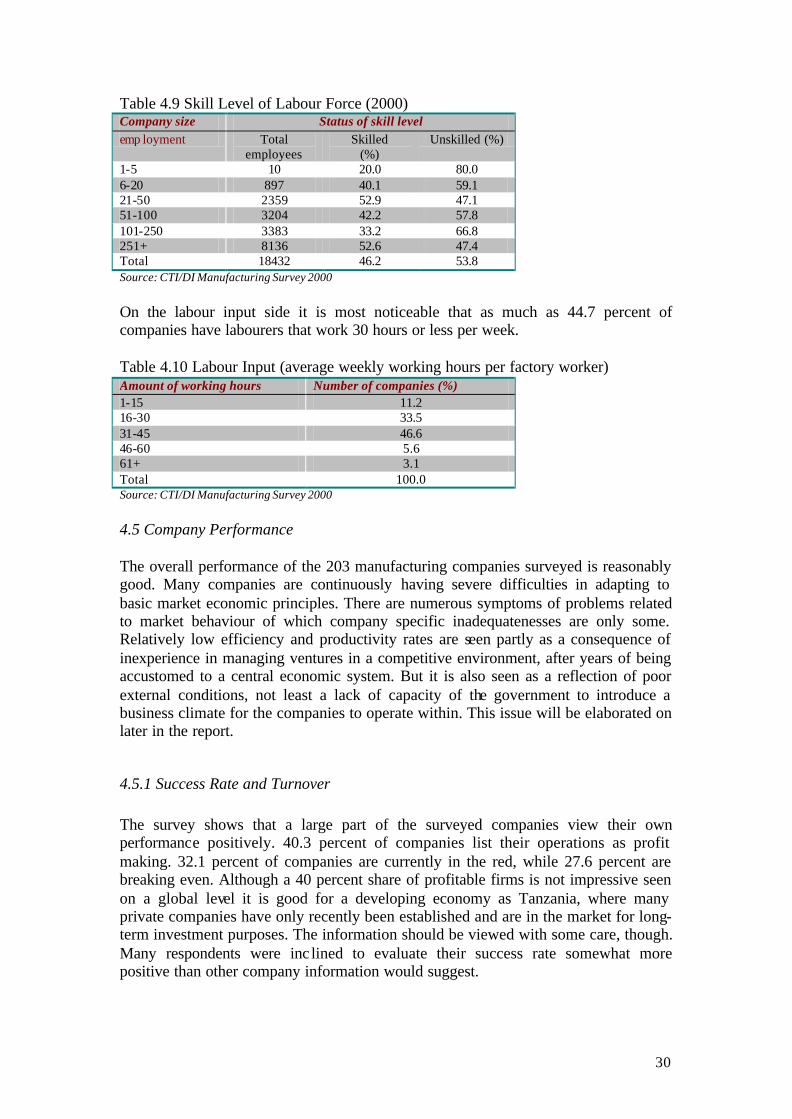
30
Table 4.9 Skill Level of Labour Force (2000) Company size Status of skill level emp loyment Total
employees Skilled
(%) Unskilled (%)
1-5 10 20.0 80.0 6-20 897 40.1 59.1 21-50 2359 52.9 47.1 51-100 3204 42.2 57.8 101-250 3383 33.2 66.8 251+ 8136 52.6 47.4 Total 18432 46.2 53.8 Source: CTI/DI Manufacturing Survey 2000
On the labour input side it is most noticeable that as much as 44.7 percent of companies have labourers that work 30 hours or less per week. Table 4.10 Labour Input (average weekly working hours per factory worker) Amount of working hours Number of companies (%) 1-15 11.2 16-30 33.5 31-45 46.6 46-60 5.6 61+ 3.1 Total 100.0 Source: CTI/DI Manufacturing Survey 2000
4.5 Company Performance The overall performance of the 203 manufacturing companies surveyed is reasonably good. Many companies are continuously having severe difficulties in adapting to basic market economic principles. There are numerous symptoms of problems related to market behaviour of which company specific inadequatenesses are only some. Relatively low efficiency and productivity rates are seen partly as a consequence of inexperience in managing ventures in a competitive environment, after years of being accustomed to a central economic system. But it is also seen as a reflection of poor external conditions, not least a lack of capacity of the government to introduce a business climate for the companies to operate within. This issue will be elaborated on later in the report.
4.5.1 Success Rate and Turnover The survey shows that a large part of the surveyed companies view their own performance positively. 40.3 percent of companies list their operations as profit making. 32.1 percent of companies are currently in the red, while 27.6 percent are breaking even. Although a 40 percent share of profitable firms is not impressive seen on a global level it is good for a developing economy as Tanzania, where many private companies have only recently been established and are in the market for long-term investment purposes. The information should be viewed with some care, though. Many respondents were inc lined to evaluate their success rate somewhat more positive than other company information would suggest.

31
Breaking down the success rate by company size it is interesting to notice that SMEs supposedly are faring better than large enterprises. 71.1 percent of SMEs formally recorded either profit or break-even status, compared with 56.4 percent for the larger companies. Table 4.11 Current Rate of Success Success status Number of companies (%) Large enterprises8 Small and medium-
sized enterprises All enterprises
Profitable 33.3 41.5 40.3 Break-even 23.1 29.6 27.6 Loss-making 43.6 28.9 32.1 Total 100.0 100.0 100.0 Source: CTI/DI Manufacturing Survey 2000 In terms of turnover the performance is also better than could be anticipated. In 1999 the share of companies with a turnover of more than 100 million TZS was 60 percent, up from 51 percent in 1998. More than half of this group even recorded a turnover rate of 500 million TZS or more. Table 4.12 Turnover (in million TZS) Turnover rate Number of companies (%) million TZS 1998 1999 0-5 10 6 6-25 14 11 26-100 25 22 101-500 24 26 500+ 27 35 Total 100 100 Source: CTI/DI Manufacturing Survey 2000
Total turnover for the responding share (159 companies) of surveyed companies was TZS 309.9 billion in 1999 (US$ 413 million) 9. This gives an average turnover rate for the respondents of TZS 2.0 billion (US$ 2.6 million). Compared to the 1998 level, where two companies less provided information about turnover (157 companies) a slight increase in turnover performance can be recorded in terms of TZS, but a marginal decrease is noted in USD terms. 1998 saw a total of TZS 276.9 billion (US$ 417 million) in turnover for the surveyed 159 companies. Equivalent to an average turnover rate of TZS 1.8 billion (US$ 2.7 million) per company. Overall the performance is hence satisfactory, since the modest fall in USD terms can be largely ascribed to the strengthened US currency.
8 More than 100 employees. 9 The TZS/US$ exchange rates for the three years examined were: 612:1 (1997); 664:1 (1998); 750:1 (1999).
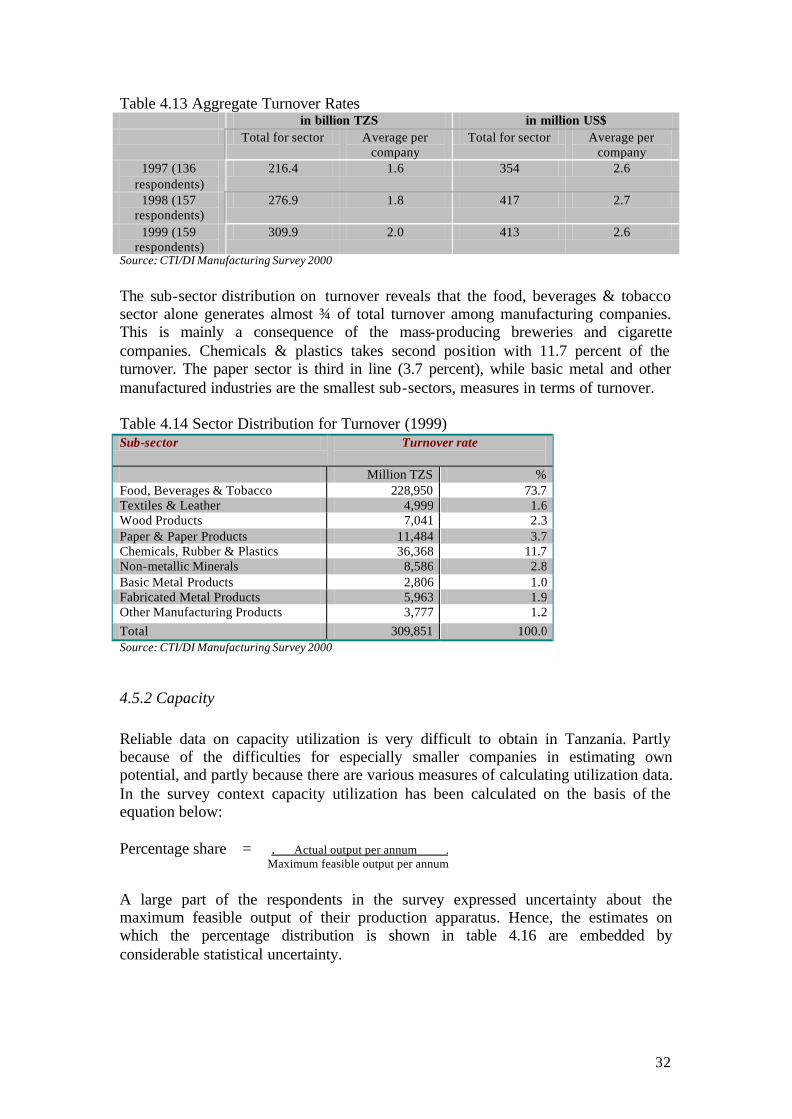
32
Table 4.13 Aggregate Turnover Rates in billion TZS in million US$
Total for sector Average per company
Total for sector Average per company
1997 (136 respondents)
216.4 1.6 354 2.6
1998 (157 respondents)
276.9 1.8 417 2.7
1999 (159 respondents)
309.9 2.0 413 2.6
Source: CTI/DI Manufacturing Survey 2000
The sub-sector distribution on turnover reveals that the food, beverages & tobacco sector alone generates almost ¾ of total turnover among manufacturing companies. This is mainly a consequence of the mass-producing breweries and cigarette companies. Chemicals & plastics takes second position with 11.7 percent of the turnover. The paper sector is third in line (3.7 percent), while basic metal and other manufactured industries are the smallest sub-sectors, measures in terms of turnover. Table 4.14 Sector Distribution for Turnover (1999) Sub-sector Turnover rate
Million TZS % Food, Beverages & Tobacco 228,950 73.7 Textiles & Leather 4,999 1.6 Wood Products 7,041 2.3 Paper & Paper Products 11,484 3.7 Chemicals, Rubber & Plastics 36,368 11.7 Non-metallic Minerals 8,586 2.8 Basic Metal Products 2,806 1.0 Fabricated Metal Products 5,963 1.9 Other Manufacturing Products 3,777 1.2
Total 309,851 100.0 Source: CTI/DI Manufacturing Survey 2000
4.5.2 Capacity Reliable data on capacity utilization is very difficult to obtain in Tanzania. Partly because of the difficulties for especially smaller companies in estimating own potential, and partly because there are various measures of calculating utilization data. In the survey context capacity utilization has been calculated on the basis of the equation below: Percentage share = . Actual output per annum . Maximum feasible output per annum A large part of the respondents in the survey expressed uncertainty about the maximum feasible output of their production apparatus. Hence, the estimates on which the percentage distribution is shown in table 4.16 are embedded by considerable statistical uncertainty.
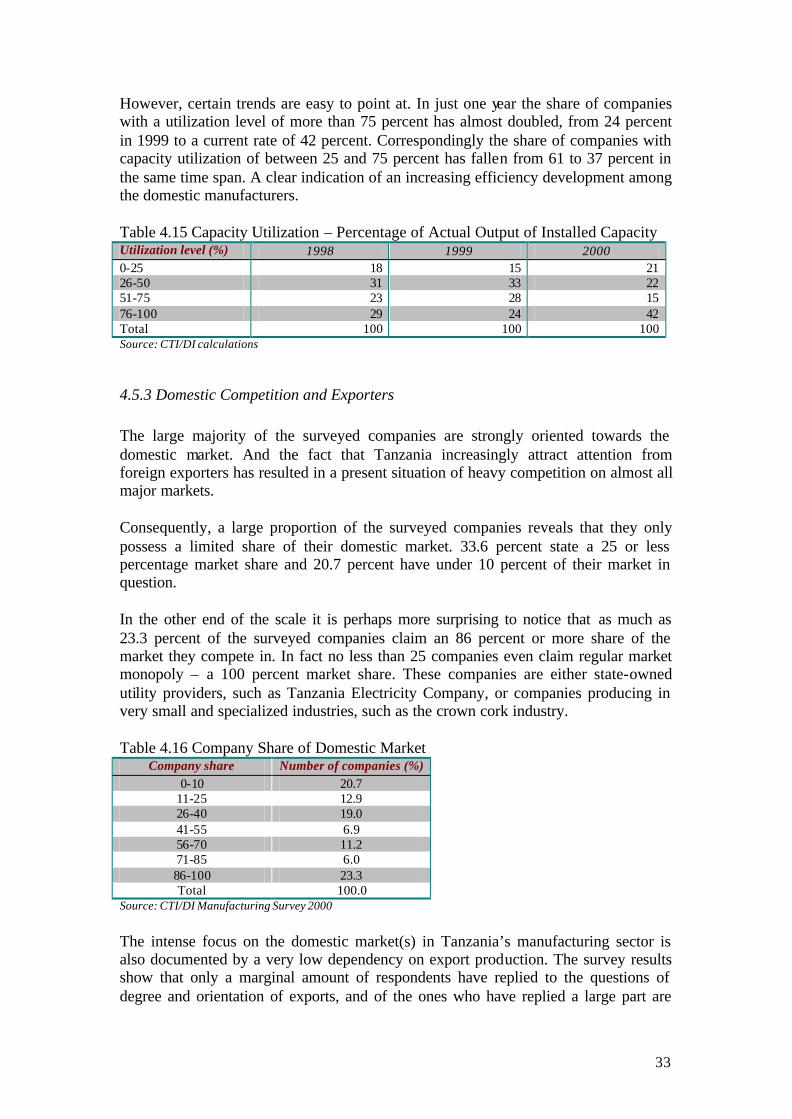
33
However, certain trends are easy to point at. In just one year the share of companies with a utilization level of more than 75 percent has almost doubled, from 24 percent in 1999 to a current rate of 42 percent. Correspondingly the share of companies with capacity utilization of between 25 and 75 percent has fallen from 61 to 37 percent in the same time span. A clear indication of an increasing efficiency development among the domestic manufacturers. Table 4.15 Capacity Utilization – Percentage of Actual Output of Installed Capacity Utilization level (%) 1998 1999 2000 0-25 18 15 21 26-50 31 33 22 51-75 23 28 15 76-100 29 24 42 Total 100 100 100 Source: CTI/DI calculations
4.5.3 Domestic Competition and Exporters The large majority of the surveyed companies are strongly oriented towards the domestic market. And the fact that Tanzania increasingly attract attention from foreign exporters has resulted in a present situation of heavy competition on almost all major markets. Consequently, a large proportion of the surveyed companies reveals that they only possess a limited share of their domestic market. 33.6 percent state a 25 or less percentage market share and 20.7 percent have under 10 percent of their market in question. In the other end of the scale it is perhaps more surprising to notice that as much as 23.3 percent of the surveyed companies claim an 86 percent or more share of the market they compete in. In fact no less than 25 companies even claim regular market monopoly – a 100 percent market share. These companies are either state-owned utility providers, such as Tanzania Electricity Company, or companies producing in very small and specialized industries, such as the crown cork industry. Table 4.16 Company Share of Domestic Market
Company share Number of companies (%) 0-10 20.7
11-25 12.9 26-40 19.0 41-55 6.9 56-70 11.2 71-85 6.0 86-100 23.3 Total 100.0
Source: CTI/DI Manufacturing Survey 2000
The intense focus on the domestic market(s) in Tanzania’s manufacturing sector is also documented by a very low dependency on export production. The survey results show that only a marginal amount of respondents have replied to the questions of degree and orientation of exports, and of the ones who have replied a large part are
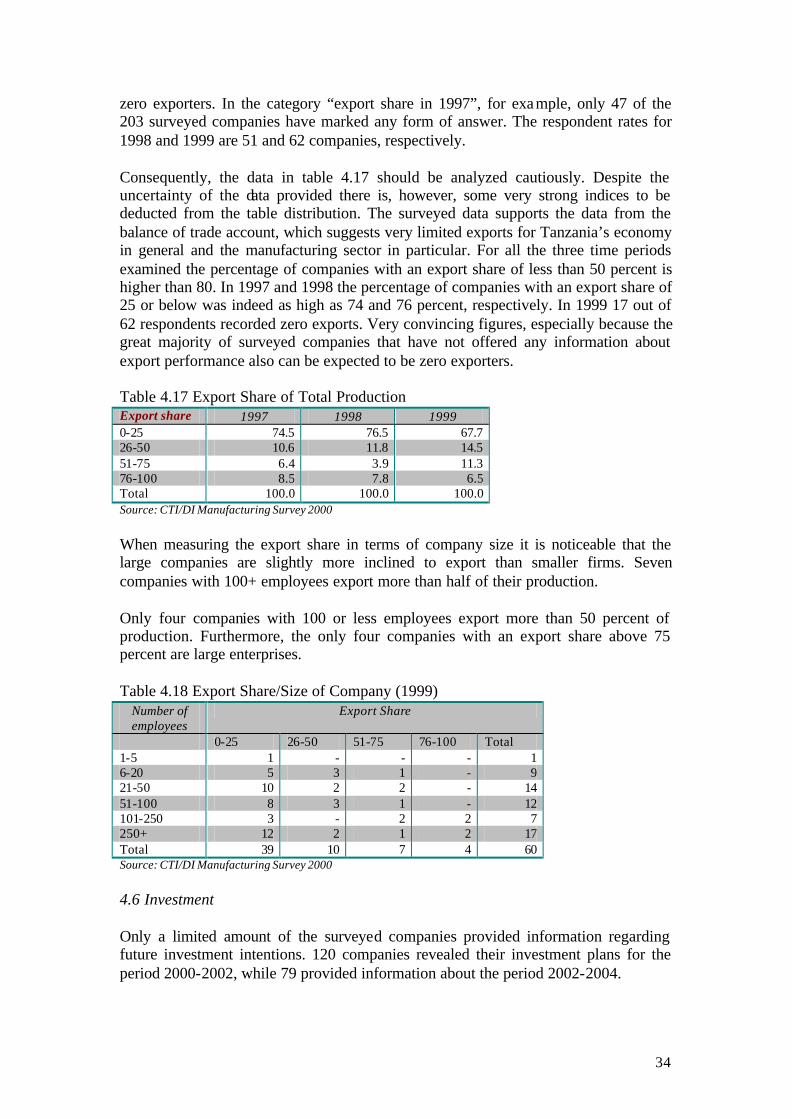
34
zero exporters. In the category “export share in 1997”, for example, only 47 of the 203 surveyed companies have marked any form of answer. The respondent rates for 1998 and 1999 are 51 and 62 companies, respectively. Consequently, the data in table 4.17 should be analyzed cautiously. Despite the uncertainty of the data provided there is, however, some very strong indices to be deducted from the table distribution. The surveyed data supports the data from the balance of trade account, which suggests very limited exports for Tanzania’s economy in general and the manufacturing sector in particular. For all the three time periods examined the percentage of companies with an export share of less than 50 percent is higher than 80. In 1997 and 1998 the percentage of companies with an export share of 25 or below was indeed as high as 74 and 76 percent, respectively. In 1999 17 out of 62 respondents recorded zero exports. Very convincing figures, especially because the great majority of surveyed companies that have not offered any information about export performance also can be expected to be zero exporters. Table 4.17 Export Share of Total Production Export share 1997 1998 1999 0-25 74.5 76.5 67.7 26-50 10.6 11.8 14.5 51-75 6.4 3.9 11.3 76-100 8.5 7.8 6.5 Total 100.0 100.0 100.0 Source: CTI/DI Manufacturing Survey 2000
When measuring the export share in terms of company size it is noticeable that the large companies are slightly more inclined to export than smaller firms. Seven companies with 100+ employees export more than half of their production. Only four companies with 100 or less employees export more than 50 percent of production. Furthermore, the only four companies with an export share above 75 percent are large enterprises. Table 4.18 Export Share/Size of Company (1999)
Number of employees
Export Share
0-25 26-50 51-75 76-100 Total 1-5 1 - - - 1 6-20 5 3 1 - 9 21-50 10 2 2 - 14 51-100 8 3 1 - 12 101-250 3 - 2 2 7 250+ 12 2 1 2 17 Total 39 10 7 4 60 Source: CTI/DI Manufacturing Survey 2000
4.6 Investment Only a limited amount of the surveyed companies provided information regarding future investment intentions. 120 companies revealed their investment plans for the period 2000-2002, while 79 provided information about the period 2002-2004.
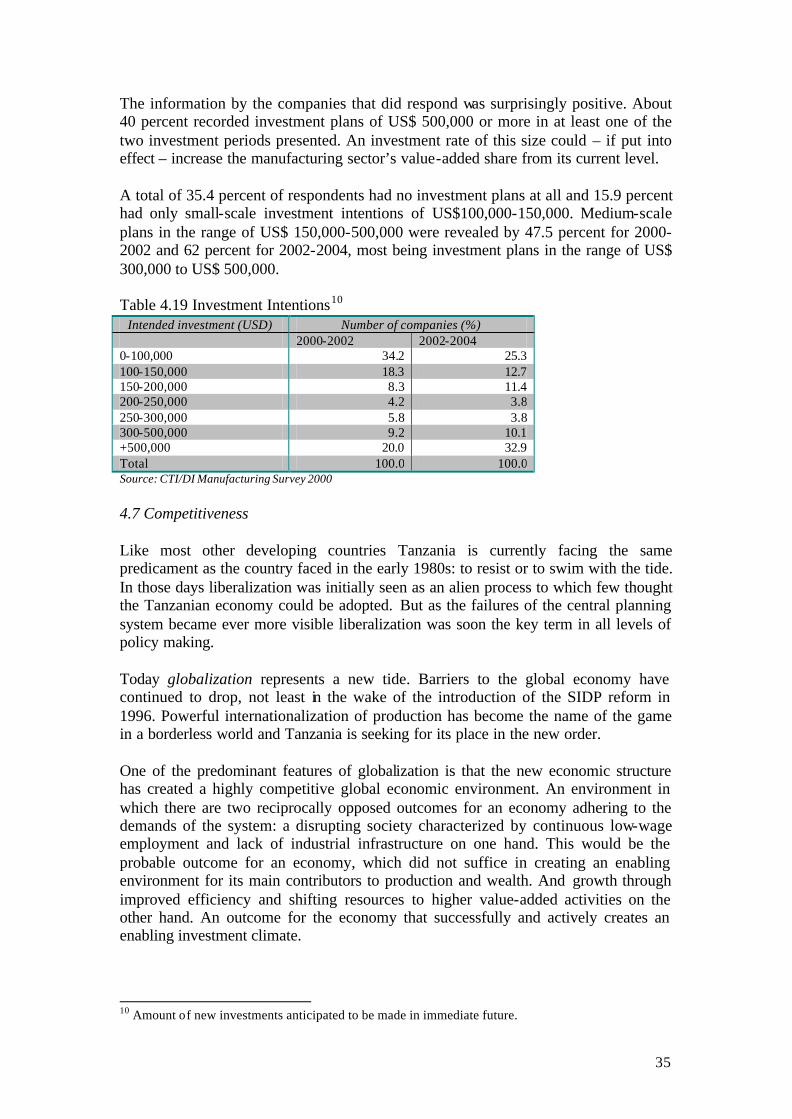
35
The information by the companies that did respond was surprisingly positive. About 40 percent recorded investment plans of US$ 500,000 or more in at least one of the two investment periods presented. An investment rate of this size could – if put into effect – increase the manufacturing sector’s value-added share from its current level. A total of 35.4 percent of respondents had no investment plans at all and 15.9 percent had only small-scale investment intentions of US$100,000-150,000. Medium-scale plans in the range of US$ 150,000-500,000 were revealed by 47.5 percent for 2000-2002 and 62 percent for 2002-2004, most being investment plans in the range of US$ 300,000 to US$ 500,000. Table 4.19 Investment Intentions10
Intended investment (USD) Number of companies (%) 2000-2002 2002-2004 0-100,000 34.2 25.3 100-150,000 18.3 12.7 150-200,000 8.3 11.4 200-250,000 4.2 3.8 250-300,000 5.8 3.8 300-500,000 9.2 10.1 +500,000 20.0 32.9 Total 100.0 100.0 Source: CTI/DI Manufacturing Survey 2000
4.7 Competitiveness Like most other developing countries Tanzania is currently facing the same predicament as the country faced in the early 1980s: to resist or to swim with the tide. In those days liberalization was initially seen as an alien process to which few thought the Tanzanian economy could be adopted. But as the failures of the central planning system became ever more visible liberalization was soon the key term in all levels of policy making. Today globalization represents a new tide. Barriers to the global economy have continued to drop, not least in the wake of the introduction of the SIDP reform in 1996. Powerful internationalization of production has become the name of the game in a borderless world and Tanzania is seeking for its place in the new order. One of the predominant features of globalization is that the new economic structure has created a highly competitive global economic environment. An environment in which there are two reciprocally opposed outcomes for an economy adhering to the demands of the system: a disrupting society characterized by continuous low-wage employment and lack of industrial infrastructure on one hand. This would be the probable outcome for an economy, which did not suffice in creating an enabling environment for its main contributors to production and wealth. And growth through improved efficiency and shifting resources to higher value-added activities on the other hand. An outcome for the economy that successfully and actively creates an enabling investment climate.
10 Amount of new investments anticipated to be made in immediate future.

36
In this respect the main task for Tanzania’s manufacturing sector is to develop a framework in which the companies operating within it can expand their competitiveness. This will require strategic resolving of a number of the issues, which are currently inhibiting company performance the most. Consequently, one of the objectives with the survey was to identify which factors the manufacturing companies currently perceive to have the most constraining impact on their business procedures and hence competitiveness. Not only factors related to government policies were examined, but also a set of factors with roots in civil society – e.g. social factors – were addressed in the survey.
4.7.1 Constraining Government Policies Chart 4A Specification of Most Constraining Government Policies
Source: CTI/DI Manufacturing Survey 2000
In the opinion of the Tanzanian manufacturing companies there is no doubt that the high cost of utilities is the most severe constraint to company competitiveness that can be related to government policies and actions. Utility costs was ranked to be the worst government constraint by 33 out of 102 respondents (32.3); the second worst
0 5 10 15 20 25 30 35
Lack of environmental regulation
Unclear roles of regulatory ag.
Abuse of tax exemptions
Regulation
Inconsistency of gov. policy
Inflation
No export incentives
Exchange rate
Poor infrastructure
Utility availability
Harrassment from off.
Late settlement of tax refund claims
Utility reliability
Taxes
Import dumping
Bureaucracy
Utility costs
3rd worst2nd worstWorst

37
constraint by 18 out of 101 (17.8 percent); and the third worst constraint by 22 of 95 respondents (23.2 percent). Bureaucracy is also viewed as a major barrier to the company operations. It was found to be the worst government constraint by 13 respondents (12.7 percent) and the second worst constraint by a similar amount. Other issues that were regarded as being seriously inhibiting competitiveness were import dumping, poor infrastructure and various problems related to the tax administration. On a factor-by-factor basis cost of utilities was said to be very constraining by 64.3 percent of respondents. Multiplicity/high level of taxes was ranked very constraining by 44.6 percent of respondents. Bureaucracy was third, ranked a very constraining factor by 43.8 percent of the companies. Table 4.20 Factor-by-factor Evaluation of Government Constraints
Very constraining
Slightly constraining
Neutral Not constraining
Total
Utility costs 64.2 20.0 13.3 2.3 100.0
Taxes 44.6 24.1 24.1 6.9 100.0 Bureaucracy 43.7 26.3 21.3 8.4 100.0
Import dumping 42.8 21.6 20.6 14.8 100.0
Late settlement of tax refund claims
39.4 21.5 29.7 9.2 100.0
Harassment from officials 29.4 25.1 32.8 12.7 100.0
Poor infrastructure 29.1 31.7 23.9 15.1 100.0
Utility reliability 28.9 35.7 29.4 5.8 100.0 Exchange rate 27.7 30.3 30.8 10.9 100.0
Utility availability 27.0 34.7 27.5 10.6 100.0
No export incentives 26.9 29.6 27.4 15.9 100.0
Abuse of tax exemptions 22.8 26.0 35.3 15.7 100.0
Unclear role of regulatory agen. 22.7 33.8 28.0 15.2 100.0
Inflation 22.4 33.3 31.1 13.1 100.0
Regulation 21.9 34.0 30.3 13.6 100.0 Inconsistency of gov. policy 19.6 33.3 31.1 15.8 100.0 No environment regulation 17.4 25.9 38.0 18.5 100.0
CTI/DI Manufacturing Survey 2000
4.7.2 Constraining Social Factors With regard to the impact of social factors 18.8 percent found the predominant constraining social factor to be the strict competition prevailing in many domestic markets, and 17 percent believed it to be the widespread corruption in Tanzania’s economical and political system. Insufficient demand and low quality technology were also believed to be extraordinarily constraints on competitiveness. See chart on next page.
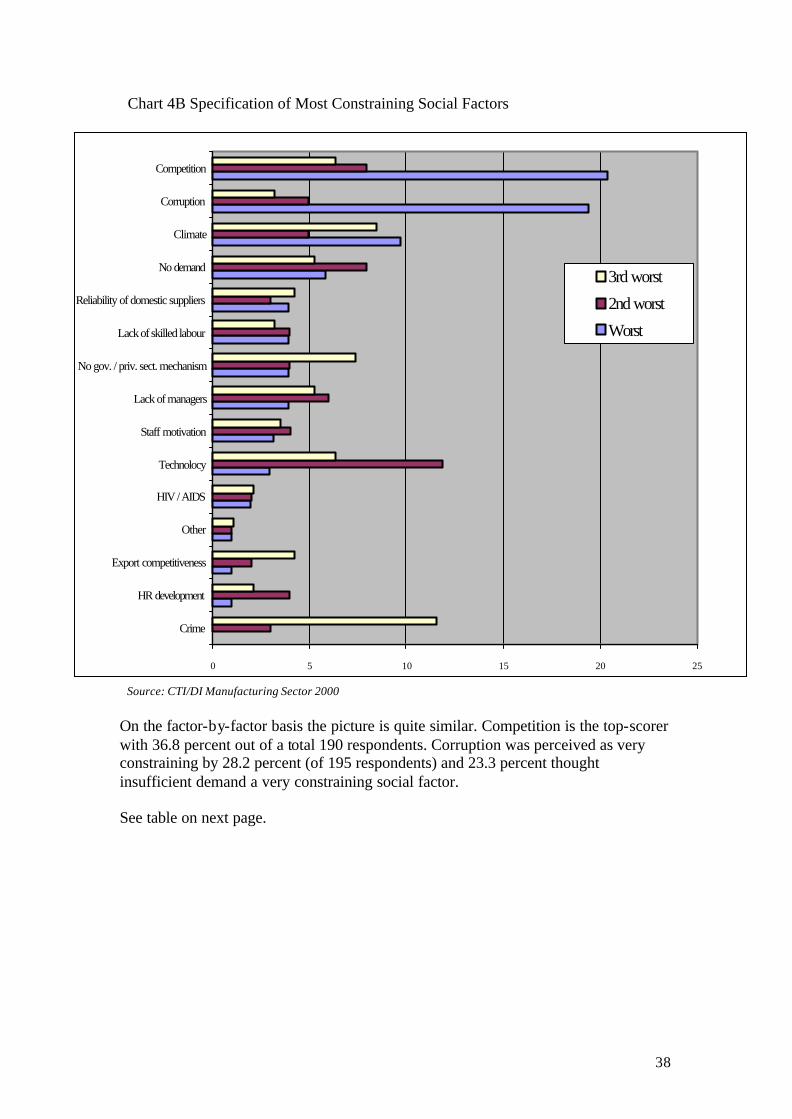
38
Chart 4B Specification of Most Constraining Social Factors
Source: CTI/DI Manufacturing Sector 2000
On the factor-by-factor basis the picture is quite similar. Competition is the top-scorer with 36.8 percent out of a total 190 respondents. Corruption was perceived as very constraining by 28.2 percent (of 195 respondents) and 23.3 percent thought insufficient demand a very constraining social factor. See table on next page.
0 5 10 15 20 25
Crime
HR development
Export competitiveness
Other
HIV / AIDS
Technolocy
Staff motivation
Lack of managers
No gov. / priv. sect. mechanism
Lack of skilled labour
Reliability of domestic suppliers
No demand
Climate
Corruption
Competition
3rd worst
2nd worst
Worst

39
Chart 4B Specification of Most Constraining Social Factors Factor Very
constrai-ning
Slightly constrai-
ning
Neutral Not constrai-
ning
Total
Competition 36.8 25.2 22.1 15.7 100.0
Corruption 28.2 28.7 26.6 16.4 100.0
No demand 23.3 27.2 28.8 20.5 100.0
Lack of managers 18.8 26.1 22.5 32.4 100.0
Technology 18.5 38.0 21.6 21.6 100.0
Export competitiveness 17.1 19.5 31.9 31.3 100.0
Reliability of domestic suppliers 16.7 22.3 31.8 29.05 100.0 Lack of gov./private mechanism 15.5 30.4 31.0 22.9 100.0
HR development 13.9 33.3 26.8 25.8 100.0
Crime 11.9 34.7 30.5 22.7 100.0
HIV / AIDS 9.0 23.4 34.5 32.9 100.0
Climate 8.8 17.1 36.4 37.5 100.0
Staff motivation 8.7 28.7 32.3 30.2 100.0
Other 4.1 8.3 45.8 41.6 100.0
Source: CTI/DI Manufacturing Survey 2000 4.8 Capitalization Financing investment in Tanzania’s manufacturing sector is compounded with a number of difficulties. Partly because the domestic financing structure is still not very well developed. A consequence of the many years with a central planning system that did not provide ample room for commercial lending and private equity stake-holding. And it is partly due to the international financing community’s continuous distrust in the growth potential of Tanzania’s industry. Throughout the last decade where an abundance of especially Western capital found its way to the high-yielding markets of East Asia and, to a certain extent, Latin America the sub-Saharan African continent was more or less surpassed. Even in the wake of the major currency crises that greatly damaged the economic structures in both East Asian and Latin America in the latter part of the 1990s – and which more than anything was the outcome of excessive foreign lending by both private and government agencies in the affected regions – international finance is still considerably more likely to find its way to China, South Korea, Brazil etc. than to Tanzania and its neighbours. When it comes to Tanzania in specific the gloomy international portrait of the prospects in lending funds for investment has recently been supported by the conclusions of the World Economic Forum’s (WEF) “Africa Competitiveness Report 2000/2001.” In the report Tanzania is ranked in the low end when it comes to most factors affiliated to ability of and confidence in the financial environment. The main findings are summarized in table 4.22. Table 4.22 Summary of WEF Findings on Ability Of/

40
Confidence In Tanzania’s Financial System (ranking includes 24 countries in Africa)11 Factors Gross
domestic investment
Gross domestic savings
Confidence in system
Time to transfer money
Personal relations
Tanzania ranking
17 18 20 11 7
Source: Summary of findings in World Economic Forum, Africa Competitiveness Report 2000/2001
The survey results underlines the problems for manufacturing companies in Tanzania in accessing finance. 76.4 percent of respondents revealed they had difficulties, while only 23.9 percent did not find capitalization a major problem. 33.1 percent of respondents even found it harder now to access finance than 24 months ago (table 4.24). 17.9 percent found it to be easier now than before, while the majority of respondents – 48.9 percent – found the conditions to be the same today as two years ago. Not surprisingly it is mainly the SMEs that have the most difficulties in accessing investment capital. 80.6 of SMEs find it difficult compared to 61.5 of large enterprises. Most of the very large parastatals find no problems in getting access to new funds. Moreover, 85.0 percent of the large-scale enterprises say that access to capital is easier or the same today as compared to 24 months ago. Only 61.2 percent of SMEs are of the same opinion. Table 4.23 Current Ease of Access to Financing Ease of access Number of companies (%) Large
enterprises Small and medium-sized enterprises
All enterprises
Difficult 61.5 80.6 76.4 Not difficult 38.5 19.4 23.6 Total 100.0 100.0 100.0 Source: CTI/DI Manufacturing Survey 2000 Table 4.24 Comparative Ease of Access to Financing (compared to 24 months ago) Ease of access Number of companies (%) Large
enterprises Small and medium- sized enterprises
All enterprises
Easier 17.5 17.4 17.9 Same 67.5 43.8 48.9 Harder 15.0 38.9 33.1 Total 100.0 100.0 100.0 Source: CTI/DI Manufacturing Survey 2000 The imbalances in the financial environment are reflected in how the manufacturing companies view the main barriers in accessing finance. Of the 203 potential respondents 154 replied to this question and all respondents found the high cost of borrowing to be one of the four main constraints. 117 even ranked the cost factor as being the worst of all obstacles to accessing finance. Collateral was regarded to be the second worst constraint with 113 companies placing this factor as the main financing problem. 11 See appendix for the full ranking and details on questionnaire definitions.
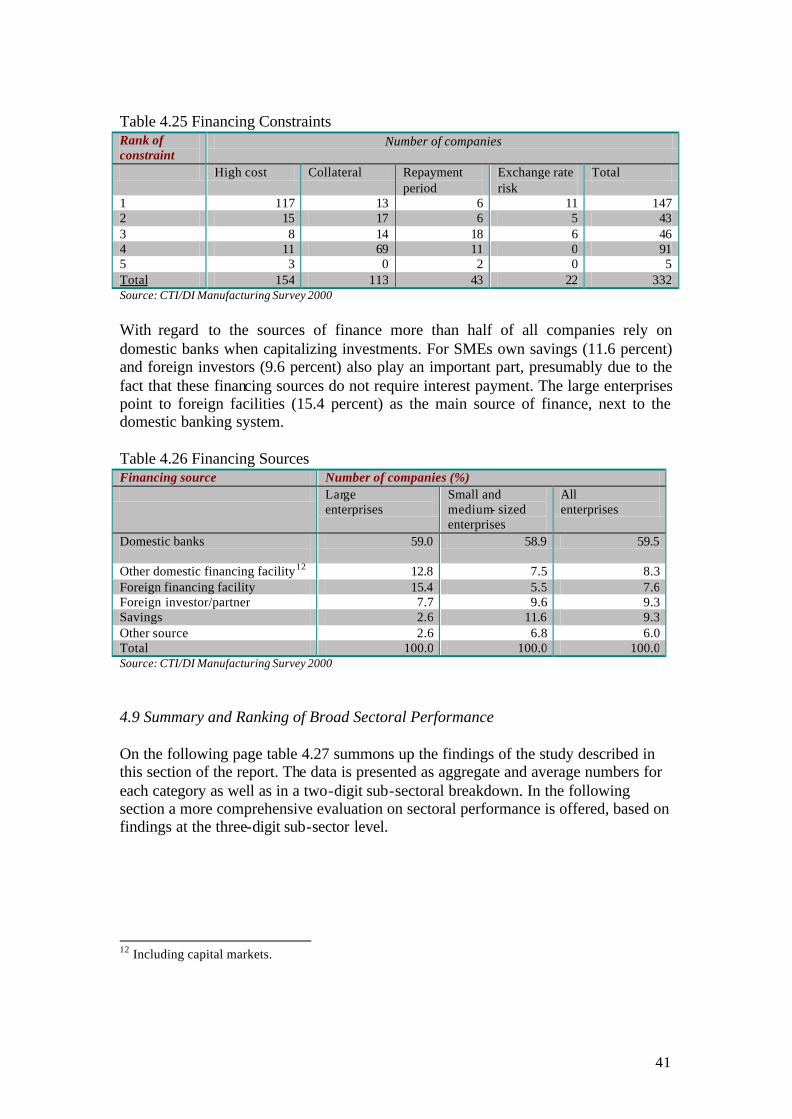
41
Table 4.25 Financing Constraints Rank of constraint
Number of companies
High cost Collateral Repayment period
Exchange rate risk
Total
1 117 13 6 11 147 2 15 17 6 5 43 3 8 14 18 6 46 4 11 69 11 0 91 5 3 0 2 0 5 Total 154 113 43 22 332 Source: CTI/DI Manufacturing Survey 2000
With regard to the sources of finance more than half of all companies rely on domestic banks when capitalizing investments. For SMEs own savings (11.6 percent) and foreign investors (9.6 percent) also play an important part, presumably due to the fact that these financing sources do not require interest payment. The large enterprises point to foreign facilities (15.4 percent) as the main source of finance, next to the domestic banking system. Table 4.26 Financing Sources Financing source Number of companies (%) Large
enterprises Small and medium- sized enterprises
All enterprises
Domestic banks
59.0 58.9 59.5
Other domestic financing facility12 12.8 7.5 8.3 Foreign financing facility 15.4 5.5 7.6 Foreign investor/partner 7.7 9.6 9.3 Savings 2.6 11.6 9.3 Other source 2.6 6.8 6.0 Total 100.0 100.0 100.0 Source: CTI/DI Manufacturing Survey 2000
4.9 Summary and Ranking of Broad Sectoral Performance On the following page table 4.27 summons up the findings of the study described in this section of the report. The data is presented as aggregate and average numbers for each category as well as in a two-digit sub-sectoral breakdown. In the following section a more comprehensive evaluation on sectoral performance is offered, based on findings at the three-digit sub-sector level.
12 Including capital markets.
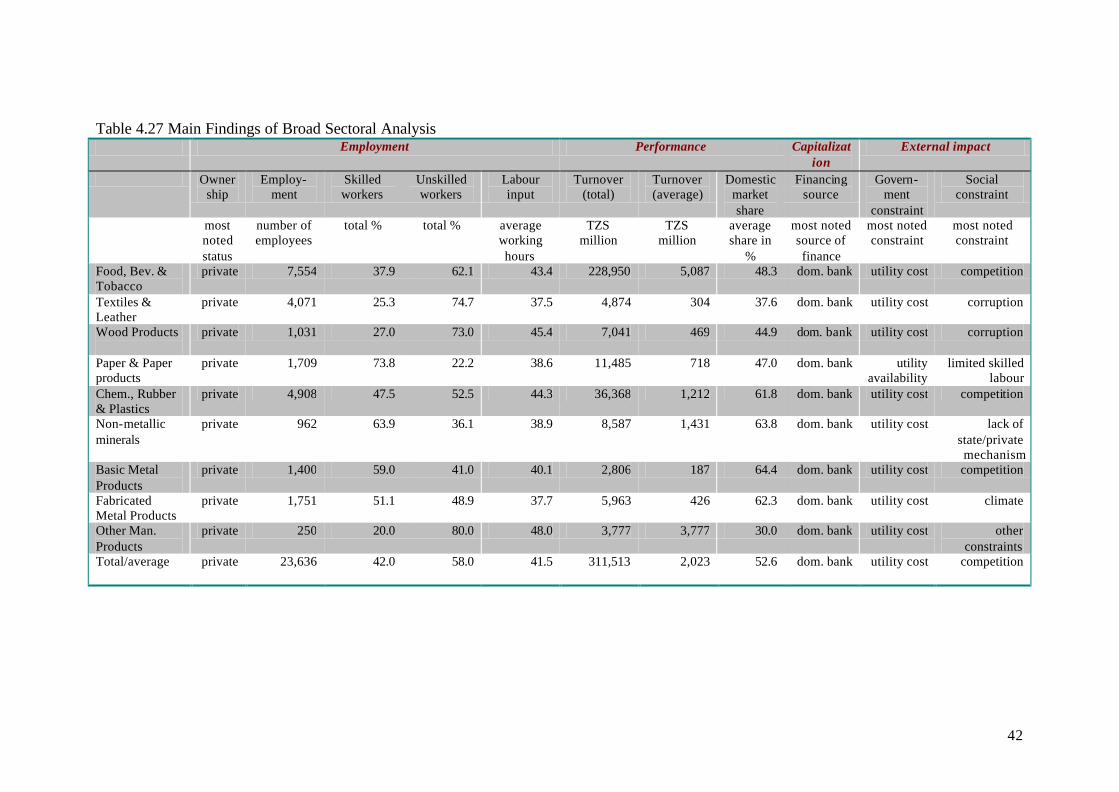
42
Table 4.27 Main Findings of Broad Sectoral Analysis Employment Performance Capitalizat
ion External impact
Ownership
Employ-ment
Skilled workers
Unskilled workers
Labour input
Turnover (total)
Turnover (average)
Domestic market share
Financing source
Govern-ment
constraint
Social constraint
most noted status
number of employees
total % total % average working hours
TZS million
TZS million
average share in
%
most noted source of finance
most noted constraint
most noted constraint
Food, Bev. & Tobacco
private 7,554 37.9 62.1 43.4 228,950 5,087 48.3 dom. bank utility cost competition
Textiles & Leather
private 4,071 25.3 74.7 37.5 4,874 304 37.6 dom. bank utility cost corruption
Wood Products
private 1,031 27.0 73.0 45.4 7,041 469 44.9 dom. bank utility cost corruption
Paper & Paper products
private 1,709 73.8 22.2 38.6 11,485 718 47.0 dom. bank utility availability
limited skilled labour
Chem., Rubber & Plastics
private 4,908 47.5 52.5 44.3 36,368 1,212 61.8 dom. bank utility cost competition
Non-metallic minerals
private 962 63.9 36.1 38.9 8,587 1,431 63.8 dom. bank utility cost
lack of state/private mechanism
Basic Metal Products
private 1,400 59.0 41.0 40.1 2,806 187 64.4 dom. bank utility cost competition
Fabricated Metal Products
private 1,751 51.1 48.9 37.7 5,963 426 62.3 dom. bank utility cost climate
Other Man. Products
private 250 20.0 80.0 48.0 3,777 3,777 30.0 dom. bank utility cost other constraints
Total/average
private 23,636 42.0 58.0 41.5 311,513 2,023 52.6 dom. bank utility cost competition
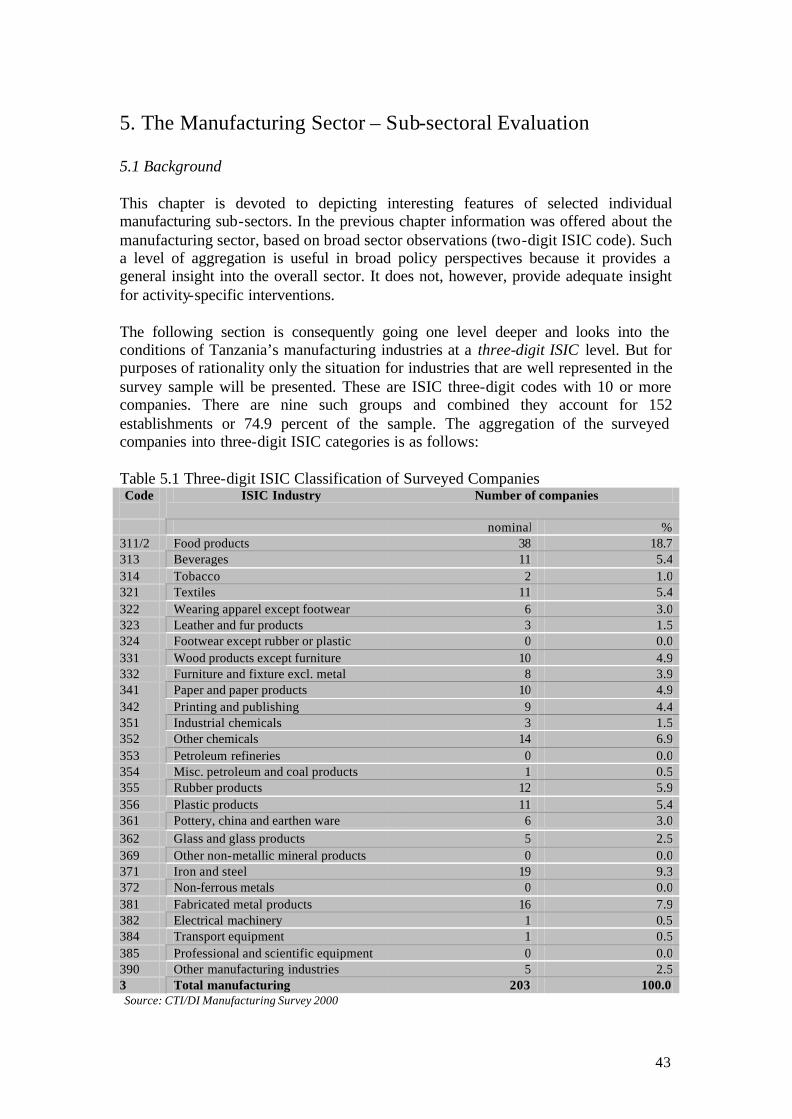
43
5. The Manufacturing Sector – Sub-sectoral Evaluation 5.1 Background This chapter is devoted to depicting interesting features of selected individual manufacturing sub-sectors. In the previous chapter information was offered about the manufacturing sector, based on broad sector observations (two-digit ISIC code). Such a level of aggregation is useful in broad policy perspectives because it provides a general insight into the overall sector. It does not, however, provide adequate insight for activity-specific interventions. The following section is consequently going one level deeper and looks into the conditions of Tanzania’s manufacturing industries at a three-digit ISIC level. But for purposes of rationality only the situation for industries that are well represented in the survey sample will be presented. These are ISIC three-digit codes with 10 or more companies. There are nine such groups and combined they account for 152 establishments or 74.9 percent of the sample. The aggregation of the surveyed companies into three-digit ISIC categories is as follows: Table 5.1 Three-digit ISIC Classification of Surveyed Companies Code
ISIC Industry Number of companies
nominal % 311/2 Food products 38 18.7 313 Beverages 11 5.4 314 Tobacco 2 1.0 321 Textiles 11 5.4 322 Wearing apparel except footwear 6 3.0 323 Leather and fur products 3 1.5 324 Footwear except rubber or plastic 0 0.0 331 Wood products except furniture 10 4.9 332 Furniture and fixture excl. metal 8 3.9 341 Paper and paper products 10 4.9 342 Printing and publishing 9 4.4 351 Industrial chemicals 3 1.5 352 Other chemicals 14 6.9 353 Petroleum refineries 0 0.0 354 Misc. petroleum and coal products 1 0.5 355 Rubber products 12 5.9 356 Plastic products 11 5.4 361 Pottery, china and earthen ware 6 3.0 362 Glass and glass products 5 2.5 369 Other non-metallic mineral products 0 0.0 371 Iron and steel 19 9.3 372 Non-ferrous metals 0 0.0 381 Fabricated metal products 16 7.9 382 Electrical machinery 1 0.5 384 Transport equipment 1 0.5 385 Professional and scientific equipment 0 0.0 390 Other manufacturing industries 5 2.5 3 Total manufacturing 203 100.0 Source: CTI/DI Manufacturing Survey 2000

44
5.2 Food Products (ISIC 311/2) Size and Ownership The survey sample consists of 38 companies belonging to the food industry (18.7 percent of total). The dominant mode of ownership among these companies is private ownership followed by state ownership, making up 81.6 and 10.5 percent of the total, respectively. Employment The majority of companies (42.1 percent) employ between 21 and 50 people, while the share for companies with 51-250 employees is 34.2 percent. Only 2.6 percent of food companies have more than 250 people in their staff. The distribution between skilled and unskilled workers is strongly in favour of the latter. 70.4 percent of employees in the food sector are unskilled, while only 29.6 percent are skilled. As for labour input more than half of food producers (51.6 percent) work their production staff for over 40 hours per week (in average). 32.3 percent of workers in the food sector are working an average 31-40 hours per week, while the remaining 16.1 percent put in between 1 and 30 working hours per week. Capitalization The main source of finance for food companies is domestic banks (57.6 percent). Access to finance is found to be difficult by 64.7 percent and has remained the same in the view of 47.1 percent of the surveyed companies. Company Performance 77.8 percent of the surveyed food companies are either making profit (30.6 percent) or breaking even (47.2 percent) on their activities. Almost half (48.5 percent) recorded an annual turnover rate of more than 500 million Tsh. in 1999. No responding food producers had a turnover of less than 25 million Tsh. An equal amount of companies inhabited a share of the domestic market within their particular segment of the food industry of either 0-25, 26-50 or 76-100 percent (28.6 percent). Meaning that 42.9 percent of all food companies had a majority sub-market share.

45
Investment, Competitiveness and Business Support Services Investment intentions are low. 38.9 percent of companies are not planning to invest in the period 2000-2002 and 38.5 percent have no investment intentions in 2002-2004. For investment plans up to US$ 100,000 the rate is 27.8 percent in 2000-2002 and 23.1 percent in 2002-2004. Cost of utilities (58.9 percent) is found to be the most constraining policy factor on company competitiveness, followed by bureaucracy (43.8 percent). Competition from imports acts especially negatively in the business climate in the view of 45.2 percent. 5.3 Beverages (ISIC 313) Size and Ownership 11 companies make up the survey sample within the beverage sub-sector (5.4 percent of total). Most companies in the group are privately owned (73 percent). Employment 80 percent of the surveyed companies that offered information about number of employees (1 respondent did not provide data about this factor) employ more than 51 people. Half of the surveyed beverage companies employ 51-250 people and 30 percent more than 251. The skill distribution of thew labour force has a clear majority (61.1 percent) skilled and 38.9 percent unskilled. This makes the beverage industry the sub-sector with the second largest share of skilled employees. Two-thirds of the surveyed companies work their production staff between 31 and 40 hours per week. Capitalization The main source of financing for beverage companies is domestic commercial banks with a share of 70 percent. 60 percent believe that access to finance is difficult and the same number finds the problems of financing to have remained over time. Company Performance 56.6 percent of the surveyed companies in the beverage sector are breaking even on operations, while 33 percent are currently profiting. Only 14.6 percent of companies are in the red. Half the sector participants have turnover rates of more than 500 Tsh., while only one surveyed company (10 percent) turns over less than 5 million Tsh. 4 out of 10 companies claim to possess more than 75 percent of their domestic sub-market.

46
Investment, Competitiveness and Business Support Services Investment plans up to 2002 are very mixed. While 28.6 percent have no intentions to invest in this period, an equal amount have plans of investing US$ 500,000 or more. Furthermore, 60 percent are planning to invest US$ 500,000 or more in the period 2002-2004. The constraints faced is mainly related to utility costs with 58.8 percent, followed by import dumping (46.7 percent) and bureaucracy (43.8 percent). As for the operating environment the most notable concern is the tough competition on the domestic beverage market. 5.4 Textiles (ISIC 321) Size and Ownership The textiles sub-sector sample is compiled of 11 companies (5.4 percent of total). All of which are privately owned. Employment 72.8 percent of the surveyed textile companies employ more than 50 people. Only 9.1 percent have a staff of less than 20. A large majority of 75.2 percent of the total labour force in the textiles industry are unskilled. Making this sector the least skilled industry in percentage terms. A figure that corresponds very well with the generally declining development of the textiles industry in Tanzania. Capitalization The main source of finance is domestic banks with access being “fifty-fifty.” 66.7 percent find accessibility not to have changed considerably over time. Company Performance A very limited amount of companies in the sector, 12,5 percent, revealed that they recorded profits in the latest budget year. 50.0 percent recorded a break-even status. 75 percent of the surveyed textile companies recorded a turnover rate of more than 100 million Tsh. in 1999. 87.5 percent stated that they have 50 percent or less of their domestic market. Investment, Competitiveness and Business Support Services Investment plans are generally high in the sector with 66.6 percent ready to invest US$ 300.000 or more up to 2002 and 50 percent are contemplating a similar investment in 2002-2004.

47
Import dumping and lack of export incentives are listed as the most constraining government inhibitions (66.7 percent for each), followed by cost of utilities and a high level of taxes. 5.5 Wood Products Except Furniture (ISIC 331) Size and Ownership In this sub-sector 10 companies are listed as the survey sample (4.9 percent of total). All wood companies surveyed are private-owned. Employment Only 10 percent employ more than 250 people, while 40 percent have less than 20 employees. 73.4 percent of the staff employed in the respondent companies in the wood sector are unskilled. Consequently, the minimal share of 26.6 percent skilled employees makes the sector the second worst off when it comes to skill leve l of the labour force. Only the textiles sector has a smaller share of skilled workers. 6 out of 9 responding companies (66.6 percent) work their staff an average 40 hours or more per week. Capitalization Domestic banks and own savings are the main sources of financing in the wood sector (40 percent each). Access to finance is considered difficult and has remained so overtime (50 percent). Company Performance The companies in the sector are generally performing very well with 66.7 percent making out right profit and an additional 22.2 percent breaking even. This gives the wood sector the highest success rating of the surveyed sub-sectors. The good development is supported by the fact that 87.5 percent of companies have a turnover rate of more than 100 million Tsh. All surveyed companies claim a domestic market share of less than 51 percent. Investment, Competitiveness and Business Support Services Investment plans are mainly in the range of US$ 100,000-150,000 in both suggested investment periods (60 percent in each). Competitiveness in predominantly constrained by utility costs, which was found to be very constraining by all surveyed companies. Availability of utilities was considered the second biggest government constraint with a 50 percent stake.
48
Also high level of taxes and import dumping was considered by many to be severely constraining performance. With regard to the social factors corruption was most abhorred (by 60 percent). 5.6 Paper and Paper Products (341) Size and Ownership 10 companies comprise the paper and paper product sample (4.9 of total). All are privately owned. Employment Half the surveyed companies have between 51 and 250 employees, while another 30 percent have a staff of more than 250. The paper sector has the highest percentage of skilled workers of all the reviewed sub-sectors. 75.7 percent of employees are skilled, leaving only 24.3 percent as unskilled. 75 percent of paper companies work their staff more than 40 hours per week, which is highest among all sub-sectors. No workers in the paper sector put in less than 30 hours a week. Capitalization Access to financing is difficult in the view of 57.5 percent of surveyed companies, while only 11.1 find that access has become harder in the last two years. Company Performance A very high percentage of the companies in the sector are loss-making (55.6 percent) with 17.6 percent making profit. 62.5 percent of the surveyed paper companies recorded a turnover rate of more than 500 million Tsh. in 1999. No companies had a turnover rate of less than 6 million Tsh. Only one out of nine responding companies claim a domestic market share of more than 75 percent, whereas 66.6 percent state a market share below 51 percent. Investment, Competitiveness and Business Support Services Investment intentions are low in the period 2000-2002 but picks up in 2002-2004 with 60 percent of companies planning to invest US$ 500,000 or more. Competitiveness is predominantly affected by cost of utilities and multiplicity taxes (88.9 percent each).

49
5.7 Other Chemicals (ISIC 352) Size and Ownership The sample of companies producing other chemicals consists of 14 respondents (6.9 percent of total). Ownership is divided between private (92.9 percent) and private/state (7.1 percent). Employment No companies in the sector have an employment rate of more than 250 people. Most companies (46.2 percent) in fact employ below 21 people, which is the second lowest of all sub-sectors. 61.5 percent of employees in the sector are skilled, making this the sub-sector with the second largest amount of skilled workers. All companies in the sector in average work their staff 31 hours or more per week. Capitalization The main source of finance is domestic banks with access to financing rated difficult by as many as 92.3 percent of companies. 64.3 percent believe there has been no change over time with regard to accessibility. Company Performance There was an equal amount of profit-makers and loss-makers in the sector in the last budget year (46.2 percent for each). The turnover rate for the sector was not impressive in 1999 with only 41.7 percent recording a rate of more than 500 million Tsh. A limited 12.5 percent of the surveyed companies inhabit more than 50 percent of their domestic sub-market with 62.5 percent having less than a 25 percent market share. Investment, Competitiveness and Business Support Services Investment planning is also low. US$ 0-100,000 for both investment periods in question. The cost of utilities was also in the sector regarded as the main constraint to competitiveness (by 72.7 percent). Harsh competition was the top-scorer among the constraining social/market factors with 50 percent.

50
5.8 Rubber products (ISIC 355) Size and Ownership 12 companies comprise the sample of the rubber plastic sector (5.9 percent of total). Private ownership constitutes 83.3 percent of the group. Employment Only 8.3 percent of the surveyed rubber producers employ less than 21 people. The smallest amount for all sub-sectors. 58.4 percent of companies have a staff of 21-50 people. The distribution of the labour force in terms of skill level is fairly equal. A small majority – 53.7 percent – is unskilled leaving 46.3 percent as skilled employees. Of the surveyed companies 66.6 percent work their staff between 31 and 40 hours a week. Capitalization Domestic banks account for 77.8 percent of financing, but accessibility for the financial sector as a whole is declared to be difficult by 81.8 percent of the surveyed companies. Company Performance The success rate of the rubber sector is equally divided between profit-makers and loss-makers (41.7 percent each). All companies recorded a turnover of more than 100 million Tsh., and 62.5 percent had a turnover rate of more than 500 million Tsh. Both of these rates are high score for all sectors. Half of the companies surveyed claim a domestic market share of less than 26 percent. 37.5 percent possess a sub-market share of more than 75 percent. Investment, Competitiveness and Business Support Services Investment intentions were low. 37.5 percent declared no investment plans in the period 2000-2002 and 66.7 percent have no intention to invest from 2002 to 2004. Utility costs are seen to represent the main government related constraint to performance by 50 percent of companies. Competiton is the most constraining operational factor, as viewed by 66.7 percent.

51
5.9 Iron and Steel (ISIC 371) Size and Ownership The sample of this sub-sector consists of 19 companies (9.3 percent of total). This makes iron and steel the second largest sub-sector in terms of recorded establishments. 84.2 percent of these companies have private ownership. Employment The number of employees is 50 or below for 68.4 percent of the surveyed companies. Despite the high amount of establishments in the sector only 2 respondents (10.5 percent) have more than 250 people employed. Most employees in the iron & steel sector are skilled (59.0 percent). 66.6 percent of companies work their staff more than 40 hours per week, which is the second highest of all sub-sectors. Capitalization Domestic banks are also in this sector the predominant financing source (62.7 percent). An all-sector high of 94.1 percent find it difficult to access capital. Company Performance The success rate of the iron and steel sector is high. 52.9 percent of companies claim a profitable last budget year, while 23.5 percent broke even. The turnover rate for the sector is equally distributed among companies with high and low rates. Largest share is accounted for by companies with more than 500 million Tsh. in annual turnover. Half of the surveyed companies declare that they possess a higher than 75 percent share of their domestic sub-market. Investment, Competitiveness and Business Support Services Investment intentions in the sector are low. 70 percent of companies have no intention to invest up to 2002 and 40 percent do not expect to invest from 2002-2004. Costs of utilities are again perceived to be the main government constraint to competitiveness by 76.5 percent of companies. No major threat was, however, documented among social/operational factors.

52
5.10 Fabricated Metal Products (ISIC 381) Size and Ownership 16 companies comprise this sector sample (7.9 percent of total). Ownership is distributed between private (87.5 percent) and foreign (12.5 percent). Employment 53.3 percent of the surveyed companies employ 20 or fewer people. 13.5 percent have staffs of more than 250. The skill distribution in the industry for fabricated metal products is the most equal of all the reviewed sub-sector. 50.1 percent unskilled and 49.9 percent skilled. All companies work their staff more than 30 hours per week in average. Capitalization The main source of finance is domestic banks with 66.7 percent followed by own savings with a share of 20 percent. Access to finance is ranked difficult by 71.4 percent of the companies. 42.9 percent point out that access to fuinancing have become harder in the last two years. Company Performance The profit rate is quite high for the sector with 46.2 percent making outright profits and 12.3 percent breaking even. 36.4 percent of the surveyed companies recorded a turnover rate of less than 100 million Tsh. in 1999. 50 percent claim a 76 or higher percent share of their domestic sub-market. Investment, Competitiveness and Business Support Services Investment intentions are conspicuously absent for the sector. Cost of utilities are also by this sector claimed as the worst government related constraint (by 46.2 percent), while a large share regards HIV/AIDS as the main social factor negatively affecting performance. 71.4 percent of the surveyed companies in the sector for fabricated metal products are members of CTI.

53
5.11 Summary and Ranking of Sub-sectoral Performance Below is a table ranking the nine analyzed sub-sectors, measured in terms of performance in a number of the surveyed features examined in this section. The ranking shows that the beverage sector is the high scoring sector, when it comes to turnover, both in total and average terms. The fact that the beverage industry only has the sixth most establishments suggests that few but large companies dominate the sector. The textiles industry has the most employees and also the highest share of unskilled workers in its labour force. The turnover rate is conversely one of the smallest among the surveyed sectors, indicating the textile industry’s problems in converting labour-intensity into real output. The same is true for the both the wood and the iron & steel sector, which has a high number of establishments and many employees but records only very modest turnover rates. The paper and other chemicals sectors have the largest share of skilled workers employed, although the aggregate number of employees in the two sectors is not high. It suggests that these industries require a skilled labour force rather than labour-intensity to obtain competitiveness. The food sector is highly placed in the ranking within most indicators, but has a relative limited share of skilled workers. Table 5.2 Ranking of Sub-sectors on Selected Indicators
Sector No. of establish.
No. of employees
Skilled13 workers
Unskilled workers
Labour input
Turnover (total)
Turnover (avg.)
Food products 1 2 7 3 2 2 2 Beverages 6 3 3 7 5 1 1 Textiles 6 1 9 1 9 8 7 Wood products 8 8 8 2 1 6 6 Paper products 8 5 1 9 3 5 4 Other chemicals 4 9 2 8 4 3 3 Rubber products 5 7 6 4 7 4 5 Iron & steel 2 4 4 6 6 9 9 Fabricated metal 3 6 5 5 8 7 8
Source: C TI/DI Manufacturing Survey 2000 Table 5.3 on the next page summons up the findings presented in this section of the report.
13 Measured in share of total labour force.

54
Employment Performance Capitalization
External impact
Ownership No. of employees
Skilled workers
Unskilled workers
Labour input
Turnover (total)
Turnover (average)
Domestic market share
Financing source
Govern-ment constraint
Social constraint
most noted ownership
form
total people
total people
total people
average working hours
aggregate in TZS million
per company in TZS million
average share in %
most noted source of finance
most noted constraint
most noted constraint
Food products
private 2,909 29.6 70.4 43.7 47,886 1,451 50.7 dom. bank Utility costs Competition
Beverages
private 2,828 61.1 38.9 41.2 176,128 1,761 53.0 dom. bank Utility costs Competition
Textiles
private 3,817 24.8 75.2 34.2 4,242 606 37.8 dom. bank Dumping Insufficient demand
Wood products exc. furniture
private 780 26.6 73.4 45.0 6,488 811 21.6 dom. bank Utility costs Corruption
Paper and paper products
private 1,397 75.7 24.3 42.0 9,633 1,204 51.1 dom. bank Utility costs Competition
Other chemicals
private 695 61.5 38.5 41.9 17,805 1,424 23.6 dom. bank Utility costs Competition
Rubber products
private 1,000 46.3 53.7 38.0 16,234 1,082 49.0 dom. bank Utility costs Competition
Iron and steel
private 1,400 59.0 41.0 40.1 2,806 187 64.4 dom. bank Utility costs -
Fabricated metal products
private 1,315 49.9 50.1 36.6 4,472 407 63.8 dom. bank Utility costs HIV/AIDS
Total
private 16,141 44.2 55.8 40.7 284,974 2,544 47.3 dom. bank Utility costs Competition
Source: CTI/DI Manufacturing Survey 2000
55
6. Tanzania in a Comparative Perspective 6.1 Background This section of the report is looking into the status of Tanzania’s manufacturing sector in a comparative perspective. On a number of key areas the domestic sector is benchmarked to sectors elsewhere in the world – with specific emphasis on the regional dimension. The concept of region is in this context narrowed to include only Tanzania and its two associates within the East African Community, Kenya and Uganda. A brief description of Tanzania’s participation in various international co-operative treaties and organizations will also be offered. 6.2 The Manufacturing Sector in a Regional Perspective The traditionally strong political and economic interdependence between these three countries, most recently cemented by the formal re-establishment of the EAC, calls for a detailed comparison between the three. Not least because they share – in addition to the historical denominator – a number of cultural and demographic joint features. The fact that Kenya and Uganda bear many similarities to Tanzania when it comes to population size, ethnic composition, climate, religion, etc. provides a strong basis for comparisons, and is hence a valuable mean to evaluate the performance of Tanzania on specific issues.
6.2.1 Key Comparative Indicators Table 6.1 illustrates the internal relationship between the three countries in terms of key economic indicators. From the table it is noticeable that the Kenyan economy is the strongest of the three East African economies. Kenya has got the advantage compared to its neighbours in terms of total value of GDP as well as GDP per capita. But it can also be recorded that the Kenyan economy has gradually lost its pace in recent years and is currently growing at a speed, which is only one-third of Uganda’s and half of Tanzania’s economy. The decline of the Kenyan economy has been a gradual process. From an average growth rate of 6.6 percent of GDP in the period 1964-1973, to 5.2 percent between 1974-1979, 4.1 percent in the period 1980-1989, 2.5 percent between 1990-1995 to a current level of 1.5-1.8 percent. As a consequence, GDP per capita has dropped by more than 15 percent since 1980 alone. This poor performance has occurred despite the fact that Kenya is generally considered to inhabit most of the ingredients it takes to be a strong economy. A sound educational system has created an abundant availability of skilled manpower required for industrialization, a revenue/GDP ratio of 24 percent is one of the highest in Africa, and the private sector is considered to be dynamic and capable of responding to an enabling environment.

56
Table 6.1 Basic Economic and Demographic Data (1999) Kenya Tanzania Uganda GDP (US$ billion)
10.2 8.3 6.6
GDP per Capita (US%)
340 265 320
Real GDP Growth (%) 1.3 5.0 7.8
Consumer Price Inflation (%)
3.5 7.0 6.3
Population
28.6 31.3 22.8
Exports (US$)
1,903 541 463
Imports (US$)
3,072 1,419 1,116
Foreign Exchange Reserves (US$)
1,129 620 791
Total External Debt (US$)
5,663 7,268 3,555
Exchange Rate (TZS/US$)
73.9 800 1,502
Source: East African Development Bank, Annual Report 1999 The explanations as to why these positive deve lopments have not materialized in terms of economic progress are plentiful. From the industrial side the most common factors referred to are poor import policies that do not favour local manufacturers, decreasing demand for locally produced goods, poor economic infrastructure and an inefficient/expensive inland transportation and distribution system. Furthermore is the relationship between government and private sector weak and hampered by rent-seeking behaviour among leading bureaucrats and politicians. The Ugandan economy has developed in the opposite direction of the Kenyan. After grave political and economic instability in the 1970s and most of the 1980s, the economy has been growing at an average rate of 7 percent over the past ten years. Inflation has been running at a single digit level since 1993, and FDI inflows have increased by USD 450 million during the past five years. Uganda has successfully implemented a Structural Adjustment Program under the guidance of the IMF, and the country was the first African nation to be granted debt relief under the HIPC14 initiative. The reverse trends in development of the Kenyan and Ugandan economies over the past decade has meant that the two are gradually meeting each other in terms of capacity. Whereas Kenya’s gross domestic product in 1980 was more than eight times higher than Uganda’s, the advantage in Kenya’s favour had in 1997 dropped to only 70 percent. In per capita terms the gap has diminished from being 450 percent higher in Kenya in 1980 to a modest 10 percent more in 1997.
14 HIPC: Highly Indebted Poor Countries
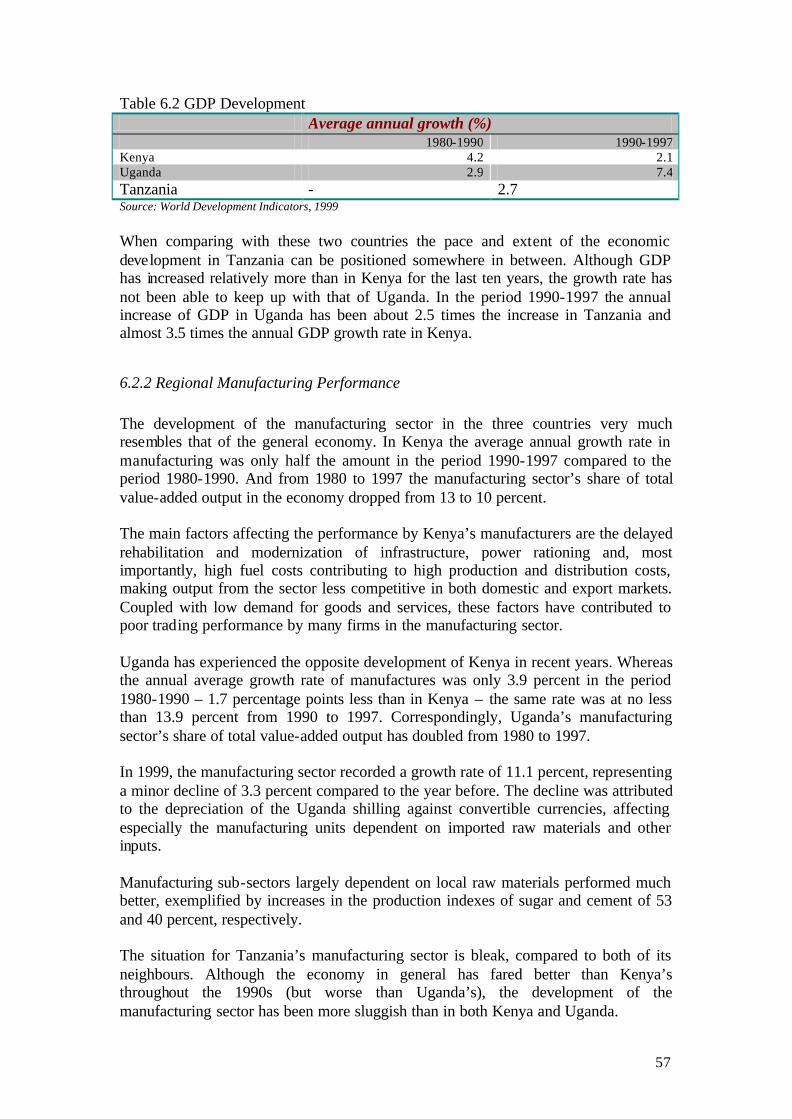
57
Table 6.2 GDP Development Average annual growth (%) 1980-1990 1990-1997 Kenya 4.2 2.1 Uganda 2.9 7.4 Tanzania - 2.7 Source: World Development Indicators, 1999
When comparing with these two countries the pace and extent of the economic development in Tanzania can be positioned somewhere in between. Although GDP has increased relatively more than in Kenya for the last ten years, the growth rate has not been able to keep up with that of Uganda. In the period 1990-1997 the annual increase of GDP in Uganda has been about 2.5 times the increase in Tanzania and almost 3.5 times the annual GDP growth rate in Kenya.
6.2.2 Regional Manufacturing Performance The development of the manufacturing sector in the three countries very much resembles that of the general economy. In Kenya the average annual growth rate in manufacturing was only half the amount in the period 1990-1997 compared to the period 1980-1990. And from 1980 to 1997 the manufacturing sector’s share of total value-added output in the economy dropped from 13 to 10 percent. The main factors affecting the performance by Kenya’s manufacturers are the delayed rehabilitation and modernization of infrastructure, power rationing and, most importantly, high fuel costs contributing to high production and distribution costs, making output from the sector less competitive in both domestic and export markets. Coupled with low demand for goods and services, these factors have contributed to poor trading performance by many firms in the manufacturing sector. Uganda has experienced the opposite development of Kenya in recent years. Whereas the annual average growth rate of manufactures was only 3.9 percent in the period 1980-1990 – 1.7 percentage points less than in Kenya – the same rate was at no less than 13.9 percent from 1990 to 1997. Correspondingly, Uganda’s manufacturing sector’s share of total value-added output has doubled from 1980 to 1997. In 1999, the manufacturing sector recorded a growth rate of 11.1 percent, representing a minor decline of 3.3 percent compared to the year before. The decline was attributed to the depreciation of the Uganda shilling against convertible currencies, affecting especially the manufacturing units dependent on imported raw materials and other inputs. Manufacturing sub-sectors largely dependent on local raw materials performed much better, exemplified by increases in the production indexes of sugar and cement of 53 and 40 percent, respectively. The situation for Tanzania’s manufacturing sector is bleak, compared to both of its neighbours. Although the economy in general has fared better than Kenya’s throughout the 1990s (but worse than Uganda’s), the development of the manufacturing sector has been more sluggish than in both Kenya and Uganda.

58
With an average annual growth of 1.9 percent in 1990-1997, Tanzania’s manufacturers have not only increased total output at a rate seven times less than in Uganda, but annual output has even increased less than in Kenya’s otherwise hampered manufacturing sector. 6.3 Performance by Manufacturing Sector in East Africa Country Average annual growth rate for
manufacturing sector (%) 1980-1990 1990-1997 Kenya 4.9 2.5 Uganda 3.7 13.9 Tanzania - 1.9 World - 2.7 Source: World Development Indicators, 1999
Despite its disappointing performance in recent years, Kenya’s manufacturing sector is still by far the largest in the East Africa and generates more value than the manufacturing sectors of Uganda and Tanzania combined. In 1998, the contribut ion to GDP by the Kenyan manufacturers had a total value of US$ 1,165 billion, to be compared with US$ 532 million in Uganda and US$ 497 million in Tanzania. The total value of Kenya’s manufacturing sector corresponds to a sector contribution of 13.3 percent of GDP. This is a slight decrease from 13.5 percent in 1995. The manufacturing sector in Uganda was able to increase its share of GDP from 7.1 to 9.0 percent in the same period. In Tanzania, the manufacturing sector contributed 7.9 percent to GDP in 1995 and 9.0 percent in 1998. Table 6.4 Manufacturing Share of GDP 1980 1995 1998 Kenya 13.0 13.5 13.3 Uganda 4.0 7.1 9.0 Tanzania 12.0 7.9 8.4 Source: World Development Indicators 2000 – EAC / GTZ Report, 2000
6.2.3 Employment The labour force in East Africa has experienced noticeable changes in the last twenty years. Both the agricultural and industrial sector has dropped its share of total employment to the benefit of the service sector. In this sense the three countries have responded to the demands of a global economy, increasingly putting focus on services as the engine for growth and raising living standards. Although not as significant as in the case of the developed part of the world, where the service sector in some cases has increased as much as 25-30 percent of its share of total employment and now constitutes the largest labour force category.

59
Table 6.5 Labour Force Development Population aged
15-64 Labour Force
millions total millions % yearly growth female % of total 1980 1998 1980 1998 2010 80-98 98-‘10 1980 1998 Kenya 8 15 8 15 20 3.6 2.3 46.0 46.1 Uganda 9 17 9 16 21 3.0 2.2 49.8 49.2 Tanzania 6 10 7 10 13 2.4 2.3 47.9 47.6 Source: World Development Indicators, 2000 As to the structure of the labour force Kenya consequently still inhabits the largest share of employed in the industry with Tanzania a narrow second ahead of Uganda. The development has in this respect been very equal. Table 6.6 Structure of Labour Force Agriculture Industry15
Services
% of male labour force
% of female labour force
% of male labour force
% of female labour force
% of male labour force
% of female labour force
1980 90-9716
1980 90-97
1980 90-97
1980 90-97
1980 90-97
1980 90-97
Kenya
77 75 88 85 10 11 2 3 13 15 10 12
Uganda 84 81 91 88 6 7 2 2 10 12 8 10
Tanzania
80 78 92 91 7 8 2 2 13 14 7 7
Source: World Development Indicators, 1999 The gender distribution is also following the same path in the three countries. Whereas women’s participation in the labour force is quite high for a developing country, the share of females in the industry is continuously very low. Only 2-3 percent of the total are employed in the industrial sector, whereas 85-90 percent of the region’s female work force are employed in the agricultural sector.
6.2.4 Intra Regional Trade As a consequence of its still dominating status with regard to output the balance of trade among the three East African countries is in favour of Kenya. Tanzania's exports to Kenya are, however, continuously growing. From 1998 to 1999 exports increased from US$ 15 million to US$ 26 million in addition to the substantial amounts of undocumented trade, which continue to boom between the two countries17. Trade between Tanzania and Uganda remains low. Uganda's exports to Tanzania during the calendar year 1998-1999 amounted to US$ 5.2 million while imports from Tanzania amounted to US$ 9.3 million. In 1998, Kenya's exports to Uganda increased from US$ 306 million to US$ 322 million in 1999, thereby reversing the declining trend that had been registered over the previous two years. The increase was mainly on petroleum products and building materials (cement and steel).
15 In addition to manufacturing this category includes mining, construction and utilities. 16 All data in the specification “90-97” are for the most recent year available. 17 This also goes for trade with Uganda.

60
Exports to Tanzania also increased from US$ 238 million to US$ 270 million during this period. Uganda's officially recorded exports to Kenya increased from US$ 24.2 million in 1998 to US$ 58.4 million in 1999. The main export items were tea, cotton, fruits and other food crops. As for the manufacturing sector the weak performance by Tanzania’s manufacturers in the regional context is also documented by the regional trade statistics. Table 6.7 shows the development of Tanzania’s trade relationship to Kenya and Uganda on a number of key areas of manufacturing. The figures confirm that Kenya’s generally superior trade position to its EAC co-members is also valid for the manufacturing sector. In 1998 the Tanzania-Kenya manufacturing trade balance recorded a surplus in favour of Kenya’s manufacturers of more than US$ 50 million with a 6/1 import/export ratio. The Kenya-Uganda trade status for 1997 recorded a Kenyan surplus of US$ 282 million, of which approximately 30 percent was generated by the manufacturing sector18. Tanzania and Uganda enjoy a more equal trade relationship. In accumulated figures Uganda has the trade surplus in the manufacturing sector, but throughout the 1990s Tanzania has in several years had a surplus. However, as Uganda’s manufacturing sector has continued to grow larger and stronger in recent years, it has become correspondingly more difficult for Tanzania’s exporters to gain access to the Uganda market. Consequently, the last four years has seen a total manufacturing trade surplus to Uganda of more than US$ 30 million. Table 6.7 Tanzanian Trade with Kenya and Uganda Description 1997 1998 1 Manufactured Exports to:
Kenya (TZS mill) Uganda (TZS mill) Kenya and Uganda (TZS mill)
6,045 3,324 9,370
9,610 3,873
13,484 2 Manufactured Imports
from Kenya (TZS million) from Uganda (TZS million) from Kenya and Uganda (TZS million)
47,632 14,968 62,601
60,570
1,272 61843
3 Balance of Trade Trade with Kenya (TZS mill) Trade with Uganda (TZS mill) Trade with Kenya and Uganda (TZS mill)
-41,587 -11,644 -53,231
-50,960 2,601 -48,358
4 Manufactured Exports to East Africa as a share of Tanzania’s total manufactured exports to Kenya (%) to Uganda (%) to Kenya and Uganda (%)
9.5 5.2
14.7
- - -
5 Manufactures as a share of Tanzania’s Exports to Kenya (%) to Uganda (%) to Kenya and Uganda (%)
39.2 73.6 47.0
54.5 90.2 61.5
Source: ERB, 1999
18 Source: ERB, 1999.
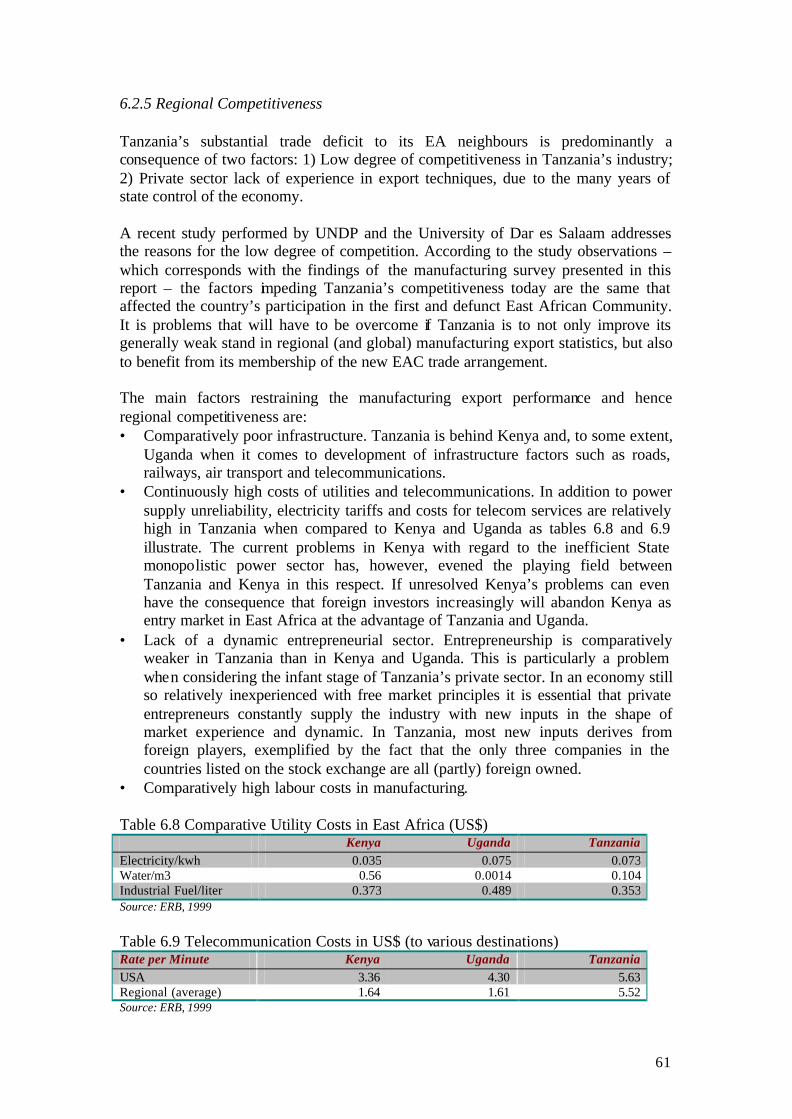
61
6.2.5 Regional Competitiveness Tanzania’s substantial trade deficit to its EA neighbours is predominantly a consequence of two factors: 1) Low degree of competitiveness in Tanzania’s industry; 2) Private sector lack of experience in export techniques, due to the many years of state control of the economy. A recent study performed by UNDP and the University of Dar es Salaam addresses the reasons for the low degree of competition. According to the study observations – which corresponds with the findings of the manufacturing survey presented in this report – the factors impeding Tanzania’s competitiveness today are the same that affected the country’s participation in the first and defunct East African Community. It is problems that will have to be overcome if Tanzania is to not only improve its generally weak stand in regional (and global) manufacturing export statistics, but also to benefit from its membership of the new EAC trade arrangement. The main factors restraining the manufacturing export performance and hence regional competitiveness are: • Comparatively poor infrastructure. Tanzania is behind Kenya and, to some extent,
Uganda when it comes to development of infrastructure factors such as roads, railways, air transport and telecommunications.
• Continuously high costs of utilities and telecommunications. In addition to power supply unreliability, electricity tariffs and costs for telecom services are relatively high in Tanzania when compared to Kenya and Uganda as tables 6.8 and 6.9 illustrate. The current problems in Kenya with regard to the inefficient State monopolistic power sector has, however, evened the playing field between Tanzania and Kenya in this respect. If unresolved Kenya’s problems can even have the consequence that foreign investors increasingly will abandon Kenya as entry market in East Africa at the advantage of Tanzania and Uganda.
• Lack of a dynamic entrepreneurial sector. Entrepreneurship is comparatively weaker in Tanzania than in Kenya and Uganda. This is particularly a problem when considering the infant stage of Tanzania’s private sector. In an economy still so relatively inexperienced with free market principles it is essential that private entrepreneurs constantly supply the industry with new inputs in the shape of market experience and dynamic. In Tanzania, most new inputs derives from foreign players, exemplified by the fact that the only three companies in the countries listed on the stock exchange are all (partly) foreign owned.
• Comparatively high labour costs in manufacturing. Table 6.8 Comparative Utility Costs in East Africa (US$) Kenya Uganda Tanzania Electricity/kwh 0.035 0.075 0.073 Water/m3 0.56 0.0014 0.104 Industrial Fuel/liter 0.373 0.489 0.353 Source: ERB, 1999
Table 6.9 Telecommunication Costs in US$ (to various destinations) Rate per Minute Kenya Uganda Tanzania USA 3.36 4.30 5.63 Regional (average) 1.64 1.61 5.52 Source: ERB, 1999
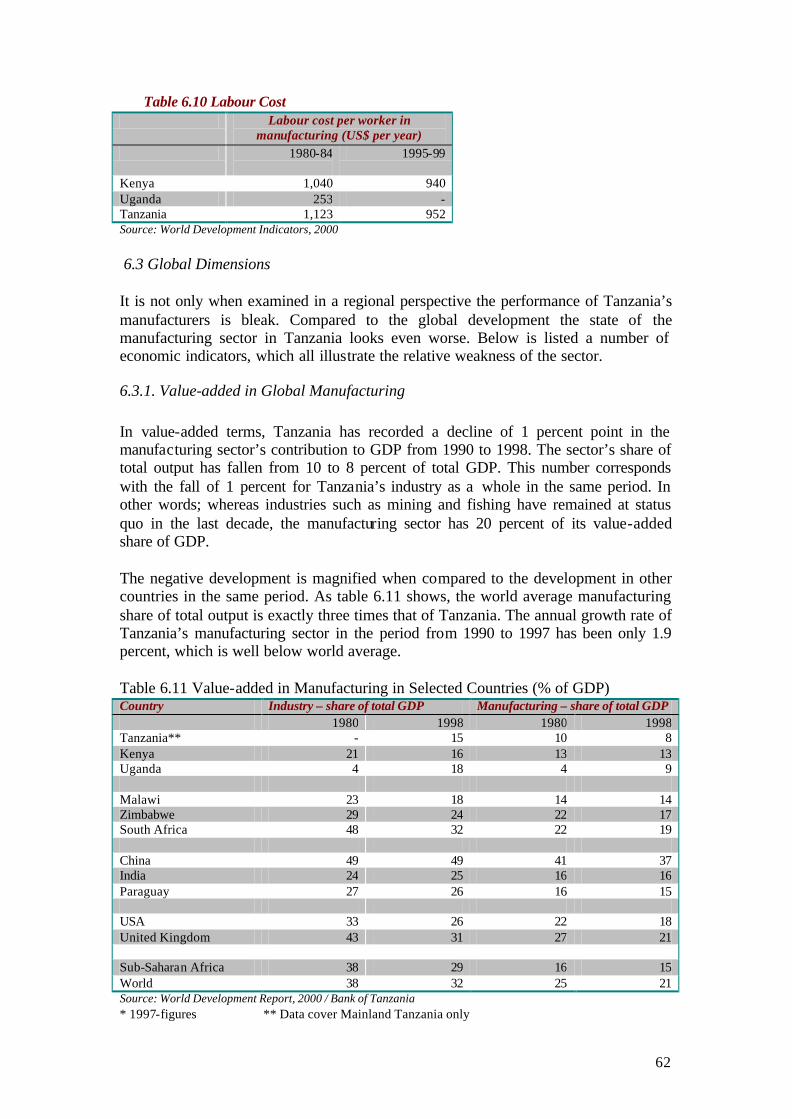
62
Table 6.10 Labour Cost Labour cost per worker in
manufacturing (US$ per year) 1980-84
1995-99
Kenya 1,040 940 Uganda 253 - Tanzania 1,123 952 Source: World Development Indicators, 2000
6.3 Global Dimensions It is not only when examined in a regional perspective the performance of Tanzania’s manufacturers is bleak. Compared to the global development the state of the manufacturing sector in Tanzania looks even worse. Below is listed a number of economic indicators, which all illustrate the relative weakness of the sector.
6.3.1. Value-added in Global Manufacturing In value-added terms, Tanzania has recorded a decline of 1 percent point in the manufacturing sector’s contribution to GDP from 1990 to 1998. The sector’s share of total output has fallen from 10 to 8 percent of total GDP. This number corresponds with the fall of 1 percent for Tanzania’s industry as a whole in the same period. In other words; whereas industries such as mining and fishing have remained at status quo in the last decade, the manufacturing sector has 20 percent of its value-added share of GDP. The negative development is magnified when compared to the development in other countries in the same period. As table 6.11 shows, the world average manufacturing share of total output is exactly three times that of Tanzania. The annual growth rate of Tanzania’s manufacturing sector in the period from 1990 to 1997 has been only 1.9 percent, which is well below world average. Table 6.11 Value-added in Manufacturing in Selected Countries (% of GDP) Country Industry – share of total GDP Manufacturing – share of total GDP 1980 1998 1980 1998 Tanzania** - 15 10 8 Kenya 21 16 13 13 Uganda 4 18 4 9 Malawi 23 18 14 14 Zimbabwe 29 24 22 17 South Africa 48 32 22 19 China 49 49 41 37 India 24 25 16 16 Paraguay 27 26 16 15 USA 33 26 22 18 United Kingdom 43 31 27 21 Sub-Saharan Africa 38 29 16 15 World 38 32 25 21 Source: World Development Report, 2000 / Bank of Tanzania * 1997-figures ** Data cover Mainland Tanzania only

63
Table 6.12 Growth of Output GDP Agriculture Industry Manufact. Services
average annual % growth 1990-
1998 1990- 1998
1990- 1998
1990- 1998
1990-1998
Tanzania* 2.7 3.7 1.2 1.9 1.9 Kenya 2.2 1.3 1.9 2.5 3.6 Uganda 7.3 3.6 12.8 14.2 8.3 Malawi 3.8 8.9 1.3 0.5 0.4 Zimbabwe 2.3 3.9 -1.2 -1.7 3.6 South Africa 1.9 0.8 1.0 1.1 2.4 China 11.2 4.4 15.4 14.7 9.4 India 6.1 3.8 6.7 8.0 7.7 Paraguay 2.8 2.8 3.1 0.9 2.5 USA 3.2 2.5 4.9 6.0 2.3 UK 2.2 - - - - Sub-Sah. Africa 2.3 2.4 1.3 1.2 2.5 World 2.4 1.1 2.6 2.7 2.1 Source: World Development Indicators, 1999 * Data cover Mainland Tanzania only
6.3.2 Structure of Manufacturing When comparing the output of the various sub-sectors constituting the manufacturing sector in Tanzania to the same sectors in other countries, the most distinct feature is the large share of the sector “textiles & clothing.” Manufacturing of textiles is typically a preferred sector in developing countries because of the relatively limited technological investments it requires, as well as the labour- intensive mode of production. The textiles sector has in this respect underpinned a successful modernization process in many countries. As industrialization progressed these countries have been able to move into technologically intensive sectors on the basis of a thriving textiles industry. This has not least been true in many Asian economies. In China, for example, the textiles sector has expanded constantly for the last three to four decades, but has even so gradually been surpassed by other “new” sectors in terms of share of total manufacturing output. Hence, a high share of textiles in an economy’s total level of manufacturing value-added output usually corresponds to a low level of industrialization for the economy. In the case of Tanzania a 33 percent share for the textiles & clothing sector reveals that the economy in 1980 was at a low stage of development, in relative terms. This observation is supported by the fact that the sector “machinery & transport equipment” – a sector that requires a high level of technological efficiency – was considerably underrepresented in the manufacturing industry, compared to the similar sector in most other countries.

64
Since the peak in the early 1980s the share of textile & clothing in total value-added manufacturing in Tanzania has dropped dramatically. In 1999 the share of textiles & clothing in total value-added manufacturing was estimated at only 1 percent. But as previously explained the drastic decline of the sector has, however, not been the result of a successful transfer of the textile sector’s dynamic onto other sectors. Rather, it has been the result of an increasing amount of imported garment products and the almost total collapse of the largest state-owned mills. Consequently, the textiles & clothing sector has lost its leading role in the manufacturing industry and in 1998 was estimated to generate a share of total output that was almost 15 percent less than the food manufacturing share. Table 6.13. illustrates the composition of the manufacturing sector in Tanzania and other countries. Table 6.13 Structure of Manufacturing in Selected Countries Country Food,
beverages & tobacco
Textiles & clothing
Machinery & transport equipment
Chemicals Other manufac-
turing % of total % of total % of total % of total % of total 1980 1997 1980 1997 1980 1997 1980 1997 1980 1997 Tanzania* 23 47** 33 1** 8 5** 6 15** 30 32** Kenya 34 48 12 7 15 10 9 8 30 27 Uganda - 31 - 23 - 0 - 4 - 42 Malawi 58 - 12 - 4 - 5 - 20 - Zimbabwe 23 31 17 15 8 8 9 9 42 36 SA 12 16 9 7 21 19 9 10 48 48 China 10 15 18 12 22 25 11 12 38 36 India 9 12 21 14 25 25 14 17 30 32 Paraguay 38 56 12 16 1 1 3 5 46 21 USA 11 11 6 4 34 37 10 11 40 37 UK 13 14 6 5 33 30 10 12 38 39 Source: World Development Indicators, 2000 / Bureau of Statistics, 1999 * Data cover mainland Tanzania only ** The data for Tanzania is based on 1999 figures
6.3.3 Manufacturing Exports The export performance of Tanzania’s manufacturing sector has reflected the generally sluggish state of the country’s export development. In total nominal terms Tanzania’s aggregate merchandise exports has increased by only about 20 percent within a two-decade span from 1980 to 1997 (2 percent annual growth rate), compared to a world average increase of more than 200 percent in the period 1980-1997 (11.6 percent annual growth rate). The worst period was 1985-1995 where Tanzania’s merchandise export sector recorded a loss in export competitiveness (measured in market participation) on the OECD markets of 25-30 percent – equal to the situation of many other countries in Sub-Sahara Africa. In the same period a number of Latin American and South East Asian economies experienced annual growth rates for exports to the OECD markets of 40-50 percent.
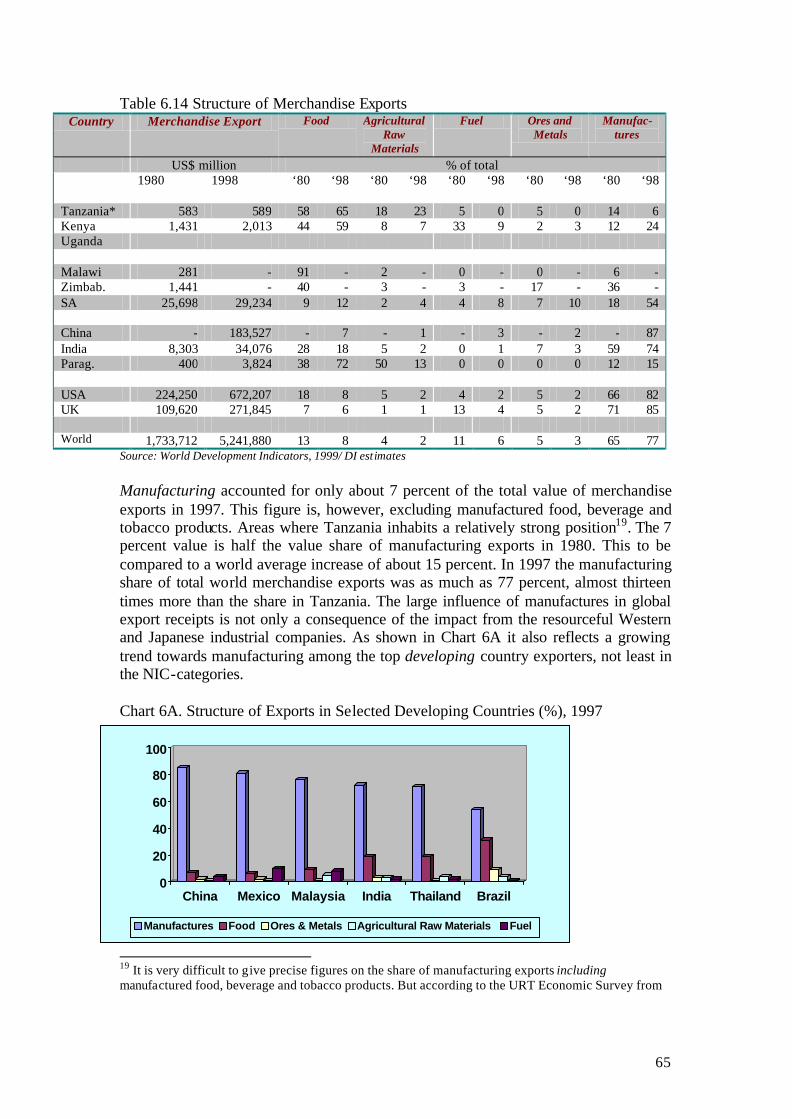
65
Table 6.14 Structure of Merchandise Exports Country Merchandise Export Food Agricultural
Raw Materials
Fuel Ores and Metals
Manufac-tures
US$ million % of total
1980 1998 ‘80 ‘98 ‘80 ‘98 ‘80 ‘98 ‘80 ‘98 ‘80 ‘98
Tanzania* 583 589 58 65 18 23 5 0 5 0 14 6 Kenya 1,431 2,013 44 59 8 7 33 9 2 3 12 24 Uganda Malawi 281 - 91 - 2 - 0 - 0 - 6 - Zimbab. 1,441 - 40 - 3 - 3 - 17 - 36 - SA 25,698 29,234 9 12 2 4 4 8 7 10 18 54 China - 183,527 - 7 - 1 - 3 - 2 - 87 India 8,303 34,076 28 18 5 2 0 1 7 3 59 74 Parag. 400 3,824 38 72 50 13 0 0 0 0 12 15 USA 224,250 672,207 18 8 5 2 4 2 5 2 66 82 UK 109,620 271,845 7 6 1 1 13 4 5 2 71 85 World 1,733,712 5,241,880 13 8 4 2 11 6 5 3 65 77
Source: World Development Indicators, 1999/ DI estimates
Manufacturing accounted for only about 7 percent of the total value of merchandise exports in 1997. This figure is, however, excluding manufactured food, beverage and tobacco products. Areas where Tanzania inhabits a relatively strong position19. The 7 percent value is half the value share of manufacturing exports in 1980. This to be compared to a world average increase of about 15 percent. In 1997 the manufacturing share of total world merchandise exports was as much as 77 percent, almost thirteen times more than the share in Tanzania. The large influence of manufactures in global export receipts is not only a consequence of the impact from the resourceful Western and Japanese industrial companies. As shown in Chart 6A it also reflects a growing trend towards manufacturing among the top developing country exporters, not least in the NIC-categories. Chart 6A. Structure of Exports in Selected Developing Countries (%), 1997
19 It is very difficult to give precise figures on the share of manufacturing exports including manufactured food, beverage and tobacco products. But according to the URT Economic Survey from
0
20
40
60
80
100
China Mexico Malaysia India Thailand Brazil
Manufactures Food Ores & Metals Agricultural Raw Materials Fuel
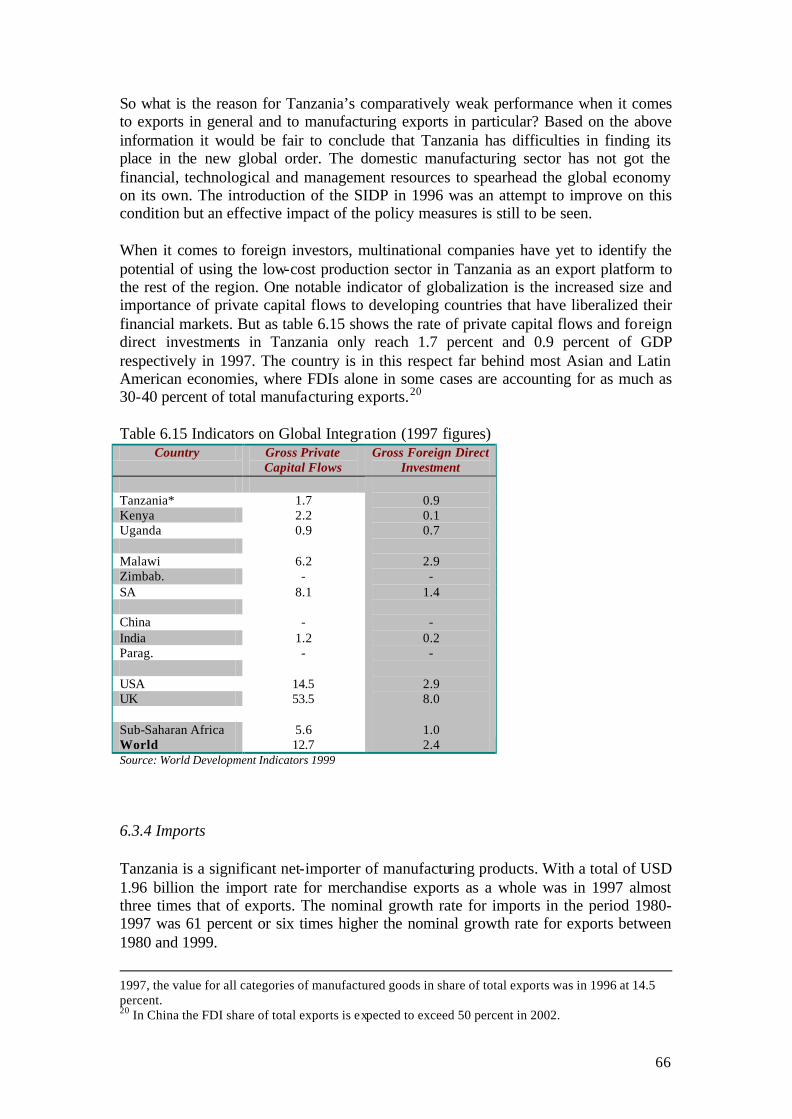
66
So what is the reason for Tanzania’s comparatively weak performance when it comes to exports in general and to manufacturing exports in particular? Based on the above information it would be fair to conclude that Tanzania has difficulties in finding its place in the new global order. The domestic manufacturing sector has not got the financial, technological and management resources to spearhead the global economy on its own. The introduction of the SIDP in 1996 was an attempt to improve on this condition but an effective impact of the policy measures is still to be seen. When it comes to foreign investors, multinational companies have yet to identify the potential of using the low-cost production sector in Tanzania as an export platform to the rest of the region. One notable indicator of globalization is the increased size and importance of private capital flows to developing countries that have liberalized their financial markets. But as table 6.15 shows the rate of private capital flows and foreign direct investments in Tanzania only reach 1.7 percent and 0.9 percent of GDP respectively in 1997. The country is in this respect far behind most Asian and Latin American economies, where FDIs alone in some cases are accounting for as much as 30-40 percent of total manufacturing exports.20 Table 6.15 Indicators on Global Integration (1997 figures)
Country Gross Private Capital Flows
Gross Foreign Direct Investment
Tanzania* Kenya Uganda Malawi Zimbab. SA China India Parag. USA UK Sub-Saharan Africa World
1.7 2.2 0.9
6.2 -
8.1 -
1.2 -
14.5 53.5
5.6 12.7
0.9 0.1 0.7
2.9 -
1.4 -
0.2 -
2.9 8.0
1.0 2.4
Source: World Development Indicators 1999
6.3.4 Imports Tanzania is a significant net-importer of manufacturing products. With a total of USD 1.96 billion the import rate for merchandise exports as a whole was in 1997 almost three times that of exports. The nominal growth rate for imports in the period 1980-1997 was 61 percent or six times higher the nominal growth rate for exports between 1980 and 1999.
1997, the value for all categories of manufactured goods in share of total exports was in 1996 at 14.5 percent. 20 In China the FDI share of total exports is expected to exceed 50 percent in 2002.
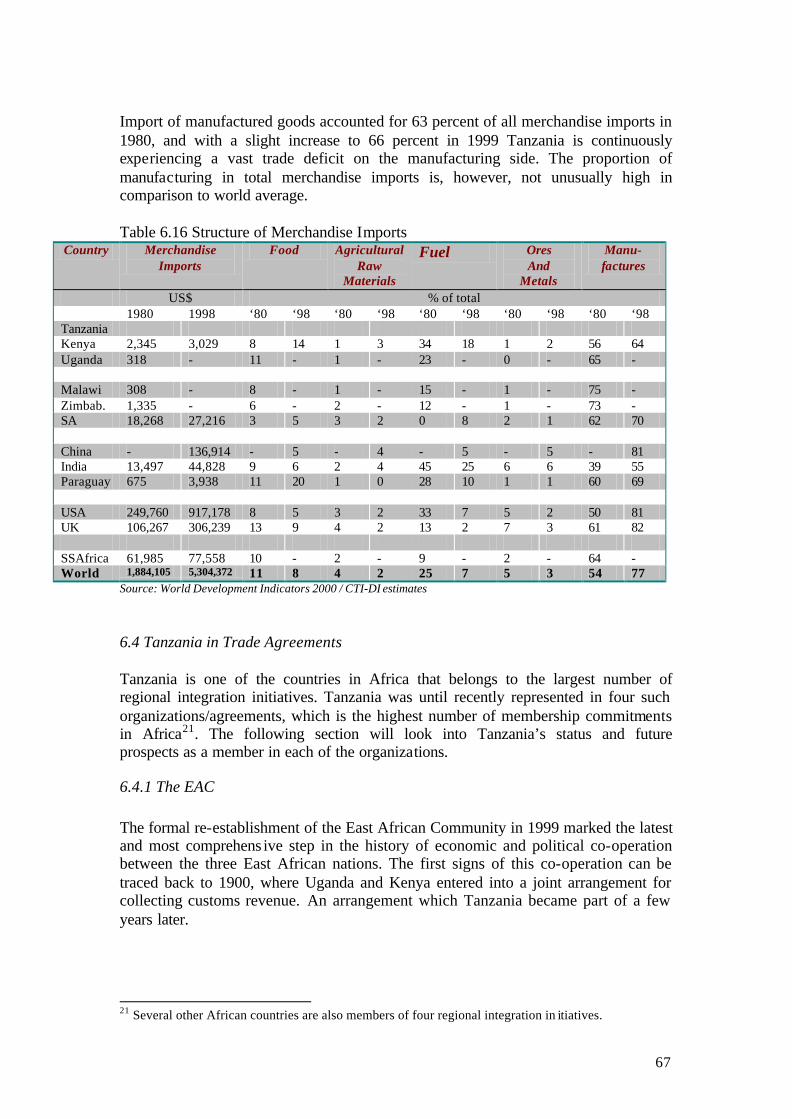
67
Import of manufactured goods accounted for 63 percent of all merchandise imports in 1980, and with a slight increase to 66 percent in 1999 Tanzania is continuously experiencing a vast trade deficit on the manufacturing side. The proportion of manufacturing in total merchandise imports is, however, not unusually high in comparison to world average. Table 6.16 Structure of Merchandise Imports
Country Merchandise Imports
Food Agricultural Raw
Materials
Fuel Ores And
Metals
Manu-factures
US$ % of total 1980 1998 ‘80 ‘98 ‘80 ‘98 ‘80 ‘98 ‘80 ‘98 ‘80 ‘98 Tanzania Kenya 2,345 3,029 8 14 1 3 34 18 1 2 56 64 Uganda 318 - 11 - 1 - 23 - 0 - 65 - Malawi 308 - 8 - 1 - 15 - 1 - 75 - Zimbab. 1,335 - 6 - 2 - 12 - 1 - 73 - SA 18,268 27,216 3 5 3 2 0 8 2 1 62 70 China - 136,914 - 5 - 4 - 5 - 5 - 81 India 13,497 44,828 9 6 2 4 45 25 6 6 39 55 Paraguay 675 3,938 11 20 1 0 28 10 1 1 60 69 USA 249,760 917,178 8 5 3 2 33 7 5 2 50 81 UK 106,267 306,239 13 9 4 2 13 2 7 3 61 82 SSAfrica 61,985 77,558 10 - 2 - 9 - 2 - 64 - World 1,884,105 5,304,372 11 8 4 2 25 7 5 3 54 77
Source: World Development Indicators 2000 / CTI-DI estimates
6.4 Tanzania in Trade Agreements Tanzania is one of the countries in Africa that belongs to the largest number of regional integration initiatives. Tanzania was until recently represented in four such organizations/agreements, which is the highest number of membership commitments in Africa21. The following section will look into Tanzania’s status and future prospects as a member in each of the organizations.
6.4.1 The EAC The formal re-establishment of the East African Community in 1999 marked the latest and most comprehens ive step in the history of economic and political co-operation between the three East African nations. The first signs of this co-operation can be traced back to 1900, where Uganda and Kenya entered into a joint arrangement for collecting customs revenue. An arrangement which Tanzania became part of a few years later.
21 Several other African countries are also members of four regional integration in itiatives.
68
In the years that followed a number of new joint initiatives were launched. On the more formal side, the establishment of organs such as the East African High Commission and the East African Common Services Organization paved the way for the signing of the actual Treaty of the East African Community in 1967. This first version of the EAC established, among other things, a common external tariff, duty free movement of goods within the three member countries and the abolition of almost all quantitative restrictions on trade. But the community had serious problems from the beginning and only ten years after the inauguration, in 1977, the collapse of the EAC was a reality. The main reasons for the collapse were threefold: • A lack of strong political will • A lack of strong participation by the private sector and civil society in the co-
operative activities • A continued disproportionate sharing of benefits among the partner states In the years following the dissolution of the Community a stalemate in the economic co-operation could be identified. Despite intense negotiations and the introduction of minor joint agreements, no concrete steps to revive the Community was hence taken before 1993. The signing of the Permanent Tripartite Commission Agreement that year was followed by the launching of the Secretariat of the Commission in 1996. And then finally – on November 30th, 1999 – the treaty of the re-establishment of the East African Community was signed in Arusha. The establishment of the new EAC has been strongly supported by the World Bank, IMF and various donors. These parties believe that increased economic integration offers an opportunity for African countries to eventually become active players in the globalization process. Their strong involvement in the new build-up has also meant a better possibility for the Community to overcome the problems, which resulted in the breakdown of the first EAC. Both the World Bank and the IMF as well as several donor countries are continuously assisting the three membership governments in providing a framework for the Community, which will secure more private sector participation and distribute the benefits of the integration to the satisfaction of both Kenya, Uganda and Tanzania.
6.4.2 SADC and COMESA In addition to the re-establishment of the EAC, Tanzania has also been a co-founder of the Southern African Development Community (SADC). Initially, SADC’s approach to regional integration placed emphasis on infrastructural development as opposed to the market integration approach. But in 1996 Tanzania was one of 13 (11) states, which signed the SADC Protocol on Trade. The members of the Protocol are: Angola Namibia Botswana Seychelles D.R. of Congo South Africa Malawi Swaziland Mauritius Tanzania Mozambique Zambia Zimbabwe

69
In broad terms, the objective of the Protocol is the establishment of a Free Trade Area among the SADC member states. An important aspect of the agreement is that manufacturing products produced in the member states can be exempted for duty tariffs, when traded internally. It is, however, not all products that qualify for the duty-free status. Three criteria of qualifications will have to be met: 1) The products have to be produced in their entirety in the country of origin. 2) The cif (cost, insurance and freight) value of imported materials from outside
SADC to be used in the manufacturing of the products from outside SADC cannot exceed 60 percent of total costs of materials used in the production. Otherwise the value-added resulting from the production process should account for at least 35 percent of the ex-factory costs of the goods.
3) Changes in tariff headings should be applied for the products deriving from the processing carried out on the imported, non-origination material.
Tanzania’s membership of SADC has been subject to much criticism. Especially because the membership to some extent replaces the membership of the Common Market for Eastern and Southern Africa (COMESA). COMESA is a geographically widespread trade community that was founded in 1994 and until Tanzania’s recent withdrawal covered 22 member countries with a total population of more than 300 million people. The main aim of COMESA is to create a level of regional integration that could eventually develop into a common market in which goods, services, capital and labour could move unhindered. For the manufacturing sector in the member countries, a full implementation of the COMESA directives would mean gradual reduction and eventual elimination of tariffs on finished products as well as imported inputs. COMESA members as of September 15, 2000: Angola Namibia Burundi Rwanda Comoros Seychelles D.R. of Congo Swaziland Eritrea Sudan Egypt Uganda Kenya Zambia Madagascar Zimbabwe Mauritius Malawi Tanzania formally withdrew from the organization in September 2000. The reason for the withdrawal was mainly the country’s substantial and growing trade deficit within the organization. In 1999, Tanzania’s total trade with COMESA amounted to US$ 175 million. Out of this amount some US$ 128 million were imports and only US$ 47 were exports. As a consequence of this situation the Tanzanian government decided that the purpose of the membership was not being met, and that enhancement of the country’s export performance could better be achieved in one of the two other organizations/trade agreements, of which Tanzania is a member.

70
6.4.2.1 Problems with SADC Critics of Tanzania pulling out of COMESA points to a number of problems in the decision. First of because Tanzania now is a member of a free trade agreement which its two co-members in EAC are not participants in. As opposed to COMESA, where both Kenya and Uganda are members. This situation can create a mismatch in the formulation of the three countries’ industrial and trade policies, due to certain incompatibilities in the content of the agreements, and hence have a hampering effect on the EAC integration process. Another critical point to Tanzania’s shift from COMESA to SADC membership goes to the fact that SADC has a substantial smaller membership base. If the withdrawal from COMESA was explained on the basis of poor trade statistics it does not seem logical to join a smaller trade regime in which Tanzania’s comparative advantages are not more evident. COMESA consists (now) of 21 domestic markets that are fairly diverse in product segmentation and hence should provide potentially lucrative sales opportunities to Tanzania’s companies. Whereas SADC in contrast have 14 markets with a great degree of product similarity. From a more direct manufacturing perspective, the lack of an overarching institutional framework (a central finance institution, a reinsurance company) and, not least, an effective regional infrastructure regime for trade in the SADC can have an inhibiting effect on the operational capacity of the traders within the organization. In transport, for example, Tanzania will find it difficult to operate its trade fleets across the SADC region because no prior arrangements have been made. 6.4.2.2 Advantages of SADC There are, however, also a number of benefits attached to the shift from COMESA to SADC. Former Vice Chairman in CTI, Ravi Chande, has analyzed Tanzania’s participation in the two organizations and finds that SADC membership offers a better deal to Tanzania than being part of COMESA. The reasons for this position are summarized as follows22: • The SADC Treaty recognizes the differences in the levels of development among
its member countries. The SADC Trade Protocol hence acknowledges the principle of asymmetry in the establishment of a common free trade area to reflect the imbalance in the strengths of the various economies. A number of the member countries including South Africa have agreed to reduce their tariffs at a faster pace than Tanzania and other lower developed countries. This offers a dual advantage to Tanzania: on one hand will Tanzanian producers benefit from duty-free imports of raw materials and goods. And on the other hand will sensitive23 products not be offered duty free treatment until the eleventh year of the Trade Protocol implementation. The eleven-year adjustment period is far more appropriate to the prevailing circumstances in Tanzania than the adoption of an immediate Free Trade Areas as proposed by COMESA.
22 Extracts from the report by Ravi Chande, which will be published in late 2000. 23 Sensitive products are classified as products deriving from industries/sectors, which still needs a certain degree of legislative protection before being thrown open to free market competition. Each country in the SADC has prepared a list of products, which are considered to be sensitive under this classification.
71
• The SADC Trade Protocol stipulates a product-by-product approach to duty-free intra-trade, as opposed to the COMESA approach of across-the-board zero tariffs. Furthermore, similar to the SADC Treaty itself, the Trade Protocol applied the principle of asymmetry, whilst the COMESA free trade stipulation treats every country equally.
• Tanzania is not ready to eliminate all tariffs by November, as proposed by the COMESA Treaty. It would lead to the collapse of the industrial structure in the country. Alternatively, Tanzania could adopt the strategy of many COMESA members and accept the FTA in principle and then impose various trade flow restricting measures afterwards. This, however, is not a sustainable method for neither Tanzania’s economy nor the integrity of the COMESA FTA as a viable trade arrangement.
• Tanzania needs a period of adjustment to deal with the distortions in the economy. Implementation of various new measures with regard to development and liberalization of taxation policies, infrastructure and industry support will require many resources and much time in order to be completed successfully. This process has to be carefully managed within a realistic timetable, which the COMESA integration does not provide.

72
Annex A Manufacturing Survey Questionnaire
Manufacturing Survey 2000
Questionnaire Company Data: Name of Company: ___________________________________________________________ Address: ___________________________________________________________________ PO Box: ____________________________________________________________________ Telephone: __________________________________________________________________ Fax: _______________________________________________________________________ E-mail: _____________________________________________________________________ Web-site: ___________________________________________________________________ Name of Managing Director: ___________________________________________________ Name(s) and Title(s) o f Respondent: _____________________________________________ Company Status 1. Company’s Registered ISIC Classification: _____________________________________________ 2. Main Product Line: ________________________________________________________________ 3. Secondary Product Lines: ___________________________________________________________ ___________________________________________________________________________________ 4. Form of Ownership:
Private State Private/State Venture*
Wholly Foreign-owned
Joint Venture*
Co-operative*
* Distribution of Ownership Share: _____________________________________________________ 5. Number of Employees: 1999: _______________ Currently: _______________ 6. Distribution of Labour Force (percentage): Skilled Unskilled 1999 Currently Skilled: Workers with specific training in one or more aspects of the production field Unskilled: Workers without specific training in any aspects of the production field
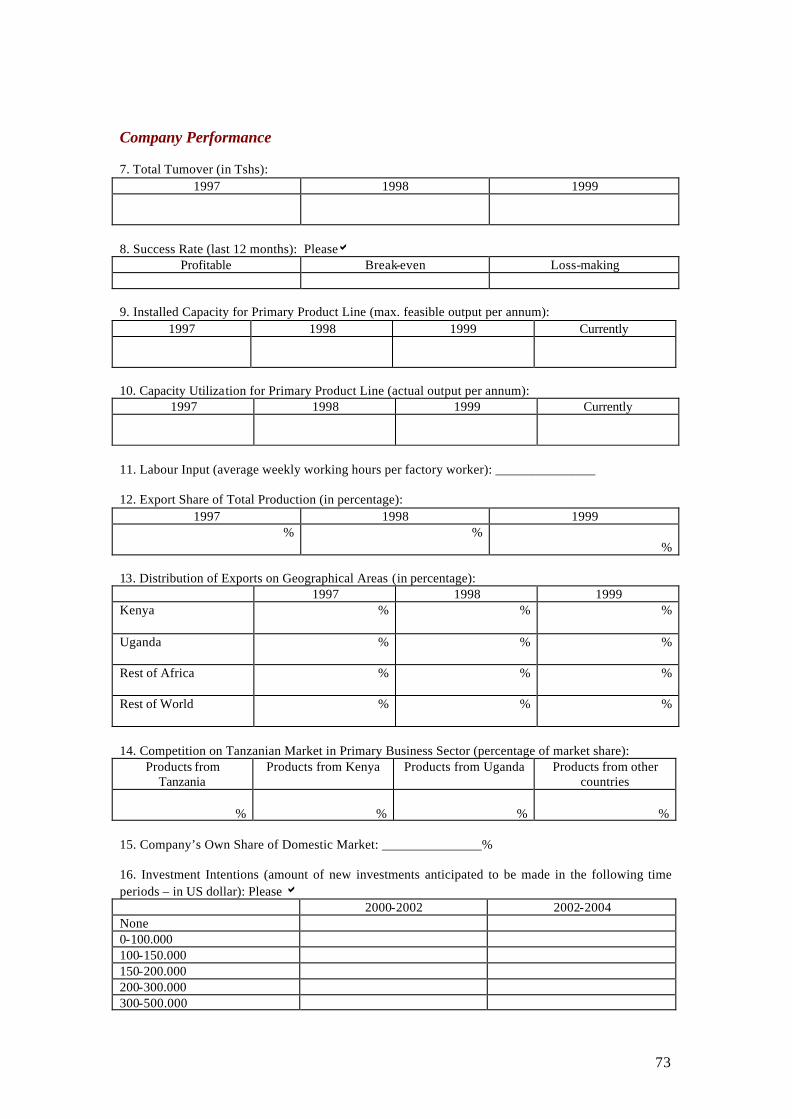
73
Company Performance 7. Total Turnover (in Tshs):
1997 1998 1999
8. Success Rate (last 12 months): Pleasea
Profitable Break-even Loss-making 9. Installed Capacity for Primary Product Line (max. feasible output per annum):
1997 1998 1999 Currently
10. Capacity Utilization for Primary Product Line (actual output per annum):
1997 1998 1999 Currently
11. Labour Input (average weekly working hours per factory worker): _______________ 12. Export Share of Total Production (in percentage):
1997 1998 1999 % %
% 13. Distribution of Exports on Geographical Areas (in percentage): 1997 1998 1999 Kenya
% % %
Uganda
% % %
Rest of Africa
% % %
Rest of World
% % %
14. Competition on Tanzanian Market in Primary Business Sector (percentage of market share):
Products from Tanzania
Products from Kenya Products from Uganda Products from other countries
%
%
%
%
15. Company’s Own Share of Domestic Market: _______________% 16. Investment Intentions (amount of new investments anticipated to be made in the following time periods – in US dollar): Please a 2000-2002 2002-2004 None 0-100.000 100-150.000 150-200.000 200-300.000 300-500.000

74
+500.000 Access to Capital 17. Financing Sources (pleaseaone or more sources):
Domestic Banks
Other Domestic Financing
Facility (incl. capital
markets)
Foreign Financing Facility
Foreign Investor/Part-
ner
Savings/ Other (specify below)
Specify: (financing institution): ________________________________________________________ 18. Access to Financing: Pleasea
Difficult Not difficult 19. Access to Financing (compared to 24 months ago): Please a
Easier Same Harder 20. Ranking of Financing Constraints (rank only factors you find to be constraining to your company performance):
High Cost Collateral Repayment Period Exchange Rate Risk
Other (specify below)
Specify: ______________________________________________________________ Information Technology (IT) Sufficiency 21. Number of Employees with Computer Literacy: _________________________________________ 22. Number of Installed Computers in Company: ___________________________________________ Institutional and Social Constraints: 23. Constraining Impact of Government Policies & Actions on Company Performance: Pleaseaand rank (last column) Very
constraining Slightly
constraining Neutral Not
constraining Rank three
worst constraints*
A. Cost of utilities
B. Availability of utilities
C. Reliability of utilities
D. Bureaucracy
E. Delay in settlement of tax

75
refund claims F. Harassment from government officials
G. Multiplicity/high level of taxes
H. Abuse of tax exemptions
I. Exchange rate (high/fluctuating)
J. Domestic inflation
K. Import dumping on domestic market
L. Lack of export incentives
M. Outdated/conflicting laws/regulations
N .Lack of/unclear environmental legislation
O. Duplication of roles among regulatory agencies
P. Poor infrastructure
Q. Inconsistencies of government policies
R. Other
S. Other
T. Other
* 1=most constraining, 2=second most constraining, 3=third most constraining 24. Constraining Impact of Social Factors on Performance: Pleaseaand rank (last column) Very
constraining Slightly
constraining Neutral Not
constraining Rank three
worst constraints*
A. Climate
B. Corruption
C. Crime
D. HIV/AIDS
E. Human resource development
F. Technology
G. Shortage of skilled labour
H. Shortage of managerial staff
I. Staff motivation
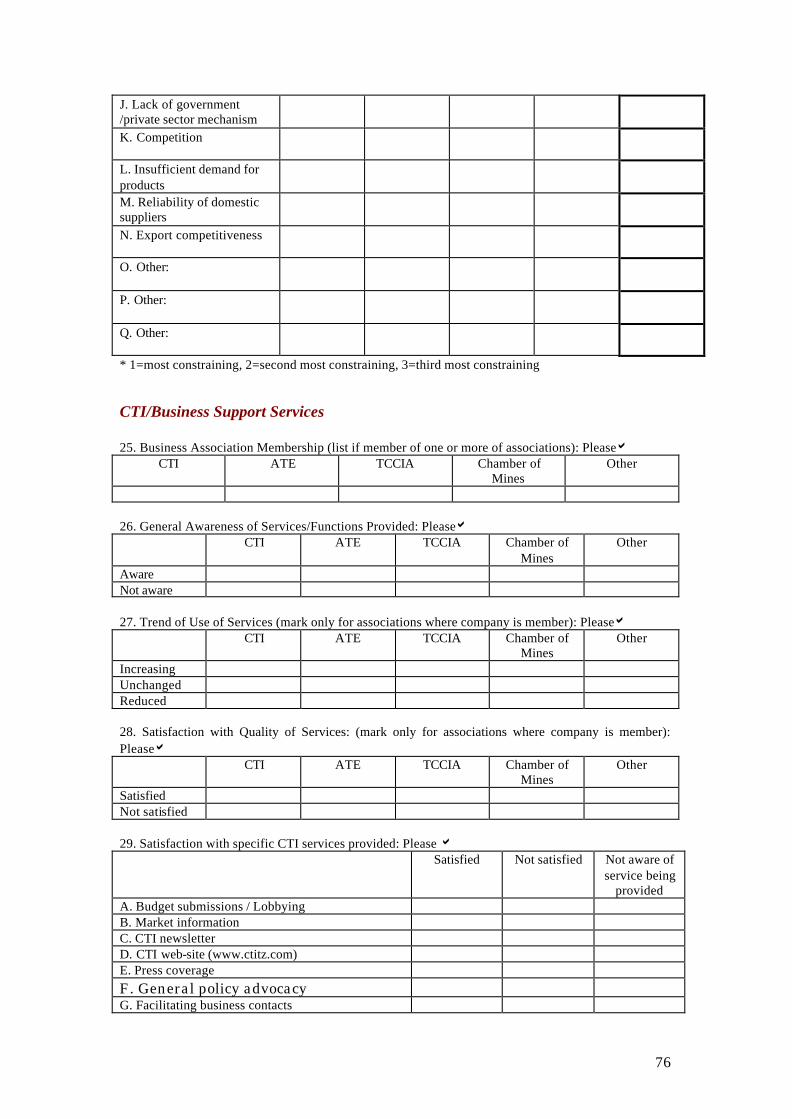
76
J. Lack of government /private sector mechanism
K. Competition
L. Insufficient demand for products
M. Reliability of domestic suppliers
N. Export competitiveness
O. Other:
P. Other:
Q. Other:
* 1=most constraining, 2=second most constraining, 3=third most constraining CTI/Business Support Services 25. Business Association Membership (list if member of one or more of associations): Pleasea
CTI ATE TCCIA Chamber of Mines
Other
26. General Awareness of Services/Functions Provided: Pleasea CTI ATE TCCIA Chamber of
Mines Other
Aware Not aware 27. Trend of Use of Services (mark only for associations where company is member): Pleasea CTI ATE TCCIA Chamber of
Mines Other
Increasing Unchanged Reduced 28. Satisfaction with Quality of Services: (mark only for associations where company is member): Pleasea CTI ATE TCCIA Chamber of
Mines Other
Satisfied Not satisfied 29. Satisfaction with specific CTI services provided: Please a Satisfied Not satisfied Not aware of
service being provided
A. Budget submissions / Lobbying B. Market information C. CTI newsletter D. CTI web-site (www.ctitz.com) E. Press coverage
F. General policy advocacy
G. Facilitating business contacts
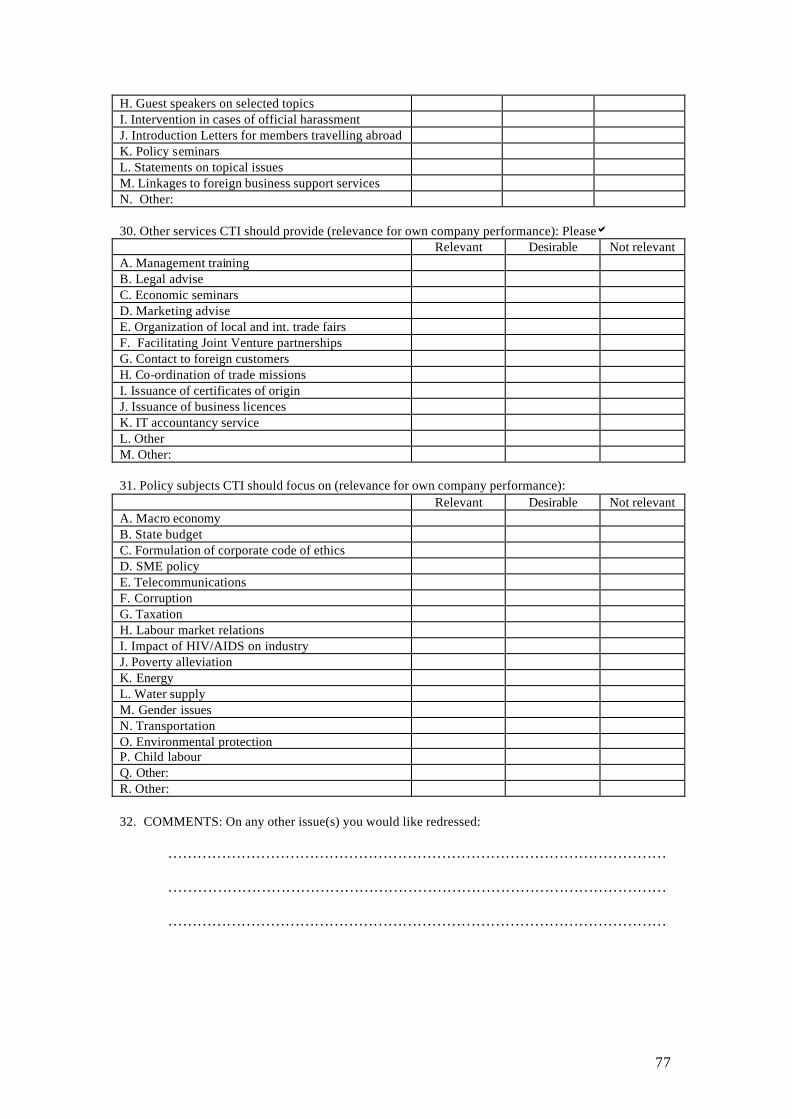
77
H. Guest speakers on selected topics I. Intervention in cases of official harassment J. Introduction Letters for members travelling abroad K. Policy seminars L. Statements on topical issues M. Linkages to foreign business support services N. Other: 30. Other services CTI should provide (relevance for own company performance): Pleasea Relevant Desirable Not relevant A. Management training B. Legal advise C. Economic seminars D. Marketing advise E. Organization of local and int. trade fairs F. Facilitating Joint Venture partnerships G. Contact to foreign customers H. Co-ordination of trade missions I. Issuance of certificates of origin J. Issuance of business licences K. IT accountancy service L. Other M. Other: 31. Policy subjects CTI should focus on (relevance for own company performance): Relevant Desirable Not relevant A. Macro economy B. State budget C. Formulation of corporate code of ethics D. SME policy E. Telecommunications F. Corruption G. Taxation H. Labour market relations I. Impact of HIV/AIDS on industry J. Poverty alleviation K. Energy L. Water supply M. Gender issues N. Transportation O. Environmental protection P. Child labour Q. Other: R. Other: 32. COMMENTS: On any other issue(s) you would like redressed:
………………………………………………………………………………………… ………………………………………………………………………………………… …………………………………………………………………………………………

78
Annex B Standard Industrial Classification Food, Beverages and Tobacco (ISIC 31) • slaughtering, preparing and preserving of meat • manufacturing of dairy products • canning, preserving of fruits, vegetables, fish products • manufacturing of vegetable and animal oils and fats, grain mill products, baking
products, sugar and confectionery • manufacturing of other foods • distilling of ethyl alcohol for alcoholic beverages • distilling and blending of spirits • manufacturing of wines, cider, perry, beer, carbonated waters, natural spring &
mineral waters and soft drinks • manufacturing of cigarettes, cigars, tobacco and other tobacco products Textiles, Clothing, Leather and Footwear (ISIC 32) • spinning, weaving and finishing of textiles • manufacturing of made-up textile goods, knitting mills, carpets, rugs, cordage,
rope and twine • manufacturing of clothing by cutting and sewing fabrics, leather, fur, plastics,
rubber and other materials • manufacturing of tanneries and leather products • manufacturing of leggings, gaiters and footwear from leather, fabrics and other
materials, excluding plastics and rubber footwear Wood and Wooden Products excluding Furniture (ISIC 33) • manufacturing of sawmills, planing and other wood mills producing goods such as
lumber, wooden building material, plywood, etc. • manufacturing of wooden containers, cane products, wooden products such as
ladders, picture frames and cork products Paper and Paper Products (ISIC 34) • manufacturing of pulp, paper, paperboard, fiberboard, light packaging, heavy
packaging, stationery and other paper products Chemicals, Petroleum, Rubber and Plastics (ISIC 35) • manufacturing of basic industrial chemicals • fertilizers and pesticides • synthetic resins, plastic raw materials and man-made ibres’ • medicinal and pharmaceutical preparations such as medicines, vaccines,
antibiotics and vitamins • soap and cleaning preparations, perfumes, cosmetics and other toilet preparations • paints, varnishes and lacquers • other chemical products such as furniture and metal polishes, waxes and
dressings, glues, ink, waterproofing compounds and photochemical materials • manufacturing of petroleum refineries producing petrol, fuel oils, lubricating oils
and greases, asphalt material

79
• manufacturing of tyres and tubes, conveyor and fan belts, rubber mats, gloves and rubber pipes from natural and synthetic rubber
• manufacturing of plastic products by a process of extruding or moulding resins or plastic raw materials (incl. kitchenware, plastic sheets, furniture and footwear)
Non-metallic Mineral Products (ISIC 36) • manufacturing of pottery, china and earthenware • manufacturing of glass and glassware products • manufacturing of other products such as bricks, tiles, cement, concrete, gypsum
and plastic products Basic Metal Products (ISIC 37) • manufacturing of basic iron and steel products including all the three processes
from melting in blast furnaces to the semi-final state in rolling mills and foundries. • Manufacturing of non-ferrous basic metals such as processes from smelting,
alloying, refining, rolling, drawing, founding and casting. • Manufacturing of ingots, bars and billets, rods, tubes, pipes and alumina. Fabricated Metal Products and Machinery and Equipment (ISIC 38) • manufacturing of cutlery, hand tools and general hardware such as table, kitchen
and other cutlery, axes, chisels, files, hammers, shovels and garden tools • manufacturing of furniture and fixtures • manufacturing of structural metal products such as structural components for
bridges and buildings, etc. • manufacturing of engines and turbines • manufacturing of agricultural machinery and equipment, metal-working and
wood-working machinery and other specialized industrial machinery and equipment
• manufacturing of computers, office, calculating and accounting machinery • manufacturing of electrical machinery and equipment such and generators, electric
motors, transformers, electrical devices and switchboard apparatus • manufacturing of radios, television and other communication equipment • manufacturing of electrical appliances and houseware apparatus such as heaters
and blankets, hot plates, toasters, food mixtures, irons, fans, vacuum cleaners and floor polishers
• manufacturing of transport equipment such as motor vehicles, motor cycles, ships, aircraft as well a accessories and parts of these products
Other Manufacturing Industries (ISIC 39) • manufacturing of all other products not included in the above sectors, such as
jewelry and related articles, furniture manufacture, professional, scientific, measuring and controlling equipment, photographic and optical goods, watches and clocks, sporting equipment and toys

80
References Bank of Tanzania, Annual Report 1999, Dar es Salaam Bigsten & Danielsson, 1999: Is Tanzania an Emerging Economy, Dar es Salaam Bureau of Statistics: Various Survey Material EAC & GTZ GmbH, 2000: East African Industrial Development Strategy, Interim Report East African Development Bank: Annual Report 1999, Dar es Salaam Economic Research Bureau, Univesity of Dar es Salaam (ERB), 1999: Tanzania’s Capacity to Participate in EAC Arrangements and Effects of EAC Treaty Provisions, Dar es Salaam Tanzania Investment Center Tanzania Ministry of Industry and Trade & UNIDO, 2000: Review of Industrial and Trade Performance, Vienna Wangwe, S.M., 1994: Economic reforms, Industrialization and Technological Capabilities in Tanzania Industry, Economic and Social Research Forum World Bank, World Development Indicators 1999, Oxford University Press World Bank, World Development Indicators 2000, Oxford University Press World Economic Forum: Africa Competitiveness Report 2000, Oxford University Press