t2001 upgrade of a tail-end acetylene converter edgar ...kolmetz.com/pdf/articles/upgrade nroc...
TRANSCRIPT

T2001
Upgrade of a Tail-End Acetylene Converter BASF FINA Petrochemicals Limited Partnership Naphtha Cracker
Edgar Mohundro, Consultant, BASF FINA Petrochemicals Sam Valleru, BASF Corporation Scott Miller, BASF Corporation
Dimitri Mertens de Wilmars, Total Petrochemicals Bruno Leaustic, Total Petrochemicals
Juergen Fuchs, BASF Corporation
Prepared for Presentation at the American Institute of Chemical Engineers
18th Ethylene Producers Conference 2006 Spring National Meeting
Orlando, FL April 23-27, 2006
Ethylene Plant Operations April 25, 2006 Unpublished
AIChE shall not be responsible for statements or opinions contained in papers
or printed in its publications

Upgrade of a Tail-End Acetylene Converter BASF FINA Petrochemicals Limited Partnership Naphtha Cracker
Edgar Mohundro, Consultant, BASF FINA Petrochemicals Sam Valleru, BASF Corporation Scott Miller, BASF Corporation
Dimitri Mertens de Wilmars, Total Petrochemicals Bruno Leaustic, Total Petrochemicals
Juergen Fuchs, BASF Corporation
ABSTRACT This paper will provide an overview on improving the performance of a tail-end acetylene converter through the implementation of a succession of changes. The converter is in a naphtha cracker located at Port Arthur, Texas. This cracker is a joint venture between BASF Corporation (“BASF”) and TOTAL PETROCHEMICALS USA, INC. (“TOTAL”). The operating entity is BASF FINA Petrochemicals Limited Partnership (“BFLP”). ABB Lummus Global, Inc. (“ABB”) designed and constructed the naphtha cracker complex. During the initial startup phase and the early years of the cracker operation, the acetylene converter was a major factor in poor plant reliability and associated flaring. The flaring and production interruptions were quite costly. The focus and thrust in dealing with the poor-performing acetylene converter could be characterized as “real-time, operations-oriented”. That is, the over-riding priority was to fix the problem. Since there was no obvious root cause, a multi-pronged approach was taken. Hence, this paper is directed towards the following:
• Describing the converter system and catalyst as installed • Reviewing converter performance during the first two years of plant operation, • Discussing the “fixes”: Some of the “fixes” didn’t address the problem; some did. • Providing an overview description of the current acetylene converter system, after
implementation of all the changes. • Illustrating the good performance being achieved with the modified system.

INTRODUCTION General Plant Information The plant site is known as the “NAFTA Region Olefins Complex” (NROC). Figures 1 and 2 provide aerial views of the site. This site is in Port Arthur, Texas, at the mouth of the Neches River where it empties into Sabine Lake. Two distinct legal entities are located at the site: BASF FINA Petrochemicals Limited Partnership (BFLP) and Sabina Petrochemicals LLC (Sabina). The BFLP entity encompasses the naphtha cracker, an on-purpose propylene unit, and an aromatics recovery unit. This is a joint venture between BASF and TOTAL. Sabina is a C4-upgrade complex. This is a joint venture between Shell Chemicals, BASF, and TOTAL. Both Sabina and BFLP are operated by BASF. The site has only one Control Room. The plant site is situated adjacent to the TOTAL Port Arthur refinery. Design capacities for the cracker primary products are: 2.1 Billion lbs./yr (950 KTA) of ethylene and 1.3 Billion lbs./yr (590 KTA) of propylene. The on-purpose propylene capacity is 690 Million lbs/yr. On-purpose propylene is produced via the metathesis route using ABB’s Olefins Conversion Technology (OCT). The aromatics recovery unit is a combination of BASF’s SELOP Pygas Hydrogenation Technology and Krupp Uhde’s MORPHYLANE Extractive Distillation Technology. Butadiene is recovered via BASF’s NMP Technology. The capacity of the butadiene unit is 900 Million lbs/yr, making it the world’s largest single-train butadiene plant. Isobutylene and butene-1 are upgraded to a high-octane gasoline component via UOP’s InAlk Technology. TOTAL’s refinery manages the logistics required for furnace feeds and cracker liquid products; e.g., benzene, toluene, and C8+ material. The initial startup of the cracker got underway during November/December 2001. Simplified Plant Schematic and Design Information on the Acetylene Converter. Figure 3 is a simplified Block Diagram for the Cracker, illustrating location of the tail-end acetylene converter on the O/H of the Deethanizer. Figure 4 illustrates the ABB acetylene converter system, at start-up. The acetylene converter was designed with two-beds in series. There is inter-cooling between the beds. Each two-bed reactor is contained in one vessel. The reactor is spared; that is, a two-bed reactor is online while the spare reactor is being regenerated or in standby.

Some design parameters are as follows:
Inlet Acetylene 1.1-1.3 mole % Ethylene in Converter Feed 76%
Acetylene Specification for ethylene product 1.4 wppm (Max) Maximum Acetylene Allowed in Converter
Effluent 0.8 ppm
Bed Space velocity 5000 V/V/Hr Bed L/D 0.7 Catalyst Sud Chemie’s G-58D
CO in Feed None H2 Cracker Methanated H2 : About 95.7
mole % Backup pipeline H2 is available at 99.9 %
purity Regeneration Insitu steam/air
The acetylene converter was designed with a catalyst selection basis that did not require CO moderation. The catalyst selected was Sud Chemie’s G-58D. This selection was based on information available about industrial experience on operating G-58D in tail-end acetylene converters without CO moderation. The ethylene product has a CO specification of 100 mppb, maximum, and the C2 fractionator has a pasteurization section; so, it is possible to safely inject CO into the feed of the converter at levels below about 2 mppm. However, during the design stage, it was decided to forego the installation CO injection facilities. G-58D is a silver-promoted Pd-on-alumina catalyst. It is one of several versions of Ag/Pd acetylene converter catalysts offered by Sud Chemie. One of its primary attributes is that it does not require CO moderation for selectivity and stability maintenance. Some of the characteristics of G-58 D are given below:
Sud Chemie’s Designation G-58D Shape/Size Tablets: 4 x 4 mm
Pd Content, wt % 0.018 Ag Content, wt% 0.120 Support Material Alpha Alumina,
Surface Area, m2/gm 3-7 Bulk Density, Lbs/Ft3 72

The acetylene converter system was installed with 2 online analyzers. These analyzers monitored acetylene, H2 and ethane in the converter feed, at the mid-bed location, and in the converter effluent. The feed and mid-bed streams were monitored with a single analyzer, set up with automatic “stream switching” such that the amount of acetylene, H2, and ethane in each stream was updated every 4 minutes. The effluent analyzer provided updated component readouts every 5 minutes. The design control strategy was to maintain the moles of H2 being fed to each bed by ratio-controlling off moles of acetylene in the feed to each bed. The operators reset these ratios as needed to maintain the acetylene in the converter effluent below 0.8 ppm.. OVERVIEW ON ACETYLENE CONVERTER SITUATION DURING 2002/2003---PERFORMANCE & TROUBLESHOOTING ACTIVITIES In a nutshell, the performance of the acetylene converter during 2002 ranged from “disappointing to poor”. There were many acetylene off-spec incidents caused by the poor performance of the converter. Each off-spec incident resulted in flaring. A summary of the poor performance of the converter during 2002 is as follows. This information was extracted from a presentation given to the TCEQ in September 2002.
• Number of Switchovers between R 4101 A and B: 7 • Average run length: 41 days • Overall average selectivity: about “negative 30%” • No of acetylene off-spec incidents: 31 • Estimated economic impact: Approx. $13M
Flaring losses Losses from “expected selectivity” Impact on recycle cracking furnace
• Highly unstable operation: Flaring at each reactor switch Operators “nightmare”

A team effort was directed towards this problem. This included support from BASF, TOTAL Petrochemicals, ABB, and Sud Chemie. There were a number of factors considered as being the “root cause” or major contributors to the problem. These include:
• Feed poisons • Insufficient catalyst bed height; i.e., L/D should be 1.0 (min.) vs actual of 0.7 • Inadequate space velocity (at times, perhaps too low or too high) • Catalyst not the “right choice” for this cracker. • Inadequate control scheme and/or inadequate online analyzers • Incorrect operating conditions –partially due to inexperience of operators • Inadequate “reactor swapping procedures” • Mal-distribution of flow through the catalyst beds • Excessive green oil formation • Problems with regeneration
In the “final analysis, there was no “single smoking gun” identified and fixed. However, the performance of the acetylene converter was dramatically improved by doing tasks to eliminate some of the proposed contributors to the problem and by implementing changes in facilities, catalyst, and operations. The following steps are the ones that resulted in the improved performance of the converter:
• Replacing the G-58D catalyst with Sud Chemie’s G-58C • Installing facilities to inject CO in the converter feed (This is for “moderating G-
58C) • Installing a common “trim” reactor. This reactor is loaded with G-58C • Analyzer upgrade: In general, additional analyzers were installed and these
analyzers had shorter cycle times. • Some procedures were changed and more training was given to the operators. • The operators became “more experienced”
Improved converter performance began to be realized in late 2003 and early 2004. The remainder of this paper will cover the following:
• Historical data from the “poor performance period” (all of 2002 and a major portion of 2003)
• Comments on some of the diagnostic/troubleshooting work done in 2002/2003 • Results from some “performance improvement trials and activities” • Description of current converter system • Rundown on typical converter performance during 2004 and 2005.

Overview on Converter Performance -- Early Cycles in 1st half of 2002 The performance of the converter during the first four cycles is outlined as follows: Cycle Number Reactor A or
B - Catalyst (G-58D) SOR EOR Run length
(days) Overall average
ethylene gain (Lbs/Hr) 1st A – G-58D 11/19/01 1/22/02 38 -484 1st B – G-58D 1/23/02 2/19/03 22 -215 2nd A – G-58D 2/20/02 3/19/03 26 -322 2nd B – G-58D 3/20/02 4/29/02 37 -1240
The operation of the converter during this period can be characterized by the following comments:
• Difficult to maintain consistent/stable operation during these cycles. • Many episodes of flaring due to excessive acetylene in the converter effluent. • Reactors could not be switched without an off-spec flaring incident.
Figures 8 through 11 show the ethylene gain trend during each of these cycles. These figures provide an illustration of the performance of the reactors during this period. There was no discernible difference between the performance of the “A” reactor and the “B” reactor. Analyzer Upgrade Project Initiated By the beginning May, 2002, the Converter Improvement Team had not been able to define a “Root Cause” for the poor performance of the converter. However, a portion of the problem was attributed to the long cycle times for the two online analyzers. For illustration, the analyzer cycle times were so long that the operators could not use molar H2/acetylene control. They could only use mass ratios of H2 flows/converter-feed to control H2 injected into each bed. This meant that the H2 injection rates were based on flow meters, not on analyzer readings. Also, acetylene breakthrough from the 2nd bed was not detected before the C2 fractionator was contaminated with acetylene. This resulted in much longer flaring durations before “on-spec” ethylene was re-established. New analyzers were purchased for installation during the 2nd half of 2002. The analyzer upgrade project provided for the following analyzers:
• Two new acetylene analyzers on the outlet of the converter. The cycle time for each analyzer is 45 seconds.
• Two new analyzers at the mid bed locations: One analyzer on the outlet of the 1st Bed and one analyzer on the feed to the 2nd Bed. Each analyzer gave measurements for acetylene, H2, and ethane.
• An existing analyzer was reconfigured to monitor only the feed to the reactor. This analyzer gave faster updates for acetylene, H2, and ethane.

Implemented Improved Dryout Procedure following Steam/Air Regeneration: Free water was discovered in the piping of a freshly regenerated reactor; so the dryout procedure was revised. This included using moisture analyzers at several locations to assure that Dew Points < -60 F are achieved during the dryout. Following this, there were no more incidents of excessive moisture following completion of the dryout procedure. However, this did not contribute to a noticeable “short-term” improvement in the performance of the converter. G-58D Catalyst in 2nd Bed of “A Reactor” Replaced with G-58C/C-31-3 -- May, 2002 The catalyst in the 2nd bed of the “A” reactor was replaced with G-58C and C-31-3. The new bed configuration was as follows: Top Layer (75% of bed): G-58C Bottom Layer (25% of bed): C-31-3 This was done before returning the “A” reactor for the 3rd Cycle. A schematic of the reactor system with G-58C/C-31-1 loaded in the 2nd bed of the “A” reactor is shown in Figure 5. This change did not bring about a significant improvement in the converter performance. This can be seen from the Ethylene Gain Profile shown in Figure 12. The cycle only lasted about 7 weeks and the ethylene gain decreased below “zero” in less than a week. With the benefit of “hindsight”, it’s easy to say that this was not a “good step”. Nonetheless, here are some of the reasons, at the time, which led to the decision to install G-58C/C-31-3 in a 2nd bed.
• There was an “urgency to do something” that might improve converter performance
• The 2nd bed was where the instabilities were most visible with a direct impact on product quality.
This bed was most difficult to control. It was very unstable after only a few days online. There were problems with excessive H2 breakthrough, coincident with
acetylene breakthroughs Some “thinking” that G-58D was not the “right catalyst” for this plant
operation.

For reference, here are some properties for G-58C and C-31-3:
G-58C C-31-3 Pd Content, wt% 0.03 0.14 Ag Content, wt% 0.18 None Support Alumina Alumina Particle Size/Shape 2-4 mm spheres 3-7 mm spheres Bulk Density, Lbs/Ft3 44 44
Reasons for installing G-58C include:
• Good experience with this catalyst within TOTAL. • Input from “outside companies” on good experience with G-58C.
Concerns over installing this bed configuration:
• No CO injection for moderation of the selectivity/stability of G-58C and C-31-3 • Insufficient length of G-58C “selective layer”: L/D of about 0.55 • C-31-3 is very non-selective in this environment. Dominant reaction will be
complete consumption of H2 via hydrogenation of ethylene. Hence, H2 will not be available for “removal of trace acetylene”.
Other work done in the 2nd Half of 2002 eliminated some “proposed causes” for the poor performance of the converter. This work is outlined as follows:
• Initial work by TOTAL on excessive green oil formation by G-58D was inconclusive. Corrective changes were made to the converter system before this work was completed.
• Samples of used G-58D removed from the 2nd bed of the “A” reactor were
analyzed. The results from these analyses are given below. This work did not reveal noteworthy catalyst poisoning and/or catalyst damage. The only item “of note” is the higher level of iron found at the bottom of the 2nd bed.

Analytical Results from Used G-58D (April 2002)
Species Units 1st Bed Top Layer
1st Bed Btm Layer
2nd Bed Top Layer
2nd Bed Btm Layer
Pb wppm <3 <3 <3 <3 Ca wppm <39 45 40 40 Cl wppm <20 <20 <20 <20 Cr wppm 14 12 22 91 Fe wppm 108 103 134 392 Mg wppm <39 <40 <40 <40 Hg wppm <0.05 <0.05 <0.05 <0.05 Ni wppm 7 5.4 10 38 Pd wppm 169 180 174 185 P wppm 48 45 <40 <40 Si wppm 306 246 325 325 Ag wt.% 0.11 0.12 0.11 N/A Na wppm 72 84 68 68 S wppm <17 <17 <17 <17 V wppm 3 <3 <3 <3
• Argon tracer studies were done to determine if there were mal-distribution problems within the catalyst bed. This work showed that mal-distribution was not an issue.
Additional work done to “prove or disprove” the supposition that the poor converter performance was being caused by a “catalyst poison” being in the converter feed. A plant test was undertaken to determine if the installation of a “guard layer” on top of the 1st bed of G-58D catalyst would lead to an improved performance of the converter. Sud Chemie recommended using their Ag-on-Alumina guard adsorbent, T-2552A. The composition of this adsorbent is: 6% Ag-on-alumina. Feedback from industrial experience confirmed that this was a “good, general purpose” adsorbent of use in protecting selective hydrogenation catalysts. The “B” reactor was used for this test. See Figure 6 for the converter schematic that illustrates the 1st Bed loading with T-2552A on top of G-58D. Figures 13 and 14 show the performance of “B” Reactor before and after installation of T-2552A. The operators managed to operate the “B” reactor for about 6 months with the layer of T-2552A. However, the selectivity of the converter was still very poor. This long cycle of the “B” reactor was the 1st Cycle after commissioning of the analyzer upgrade project. Hence, the ability to detect and react more quickly to trace acetylene leakage was a likely reason for this long cycle.

In addition to this “guard layer trial”, slipstream test facilities were installed for testing a number of other adsorbent traps. This work did not get underway before implementing catalyst and facilities changes that brought about the dramatic improvement in the performance of the converter. IN LATTER PART OF 2002, CONVERTER IMPROVEMENT TEAM BEGAN TO FOCUS ON IMPLEMENTING A “THREE- PRONGED SOLUTION” This three-pronged approach was as follows:
• Replace G-58D with G-58C • Install facilities to inject CO into the converter feed to “moderate G-58C” • Install a 3rd reactor downstream of the current converter system.
G-58C would also be used in this reactor. It would be used primarily as a “polishing reactor”. Initially, it would convert small leakages of acetylene from the 2nd beds and it
would provide “insurance” such that the operators could tune the 1st and 2nd beds to operate more selectively. This would also provide the additional catalyst volume required as the
“acetylene load” increases through higher severity naphtha cracking. The first cycle with two beds of G-58C was with the “A” reactor. This got underway in May 2003. Figure 6 is a schematic illustrating the loading of G-58C in the “A” reactor. For this run, the layer of C-31-3 was still in the 2nd Bed. Furthermore, the CO injection facilities were not yet commissioned. Nonetheless, the cycle length was more than 3 months, and there was a positive ethylene gain for about 7 weeks. Figure 15 shows the performance trend for this cycle. The ethylene gain during the 1st three weeks averaged about 1000 Lbs/Hr. (Note: For simplification, the formation of C4+ has been ignored. On average, the amount of acetylene downgraded to C4+ material is about 10%.) This cycle was the “first solid indication” that the proposed “ultimate converter system” was going to bring about a big improvement in the performance of the acetylene converter. In the 4th quarter of 2003, the C-31-3 layer in the 2nd Bed of the “A” reactor was replaced with G-58C. In the 1st quarter of 2004, the G-58D in the “B” reactor was replaced with G-58C and the CO injection facilities were commissioned. Figure 7 is a schematic of the 3-Bed System. Figures 16 and 17 illustrate the performance of the acetylene converter during 2005 following commission of the CO injection facilities and the 3rd Bed. Figure 16 illustrates
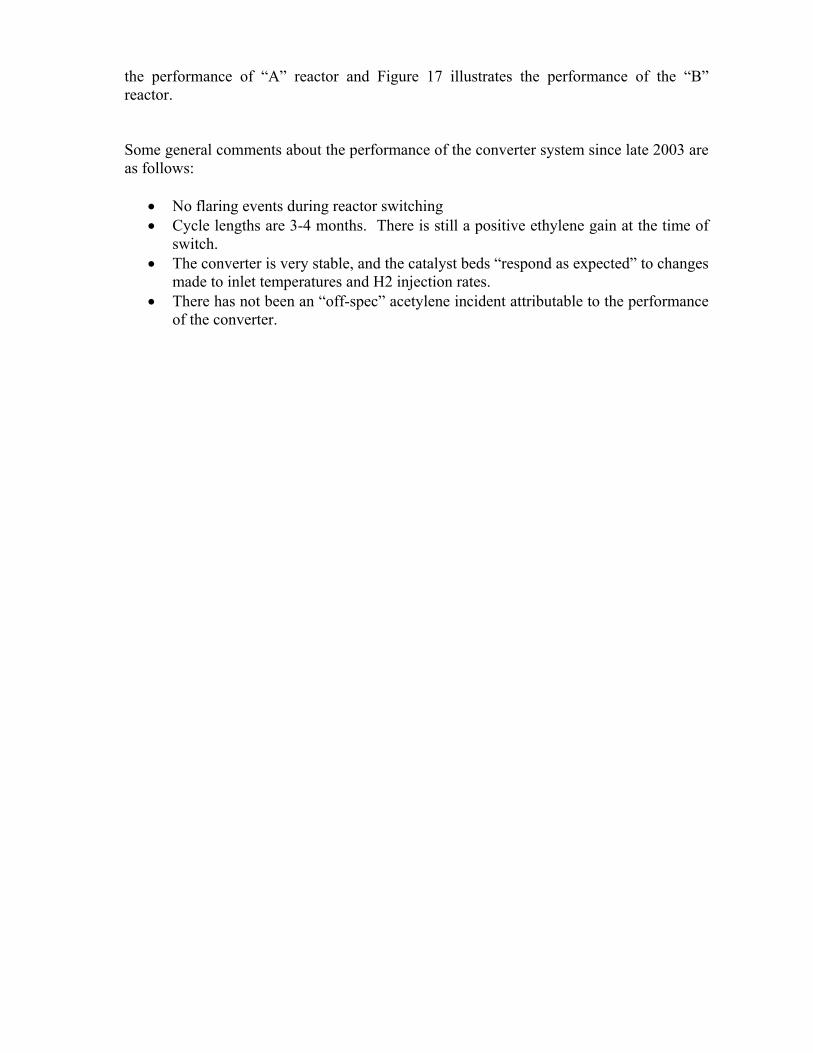
the performance of “A” reactor and Figure 17 illustrates the performance of the “B” reactor. Some general comments about the performance of the converter system since late 2003 are as follows:
• No flaring events during reactor switching • Cycle lengths are 3-4 months. There is still a positive ethylene gain at the time of
switch. • The converter is very stable, and the catalyst beds “respond as expected” to changes
made to inlet temperatures and H2 injection rates. • There has not been an “off-spec” acetylene incident attributable to the performance
of the converter.

Figure 1 BASF FINA Petrochemicals Port Arthur
Site –Adjacent to Total’s Refinery

Figure 2 BASF FINA Petrochemicals LP(Naphtha Cracker) and Sabina Petrochemcials LLC
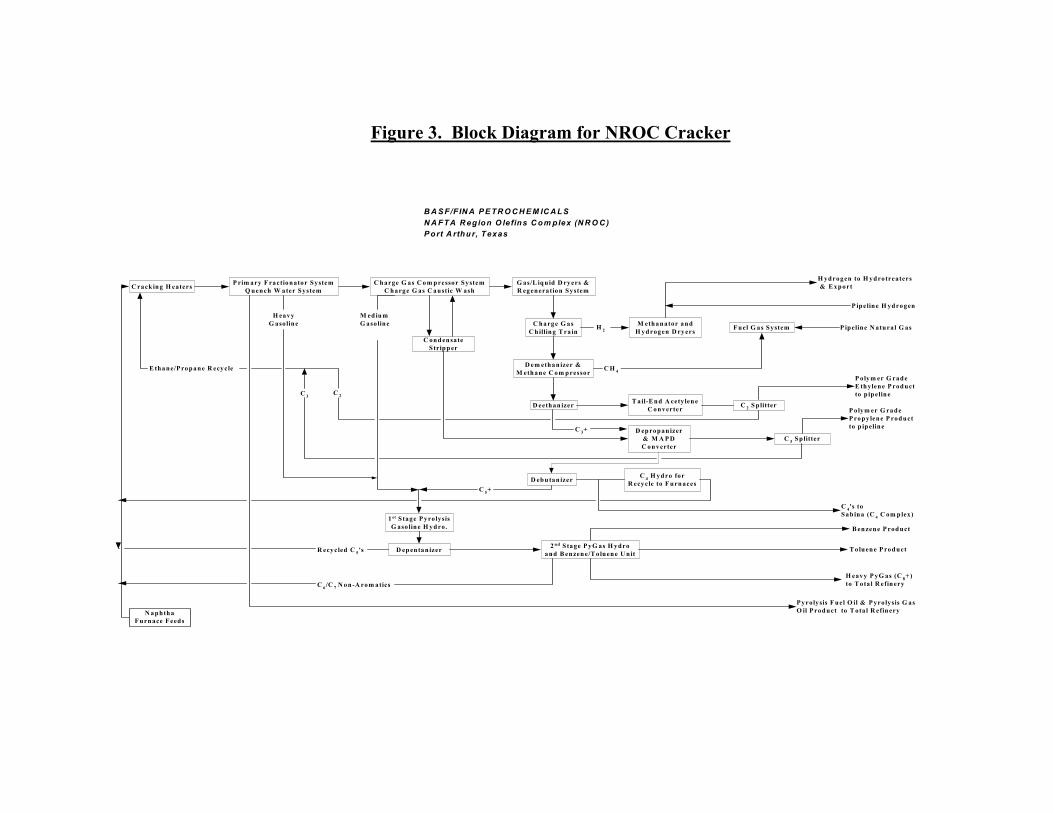
Figure 3. Block Diagram for NROC Cracker
B A S F/F IN A P E TR O C H E M IC A L SN A FT A R egion O le fins C om plex (N R O C )P ort A rthur, T exas
C racking H eaters P rim ary F ractionator SystemQ uench W ater System
C harge G as C om pressor SystemC harge G as C austic W ash
G as/L iquid D ryers &R egeneration System
C harge G asC hilling T rain
D em ethanizer &M ethane C om pressor
D eethan izer
D ebu tanizer
C ond ensateStripp er
H eavyG asoline
M ediumG asoline
C 3
R ecycled C 5's
C 6/C 7 N on-A rom atics
1st S tage P yrolysisG aso line H ydro.
D ep entan izer 2 n d S tage P yG as H ydroand B enzene/T oluene U nit
B enzene P roduct
H eavy P yG as (C 8+ )to T ota l R efinery
M ethanator andH ydrogen D ryers
T ail-E nd A cety leneC onverter
D ep ropanizer& M A P DC onverter
C 4 H ydro forR ecycle to F urnaces
F uel G as System
C 2 S plitter
C 3 Sp litter
P yrolysis F uel O il & P yrolysis G asO il P roduct to T ota l R efinery
H ydrogen to H ydrotreaters & E xport
P ipeline H ydrogen
P ipeline N atural G as
P olym er G radeE thylene P roductto p ipeline
P olym er G radeP ropylene P roductto p ipeline
C 4's toSabina (C 4 C om p lex)
E thane/P ropane R ecycle C H 4
H 2
C 3+
C 5+
T oluene P roduct
N aphthaF urnace F eeds
C 2

Figure 4 NROC Tail-End Acetylene Converter at
Start-up in December 2001
DEETHANIZEROVERHEAD
H2
CONVERTEREFFLUENT
H2
G-58D
CW
CW
Reactor AReactor B
G-58DG-58D
G-58D
A1H2C2H2C2H6
A2H2C2H2C2H6
A1H2C2H2C2H6

Figure 5 NROC Tail-End Acetylene Converter
Illustrating Trial Operation with G-58C/C-31-3 in 2nd Bed of Reactor “A’
DEETHANIZER
OVERHEAD
H2
CONVERTEREFFLUENT
H2
G-58C
CW
CW
C31-3
Reactor A Reactor B
G-58D
G-58D
G-58D

Figure 6 NROC Tail-End Acetylene Converter
Illustrating Trial Operation with T-2552 Guard Layer in 1st Bed of Reactor “B”
DEETHANIZEROVERHEAD
H2
CONVERTEREFFLUENT
H2
G-58C G-58D
CW
CW
C31-3
Reactor A Reactor B
G-58D
G-58D T-2552A

Figure 6A NROC Tail-End Acetylene Converter
Illustrating 1st Cycle with G-58C Catalyst in 1st and 2nd Beds Reactor “A”
DEETHANIZER
OVERHEAD
H2
CONVERTEREFFLUENT
H2
G-58C G-58D
CW
CW
C31-3
Reactor A Reactor B
G-58D
G-58C T-2552A

Figure 7
Current Configuration of NROC Tail-End Acetylene Converter
DEETHANIZEROVERHEAD
H2
LP STEAMOR CW
A C2H2C2H6
H2
A
CWH2
A C2H2C2H6
H2
H2
AC2H2
AH2
CONVERTEREFFLUENT
CW AC2H2C2H6
H2
R-4101C
R-4101A R-4101BA C2H2
C2H6
H2
(H2 + CO)(Methanator Bypass)
G-58C G-58C
G-58CG-58C
G-58C
C2H2C2H6
H2
CO

Figure 8 - Reactor A Cycle 1 Ethylene Gain
-4000
-3000
-2000
-1000
0
1000
2000
3000
4000
11/15/01 11/25/01 12/05/01 12/15/01 12/25/01 01/04/02 01/14/02 01/24/02 02/03/02
Date
Ethy
lene
Gai
n, L
bs/H
r
Actual Ethylene Gain Max Potential Gain
Plant Down
Max Potential Ethylene Gain
Actual Ethylene Gain

Figure 9 - Reactor B Cycle 1 Ethylene Gain
-2000
-1000
0
1000
2000
3000
4000
01/19/02 01/24/02 01/29/02 02/03/02 02/08/02 02/13/02 02/18/02 02/23/02
Date
Ethy
lene
, Lbs
/Hr
Actual Ethylene Gain Max Potential Ethylene Gain
Max Potential Ethylene Gain
Actual Ethylene GainPlant Down

Figure 10 - Reactor A Cycle 2 Ethylene Gain
-1500
-1000
-500
0
500
1000
1500
2000
2500
3000
3500
02/18/02 02/23/02 02/28/02 03/05/02 03/10/02 03/15/02 03/20/02
Date
Ethy
elen
e G
ain,
Lbs
/Hr
Actual Ethylene Gain Max Potential Ethylene Gain
Max Potential Ethylene Gain
Actual Ethylene Gain

Figure 11 - Reactor B Cycle 2 Ethylene Gain
-6000
-5000
-4000
-3000
-2000
-1000
0
1000
2000
3000
4000
5000
03/15/02 03/25/02 04/04/02 04/14/02 04/24/02 05/04/02 05/14/02 05/24/02 06/03/02
Date
Ethy
lene
Gai
n, L
bs/H
r
Actual Ethylene Gain Max potential Ethylene Gain
Max Potential Ethylene Gain
Actual Ethylene Gain
Acetylene Breakthrough
Plant Unstable or Down

Figure 12 - Reactor A Cycle 3 Ethylene Gain2nd Bed Loaded with G-58C(Top 75%) and C-31-3(Btm 25%)
-6000
-5000
-4000
-3000
-2000
-1000
0
1000
2000
3000
4000
5000
04/24/02 05/04/02 05/14/02 05/24/02 06/03/02 06/13/02 06/23/02 07/03/02
Date
Ethy
lene
Gai
n, L
bs/H
r
Actual Ethylene Gain Max Potential Ethylene Gain
Max Potential Ethylene Gain
PlantDown
Actual Ethylene gain
PlantDown

Figure 13 - Reactor B Cycle 3 Ethylene Gain
-6000
-5000
-4000
-3000
-2000
-1000
0
1000
2000
3000
4000
5000
06/23/02 07/03/02 07/13/02 07/23/02 08/02/02 08/12/02 08/22/02 09/01/02 09/11/02
Date
Ethy
lene
gai
n, L
bs/H
r
Actual Ethylene Gain Max Potential Ethylene Gain
Max Potential Ethylene Gain
Actual Ethylene Gain
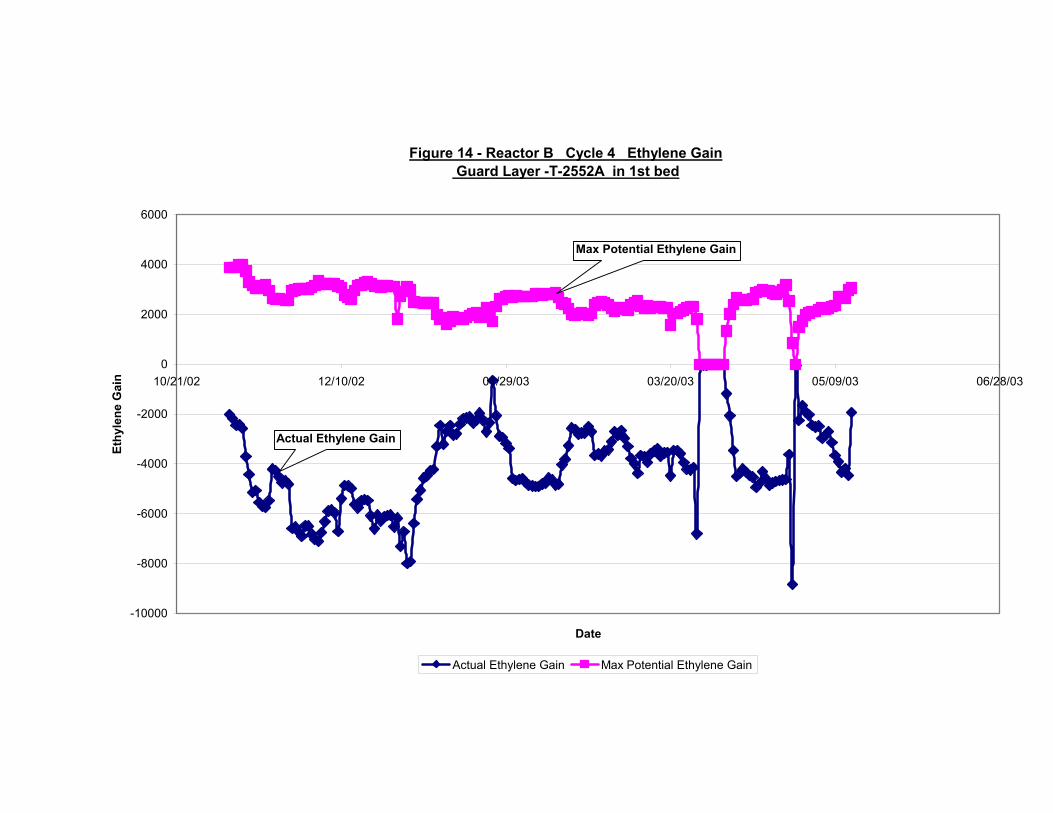
Figure 14 - Reactor B Cycle 4 Ethylene Gain Guard Layer -T-2552A in 1st bed
-10000
-8000
-6000
-4000
-2000
0
2000
4000
6000
10/21/02 12/10/02 01/29/03 03/20/03 05/09/03 06/28/03
Date
Ethy
lene
Gai
n
Actual Ethylene Gain Max Potential Ethylene Gain
Max Potential Ethylene Gain
Actual Ethylene Gain

Figure 15 - Reactor A 1st cycle with G-58C in 1st bed and Mix of G-58C/C-31-2 in 2nd BedWithout CO Moderation
-3000
-2000
-1000
0
1000
2000
3000
4000
04/29/03 05/19/03 06/08/03 06/28/03 07/18/03 08/07/03 08/27/03 09/16/03
Date
Ethy
lene
Gai
n, L
bs/H
r
Actual Ethylene Gain Max Potential Ethylene Gain
Max Potential Ethylene Gain
Actual Ethylene Gain

Figure 16 - Reactor A - 1st Cycle with G-58C in Beds 1 & 2 With CO Injection and 3rd Bed in Service
-1000
-500
0
500
1000
1500
2000
2500
3000
3500
04/23/04 05/13/04 06/02/04 06/22/04 07/12/04 08/01/04 08/21/04 09/10/04 09/30/04 10/20/04
Date
Ethy
lene
Gai
n, L
bs/H
r
Max Potential Ethylene Gain Actual Ethylene Gain
Plant UpsetPlant Upset
Max Potential Ethylene Gain
Actual Ethylene Gain

Figure 17 - Reactor B 2nd Cycle with G-58C in Beds 1 & 2With CO Injection and 3rd Bed In Service
-2000
-1000
0
1000
2000
3000
4000
09/10/04 09/30/04 10/20/04 11/09/04 11/29/04 12/19/04 01/08/05 01/28/05 02/17/05
Date
Ethy
lene
Gai
n, L
bs/H
r
Max Potential Ethylene Gain Actual Ethylene Gain
Plant Upset
Plant Upset
Max Potential Ethylene Gain
Actual Ethylene Gain