ta beginners
TRANSCRIPT

Dear Friends, Welcome. Its no wonder how a successful trader, is successful always and everytime. Because his fundamental knowledge is STRONG and he keeps learning and refreshing them day in and day out. In order to begin our successful trading, we need to strengthen our fundamentals first. Fundamentals include study of trends, chart patterns, various technical indicators and finally a good trading strategy. I will try to post these fundas one by one so that everyone especially beginners keep visiting the thread to refresh their fundas. As the thread becomes voluminous, I will try to edit this post to include various topics covered in this thread so that we can have ready reckenor instead of going through allaround. ADX MACD (Just scroll down it is discussed in this same page) Moving Average crossover (Just scroll down it is discussed in this same page) Pivot Points (It is discussed in this same post, just scroll down) Relative Strength Index (RSI) (just scroll down it is discussed in this same page) Some tricks of fibonacci can be learnt here http://www.hardrightedge.com/wheel/hrefibtricks.htm Is it make a sense? Fibonacci trading strategy on a daily basis. Look at two key retracement lines: the 61.8% and 50% fib retracements. Call this zone the "hot zone". Pay close attention when prices retrace or pullback to this zone. Uptrend strategy: In an uptrend, Let prices to retrace below the 50% fibonacci retracement but close above the 61.8% retracement. If the hot zone acts as a key support zone, enter a long position with a 3-5 tick stop below the 61.8% retracement line. Exit most of position at the previous swing high. Downtrend strategy: In a downtrend, let price to retrace back to the 50% fibonacci retracement line but not close below the 61.8% retracement. Look for the hot zone to act
as a key resistance level. Enter a short position using a 3-5 tick stop above the 61.8% retracement. Exit most of position at the previous swing low. Just remember this: 61.8% for an uptrend & 50% for a downtrend. These are the two main levels. Pivot Point Trading You are going to love this lesson. Using pivot points as a trading strategy has been around for a long time and was originally used by floor traders. This was a nice simple way for floor traders to have some idea of where the market was heading during the course of the day with only a few simple calculations. For beginners I would suggest this link before going further what I am going to say http://www.traderji.com/day-trading/...ofit-more.html (Thanks to Radha55) The pivot point is the level at which the market direction changes for the day. Using some simple arithmetic and the previous days high, low and close, a series of points are derived. These points can be critical support and resistance levels. The pivot level and levels calculated from that are collectively known as pivot levels. Every day the market you are following has an open, high, low and a close for the day (some markets like forex are 24 hours but generally use 5pm EST as the open and close). This information basically contains all the data you need to calculate the pivot levels. The reason pivot point trading is so popular is that pivot points are predictive as opposed to lagging. You use the information of the previous day to calculate potential turning points for the day you are about to trade (present day). Because so many traders follow pivot points you will often find that the market reacts at these levels. This give you an opportunity to trade. For Pivot calculator if you like then visit the following site(I personally use it on regular basis) :-
http://www.calloptionputoption.com/opivotpointcalc.html Just by having the previous days high, low and close you eventually finish up with 7 points, 3 resistance levels, 3 support levels and the actual pivot point. If the market opens above the pivot point then the bias for the day is for long trades as long as price remains above the pivot point. If the market opens below the pivot point then the bias for the day is for short trades as long as the market remains below the pivot point. The three most important pivot points are R1, S1 and the actual pivot point. The general idea behind trading pivot points is to look for a reversal or break of R1 or S1. By the time the market reaches R2,R3 or S2,S3 the market will already be overbought or oversold and these levels should be used for exits rather than entries. A perfect set up would be for the market to open above the pivot level and then stall slightly at R1 then go on to R2. You would enter on a break of R1 with a target of R2 and if the market was really strong close half at R2 and target R3 with the remainder of your position. This all looks pretty straight forward. Unfortunately life is not that simple and we have to deal with each trading day the best way we can. There are loads of ways to trade using pivot points but I shall walk you through a few of them and discuss why some are good in certain situations and why some are bad. The Breakout Trade At the beginning of the day we were below the pivot point, so our bias is for short trades. A channel formed so you would be looking for a break out of the channel, preferably to the downside. In this type of trade you would have your sell entry order just below the lower channel line with a stop order just above the upper channel line and a target of S1. The problem on this day was that, S1 was very close to the breakout level and there was just not enough meat in the trade. This cab be a good entry technique for you. Just because it was not suitable this day, does not mean it will not be suitable the next day. The Pullback Trade

This is one of my favorite set ups. The market passes through S1 and then pulls back. An entry order is placed below support, which in this case was the most recent low before the pullback. A stop is then placed above the pullback (the most recent high - peak) and a target set for S2. The problem again, on this day was that the target of S2 was to close, and the market never took out the previous support, which tells us that the market sentiment is beginning to change. Advanced As I mentioned earlier, there are lots of ways to trade with pivot points. A more advanced method is to use the cross of two moving averages (post on moving averages will follow shortly)as a confirmation of a breakout. You can even use combinations of indicators to help you make a decision. It might be the cross of two averages and also MACD must be in buy mode. When the market passed through S1 and then retraced to the S1 line again. It then formed a channel. At around this time we had a cross of the averages, MACD signaled buy and there was a breakout of the channel line. This gave a great signal to go long with a target of the original pivot line. Mess around with a few of your favorite indicators to help determine an entry around a pivot level but remember the signal is a break of a level and the indicators are just confirmation. We haven't even got into patterns around pivot levels or failures but that is not the point of this lesson. I just want to introduce another possible way for you to trade. Good Trading Yours veluri1967 After Pivot Point Trading, let me take this privilege to introduce you the most popular and powerful indicator MACD Let us get in.
Moving Average Convergence-Divergence (MACD)
History (MACD) was originally constructed by Gerald Appel an analyst in New York. Originally designed for analysis of stock trends, it is now widely used in many markets. MACD is constructed by making an average of the difference between two moving averages. The difference of the original two moving averages and the moving average of the difference can be plotted as two lines, one fast and one slow. Uses Most modern charting software now includes MACD as standard. Once selected to display in your charting software it normally shows up as two lines plotted on an open scale against the zero line. These two lines will normally be of different color or one line a solid line and the other a dotted line. Frequently used settings are 12 and 26 period exponential moving averages with 9 period exponential moving average as the signal line. Although there are three moving averages mentioned you will only see two lines. The simplest method of use is when the two lines cross. If the faster signal line crosses above the slower line then a buy signal is generated and vice versa. It is also used as an overbought and oversold indicator. The higher above the zero both lines are the more overbought it becomes and the lower below the zero line both lines are the more oversold it becomes. It may also lead to a stronger signal if the signal line crosses down when it is overbought and crosses up when it is oversold. The last common use of MACD is that of divergence. If the MACD is making new lows and the price of the security is not making new lows that is one form of divergence (bullish divergence). Also, if the MACD has made a high and starts to head down but price continues up that is another type of divergence (bearish divergence) and may lead to an indication of a change in direction. My Own Use Of MACD I like to use the MACD as a trend indicator with parameters set at 8 and 18 period exponential moving averages with a 9 period exponential moving average as the signal line. All I am trying to do is establish a trend in a higher time period than the one I intend to trade. If you were trading day charts you would be looking at the MACD on the weekly. If you were trading an hourly chart you might look at the MACD on the daily. As long as the signal line remains above or below the MACD line on the next higher time frame you know the trend is still in place.
PS :- Use MACD alongwith Bollinger Bands, RSI for better results. Thanks
veluri1967 Here is the guide on RSI (Relative Strength Index) Tradingwith the RSI Very basically, when trading the stock markets "buy" signals on the RSI are considered to be readings of 30 or less (the security is considered oversold) and "sell" signals are considered to be RSI values of 70 or greater (the security is considered overbought). Depending on the technician and price volatility, there are various other qualifiers and nuances that can be incorporated into a signal. First Some History Relative Strength Index was developed by J.Welles Wilder Jr. and first introduced in his book 'New Concepts In Technical Trading Systems'. It is one of the most popular technical tools around and is plotted on a vertical scale of 0 to 100. The 70% and 30% levels are used as warning signals. A relative strength index above 70% is considered overbought and below 30% is considered oversold. An RSI above 70% is considered overbought and below 30% is considered oversold. An overbought or oversold condition merely indicates that there is a high probability of a counter reaction. It is an indication that there may be an opportunity to buy or sell, but does not provide the final signal. RSI signals should always be used in conjunction with trend-reversal signals offered by the price itself. Calculation Relative Strength Index (RSI) measures the strength of all upward movement against the strength of all downward movement in a specified time frame. The most common parameter for RSI is period 14, although users can pick their favorite period of time if they wish. It is one of the most popular oscillators that works well in range-bound market. Signals Tops and Bottoms

These are indicated when the readings go above 70 (top) and below 30 (bottom). RSI can form formations similar to Chart Formations. The RSI may form chart formations that may or may not appear on the actual bar chart e.g. you might see a head and shoulders formation on the RSI but not on the bar chart. Failure Swings When the RSI goes above 70 or below 30 this is a strong indication that the market is ready for a reversal. Support and Resistance It is sometimes more apparent that support or resistance is forming in the RSI than can be seen on the bar chart. My Use Of RSI My favorite use of RSI is that of divergence as suggested by Wilder himself.. When the security you are trading makes a new high and the RSI turns down that is bearish divergence. The same is true of bullish divergence. When price makes a new low (red line) and the RSI turns up (blue line) that is bullish divergence. We also prefer to see divergence at major tops and bottoms. That is to say, if we have been in a down trend for some time and price has gone past a reading of 20 on the RSI AND we see divergence then we are a lot more confident that price has in fact bottomed. We don't like to use RSI as a sole trigger for a new position but rather like to use it in combination with other indicators to help build a picture. In most cases of divergence the security makes a low as does the RSI, then the RSI begins to turn up but the security continues down. We wait for the security to make a new low and the RSI to come down but not as low as the previous low and that is the point where action can be taken. The fact that the RSI has not dropped lower than its previous low and the price has, is the point of recognition. If we also have a break of a trendline or it has reach a projection or some other confirming analysis then we would enter a trade. For the purposes of this illustration we will use a break of a trendline to confirm that trend direction has indeed changed.
Advanced A more advanced method is to use Bollinger Bands for your target and exit strategy after your entry. Set RSI set at 14, and Bollinger Bands at 20. Trading Rules (Going long): Identify divergence between the security and RSI. Confirm oversold conditions with a reading below 20 on the RSI. Draw a trendline and enter when price breaks the trendline. Exit when price retraces back to the middle Bollinger Band line. Your stop loss will be whenever price hits the lower Bollinger Band line after your entry. Conclusion The RSI is a momentum indicator, or oscillator, that measures the relative internal strength of a market (not against another market or index). As with all oscillators, RSI can provide early warning signals but should be used in conjunction with other indicators. Divergences are the most important signal provided by RSI. Happy & profitable trading Thanks for being with me Before understanding Bollinger Bands, a knowledge about moving averages is of paramount importance. Definition, explanation and basics of moving averages is deliberately ommitted as the same can be learned by browsing any technical indicators site. Think differently and BE A WINNER. Make exploration of basics by practising and observing. So, friends, here is the next post.
A Different Type of Moving Average Cross
Virtually every trader has dabbled with or experimented with some sort of moving average. What I want

to introduce you to in this lesson is a different sort of moving average cross method, which I have found to be very good at identifying short term trend changes. As we know a moving average is normally plotted using the close of a bar e.g. if you were plotting a 3 period moving average, then you would add the last three closes and divide the total by three to get a simple moving average. This is where I want you to think a little differently. I have always been an advocate of taking traditional thinking and changing it around. What if you used the open instead of the close? What if you used the close of one period of a moving average and the open of another? First, most charting packages will allow you to use the open, high, low or close to plot a moving average. I use a 5 period exponential moving average of the close and a 6 period exponential moving average of the open on daily, hourly charts. My experience shows that it catches the short term trend changes really nicely. Of course you will go through periods of consolidation with any market and any moving average method you use will be whipsawed. To get around this you need some sort of filter or approach that helps you keep out of the low probability trades. You could use ADX, Stochastic or MACD to help filter the noise but I also like to add a time frame. To help identify better entry points you can drop down a few time frames to the 30 minute chart. There are lots of ways to trade this but a neat little trick is to wait for the signal on a higher time frame and then drop down a few time frames and wait for a pullback. The first signal after the pullback on the lower time frame is normally a pretty good entry point e.g. If there were a cross up on the large time frame then drop down to a lower time frame and wait for the market to retrace and then give another buy signal (cross up). The opposite is true for short signals. Once you get the signal on the shorter time frame depending on where support is you can usually place your first stop loss under the nearest support area (valley). If the market begins to make progress you can move your stop so that it trails the market by moving your stop to just under the most recent support area. Here I used only an exponential moving average but as said earlier experiment with different types of average such as weighted, smoothed or simple. You can also experiment with different lengths of moving average. Happy Experimenting & Learning
Thanks for sparing your valuable time to be with me.
veluri1967 Oooooops.... Though I do not personally like this indicator, but for the knowledge sake I find it more informative. So here is
Stochastic History George Lane was the originator of the stochastic indicator in the 1970's. Lane observed that as prices increase in an up trend, closing prices tend to be closer to the upper end of bars and in a down trend closing prices tend to be nearer the lower end of bars. Lane developed stochastics to discern the relationship between the closing price and the high and low of a bar. Typically used to identify overbought and oversold conditions the indicator consists of two lines: % K and %D. These two lines fluctuate in a vertical range between 0 and 100. Readings above 80 are considered overbought and readings below 20 are considered oversold. Stochastics can also be used to generate buy and sell signals. When the faster %K line crosses above the slower %D line and the lines are below 20, a buy signal is generated. When the %K lines crosses below the %D line and the lines are above 80 a sell signal is generated. My Own use Of Stochastics Well, as usual just to be contrary to everyone else, I don't use the stochastic indicator to signal overbought or oversold although I do take note of the readings. I like to use it as possible buy and sell opportunities after defining a trend. If the trend is up I like to only take buy signals regardless of the reading as long as the trend remains in place. I ignore the sell signals. I purposefully weaken the stochastics to give me more signals and I use 8,3,3 as my settings. This gives more signals and shows the hand of the weaker players. The same is true of selling in a down trend. I ignore the buy signals and only take the sell signals. I don't use the stochastic indicator by itself as trading method as all the settings I have tried ultimately resulted in to many whipsaws.
Home work for the learners Experiment with different settings and consider adding this indicator to your trading arsenal. Wish u a great finder
veluri1967 Sorry for the delay
Keltner Channels Keltner channels all fall into the general category of envelopes, which consist of three lines – a middle line and two outer lines. Envelope theory holds that price has the greatest probability of falling within the boundaries of the envelope. Stock market price falling outside the envelope boundaries is considered an anomaly and therefore provides a trading opportunity. History Keltner Channels were developed by Chester W. Keltner. They were first introduced in the book "How To Make Money in Commodities", by Chester W. Keltner and are explained in the book "The New Commodity Trading System and Methods" by Perry Kaufman. The Keltner Channel is based on the Average True Range and is sensitive to volatility. It may be used in place of standard deviation (Bollinger) bands or percentage envelopes. Originally, Keltner had his system buy when the close exceed the upper channel and sell when the close was below the lower channel. Basically, penetration exceeding the channels showed a strong bullish or bearish momentum and presumably the momentum would continue. However, there is no reason why not to use Keltner Channels the same way as other price envelopes such as Bollinger Bands. When using Bollinger Bands ninety five percent of price movement occurs within the bands. The upper and lower bands are considered as extremes of the price movement and are a warning that price exhaustion may be occurring. Buy signals occur when the price is below the lower band and sell signal occur when price exceeds the upper band. Calculation of Keltner Channels Construction of Keltner Channels is simple so it is omitted here.
Why the 9 simple moving average you may ask? Because that moving average have been working for us and many others. Rest assured there is nothing supernatural about the number, other combinations of numbers might work just as well, the trick is in learning how to use Keltner Channels at one setting and to stick with it until it eventually proves to work or not to. Keltner Channels work great in any time frame, the more trending the market, the better chance for success using the Keltner Channel. Trading Set On a daily chart with the Keltner Channel set at 9. We are looking for price breakouts outside the channel with the candle not only outside or touching the line but having also closed outside the upper line of the Keltner Channel. We will add a filter to identify our trades as usual and in this case we like to use the Commodity Channel Index (CCI) set at 14. Trading rules (Going Long) Have your chart set up with the CCI indicator at 14 and Keltner Channel setting at 9. Enter long whenever price closes outside the upper line of the Keltner Channel TOGETHER with the CCI crossing into overbought. Your stop loss/exit will be the first candle closing below the lower Keltner Channel line. For a target you could employ a 30 pip trailing stop or use Fibonacci expansions. Fibonacci lesson some other time. Worth Remembering As with all trend following systems, the Keltner Channel works well in up trends or down trends, but doesn't work well in a sideways channel. As a trend following system it is not meant to catch tops or bottoms and should be used in combination with other indicators, such as RSI or MACD, to provide confirmation of the strength of a market. For example charts and study, click the link below :- http://www.traderji.com/technical-an...tml#post363154 Happy learning
veluri1967
How to profit in intraday quickly about Rs.5 to Rs.10 buck. This is the mute question many of my new friends have asked me to answer. I have been searching for a answer trying different settings, strategies and indicators. At last, I have concluded that its possible only when you foresee a change in trend. There are various methods to forecast a change in trend example by divergence in indicators with that of price. We all know that Volume is the key factor to determine the price patterns. Hence here is my next post on Chaikin Oscillator based on volume:- Chaikin Oscillator The Chaikin Oscillator or Volume Accumulation Oscillator consists of the difference between two exponential moving averages (usually 3 and 10-day) of the Accumulation Distribution Line indicator and is used to confirm price movement or divergences in price movement. The Chaikin Oscillator is more accurate than the On Balance Volume indicator. Chaikin Oscillator: factors in the closing price in relation to the highs, lows, and average price and determines the appropriate ratio of volume to be attributed to the day. The main purpose of the Chaikin Oscillator is to confirm price trends and warn of impending price reversals. The chart below illustrates this phenomena"- High #1 to High #2 Scrip made higher highs, usually a bullish sign. However, the Chaikin Oscillator failed to mirror the scrips advance higher and ended up making a lower low. This bearish divergence forewarned of the impending price reversal. High #2 to High #3 It made a significantly lower high. The Chaikin Oscillator confirmed the scrips downtrend by making a lower high as well. Low #1 to Low #2 it made significant lower lows, yet the Chaikin Oscillator made higher lows. This bullish divergence signaled that the previous downtrend may have ended. The Chaikin Oscillator is a helpful volume based technical indicator that helps confirm the current price action or foreshadow future price reversals. Other technical indicators similar to the Chaikin Oscillator is the On Balance Volume indicator and the Money Flow Index. I will post the charts for better understanding of the concept, if you are interested in the concept. Veluri1967
hi new friends, Some of you are pressing me hard to post some charts explaining the concepts of Pivot Points, RSI, MACD, Moving Average Crossover. I have here the charts of Cipla of intraday depicting all the four ie pivot points, RSI, MACD and Moving Average Crossover. Hope u all are ready with basic theoritical knowledge otherwise refresh by going back to the basics in this same thread. The Charts are 1 minute and 3 minutes. We need to take decisions by comparing both charts. As you can see, the price opened below Pivot Point hence its time to short. Wait...for the action of price. Can you notice that...the price climbed up to Pivot point to test penetration and failed and closed below pivot point. Hence, the first trading signal is given. SHORT. Now the price started rolling down to Support1. We can notice that the price took support at Support1 and bounced back. (See 1 minute Chart). Wait... donot we need to verify with other indicators to confirm the reversal. RSI is making a new low at Circle 1 giving a signal for BUY. Bollinger Bands are also giving a BUy signal. Whereas the MACD is not confirming it except that it is looking up. Can we risk just taking cue from RSI, Support 1 reversal, Bollinger Bands. Yes...for hardcore traders. But for beginners, I suggest that just ignore this signal, since RSI and MACD are not favouring. Wait....again at Circle 3 on MACD line, a bearish crossover is confirming our stand on SELL. Now... the time is to test Resistance 1. We can see.... there is no resistance forming at Support 1 (both in 3min and 1 min charts). Hence the downtrend continues sticking with our SELL. Now the price approached Resistance 2 (which itself indicates OVERSOLD condition). Expect strong Support at Support 2 from slipping further. Yes. It did find strong support at Resistance 2. Square off your position. Now... Wait for price reversal. Refer 3min chart. Can you see a bottoming out in RSI at Circle 1. Surely a buying opportunity. It is confirmed by Moving Average Crossover at Circle 3. But what about MACD. Refer 1 min chart. Isnot MACD giving a BUY signal at Circle4. Go.....Go.....Go.....BUY. Yes....MACD is also now confirming BUY in 3min chart at Circle 2. Here on....there is no looking back....the price penetrated Support1 with ease heading towards Pivot Point. That's all folks. Enjoyed it. veluri1967.

Must know abt tech indicators
Multicollinearity is a problem that is common in technical analysis. That is, when one unknowingly uses the same type of information more than once. Analysts need to be careful and not utilize technical indicators that reveal the same type of information. "A cardinal rule for the successful use of technical analysis requires avoiding multicollinearity amid indicators. Multicollinearity is simply the multiple counting of the same information. The use of four different indicators all derived from the same series of closing prices to confirm each other is a perfect example." The issue of multicollinearity is a serious issue in technical analysis when your money is at stake. It is a problem because collinear variables contribute redundant information and can cause other variables to appear to be less important than they really are. One of the real problems is that sometimes multicollinearity is difficult to spot. Technical indicators should be arranged in categories to keep from using too many from the same category. Hereunder different indicators are categorized for your information. MOMENTUM INDICATORS :- Rate of Change (ROC) Stochastics (%K, %D) Relative Strength Index (RSI) Commodity Channel Index (CCI) Williams %R (Wm%R) StochRSI TRIX Ultimate Oscillator (ULT) Aroon TREND INDICATORS :- Moving Averages Moving Average Convergence Divergence (MACD) Average True Range (ATR) Wilder's DMI (ADX) Price Oscillator (PPO) VOLUME INDICATORS:- Accumulation Distribution Chaikin Money Flow (CMF) Volume Rate of Change
Volume Oscillator (PVO) Demand Index On Balance Volume (OBV) Money Flow Index The best way to quickly determine if an indicator is collinear with another one is to chart it. Make sure you have enough data on the chart to get a good indication. If they basically rise and fall in about the same areas, the odds are that they are collinear and you should just use one of them. CAUTION :If you are randomly selecting indicators to support your analysis, you will more than likely fall into the multicollinearity trap of using multiple indicators that are all saying the same thing. They are not giving you any additional information; in fact, they are restricting your overall view of the market. Don't search for supporting information among collinear indicators, it is just misleading.
veluri1967 John Murphy's Technical Trading
Study long-term charts. Begin a chart analysis with monthly and weekly charts spanning several years. A larger scale map of the market provides more visibility and a better long-term perspective on a market. Once the long-term has been established, then consult daily and intra-day charts. A short-term market view alone can often be deceptive. Even if you only trade the very short term, you will do better if you're trading in the same direction as the intermediate and longer term trends. Determine the trend and follow it. Market trends come in many sizes – long-term, intermediate-term and short-term. First, determine which one you're going to trade and use the appropriate chart. Make sure you trade in the direction of that trend. Buy dips if the trend is up. Sell rallies if the trend is down. If you're trading the intermediate trend, use daily and weekly charts. If you're day trading, use daily and intra-day charts. But in each case, let the longer range chart determine the trend, and then use the shorter term chart for timing. Find support and resistance levels. The best place to buy a market is near support levels. That support is usually a previous reaction low. The best place to sell a market is near resistance levels. Resistance is usually a previous peak. After a resistance peak has been broken, it will usually provide support on subsequent pullbacks. In other words, the old "high" becomes the new low. In the same way, when a support level has been broken, it will usually produce selling on subsequent rallies – the old "low" can become the new "high."
Measure percentage retracements. Market corrections up or down usually retrace a significant portion of the previous trend. You can measure the corrections in an existing trend in simple percentages. A fifty percent retracement of a prior trend is most common. A minimum retracement is usually one-third of the prior trend. The maximum retracement is usually two-thirds. Fibonacci retracements of 38% and 62% are also worth watching. During a pullback in an uptrend, therefore, initial buy points are in the 33-38% retracement area. Draw trend lines. Trend lines are one of the simplest and most effective charting tools. All you need is a straight edge and two points on the chart. Up trend lines are drawn along two successive lows. Down trend lines are drawn along two successive peaks. Prices will often pull back to trend lines before resuming their trend. The breaking of trend lines usually signals a change in trend. A valid trend line should be touched at least three times. The longer a trend line has been in effect, and the more times it has been tested, the more important it becomes. Follow moving averages. Moving averages provide objective buy and sell signals. They tell you if existing trend is still in motion and help confirm a trend change. Moving averages do not tell you in advance, however, that a trend change is imminent. A combination chart of two moving averages is the most popular way of finding trading signals. Some popular futures combinations are 4- and 9-day moving averages, 9- and 18-day, 5- and 20-day. Signals are given when the shorter average line crosses the longer. Price crossings above and below a 40-day moving average also provide good trading signals. Since moving average chart lines are trend-following indicators, they work best in a trending market. Track oscillators. Oscillators help identify overbought and oversold markets. While moving averages offer confirmation of a market trend change, oscillators often help warn us in advance that a market has rallied or fallen too far and will soon turn. Two of the most popular are the Relative Strength Index (RSI) and Stochastics. They both work on a scale of 0 to 100. With the RSI, readings over 70 are overbought while readings below 30 are oversold. The overbought and oversold values for Stochastics are 80 and 20. Most traders use 14-days or weeks for stochastics and either 9 or 14 days or weeks for RSI. Oscillator divergences often warn of market turns. These tools work best in a trading market range. Weekly signals can be used as filters on daily signals. Daily signals can be used as filters for intra-day charts. Trade MACD. The Moving Average Convergence Divergence (MACD) indicator (developed by Gerald Appel) combines a moving average crossover system with the
overbought/oversold elements of an oscillator. A buy signal occurs when the faster line crosses above the slower and both lines are below zero. A sell signal takes place when the faster line crosses below the slower from above the zero line. Weekly signals take precedence over daily signals. An MACD histogram plots the difference between the two lines and gives even earlier warnings of trend changes. It's called a "histogram" because vertical bars are used to show the difference between the two lines on the chart. Use ADX. The Average Directional Movement Index (ADX) line helps determine whether a market is in a trending or a trading phase. It measures the degree of trend or direction in the market. A rising ADX line suggests the presence of a strong trend. A falling ADX line suggests the presence of a trading market and the absence of a trend. A rising ADX line favors moving averages; a falling ADX favors oscillators. By plotting the direction of the ADX line, the trader is able to determine which trading style and which set of indicators are most suitable for the current market environment. Include volume and open interest. Volume and open interest are important confirming indicators in futures markets. Volume precedes price. It's important to ensure that heavier volume is taking place in the direction of the prevailing trend. In an uptrend, heavier volume should be seen on up days. Rising open interest confirms that new money is supporting the prevailing trend. Declining open interest is often a warning that the trend is near completion. A solid price uptrend should be accompanied by rising volume and rising open interest. "Technical analysis is a skill that improves with experience and study. Always be a student and keep learning. "- John Murphy Happy learning with many many thanks to John Murphy.
veluri1967 Choose a Chart Pattern to learn
Below is a list of common chart patterns that can be useful in Technical Analysis. Friends...choose yourself which one is to be studied next and I will accomplish it choosing the most opted chart pattern. Double Top Double Bottom Head and Shoulders Top Head and Shoulders Bottom Falling Wedge
Rising Wedge Rounding Bottom Triple Top Triple Bottom Bump and Run Reversal Flag, Pennant Symmetrical Triangle Ascending Triangle Descending Triangle Rectangle Price Channel (Continuation) Measured Move - Bullish (Continuation) Measured Move - Bearish (Continuation) Cup with Handle Go and post your choice.
veluri1967 Re: Technical Analysis for Beginners
We have covered so far Pivot Point Trading Technical Indicators Chart Patterns Murphy's Trading Strategy. What next? A simple strategy development based on the knowledge gained so far. I have a strategy on Simple Moving Average/Exponential Moving Average. I call it "SMA/EMA Pullback strategy" which I have posted as SMA/EMA A simple Trading Strategy as another thread. I will post it here after removing any flaws in it. Happy Dusshera. veluri1967
Originally Posted by veluri1967 Triangles are of three types. They are:- Symmetrical Triangles Ascending Triangles Descending Triangles The symmetrical triangle, which can also be referred to as a coil, usually forms during a trend as a continuation pattern. The pattern contains at least two lower highs and two higher lows. When these points are connected, the lines converge as they are extended and the symmetrical triangle takes shape. While there are instances when symmetrical triangles mark important trend reversals, they more often mark a continuation of the current trend. Regardless of the nature of the pattern, continuation or reversal, the direction of the next major move can only be determined after a valid breakout. We will examine each part of the symmetrical triangle individually, and then provide an example. 1.Trend: In order to qualify as a continuation pattern, an established trend should exist. The trend should be at least a few months old and the symmetrical triangle marks a consolidation period before continuing after the breakout. 2.Four (4) Points: At least 2 points are required to form a trend line and 2 trend lines are required to form a symmetrical triangle. Therefore, a minimum of 4 points are required to begin considering a formation as a symmetrical triangle. The second high (2) should be lower than the first (1) and the upper line should slope down. The second low (2) should be higher than the first (1) and the lower line should slope up. Ideally, the pattern will form with 6 points (3 on each side) before a breakout occurs. 3.Volume: As the symmetrical triangle extends and the trading range contracts, volume should start to diminish. This refers to the quiet before the storm, or the tightening consolidation before the breakout. 4.Duration: The symmetrical triangle can extend for a few weeks or many months. If the pattern is less than 3 weeks, it is usually considered a pennant. Typically, the time duration is about 3 months. 5.Breakout Time Frame: The ideal breakout point occurs 1/2 to 3/4 of the way through the pattern's development or time-span. The time-span of the pattern can be measured from the apex (convergence of upper and lower lines) back to the beginning of the lower trend line (base). A break before the 1/2 way point might be premature and a break too close to the apex may be insignificant. After all, as the apex approaches, a breakout must occur sometime. 6.Breakout Direction: The future direction of the breakout can only be determined after
the break has occurred. Sound obvious enough, but attempting to guess the direction of the breakout can be dangerous. Even though a continuation pattern is supposed to breakout in the direction of the long-term trend, this is not always the case. 7.Breakout Confirmation: For a break to be considered valid, it should be on a closing basis. Some traders apply a price (3% break) or time (sustained for 3 days) filter to confirm validity. The breakout should occur with an expansion in volume, especially on upside breakouts. 8.Return to Apex: After the breakout (up or down), the apex can turn into future support or resistance. The price sometimes returns to the apex or a support/resistance level around the breakout before resuming in the direction of the breakout. 9.Price Target: There are two methods to estimate the extent of the move after the breakout. First, the widest distance of the symmetrical triangle can be measured and applied to the breakout point. Second, a trend line can be drawn parallel to the pattern's trend line that slopes (up or down) in the direction of the break. The extension of this line will mark a potential breakout target. Roughly 75% of symmetrical triangles are continuation patterns and the rest mark reversals. The reversal patterns can be especially difficult to analyze and often have false breakouts. Even so, we should not anticipate the direction of the breakout, but rather wait for it to happen. Further analysis should be applied to the breakout by looking for gaps, accelerated price movements, and volume for confirmation. Confirmation is especially important for upside breakouts. Prices sometimes return to the breakout point of apex on a reaction move before resuming in the direction of the breakout. This return can offer a second chance to participate with a better reward to risk ratio. Potential reward price targets found by measurement and parallel trend line extension are only meant to act as rough guidelines. Technical analysis is dynamic and ongoing assessment is required. A large symmetrical triangle over a 5-month period before breaking out on the downside. See the attached chart. 1.The stock declined from 50 in Mar-98 to 22 in Oct-98 before beginning to firm and consolidate. The low at 22 probably was an over-reaction, but the long-term trend was down and established for almost a year. 2.After the first 4 points formed, the lines of the symmetrical triangle were draw. The stock traded within the boundaries for another 2 months to form the last 2 points. 3.After the gap up from point 3 to point 4, volume slowed over the next few months. There was some increase in volume in late June, but the 60-day SMA remained in a downtrend as the pattern took shape. 4.The red square marks the ideal breakout time-span from 50% to 75% of the pattern. The breakout occurred a little over 2 weeks later, but proved valid nonetheless. While it is preferable to have an ideal pattern develop, it is also quite rare.
5.After points 5 and 6 formed, the price action moved to the lower boundary of the pattern. Even at this point, the direction of the breakout was still a guess and its was prudent to wait. The break occurred with an increase in volume and accelerated price decline. Chaikin Money Flow declined past -30% and volume exceeded the 60-day SMA for an extended period. 6.After the decline from 29 1/2 to 25 1/2, the stock rebounded, but failed to reach potential resistance from the apex. The weakness of the reaction rally foreshadowed the sharpness of the decline that followed. 7.The widest point on the pattern extended 10 1/2 points. With a break of support at 29 1/2, the measured decline was estimated to around 19. By drawing a trend line parallel to the upper boundary of the pattern, the extension estimates a decline to around 20. Ascending Triangle (Continuation) The ascending triangle is a bullish formation that usually forms during an uptrend as a continuation pattern. There are instances when ascending triangles form as reversal patterns at the end of a downtrend, but they are typically continuation patterns. Regardless of where they form, ascending triangles are bullish patterns that indicate accumulation. Because of its shape, the pattern can also be referred to as a right-angle triangle. Two or more equal highs form a horizontal line at the top. Two or more rising troughs form an ascending trend line that converges on the horizontal line as it rises. If both lines were extended right, the ascending trend line could act as the hypotenuse of a right triangle. If a perpendicular line were drawn extending down from the left end of the horizontal line, a right triangle would form. Let's examine each individual part of the pattern and then look at an example. 1.Trend: In order to qualify as a continuation pattern, an established trend should exist. However, because the ascending triangle is a bullish pattern, the length and duration of the current trend is not as important as the robustness of the formation, which is paramount. 2.Top Horizontal Line: At least 2 <gl reaction high>reaction highs<gl> are required to form the top horizontal line. The highs do not have to be exact, but they should be within reasonable proximity of each other. There should be some distance between the highs, and a reaction low between them. 3.Lower Ascending Trend Line: At least two reaction lows are required to form the lower ascending trend line. These reaction lows should be successively higher, and there should be some distance between the lows. If a more recent reaction low is equal to or less than the previous reaction low, then the ascending triangle is not valid. 4.Duration: The length of the pattern can range from a few weeks to many months with the average pattern lasting from 1-3 months. 5.Volume: As the pattern develops, volume usually contracts. When the upside breakout

occurs, there should be an expansion of volume to confirm the breakout. While volume confirmation is preferred, it is not always necessary. 6.Return to Breakout: A basic tenet of technical analysis is that resistance turns into support and vice versa. When the horizontal resistance line of the ascending triangle is broken, it turns into support. Sometimes there will be a return to this support level before the move begins in earnest. 7.Target: Once the breakout has occurred, the price projection is found by measuring the widest distance of the pattern and applying it to the resistance breakout. In contrast to the symmetrical triangle, an ascending triangle has a definitive bullish bias before the actual breakout. If you will recall, the symmetrical triangle is a neutral formation that relies on the impending breakout to dictate the direction of the next move. On the ascending triangle, the horizontal line represents overhead supply that prevents the security from moving past a certain level. It is as if a large sell order has been placed at this level and it is taking a number of weeks or months to execute, thus preventing the price from rising further. Even though the price cannot rise past this level, the reaction lows continue to rise. It is these higher lows that indicate increased buying pressure and give the ascending triangle its bullish bias. Descending Triangle (Continuation) The descending triangle is a bearish formation that usually forms during a downtrend as a continuation pattern. There are instances when descending triangles form as reversal patterns at the end of an uptrend, but they are typically continuation patterns. Regardless of where they form, descending triangles are bearish patterns that indicate distribution. Because of its shape, the pattern can also be referred to as a right-angle triangle. Two or more comparable lows form a horizontal line at the bottom. Two or more declining peaks form a descending trend line above that converges with the horizontal line as it descends. If both lines were extended right, the descending trend line could act as the hypotenuse of a right triangle. If a perpendicular line were drawn extending up from the left end of the horizontal line, a right triangle would form. Let's examine each individual part of the pattern and then look at an example. 1.Trend: In order to qualify as a continuation pattern, an established trend should exist. However, because the descending triangle is definitely a bearish pattern, the length and duration of the current trend is not as important. The robustness of the formation is paramount. 2.Lower Horizontal Line: At least 2 reaction lows are required to form the lower horizontal line. The lows do not have to be exact, but should be within reasonable proximity of each other. There should be some distance separating the lows and a reaction high between them. 3.Upper Descending Trend Line: At least two reaction highs are required to form the upper descending trend line. These reaction highs should be successively lower and there should be some distance between the highs. If a more recent reaction high is equal to or greater than the previous reaction high, then the descending triangle is not valid. 4.Duration: The length of the pattern can range from a few weeks to many months, with
the average pattern lasting from 1-3 months. 5.Volume: As the pattern develops, volume usually contracts. When the downside break occurs, there would ideally be an expansion of volume for confirmation. While volume confirmation is preferred, it is not always necessary. 6.Return to Breakout: A basic tenet of technical analysis is that broken support turns into resistance and visa versa. When the horizontal support line of the descending triangle is broken, it turns into resistance. Sometimes there will be a return to this newfound resistance level before the down move begins in earnest. 7.Target: Once the breakout has occurred, the price projection is found by measuring the widest distance of the pattern and subtracting it from the resistance breakout. In contrast to the symmetrical triangle, a descending triangle has a definite bearish bias before the actual break. The symmetrical triangle is a neutral formation that relies on the impending breakout to dictate the direction of the next move. For the descending triangle, the horizontal line represents demand that prevents the security from declining past a certain level. It is as if a large buy order has been placed at this level and it is taking a number of weeks or months to execute, thus preventing the price from declining further. Even though the price does not decline past this level, the reaction highs continue to decline. It is these lower highs that indicate increased selling pressure and give the descending triangle its bearish bias. veluri1967 Indentify Market Stages to enter Trade
Strict to your trading strategy whether you loose or gain. If we gain no matter. If we loose, let us remove the flaws in the strategy and not quickly switch to other strategy. Secondly, if your trading strategy is not giving you any trade signals based on trading strategy, just quit trading that day. Do not force yourself to trade even if trade signals are not generated. Patience is the key. "History repeats itself in the stock market. Many price patterns and price consolidation structures that stocks form are repeated over and over again." Interesting link worth trying :- http://www.gainmax.com/daytrading.htm http://www.gainmax.com/daytrading.htm As many of us now understood, the importance of studying various charts with bare eye. Printing, saving charts is cumbersome and copying and pasting them is even more. Why not have a look here.
60 charts to display. http://www.nobrainertrades.com/2008/...-examples.html veluri1967 Intraday trade with Unitech. Pivots set for today. PP - 106.30 R1 - 107.35 R2 - 109 R3 - 110 S1 - 104.65 S2 - 103.60 S3 - 102 Market scenerio at 10:30 AM Nifty & BSE both were in negative zone. In the market watch list, Unitech is displayed in TOP 5 declines. The trades were as follows :- Long Buy 100 @ 103.05 Sell 100 @ 102.50 Loss of 0.55 x 100 = 55 Short Sell 100 @ 102.50 Sell 100 @ 102.75 Buy 200 @ 102.05 Profit of 0.45 x 100 + 0.70 X 100 = 115 Short Sell 100 @ 102.40 Sell 100 @ 102.70 Buy 200 @ 102.35
Profit of 0.05 x 100 + 0.35 X 100 = 40 Total profit = - 55 + 115 + 40 = 100 including brokerage. The lessons learnt are important than the numbers. 1. Plot Pivot Lines before start of trade on the chart. 2. Not to initiate trade just on first confirmation. Let the whipsaws cool down. (See the chart from 10:25 to 10:40). 3. Donot chase the price. If opportunity lost, never mind we will have it again. (My first LONG loss is because of this as my BUY ended at the top). 4. Interpretation of sudden spurt of volumes is very important whether on RED bar or BLUE bar. 5. Avoid trading between two pivot points. (My nerve wrecking is due to this). 6. Lot of patience is required to meet our targets. 7. Donot anticipate anything. Let the price action decide it. 8. If you are confident of trend, nothing wrong to average your trade even if it is in loss. 9. Well balanced emotions is the key. (Fear of Loss, loosing profit etc should not interefere with your strategy). Throughout the day the nerves were taken out. The movement I initiate trade, the price simply drifts making my decision wrong. Keeping my cool is found very nerve wrecking. I hope paper trading does not give this experience. Please share your views. If possible try like this low risk trade, experience yourself. I will edit the post to show exact times of trade which will make it easier to assess what is right or wrong. hi veluri dont want to write much but i think u understoon ur mistakes during the trade i ll like to add on there no pont going long at unitech when it opens gap down from previoud day close 3/15 downward crossover happened on 29th then followed 30th also i think we should first understand the reason for taking the trade long or short by doing some homework on it

when u saw unitech in the top 5 declines in the morning and we know unitech was showng sell signals u should have been more confident unitech tested 105.6 2 times and a break below it would make it go lower and it opened way down 105 .6 i guesss patience as taught by every profeesional trader should be what we newbies need to learn hope i dint oversay anythin i have also experienced the same fear of movement of suzlon and unitech in my early trading days .
then i thought first to understand the movement of markets stocks volatility and all i can learn and take positions rather trading at unitech we can do some hmewrok on stocks which are likely to move up and book some profits confidently scan for stocks looking forward for ur safe trades he he I have started this thread with Pivot Points. For Amibroker users, i am giving below AFL indicating Pivot Points. Thanks to Sunny for giving me this useful info. _SECTION_BEGIN("Robert's Pivot Points"); //--------------------------------------------------------------------------- // Pivot Pointer //--------------------------------------------------------------------------- // Now a days each and every trader wants pivot levels for thier day // trading.But the main feature in this afl is you can get all types of // pivot point in a single afl, Some of the traders use Woodie pivot, // caramilla pivot, Fibonacci pivot and most of them used Classical // pivot, i think this afl will solve all your needs. //--------------------------------------------------------------------------- //--------------------------------------------------------------------------- // Please write your comments to [email protected] //--------------------------------------------------------------------------- //--------------------------------------------------------------------------- // This section gets whether they want pivot level for intraday or thier eod //---------------------------------------------------------------------------
_N(ioreod =ParamList("Pivot Levels for ", "Intraday|EOD")); if (ioreod=="Intraday") { yh = TimeFrameGetPrice( "H", inDaily, -1 ); yl = TimeFrameGetPrice( "L", inDaily, -1 ); yc = TimeFrameGetPrice( "C", inDaily, -1 ); } else { yh = TimeFrameGetPrice( "H", inDaily, 0 ); yl = TimeFrameGetPrice( "L", inDaily, 0 ); yc = TimeFrameGetPrice( "C", inDaily, 0 ); } //--------------------------------------------------------------------------- // To calculate the Pivot Levels //--------------------------------------------------------------------------- to = TimeFrameGetPrice( "O", inDaily, 0 ); pivot = (yh + yl + yc) / 3; range = yh - yl; _N(pist =ParamList("Select Pivot Type ", "Classical Pivot|Woodie Pivot|Caramilla Pivot|Fibonacci Pivot")); if (pist =="Classical Pivot" ) { r1 = (2 * pivot) - yl ; s1 = (2 * pivot) - yh ; r2 = pivot - s1 + r1; s2 = pivot - (r1 - s1) ; r3 = 2 * (pivot - yl) + yh ; s3 = yl - (2 * (yh - pivot)); } else if(pist =="Woodie Pivot" ) { pivot = (yh + yl + yc + to) / 4; r1 = (2 * pivot) - yl; r2 = pivot + range; r3 = yh + 2 * (pivot - yl); r4 = r3 + range; s1 = (2 * pivot) - yh; s2 = pivot - range; s3 = yl - 2 * (yh - pivot);
s4 = S3 - range; } else if(pist =="Caramilla Pivot" ) { r4 = yc + range * 1.1/2; r3 = yc + range * 1.1/4; r2 = yc + range * 1.1/6; r1 = yc + range * 1.1/12; s1 = yc - range * 1.1/12; s2 = yc - range * 1.1/6; s3 = yc - range * 1.1/4; s4 = yc - range * 1.1/2; } else { r3 = pivot + 1.000 * (yh - yl); r2 = pivot + 0.618 * (yh - yl); r1 = pivot + 0.382 * (yh - yl); s1 = pivot - 0.382 * (yh - yl); s2 = pivot - 0.618 * (yh - yl); s3 = pivot - 1.000 * (yh - yl); } //--------------------------------------------------------------------------- // To Plot Pivot Levels in the screen //--------------------------------------------------------------------------- _N(dsr =ParamList("Draw Intraday Pivot Levels ", "None|Both|Support|Resistance")); if (dsr =="Support" OR dsr == "Both") { Plot(pivot, "\n Pivot - ",colorGreen,1); Plot(r1, "Resistance 1 - ",colorDarkRed,1); Plot(r2, "Resistance 2 - ",colorDarkRed,1); Plot(r3, "Resistance 3 - ",colorDarkRed,1); Plot((pivot+r1)/2, "Mid Value of R1 & Pivot ",colorLightBlue,1); Plot((r3+r2)/2, "Mid Value of R2 & R3 - ",colorLightBlue,1); Plot((r1+r2)/2, "Mid Value of R1 & R2 - ",colorLightBlue,1); } if( dsr == "Resistance" OR dsr == "Both") { Plot(pivot, "\n Pivot - ",colorGreen,1);
Plot(s3, "Support 2 - ",colorDarkGreen,1); Plot(s2, "Support 2 - ",colorDarkGreen,1); Plot(s1, "Support 1 - ",colorDarkGreen,1); Plot((s3+s2)/2, "Mid Value of S2 & S3 ",colorWhite,1); Plot((s1+s2)/2, "Mid Value of S1 & S2 - ",colorWhite,1); Plot((pivot+s1)/2, "Mid Value of S1 & Pivot ",colorWhite,1); } //--------------------------------------------------------------------------- // Printing the pivot level in interpretation window //--------------------------------------------------------------------------- printf(Name()+ "\n\nResistance - 3 | %g\nResistance - 2 | %g\nResistance - 1 | %g\n" + "Pivot | %g\nSupport - 1 | %g\nSupport - 2 | %g\nSupport - 3 | %g", r3,r2,r1,pivot,s1,s2,s3); //--------------------------------------------------------------------------- // This section is for Exploration //--------------------------------------------------------------------------- Filter = 1; AddColumn(r3,"Resistance 3"); AddColumn(r2,"Resistance 2"); AddColumn(r1,"Resistance 1"); AddColumn(Pivot,"Pivot"); AddColumn(s1,"Support 1"); AddColumn(s2,"Support 2"); AddColumn(s3,"Support 3"); //--------------------------------------------------------------------------- // Add Pivot levels along with the title //--------------------------------------------------------------------------- _N(Title = EncodeColor(colorBrown)+ StrFormat("{{NAME}} - {{INTERVAL}} {{DATE}} Open %g, Hi %g, Lo %g, Close %g(%.1f%%)\n"+ EncodeColor(4)+"Resistance 3 -=- %g ::::: Resistance 2 -=- %g ::::: Resistance 1 -=- %g :::::"+ EncodeColor(colorGreen)+" Pivot -=- %g"+ EncodeColor(29)+"\nSupport 1 -=- %g ::::: Support 2 -=- %g ::::: Support 3 -=- %g\n ", O, H, L, C,SelectedValue( ROC( C, 1 ) ),r3,r2,r1,pivot,s1,s2,s3));
//--------------------------------------------------------------------------- // End of Pivot Point //--------------------------------------------------------------------------- _SECTION_END(); ------------------------------------------------------------------------------- Or try this :- SetChartOptions(0,chartShowArrows|chartShowDates); _N(Title = StrFormat("{{NAME}} - {{INTERVAL}} {{DATE}} Open %g, Hi %g, Lo %g, Close %g (%.1f%%) Vol " +WriteVal( V, 1.0 ) +" {{VALUES}}", O, H, L, C, SelectedValue( ROC( C, 1 )) )); Plot( C, "Close", ParamColor("Color", colorBlack ), styleNoTitle | ParamStyle("Style") | GetPriceStyle() ); H1=SelectedValue( TimeFrameGetPrice( "H", inDaily, -1 )); L1=SelectedValue(TimeFrameGetPrice( "L", inDaily, -1 )); C1=SelectedValue(TimeFrameGetPrice( "C", inDaily, -1 )); /*PIVOT Calculation*/ p = ( H1+ L1 + C1 )/3; s1 = (2*p)-H1; r1 = (2*p)-L1; s2 = p -(H1 - L1); s3 = S1 - (H1-L1); r2 = p +(H1 - L1); r3 = R1 +(H1-L1); Plot (p,"Pivot",25,1); Plot (r1,"R1",12,1); Plot (r2,"R2",12,1); Plot (r3,"R3",12,1); Plot (s1,"S1",3,1); Plot (s2,"S2",3,1); Plot (s3,"S3",3,1);
Re: Technical Analysis for Beginners
Can retail traders win? Yes they can win. First of all do not fall for the tricks of marketing wizards. In order to be able to do that you must understand the market very well. Secondly you need to have a strategy that is, or has aspects of it, used by professionals. Thirdly, and this is very important - you must not catch the unwanted attention of a market maker. Do not violate the trust relationship that is supposed to exist by trying to exploit weaknesses in the system and create a scenario where your market maker can only lose. He holds the aces because he can change the rules of the game. If you have a strategy that offers a winning edge, you will be able to negotiate this market and make money without resorting to any fundamentally flawed concepts and tactics which attract the sort of attention from your counter party that will end up costing you money. There is more than one way to make money trading any market and there are a myriad of factors playing a role in being successful, including having a scientific edge, being a master of relevant analysis and working through the constant changes in the markets. Success as a trader does not come cheaply, it does not come overnight and it does not come from running after every fad touted by marketing wizards. Success is hard earned, requiring application of, and dedication to, sound trading and business principles. Take a bird's view of the market first, then narrow down to your trading style ie intraday, daytrading, swingtrade, long term investing. It helps. Courtesy : http://www.indiadaytrading.com/bwilc3.html
Re: Technical Analysis for Beginners
Quote: First of all do not fall for the tricks of marketing wizards. In order to be able to do that you must understand the market very well. Please illustrate some tricks of marketing wizards on charts, without referring to any record of good news. If given a chart of a random stock from a non-Indian market, can you tell me on which days there was "good news"? Quote:
Secondly you need to have a strategy that is, or has aspects of it, used by professionals. Which are the strategies used by professionals? Which moving average system is more significant to them: EMA, SMA, Weighed MA, Bollinger Bands, MACD, Stoch, RSI, etc? Or do they use fundamental approach? Or some insider information? By simply looking at a trading range, can you identify if its accumulation or distribution or continuation?
Quote: Thirdly, and this is very important - you must not catch the unwanted attention of a market maker. Who is a market-maker? What is the role of the market-maker in the whole system? Are their actions reliable? To what extent if reliable? How do check if their actions are deceptive or not? What is the specific mechanism by which market maker increases/decreases the market price? How does the market maker arrive at a correct price for that instance? ------------ I am sorry if I am asking too many question but I cannot hold my self. Few more interesting questions related to technical patterns are in waiting, will post after dinner, mother yelling because food is under ready and I am still on PC. bye :-h
Quote: Originally Posted by bunny Please illustrate some tricks of marketing wizards on charts, without referring to any record of good news. If given a chart of a random stock from a non-Indian market, can you tell me on which days there was "good news"? Hi...bunny, First of all, i am happy to see you again. Coming to tricks of marketing wizards, if known to us they are no more tricks. They are not that easy to pin point on the charts until unless we have a wholesome look. Its when we get the beat, we understand it. If they are not for tricks why the stocks are moving randomely inspite of corroborative support of valid technicals.
Quote: Originally Posted by bunny Which are the strategies used by professionals? Which moving average system is more significant to them: EMA, SMA, Weighed MA, Bollinger Bands, MACD, Stoch, RSI, etc? Or do they use fundamental approach? Or some insider information? Strategies are adopted by everyone to succeed in stock market. Without a strategy its impossible to survive. So..do the professionals. Adoption of strategy is to suit according to their personalities. We cannot pin point this is their strategy. Here in this traderji, we can see a number of strategies.
Quote: Originally Posted by bunny By simply looking at a trading range, can you identify if its accumulation or distribution or continuation? I think in this respect, volume analysis should help us.
Quote: Originally Posted by bunny Who is a market-maker? What is the role of the market-maker in the whole system? As is in any place where money is involved, there will find a market maker for sole benefit of making money usually by manipulating the prices.
Quote: Originally Posted by bunny Are their actions reliable? To what extent if reliable? How do check if their actions are deceptive or not? Basically there is a difference between a speculator n market maker. The laters intentions are always questionable and doubtful.
Quote: Originally Posted by bunny What is the specific mechanism by which market maker increases/decreases the market price? How does the market maker arrive at a correct price for that instance? I am sorry to say that....I am just a beginner learning the aspects of technical trading step by step.... I have a long way to go... And another thing... I donot aim to be a market maker..... just at the most a speculator. It is suffice for us to understand a fact that there exists a market maker whose intentions are doubtful. So,,, the mechanism adopted by market makers is out of scope of this

thread.... i think so. ------------ Quote: Originally Posted by bunny I am sorry if I am asking too many question but I cannot hold my self.. Never mind. It would be good if we are able to pick what is opt for us. The subject is so vast we can possibly not digest the entire thing in one go.. Lets go step by step. Finally I am happy to see that my post is able to generate so many doubts and questions on the subject.
Quote: Originally Posted by bunny Few more interesting questions related to technical patterns are in waiting, will post after dinner, mother yelling because food is under ready and I am still on PC. I am just a beginner. Let me see if i can answer your querries. Originally Posted by bunny Ok, here are those additional questions: http://www.rohanshenoy.net/stocks/itaq.html
Thought provoking questionnere...indeed. Thank you __________________ veluri1967 Re: Technical Analysis for Beginners
Quote: AW10, Vishalalluri, Prasadam and a few others have answered it. But there are differences of opinions in many about the same thing. Bunny, market is a grey world. You will always have difference of opinion.. and everybody is right in their own perspective. There is nothing RIGHT and nothing WRONG. We don't trade right or wrong here.. We trade what we belive in. If I feel market is going to reverse, then I buy and put stop. Someone else might think it is going down, and will sell and put stops. Finally, one of us is going to win and someone else is going to loose on that particular trade.. it doesn't matter at all. What matters is where we both end up in long run. Quite possible, we both are winner in long run.. or both are looser. You might believe that smart money moves the market and there are real smart trader sitting there.. but I might believe that there are bigger fools sitting and managing smart
money.. who don't know the concepts of trading like position size, psychology, risk mgmt etc. There only goal is beat next fund in their category and beat the benchmark. We both might have our reason to justify our position... and we can keep arguing it for life and reach nowhere... Beauty of market is that , it needs people with different view to flourish. And they will always be there cause as a human being, no two of us are same. We all are wired differently.. So our reaction will be differ, always. Hope this helps. __ As a matter of fact, trading should be profitable and fun (rather than serious, if feel so). Day Trading demands a full time participation. Its for full time professionals. It is their main duty. Its not suitable for working men because they cannot have time to glue to the monitors entire day leaving their work aside. Though I like a lot to day trade, my work does not allow me to do so. For people like us, who are active but unable to spare time for day trading, then I think swing trading is best. we are active enough to watch markets by following EOD charts. We can arrive at decisions for next day trade. We can trade by making a phone call to the broker in the absence of live broker terminal at work place. The best about swing trading is that we need not watch our positions during the day. In view of this, my future posts will be for swing trades. I apolozise those who get offended with this shift of mine from day trading to swing trading. I cannot justify even now if i donot change my focus. The greed and fear create highs and lows of prices. Swing Trader comes here to take the advantage of these price changes. Swing Trade is suitable for both Trending and Range bound markets. You need to hold positions anywhere between 2 or 3 days to 2 or 3 weeks. We are going to use Technical Analysis for learning Swing Trade. May be not in one go but step by step. Also as time goes we will also identify some stocks for Swing Trade. For now, we use simple Technical Indicators. Simple Moving Averages. 10 days, 20 days, 50 days. Moving Average Crossover I have already discussed in this thread at the initial postings. Profit target should be anywhere between 6 to 9%. Stop loss should be half of your profit target. Suppose if you choose 6% profit target, stop loss should be 3%. Needless to emphase the importance of trailing stops to protect our capital and earned profits.
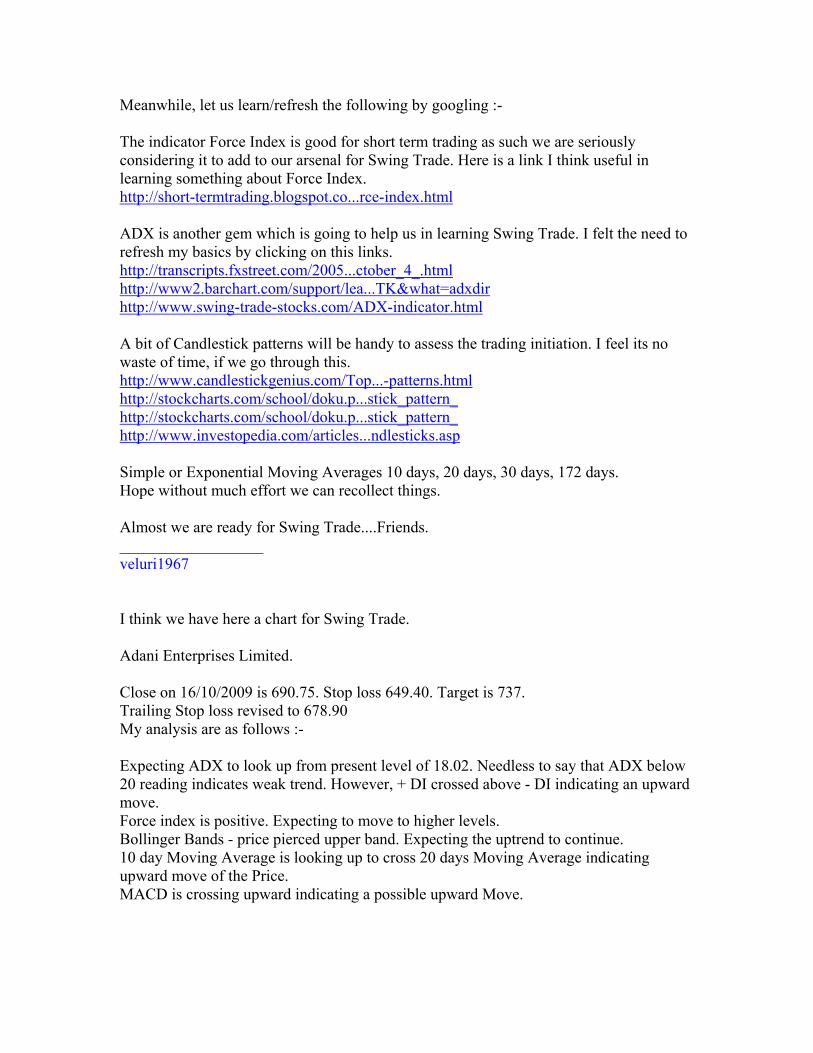
Meanwhile, let us learn/refresh the following by googling :- The indicator Force Index is good for short term trading as such we are seriously considering it to add to our arsenal for Swing Trade. Here is a link I think useful in learning something about Force Index. http://short-termtrading.blogspot.co...rce-index.html ADX is another gem which is going to help us in learning Swing Trade. I felt the need to refresh my basics by clicking on this links. http://transcripts.fxstreet.com/2005...ctober_4_.html http://www2.barchart.com/support/lea...TK&what=adxdir http://www.swing-trade-stocks.com/ADX-indicator.html A bit of Candlestick patterns will be handy to assess the trading initiation. I feel its no waste of time, if we go through this. http://www.candlestickgenius.com/Top...-patterns.html http://stockcharts.com/school/doku.p...stick_pattern_ http://stockcharts.com/school/doku.p...stick_pattern_ http://www.investopedia.com/articles...ndlesticks.asp Simple or Exponential Moving Averages 10 days, 20 days, 30 days, 172 days. Hope without much effort we can recollect things. Almost we are ready for Swing Trade....Friends. __________________ veluri1967 I think we have here a chart for Swing Trade. Adani Enterprises Limited. Close on 16/10/2009 is 690.75. Stop loss 649.40. Target is 737. Trailing Stop loss revised to 678.90 My analysis are as follows :- Expecting ADX to look up from present level of 18.02. Needless to say that ADX below 20 reading indicates weak trend. However, + DI crossed above - DI indicating an upward move. Force index is positive. Expecting to move to higher levels. Bollinger Bands - price pierced upper band. Expecting the uptrend to continue. 10 day Moving Average is looking up to cross 20 days Moving Average indicating upward move of the Price. MACD is crossing upward indicating a possible upward Move.
I will adjust my trailing stop loss as price moves up. Attached Images
__________________ veluri1967