table 1 background statistics education for all global ... · pdf filetable 1 background...
TRANSCRIPT

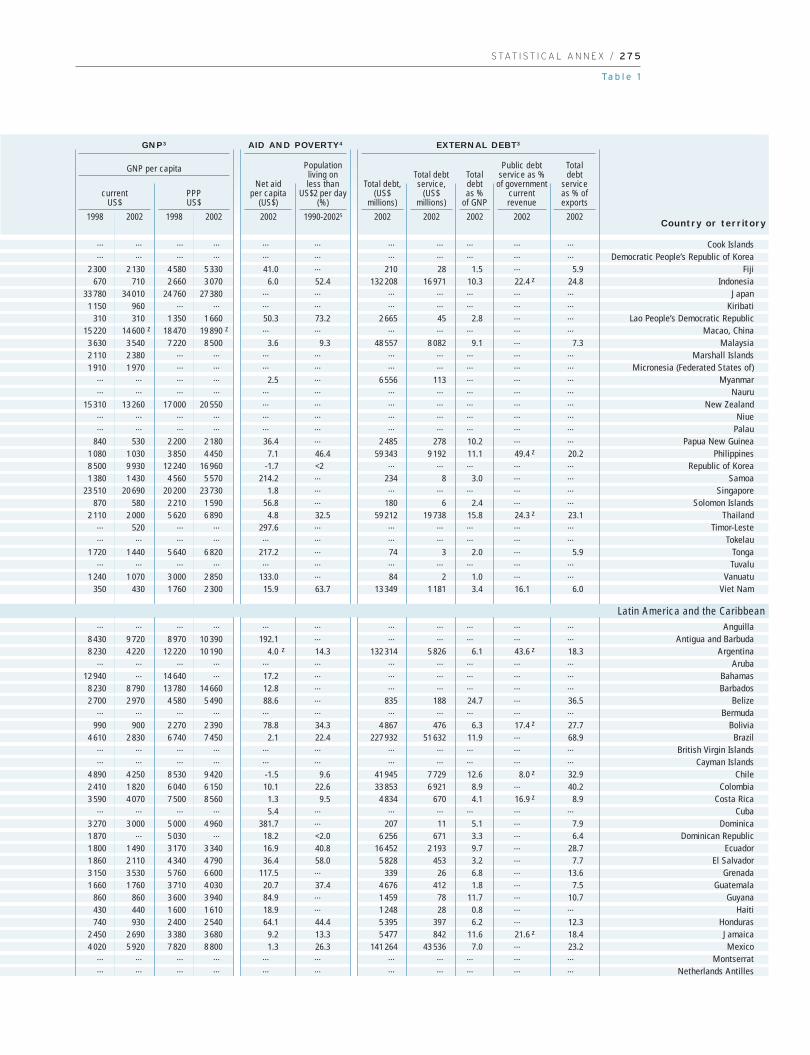
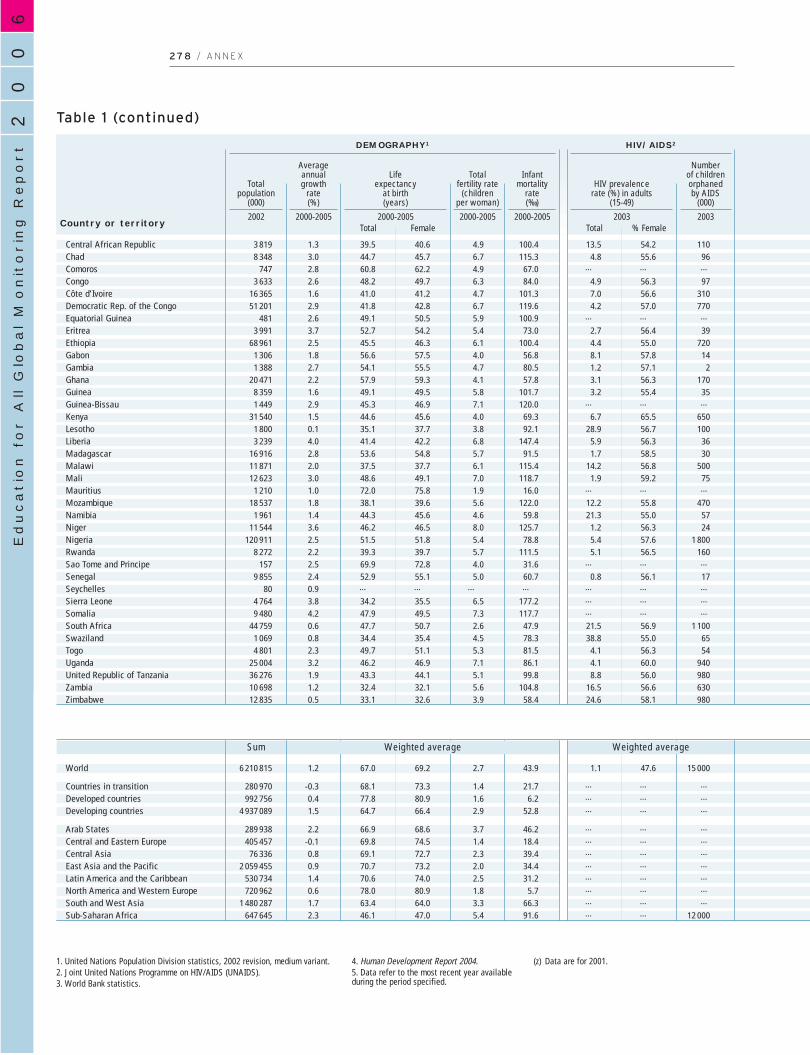
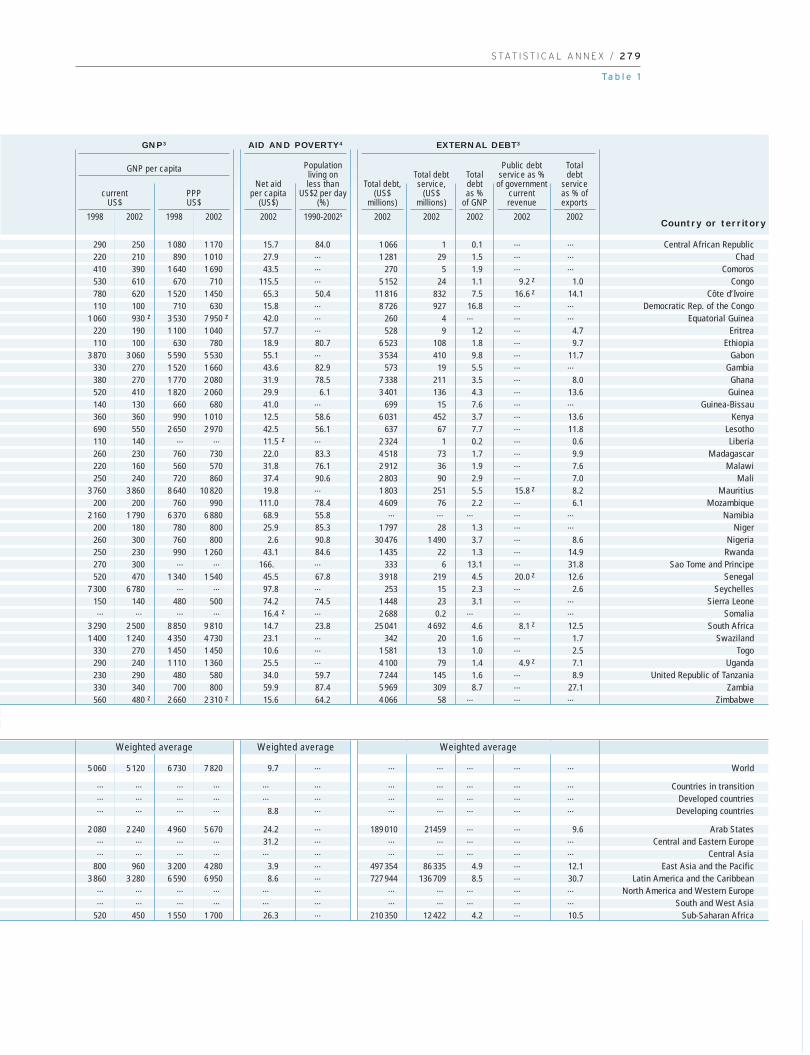
Table 1Background statistics
31 266 1.7 69.7 71.3 2.8 43.9 0.1 15.6 …
709 2.2 74.0 75.9 2.7 14.2 0.2 … …
693 1.6 45.7 46.8 5.7 102.4 2.9 56.0 570 507 2.0 68.8 71.0 3.3 40.6 <0.1 13.3 …
24 510 2.7 60.7 62.3 4.8 83.3 <0.1 … …
5 329 2.7 71.0 72.5 3.6 23.9 <0.1 … …
2 443 3.5 76.6 79.0 2.7 10.8 … … …
3 596 1.6 73.5 75.1 2.2 17.2 0.1 … …
5 445 1.9 72.8 75.4 3.0 20.7 0.3 … …
2 807 3.0 52.5 54.1 5.8 96.7 0.6 57.3 230 072 1.6 68.7 70.5 2.7 42.1 0.1 … …
2 768 2.9 72.4 74.4 5.0 19.7 0.1 … …
3 433 3.6 72.4 74.0 5.6 20.7 … … …
601 1.5 72.2 75.4 3.2 12.3 … … …
23 520 2.9 72.3 73.7 4.5 20.6 … … …
32 878 2.2 55.6 57.1 4.4 77.0 2.3 57.9 …
17 381 2.4 71.9 73.1 3.3 22.3 <0.1 … …
9 728 1.1 72.8 74.9 2.0 23.3 <0.1 … …
2 937 1.9 74.7 77.4 2.8 13.6 … … …
19 315 3.5 60.0 61.1 7.0 70.6 0.1 … …
3 141 0.7 73.7 76.7 2.3 25.0 … … …
9 940 -0.5 70.1 75.3 1.2 11.3 … … …
4 126 1.1 74.0 76.7 1.3 13.5 <0.1 … …
7 965 -0.8 70.9 74.6 1.1 15.2 <0.1 … …
4 439 -0.2 74.2 78.1 1.7 8.1 <0.1 … …
10 246 -0.1 75.4 78.7 1.2 5.6 0.1 32.0 …
1 338 -1.1 71.7 76.8 1.2 9.4 1.1 33.8 …
9 923 -0.5 71.9 76.0 1.2 8.8 0.1 … …
2 329 -0.9 71.0 76.2 1.1 14.2 0.6 33.3 …
3 465 -0.6 72.7 77.6 1.3 8.7 0.1 … …
38 622 -0.1 73.9 78.0 1.3 9.1 0.1 … …
4 270 -0.1 68.9 72.2 1.4 18.1 0.2 … …
22 387 -0.2 70.5 74.2 1.3 20.0 <0.1 … …
144 082 -0.6 66.8 73.1 1.1 15.9 1.1 33.7 …
10 535 -0.1 73.2 75.6 1.7 13.0 0.2 20.0 …
5 398 0.1 73.7 77.6 1.3 8.0 <0.1 … …
1 986 -0.1 76.3 79.8 1.1 5.5 <0.1 … …
2 046 0.5 73.6 75.8 1.9 16.0 <0.1 … …
70 318 1.4 70.5 73.2 2.4 39.5 … … …
48 902 -0.8 69.7 74.7 1.2 13.8 1.4 33.3 …
3 072 -0.5 72.4 75.6 1.2 17.3 0.1 36.0 …
8 297 0.9 72.2 75.5 2.1 29.3 <0.1 … …
5 177 -0.9 73.6 77.6 1.4 17.6 0.1 33.3 …
15 469 -0.4 66.3 71.9 2.0 51.7 0.2 33.5 …
5 067 1.4 68.6 72.3 2.6 37.0 0.1 … …
2 559 1.3 63.9 65.9 2.4 58.2 <0.1 … …
6 195 0.9 68.8 71.4 3.1 50.0 <0.1 … …
4 794 1.5 67.1 70.4 2.7 48.6 <0.1 … …
25 705 1.5 69.7 72.5 2.4 36.7 0.1 33.6 …
19 544 1.0 79.2 82.0 1.7 5.5 0.1 7.1 …
350 2.3 76.3 78.9 2.5 6.1 <0.1 … …
13 810 2.4 57.4 59.5 4.8 73.2 2.6 30.0 …
1 294 867 0.7 71.0 73.3 1.8 36.6 0.1 22.9 …
AlgeriaBahrainDjiboutiEgyptIraqJordanKuwaitLebanonLibyan Arab JamahiriyaMauritaniaMoroccoOmanPalestinian Autonomous TerritoriesQatarSaudi ArabiaSudanSyrian Arab RepublicTunisiaUnited Arab EmiratesYemen
AlbaniaBelarusBosnia and HerzegovinaBulgariaCroatiaCzech RepublicEstoniaHungaryLatviaLithuaniaPolandRepublic of MoldovaRomaniaRussian FederationSerbia and MontenegroSlovakiaSloveniaThe former Yugoslav Rep. of MacedoniaTurkeyUkraine
ArmeniaAzerbaijanGeorgiaKazakhstanKyrgyzstanMongoliaTajikistanTurkmenistanUzbekistan
AustraliaBrunei DarussalamCambodiaChina
60
02
Education f
or A
ll G
lobal M
onitorin
g R
eport
2 7 2 / A N N E X
DEMOGRAPHY1 HIV/AIDS2
2002 2000-2005 2000-2005Total TotalFemale % Female
2000-2005 2000-2005 2003 2003
Total population
(000)
Averageannualgrowth
rate(%)
Life expectancy
at birth (years)
Total fertility rate
(children per woman)
Infant mortality
rate (‰)
HIV prevalence rate (%) in adults
(15-49)
Number of childrenorphaned by AIDS
(000)
Country or territory
Arab States
Central and Eastern Europe
Central Asia
East Asia and the Pacific

1 560 1 720 4 850 5 530 11.5 15.1 22 800 4 166 7.8 21.3 z …
9 610 10 500 14 180 16 190 99.5 … … … … … …
790 850 1 950 2 040 112.3 … 335 12 2.0 … …
1 270 1 470 3 210 3 810 18.2 43.9 30 750 2 066 2.3 … 10.3… … … … 5.1 z … … … … … …
1 590 1 760 3 730 4 180 100.3 7.4 8 094 585 6.3 26.0 z 8.717 390 16 340 19 020 17 780 1.9 … … … … … …
3 670 3 990 4 400 4 600 126.8 … 17 077 2 188 12.0 … 51.0… … … … 1.9 … … … … … …
420 280 1 560 1 790 126.6 63.1 2 309 64 8.2 … …
1 260 1 170 3 350 3 730 21.2 14.3 18 601 3 691 10.4 … 23.96 420 7 830 11 620 13 000 14.7 … 4 639 1 748 8.8 14.7 z …
… … … … 470.9 … … … … … …… … … … 3.7 … … … … … …
8 120 8 530 12 320 12 660 1.1 … … … … … …
340 370 1 400 1 740 10.7 … 16 389 23 0.2 … 0.8930 1 130 3 250 3 470 4.7 … 21 504 258 1.3 … 3.0
2 050 1 990 5 320 6 440 48.8 6.6 12 625 1 438 7.2 … 13.519 550 … 22 620 … 1.4 … … … … … …
390 490 710 800 30.2 45.2 5 290 171 1.9 … 3.3
890 1 450 3 210 4 960 100.9 … 1 312 58 1.2 … 3.41 560 1 360 4 220 5 500 4.0 … 908 197 1.4 5.4 z 2.11 190 1 310 … … 142.3 … 2 515 158 2.7 … 6.91 270 1 770 5 380 7 030 47.9 … 10 462 1 368 9.0 19.1 z 15.94 690 4 540 8 450 10 000 37.5 … 15 347 3 018 13.8 16.9 z 25.95 160 5 480 12 650 14 920 38.3 … 26 419 4 534 6.9 9.7 z 9.53 490 4 190 8 830 11 630 51.5 … 4 741 783 12.7 2.3 z 13.74 480 5 290 10 410 13 070 47.5 … 34 958 14 870 23.1 … 33.92 430 3 480 6 610 9 190 37.1 … 6 690 650 7.8 4.9 z 15.82 700 3 670 7 990 10 190 42.4 … 6 199 1 281 9.4 11.1 z 16.63 860 4 570 8 780 10 450 30.0 … 69 521 13 489 7.2 11.4 z 22.5
470 460 1 320 1 600 33.2 … 1 349 229 12.9 29.4 19.91 520 1 870 5 490 6 490 31.3 … 14 683 3 088 6.8 16.4 z 18.62 140 2 130 5 770 8 080 9.0 … 147 541 14 330 4.2 12.0 z 11.3
… 1 400 … … 122.6 z … 12 688 150 1.0 … 2.84 000 3 970 10 490 12 590 35.1 … 13 013 3 377 14.5 14.0 z 19.39 740 10 370 14 660 18 480 86.1 … … … … … …
1 920 1 710 5 790 6 420 135.2 … 1 619 238 6.3 … 15.83 060 2 490 6 150 6 300 9.0 10.3 131 556 27 604 15.2 26.0 z 46.8
850 780 3 590 4 800 9.9 … 13 555 3 243 7.9 8.2 z 13.7
570 790 2 150 3 230 95.5 … 1 149 74 3.0 … 8.8510 710 2 000 3 010 42.1 … 1 398 187 3.3 … 6.5700 650 1 780 2 270 60.4 … 1 838 129 3.8 18.0 11.0
1 350 1 520 3 580 5 630 12.2 … 17 538 4 115 17.4 18.6 z 34.4350 290 1 330 1 560 36.7 … 1 797 173 11.2 … 25.3410 430 1 510 1 710 81.5 50.0 1 037 52 4.7 11.6 z 6.7180 180 660 930 27.2 … 1 153 79 6.9 25.5 z 10.2580 … 2 500 … 8.5 … … … … … …
490 310 1 360 1 640 7.4 … 4 568 733 9.4 … 24.3
21 240 19 530 23 730 27 440 … … … … … … …… … … … -5.0 … … … … … …
290 300 1 510 1 970 35.3 77.7 2 907 21 0.5 … 0.8740 960 3 240 4 520 1.1 46.7 168 255 30 616 2.4 … 8.2
S TAT I S T I C A L A N N E X / 2 7 3
Ta b l e 1
GNP3 AID AND POVERTY4 EXTERNAL DEBT3
1998 2002 20021998 2002 2002 2002 2002 2002 20021990-20025
currentUS$
GNP per capita
PPPUS$
Net aid per capita
(US$)
Populationliving on less than
US$2 per day(%)
Country or territory
Total debt, (US$
millions)
Total debtservice,
(US$ millions)
Total debt as %
of GNP
Public debtservice as %
of governmentcurrentrevenue
Total debt
service as % ofexports
AlgeriaBahrainDjibouti
EgyptIraq
JordanKuwait
LebanonLibyan Arab Jamahiriya
MauritaniaMorocco
OmanPalestinian Autonomous Territories
QatarSaudi Arabia
SudanSyrian Arab Republic
TunisiaUnited Arab Emirates
Yemen
AlbaniaBelarus
Bosnia and HerzegovinaBulgariaCroatia
Czech RepublicEstonia
HungaryLatvia
LithuaniaPoland
Republic of MoldovaRomania
Russian FederationSerbia and Montenegro
SlovakiaSlovenia
The former Yugoslav Rep. of MacedoniaTurkey
Ukraine
ArmeniaAzerbaijan
GeorgiaKazakhstanKyrgyzstan
MongoliaTajikistan
TurkmenistanUzbekistan
AustraliaBrunei Darussalam
CambodiaChina
Arab States
Central and Eastern Europe
Central Asia
East Asia and the Pacific
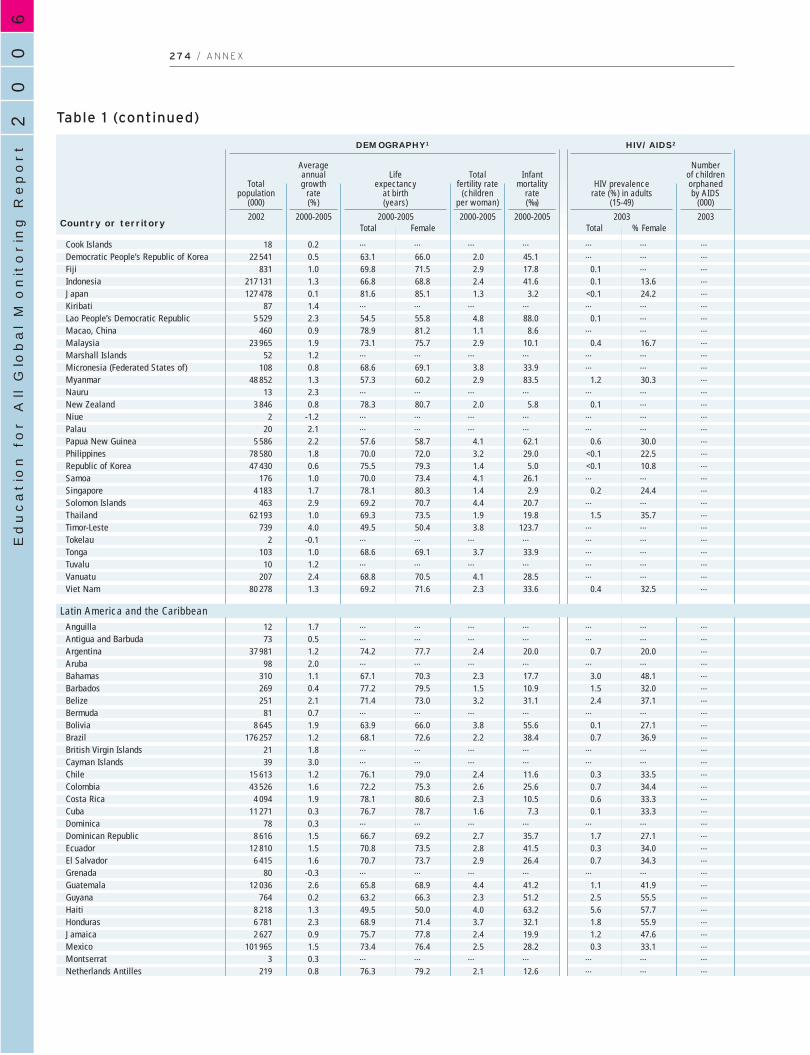
Table 1 (continued)
18 0.2 … … … … … … …
22 541 0.5 63.1 66.0 2.0 45.1 … … …
831 1.0 69.8 71.5 2.9 17.8 0.1 … …
217 131 1.3 66.8 68.8 2.4 41.6 0.1 13.6 …
127 478 0.1 81.6 85.1 1.3 3.2 <0.1 24.2 …
87 1.4 … … … … … … …
5 529 2.3 54.5 55.8 4.8 88.0 0.1 … …
460 0.9 78.9 81.2 1.1 8.6 … … …
23 965 1.9 73.1 75.7 2.9 10.1 0.4 16.7 …
52 1.2 … … … … … … …
108 0.8 68.6 69.1 3.8 33.9 … … …
48 852 1.3 57.3 60.2 2.9 83.5 1.2 30.3 …
13 2.3 … … … … … … …
3 846 0.8 78.3 80.7 2.0 5.8 0.1 … …
2 -1.2 … … … … … … …
20 2.1 … … … … … … …
5 586 2.2 57.6 58.7 4.1 62.1 0.6 30.0 …
78 580 1.8 70.0 72.0 3.2 29.0 <0.1 22.5 …
47 430 0.6 75.5 79.3 1.4 5.0 <0.1 10.8 …
176 1.0 70.0 73.4 4.1 26.1 … … …
4 183 1.7 78.1 80.3 1.4 2.9 0.2 24.4 …
463 2.9 69.2 70.7 4.4 20.7 … … …
62 193 1.0 69.3 73.5 1.9 19.8 1.5 35.7 …
739 4.0 49.5 50.4 3.8 123.7 … … …
2 -0.1 … … … … … … …
103 1.0 68.6 69.1 3.7 33.9 … … …
10 1.2 … … … … … … …
207 2.4 68.8 70.5 4.1 28.5 … … …
80 278 1.3 69.2 71.6 2.3 33.6 0.4 32.5 …
12 1.7 … … … … … … …
73 0.5 … … … … … … …
37 981 1.2 74.2 77.7 2.4 20.0 0.7 20.0 …
98 2.0 … … … … … … …
310 1.1 67.1 70.3 2.3 17.7 3.0 48.1 …
269 0.4 77.2 79.5 1.5 10.9 1.5 32.0 …
251 2.1 71.4 73.0 3.2 31.1 2.4 37.1 …
81 0.7 … … … … … … …
8 645 1.9 63.9 66.0 3.8 55.6 0.1 27.1 …
176 257 1.2 68.1 72.6 2.2 38.4 0.7 36.9 …
21 1.8 … … … … … … …
39 3.0 … … … … … … …
15 613 1.2 76.1 79.0 2.4 11.6 0.3 33.5 …
43 526 1.6 72.2 75.3 2.6 25.6 0.7 34.4 …
4 094 1.9 78.1 80.6 2.3 10.5 0.6 33.3 …
11 271 0.3 76.7 78.7 1.6 7.3 0.1 33.3 …
78 0.3 … … … … … … …
8 616 1.5 66.7 69.2 2.7 35.7 1.7 27.1 …
12 810 1.5 70.8 73.5 2.8 41.5 0.3 34.0 …
6 415 1.6 70.7 73.7 2.9 26.4 0.7 34.3 …
80 -0.3 … … … … … … …
12 036 2.6 65.8 68.9 4.4 41.2 1.1 41.9 …
764 0.2 63.2 66.3 2.3 51.2 2.5 55.5 …
8 218 1.3 49.5 50.0 4.0 63.2 5.6 57.7 …
6 781 2.3 68.9 71.4 3.7 32.1 1.8 55.9 …
2 627 0.9 75.7 77.8 2.4 19.9 1.2 47.6 …
101 965 1.5 73.4 76.4 2.5 28.2 0.3 33.1 …
3 0.3 … … … … … … …
219 0.8 76.3 79.2 2.1 12.6 … … …
Cook IslandsDemocratic People’s Republic of KoreaFijiIndonesiaJapanKiribatiLao People’s Democratic RepublicMacao, ChinaMalaysiaMarshall IslandsMicronesia (Federated States of)MyanmarNauruNew ZealandNiuePalauPapua New GuineaPhilippinesRepublic of KoreaSamoaSingaporeSolomon IslandsThailandTimor-LesteTokelauTongaTuvaluVanuatuViet Nam
AnguillaAntigua and BarbudaArgentinaArubaBahamasBarbadosBelizeBermudaBoliviaBrazilBritish Virgin IslandsCayman IslandsChileColombiaCosta RicaCubaDominicaDominican RepublicEcuadorEl SalvadorGrenadaGuatemalaGuyanaHaitiHondurasJamaicaMexicoMontserratNetherlands Antilles
60
02
Education f
or A
ll G
lobal M
onitorin
g R
eport
2 7 4 / A N N E X
DEMOGRAPHY1 HIV/AIDS2
2002 2000-2005 2000-2005Total TotalFemale % Female
2000-2005 2000-2005 2003 2003
Total population
(000)
Averageannualgrowth
rate(%)
Life expectancy
at birth (years)
Total fertility rate
(children per woman)
Infant mortality
rate (‰)
HIV prevalence rate (%) in adults
(15-49)
Number of childrenorphaned by AIDS
(000)
Country or territory
Latin America and the Caribbean
… … … … … … … … … … …… … … … … … … … … … …
2 300 2 130 4 580 5 330 41.0 … 210 28 1.5 … 5.9670 710 2 660 3 070 6.0 52.4 132 208 16 971 10.3 22.4 z 24.8
33 780 34 010 24 760 27 380 … … … … … … …
1 150 960 … … … … … … … … …
310 310 1 350 1 660 50.3 73.2 2 665 45 2.8 … …
15 220 14 600 z 18 470 19 890 z … … … … … … …
3 630 3 540 7 220 8 500 3.6 9.3 48 557 8 082 9.1 … 7.32 110 2 380 … … … … … … … … …
1 910 1 970 … … … … … … … … …… … … … 2.5 … 6 556 113 … … …… … … … … … … … … … …
15 310 13 260 17 000 20 550 … … … … … … …… … … … … … … … … … …… … … … … … … … … … …
840 530 2 200 2 180 36.4 … 2 485 278 10.2 … …
1 080 1 030 3 850 4 450 7.1 46.4 59 343 9 192 11.1 49.4 z 20.28 500 9 930 12 240 16 960 -1.7 <2 … … … … …
1 380 1 430 4 560 5 570 214.2 … 234 8 3.0 … …
23 510 20 690 20 200 23 730 1.8 … … … … … …
870 580 2 210 1 590 56.8 … 180 6 2.4 … …
2 110 2 000 5 620 6 890 4.8 32.5 59 212 19 738 15.8 24.3 z 23.1… 520 … … 297.6 … … … … … …… … … … … … … … … … …
1 720 1 440 5 640 6 820 217.2 … 74 3 2.0 … 5.9… … … … … … … … … … …
1 240 1 070 3 000 2 850 133.0 … 84 2 1.0 … …
350 430 1 760 2 300 15.9 63.7 13 349 1 181 3.4 16.1 6.0
… … … … … … … … … … …
8 430 9 720 8 970 10 390 192.1 … … … … … …
8 230 4 220 12 220 10 190 4.0 z 14.3 132 314 5 826 6.1 43.6 z 18.3… … … … … … … … … … …
12 940 … 14 640 … 17.2 … … … … … …
8 230 8 790 13 780 14 660 12.8 … … … … … …
2 700 2 970 4 580 5 490 88.6 … 835 188 24.7 … 36.5… … … … … … … … … … …
990 900 2 270 2 390 78.8 34.3 4 867 476 6.3 17.4 z 27.74 610 2 830 6 740 7 450 2.1 22.4 227 932 51 632 11.9 … 68.9
… … … … … … … … … … …… … … … … … … … … … …
4 890 4 250 8 530 9 420 -1.5 9.6 41 945 7 729 12.6 8.0 z 32.92 410 1 820 6 040 6 150 10.1 22.6 33 853 6 921 8.9 … 40.23 590 4 070 7 500 8 560 1.3 9.5 4 834 670 4.1 16.9 z 8.9
… … … … 5.4 … … … … … …
3 270 3 000 5 000 4 960 381.7 … 207 11 5.1 … 7.91 870 … 5 030 … 18.2 <2.0 6 256 671 3.3 … 6.41 800 1 490 3 170 3 340 16.9 40.8 16 452 2 193 9.7 … 28.71 860 2 110 4 340 4 790 36.4 58.0 5 828 453 3.2 … 7.73 150 3 530 5 760 6 600 117.5 … 339 26 6.8 … 13.61 660 1 760 3 710 4 030 20.7 37.4 4 676 412 1.8 … 7.5
860 860 3 600 3 940 84.9 … 1 459 78 11.7 … 10.7430 440 1 600 1 610 18.9 … 1 248 28 0.8 … …
740 930 2 400 2 540 64.1 44.4 5 395 397 6.2 … 12.32 450 2 690 3 380 3 680 9.2 13.3 5 477 842 11.6 21.6 z 18.44 020 5 920 7 820 8 800 1.3 26.3 141 264 43 536 7.0 … 23.2
… … … … … … … … … … …… … … … … … … … … … …
S TAT I S T I C A L A N N E X / 2 7 5
Ta b l e 1
GNP3 AID AND POVERTY4 EXTERNAL DEBT3
1998 2002 20021998 2002 2002 2002 2002 2002 20021990-20025
currentUS$
GNP per capita
PPPUS$
Net aid per capita
(US$)
Populationliving on less than
US$2 per day(%)
Country or territory
Total debt, (US$
millions)
Total debtservice,
(US$ millions)
Total debt as %
of GNP
Public debtservice as %
of governmentcurrentrevenue
Total debt
service as % ofexports
Cook IslandsDemocratic People’s Republic of Korea
FijiIndonesia
JapanKiribati
Lao People’s Democratic RepublicMacao, China
MalaysiaMarshall Islands
Micronesia (Federated States of)Myanmar
NauruNew Zealand
NiuePalau
Papua New GuineaPhilippines
Republic of KoreaSamoa
SingaporeSolomon Islands
ThailandTimor-Leste
TokelauTongaTuvalu
VanuatuViet Nam
AnguillaAntigua and Barbuda
ArgentinaAruba
BahamasBarbados
BelizeBermuda
BoliviaBrazil
British Virgin IslandsCayman Islands
ChileColombia
Costa RicaCuba
DominicaDominican Republic
EcuadorEl Salvador
GrenadaGuatemala
GuyanaHaiti
HondurasJamaicaMexico
MontserratNetherlands Antilles
Latin America and the Caribbean

Table 1 (continued)
5 335 2.4 69.5 71.9 3.7 35.7 0.2 33.9 …
3 064 1.8 74.7 77.4 2.7 20.6 0.9 41.3 …
5 740 2.4 70.9 73.1 3.8 37.0 0.5 26.0 …
26 767 1.5 69.8 72.4 2.9 33.4 0.5 33.8 …
42 -0.3 … … … … … … …
148 0.8 72.5 74.1 2.3 14.8 … … …
119 0.6 74.1 75.6 2.2 15.7 … … …
432 0.8 71.1 73.7 2.5 25.7 1.7 34.0 …
1 298 0.3 71.3 74.4 1.6 14.1 3.2 50.0 …
20 3.5 … … … … … … …
3 391 0.7 75.3 78.9 2.3 13.1 0.3 32.8 …
25 226 1.9 73.7 76.7 2.7 18.9 0.7 32.0 …
69 2.6 … … … … … … …
8 111 0.05 78.5 81.5 1.3 4.7 0.3 22.0 …
10 296 0.2 78.8 81.9 1.7 4.2 0.2 35.0 …
31 271 0.8 79.3 81.9 1.5 5.3 0.3 23.6 …
796 0.8 78.3 80.5 1.9 7.7 … … …
5 351 0.2 76.6 79.1 1.8 5.0 0.2 18.0 …
5 197 0.2 78.0 81.5 1.7 4.0 0.1 … …
59 850 0.5 79.0 82.8 1.9 5.0 0.4 26.7 …
82 414 0.1 78.3 81.2 1.4 4.5 0.1 22.1 …
10 970 0.1 78.3 80.9 1.3 6.4 0.2 20.0 …
287 0.8 79.8 81.9 2.0 3.4 0.2 … …
3 911 1.1 77.0 79.6 1.9 5.8 0.1 30.8 …
6 304 2.0 79.2 81.0 2.7 5.9 0.1 … …
57 482 -0.1 78.7 81.9 1.2 5.4 0.5 32.1 …
447 1.3 78.4 81.4 1.7 5.4 0.2 … …
393 0.4 78.4 80.7 1.8 7.1 0.2 … …
34 0.9 … … … … … … …
16 067 0.5 78.3 81.0 1.7 4.5 0.2 20.0 …
4 514 0.4 78.9 81.9 1.8 4.5 0.1 … …
10 049 0.1 76.2 79.6 1.5 6.1 0.4 19.5 …
27 1.0 … … … … … … …
40 977 0.2 79.3 82.8 1.2 5.1 0.7 20.8 …
8 867 0.1 80.1 82.6 1.6 3.4 0.1 25.7 …
7 171 0.0 79.1 82.3 1.4 4.8 0.4 30.0 …
59 068 0.3 78.2 80.7 1.6 5.4 0.2 29.8 …
291 038 1.0 77.1 79.9 2.1 6.7 0.6 25.5 …
22 930 3.9 43.1 43.3 6.8 161.7 … … …
143 809 2.0 61.4 61.8 3.5 64.0 … … …
2 190 3.0 63.2 64.5 5.0 53.6 … … …
1 049 549 1.5 63.9 64.6 3.0 64.5 0.9 38.0 …
68 070 1.2 70.3 71.9 2.3 33.3 0.1 12.3 …
309 3.0 67.4 67.0 5.3 38.3 … … …
24 609 2.2 59.9 59.6 4.3 70.9 0.5 26.7 …
149 911 2.4 61.0 60.9 5.1 86.5 0.1 12.2 …
18 910 0.8 72.6 75.9 2.0 20.1 <0.1 17.1 …
13 184 3.2 40.1 41.5 7.2 140.3 3.9 59.1 1106 558 2.6 50.6 53.0 5.7 92.7 1.9 56.5 341 770 0.9 39.7 40.5 3.7 56.6 37.3 57.6 120
12 624 3.0 45.7 46.2 6.7 93.2 4.2 55.6 2606 602 3.1 40.9 41.4 6.8 107.4 6.0 59.1 200
15 729 1.8 46.2 47.4 4.6 88.1 6.9 55.8 240454 2.0 70.2 72.8 3.3 29.7 … … …
NicaraguaPanamaParaguayPeruSaint Kitts and NevisSaint LuciaSaint Vincent and the GrenadinesSurinameTrinidad and TobagoTurks and Caicos IslandsUruguayVenezuela
AndorraAustriaBelgiumCanadaCyprusDenmarkFinlandFranceGermanyGreeceIcelandIrelandIsraelItalyLuxembourgMaltaMonacoNetherlandsNorwayPortugalSan MarinSpainSwedenSwitzerlandUnited KingdomUnited States
AfghanistanBangladeshBhutanIndiaIran, Islamic Republic ofMaldivesNepalPakistanSri Lanka
AngolaBeninBotswanaBurkina FasoBurundiCameroonCape Verde
60
02
Education f
or A
ll G
lobal M
onitorin
g R
eport
2 7 6 / A N N E X
DEMOGRAPHY1 HIV/AIDS2
2002 2000-2005 2000-2005Total TotalFemale % Female
2000-2005 2000-2005 2003 2003
Total population
(000)
Averageannualgrowth
rate(%)
Life expectancy
at birth (years)
Total fertility rate
(children per woman)
Infant mortality
rate (‰)
HIV prevalence rate (%) in adults
(15-49)
Number of childrenorphaned by AIDS
(000)
Country or territory
North America and Western Europe
South and West Asia
Sub-Saharan Africa

380 710 1 930 2 350 97.0 79.9 6 485 151 4.0 … 11.73 590 4 020 5 520 6 060 11.5 17.6 8 298 1 677 13.9 … 19.71 810 1 170 4 660 4 590 9.9 30.3 2 967 327 6.0 22.7 z 10.52 210 2 020 4 430 4 880 18.4 37.7 28 167 3 357 6.1 20.5 z 32.85 750 6 540 9 650 10 750 683.8 … 255 38 12.4 … 22.63 700 3 750 5 090 4 950 226.5 … 415 26 4.2 … 7.22 590 2 820 4 710 5 190 40.1 … 206 13 3.9 … 7.62 310 1 940 … … 26.9 … … … … … …
4 540 6 750 7 370 9 000 -5.6 39.0 2 672 265 2.9 … 5.7… … … … … … … … … … …
6 620 4 340 8 900 7 710 4.0 3.9 10 736 1 280 10.7 26.3 z 40.03 540 4 080 5 780 5 220 2.3 32.0 32 563 7 487 8.2 23.1 z 25.6
… … … … … … … … … … …
27 040 23 860 25 130 28 910 … … … … … … …
25 590 22 940 24 460 28 130 … … … … … … …
20 000 22 390 24 200 28 930 … … … … … … …
12 110 12 320 z 15 150 18 080 z 62.3 … … … … … …
32 770 30 260 26 450 30 600 … … … … … … …
24 750 23 890 22 040 26 160 … … … … … … …
24 770 22 240 23 200 27 040 … … … … … … …
26 630 22 740 23 920 26 980 … … … … … … …
12 130 11 660 15 140 18 770 … … … … … … …
27 390 27 960 25 150 29 240 … … … … … … …
20 630 23 030 21 080 29 570 … … … … … … …
16 730 16 020 17 950 19 000 119.6 … … … … … …
20 560 19 080 22 810 26 170 … … … … … … …
44 810 39 470 42 620 53 290 … … … … … … …
8 790 9 260 15 340 17 710 28.8 … … … … … …… … … … … … … … … … …
25 160 23 390 24 920 28 350 … … … … … … …
35 240 38 730 32 400 36 690 … … … … … … …
11 030 10 720 15 290 17 820 … … … … … … …… … … … … … … … … … …
14 840 14 580 17 850 21 210 … … … … … … …
28 710 25 970 21 570 25 820 … … … … … … …
40 820 36 170 28 770 31 840 … … … … … … …
22 790 25 510 22 820 26 580 … … … … … … …
30 700 35 400 31 790 36 110 … … … … … … …
… … … … 14.7 z … … … … … …
360 380 1 450 1 770 6.3 82.8 17 037 722 1.5 … 7.3450 600 … … 33.5 … 377 6 1.2 6.1 4.6420 470 2 150 2 650 1.4 79.9 104 429 13 128 2.6 13.1 z 14.9
1 650 1 720 5 440 6 690 1.7 7.3 9 154 1 460 1.3 … 4.11 950 2 170 … … 88.9 … 270 22 3.7 10.1 4.5
220 230 1 220 1 370 14.9 82.5 2 953 98 1.8 14.9 8.8470 420 1 760 1 960 14.3 65.6 33 672 2 844 4.8 19.6 17.8850 850 3 060 3 510 18.2 45.4 9 611 716 4.4 19.5 z 9.8
520 710 1 520 1 840 32.0 … 10 134 863 8.9 … 10.0390 380 890 1 060 33.6 … 1 843 63 2.4 … 9.6
3 290 3 010 6 220 7 740 21.2 50.1 480 60 1.2 … 2.0250 250 950 1 090 37.4 81.0 1 580 53 1.7 … 16.0140 100 600 630 26.1 89.2 1 204 23 3.3 … 59.0600 550 1 620 1 910 40.2 50.6 8 503 358 4.1 … …
1 300 1 250 4 050 4 920 203.1 … 414 22 3.6 … 7.6
S TAT I S T I C A L A N N E X / 2 7 7
Ta b l e 1
NicaraguaPanama
ParaguayPeru
Saint Kitts and NevisSaint Lucia
Saint Vincent and the GrenadinesSuriname
Trinidad and TobagoTurks and Caicos Islands
UruguayVenezuela
AndorraAustria
BelgiumCanadaCyprus
DenmarkFinlandFrance
GermanyGreeceIcelandIreland
IsraelItaly
LuxembourgMalta
MonacoNetherlands
NorwayPortugal
San MarinSpain
SwedenSwitzerland
United KingdomUnited States
AfghanistanBangladesh
BhutanIndia
Iran, Islamic Republic ofMaldives
NepalPakistan
Sri Lanka
AngolaBenin
BotswanaBurkina Faso
BurundiCameroon
Cape Verde
GNP3 AID AND POVERTY4 EXTERNAL DEBT3
1998 2002 20021998 2002 2002 2002 2002 2002 20021990-20025
currentUS$
GNP per capita
PPPUS$
Net aid per capita
(US$)
Populationliving on less than
US$2 per day(%)
Country or territory
Total debt, (US$
millions)
Total debtservice,
(US$ millions)
Total debt as %
of GNP
Public debtservice as %
of governmentcurrentrevenue
Total debt
service as % ofexports
North America and Western Europe
South and West Asia
Sub-Saharan Africa
3 819 1.3 39.5 40.6 4.9 100.4 13.5 54.2 1108 348 3.0 44.7 45.7 6.7 115.3 4.8 55.6 96
747 2.8 60.8 62.2 4.9 67.0 … … …
3 633 2.6 48.2 49.7 6.3 84.0 4.9 56.3 9716 365 1.6 41.0 41.2 4.7 101.3 7.0 56.6 31051 201 2.9 41.8 42.8 6.7 119.6 4.2 57.0 770
481 2.6 49.1 50.5 5.9 100.9 … … …
3 991 3.7 52.7 54.2 5.4 73.0 2.7 56.4 3968 961 2.5 45.5 46.3 6.1 100.4 4.4 55.0 720
1 306 1.8 56.6 57.5 4.0 56.8 8.1 57.8 141 388 2.7 54.1 55.5 4.7 80.5 1.2 57.1 2
20 471 2.2 57.9 59.3 4.1 57.8 3.1 56.3 1708 359 1.6 49.1 49.5 5.8 101.7 3.2 55.4 351 449 2.9 45.3 46.9 7.1 120.0 … … …
31 540 1.5 44.6 45.6 4.0 69.3 6.7 65.5 6501 800 0.1 35.1 37.7 3.8 92.1 28.9 56.7 1003 239 4.0 41.4 42.2 6.8 147.4 5.9 56.3 36
16 916 2.8 53.6 54.8 5.7 91.5 1.7 58.5 3011 871 2.0 37.5 37.7 6.1 115.4 14.2 56.8 50012 623 3.0 48.6 49.1 7.0 118.7 1.9 59.2 75
1 210 1.0 72.0 75.8 1.9 16.0 … … …
18 537 1.8 38.1 39.6 5.6 122.0 12.2 55.8 4701 961 1.4 44.3 45.6 4.6 59.8 21.3 55.0 57
11 544 3.6 46.2 46.5 8.0 125.7 1.2 56.3 24120 911 2.5 51.5 51.8 5.4 78.8 5.4 57.6 1 800
8 272 2.2 39.3 39.7 5.7 111.5 5.1 56.5 160157 2.5 69.9 72.8 4.0 31.6 … … …
9 855 2.4 52.9 55.1 5.0 60.7 0.8 56.1 1780 0.9 … … … … … … …
4 764 3.8 34.2 35.5 6.5 177.2 … … …
9 480 4.2 47.9 49.5 7.3 117.7 … … …
44 759 0.6 47.7 50.7 2.6 47.9 21.5 56.9 1 1001 069 0.8 34.4 35.4 4.5 78.3 38.8 55.0 654 801 2.3 49.7 51.1 5.3 81.5 4.1 56.3 54
25 004 3.2 46.2 46.9 7.1 86.1 4.1 60.0 94036 276 1.9 43.3 44.1 5.1 99.8 8.8 56.0 98010 698 1.2 32.4 32.1 5.6 104.8 16.5 56.6 63012 835 0.5 33.1 32.6 3.9 58.4 24.6 58.1 980
6 210 815 1.2 67.0 69.2 2.7 43.9 1.1 47.6 15 000
280 970 -0.3 68.1 73.3 1.4 21.7 … … …
992 756 0.4 77.8 80.9 1.6 6.2 … … …
4 937 089 1.5 64.7 66.4 2.9 52.8 … … …
289 938 2.2 66.9 68.6 3.7 46.2 … … …
405 457 -0.1 69.8 74.5 1.4 18.4 … … …
76 336 0.8 69.1 72.7 2.3 39.4 … … …
2 059 455 0.9 70.7 73.2 2.0 34.4 … … …
530 734 1.4 70.6 74.0 2.5 31.2 … … …
720 962 0.6 78.0 80.9 1.8 5.7 … … …
1 480 287 1.7 63.4 64.0 3.3 66.3 … … …
647 645 2.3 46.1 47.0 5.4 91.6 … … 12 000
Central African RepublicChadComorosCongoCôte d’IvoireDemocratic Rep. of the CongoEquatorial GuineaEritreaEthiopiaGabonGambiaGhanaGuineaGuinea-BissauKenyaLesothoLiberiaMadagascarMalawiMaliMauritiusMozambiqueNamibiaNigerNigeriaRwandaSao Tome and PrincipeSenegalSeychellesSierra LeoneSomaliaSouth AfricaSwazilandTogoUgandaUnited Republic of TanzaniaZambiaZimbabwe
World
Countries in transitionDeveloped countriesDeveloping countries
Arab States Central and Eastern EuropeCentral AsiaEast Asia and the PacificLatin America and the CaribbeanNorth America and Western EuropeSouth and West AsiaSub-Saharan Africa
60
02
Education f
or A
ll G
lobal M
onitorin
g R
eport
2 7 8 / A N N E X
DEMOGRAPHY1 HIV/AIDS2
2002 2000-2005 2000-2005Total TotalFemale % Female
2000-2005 2000-2005 2003 2003
Total population
(000)
Averageannualgrowth
rate(%)
Life expectancy
at birth (years)
Total fertility rate
(children per woman)
Infant mortality
rate (‰)
HIV prevalence rate (%) in adults
(15-49)
Number of childrenorphaned by AIDS
(000)
Country or territory
Table 1 (continued)
1. United Nations Population Division statistics, 2002 revision, medium variant.2. Joint United Nations Programme on HIV/AIDS (UNAIDS).3. World Bank statistics.
4. Human Development Report 2004.5. Data refer to the most recent year availableduring the period specified.
(z) Data are for 2001.
Sum Weighted average Weighted average
290 250 1 080 1 170 15.7 84.0 1 066 1 0.1 … …
220 210 890 1 010 27.9 … 1 281 29 1.5 … …
410 390 1 640 1 690 43.5 … 270 5 1.9 … …
530 610 670 710 115.5 … 5 152 24 1.1 9.2 z 1.0780 620 1 520 1 450 65.3 50.4 11 816 832 7.5 16.6 z 14.1110 100 710 630 15.8 … 8 726 927 16.8 … …
1 060 930 z 3 530 7 950 z 42.0 … 260 4 … … …
220 190 1 100 1 040 57.7 … 528 9 1.2 … 4.7110 100 630 780 18.9 80.7 6 523 108 1.8 … 9.7
3 870 3 060 5 590 5 530 55.1 … 3 534 410 9.8 … 11.7330 270 1 520 1 660 43.6 82.9 573 19 5.5 … …
380 270 1 770 2 080 31.9 78.5 7 338 211 3.5 … 8.0520 410 1 820 2 060 29.9 6.1 3 401 136 4.3 … 13.6140 130 660 680 41.0 … 699 15 7.6 … …
360 360 990 1 010 12.5 58.6 6 031 452 3.7 … 13.6690 550 2 650 2 970 42.5 56.1 637 67 7.7 … 11.8110 140 … … 11.5 z … 2 324 1 0.2 … 0.6260 230 760 730 22.0 83.3 4 518 73 1.7 … 9.9220 160 560 570 31.8 76.1 2 912 36 1.9 … 7.6250 240 720 860 37.4 90.6 2 803 90 2.9 … 7.0
3 760 3 860 8 640 10 820 19.8 … 1 803 251 5.5 15.8 z 8.2200 200 760 990 111.0 78.4 4 609 76 2.2 … 6.1
2 160 1 790 6 370 6 880 68.9 55.8 … … … … …
200 180 780 800 25.9 85.3 1 797 28 1.3 … …
260 300 760 800 2.6 90.8 30 476 1 490 3.7 … 8.6250 230 990 1 260 43.1 84.6 1 435 22 1.3 … 14.9270 300 … … 166. … 333 6 13.1 … 31.8520 470 1 340 1 540 45.5 67.8 3 918 219 4.5 20.0 z 12.6
7 300 6 780 … … 97.8 … 253 15 2.3 … 2.6150 140 480 500 74.2 74.5 1 448 23 3.1 … …… … … … 16.4 z … 2 688 0.2 … … …
3 290 2 500 8 850 9 810 14.7 23.8 25 041 4 692 4.6 8.1 z 12.51 400 1 240 4 350 4 730 23.1 … 342 20 1.6 … 1.7
330 270 1 450 1 450 10.6 … 1 581 13 1.0 … 2.5290 240 1 110 1 360 25.5 … 4 100 79 1.4 4.9 z 7.1230 290 480 580 34.0 59.7 7 244 145 1.6 … 8.9330 340 700 800 59.9 87.4 5 969 309 8.7 … 27.1560 480 z 2 660 2 310 z 15.6 64.2 4 066 58 … … …
5 060 5 120 6 730 7 820 9.7 … … … … … …
… … … … … … … … … … …… … … … … … … … … … …… … … … 8.8 … … … … … …
2 080 2 240 4 960 5 670 24.2 … 189 010 21459 … … 9.6… … … … 31.2 … … … … … …… … … … … … … … … … …
800 960 3 200 4 280 3.9 … 497 354 86 335 4.9 … 12.13 860 3 280 6 590 6 950 8.6 … 727 944 136 709 8.5 … 30.7
… … … … … … … … … … …… … … … … … … … … … …
520 450 1 550 1 700 26.3 … 210 350 12 422 4.2 … 10.5
S TAT I S T I C A L A N N E X / 2 7 9
Ta b l e 1
GNP3 AID AND POVERTY4 EXTERNAL DEBT3
1998 2002 20021998 2002 2002 2002 2002 2002 20021990-20025
currentUS$
GNP per capita
PPPUS$
Net aid per capita
(US$)
Populationliving on less than
US$2 per day(%)
Country or territory
Total debt, (US$
millions)
Total debtservice,
(US$ millions)
Total debt as %
of GNP
Public debtservice as %
of governmentcurrentrevenue
Total debt
service as % ofexports
Central African RepublicChad
ComorosCongo
Côte d’IvoireDemocratic Rep. of the Congo
Equatorial GuineaEritrea
EthiopiaGabon
GambiaGhana
GuineaGuinea-Bissau
KenyaLesothoLiberia
MadagascarMalawi
MaliMauritius
MozambiqueNamibia
NigerNigeria
RwandaSao Tome and Principe
SenegalSeychelles
Sierra LeoneSomalia
South AfricaSwaziland
TogoUganda
United Republic of TanzaniaZambia
Zimbabwe
World
Countries in transitionDeveloped countries
Developing countries
Arab States Central and Eastern Europe
Central AsiaEast Asia and the Pacific
Latin America and the CaribbeanNorth America and Western Europe
South and West AsiaSub-Saharan Africa
Weighted average Weighted average Weighted average

60
02
Education f
or A
ll G
lobal M
onitorin
g R
eport
2 8 0 / A N N E X
AlgeriaBahrainDjiboutiEgyptIraqJordanKuwaitLebanonLibyan Arab JamahiriyaMauritaniaMoroccoOmanPalestinian Autonomous TerritoriesQatarSaudi ArabiaSudan3
Syrian Arab RepublicTunisiaUnited Arab EmiratesYemen
AlbaniaBelarusBosnia and HerzegovinaBulgariaCroatiaCzech RepublicEstoniaHungaryLatviaLithuaniaPolandRepublic of MoldovaRomaniaRussian FederationSerbia and MontenegroSlovakiaSloveniaThe former Yugoslav Rep. of MacedoniaTurkeyUkraine
ArmeniaAzerbaijanGeorgiaKazakhstanKyrgyzstanMongoliaTajikistanTurkmenistanUzbekistan
AustraliaBrunei DarussalamCambodiaChinaCook Islands
Table 2A Adult and youth literacy1
52.9 64.3 41.3 69.8 * 79.5 * 60.1* 79.8 87.4 72.1 6 799 62 6 280 66 * 5 596 6982.1 86.8 74.6 87.7 * 92.5 * 83.0* 93.2 95.6 90.1 60 55 55 60 * 47 6053.0 66.8 39.7 … … … … … … 141 65 … … … …
47.1 60.4 33.6 55.6 * 67.2 * 43.6* … … … 17 432 63 17 270 64 * … …
35.7 51.3 19.7 … … … … … … 6 208 62 … … … …
81.5 90.0 72.1 89.9 * 95.1 * 84.7* 95.2 97.8 92.3 320 72 336 74 * 229 7776.7 79.3 72.6 82.9 84.7 81.0 … … … 317 47 301 42 … …
80.3 88.3 73.1 … … … … … … 347 72 … … … …
68.1 82.8 51.1 81.7 91.8 70.7 … … … 773 71 685 77 … …
34.8 46.3 23.9 51.2 * 59.5 * 31.3* 58.9 65.7 52.4 743 60 732 60 * 955 5938.7 52.7 24.9 50.7 63.3 38.3 … … … 9 089 62 10 108 63 … …
54.7 67.3 38.3 74.4 82.0 65.4 … … … 457 57 423 55 … …… … … 91.9* 96.3* 87.4* 96.6 98.3 94.8 … … 156 77 * 104 7577.0 77.4 76.0 89.2 * … … 91.4 78 28 50 … 48 …
66.2 76.2 50.2 79.4 * 87.1 * 69.3* 89.2 93.7 84.0 3 287 59 2 776 65 * 2 315 6845.8 60.0 31.5 59.0 * 69.3 * 49.9* 71.3 79.3 63.4 7 836 63 7 621 62 * 7 757 6464.8 81.8 47.5 82.9 * 91.0 * 74.2* 89.6 95.3 84.0 2 351 75 1 864 74 * 1 622 7759.1 71.6 46.5 74.3 * 83.4 * 65.3* 82.2 89.7 74.8 2 081 65 1 864 68 * 1 532 7171.0 71.2 70.6 77.3 75.6 80.7 … … … 421 28 497 25 … …
32.7 55.2 12.9 49.0 69.5 28.5 … … … 3 820 66 5 032 70 … …
77.0 86.8 66.7 98.7 * 99.2 * 98.3* … … … 509 71 28 67 * … …
99.5 99.7 99.3 99.6 * 99.8 * 99.4* 99.8 99.8 99.8 42 76 33 77 * 16 54… … … 94.6 * 98.4 * 91.1* 97.3 99.1 95.6 … … 172 85 * 99 8397.2 98.3 96.2 98.2 * 98.7 * 97.7* 98.4 98.7 98.1 195 70 122 66 * 100 6296.9 99.0 94.9 98.1 * 99.3 * 97.1* 99.0 99.5 98.6 121 85 68 83 * 36 73… … … … … … … … … … … … … … …
99.8 99.8 99.8 99.8 * 99.8 * 99.8* 99.8 99.8 99.8 3 53 3 56 * 2 5599.1 99.3 98.9 99.3 * 99.4 * 99.3* 99.4 99.4 99.4 78 63 54 57 * 49 53… … … 99.7 * 99.8 * 99.7* 99.8 99.8 99.8 … … 5 63 * 4 5599.3 99.5 99.1 99.6 * 99.6 * 99.6* 99.7 99.7 99.7 20 67 10 54 * 8 55… … … … … … … … … … … … … … …
97.5 99.1 96.1 96.2 * 97.5 * 95.0* 98.5 98.6 98.5 80 83 126 69 * 53 5397.1 98.6 95.6 97.3 * 98.4 * 96.3* 97.7 98.3 97.2 519 77 501 71 * 421 6399.2 99.6 98.9 99.4 * 99.7 * 99.2* 99.7 99.7 99.7 857 76 672 75 * 346 54… … … 96.4 * 98.9 * 94.1* 98.4 99.3 97.5 … … 302 85 * 139 79… … … 99.6 * 99.7 * 99.6* 99.6 99.6 99.6 … … 16 54 * 18 5299.6 99.6 99.5 99.7 99.7 99.6 … … … 7 58 6 56 … …… … … 96.1 * 98.2 * 94.1* 97.6 98.8 96.5 … … 62 77 * 41 7477.9 89.2 66.4 88.3 * 95.7 * 81.1* 92.4 97.4 87.4 8 066 75 5 768 81 * 4 686 8399.4 99.7 99.2 99.4 * 99.7 * 99.2* 99.8 99.8 99.7 237 77 232 80 * 77 81
97.5 98.9 96.1 99.4 * 99.7 * 99.2* 99.9 99.9 99.8 63 80 14 74 * 3 104… … … 98.8 * 99.5 * 98.2* 99.7 99.9 99.5 … … 66 79 * 22 87… … … … … … … … … … … … … … …
98.8 99.5 98.2 99.5 * 99.8 * 99.3* 99.8 99.8 99.8 136 79 55 77 * 24 53… … … 98.7 * 99.3 * 98.1* 99.6 99.7 99.4 … … 41 74 * 18 77… … … 97.8 * 98.0 * 97.5* 97.6 97.1 98.1 … … 36 56 * 54 4098.2 99.2 97.2 99.5 * 99.7 * 99.3* 99.9 99.9 99.9 55 77 19 68 * 5 50… … … 98.8 * 99.3 * 98.3* … … … … … 31 73 * … …
98.7 99.5 97.9 99.3 99.6 98.9 … … … 164 80 122 74 … …
… … … … … … … … … … … … … … …
85.5 91.0 79.4 92.7 * 95.2 * 90.2* 95.9 97.3 94.4 24 66 17 65 * 14 6662.0 77.7 48.8 73.6 * 84.7 * 64.1* 79.6 87.4 72.4 2 032 73 2 235 72 * 2 351 7078.3 87.2 68.9 90.9 * 95.1 * 86.5* 95.7 97.8 93.4 181 331 70 87 038 73 * 48 626 76… … … … … … … … … … … … … … …
123456789
1011121314151617181920
2122232425262728293031323334353637383940
414243444546474849
5051525354
ADULT LITERACY RATE (15 and over)(%) ADULT ILLITERATES (15 and over)
1990 2000-20042 2015 2015
Total Total(000)
% FCountry or territory
2000-20042
Total(000)
% F
1990
Total(000)
% FMale Female Total Male Female Total Male Female
Arab States
Central and Eastern Europe
Central Asia
East Asia and the Pacific
S TAT I S T I C A L A N N E X / 2 8 1
Ta b l e 2 A
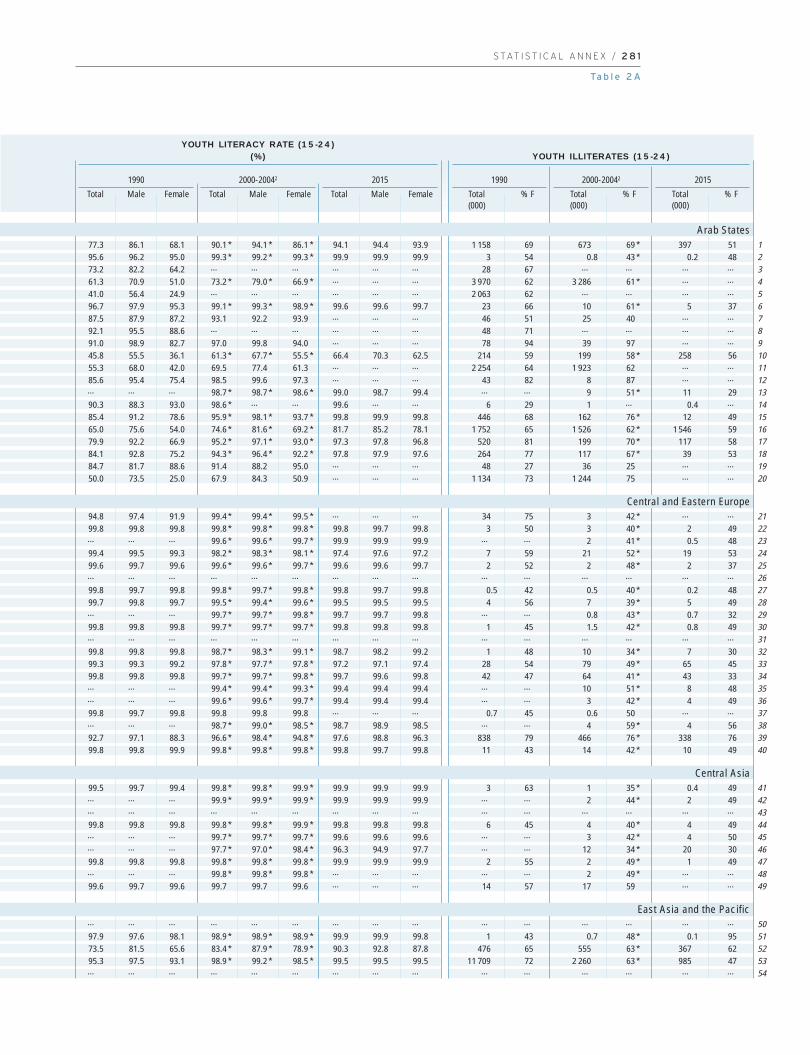
77.3 86.1 68.1 90.1 * 94.1 * 86.1 * 94.1 94.4 93.9 1 158 69 673 69 * 397 5195.6 96.2 95.0 99.3 * 99.2 * 99.3 * 99.9 99.9 99.9 3 54 0.8 43 * 0.2 4873.2 82.2 64.2 … … … … … … 28 67 … … … …
61.3 70.9 51.0 73.2 * 79.0 * 66.9 * … … … 3 970 62 3 286 61 * … …
41.0 56.4 24.9 … … … … … … 2 063 62 … … … …
96.7 97.9 95.3 99.1 * 99.3 * 98.9 * 99.6 99.6 99.7 23 66 10 61 * 5 3787.5 87.9 87.2 93.1 92.2 93.9 … … … 46 51 25 40 … …
92.1 95.5 88.6 … … … … … … 48 71 … … … …
91.0 98.9 82.7 97.0 99.8 94.0 … … … 78 94 39 97 … …
45.8 55.5 36.1 61.3 * 67.7 * 55.5 * 66.4 70.3 62.5 214 59 199 58 * 258 5655.3 68.0 42.0 69.5 77.4 61.3 … … … 2 254 64 1 923 62 … …
85.6 95.4 75.4 98.5 99.6 97.3 … … … 43 82 8 87 … …… … … 98.7 * 98.7 * 98.6 * 99.0 98.7 99.4 … … 9 51 * 11 2990.3 88.3 93.0 98.6 * … … 99.6 … … 6 29 1 … 0.4 …
85.4 91.2 78.6 95.9 * 98.1 * 93.7 * 99.8 99.9 99.8 446 68 162 76 * 12 4965.0 75.6 54.0 74.6 * 81.6 * 69.2 * 81.7 85.2 78.1 1 752 65 1 526 62 * 1 546 5979.9 92.2 66.9 95.2 * 97.1 * 93.0 * 97.3 97.8 96.8 520 81 199 70 * 117 5884.1 92.8 75.2 94.3 * 96.4 * 92.2 * 97.8 97.9 97.6 264 77 117 67 * 39 5384.7 81.7 88.6 91.4 88.2 95.0 … … … 48 27 36 25 … …
50.0 73.5 25.0 67.9 84.3 50.9 … … … 1 134 73 1 244 75 … …
94.8 97.4 91.9 99.4 * 99.4 * 99.5 * … … … 34 75 3 42 * … …
99.8 99.8 99.8 99.8 * 99.8 * 99.8 * 99.8 99.7 99.8 3 50 3 40 * 2 49… … … 99.6 * 99.6 * 99.7 * 99.9 99.9 99.9 … … 2 41 * 0.5 4899.4 99.5 99.3 98.2 * 98.3 * 98.1 * 97.4 97.6 97.2 7 59 21 52 * 19 5399.6 99.7 99.6 99.6 * 99.6 * 99.7 * 99.6 99.6 99.7 2 52 2 48 * 2 37… … … … … … … … … … … … … … …
99.8 99.7 99.8 99.8 * 99.7 * 99.8 * 99.8 99.7 99.8 0.5 42 0.5 40 * 0.2 4899.7 99.8 99.7 99.5 * 99.4 * 99.6 * 99.5 99.5 99.5 4 56 7 39 * 5 49… … … 99.7 * 99.7 * 99.8 * 99.7 99.7 99.8 … … 0.8 43 * 0.7 3299.8 99.8 99.8 99.7 * 99.7 * 99.7 * 99.8 99.8 99.8 1 45 1.5 42 * 0.8 49… … … … … … … … … … … … … … …
99.8 99.8 99.8 98.7 * 98.3 * 99.1 * 98.7 98.2 99.2 1 48 10 34 * 7 3099.3 99.3 99.2 97.8 * 97.7 * 97.8 * 97.2 97.1 97.4 28 54 79 49 * 65 4599.8 99.8 99.8 99.7 * 99.7 * 99.8 * 99.7 99.6 99.8 42 47 64 41 * 43 33… … … 99.4 * 99.4 * 99.3 * 99.4 99.4 99.4 … … 10 51 * 8 48… … … 99.6 * 99.6 * 99.7 * 99.4 99.4 99.4 … … 3 42 * 4 4999.8 99.7 99.8 99.8 99.8 99.8 … … … 0.7 45 0.6 50 … …… … … 98.7 * 99.0 * 98.5 * 98.7 98.9 98.5 … … 4 59 * 4 5692.7 97.1 88.3 96.6 * 98.4 * 94.8 * 97.6 98.8 96.3 838 79 466 76 * 338 7699.8 99.8 99.9 99.8 * 99.8 * 99.8 * 99.8 99.7 99.8 11 43 14 42 * 10 49
99.5 99.7 99.4 99.8 * 99.8 * 99.9 * 99.9 99.9 99.9 3 63 1 35 * 0.4 49… … … 99.9 * 99.9 * 99.9 * 99.9 99.9 99.9 … … 2 44 * 2 49… … … … … … … … … … … … … … …
99.8 99.8 99.8 99.8 * 99.8 * 99.9 * 99.8 99.8 99.8 6 45 4 40 * 4 49… … … 99.7 * 99.7 * 99.7 * 99.6 99.6 99.6 … … 3 42 * 4 50… … … 97.7 * 97.0 * 98.4 * 96.3 94.9 97.7 … … 12 34 * 20 3099.8 99.8 99.8 99.8 * 99.8 * 99.8 * 99.9 99.9 99.9 2 55 2 49 * 1 49… … … 99.8 * 99.8 * 99.8 * … … … … … 2 49 * … …
99.6 99.7 99.6 99.7 99.7 99.6 … … … 14 57 17 59 … …
… … … … … … … … … … … … … … …
97.9 97.6 98.1 98.9 * 98.9 * 98.9 * 99.9 99.9 99.8 1 43 0.7 48 * 0.1 9573.5 81.5 65.6 83.4 * 87.9 * 78.9 * 90.3 92.8 87.8 476 65 555 63 * 367 6295.3 97.5 93.1 98.9 * 99.2 * 98.5 * 99.5 99.5 99.5 11 709 72 2 260 63 * 985 47… … … … … … … … … … … … … … …
1234567891011121314151617181920
2122232425262728293031323334353637383940
414243444546474849
5051525354
YOUTH LITERACY RATE (15-24)(%) YOUTH ILLITERATES (15-24)
1990 2000-20042 2015
Total Male Female Total Male Female Total Male Female
2015
Total(000)
% F
2000-20042
Total(000)
% F
1990
Total(000)
% F
Arab States
Central and Eastern Europe
Central Asia
East Asia and the Pacific

60
02
Education f
or A
ll G
lobal M
onitorin
g R
eport
2 8 2 / A N N E X
Table 2A (continued)
… … … … … … … … … … … … … … …
88.6 91.6 85.5 92.9 * 94.5 * 91.4* … … … 51 63 36 60 * … …
79.5 86.7 72.5 87.9 92.5 83.4 … … … 23 800 68 18 432 69 … …… … … … … … … … … … … … … … …… … … … … … … … … … … … … … …
56.5 70.3 42.8 68.7 * 77.0 * 60.9* 76.8 82.2 71.5 1 017 67 970 64 * 1 067 6290.5 94.6 86.8 91.3 * 95.3 * 87.8* 95.1 97.2 93.1 26 73 31 75 * 22 7580.7 86.9 74.4 88.7 * 92.0 * 85.4* 93.3 95.2 91.4 2 190 66 1 723 64 * 1 442 64… … … … … … … … … … … … … … …… … … … … … … … … … … … … … …
80.7 87.4 74.2 89.7 * 93.7 * 86.2* 93.3 95.0 91.7 4 905 68 3 224 69 * 2 733 6430.4 47.4 14.0 … … … … … … 7 546 61 … … … …… … … … … … … … … … … … … … …… … … … … … … … … … … … … … …… … … … … … … … … … … … … … …
56.6 64.4 48.2 57.3 * 63.4 * 50.9* 62.9 66.2 59.5 1 046 57 1 330 56 * 1 755 5391.7 92.2 91.2 92.6 * 92.5 * 92.7* 94.2 93.7 94.6 2 986 53 3 500 50 * 3 919 47… … … … … … … … … … … … … … …
98.0 98.5 97.4 98.7 98.9 98.4 … … … 2 61 1 57 … …
88.8 94.4 83.2 92.5 * 96.6 * 88.6* 96.4 98.1 94.7 265 75 232 77 * 148 74… … … … … … … … … … … … … … …… … … 92.6 * 94.9 * 90.5* 95.7 96.9 94.5 … … 3 298 66 * 2 334 66… … … … … … … … … … … … … … …… … … … … … … … … … … … … … …… … … 98.9 * 98.8 * 99.0* … … … … … 0.7 46 * … …… … … … … … … … … … … … … … …… … … 74.0 * … … … … … … … 29 … … …… … … 90.3 * 93.9 * 86.9* 93.8 94.7 92.9 … … 4 887 69 * 4 386 58
… … … … … … … … … … … … … … …… … … … … … … … … … … … … … …
95.7 95.9 95.6 97.2 * 97.2 * 97.2* 98.1 98.0 98.2 964 54 764 52 * 624 49… … … … … … … … … … … … … … …
94.4 93.6 95.2 … … … … … … 10 44 … … … …
99.4 99.4 99.3 99.7 99.7 99.7 … … … 1 57 0.6 50 … …… … … 76.9 * 76.7 * 77.1* 81.9 81.6 82.2 … … 34 49 * 39 49… … … … … … … … … … … … … … …
78.1 86.8 69.8 86.5 * 92.9 * 80.4* 93.4 96.8 90.0 862 71 693 74 * 480 7782.0 82.9 81.2 88.4 * 88.3 * 88.6* 92.3 91.9 92.6 17 336 53 14 870 51 * 11 807 50… … … … … … … … … … … … … … …… … … … … … … … … … … … … … …
94.0 94.4 93.6 95.7 * 95.8 * 95.6* 97.2 97.3 97.2 550 55 483 52 * 385 5188.4 88.8 88.1 94.2 * 93.7 * 94.6* 95.2 94.8 95.6 2 584 53 1 765 47 * 1 829 4793.9 93.9 93.8 95.8 95.7 95.9 … … … 121 50 118 48 … …
95.1 95.2 95.1 99.8 * 99.8 * 99.8* 99.9 99.9 99.9 398 51 18 52 * 8.3 63… … … … … … … … … … … … … … …
79.4 79.8 79.0 87.7 * 88.0 * 87.3* 92.6 92.0 93.3 894 50 684 51 * 537 4587.6 90.2 85.1 91.0 * 92.3 * 89.7* 94.1 94.8 93.4 775 60 753 57 * 652 5672.4 76.1 69.1 79.7 82.4 77.1 88.5 90.3 86.8 835 59 847 58 614 59… … … … … … … … … … … … … … …
61.0 68.8 53.2 69.1 * 75.4 * 63.3* 77.9 83.2 72.9 1 843 60 2 103 60 * 2 242 6297.2 98.0 96.4 … … … … … … 13 66 … … … …
39.7 42.6 36.9 51.9 53.8 50.0 … … … 2 328 54 2 407 54 … …
68.1 68.9 67.3 80.0 * 79.8 * 80.2* 86.0 84.8 87.2 851 51 779 49 * 816 4682.2 78.0 86.1 87.6 83.8 91.4 … … … 274 40 223 36 … …
87.3 90.6 84.3 90.3 * 92.0 * 88.7* 94.6 95.8 93.4 6 471 64 6 640 60 * 4 755 63… … … … … … … … … … … … … … …
95.6 95.6 95.7 96.7 96.7 96.7 … … … 6 53 6 53 … …
62.7 62.7 62.8 76.7 * 76.8 * 76.6* 84.0 82.6 85.4 764 51 701 51 * 732 4689.0 89.7 88.4 91.9 * 92.5 * 91.2* 94.3 95.0 93.7 171 53 164 54 * 157 5590.3 92.4 88.3 91.6 * 93.1 * 90.2* 94.8 95.4 94.2 237 60 285 59 * 262 56
Democratic People’s Republic of KoreaFijiIndonesiaJapanKiribatiLao People’s Democratic RepublicMacao, ChinaMalaysiaMarshall IslandsMicronesia (Federated States of)MyanmarNauruNew ZealandNiuePalauPapua New GuineaPhilippinesRepublic of KoreaSamoaSingaporeSolomon IslandsThailandTimor-LesteTokelauTongaTuvaluVanuatuViet Nam
AnguillaAntigua and BarbudaArgentinaArubaBahamasBarbadosBelizeBermudaBoliviaBrazilBritish Virgin IslandsCayman IslandsChileColombiaCosta RicaCubaDominicaDominican RepublicEcuadorEl SalvadorGrenadaGuatemalaGuyanaHaitiHondurasJamaicaMexicoMontserratNetherlands AntillesNicaraguaPanamaParaguay
55565758596061626364656667686970717273747576777879808182
8384858687888990919293949596979899
100101102103104105106107108109110111112113114
ADULT LITERACY RATE (15 and over)(%) ADULT ILLITERATES (15 and over)
1990 2000-20042 2015 2015
Total Total(000)
% FCountry or territory
2000-20042
Total(000)
% F
1990
Total(000)
% FMale Female Total Male Female Total Male Female
Latin America and the Caribbean

S TAT I S T I C A L A N N E X / 2 8 3
Ta b l e 2 A
… … … … … … … … … … … … … … …
97.8 98.1 97.6 99.3 * 99.1 * 99.4 * … … … 3 54 1 39 * … …
95.0 96.6 93.4 98.0 98.5 97.6 … … … 1 873 65 834 62 … …… … … … … … … … … … … … … … …… … … … … … … … … … … … … … …
70.1 79.47 60.56 78.5 * 82.6 * 74.7 * 83.9 86.8 80.8 235 66 225 59 * 238 5997.2 99.2 95.8 99.6 * 99.4 * 99.8 * 99.9 99.9 99.9 2 88 0.3 26 * 0.1 4994.8 95.3 94.2 97.2 * 97.2 * 97.3 * 98.8 98.6 98.9 179 55 120 48 * 66 45… … … … … … … … … … … … … … …… … … … … … … … … … … … … … …
88.2 90.1 86.2 94.4 * 95.6 * 93.2 * 96.7 96.1 97.3 972 58 531 60 * 340 4146.6 67.0 27.3 … … … … … … 1867 67 … … … …… … … … … … … … … … … … … … …… … … … … … … … … … … … … … …… … … … … … … … … … … … … … …
68.6 74.4 62.4 66.7 * 69.1 * 64.1 * 67.5 66.3 68.8 277 60 343 52 * 504 4797.3 97.1 97.4 95.1 * 94.5 * 95.7 * 95.0 94.2 95.9 342 46 759 43 * 946 40… … … … … … … … … … … … … … …
99.0 99.1 98.9 99.5 99.4 99.5 … … … 0.3 50 0.2 50 … …
99.0 98.8 99.2 99.5 * 99.4 * 99.6 * 99.7 99.4 99.9 6 39 2 38 * 2 16… … … … … … … … … … … … … … …… … … 98.0 * 98.1 * 97.8 * 98.6 98.6 98.6 … … 236 53 * 147 49… … … … … … … … … … … … … … …… … … … … … … … … … … … … … …… … … 99.3 * 99.2 * 99.4 * … … … … … 0.1 45 * … …… … … … … … … … … … … … … … …… … … … … … … … … … … … … … …
94.1 94.5 93.6 … … … 95.6 95.1 96.1 801 54 … … 727 44
… … … … … … … … … … … … … … …… … … … … … … … … … … … … … …
98.2 98.0 98.4 98.9 * 98.7 * 99.1 * 99.2 99.0 99.3 97 44 72 40 * 55 43… … … … … … … … … … … … … … …
96.5 95.4 97.5 … … … … … … 2 34 … … … …
99.8 99.8 99.8 99.8 99.8 99.8 … … … 0.1 49 0.1 50 … …… … … 84.2 * 83.9 * 84.5 * 86.9 85.8 88.0 … … 8 48 * 8 45… … … … … … … … … … … … … … …
92.6 96.2 89.0 97.3 * 98.5 * 96.1 * 99.0 99.1 99.0 98 74 43 72 * 22 4991.8 90.5 93.1 96.6 * 95.6 * 97.7 * 98.6 97.9 99.4 2 363 42 1180 34 * 455 21… … … … … … … … … … … … … … …… … … … … … … … … … … … … … …
98.1 97.9 98.3 99.0 * 98.8 * 99.2 * 99.3 99.1 99.4 48 44 26 40 * 20 4294.9 94.3 95.5 97.6 * 96.7 * 98.4 * 98.2 97.1 99.3 369 44 201 32 * 167 1997.4 97.1 97.7 98.4 98.1 98.7 … … … 15 43 12 42 … …
99.3 99.3 99.2 100.0 * 100.0 * 100.0 * 100.0 100.0 100.0 17 51 0.7 51 * 0.6 51… … … … … … … … … … … … … … …
87.5 86.8 88.2 94.0 * 93.1 * 95.0 * 95.9 93.9 98.0 184 46 100 41 * 72 2495.5 96.0 94.9 96.4 * 96.4 * 96.5 * 96.7 96.3 97.1 95 56 91 48 * 91 4383.8 85.1 82.6 88.9 89.6 88.1 95.7 95.1 96.2 172 55 143 53 60 44… … … … … … … … … … … … … … …
73.4 80.5 66.2 82.2 * 86.4 * 78.4 * 87.0 89.4 84.6 457 63 440 60 * 437 5899.8 99.8 99.8 … … … … … … 0.3 51 … … … …
54.8 55.8 53.8 66.2 65.8 66.5 … … … 580 51 637 49 … …
79.7 78.5 80.8 88.9 * 86.9 * 90.9 * 91.2 88.2 94.3 201 47 153 40 * 160 3291.2 87.1 95.2 94.5 91.3 97.8 … … … 42 28 27 19 … …
95.2 95.9 94.4 97.6 * 97.9 * 97.3 * 98.8 98.9 98.8 889 58 486 57 * 254 50… … … … … … … … … … … … … … …
97.5 97.3 97.7 98.3 98.2 98.5 … … … 0.7 46 0.6 50 … …
68.2 67.7 68.7 86.2 * 83.6 * 88.8 * 90.9 87.1 94.8 246 50 154 40 * 134 2895.3 95.7 94.8 96.1 * 96.5 * 95.6 * 96.4 96.6 96.2 24 54 21 55 * 23 5295.6 95.9 95.2 96.3 * 96.2 * 96.5 * 97.1 97.0 97.2 36 53 41 47 * 43 48
55565758596061626364656667686970717273747576777879808182
8384858687888990919293949596979899100101102103104105106107108109110111112113114
YOUTH LITERACY RATE (15-24)(%) YOUTH ILLITERATES (15-24)
1990 2000-20042 2015
Total Male Female Total Male Female Total Male Female
2015
Total(000)
% F
2000-20042
Total(000)
% F
1990
Total(000)
% F
Latin America and the Caribbean

60
02
Education f
or A
ll G
lobal M
onitorin
g R
eport
2 8 4 / A N N E X
Table 2A (continued)
… … … 87.7 * 93.5 * 82.1* 92.4 96.0 88.9 … … 2 271 73 * 1 762 73… … … … … … … … … … … … … … …… … … 90.1 * 89.5 * 90.6* 93.0 92.3 93.6 … … 10 49 * 8 47… … … … … … … … … … … … … … …… … … 88.0 * 92.3 * 84.1* 90.0 92.6 87.5 … … 34 68 * 34 6396.8 98.1 95.6 98.5 99.0 97.9 … … … 26 70 15 67 … …… … … … … … … … … … … … … … …
96.5 96.0 97.0 97.7 97.3 98.1 … … … 80 46 57 42 … …
88.9 90.1 87.7 93.0 * 93.3 * 92.7* 95.7 95.4 96.0 1 340 55 1 154 52 * 972 47
… … … … … … … … … … … … … … …… … … … … … … … … … … … … … …… … … … … … … … … … … … … … …… … … … … … … … … … … … … … …
94.3 97.7 91.0 96.8 * 98.6 * 95.1* 98.6 99.4 98.0 29 80 19 79 * 10 72… … … … … … … … … … … … … … …… … … … … … … … … … … … … … …… … … … … … … … … … … … … … …… … … … … … … … … … … … … … …
94.9 97.6 92.3 91.0 * 94.0 * 88.3* 95.7 97.3 94.1 419 77 836 67 * 408 70… … … … … … … … … … … … … … …… … … … … … … … … … … … … … …
91.4 94.9 88.0 96.9 * 98.3 * 95.6* 98.0 99.0 97.1 267 71 145 73 * 117 74… … … … … … … … … … … … … … …… … … … … … … … … … … … … … …
88.4 87.9 88.9 87.9 * 86.4 * 89.2* … … … 32 49 36 45 * … …… … … … … … … … … … … … … … …… … … … … … … … … … … … … … …… … … … … … … … … … … … … … …… … … … … … … … … … … … … … …… … … … … … … … … … … … … … …… … … 97.1 * 98.1 * 96.1* … … … … … 1 030 69 * … …… … … … … … … … … … … … … … …… … … … … … … … … … … … … … …… … … … … … … … … … … … … … …… … … … … … … … … … … … … … …
… … … … … … … … … … … … … … …
34.2 44.3 23.7 41.1 50.3 31.4 … … … 41 606 56 52 209 57 … …… … … … … … … … … … … … … … …
49.3 61.9 35.9 61.0 * 73.4 * 47.8* 69.7 79.5 59.5 272 279 61 267 002 65 * 273 107 6563.2 72.2 54.0 77.0 * 83.5 * 70.4* … … … 11 506 61 10 543 64 * … …
94.8 95.0 94.6 96.3 * 96.2 * 96.4* 97.5 97.4 97.7 6 50 6 47 * 6.7 4630.4 47.4 14.0 48.6 * 62.7 * 34.9* 63.4 75.5 51.5 7 546 61 7 308 63 * 7 548 6535.4 49.3 20.1 48.7 * 61.7 * 35.2* 57.1 68.8 44.8 41 368 60 47 577 62 * 54 259 6388.7 92.9 84.7 90.4 * 92.2 * 88.6* 92.8 93.6 92.1 1 262 65 1 331 57 * 1 169 54
… … … 66.8 * 82.1 * 53.8* 70.2 81.1 59.8 … … 2 174 73 * 2 993 6926.4 38.1 15.5 33.6 * 46.4 * 22.6* 42.9 55.7 30.1 1 773 59 2 352 61 * 3 006 6368.1 65.7 70.3 78.9 76.1 81.5 … … … 234 49 223 45 … …… … … 12.8 * 18.5 * 8.1* … … … … … 4 726 56 * … …
37.0 48.4 26.6 58.9 * 66.8 * 51.9* 69.7 74.0 65.6 1 929 61 1 338 62 * 1 615 5857.9 68.7 47.5 67.9 * 77.0 * 59.8* … … … 2 701 64 2 807 64 * … …
63.8 76.2 54.3 75.7 85.4 68.0 … … … 67 71 64 72 … …
33.2 47.1 20.7 48.6 * 64.8 * 33.5* 55.9 68.9 43.5 1 119 63 1 093 68 * 1 206 6627.7 37.0 18.8 25.5 * 40.6 * 12.7* 37.9 54.3 21.9 2 299 58 3 097 61 * 4 031 6453.8 61.4 46.4 56.2 63.5 49.1 … … … 129 59 187 58 … …
67.1 77.1 57.9 82.8 88.9 77.1 … … … 443 66 330 68 … …
38.5 50.5 25.7 48.1 * 60.1 * 38.2* 58.2 67.3 48.8 4 119 57 4 579 59 * 5 200 60
PeruSaint Kitts and NevisSaint LuciaSaint Vincent and the GrenadinesSurinameTrinidad and TobagoTurks and Caicos IslandsUruguayVenezuela
AndorraAustriaBelgiumCanadaCyprusDenmarkFinlandFranceGermanyGreeceIcelandIrelandIsraelItalyLuxembourgMaltaMonacoNetherlandsNorwayPortugalSan MarinSpainSwedenSwitzerlandUnited KingdomUnited States
AfghanistanBangladeshBhutanIndia4
Iran, Islamic Republic ofMaldivesNepalPakistanSri Lanka3
AngolaBeninBotswanaBurkina FasoBurundiCameroonCape VerdeCentral African RepublicChadComorosCongoCôte d’Ivoire
115116117118119120121122123
124125126127128129130131132133134135136137138139140141142143144145146147148149
150151152153154155156157158
159160161162163164165166167168169170
ADULT LITERACY RATE (15 and over)(%) ADULT ILLITERATES (15 and over)
1990 2000-20042 2015 2015
Total Total(000)
% FCountry or territory
2000-20042
Total(000)
% F
1990
Total(000)
% FMale Female Total Male Female Total Male Female
North America and Western Europe
South and West Asia
Sub-Saharan Africa
S TAT I S T I C A L A N N E X / 2 8 5
Ta b l e 2 A
94.5 96.9 92.1 96.8 * 97.8 * 95.7 * 97.9 97.8 97.9 243 71 174 66 * 124 49… … … … … … … … … … … … … … …… … … 95.4 * 94.8 * 95.9 * 93.0 92.5 93.5 … … 1 44 * 2 45… … … … … … … … … … … … … … …… … … 93.5 * 95.1 * 92.1 * 92.1 91.4 92.8 … … 6 61 * 7 4599.6 99.7 99.6 99.8 99.8 99.8 … … … 0.8 51 0.6 50 … …… … … … … … … … … … … … … … …
98.7 98.3 99.1 99.1 98.8 99.4 … … … 6 34 5 33 … …
96.0 95.4 96.6 97.2 * 96.3 * 98.1 * 97.8 96.9 98.8 153 42 136 34 * 122 27
… … … … … … … … … … … … … … …… … … … … … … … … … … … … … …… … … … … … … … … … … … … … …… … … … … … … … … … … … … … …
99.7 99.5 99.8 99.8 * 99.7 * 99.8 * 99.9 99.9 99.9 0.3 29 0.3 40 * 0.1 48… … … … … … … … … … … … … … …… … … … … … … … … … … … … … …… … … … … … … … … … … … … … …… … … … … … … … … … … … … … …
99.5 99.4 99.7 99.5 * 99.4 * 99.5 * 99.1 99.2 99.1 7 37 7 43 * 10 48… … … … … … … … … … … … … … …… … … … … … … … … … … … … … …
98.7 99.0 98.4 99.6 * 99.7 * 99.4 * 99.8 99.8 99.8 10 61 5 66 * 2 49… … … … … … … … … … … … … … …… … … … … … … … … … … … … … …
97.5 96.0 99.1 96.0 * 94.4 * 97.8 * … … … 1 18 2 27 * … …… … … … … … … … … … … … … … …… … … … … … … … … … … … … … …… … … … … … … … … … … … … … …… … … … … … … … … … … … … … …… … … … … … … … … … … … … … …… … … 99.6 * 99.6 * 99.6 * … … … … … 21 54 * … …… … … … … … … … … … … … … … …… … … … … … … … … … … … … … …… … … … … … … … … … … … … … …… … … … … … … … … … … … … … …
… … … … … … … … … … … … … … …
42.0 50.7 33.2 49.7 57.8 41.1 … … … 12 842 56 14 740 57 … …… … … … … … … … … … … … … … …
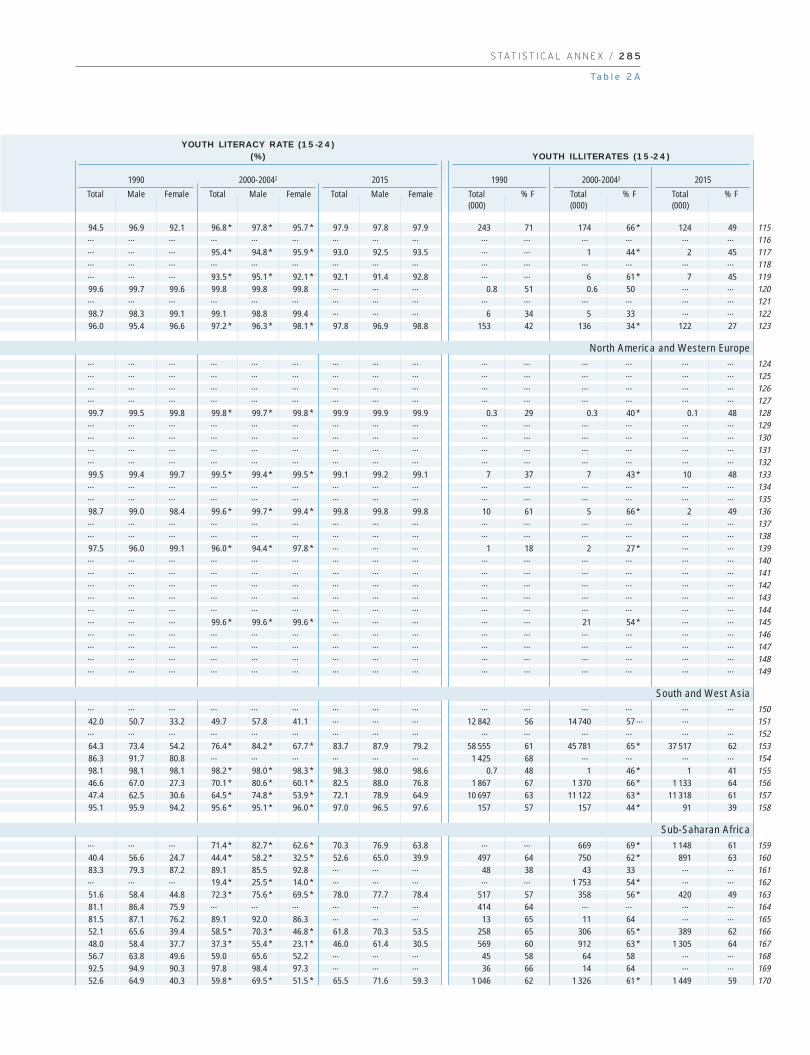
64.3 73.4 54.2 76.4 * 84.2 * 67.7 * 83.7 87.9 79.2 58 555 61 45 781 65 * 37 517 6286.3 91.7 80.8 … … … … … … 1 425 68 … … … …
98.1 98.1 98.1 98.2 * 98.0 * 98.3 * 98.3 98.0 98.6 0.7 48 1 46 * 1 4146.6 67.0 27.3 70.1 * 80.6 * 60.1 * 82.5 88.0 76.8 1 867 67 1 370 66 * 1 133 6447.4 62.5 30.6 64.5 * 74.8 * 53.9 * 72.1 78.9 64.9 10 697 63 11 122 63 * 11 318 6195.1 95.9 94.2 95.6 * 95.1 * 96.0 * 97.0 96.5 97.6 157 57 157 44 * 91 39
… … … 71.4 * 82.7 * 62.6 * 70.3 76.9 63.8 … … 669 69 * 1 148 6140.4 56.6 24.7 44.4 * 58.2 * 32.5 * 52.6 65.0 39.9 497 64 750 62 * 891 6383.3 79.3 87.2 89.1 85.5 92.8 … … … 48 38 43 33 … …… … … 19.4 * 25.5 * 14.0 * … … … … … 1 753 54 * … …
51.6 58.4 44.8 72.3 * 75.6 * 69.5 * 78.0 77.7 78.4 517 57 358 56 * 420 4981.1 86.4 75.9 … … … … … … 414 64 … … … …
81.5 87.1 76.2 89.1 92.0 86.3 … … … 13 65 11 64 … …
52.1 65.6 39.4 58.5 * 70.3 * 46.8 * 61.8 70.3 53.5 258 65 306 65 * 389 6248.0 58.4 37.7 37.3 * 55.4 * 23.1 * 46.0 61.4 30.5 569 60 912 63 * 1 305 6456.7 63.8 49.6 59.0 65.6 52.2 … … … 45 58 64 58 … …
92.5 94.9 90.3 97.8 98.4 97.3 … … … 36 66 14 64 … …
52.6 64.9 40.3 59.8 * 69.5 * 51.5 * 65.5 71.6 59.3 1 046 62 1 326 61 * 1 449 59
115116117118119120121122123
124125126127128129130131132133134135136137138139140141142143144145146147148149
150151152153154155156157158
159160161162163164165166167168169170
YOUTH LITERACY RATE (15-24)(%) YOUTH ILLITERATES (15-24)
1990 2000-20042 2015
Total Male Female Total Male Female Total Male Female
2015
Total(000)
% F
2000-20042
Total(000)
% F
1990
Total(000)
% F
North America and Western Europe
South and West Asia
Sub-Saharan Africa

60
02
Education f
or A
ll G
lobal M
onitorin
g R
eport
2 8 6 / A N N E X
Table 2A (continued)
47.5 61.4 34.4 65.3 * 79.8 * 51.9* 67.1 76.3 58.1 10 400 64 9 131 71 * 12 885 6473.3 85.8 61.1 84.2 * 92.1 * 76.4* 91.8 93.9 89.7 55 74 41 76 * 31 6446.4 58.5 34.8 … … … … … … 900 62 … … … …
28.6 37.3 19.8 41.5 49.2 33.8 … … … 18 993 57 21 955 57 … …… … … … … … … … … … … … … … …
25.6 31.7 19.7 … … … … … … 397 55 … … … …
58.5 70.1 47.2 54.1 * 62.9 * 45.7* … … … 3 455 65 5 290 60 * … …
27.2 42.3 12.9 … … … … … … 406 61 … … … …… … … … … … … … … … … … … … …
70.8 80.9 60.8 73.6 * 77.7 * 70.2* 77.4 78.2 76.5 3 489 68 4 523 58 * 5 294 5278.0 65.4 89.5 81.4 * 73.7 * 90.3* … … … 184 28 182 32 * … …
39.2 55.4 22.8 55.9 72.3 39.3 … … … 691 64 765 69 … …
58.0 66.4 49.8 70.6 * 76.4 * 65.2* 70.6 73.5 67.8 2 768 60 2 583 60 * 4 111 5551.8 68.8 36.2 64.1 * 74.9 * 54.0* … … … 2 450 69 2 137 66 * … …… … … 19.0 * 26.7 * 11.9* … … … … … 4 647 56 * … …
79.8 84.8 75.0 84.3 * 88.2 * 80.5* 89.7 91.4 88.0 150 62 138 63 * 109 5933.5 49.3 18.4 46.5 62.3 31.4 … … … 4 867 65 5 637 68 … …
74.9 77.4 72.4 85.0 * 86.8 * 83.5* 90.3 90.0 90.6 201 57 164 58 * 133 4911.4 18.0 5.1 14.4 * 19.6 * 9.4* 19.2 24.8 13.4 3 391 54 4 765 53 * 7 440 5348.7 59.4 38.4 66.8 74.4 59.4 … … … 23 678 61 22 167 61 … …
53.3 62.9 44.0 64.0 * 70.5 * 58.8* 73.3 76.1 70.8 1 660 61 1 514 63 * 1 594 57… … … … … … … … … … … … … … …
28.4 38.2 18.6 39.3 * 51.1 * 29.2* 46.3 56.4 36.6 2 822 58 3 345 60 * 4 308 60… … … 91.9 * 91.4 * 92.3* … … … … … … … … …… … … 29.6 * 39.8 * 20.5* 36.4 45.5 27.5 … … 1 735 58 * 2 275 58… … … … … … … … … … … … … … …
81.2 82.2 80.2 82.4 * 84.1 * 80.9* … … … 4 252 54 4 666 56 * … …
71.6 73.7 69.9 79.2 * 80.4 * 78.1* 86.3 85.8 86.8 129 58 121 57 * 89 5044.2 60.5 28.7 53.0 * 68.5 * 38.3* 70.6 80.5 61.1 1 049 65 1 193 67 * 1 115 6756.1 69.3 43.5 68.9 78.8 59.2 … … … 3 940 66 3 889 67 … …
62.9 75.5 51.0 69.4 * 77.5 * 62.2* 75.4 79.7 71.1 5 128 68 6 017 64 * 6 757 5968.2 78.6 58.7 67.9 * 76.1 * 59.7* 68.7 73.2 64.1 1 400 67 1 779 64 * 2 194 5780.7 86.6 75.0 90.0 93.8 86.3 … … … 1 085 66 730 69 … …
75.4 81.8 69.1 81.9 86.9 76.8 85.8 89.6 82.0 871 750 63 771 129 64 764 475 63
99.2 99.6 98.8 99.4 99.7 99.1 99.7 99.7 99.7 1 759 78 1 431 75 683 5398.0 98.5 97.5 98.7 99.0 98.4 98.9 99.4 98.3 14 864 64 10 498 62 9 684 7767.0 75.9 57.9 76.4 83.2 69.5 82.4 87.2 77.5 855 127 63 759 199 64 754 109 63
50.0 63.7 35.6 62.7 73.8 51.1 75.5 82.8 68.2 63 023 63 65 128 64 62 245 6496.2 98.0 94.6 97.4 98.9 96.2 97.9 99.1 96.9 11 500 75 8 374 79 6 994 7898.7 99.4 98.0 99.2 99.6 98.9 99.6 99.7 99.5 572 79 404 73 258 6481.8 88.9 74.5 91.4 95.0 87.7 94.9 97.0 92.8 232 255 69 129 922 71 91 851 7085.0 86.7 83.3 89.7 90.5 88.9 93.5 93.9 93.1 41 742 56 37 901 55 30 780 5497.9 98.4 97.4 98.7 99.0 98.4 99.4 99.6 99.1 11 326 64 7 740 62 3 821 7747.5 59.7 34.4 58.6 70.5 46.2 67.2 76.7 57.3 382 353 60 381 116 64 416 647.5 6449.9 60.0 40.3 59.7 68.2 51.8 69.4 75.0 63.9 128 980 61 140 544 61 151 879 59
Democratic Rep. of the CongoEquatorial GuineaEritreaEthiopiaGabonGambiaGhanaGuineaGuinea-BissauKenyaLesothoLiberiaMadagascarMalawiMaliMauritiusMozambiqueNamibiaNigerNigeriaRwandaSao Tome and PrincipeSenegalSeychellesSierra LeoneSomaliaSouth AfricaSwazilandTogoUgandaUnited Republic of TanzaniaZambiaZimbabwe
World
Countries in transitionDeveloped countriesDeveloping countries
Arab States Central and Eastern EuropeCentral AsiaEast Asia and the PacificLatin America and the CaribbeanNorth America and Western EuropeSouth and West AsiaSub-Saharan Africa
Sum % F Sum Sum% F % F
ADULT LITERACY RATE (15 and over)(%) ADULT ILLITERATES (15 and over)
1990 2000-20042 2015 2015
Total Total(000)
% FCountry or territory
2000-20042
Total(000)
% F
1990
Total(000)
% FMale Female Total Male Female Total Male Female
Weighted average
General note: The population used to generate the number of illiterates is from the United Nations Population Divisionestimates (2002 Revision). For countries with national observed literacy data, the population corresponding to the yearof the census or survey was used. For countries with UIS estimates, the population used was that of 2002.
1. For countries indicated with (*), national observed literacydata are used. For all others, UIS literacy estimates (July 2002assessment) are used.
171172173174175176177178179180181182183184185186187188189190191192193194195196197198199200201202203
I
IIIIIIV
VVI
VIIVIII
IXX
XIXII
S TAT I S T I C A L A N N E X / 2 8 7
Ta b l e 2 A
68.9 80.3 57.6 68.7 * 76.7 * 61.1 * 66.5 71.3 61.8 2 213 68 3 132 63 * 4 868 5792.7 96.6 88.8 93.8 * 93.9 * 93.7 * 94.9 93.2 96.6 5 77 5 51 * 7 3360.9 72.5 49.3 … … … … … … 236 65 … … … …
43.0 51.5 34.1 57.4 63.0 51.8 … … … 5 326 58 5 751 57 … …… … … … … … … … … … … 13 59 * … …
42.2 50.5 34.1 … … … … … … 95 58 … … … …
81.8 88.2 75.4 … … … … … … 538 67 … … … …
44.1 62.2 26.5 … … … … … … 107 66 … … … …… … … … … … … … … … … … … … …
89.8 92.9 86.7 80.3 * 79.8 * 80.7 * 77.2 74.3 80.2 473 65 1 374 49 * 1 880 4387.2 77.2 97.1 … … … … … … 38 12 … … … …
57.2 75.4 38.6 70.8 86.3 55.4 … … … 176 71 189 76 … …
72.2 77.8 66.6 70.1 * 72.4 * 68.1 * 68.5 69.0 68.0 635 60 912 54 * 1 520 5163.2 75.7 51.2 76.3 * 82.1 * 70.7 * … … … 643 68 501 63 * … …… … … 24.2 * 32.3 * 16.9 * … … … … … 1 720 55 * … …
91.1 91.2 91.1 94.5 * 93.7 * 95.4 * 96.6 95.2 98.0 18 49 12 42 * 7 2948.8 66.1 31.7 62.8 76.6 49.2 … … … 1 365 68 1 363 69 … …
87.4 85.9 89.0 92.3 * 91.2 * 93.5 * 93.1 91.3 94.9 36 44 29 42 * 38 3717.0 24.9 9.3 19.8 * 26.2 * 14.2 * 22.1 28.3 15.5 1 211 54 1 724 53 * 2 767 5373.6 80.8 66.5 88.6 90.7 86.5 … … … 4 243 63 2 779 58 … …
72.7 78.0 67.4 76.5 * 77.2 * 75.9 * 78.4 78.1 78.7 363 60 386 56 * 473 50… … … … … … … … … … … … … … …
40.1 50.0 30.2 49.1 * 58.5 * 41.0 * 52.7 59.6 45.7 829 58 1 025 59 * 1 264 57… … … 99.1 * 98.8 * 99.4 * … … … … … … … … …… … … 38.2 * 46.9 * 29.9 * 42.1 49.1 35.1 … … 523 57 * 753 56… … … … … … … … … … … … … … …
88.5 88.6 88.4 93.9 * 93.5 * 94.3 * … … … 882 51 518 47 * … …
85.1 84.7 85.5 88.1 * 86.8 * 89.4 * 88.8 87.0 90.6 25 52 27 45 * 32 4263.5 79.4 47.7 74.0 * 83.1 * 63.3 * 83.7 87.1 80.4 242 72 246 69 * 218 6070.1 79.8 60.5 80.2 86.3 74.0 … … … 1 003 66 1 000 66 … …
83.1 89.2 77.2 78.4 * 80.9 * 76.2 * 78.1 77.8 78.3 882 69 1 634 56 * 2 236 5081.2 86.4 76.2 69.4 * 72.6 * 66.1 * 66.8 68.2 65.3 311 64 656 55 * 1 000 5293.9 96.6 91.3 97.6 98.9 96.2 … … … 128 72 73 78 … …
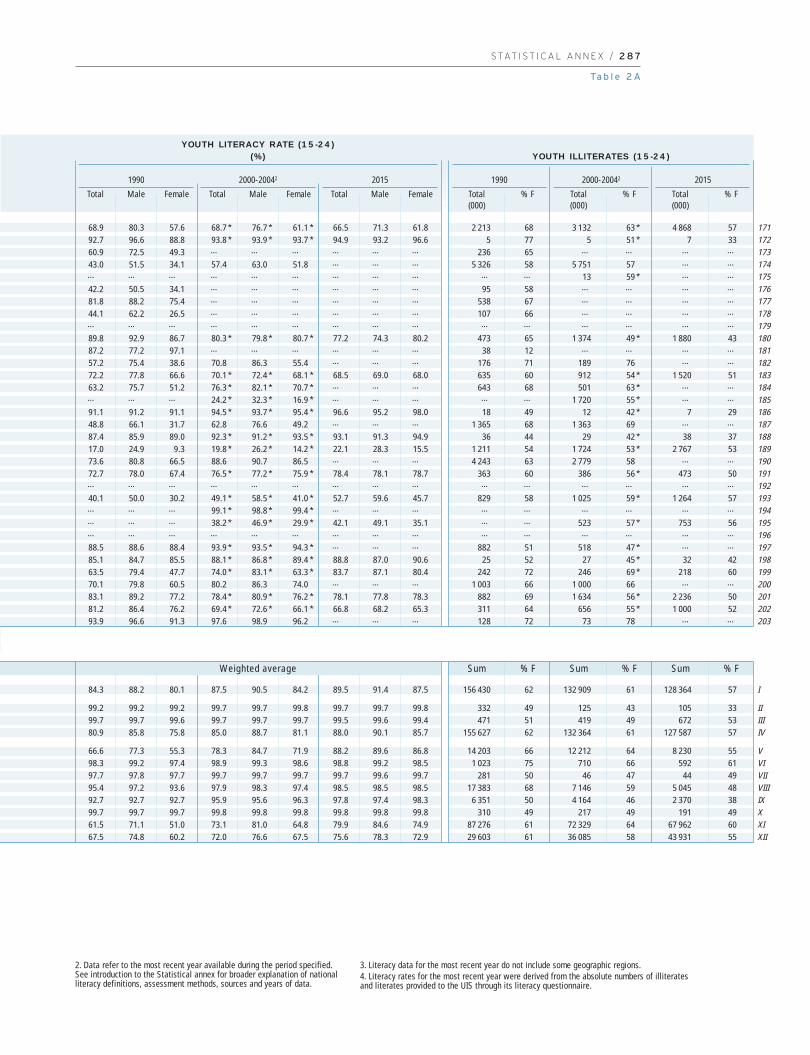
84.3 88.2 80.1 87.5 90.5 84.2 89.5 91.4 87.5 156 430 62 132 909 61 128 364 57
99.2 99.2 99.2 99.7 99.7 99.8 99.7 99.7 99.8 332 49 125 43 105 3399.7 99.7 99.6 99.7 99.7 99.7 99.5 99.6 99.4 471 51 419 49 672 5380.9 85.8 75.8 85.0 88.7 81.1 88.0 90.1 85.7 155 627 62 132 364 61 127 587 57
66.6 77.3 55.3 78.3 84.7 71.9 88.2 89.6 86.8 14 203 66 12 212 64 8 230 5598.3 99.2 97.4 98.9 99.3 98.6 98.8 99.2 98.5 1 023 75 710 66 592 6197.7 97.8 97.7 99.7 99.7 99.7 99.7 99.6 99.7 281 50 46 47 44 4995.4 97.2 93.6 97.9 98.3 97.4 98.5 98.5 98.5 17 383 68 7 146 59 5 045 4892.7 92.7 92.7 95.9 95.6 96.3 97.8 97.4 98.3 6 351 50 4 164 46 2 370 3899.7 99.7 99.7 99.8 99.8 99.8 99.8 99.8 99.8 310 49 217 49 191 4961.5 71.1 51.0 73.1 81.0 64.8 79.9 84.6 74.9 87 276 61 72 329 64 67 962 6067.5 74.8 60.2 72.0 76.6 67.5 75.6 78.3 72.9 29 603 61 36 085 58 43 931 55
Sum % F Sum Sum% F % F
YOUTH LITERACY RATE (15-24)(%) YOUTH ILLITERATES (15-24)
1990 2000-20042 2015
Total Male Female Total Male Female Total Male Female
2015
Total(000)
% F
2000-20042
Total(000)
% F
1990
Total(000)
% F
Weighted average
2. Data refer to the most recent year available during the period specified.See introduction to the Statistical annex for broader explanation of nationalliteracy definitions, assessment methods, sources and years of data.
3. Literacy data for the most recent year do not include some geographic regions.4. Literacy rates for the most recent year were derived from the absolute numbers of illiteratesand literates provided to the UIS through its literacy questionnaire.
171172173174175176177178179180181182183184185186187188189190191192193194195196197198199200201202203
I
IIIIIIV
VVIVIIVIIIIXXXIXII

60
02
Education f
or A
ll G
lobal M
onitorin
g R
eport
2 8 8 / A N N E X
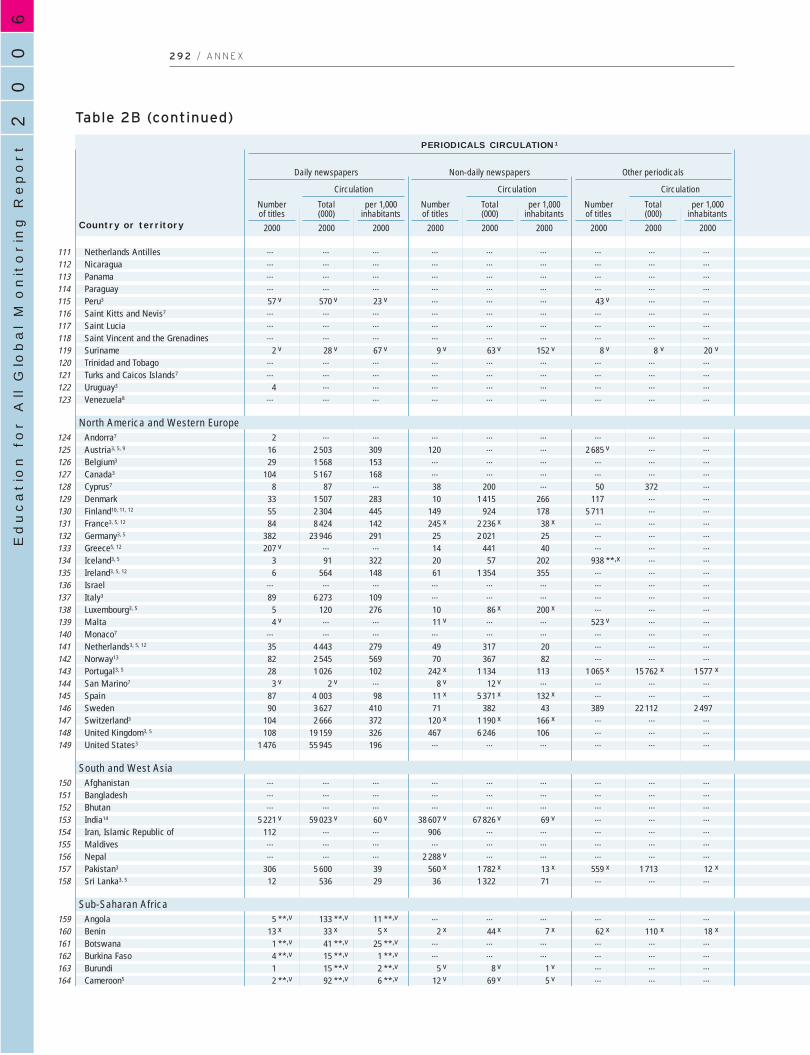
Table 2BLiterate environment
24 v 796 v 27 82 v 909 v 31 v 106 v … …… … … … … … … … …… … … … … … … … …
16 x 2 080 x 31 45 x 1 371 x 21 x 235 x 2 773 x 42 x
… … … … … … … … …
5 352 v 74 20 155 v 33 v 270 v 148 v 31 v
… … … … … … … … …
13 220 63 7 … … 49 … …
4 **,v 71 **,v 14 … … … … … …… … … … … … … … …
23 846 29 507 4 108 141 364 4 956 1705 v … … … … … 29 v … …
3 … … 13 2 058 645 62 1 854 581… … … … … … … … …… … … … … … … … …… … … 11 v 5 644 v 188 v 54 v 68 v 2 v
… … … … … … … … …
7 180 19 29 940 99 182 525 55… … … … … … … … …… … … … … … … … …
… … … … … … … … …
20 v 1 559 v 154 v 600 10 339 1 030 318 v 1 687 v 167… … … … … … … … …
43 1 400 173 527 x 2 649 x 325 x 619 x 1 247 x 153 x
12 595 134 229 568 v 128 v 2 003 … …
103 … … 712 … … 2 437 … …
13 262 192 93 … … 956 2 144 1 56940 1 625 162 167 … … 433 v … …
26 327 138 201 1 754 739 325 1 856 78222 108 31 339 949 271 753 … …
42 3 928 102 24 583 15 5 468 67 820 1 7546 v 660 v 153 v 170 915 214 99 258 60
145 ** … … 320 * … … 1 608 * … …
333 … … 10 188 … … … … …… … … … … … … … …
16 705 131 435 2 651 492 1 014 13 823 2 5645 335 168 200 … … 1 278 … …
5 108 54 33 121 60 116 235 116542 … … 688 … … 1 635 … …
61 8 683 175 2 606 38 985 785 1 245 3 988 80
8 … … 83 … … 41 114 3615 x 80 x 10 x 329 x 122 x 15 38 v 50 v 6 v
35 26 5 122 x … … 149 728 138… … … … … … … … …
3 … … 181 … … 36 170 355 44 18 27 94 v 38 v 38 85 34
… … … … … … … … …
2 32 7 22 338 73 20 47 10… … … … … … … … …
48 3 083 161 97 381 20 … … …… … … … … … … … …… … … … … … … … …
AlgeriaBahrainDjiboutiEgyptIraqJordanKuwaitLebanon3
Libyan Arab JamahiriyaMauritaniaMorocco4
OmanPalestinian Autonomous TerritoriesQatarSaudi ArabiaSudanSyrian Arab RepublicTunisiaUnited Arab EmiratesYemen
AlbaniaBelarus5
Bosnia and HerzegovinaBulgaria3
Croatia3, 5
Czech RepublicEstonia3
Hungary3, 5, 6
LatviaLithuaniaPolandRepublic of MoldovaRomaniaRussian Federation3, 5
Serbia and MontenegroSlovakiaSloveniaThe former Yugoslav Rep. of MacedoniaTurkeyUkraine
ArmeniaAzerbaijan3, 5
GeorgiaKazakhstanKyrgyzstanMongolia3, 5
TajikistanTurkmenistanUzbekistan
Australia3, 5
Brunei DarussalamCambodia
Circulation
Daily newspapers
PERIODICALS CIRCULATION1
Number of titles
Total (000)
per 1,000inhabitants
2000 2000 2000
Circulation
Non-daily newspapers
Number of titles
Total (000)
per 1,000inhabitants
2000 2000 2000
Circulation
Other periodicals
Number of titles
Total (000)
per 1,000inhabitants
2000 2000 2000Country or territory
123456789
1011121314151617181920
2122232425262728293031323334353637383940
414243444546474849
505152
Arab States
Central and Eastern Europe
Central Asia
East Asia and the Pacific

S TAT I S T I C A L A N N E X / 2 8 9
Ta b l e 2 B
133 0.4 … … 3 7 100 246 71 3 100 107 88 8 1692 v 14 v … … … 338 541 99 x 275 441 95 151 173… … … … … 52 86 57 28 46 41 14 6
1 410 v 2 v 1 001 v 456 v … 20 500 320 88 7 700 120 89 16 27… … … … … 4 850 227 … 1 750 82 … 8 1… … … … … 1 660 362 83 x 500 109 93 38 58
219 ** 10 270 … … 1 175 643 … 875 478 95 117 102289 v 9 v … … … 2 850 864 98 z 1 180 358 93 76 111… … … … … 1 350 273 91 x 730 148 95 y 24 23… … … … … 360 148 50 62 26 21 10 4
386 1 … … … 6 640 239 89 3 100 112 76 17 2312 0.5 115 15 ** 194 1 400 586 79 1 600 670 79 34 65… … … … … … … 83 … … 94 … …… … … … … 256 469 … 230 421 90 183 116… … … … … 6 250 310 90 x 5 100 253 99 128 60… … … … … 7 550 257 80 2 380 81 49 6 3… … … 85 162 4 150 270 … 1 050 68 80 19 13
1 260 13.4 … … … 2 060 224 77 920 100 92 34 52… … 1 000 15 365 820 311 91 x 310 117 86 153 346… … … … … 1 050 64 60 x 470 29 43 8 5
… … … … … 810 258 82 405 129 90 11 46 073 v 60 v … … … 3 020 297 48 2 520 248 88 z … 81
… … … … … 940 267 … 1 0.3 87 … 244 971 61 2 522 22 758 4 510 544 … 3 310 400 79 z 51 792 309 52 2 505 220 738 1 510 342 94 x 1 220 277 94 y 171 178
12 551 122 5 603 36 597 8 270 802 80 5 470 530 99 176 2543 265 237 2 285 60 486 1 010 718 97 605 430 92 213 332
10 352 103 7 554 28 2 7 010 691 93 x 4 420 436 96 y 111 1612 178 91 2 185 v 43 v 3 042 v 1 760 723 80 1 220 501 79 172 1334 097 117 5 761 15 1 562 1 900 539 98 x 1 700 482 97 110 144
19 192 50 2 731 40 543 20 200 522 95 y 13 050 337 91 106 2301 166 27 2 666 27 1 392 3 220 746 70 x 1 260 292 … 18 357 874 35 19 035 77 738 7 200 319 41 5 250 233 97 80 98
… … 73 632 100 22 729 61 500 417 … 60 500 411 98 90 42… … 5 977 v 295 v 512 v 3 150 298 … 2 750 260 92 28 61
3 153 59 6 035 31 863 3 120 580 90 2 620 487 100 180 1603 450 173 1 360 11 228 805 403 92 710 356 91 302 378
733 36 2 983 v 760 v 947 v 410 206 … 510 257 82 y … 492 920 4 1 553 27 … 11 300 173 49 x 20 900 321 … 43 616 282 13 4 122 26 2 645 45 050 885 … 18 050 355 97 19 18
516 16 6 847 2 088 2 850 264 42 825 256 91 20 20444 v 6 v 3 695 27 796 175 22 … 170 21 … … 36697 13 … 447 … 3 020 568 82 2 570 483 76 30 14
1 223 8 3 780 41 2 180 6 470 400 41 x 3 880 240 92 x … 16420 v 9 v … … … 520 111 45 x 210 45 84 x 13 30… … 3 272 53 … 360 148 … 118 48 29 27 20… … … 2 14 850 144 … 20 3 79 z … 0.5… … … … … 1 225 279 46 y 820 186 94 y … 2 z
… … … … … 10 800 457 61 x 6 400 271 90 x … 11
… … … … … 25 500 1 377 96 10 150 548 96 568 53738 v 12 v … … … 93 299 … 77 248 98 z 77 102 z
… … … … … 1 340 110 43 x 94 8 41 2 2
BOOK PRODUCTION1
Number of titles of non-periodic printed
publications(books and pamphlets)
Radio receivers Television receivers
per 1,000inhabitants
1999
Total(000)
1999
INFORMATION AND COMMUNICATION TECHNOLOGYNATIONAL LIBRARIES1
Registeredusers (000)
1999
Loans to users
(000)
1999
Number ofvolumes (books)
(000)
1999
PCs2
per 1,000inhabitants
2002
Internet users
(estimated)2
per 1,000inhabitants
2002
% ofhouseholds
with atelevision2
2002
per 1,000inhabitants
1997
Total1(000)
1997
% ofhouseholds
with a radio2
2002
per 1,000inhabitants
1997
Total1(000)
1997
1234567891011121314151617181920
2122232425262728293031323334353637383940
414243444546474849
505152
Arab States
Central and Eastern Europe
Central Asia
East Asia and the Pacific
60
02
Education f
or A
ll G
lobal M
onitorin
g R
eport
2 9 0 / A N N E X
Table 2B (continued)
909 75 603 59 1 098 103 284 81 … … …… … … … … … … … …… … … … … … … … …… … … … … … … … …
396 x 4 782 x 23 x 746 7 758 x 37 x 266 v 4 156 v 20 v
110 71 896 566 … … … … … …… … … … … … … … …… … … … … … … … …
10 167 372 7 20 44 188 … …
31 2 191 95 … … … … … …… … … … … … … … …… … … … … … … … …
4 v 400 v 9 v … … … 38 v 3 397 74 v
… … … … … … … … …
28 765 202 123 3 076 813 188 v 5 500 1 479 v
… … … … … … … … …… … … … … … … … …… … … … … … … … …… … … … … … … … …
116 … … 4 708 … … … … …… … … … … … … … …
9 1 096 273 3 115 29 … … …… … … … … … … … …
34 v 11 753 v 197 v … … … … … …
1 … … 1 … … … … …… … … … … … … … …… … … … … … … … …… … … … … … … … …… … … … … … … … …
5 x 450 **,x 6 **,x … … … … … …
… … … … … … … … …… … … … … … … … …
106 1 500 40 … 1 933 v 53 v 113 4 936 133… … … … … … … … …… … … … … … … … …… … … … … … … … …… … … … … … … … …
1 15 … 3 29 … … … …
29 v 788 *,v 99 v 10 v 7 884 v 988 v … … …
465 7 883 46 2 020 … … … … …… … … … … … … … …… … … … … … … … …
53 … … 9 … … … … …
24 x 1 093 x 26 x 4 x 131 x 3 x … … …
6 275 70 27 … … 306 … …
2 600 54 31 923 82 205 1 166 104… … … … … … … … …
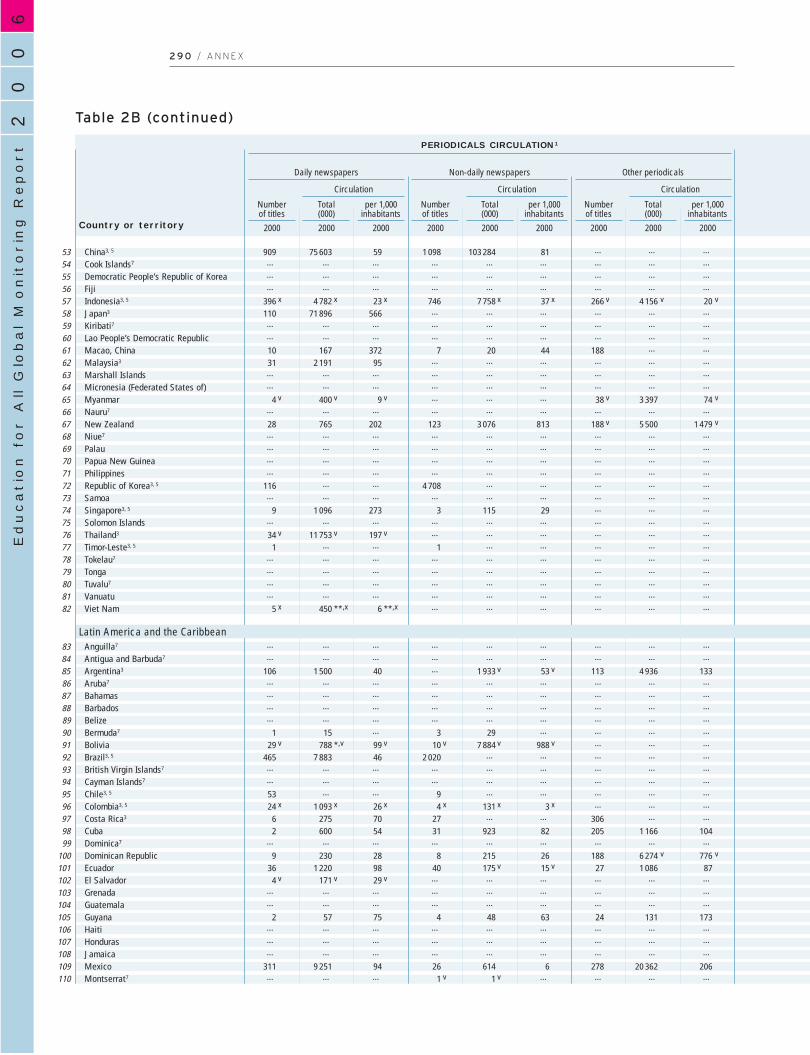
9 230 28 8 215 26 188 6 274 v 776 v
36 1 220 98 40 175 v 15 v 27 1 086 874 v 171 v 29 v … … … … … …
… … … … … … … … …… … … … … … … … …
2 57 75 4 48 63 24 131 173… … … … … … … … …… … … … … … … … …… … … … … … … … …
311 9 251 94 26 614 6 278 20 362 206… … … 1 v 1 v … … … …
China3, 5
Cook Islands7
Democratic People’s Republic of KoreaFijiIndonesia3, 5
Japan3
Kiribati7
Lao People’s Democratic RepublicMacao, ChinaMalaysia3
Marshall IslandsMicronesia (Federated States of)MyanmarNauru7
New ZealandNiue7
PalauPapua New GuineaPhilippinesRepublic of Korea3, 5
SamoaSingapore3, 5
Solomon IslandsThailand3
Timor-Leste3, 5
Tokelau7
TongaTuvalu7
VanuatuViet Nam
Anguilla7
Antigua and Barbuda7
Argentina3
Aruba7
BahamasBarbadosBelizeBermuda7
BoliviaBrazil3, 5
British Virgin Islands7
Cayman Islands7
Chile3, 5
Colombia3, 5
Costa Rica3
CubaDominica7
Dominican RepublicEcuadorEl SalvadorGrenadaGuatemalaGuyanaHaitiHondurasJamaicaMexicoMontserrat7
535455565758596061626364656667686970717273747576777879808182
8384858687888990919293949596979899
100101102103104105106107108109110
Circulation
Daily newspapers
PERIODICALS CIRCULATION1
Number of titles
Total (000)
per 1,000inhabitants
2000 2000 2000
Circulation
Non-daily newspapers
Number of titles
Total (000)
per 1,000inhabitants
2000 2000 2000
Circulation
Other periodicals
Number of titles
Total (000)
per 1,000inhabitants
2000 2000 2000Country or territory
Latin America and the Caribbean

S TAT I S T I C A L A N N E X / 2 9 1
Ta b l e 2 B
… … … … … 417 000 336 … 400 000 322 89 27 46… … … … … 14 … … 4 … … … …… … … … … 3 360 154 … 1 200 55 … … – z
… … … … … 500 636 93 21 27 57 48 60121 0.1 … … … 31 500 155 74 13 750 68 56 12 21… … 7 312 … … 120 500 955 99 x 86 500 686 100 382 449… … … … … 17 … 56 1 … 24 … …… … … … … 730 148 52 x 52 11 30 3 3
340 77 … … … … … 68 x … … 93 200 2505 084 23 … … … 9 100 425 77 y 3 600 168 89 150 327
… … … … … 82 217 … 66 174 … … …… … … … … … … 51 … … 15 … 11
227 0.5 … … … 4 200 92 2 260 6 3 5 0.5… … … … … 7 … … 1 … … … …
5 405 144 … … … 3 750 1 018 99 1 926 523 98 424 496… … … … … 1 … … – … … … …… … … … … … … … … … … … …… … … … … 410 83 25 42 8 9 57 13
1 380 2 … … … 11 500 161 83 3 700 52 76 28 45… … … … … 47 500 1 037 … 15 900 347 92 496 554… … … … … 178 1 057 99 11 62 96 7 23… … 5 420 1 720 24 757 2 550 689 98 x 1 330 360 99 619 502… … … … … 57 143 74 3 6 4 39 5… … … … … 13 959 236 77 y 15 190 257 92 40 77… … … … … 18 22 … – – … … …… … … … … 1 … … – … … … …… … … … … 61 608 … 2 21 … 20 28… … … … … 4 … … – … … … …… … … … … 62 341 … 2 13 6 15 34… … … … … 8 200 109 53 x 3 570 48 83 10 19
… … … … … 3 … … 1 … … … …… … … … … 36 … 90 x 31 … 91 z … …
11 991 v 33 v … … … 24 300 681 81 x 7 950 223 97 z 79 108… … … … … 50 … … 20 … … … …… … … … … 215 736 … 67 229 … … 193… … … … … 237 896 99 y 76 287 93 104 111… … … … … 133 591 80 x 41 183 37 140 120… … … … … 82 … … 66 … … … …… … 125 18 38 5 250 672 85 x 900 115 46 y 22 31
21 689 v 13 v … … … 71 000 430 88 36 500 221 90 74 81… … … … … 9 … … 4 … … … …… … … … … 36 … … 7 … … … …
1 443 10 101 … 447 5 180 354 99 3 150 215 95 115 229… … 429 5 … 21 000 525 … 4 590 115 92 49 46
1 464 v 39 v 825 … 225 980 268 100 x 525 144 84 z 200 195952 9 3 000 9 173 3 900 352 … 2 640 238 … 32 11 z
… … … … … 46 … 87 z 6 … 76 z … …… … … … … 1 440 181 71 x 770 97 77 x … 58
996 8 … … … 4 150 351 … 1 550 131 89 31 42663 v 11 v … … … 2 750 467 … 4 000 679 85 z 25 47… … … … … 113 271 94 y 118 283 94 y … …… … … … … 835 79 80 x 640 61 40 z 14 33… … … … … 420 561 … 46 61 … 31 164… … … … … 415 54 52 38 5 26 … 10… … … … … 2 450 411 74 z 570 96 47 13 25… … … … … 1 215 483 … 460 183 70 54 228
6 952 v 7 v 539 … 29 31 000 329 82 y 25 600 272 94 82 98… … … … … 7 … … 3 … … … …
535455565758596061626364656667686970717273747576777879808182
8384858687888990919293949596979899100101102103104105106107108109110
BOOK PRODUCTION1
Number of titles of non-periodic printed
publications(books and pamphlets)
Radio receivers Television receivers
per 1,000inhabitants
1999
Total(000)
1999
INFORMATION AND COMMUNICATION TECHNOLOGYNATIONAL LIBRARIES1
Registeredusers (000)
1999
Loans to users
(000)
1999
Number ofvolumes (books)
(000)
1999
PCs2
per 1,000inhabitants
2002
Internet users
(estimated)2
per 1,000inhabitants
2002
% ofhouseholds
with atelevision2
2002
per 1,000inhabitants
1997
Total1(000)
1997
% ofhouseholds
with a radio2
2002
per 1,000inhabitants
1997
Total1(000)
1997
Latin America and the Caribbean
60
02
Education f
or A
ll G
lobal M
onitorin
g R
eport
2 9 2 / A N N E X
Table 2B (continued)
… … … … … … … … …… … … … … … … … …… … … … … … … … …… … … … … … … … …
57 v 570 v 23 v … … … 43 v … …… … … … … … … … …… … … … … … … … …… … … … … … … … …
2 v 28 v 67 v 9 v 63 v 152 v 8 v 8 v 20 v
… … … … … … … … …… … … … … … … … …
4 … … … … … … … …… … … … … … … … …
2 … … … … … … … …
16 2 503 309 120 … … 2 685 v … …
29 1 568 153 … … … … … …
104 5 167 168 … … … … … …
8 87 … 38 200 … 50 372 …
33 1 507 283 10 1 415 266 117 … …
55 2 304 445 149 924 178 5 711 … …
84 8 424 142 245 x 2 236 x 38 x … … …
382 23 946 291 25 2 021 25 … … …
207 v … … 14 441 40 … … …
3 91 322 20 57 202 938 **,x … …
6 564 148 61 1 354 355 … … …… … … … … … … … …
89 6 273 109 … … … … … …
5 120 276 10 86 x 200 x … … …
4 v … … 11 v … … 523 v … …… … … … … … … … …
35 4 443 279 49 317 20 … … …
82 2 545 569 70 367 82 … … …
28 1 026 102 242 x 1 134 113 1 065 x 15 762 x 1 577 x
3 v 2 v … 8 v 12 v … … … …
87 4 003 98 11 x 5 371 x 132 x … … …
90 3 627 410 71 382 43 389 22 112 2 497104 2 666 372 120 x 1 190 x 166 x … … …
108 19 159 326 467 6 246 106 … … …
1 476 55 945 196 … … … … … …
… … … … … … … … …… … … … … … … … …… … … … … … … … …
5 221 v 59 023 v 60 v 38 607 v 67 826 v 69 v … … …
112 … … 906 … … … … …… … … … … … … … …… … … 2 288 v … … … … …
306 5 600 39 560 x 1 782 x 13 x 559 x 1 713 12 x
12 536 29 36 1 322 71 … … …
5 **,v 133 **,v 11 **,v … … … … … …
13 x 33 x 5 x 2 x 44 x 7 x 62 x 110 x 18 x
1 **,v 41 **,v 25 **,v … … … … … …
4 **,v 15 **,v 1 **,v … … … … … …
1 15 **,v 2 **,v 5 v 8 v 1 v … … …
2 **,v 92 **,v 6 **,v 12 v 69 v 5 v … … …
Netherlands AntillesNicaraguaPanamaParaguayPeru3
Saint Kitts and Nevis7
Saint LuciaSaint Vincent and the GrenadinesSurinameTrinidad and TobagoTurks and Caicos Islands7
Uruguay3
Venezuela8
Andorra7
Austria3, 5, 9
Belgium3
Canada3
Cyprus7
DenmarkFinland10, 11, 12
France3, 5, 12
Germany3, 5
Greece5, 12
Iceland3, 5
Ireland3, 5, 12
IsraelItaly3
Luxembourg3, 5
MaltaMonaco7
Netherlands3, 5, 12
Norway13
Portugal3, 5
San Marino7
SpainSwedenSwitzerland3
United Kingdom3, 5
United States3
AfghanistanBangladeshBhutanIndia14
Iran, Islamic Republic ofMaldivesNepalPakistan3
Sri Lanka3, 5
AngolaBeninBotswanaBurkina FasoBurundiCameroon5
111112113114115116117118119120121122123
124125126127128129130131132133134135136137138139140141142143144145146147148149
150151152153154155156157158
159160161162163164
Circulation
Daily newspapers
PERIODICALS CIRCULATION1
Number of titles
Total (000)
per 1,000inhabitants
2000 2000 2000
Circulation
Non-daily newspapers
Number of titles
Total (000)
per 1,000inhabitants
2000 2000 2000
Circulation
Other periodicals
Number of titles
Total (000)
per 1,000inhabitants
2000 2000 2000Country or territory
North America and Western Europe
South and West Asia
Sub-Saharan Africa

S TAT I S T I C A L A N N E X / 2 9 3
Ta b l e 2 B
… … … … … 217 1 034 … 69 329 … … 9 x
… … … … … 1 240 265 78 x 320 68 60 z 28 17… … … … … 815 293 83 510 183 77 38 61… … … … … 925 182 … 515 101 69 z 35 17
1 942 v 8 v … … … 6 650 269 74 z 3 060 124 65 z 43 90… … … … … 28 … 90 z 10 … 71 z … …… … … … … 111 775 93 z 32 221 79 z 162 89 z
… … … … … 77 666 … 18 157 … 118 59… … … … … 300 724 79 x 63 152 66 47 z 46… … … … … 680 534 98 z 425 334 88 80 106… … … … … 8 … … – … … … …
674 20 … … … 1 970 603 95 z 782 239 93 z 110 z 119 z
… … … … … 10 750 471 85 4 100 179 83 61 51
173 … … … … 16 … … 27 … … … …… … … … … 6 080 751 87 4 250 525 98 371 412… … … … … 8 075 793 71 z 4 720 463 99 272 330
22 941 75 6 955 5 81 32 300 1 079 99 x 21 500 718 99 z 489 515931 … 66 7 14 310 407 99 248 325 97 243 264
14 455 272 4 617 … 483 6 020 1 143 93 y 3 121 592 97 z 579 51513 173 255 2 150 … 451 7 700 1 498 96 3 200 622 91 443 51139 083 66 … … … 55 300 944 … 34 800 594 95 346 31378 042 v 95 v 34 688 v 169 v … 77 800 948 76 46 500 567 94 432 437
… … … … … 5 020 472 … 2 540 239 98 z 82 1351 796 v 650 v 840 5 83 260 951 97 z 98 359 97 452 649
… … … … … 2 550 692 95 1 470 399 97 423 2821 969 v 34 v … … … 3 070 544 … 1 690 299 93 255 317
32 365 56 13 186 v 592 v 1 081 v 50 500 879 … 30 300 527 97 z 227 346… … 800 45 20 285 683 99 z 163 391 94 593 369
237 v 62 v … … … 255 666 … 280 731 93 257 30672 … … … … 34 … … 25 … … … …… … 2 656 v … … 15 300 978 99 8 100 518 99 470 510
4 985 112 1 841 146 60 4 030 915 99 z 2 030 461 100 533 3102 186 v 22 v 2 684 67 423 v 3 020 303 88 y 3 310 333 100 z 139 199
… … … … … 16 … … 9 … … … …
59 174 146 5 822 v … … 13 100 325 95 z 16 200 402 99 195 19212 547 v 142 v 3 663 v … 130 8 250 931 93 4 600 519 94 627 57818 273 255 3 109 12 98 7 100 991 91 y 3 310 462 100 720 356
110 965 v 190 v 27 900 66 … 84 500 1 454 79 z 30 500 525 98 z 406 423… … … … … 575 000 2 084 99 y 219 000 794 98 653 546
… … … … … 2 750 136 58 z 270 13 6 z … –… … … … … 6 150 48 32 770 6 29 3 1… … … … … 37 19 21 11 6 3 5 5
14 085 v 1 v … … … 116 000 120 35 63 000 65 32 7 1614 783 23 … … … 17 000 265 83 4 610 72 77 72 47
… … … … … 34 128 … 7 28 68 65 49… … … … … 840 38 43 z 130 6 13 z 3 3… … … … … 13 500 102 35 3 100 24 39 4 z 10
4 655 25 … … … 3 850 213 63 1 530 84 32 13 11
… … … … … 630 55 18 150 13 9 2 39 v 0.2 v … … … 620 107 91 60 10 20 2 8
… … … … 237 146 92 31 19 15 40 34… … … … … 370 34 65 100 9 7 2 2… … … … … 440 72 61 25 4 14 0.8 152 * 0.4 … … … 2 270 161 54 450 32 18 6 4
111112113114115116117118119120121122123
124125126127128129130131132133134135136137138139140141142143144145146147148149
150151152153154155156157158
159160161162163164
BOOK PRODUCTION1
Number of titles of non-periodic printed
publications(books and pamphlets)
Radio receivers Television receivers
per 1,000inhabitants
1999
Total(000)
1999
INFORMATION AND COMMUNICATION TECHNOLOGYNATIONAL LIBRARIES1
Registeredusers (000)
1999
Loans to users
(000)
1999
Number ofvolumes (books)
(000)
1999
PCs2
per 1,000inhabitants
2002
Internet users
(estimated)2
per 1,000inhabitants
2002
% ofhouseholds
with atelevision2
2002
per 1,000inhabitants
1997
Total1(000)
1997
% ofhouseholds
with a radio2
2002
per 1,000inhabitants
1997
Total1(000)
1997
North America and Western Europe
South and West Asia
Sub-Saharan Africa
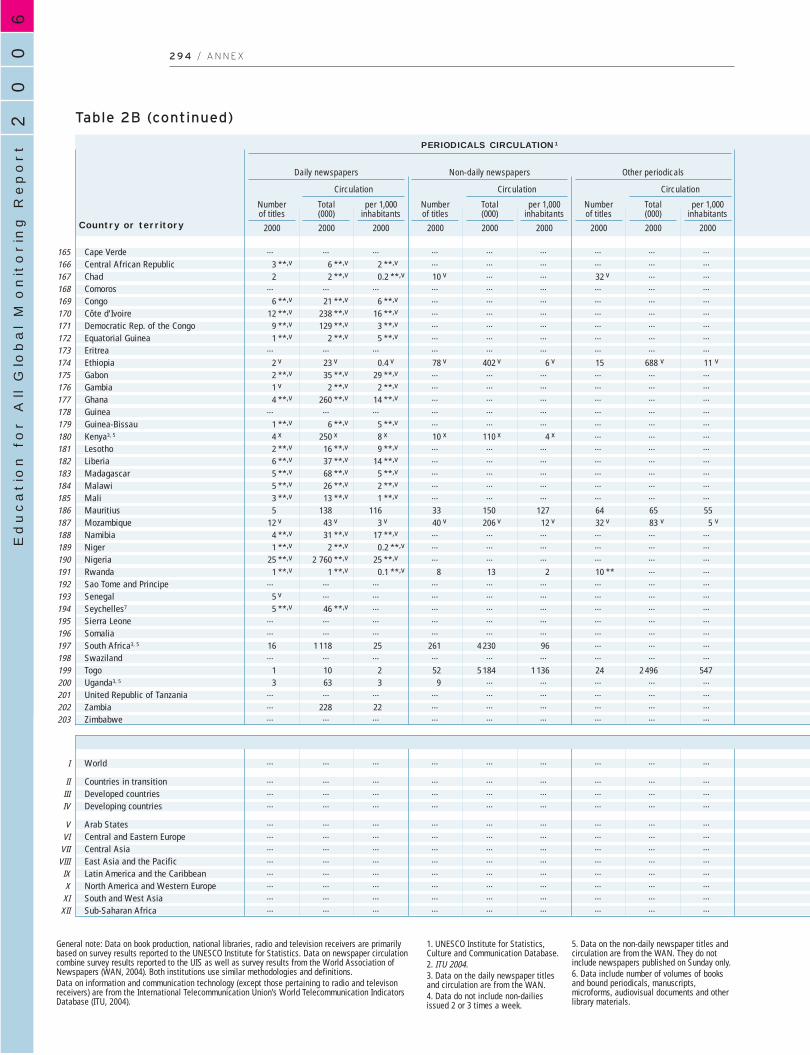
60
02
Education f
or A
ll G
lobal M
onitorin
g R
eport
2 9 4 / A N N E X
Table 2B (continued)
… … … … … … … … …
3 **,v 6 **,v 2 **,v … … … … … …
2 2 **,v 0.2 **,v 10 v … … 32 v … …… … … … … … … … …
6 **,v 21 **,v 6 **,v … … … … … …
12 **,v 238 **,v 16 **,v … … … … … …
9 **,v 129 **,v 3 **,v … … … … … …
1 **,v 2 **,v 5 **,v … … … … … …… … … … … … … … …
2 v 23 v 0.4 v 78 v 402 v 6 v 15 688 v 11 v
2 **,v 35 **,v 29 **,v … … … … … …
1 v 2 **,v 2 **,v … … … … … …
4 **,v 260 **,v 14 **,v … … … … … …… … … … … … … … …
1 **,v 6 **,v 5 **,v … … … … … …
4 x 250 x 8 x 10 x 110 x 4 x … … …
2 **,v 16 **,v 9 **,v … … … … … …
6 **,v 37 **,v 14 **,v … … … … … …
5 **,v 68 **,v 5 **,v … … … … … …
5 **,v 26 **,v 2 **,v … … … … … …
3 **,v 13 **,v 1 **,v … … … … … …
5 138 116 33 150 127 64 65 5512 v 43 v 3 v 40 v 206 v 12 v 32 v 83 v 5 v
4 **,v 31 **,v 17 **,v … … … … … …
1 **,v 2 **,v 0.2 **,v … … … … … …
25 **,v 2 760 **,v 25 **,v … … … … … …
1 **,v 1 **,v 0.1 **,v 8 13 2 10 ** … …… … … … … … … … …
5 v … … … … … … … …
5 **,v 46 **,v … … … … … … …… … … … … … … … …… … … … … … … … …
16 1 118 25 261 4 230 96 … … …… … … … … … … … …
1 10 2 52 5 184 1 136 24 2 496 5473 63 3 9 … … … … …
… … … … … … … … …… 228 22 … … … … … …… … … … … … … … …
… … … … … … … … …
… … … … … … … … …… … … … … … … … …… … … … … … … … …
… … … … … … … … …… … … … … … … … …… … … … … … … … …… … … … … … … … …… … … … … … … … …… … … … … … … … …… … … … … … … … …… … … … … … … … …
Cape VerdeCentral African RepublicChadComorosCongoCôte d’IvoireDemocratic Rep. of the CongoEquatorial GuineaEritreaEthiopiaGabonGambiaGhanaGuineaGuinea-BissauKenya3, 5
LesothoLiberiaMadagascarMalawiMaliMauritiusMozambiqueNamibiaNigerNigeriaRwandaSao Tome and PrincipeSenegalSeychelles7
Sierra LeoneSomaliaSouth Africa3, 5
SwazilandTogoUganda3, 5
United Republic of TanzaniaZambiaZimbabwe
World
Countries in transitionDeveloped countriesDeveloping countries
Arab States Central and Eastern EuropeCentral AsiaEast Asia and the PacificLatin America and the CaribbeanNorth America and Western EuropeSouth and West AsiaSub-Saharan Africa
Circulation
Daily newspapers
PERIODICALS CIRCULATION1
Number of titles
Total (000)
per 1,000inhabitants
2000 2000 2000
Circulation
Non-daily newspapers
Number of titles
Total (000)
per 1,000inhabitants
2000 2000 2000
Circulation
Other periodicals
Number of titles
Total (000)
per 1,000inhabitants
2000 2000 2000Country or territory
1. UNESCO Institute for Statistics,Culture and Communication Database.2. ITU 2004.3. Data on the daily newspaper titlesand circulation are from the WAN. 4. Data do not include non-dailiesissued 2 or 3 times a week.
5. Data on the non-daily newspaper titles andcirculation are from the WAN. They do notinclude newspapers published on Sunday only.6. Data include number of volumes of booksand bound periodicals, manuscripts,microforms, audiovisual documents and otherlibrary materials.
165166167168169170171172173174175176177178179180181182183184185186187188189190191192193194195196197198199200201202203
I
IIIIIIV
VVI
VIIVIII
IXX
XIXII
General note: Data on book production, national libraries, radio and television receivers are primarilybased on survey results reported to the UNESCO Institute for Statistics. Data on newspaper circulationcombine survey results reported to the UIS as well as survey results from the World Association ofNewspapers (WAN, 2004). Both institutions use similar methodologies and definitions. Data on information and communication technology (except those pertaining to radio and televisonreceivers) are from the International Telecommunication Union’s World Telecommunication IndicatorsDatabase (ITU, 2004).
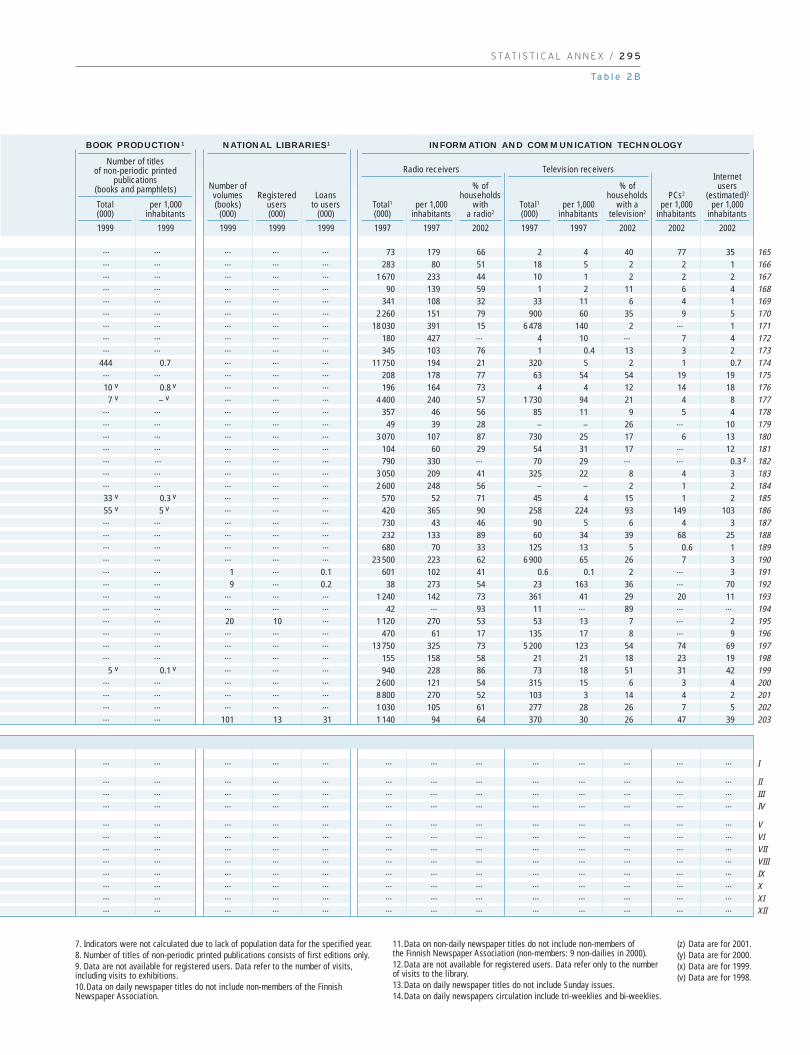
S TAT I S T I C A L A N N E X / 2 9 5
Ta b l e 2 B
… … … … … 73 179 66 2 4 40 77 35… … … … … 283 80 51 18 5 2 2 1… … … … … 1 670 233 44 10 1 2 2 2… … … … … 90 139 59 1 2 11 6 4… … … … … 341 108 32 33 11 6 4 1… … … … … 2 260 151 79 900 60 35 9 5… … … … … 18 030 391 15 6 478 140 2 … 1… … … … … 180 427 … 4 10 … 7 4… … … … … 345 103 76 1 0.4 13 3 2
444 0.7 … … … 11 750 194 21 320 5 2 1 0.7… … … … … 208 178 77 63 54 54 19 1910 v 0.8 v … … … 196 164 73 4 4 12 14 18
7 v – v … … … 4 400 240 57 1 730 94 21 4 8… … … … … 357 46 56 85 11 9 5 4… … … … … 49 39 28 – – 26 … 10… … … … … 3 070 107 87 730 25 17 6 13… … … … … 104 60 29 54 31 17 … 12… … … … … 790 330 … 70 29 … … 0.3 z
… … … … … 3 050 209 41 325 22 8 4 3… … … … … 2 600 248 56 – – 2 1 233 v 0.3 v … … … 570 52 71 45 4 15 1 255 v 5 v … … … 420 365 90 258 224 93 149 103… … … … … 730 43 46 90 5 6 4 3… … … … … 232 133 89 60 34 39 68 25… … … … … 680 70 33 125 13 5 0.6 1… … … … … 23 500 223 62 6 900 65 26 7 3… … 1 … 0.1 601 102 41 0.6 0.1 2 … 3… … 9 … 0.2 38 273 54 23 163 36 … 70… … … … … 1 240 142 73 361 41 29 20 11… … … … … 42 … 93 11 … 89 … …… … 20 10 … 1 120 270 53 53 13 7 … 2… … … … … 470 61 17 135 17 8 … 9… … … … … 13 750 325 73 5 200 123 54 74 69… … … … … 155 158 58 21 21 18 23 19
5 v 0.1 v … … … 940 228 86 73 18 51 31 42… … … … … 2 600 121 54 315 15 6 3 4… … … … … 8 800 270 52 103 3 14 4 2… … … … … 1 030 105 61 277 28 26 7 5… … 101 13 31 1 140 94 64 370 30 26 47 39
… … … … … … … … … … … … …
… … … … … … … … … … … … …… … … … … … … … … … … … …… … … … … … … … … … … … …
… … … … … … … … … … … … …… … … … … … … … … … … … …… … … … … … … … … … … … …… … … … … … … … … … … … …… … … … … … … … … … … … …… … … … … … … … … … … … …… … … … … … … … … … … … …… … … … … … … … … … … … …
BOOK PRODUCTION1
Number of titles of non-periodic printed
publications(books and pamphlets)
Radio receivers Television receivers
per 1,000inhabitants
1999
Total(000)
1999
INFORMATION AND COMMUNICATION TECHNOLOGYNATIONAL LIBRARIES1
Registeredusers (000)
1999
Loans to users
(000)
1999
Number ofvolumes (books)
(000)
1999
PCs2
per 1,000inhabitants
2002
Internet users
(estimated)2
per 1,000inhabitants
2002
% ofhouseholds
with atelevision2
2002
per 1,000inhabitants
1997
Total1(000)
1997
% ofhouseholds
with a radio2
2002
per 1,000inhabitants
1997
Total1(000)
1997
165166167168169170171172173174175176177178179180181182183184185186187188189190191192193194195196197198199200201202203
I
IIIIIIV
VVIVIIVIIIIXXXIXII
7. Indicators were not calculated due to lack of population data for the specified year.8. Number of titles of non-periodic printed publications consists of first editions only.9. Data are not available for registered users. Data refer to the number of visits,including visits to exhibitions.10.Data on daily newspaper titles do not include non-members of the FinnishNewspaper Association.
11.Data on non-daily newspaper titles do not include non-members of the Finnish Newspaper Association (non-members: 9 non-dailies in 2000).12.Data are not available for registered users. Data refer only to the numberof visits to the library.13.Data on daily newspaper titles do not include Sunday issues.14.Data on daily newspapers circulation include tri-weeklies and bi-weeklies.
(z) Data are for 2001.(y) Data are for 2000.(x) Data are for 1999.(v) Data are for 1998.

60
02
Education f
or A
ll G
lobal M
onitorin
g R
eport
2 9 6 / A N N E X
Table 3Early childhood care and education (ECCE)
4-5 2.5 2.5 2.5 1.01 3.8 3.8 3.8 0.99 … … … …
3-5 32.9 33.7 32.0 0.95 36.7 37.7 35.5 0.94 35.8 36.6 34.9 0.953-5 0.4 0.4 0.5 1.50 1.2 1.2 1.2 0.99 1.2 1.2 1.2 0.994-5 10.1 10.4 9.8 0.95 13.7 14.1 13.3 0.95 12.5 12.9 12.1 0.944-5 5.2 5.3 5.2 0.98 3.8 3.9 3.8 0.98 … … … …
4-5 28.6 29.9 27.2 0.91 30.4 31.5 29.2 0.93 28.0 28.9 26.9 0.934-5 78.3 77.8 78.8 1.01 69.9 70.0 69.8 1.00 58.4 58.4 58.4 1.003-5 66.0 66.9 65.0 0.97 74.8 75.4 74.1 0.98 72.4 72.7 72.0 0.994-5 5.0 5.0 ** 4.9 ** 0.98** 7.8** 8.0** 7.7 ** 0.96 ** … … … …
3-5 … … … … 1.9 … … … … … … …
4-5 64.3 83.9 44.0 0.52 56.1 69.1 42.5 0.62 49.2 60.3 37.7 0.624-5 5.6 6.0 5.2 0.87 5.5 5.9 5.0 0.84 4.7 5.1 4.3 0.834-5 39.9 40.6 39.1 0.97 27.4 27.9 26.8 0.96 22.7 23.5 22.0 0.943-5 25.6 26.0 25.3 0.98 33.9 35.3 32.4 0.92 30.6 31.8 29.3 0.923-5 5.1 5.4 4.9 0.91 4.9 5.0** 4.7 ** 0.94 ** 4.9 5.0 ** 4.7 ** 0.94**4-5 21.3 … … … 26.6 28.4 24.6 0.86 26.6 28.4 24.6 0.863-5 8.4 8.8 7.9 0.90 10.5 10.9 10.2 0.94 10.5 10.9 10.2 0.943-5 13.5 13.9 13.2 0.95 21.6** 21.7** 21.5 ** 0.99 ** 21.6** 21.7 ** 21.5 ** 0.99**4-5 61.6 62.4 60.8 0.97 75.3 75.8 74.8 0.99 54.9 55.3 54.5 0.983-5 0.7 0.7 0.6 0.87 0.7 0.7 0.7 0.93 0.5** 0.5 ** 0.4 ** 0.94**
3-5 41.7 ** 40.0 ** 43.5 ** 1.09** 47.0 46.4 47.7 1.03 47.0 46.4 47.7 1.033-5 81.2 84.5 77.7 0.92 101.9 102.7 101.0 0.98 91.7 92.1 91.2 0.993-5 … … … … … … … … … … … …
3-6 64.3 64.7 63.8 0.99 75.5 76.3 74.8 0.98 70.9 71.6 70.1 0.983-6 41.1 41.6 40.6 0.98 45.5 46.1 44.9 0.97 44.5 45.1 43.9 0.973-5 90.5 87.8 93.4 1.06 102.0 102.1 101.9 1.00 80.4 80.4 80.3 1.003-6 86.8 87.5 86.0 0.98 112.9 113.1 112.5 0.99 90.1 89.9 90.4 1.013-6 79.4 80.1 78.6 0.98 80.5 81.5 79.4 0.97 79.3 80.2 78.4 0.983-6 50.9 52.1 49.6 0.95 74.3 76.5 72.0 0.94 72.0 73.8 70.1 0.953-6 50.2 51.0 49.4 0.97 58.3 59.1 57.4 0.97 56.4 56.9 55.8 0.983-6 49.8 49.7 50.0 1.01 50.6 50.5 50.6 1.00 49.4 49.3 49.5 1.003-6 40.3 41.1 39.5 0.96 46.9 47.5 46.2 0.97 44.5 45.1 43.8 0.973-6 61.8 61.1 62.6 1.02 76.4 75.2 77.6 1.03 76.4 75.2 77.6 1.034-6 … … … … 93.9 96.6** 91.1 ** 0.94 ** … … … …
3-6 44.1 44.3 43.8 0.99 43.7y 43.5y 44.0 y 1.01 y 42.7y 42.4 y 43.0 y 1.01 y
3-5 81.7 … … … 86.9 87.9 85.8 0.98 68.1 68.3 68.0 1.003-6 72.0 75.3 68.6 0.91 67.7 69.0 66.3 0.96 67.7 69.0 66.3 0.963-6 27.3 27.2 27.5 1.01 28.5 28.3 28.7 1.01 26.8 26.5 27.0 1.023-5 6.0 6.2 5.8 0.94 7.6 7.8 7.3 0.94 … … … …
3-5 47.5 47.9 47.1 0.98 76.4 77.2 75.4 0.98 37.9 38.1 37.6 0.99
3-6 … … … … 34.6 33.5 35.7 1.07 … … … …
3-5 20.9 22.0 19.6 0.89 24.6 24.6 24.6 1.00 16.8 16.7 17.1 1.023-5 35.4 35.6 35.3 0.99 42.7 41.4 44.0 1.06 30.3 29.1 31.6 1.093-6 13.9 14.3 13.6 0.95 29.4 29.7 29.1 0.98 28.5 28.7 28.2 0.993-6 10.5 11.8 9.2 0.78 11.3 11.6 11.1 0.95 8.2 8.4 8.0 0.953-7 24.7 22.4 27.1 1.21 33.8 31.6 36.0 1.14 30.8 … … …
3-6 8.5 9.6 7.3 0.76 10.1 10.4 9.8 0.94 9.0 9.3 8.8 0.943-6 … … … … … … … … … … … …
3-6 … … … … 28.1 29.0 27.1 0.94 21.6 22.3 ** 20.8 ** 0.94**
4-4 … … … … 101.7 101.5 101.8 1.00 49.9 49.7 50.0 1.013-5 50.6 50.0 51.3 1.03 48.5 48.3 48.6 1.01 … … … …
3-5 5.2 ** 5.1 ** 5.3 ** 1.03** 7.0 6.8 7.2 1.05 6.3 6.2 6.5 1.054-6 37.9 38.5 37.2 0.97 36.4 37.8 34.9 0.92 24.5** … … …
4-4 … … … … … … … … … … … …
AlgeriaBahrainDjiboutiEgyptIraqJordanKuwaitLebanonLibyan Arab JamahiriyaMauritaniaMoroccoOmanPalestinian A. T.QatarSaudi ArabiaSudanSyrian Arab RepublicTunisiaUnited Arab EmiratesYemen
AlbaniaBelarusBosnia and HerzegovinaBulgariaCroatiaCzech RepublicEstoniaHungaryLatviaLithuaniaPolandRepublic of MoldovaRomaniaRussian FederationSerbia and Montenegro1
SlovakiaSloveniaTFYR MacedoniaTurkeyUkraine
ArmeniaAzerbaijanGeorgiaKazakhstanKyrgyzstanMongoliaTajikistanTurkmenistanUzbekistan
AustraliaBrunei DarussalamCambodiaChinaCook Islands
GROSS ENROLMENT RATIO (GER)IN PRE-PRIMARY EDUCATION (%)
NET ENROLMENT RATIO (GER)IN PRE-PRIMARY EDUCATION (%)
Agegroup
2002/
2002/2003
Total Male Female
1998/1999
Total Male Female GPI(F/M)2003
GPI(F/M)
2002/2003
Total Male Female GPI(F/M)Country or territory
123456789
1011121314151617181920
2122232425262728293031323334353637383940
414243444546474849
5051525354
Arab States
Central and Eastern Europe
Central Asia
East Asia and the Pacific

S TAT I S T I C A L A N N E X / 2 9 7
Ta b l e 3
… … … … … … … … … … … 3.9 3.9 3.8… … … … 38.8 40.0 37.5 0.94 … … … 70.5 65.9 75.2
0.4 0.4 0.5 1.50 1.2 1.2 1.2 0.99 … … … 2.7 y 2.2 y 3.5 y
… … … … … … … … … … … … … …… … … … … … … … … … … … … …… … … … … … … … … … … 44.2 46.2 42.1… … … … … … … … 87.2 87.8 86.5 84.1 84.4 83.7… … … … … … … … … … … 94.0 93.9 94.1… … … … … … … … … … … … … …… … … … … … … … … … … … … …
65.4 84.9 45.1 0.53 57.2 70.4 43.6 0.62 … … … … … …… … … … … … … … … … … … … …… … … … … … … … … … … 76.4 y 81.0 y 71.6 y
… … … … … … … … … … … … … …… … … … … … … … … … … … … …
21.3 … … … 26.6 28.4 24.6 0.86 … … … 45.6 45.6 45.6… … … … … … … … … … … 12.1 12.0 12.3… … … … … … … … … … … … … …… … … … … … … … … … … 74.2 74.0 74.3… … … … … … … … 1.6 1.5 1.6 … … …
41.7 ** 40.0 ** 43.5 ** 1.09 ** 47.0 46.4 47.7 1.03 … … … … … …… … … … … … … … … … … … … …… … … … … … … … … … … … … …
64.3 64.7 63.8 0.99 75.5 76.3 74.8 0.98 … … … … … …… … … … … … … … … … … 98.0 * 98.0 * 98.0 *90.5 87.8 93.4 1.06 102.0 102.1 101.9 1.00 … … … … … …
86.8 87.5 86.0 0.98 112.9 113.1 112.5 0.99 … … … … … …… … … … … … … … … … … … … …
50.9 52.1 49.6 0.95 74.3 76.5 72.0 0.94 … … … … … …
55.5 56.3 54.6 0.97 58.3 59.1 57.4 0.97 … … … … … …
49.8 49.7 50.0 1.01 50.6 50.5 50.6 1.00 … … … … … …… … … … … … … … … … … … … …
61.8 61.1 62.6 1.02 76.4 75.2 77.6 1.03 … … … … … …… … … … … … … … … … … … … …… … … … … … … … … … … … … …… … … … … … … … … … … … … …… … … … … … … … … … … … … …
31.0 30.9 31.2 1.01 31.3 31.2 31.5 1.01 … … … … … …
6.0 6.2 5.8 0.94 7.6 7.8 7.3 0.94 … … … … … …… … … … … … … … 38.9 … … 45.8 z … …
… … … … … … … … … … … … … …
21.1 22.4 19.8 0.89 24.9 25.0 24.9 1.00 … … … 8.8 8.5 9.2… … … … … … … … … … … … … …… … … … … … … … … … … … … …… … … … … … … … 8.7 * 9.7 * 7.6 * 7.7 7.5 7.8… … … … … … … … … … … … … …… … … … … … … … … … … … … …… … … … … … … … … … … … … …… … … … … … … … … … … … … …
… … … … 101.7 101.5 101.8 1.00 … … … … … …… … … … … … … … 88.2 * 86.5 * 90.1 * 87.7 87.8 87.6… … … … … … … … … … … 11.9 10.7 13.2… … … … … … … … … … … … … …… … … … … … … … … … … … … …
NEW ENTRANTS TO THE FIRST GRADE OF PRIMARY EDUCATION WITH ECCE EXPERIENCE (%)
GROSS ENROLMENT RATIO (GER) IN PRE-PRIMARY EDUCATION AND OTHER ECCE PROGRAMMES (%)
1998/1999 2002/2003 1998/1999 2002/2003
Total Male Female GPI Total Male Female GPI Total Male Female Total Male Female(F/M)(F/M)
1234567891011121314151617181920
2122232425262728293031323334353637383940
414243444546474849
5051525354
Arab States
Central and Eastern Europe
Central Asia
East Asia and the Pacific
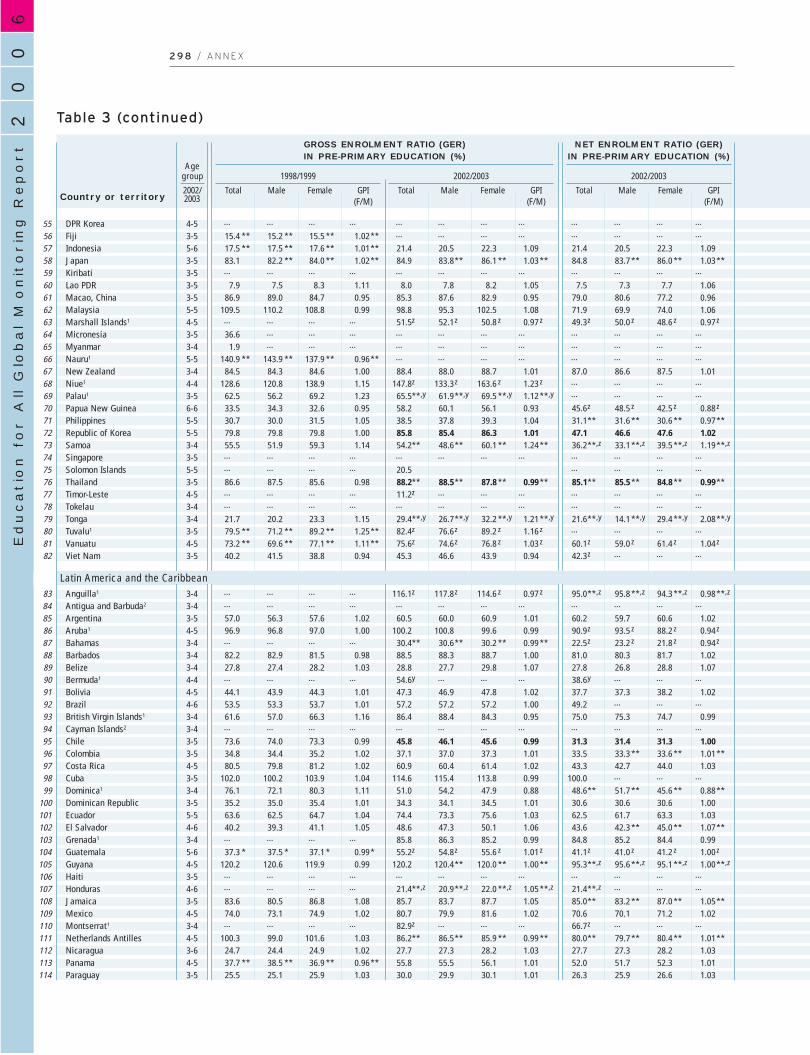
60
02
Education f
or A
ll G
lobal M
onitorin
g R
eport
2 9 8 / A N N E X
Table 3 (continued)
4-5 … … … … … … … … … … … …
3-5 15.4 ** 15.2 ** 15.5 ** 1.02** … … … … … … … …
5-6 17.5 ** 17.5 ** 17.6 ** 1.01** 21.4 20.5 22.3 1.09 21.4 20.5 22.3 1.093-5 83.1 82.2 ** 84.0 ** 1.02** 84.9 83.8** 86.1 ** 1.03 ** 84.8 83.7 ** 86.0 ** 1.03**3-5 … … … … … … … … … … … …
3-5 7.9 7.5 8.3 1.11 8.0 7.8 8.2 1.05 7.5 7.3 7.7 1.063-5 86.9 89.0 84.7 0.95 85.3 87.6 82.9 0.95 79.0 80.6 77.2 0.965-5 109.5 110.2 108.8 0.99 98.8 95.3 102.5 1.08 71.9 69.9 74.0 1.064-5 … … … … 51.5z 52.1z 50.8 z 0.97 z 49.3z 50.0 z 48.6 z 0.97 z
3-5 36.6 … … … … … … … … … … …
3-4 1.9 … … … … … … … … … … …
5-5 140.9 ** 143.9 ** 137.9 ** 0.96** … … … … … … … …
3-4 84.5 84.3 84.6 1.00 88.4 88.0 88.7 1.01 87.0 86.6 87.5 1.014-4 128.6 120.8 138.9 1.15 147.8z 133.3z 163.6 z 1.23 z … … … …
3-5 62.5 56.2 69.2 1.23 65.5**,y 61.9**,y 69.5 **,y 1.12 **,y … … … …
6-6 33.5 34.3 32.6 0.95 58.2 60.1 56.1 0.93 45.6z 48.5 z 42.5 z 0.88 z
5-5 30.7 30.0 31.5 1.05 38.5 37.8 39.3 1.04 31.1** 31.6 ** 30.6 ** 0.97**5-5 79.8 79.8 79.8 1.00 85.8 85.4 86.3 1.01 47.1 46.6 47.6 1.023-4 55.5 51.9 59.3 1.14 54.2** 48.6** 60.1 ** 1.24 ** 36.2**,z 33.1 **,z 39.5 **,z 1.19**,z
3-5 … … … … … … … … … … … …
5-5 … … … … 20.5 … … … …
3-5 86.6 87.5 85.6 0.98 88.2** 88.5** 87.8 ** 0.99 ** 85.1** 85.5 ** 84.8 ** 0.99**4-5 … … … … 11.2z … … … … … … …
3-4 … … … … … … … … … … … …
3-4 21.7 20.2 23.3 1.15 29.4**,y 26.7**,y 32.2 **,y 1.21 **,y 21.6**,y 14.1 **,y 29.4 **,y 2.08**,y
3-5 79.5 ** 71.2 ** 89.2 ** 1.25** 82.4z 76.6z 89.2 z 1.16 z … … … …
4-5 73.2 ** 69.6 ** 77.1 ** 1.11** 75.6z 74.6z 76.8 z 1.03 z 60.1z 59.0 z 61.4 z 1.04 z
3-5 40.2 41.5 38.8 0.94 45.3 46.6 43.9 0.94 42.3z … … …
3-4 … … … … 116.1z 117.8z 114.6 z 0.97 z 95.0**,z 95.8 **,z 94.3 **,z 0.98**,z
3-4 … … … … … … … … … … … …
3-5 57.0 56.3 57.6 1.02 60.5 60.0 60.9 1.01 60.2 59.7 60.6 1.024-5 96.9 96.8 97.0 1.00 100.2 100.8 99.6 0.99 90.9z 93.5 z 88.2 z 0.94 z
3-4 … … … … 30.4** 30.6** 30.2 ** 0.99 ** 22.5z 23.2 z 21.8 z 0.94 z
3-4 82.2 82.9 81.5 0.98 88.5 88.3 88.7 1.00 81.0 80.3 81.7 1.023-4 27.8 27.4 28.2 1.03 28.8 27.7 29.8 1.07 27.8 26.8 28.8 1.074-4 … … … … 54.6y … … … 38.6y … … …
4-5 44.1 43.9 44.3 1.01 47.3 46.9 47.8 1.02 37.7 37.3 38.2 1.024-6 53.5 53.3 53.7 1.01 57.2 57.2 57.2 1.00 49.2 … … …
3-4 61.6 57.0 66.3 1.16 86.4 88.4 84.3 0.95 75.0 75.3 74.7 0.993-4 … … … … … … … … … … … …
3-5 73.6 74.0 73.3 0.99 45.8 46.1 45.6 0.99 31.3 31.4 31.3 1.003-5 34.8 34.4 35.2 1.02 37.1 37.0 37.3 1.01 33.5 33.3 ** 33.6 ** 1.01**4-5 80.5 79.8 81.2 1.02 60.9 60.4 61.4 1.02 43.3 42.7 44.0 1.033-5 102.0 100.2 103.9 1.04 114.6 115.4 113.8 0.99 100.0 … … …
3-4 76.1 72.1 80.3 1.11 51.0 54.2 47.9 0.88 48.6** 51.7 ** 45.6 ** 0.88**3-5 35.2 35.0 35.4 1.01 34.3 34.1 34.5 1.01 30.6 30.6 30.6 1.005-5 63.6 62.5 64.7 1.04 74.4 73.3 75.6 1.03 62.5 61.7 63.3 1.034-6 40.2 39.3 41.1 1.05 48.6 47.3 50.1 1.06 43.6 42.3 ** 45.0 ** 1.07**3-4 … … … … 85.8 86.3 85.2 0.99 84.8 85.2 84.4 0.995-6 37.3 * 37.5 * 37.1 * 0.99* 55.2z 54.8z 55.6 z 1.01 z 41.1z 41.0 z 41.2 z 1.00 z
4-5 120.2 120.6 119.9 0.99 120.2 120.4** 120.0 ** 1.00 ** 95.3**,z 95.6 **,z 95.1 **,z 1.00**,z
3-5 … … … … … … … … … … … …
4-6 … … … … 21.4**,z 20.9**,z 22.0 **,z 1.05 **,z 21.4**,z … … …
3-5 83.6 80.5 86.8 1.08 85.7 83.7 87.7 1.05 85.0** 83.2 ** 87.0 ** 1.05**4-5 74.0 73.1 74.9 1.02 80.7 79.9 81.6 1.02 70.6 70.1 71.2 1.023-4 … … … … 82.9z … … … 66.7z … … …
4-5 100.3 99.0 101.6 1.03 86.2** 86.5** 85.9 ** 0.99 ** 80.0** 79.7 ** 80.4 ** 1.01**3-6 24.7 24.4 24.9 1.02 27.7 27.3 28.2 1.03 27.7 27.3 28.2 1.034-5 37.7 ** 38.5 ** 36.9 ** 0.96** 55.8 55.5 56.1 1.01 52.0 51.7 52.3 1.013-5 25.5 25.1 25.9 1.03 30.0 29.9 30.1 1.01 26.3 25.9 26.6 1.03
DPR KoreaFijiIndonesiaJapanKiribatiLao PDRMacao, ChinaMalaysiaMarshall Islands1
MicronesiaMyanmarNauru1
New ZealandNiue1
Palau1
Papua New GuineaPhilippinesRepublic of KoreaSamoaSingaporeSolomon IslandsThailandTimor-LesteTokelauTongaTuvalu1
VanuatuViet Nam
Anguilla1
Antigua and Barbuda2
ArgentinaAruba1
BahamasBarbadosBelizeBermuda1
BoliviaBrazilBritish Virgin Islands1
Cayman Islands2
ChileColombiaCosta RicaCubaDominica1
Dominican RepublicEcuadorEl SalvadorGrenada1
GuatemalaGuyanaHaitiHondurasJamaicaMexicoMontserrat1
Netherlands AntillesNicaraguaPanamaParaguay
GROSS ENROLMENT RATIO (GER)IN PRE-PRIMARY EDUCATION (%)
NET ENROLMENT RATIO (GER)IN PRE-PRIMARY EDUCATION (%)
Agegroup
2002/
2002/2003
Total Male Female
1998/1999
Total Male Female GPI(F/M)
GPI(F/M)
2002/2003
Total Male Female GPI(F/M)Country or territory
55565758596061626364656667686970717273747576777879808182
8384858687888990919293949596979899
100101102103104105106107108109110111112113114
2003
Latin America and the Caribbean

S TAT I S T I C A L A N N E X / 2 9 9
Ta b l e 3
… … … … … … … … … … … … … …… … … … … … … … … … … … … …… … … … … … … … … … … … … …… … … … … … … … … … … … … …… … … … … … … … … … … … … …… … … … … … … … … … … 7.9 7.2 8.6… … … … … … … … 96.4 96.6 96.2 96.0 96.2 95.8… … … … … … … … … … … 78.4 76.0 80.9… … … … … … … … … … … … … …… … … … … … … … … … … … … …… … … … … … … … … … … … … …… … … … … … … … … … … … … …
84.5 84.3 84.6 1.00 88.4 88.0 88.7 1.01 … … … … … …… … … … … … … … … … … … … …… … … … … … … … … … … … … …… … … … … … … … … … … 43.8 z 42.8 z 45.1 z
… … … … … … … … … … … 56.8 56.5 57.1… … … … 85.8 85.4 86.3 1.01 … … … … … …… … … … … … … … … … … 59.9 y 55.6 y 64.6 y
… … … … … … … … … … … … … …… … … … … … … … … … … … … …… … … … … … … … … … … … … …… … … … … … … … … … … … … …… … … … … … … … … … … … … …… … … … … … … … … … … … … …… … … … … … … … – – – … … …… … … … … … … … … … … … … …… … … … … … … … … … … … … …
… … … … … … … … 100.0 100.0 100.0 100.0 z 100.0 z 100.0 z
… … … … … … … … … … … … … …… … … … … … … … … … … 89.1 88.8 89.4… … … … … … … … 84.9 84.7 85.1 88.8 88.7 89.0… … … … … … … … … … … … … …… … … … … … … … … … … 100.0 100.0 100.0… … … … … … … … … … … … … …… … … … … … … … … … … 50.4 y 45.6 y 54.8 y
44.1 43.9 44.3 1.01 47.3 46.9 47.8 1.02 … … … 59.9 59.9 60.0… … … … … … … … … … … … … …… … … … … … … … … … … 79.6 72.1 88.9… … … … … … … … … … … 89.3 z 90.5 z 88.1 z
… … … … … … … … … … … … … …… … … … … … … … … … … … … …… … … … … … … … … … … 85.1 84.8 85.3… … … … … … … … … … … 99.5 99.5 99.4… … … … … … … … … … … 100.0 100.0 100.035.2 35.0 35.4 1.01 34.3 34.1 34.5 1.01 … … … … … …… … … … … … … … … … … 53.2 52.0 54.4… … … … … … … … … … … … … …… … … … … … … … … … … … … …… … … … … … … … … … … 79.9 78.4 81.6… … … … … … … … … … … … … …… … … … … … … … … … … … … …… … … … … … … … … … … … … …… … … … … … … … … … … … … …
74.0 73.1 74.9 1.02 80.7 79.9 81.6 1.02 … … … … … …… … … … … … … … … … … … … …… … … … … … … … 100.0 ** 100.0 ** 100.0 ** … … …… … … … … … … … … … … 38.9 * 37.6 * 40.3 *… … … … … … … … … … … 61.0 59.6 62.6… … … … … … … … … … … 74.0 72.5 75.5
NEW ENTRANTS TO THE FIRST GRADE OF PRIMARY EDUCATION WITH ECCE EXPERIENCE (%)
GROSS ENROLMENT RATIO (GER) IN PRE-PRIMARY EDUCATION AND OTHER ECCE PROGRAMMES (%)
1998/1999 2002/2003 1998/1999 2002/2003
Total Male Female GPI Total Male Female GPI Total Male Female Total Male Female(F/M)(F/M)
55565758596061626364656667686970717273747576777879808182
8384858687888990919293949596979899100101102103104105106107108109110111112113114
Latin America and the Caribbean
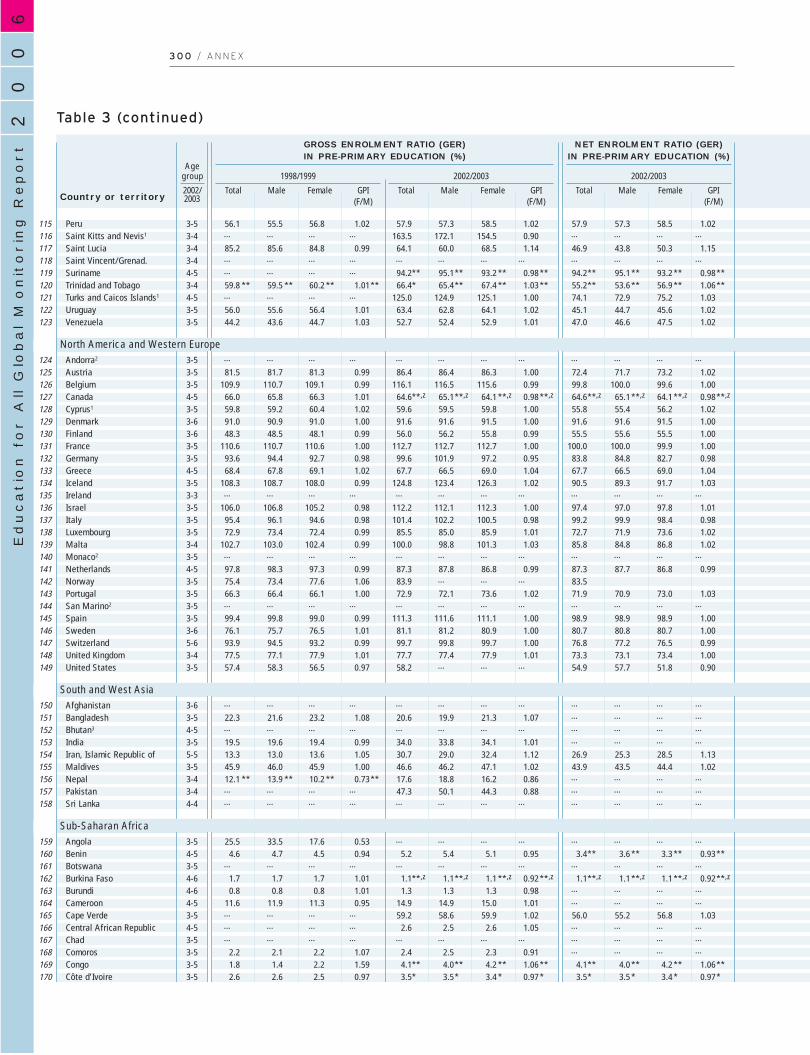
60
02
Education f
or A
ll G
lobal M
onitorin
g R
eport
3 0 0 / A N N E X
Table 3 (continued)
3-5 56.1 55.5 56.8 1.02 57.9 57.3 58.5 1.02 57.9 57.3 58.5 1.023-4 … … … … 163.5 172.1 154.5 0.90 … … … …
3-4 85.2 85.6 84.8 0.99 64.1 60.0 68.5 1.14 46.9 43.8 50.3 1.153-4 … … … … … … … … … … … …
4-5 … … … … 94.2** 95.1** 93.2 ** 0.98 ** 94.2** 95.1 ** 93.2 ** 0.98**3-4 59.8 ** 59.5 ** 60.2 ** 1.01** 66.4* 65.4** 67.4 ** 1.03 ** 55.2** 53.6 ** 56.9 ** 1.06**4-5 … … … … 125.0 124.9 125.1 1.00 74.1 72.9 75.2 1.033-5 56.0 55.6 56.4 1.01 63.4 62.8 64.1 1.02 45.1 44.7 45.6 1.023-5 44.2 43.6 44.7 1.03 52.7 52.4 52.9 1.01 47.0 46.6 47.5 1.02
3-5 … … … … … … … … … … … …
3-5 81.5 81.7 81.3 0.99 86.4 86.4 86.3 1.00 72.4 71.7 73.2 1.023-5 109.9 110.7 109.1 0.99 116.1 116.5 115.6 0.99 99.8 100.0 99.6 1.004-5 66.0 65.8 66.3 1.01 64.6**,z 65.1**,z 64.1 **,z 0.98 **,z 64.6**,z 65.1 **,z 64.1 **,z 0.98**,z
3-5 59.8 59.2 60.4 1.02 59.6 59.5 59.8 1.00 55.8 55.4 56.2 1.023-6 91.0 90.9 91.0 1.00 91.6 91.6 91.5 1.00 91.6 91.6 91.5 1.003-6 48.3 48.5 48.1 0.99 56.0 56.2 55.8 0.99 55.5 55.6 55.5 1.003-5 110.6 110.7 110.6 1.00 112.7 112.7 112.7 1.00 100.0 100.0 99.9 1.003-5 93.6 94.4 92.7 0.98 99.6 101.9 97.2 0.95 83.8 84.8 82.7 0.984-5 68.4 67.8 69.1 1.02 67.7 66.5 69.0 1.04 67.7 66.5 69.0 1.043-5 108.3 108.7 108.0 0.99 124.8 123.4 126.3 1.02 90.5 89.3 91.7 1.033-3 … … … … … … … … … … … …
3-5 106.0 106.8 105.2 0.98 112.2 112.1 112.3 1.00 97.4 97.0 97.8 1.013-5 95.4 96.1 94.6 0.98 101.4 102.2 100.5 0.98 99.2 99.9 98.4 0.983-5 72.9 73.4 72.4 0.99 85.5 85.0 85.9 1.01 72.7 71.9 73.6 1.023-4 102.7 103.0 102.4 0.99 100.0 98.8 101.3 1.03 85.8 84.8 86.8 1.023-5 … … … … … … … … … … … …
4-5 97.8 98.3 97.3 0.99 87.3 87.8 86.8 0.99 87.3 87.7 86.8 0.993-5 75.4 73.4 77.6 1.06 83.9 … … … 83.53-5 66.3 66.4 66.1 1.00 72.9 72.1 73.6 1.02 71.9 70.9 73.0 1.033-5 … … … … … … … … … … … …
3-5 99.4 99.8 99.0 0.99 111.3 111.6 111.1 1.00 98.9 98.9 98.9 1.003-6 76.1 75.7 76.5 1.01 81.1 81.2 80.9 1.00 80.7 80.8 80.7 1.005-6 93.9 94.5 93.2 0.99 99.7 99.8 99.7 1.00 76.8 77.2 76.5 0.993-4 77.5 77.1 77.9 1.01 77.7 77.4 77.9 1.01 73.3 73.1 73.4 1.003-5 57.4 58.3 56.5 0.97 58.2 … … … 54.9 57.7 51.8 0.90
3-6 … … … … … … … … … … … …
3-5 22.3 21.6 23.2 1.08 20.6 19.9 21.3 1.07 … … … …
4-5 … … … … … … … … … … … …
3-5 19.5 19.6 19.4 0.99 34.0 33.8 34.1 1.01 … … … …
5-5 13.3 13.0 13.6 1.05 30.7 29.0 32.4 1.12 26.9 25.3 28.5 1.133-5 45.9 46.0 45.9 1.00 46.6 46.2 47.1 1.02 43.9 43.5 44.4 1.023-4 12.1 ** 13.9 ** 10.2 ** 0.73** 17.6 18.8 16.2 0.86 … … … …
3-4 … … … … 47.3 50.1 44.3 0.88 … … … …
4-4 … … … … … … … … … … … …
3-5 25.5 33.5 17.6 0.53 … … … … … … … …
4-5 4.6 4.7 4.5 0.94 5.2 5.4 5.1 0.95 3.4** 3.6 ** 3.3 ** 0.93**3-5 … … … … … … … … … … … …
4-6 1.7 1.7 1.7 1.01 1.1**,z 1.1**,z 1.1 **,z 0.92 **,z 1.1**,z 1.1 **,z 1.1 **,z 0.92**,z
4-6 0.8 0.8 0.8 1.01 1.3 1.3 1.3 0.98 … … … …
4-5 11.6 11.9 11.3 0.95 14.9 14.9 15.0 1.01 … … … …
3-5 … … … … 59.2 58.6 59.9 1.02 56.0 55.2 56.8 1.034-5 … … … … 2.6 2.5 2.6 1.05 … … … …
3-5 … … … … … … … … … … … …
3-5 2.2 2.1 2.2 1.07 2.4 2.5 2.3 0.91 … … … …
3-5 1.8 1.4 2.2 1.59 4.1** 4.0** 4.2 ** 1.06 ** 4.1** 4.0 ** 4.2 ** 1.06**3-5 2.6 2.6 2.5 0.97 3.5* 3.5* 3.4 * 0.97 * 3.5* 3.5 * 3.4 * 0.97*
PeruSaint Kitts and Nevis1
Saint LuciaSaint Vincent/Grenad.SurinameTrinidad and TobagoTurks and Caicos Islands1
UruguayVenezuela
Andorra2
AustriaBelgiumCanadaCyprus1
DenmarkFinlandFranceGermanyGreeceIcelandIrelandIsraelItalyLuxembourgMaltaMonaco2
NetherlandsNorwayPortugalSan Marino2
SpainSwedenSwitzerlandUnited KingdomUnited States
AfghanistanBangladeshBhutan3
IndiaIran, Islamic Republic ofMaldivesNepalPakistanSri Lanka
AngolaBeninBotswanaBurkina FasoBurundiCameroonCape VerdeCentral African RepublicChadComorosCongoCôte d’Ivoire
GROSS ENROLMENT RATIO (GER)IN PRE-PRIMARY EDUCATION (%)
NET ENROLMENT RATIO (GER)IN PRE-PRIMARY EDUCATION (%)
Agegroup
2002/
2002/2003
Total Male Female
1998/1999
Total Male Female GPI(F/M)
GPI(F/M)
2002/2003
Total Male Female GPI(F/M)Country or territory
115116117118119120121122123
124125126127128129130131132133134135136137138139140141142143144145146147148149
150151152153154155156157158
159160161162163164165166167168169170
2003
North America and Western Europe
South and West Asia
Sub-Saharan Africa

S TAT I S T I C A L A N N E X / 3 0 1
Ta b l e 3
… … … … … … … … … … … … … …… … … … 189.6 197.9 181.1 0.91 … … … … … …… … … … … … … … … … … … … …… … … … … … … … … … … … … …… … … … … … … … … … … … … …… … … … … … … … … … … 77.5 76.3 78.8… … … … … … … … … … … 100.0 100.0 100.0… … … … … … … … … … … 95.0 95.0 95.052.8 52.4 53.2 1.02 56.6 56.3 56.8 1.01 … … … … … …
… … … … … … … … … … … … … …… … … … … … … … … … … … … …
109.9 110.7 109.1 0.99 116.1 116.5 115.6 0.99 … … … … … …
66.0 65.8 66.3 1.01 64.6 **,z 65.1 **,z 64.1 **,z 0.98 **,z … … … … … …… … … … … … … … … … … … … …
91.0 90.9 91.0 1.00 91.6 91.6 91.5 1.00 … … … … … …
48.3 48.5 48.1 0.99 56.0 56.2 55.8 0.99 … … … … … …
110.6 110.7 110.6 1.00 112.7 112.7 112.7 1.00 … … … … … …
93.6 94.4 92.7 0.98 99.6 101.9 97.2 0.95 … … … … … …
68.4 67.8 69.1 1.02 67.7 66.5 69.0 1.04 … … … … … …
108.3 108.7 108.0 0.99 124.8 123.4 126.3 1.02 … … … … … …
5.6 … … … … … … … … … … … … …
106.0 106.8 105.2 0.98 112.2 112.1 112.3 1.00 … … … … … …
95.4 96.1 94.6 0.98 101.4 102.2 100.5 0.98 … … … … … …
72.9 73.4 72.4 0.99 85.5 85.0 85.9 1.01 … … … … … …
102.7 103.0 102.4 0.99 100.0 98.8 101.3 1.03 … … … … … …… … … … … … … … … … … … … …
97.8 98.3 97.3 0.99 87.3 87.8 86.8 0.99 … … … … … …
75.4 73.4 77.6 1.06 83.9 … … … … … … … … …
66.3 66.4 66.1 1.00 72.9 72.1 73.6 1.02 … … … … … …… … … … … … … … … … … … … …
99.4 99.8 99.0 0.99 111.3 111.6 111.1 1.00 … … … … … …
76.1 75.7 76.5 1.01 81.1 81.2 80.9 1.00 … … … … … …
93.9 94.5 93.2 0.99 99.7 99.8 99.7 1.00 … … … … … …
77.5 77.1 77.9 1.01 77.7 77.4 77.9 1.01 … … … … … …
57.4 58.3 56.5 0.97 58.2 61.7 54.6 0.88 … … … … … …
… … … … … … … … … … … … … …… … … … … … … … … … … 23.3 24.3 22.3… … … … … … … … … … … … … …… … … … … … … … … … … … … …… … … … … … … … … … … 21.3 ** 21.4 ** 21.2 **… … … … … … … … … … … 90.0 90.5 89.5… … … … … … … … … … … 9.6 8.7 10.6… … … … … … … … … … … … … …… … … … … … … … … … … … … …
… … … … … … … … … … … … … …
4.6 4.7 4.5 0.94 5.9 6.1 5.8 0.95 … … … … … …… … … … … … … … … … … … … …… … … … … … … … … … … 4.1 y 3.7 y 4.7 y
… … … … … … … … … … … 2.7 z 2.4 z 3.1 z
11.6 11.9 11.3 0.95 14.9 14.9 15.0 1.01 … … … … … …… … … … 59.2 58.6 59.9 1.02 … … … 73.5 71.9 75.2… … … … 2.6 2.5 2.6 1.05 … … … … … …… … … … … … … … … … … … … …… … … … … … … … … … … … … …
1.8 1.4 2.2 1.59 4.1 ** 4.0 ** 4.2 ** 1.06 ** … … … 13.5 13.1 13.92.6 2.6 2.5 0.97 3.5 * 3.5 * 3.4 * 0.97 * … … … 11.4 **,y 10.5 **,y 12.6 **,y
NEW ENTRANTS TO THE FIRST GRADE OF PRIMARY EDUCATION WITH ECCE EXPERIENCE (%)
GROSS ENROLMENT RATIO (GER) IN PRE-PRIMARY EDUCATION AND OTHER ECCE PROGRAMMES (%)
1998/1999 2002/2003 1998/1999 2002/2003
Total Male Female GPI Total Male Female GPI Total Male Female Total Male Female(F/M)(F/M)
115116117118119120121122123
124125126127128129130131132133134135136137138139140141142143144145146147148149
150151152153154155156157158
159160161162163164165166167168169170
North America and Western Europe
South and West Asia
Sub-Saharan Africa
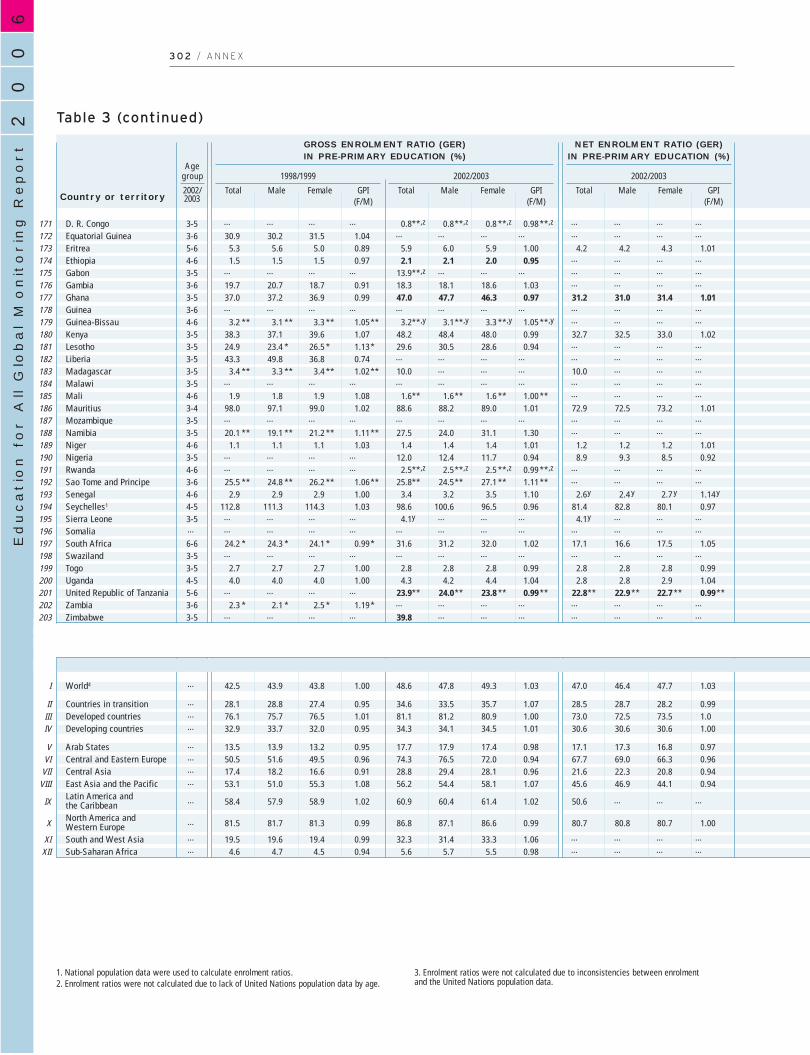
60
02
Education f
or A
ll G
lobal M
onitorin
g R
eport
3 0 2 / A N N E X
Table 3 (continued)
3-5 … … … … 0.8**,z 0.8**,z 0.8 **,z 0.98 **,z … … … …
3-6 30.9 30.2 31.5 1.04 … … … … … … … …
5-6 5.3 5.6 5.0 0.89 5.9 6.0 5.9 1.00 4.2 4.2 4.3 1.014-6 1.5 1.5 1.5 0.97 2.1 2.1 2.0 0.95 … … … …
3-5 … … … … 13.9**,z … … … … … … …
3-6 19.7 20.7 18.7 0.91 18.3 18.1 18.6 1.03 … … … …
3-5 37.0 37.2 36.9 0.99 47.0 47.7 46.3 0.97 31.2 31.0 31.4 1.013-6 … … … … … … … … … … … …
4-6 3.2 ** 3.1 ** 3.3 ** 1.05** 3.2**,y 3.1**,y 3.3 **,y 1.05 **,y … … … …
3-5 38.3 37.1 39.6 1.07 48.2 48.4 48.0 0.99 32.7 32.5 33.0 1.023-5 24.9 23.4 * 26.5 * 1.13* 29.6 30.5 28.6 0.94 … … … …
3-5 43.3 49.8 36.8 0.74 … … … … … … … …
3-5 3.4 ** 3.3 ** 3.4 ** 1.02** 10.0 … … … 10.0 … … …
3-5 … … … … … … … … … … … …
4-6 1.9 1.8 1.9 1.08 1.6** 1.6** 1.6 ** 1.00 ** … … … …
3-4 98.0 97.1 99.0 1.02 88.6 88.2 89.0 1.01 72.9 72.5 73.2 1.013-5 … … … … … … … … … … … …
3-5 20.1 ** 19.1 ** 21.2 ** 1.11** 27.5 24.0 31.1 1.30 … … … …
4-6 1.1 1.1 1.1 1.03 1.4 1.4 1.4 1.01 1.2 1.2 1.2 1.013-5 … … … … 12.0 12.4 11.7 0.94 8.9 9.3 8.5 0.924-6 … … … … 2.5**,z 2.5**,z 2.5 **,z 0.99 **,z … … … …
3-6 25.5 ** 24.8 ** 26.2 ** 1.06** 25.8** 24.5** 27.1 ** 1.11 ** … … … …
4-6 2.9 2.9 2.9 1.00 3.4 3.2 3.5 1.10 2.6y 2.4 y 2.7 y 1.14 y
4-5 112.8 111.3 114.3 1.03 98.6 100.6 96.5 0.96 81.4 82.8 80.1 0.973-5 … … … … 4.1y … … … 4.1y … … …… … … … … … … … … … … … …
6-6 24.2 * 24.3 * 24.1 * 0.99* 31.6 31.2 32.0 1.02 17.1 16.6 17.5 1.053-5 … … … … … … … … … … … …
3-5 2.7 2.7 2.7 1.00 2.8 2.8 2.8 0.99 2.8 2.8 2.8 0.994-5 4.0 4.0 4.0 1.00 4.3 4.2 4.4 1.04 2.8 2.8 2.9 1.045-6 … … … … 23.9** 24.0** 23.8 ** 0.99 ** 22.8** 22.9 ** 22.7 ** 0.99**3-6 2.3 * 2.1 * 2.5 * 1.19* … … … … … … … …
3-5 … … … … 39.8 … … … … … … …
… 42.5 43.9 43.8 1.00 48.6 47.8 49.3 1.03 47.0 46.4 47.7 1.03
… 28.1 28.8 27.4 0.95 34.6 33.5 35.7 1.07 28.5 28.7 28.2 0.99… 76.1 75.7 76.5 1.01 81.1 81.2 80.9 1.00 73.0 72.5 73.5 1.0… 32.9 33.7 32.0 0.95 34.3 34.1 34.5 1.01 30.6 30.6 30.6 1.00
… 13.5 13.9 13.2 0.95 17.7 17.9 17.4 0.98 17.1 17.3 16.8 0.97… 50.5 51.6 49.5 0.96 74.3 76.5 72.0 0.94 67.7 69.0 66.3 0.96… 17.4 18.2 16.6 0.91 28.8 29.4 28.1 0.96 21.6 22.3 20.8 0.94… 53.1 51.0 55.3 1.08 56.2 54.4 58.1 1.07 45.6 46.9 44.1 0.94
… 58.4 57.9 58.9 1.02 60.9 60.4 61.4 1.02 50.6 … … …
… 81.5 81.7 81.3 0.99 86.8 87.1 86.6 0.99 80.7 80.8 80.7 1.00
… 19.5 19.6 19.4 0.99 32.3 31.4 33.3 1.06 … … … …… 4.6 4.7 4.5 0.94 5.6 5.7 5.5 0.98 … … … …
D. R. CongoEquatorial GuineaEritreaEthiopiaGabonGambiaGhanaGuineaGuinea-BissauKenyaLesothoLiberiaMadagascarMalawiMaliMauritiusMozambiqueNamibiaNigerNigeriaRwandaSao Tome and PrincipeSenegalSeychelles1
Sierra LeoneSomaliaSouth AfricaSwazilandTogoUgandaUnited Republic of TanzaniaZambiaZimbabwe
World4
Countries in transitionDeveloped countriesDeveloping countries
Arab States Central and Eastern EuropeCentral AsiaEast Asia and the PacificLatin America and the CaribbeanNorth America and Western EuropeSouth and West AsiaSub-Saharan Africa
GROSS ENROLMENT RATIO (GER)IN PRE-PRIMARY EDUCATION (%)
NET ENROLMENT RATIO (GER)IN PRE-PRIMARY EDUCATION (%)
Agegroup
2002/
2002/2003
Total Male Female
1998/1999
Total Male Female GPI(F/M)
GPI(F/M)
2002/2003
Total Male Female GPI(F/M)Country or territory
171172173174175176177178179180181182183184185186187188189190191192193194195196197198199200201202203
I
IIIIIIV
VVI
VIIVIII
IX
X
XIXII
1. National population data were used to calculate enrolment ratios.2. Enrolment ratios were not calculated due to lack of United Nations population data by age.
3. Enrolment ratios were not calculated due to inconsistencies between enrolmentand the United Nations population data.
2003

S TAT I S T I C A L A N N E X / 3 0 3
Ta b l e 3
… … … … … … … … … … … … … …
30.9 30.2 31.5 1.04 … … … … … … … … … …
5.3 5.6 5.0 0.89 5.9 6.0 5.9 1.00 … … … … … …… … … … … … … … … … … … … …… … … … … … … … … … … … … …… … … … … … … … … … … … … …… … … … … … … … … … … … … …… … … … … … … … … … … … … …
3.2 ** 3.1 ** 3.3 ** 1.05 3.2 **,y 3.1 **,y 3.3 **,y 1.05 **,y … … … … … …… … … … … … … … … … … … … …
24.9 23.4 * 26.5 * 1.13 * 29.6 30.5 28.6 0.94 … … … … … …… … … … … … … … … … … … … …… … … … … … … … … … … … … …… … … … … … … … … … … … … …… … … … … … … … … … … … … …
98.0 97.1 99.0 1.02 88.6 88.2 89.0 1.01 … … … 100.0 y 100.0 y 100.0 y
… … … … … … … … … … … … … …… … … … … … … … … … … … … …
1.1 1.1 1.1 1.03 1.4 1.4 1.4 1.01 … … … 19.0 18.9 19.2… … … … … … … … … … … … … …… … … … … … … … … … … … … …… … … … … … … … … … … … … …… … … … 3.4 3.2 3.6 1.10 … … … … … …
112.8 111.3 114.3 1.03 98.6 100.6 96.5 0.96 … … … 100.0 100.0 100.0… … … … … … … … … … … … … …… … … … … … … … … … … … … …… … … … … … … … … … … … … …… … … … … … … … … … … … … …
2.7 2.7 2.7 1.00 2.8 2.8 2.8 0.99 … … … 1.9 y 1.7 y 2.1 y
… … … … … … … … … … … … … …… … … … … … … … … … … … … …… … … … … … … … … … … 12.8 12.1 13.5… … … … … … … … … … … … … …
… … … … … … … … … … … … … …
… … … … … … … … … … … … … …… … … … … … … … … … … … … …… … … … … … … … … … … … … …
… … … … … … … … … … … … … …… … … … … … … … … … … … … …… … … … … … … … … … … … … …… … … … … … … … … … … … … …
… … … … … … … … … … … … … …
… … … … … … … … … … … … … …
… … … … … … … … … … … … … …… … … … … … … … … … … … … …
NEW ENTRANTS TO THE FIRST GRADE OF PRIMARY EDUCATION WITH ECCE EXPERIENCE (%)
GROSS ENROLMENT RATIO (GER) IN PRE-PRIMARY EDUCATION AND OTHER ECCE PROGRAMMES (%)
1998/1999 2002/2003 1998/1999 2002/2003
Total Male Female GPI Total Male Female GPI Total Male Female Total Male Female(F/M)(F/M)
171172173174175176177178179180181182183184185186187188189190191192193194195196197198199200201202203
I
IIIIIIV
VVIVIIVIII
IX
X
XIXII
4. All values shown are medians.Data in bold are for 2003/2004.
(z) Data are for 2001/2002.(y) Data are for 2000/2001.
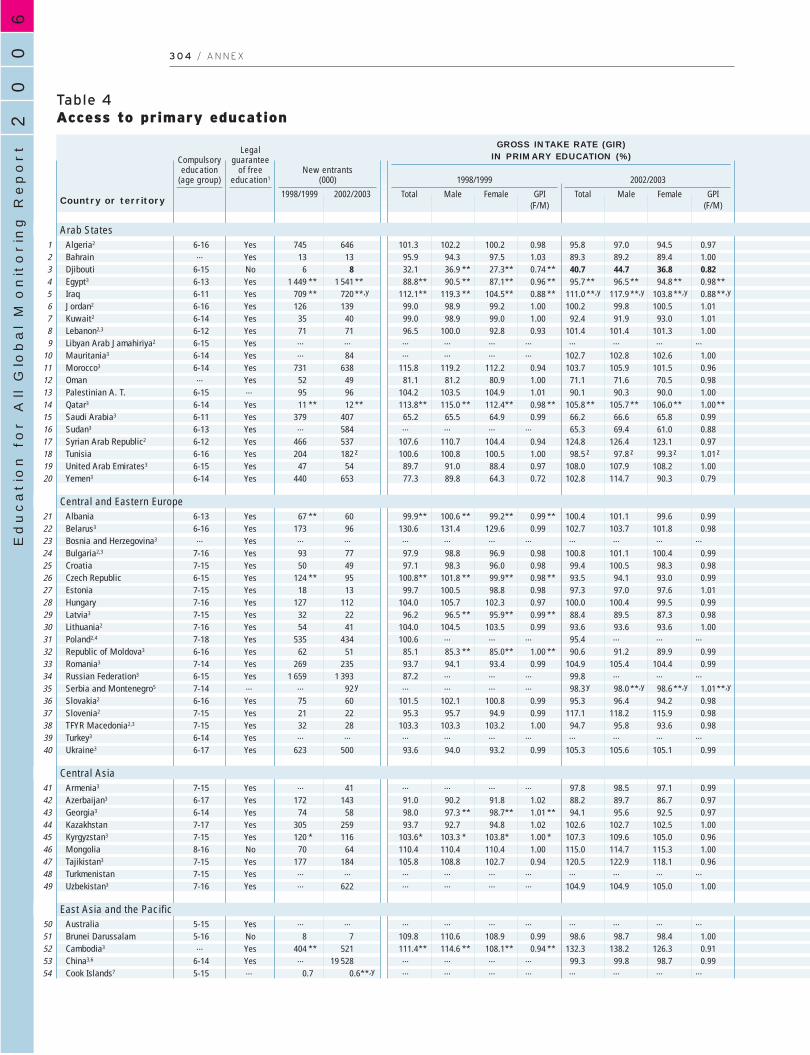
60
02
Education f
or A
ll G
lobal M
onitorin
g R
eport
3 0 4 / A N N E X
Table 4Access to primary education
6-16 Yes 745 646 101.3 102.2 100.2 0.98 95.8 97.0 94.5 0.97… Yes 13 13 95.9 94.3 97.5 1.03 89.3 89.2 89.4 1.00
6-15 No 6 8 32.1 36.9 ** 27.3** 0.74 ** 40.7 44.7 36.8 0.826-13 Yes 1 449 ** 1 541 ** 88.8** 90.5 ** 87.1** 0.96 ** 95.7 ** 96.5 ** 94.8 ** 0.98**6-11 Yes 709 ** 720 **,y 112.1** 119.3 ** 104.5** 0.88 ** 111.0 **,y 117.9 **,y 103.8 **,y 0.88**,y
6-16 Yes 126 139 99.0 98.9 99.2 1.00 100.2 99.8 100.5 1.016-14 Yes 35 40 99.0 98.9 99.0 1.00 92.4 91.9 93.0 1.016-12 Yes 71 71 96.5 100.0 92.8 0.93 101.4 101.4 101.3 1.006-15 Yes … … … … … … … … … …
6-14 Yes … 84 … … … … 102.7 102.8 102.6 1.006-14 Yes 731 638 115.8 119.2 112.2 0.94 103.7 105.9 101.5 0.96… Yes 52 49 81.1 81.2 80.9 1.00 71.1 71.6 70.5 0.98
6-15 … 95 96 104.2 103.5 104.9 1.01 90.1 90.3 90.0 1.006-14 Yes 11 ** 12 ** 113.8** 115.0 ** 112.4** 0.98 ** 105.8 ** 105.7 ** 106.0 ** 1.00**6-11 Yes 379 407 65.2 65.5 64.9 0.99 66.2 66.6 65.8 0.996-13 Yes … 584 … … … … 65.3 69.4 61.0 0.886-12 Yes 466 537 107.6 110.7 104.4 0.94 124.8 126.4 123.1 0.976-16 Yes 204 182 z 100.6 100.8 100.5 1.00 98.5 z 97.8 z 99.3 z 1.01 z
6-15 Yes 47 54 89.7 91.0 88.4 0.97 108.0 107.9 108.2 1.006-14 Yes 440 653 77.3 89.8 64.3 0.72 102.8 114.7 90.3 0.79
6-13 Yes 67 ** 60 99.9** 100.6 ** 99.2** 0.99 ** 100.4 101.1 99.6 0.996-16 Yes 173 96 130.6 131.4 129.6 0.99 102.7 103.7 101.8 0.98… Yes … … … … … … … … … …
7-16 Yes 93 77 97.9 98.8 96.9 0.98 100.8 101.1 100.4 0.997-15 Yes 50 49 97.1 98.3 96.0 0.98 99.4 100.5 98.3 0.986-15 Yes 124 ** 95 100.8** 101.8 ** 99.9** 0.98 ** 93.5 94.1 93.0 0.997-15 Yes 18 13 99.7 100.5 98.8 0.98 97.3 97.0 97.6 1.017-16 Yes 127 112 104.0 105.7 102.3 0.97 100.0 100.4 99.5 0.997-15 Yes 32 22 96.2 96.5 ** 95.9** 0.99 ** 88.4 89.5 87.3 0.987-16 Yes 54 41 104.0 104.5 103.5 0.99 93.6 93.6 93.6 1.007-18 Yes 535 434 100.6 … … … 95.4 … … …
6-16 Yes 62 51 85.1 85.3 ** 85.0** 1.00 ** 90.6 91.2 89.9 0.997-14 Yes 269 235 93.7 94.1 93.4 0.99 104.9 105.4 104.4 0.996-15 Yes 1 659 1 393 87.2 … … … 99.8 … … …
7-14 … … 92 y … … … … 98.3 y 98.0 **,y 98.6 **,y 1.01**,y
6-16 Yes 75 60 101.5 102.1 100.8 0.99 95.3 96.4 94.2 0.987-15 Yes 21 22 95.3 95.7 94.9 0.99 117.1 118.2 115.9 0.987-15 Yes 32 28 103.3 103.3 103.2 1.00 94.7 95.8 93.6 0.986-14 Yes … … … … … … … … … …
6-17 Yes 623 500 93.6 94.0 93.2 0.99 105.3 105.6 105.1 0.99
7-15 Yes … 41 … … … … 97.8 98.5 97.1 0.996-17 Yes 172 143 91.0 90.2 91.8 1.02 88.2 89.7 86.7 0.976-14 Yes 74 58 98.0 97.3 ** 98.7** 1.01 ** 94.1 95.6 92.5 0.977-17 Yes 305 259 93.7 92.7 94.8 1.02 102.6 102.7 102.5 1.007-15 Yes 120 * 116 103.6* 103.3 * 103.8* 1.00 * 107.3 109.6 105.0 0.968-16 No 70 64 110.4 110.4 110.4 1.00 115.0 114.7 115.3 1.007-15 Yes 177 184 105.8 108.8 102.7 0.94 120.5 122.9 118.1 0.967-15 Yes … … … … … … … … … …
7-16 Yes … 622 … … … … 104.9 104.9 105.0 1.00
5-15 Yes … … … … … … … … … …
5-16 No 8 7 109.8 110.6 108.9 0.99 98.6 98.7 98.4 1.00… Yes 404 ** 521 111.4** 114.6 ** 108.1** 0.94 ** 132.3 138.2 126.3 0.91
6-14 Yes … 19 528 … … … … 99.3 99.8 98.7 0.995-15 … 0.7 0.6**,y … … … … … … … …
Algeria2
BahrainDjiboutiEgypt3
IraqJordan2
Kuwait2
Lebanon2,3
Libyan Arab Jamahiriya2
Mauritania3
Morocco3
OmanPalestinian A. T.Qatar3
Saudi Arabia3
Sudan3
Syrian Arab Republic2
TunisiaUnited Arab Emirates3
Yemen3
AlbaniaBelarus3
Bosnia and Herzegovina3
Bulgaria2,3
CroatiaCzech RepublicEstoniaHungaryLatvia3
Lithuania2
Poland2,4
Republic of Moldova3
Romania3
Russian Federation3
Serbia and Montenegro5
Slovakia2
Slovenia2
TFYR Macedonia2,3
Turkey3
Ukraine3
Armenia3
Azerbaijan3
Georgia3
KazakhstanKyrgyzstan3
MongoliaTajikistan3
TurkmenistanUzbekistan3
AustraliaBrunei DarussalamCambodia3
China3,6
Cook Islands7
GROSS INTAKE RATE (GIR)IN PRIMARY EDUCATION (%)Compulsory
education(age group)
Legalguarantee
of freeeducation1
New entrants(000)
1998/1999 2002/2003
1998/1999
Country or territoryMale Female
(F/M)Total GPI Male Female
(F/M)Total GPI
2002/2003
123456789
1011121314151617181920
2122232425262728293031323334353637383940
414243444546474849
5051525354
Arab States
Central and Eastern Europe
Central Asia
East Asia and the Pacific
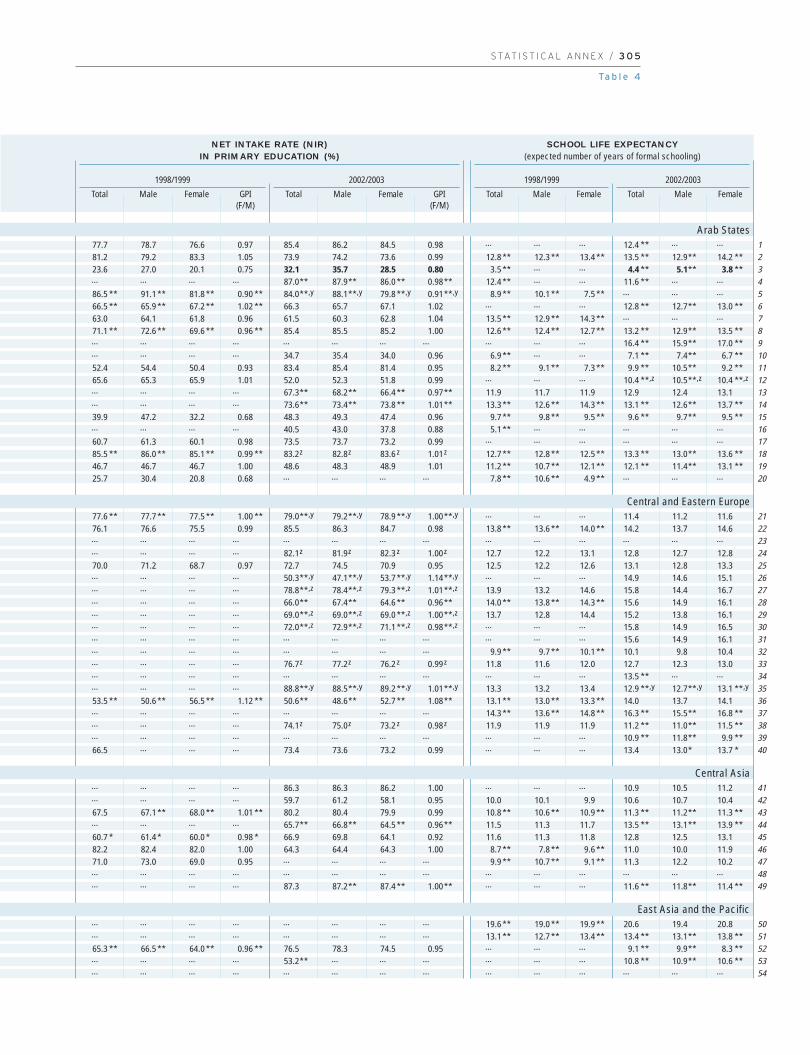
S TAT I S T I C A L A N N E X / 3 0 5
Ta b l e 4
77.7 78.7 76.6 0.97 85.4 86.2 84.5 0.98 … … … 12.4 ** … …
81.2 79.2 83.3 1.05 73.9 74.2 73.6 0.99 12.8 ** 12.3 ** 13.4 ** 13.5 ** 12.9** 14.2 **23.6 27.0 20.1 0.75 32.1 35.7 28.5 0.80 3.5 ** … … 4.4 ** 5.1** 3.8 **… … … … 87.0** 87.9** 86.0 ** 0.98** 12.4 ** … … 11.6 ** … …
86.5 ** 91.1 ** 81.8 ** 0.90 ** 84.0**,y 88.1**,y 79.8 **,y 0.91**,y 8.9 ** 10.1 ** 7.5 ** … … …
66.5 ** 65.9 ** 67.2 ** 1.02 ** 66.3 65.7 67.1 1.02 … … … 12.8 ** 12.7** 13.0 **63.0 64.1 61.8 0.96 61.5 60.3 62.8 1.04 13.5 ** 12.9 ** 14.3 ** … … …
71.1 ** 72.6 ** 69.6 ** 0.96 ** 85.4 85.5 85.2 1.00 12.6 ** 12.4 ** 12.7 ** 13.2 ** 12.9** 13.5 **… … … … … … … … … … … 16.4 ** 15.9** 17.0 **… … … … 34.7 35.4 34.0 0.96 6.9 ** … … 7.1 ** 7.4** 6.7 **52.4 54.4 50.4 0.93 83.4 85.4 81.4 0.95 8.2 ** 9.1 ** 7.3 ** 9.9 ** 10.5** 9.2 **65.6 65.3 65.9 1.01 52.0 52.3 51.8 0.99 … … … 10.4 **,z 10.5**,z 10.4 **,z
… … … … 67.3** 68.2** 66.4 ** 0.97** 11.9 11.7 11.9 12.9 12.4 13.1… … … … 73.6** 73.4** 73.8 ** 1.01** 13.3 ** 12.6 ** 14.3 ** 13.1 ** 12.6** 13.7 **39.9 47.2 32.2 0.68 48.3 49.3 47.4 0.96 9.7 ** 9.8 ** 9.5 ** 9.6 ** 9.7** 9.5 **… … … … 40.5 43.0 37.8 0.88 5.1 ** … … … … …
60.7 61.3 60.1 0.98 73.5 73.7 73.2 0.99 … … … … … …
85.5 ** 86.0 ** 85.1 ** 0.99 ** 83.2z 82.8z 83.6 z 1.01 z 12.7 ** 12.8 ** 12.5 ** 13.3 ** 13.0** 13.6 **46.7 46.7 46.7 1.00 48.6 48.3 48.9 1.01 11.2 ** 10.7 ** 12.1 ** 12.1 ** 11.4** 13.1 **25.7 30.4 20.8 0.68 … … … … 7.8 ** 10.6 ** 4.9 ** … … …
77.6 ** 77.7 ** 77.5 ** 1.00 ** 79.0**,y 79.2**,y 78.9 **,y 1.00**,y … … … 11.4 11.2 11.676.1 76.6 75.5 0.99 85.5 86.3 84.7 0.98 13.8 ** 13.6 ** 14.0 ** 14.2 13.7 14.6… … … … … … … … … … … … … …… … … … 82.1z 81.9z 82.3 z 1.00 z 12.7 12.2 13.1 12.8 12.7 12.870.0 71.2 68.7 0.97 72.7 74.5 70.9 0.95 12.5 12.2 12.6 13.1 12.8 13.3… … … … 50.3**,y 47.1**,y 53.7 **,y 1.14**,y … … … 14.9 14.6 15.1… … … … 78.8**,z 78.4**,z 79.3 **,z 1.01**,z 13.9 13.2 14.6 15.8 14.4 16.7… … … … 66.0** 67.4** 64.6 ** 0.96** 14.0 ** 13.8 ** 14.3 ** 15.6 14.9 16.1… … … … 69.0**,z 69.0**,z 69.0 **,z 1.00**,z 13.7 12.8 14.4 15.2 13.8 16.1… … … … 72.0**,z 72.9**,z 71.1 **,z 0.98**,z … … … 15.8 14.9 16.5… … … … … … … … … … … 15.6 14.9 16.1… … … … … … … … 9.9 ** 9.7 ** 10.1 ** 10.1 9.8 10.4… … … … 76.7z 77.2z 76.2 z 0.99 z 11.8 11.6 12.0 12.7 12.3 13.0… … … … … … … … … … … 13.5 ** … …… … … … 88.8**,y 88.5**,y 89.2 **,y 1.01**,y 13.3 13.2 13.4 12.9 **,y 12.7**,y 13.1 **,y
53.5 ** 50.6 ** 56.5 ** 1.12 ** 50.6** 48.6** 52.7 ** 1.08** 13.1 ** 13.0 ** 13.3 ** 14.0 13.7 14.1… … … … … … … … 14.3 ** 13.6 ** 14.8 ** 16.3 ** 15.5** 16.8 **… … … … 74.1z 75.0z 73.2 z 0.98 z 11.9 11.9 11.9 11.2 ** 11.0** 11.5 **… … … … … … … … … … … 10.9 ** 11.8** 9.9 **66.5 … … … 73.4 73.6 73.2 0.99 … … … 13.4 13.0* 13.7 *
… … … … 86.3 86.3 86.2 1.00 … … … 10.9 10.5 11.2… … … … 59.7 61.2 58.1 0.95 10.0 10.1 9.9 10.6 10.7 10.467.5 67.1 ** 68.0 ** 1.01 ** 80.2 80.4 79.9 0.99 10.8 ** 10.6 ** 10.9 ** 11.3 ** 11.2** 11.3 **… … … … 65.7** 66.8** 64.5 ** 0.96** 11.5 11.3 11.7 13.5 ** 13.1** 13.9 **60.7 * 61.4 * 60.0 * 0.98 * 66.9 69.8 64.1 0.92 11.6 11.3 11.8 12.8 12.5 13.182.2 82.4 82.0 1.00 64.3 64.4 64.3 1.00 8.7 ** 7.8 ** 9.6 ** 11.0 10.0 11.971.0 73.0 69.0 0.95 … … … … 9.9 ** 10.7 ** 9.1 ** 11.3 12.2 10.2… … … … … … … … … … … … … …… … … … 87.3 87.2** 87.4 ** 1.00** … … … 11.6 ** 11.8** 11.4 **
… … … … … … … … 19.6 ** 19.0 ** 19.9 ** 20.6 19.4 20.8… … … … … … … … 13.1 ** 12.7 ** 13.4 ** 13.4 ** 13.1** 13.8 **65.3 ** 66.5 ** 64.0 ** 0.96 ** 76.5 78.3 74.5 0.95 … … … 9.1 ** 9.9** 8.3 **… … … … 53.2** … … … … … … 10.8 ** 10.9** 10.6 **… … … … … … … … … … … … … …
SCHOOL LIFE EXPECTANCY(expected number of years of formal schooling)
NET INTAKE RATE (NIR)IN PRIMARY EDUCATION (%)
1998/1999 2002/2003
Total Male FemaleTotal Male Female
1998/1999
Total Male Female GPI(F/M)
2002/2003
Total Male Female GPI(F/M)
1234567891011121314151617181920
2122232425262728293031323334353637383940
414243444546474849
5051525354
Arab States
Central and Eastern Europe
Central Asia
East Asia and the Pacific

60
02
Education f
or A
ll G
lobal M
onitorin
g R
eport
3 0 6 / A N N E X
Table 4 (continued)
6-15 Yes … … … … … … … … … …
6-15 No 22 ** 20 **,z 122.5** 123.9 ** 121.0** 0.98 ** 111.7 **,z 114.7 **,z 108.5 **,z 0.95**,z
7-15 No … 4 985 … … … … 115.5 115.3 115.7 1.006-15 Yes … … … … … … … … … …
6-15 No … … … … … … … … … …
6-10 No 180 193 121.0 127.8 114.0 0.89 124.2 130.7 117.4 0.905-14 … 6 5 88.1 87.4 88.8 1.02 95.1 97.0 93.1 0.96… No … 525 … … … … 92.4 92.5 92.2 1.00
6-14 No 1 2 z … … … … 133.8 z 140.8 z 126.8 z 0.90 z
6-13 No … … … … … … … … … …
5-9 No 1 226 1 289 113.9 112.7 115.0 1.02 120.1 119.4 120.8 1.016-16 No … … … … … … … … … …
5-16 Yes … … … … … … … … … …
5-16 … 0.04 0.03z 95.3 112.5 73.7 0.65 110.0 z 123.1 z 100.0 z 0.81 z
6-17 Yes 0.4 … 120.2 119.8 120.7 1.01 … … … …
6-14 No 152 151 106.6 110.5 102.3 0.93 94.3 99.7 88.5 0.896-12 Yes 2 551 ** 2 637 133.5** 136.8 ** 129.9** 0.95 ** 134.8 139.7 129.6 0.936-15 Yes 711 668 105.9 105.0 106.9 1.02 103.0 103.2 102.8 1.005-14 No 5 6 z 107.9 107.3 108.5 1.01 116.3 z 115.5 z 117.1 z 1.01 z
6-16 No … … … … … … … … … …… No … … … … … … … … … …
6-14 No 1 037 ** … 97.4** 101.0 ** 93.6** 0.93 ** … … … …
7-15 … … … … … … … … … … …… … … … … … … … … … … …
6-14 No 3 3 z 110.4 111.0 109.7 0.99 109.1 z 110.6 z 107.6 z 0.97 z
7-14 No 0.2** … 86.0** 84.8 ** 87.5** 1.03 ** … … … …
6-12 No 6 ** 7 **,z 104.9** 101.3 ** 108.8** 1.07 ** 121.2 **,z 118.9 **,z 123.8 **,z 1.04**,z
6-14 Yes 2 035 1 649 ** 108.4 112.5 104.2 0.93 99.2 ** 102.2 ** 96.2 ** 0.94**
5-17 … 0.2 0.2z … … … … 104.3 z 88.2 z 127.3 z 1.44 z
5-16 Yes … … … … … … … … … …
5-15 Yes 793 777 116.2 115.7 116.8 1.01 112.1 112.1 112.1 1.006-16 … 1 2 106.2 109.4 102.9 0.94 103.6 103.3 103.9 1.015-16 No … 7 ** … … … … 113.4 ** 117.0 ** 109.6 ** 0.94**4-16 Yes 4 4 109.3 109.8 108.9 0.99 110.2 110.8 109.6 0.995-14 Yes 8 8 129.0 130.3 127.8 0.98 115.1 112.4 118.0 1.055-16 … … 1 z … … … … 100.6 z … … …
6-13 Yes 272 282 122.7 122.8 122.6 1.00 121.0 120.8 121.3 1.007-14 Yes 4 227 4 067 125.5 … … … 124.6 130.3 ** 118.7 ** 0.91**5-16 … 0.4 0.4 105.7 108.6 102.7 0.95 109.7 119.6 99.4 0.835-16 … 0.6 0.6 z … … … … … … … …
6-14 Yes 288 266 97.7 98.2 97.2 0.99 92.2 92.9 91.4 0.985-15 No 1 258 ** 1 234 135.1** 137.7 ** 132.4** 0.96 ** 128.9 131.7 126.0 0.966-15 Yes 86 86 101.9 102.6 101.1 0.98 104.8 104.6 105.1 1.016-14 Yes 161 ** 135 97.2** 99.1 ** 95.3** 0.96 ** 92.5 93.4 91.6 0.985-16 No 2 1 105.1 111.4 98.6 0.88 75.7 79.0 72.6 0.925-13 Yes 259 258 ** 139.6 144.0 135.0 0.94 140.7 ** 145.7 ** 135.5 ** 0.93**5-14 Yes 374 394 132.1 132.4 131.9 1.00 137.7 138.4 136.9 0.994-15 Yes 186 205 128.2 130.6 125.8 0.96 134.5 136.8 132.2 0.975-16 No … 2 … … … … 104.6 106.6 102.5 0.967-15 Yes 393 ** 430 123.8** 126.2 ** 121.2** 0.96 ** 124.3 125.0 123.6 0.996-15 Yes 18 24 **,z 121.0 118.0 124.1 1.05 154.5 **,z 156.1 **,z 152.9 **,z 0.98**,z
6-11 No … … … … … … … … … …
6-13 Yes … 257 **,z … … … … 138.7 **,z 138.7 **,z 138.8 **,z 1.00**,z
6-11 No … 52 … … … … 96.2 97.3 ** 95.2 ** 0.98**6-15 Yes 2 509 2 440 111.3 111.2 111.5 1.00 108.3 108.0 108.5 1.015-14 … 0.1 0.1** … … … … 145.7 ** … … …
6-15 … 4 ** 3 ** 100.8** 97.5 ** 104.1** 1.07 ** 90.7 ** 86.9 ** 94.6 ** 1.09**6-16 Yes … 210 … … … … 137.8 142.0 133.5 0.946-11 Yes … 78 … … … … 121.8 123.5 120.0 0.976-14 Yes 173 162 120.4 121.7 119.1 0.98 107.4 108.6 106.2 0.98
DPR KoreaFijiIndonesiaJapan4
KiribatiLao PDRMacao, ChinaMalaysiaMarshall Islands2,5
Micronesia MyanmarNauru5
New Zealand4
Niue5
Palau2,5
Papua New GuineaPhilippines3
Republic of Korea2,4
SamoaSingaporeSolomon IslandsThailandTimor-LesteTokelauTongaTuvalu5
VanuatuViet Nam3
Anguilla5
Antigua and BarbudaArgentina2,3
Aruba5
BahamasBarbadosBelizeBermudaBolivia3
Brazil3
British Virgin Islands5
Cayman Islands7
Chile2
Colombia2,3
Costa Rica3
CubaDominica5
Dominican Republic3
Ecuador3
El Salvador3
Grenada5
GuatemalaGuyana3
HaitiHonduras2,3
JamaicaMexico3
Montserrat5
Netherlands AntillesNicaragua3
Panama3
Paraguay3
55565758596061626364656667686970717273747576777879808182
8384858687888990919293949596979899
100101102103104105106107108109110111112113114
GROSS INTAKE RATE (GIR)IN PRIMARY EDUCATION (%)Compulsory
education(age group)
Legalguarantee
of freeeducation1
New entrants(000)
1998/1999 2002/2003
1998/1999
Country or territoryMale Female
(F/M)Total GPI Male Female
(F/M)Total GPI
2002/2003
Latin America and the Caribbean

S TAT I S T I C A L A N N E X / 3 0 7
Ta b l e 4
… … … … … … … … … … … … … …
80.5 ** 81.2 ** 79.9 ** 0.98 ** 77.3**,z 79.3**,z 75.1 **,z 0.95**,z … … … … … …… … … … 39.1 39.4** 38.8 ** 0.99** … … … 11.1 11.3 11.0… … … … … … … … 14.3 ** 14.5 ** 14.2 ** 14.7 ** 14.8** 14.5 **… … … … … … … … … … … … … …
54.7 55.7 53.7 0.96 60.9 61.7 60.1 0.97 8.4 ** 9.4 7.4 ** 9.1 ** 10.1** 8.1 **62.5 60.3 64.7 1.07 74.4 75.1 73.7 0.98 12.1 ** 12.3 ** 11.9 ** 15.1 13.9 14.0… … … … … … … … 12.0 ** 11.7 ** 12.2 ** 12.3 11.8 12.8… … … … 75.7z 75.9z 75.5 z 0.99 z … … … … … …… … … … … … … … … … … … … …
78.0 ** … … … 94.2 93.7 94.7 1.01 … … … 7.4 **,z … …… … … … … … … … 8.1 ** … … … … …… … … … … … … … 17.5 ** 17.0 ** 17.9 ** 18.9 … …
95.3 … … … … … … … 12.3 … … 12.8 z 13.3z 12.4 z
… … … … … … … … … … … 15.0 **,y 14.5**,y 15.6 **,y
… … … … … … … … 5.7 ** 6.1 ** 5.3 ** … … …
46.5 ** 47.7 ** 45.3 ** 0.95 ** 47.6 45.5 49.9 1.10 11.7 ** 11.4 ** 11.9 ** 12.0 ** 11.7** 12.3 **99.1 98.2 100.0 1.02 94.5** 94.2** 94.9 ** 1.01** 14.9 ** 15.7 ** 14.0 ** 16.9 17.5 15.979.4 81.5 77.2 0.95 76.3**,z 74.1**,z 78.6 **,z 1.06**,z 11.7 ** 11.5 ** 12.0 ** 11.8 **,z 11.6**,z 12.0 **,z
… … … … … … … … … … … … … …… … … … … … … … … … … 8.7 … …… … … … … … … … … … … 12.5 **,y 12.7**,y 12.3 **,y
… … … … … … … … … … … 11.4 **,z … …… … … … … … … … … … … … … …
60.9 60.4 61.6 1.02 87.0z 84.9z 89.1 z 1.05 z … … … 13.5 **,z 13.3**,z 13.7 **,z
86.0 ** 84.8 ** 87.5 ** 1.03 ** … … … … 10.9 ** … … 10.8 z 10.6z 11.1 z
… … … … 55.1**,z 54.1**,z 56.3 **,z 1.04**,z … … … 9.4 **,z … …
80.8 … … … 82.9**,z … … … 10.4 ** 10.9 ** 9.8 ** 10.6 ** 11.0** 10.1 **
… … … … 96.8z … … … … … … 12.5 z … …… … … … … … … … … … … … … …… … … … 92.3 92.3 92.3 1.00 14.9 ** 14.3 ** 15.6 ** 16.4 15.2 17.287.6 88.6 86.5 0.98 83.6 84.5 82.7 0.98 13.3 ** 13.2 ** 13.4 ** 13.5 z 13.2z 13.7 z
… … … … 80.8**,z 81.1**,z 80.6 **,z 0.99**,z … … … … … …
85.4 ** 85.8 ** 84.9 ** 0.99 ** 94.1 93.9 94.4 1.01 15.0 ** 14.4 ** 15.6 ** 14.3 **,y 13.6**,y 15.1 **,y
78.9 ** 80.6 ** 77.2 ** 0.96 ** 66.1** 64.2** 68.0 ** 1.06** … … … 12.5 ** 12.4** 12.7 **… … … … 100.0z … … … … … … 15.3 **,z … …
64.2 ** 63.9 ** 64.4 ** 1.01 ** 70.0 69.8 70.3 1.01 12.8 ** 13.5 ** 12.1 ** 14.2 ** … …… … … … … … … … … … … 14.7 14.1 15.073.3 ** 70.3 ** 76.4 ** 1.09 ** 75.7** 75.1** 76.2 ** 1.01** 15.8 ** … … 14.7 ** 13.7** 15.8 **… … … … … … … … … … … … … …
37.7 ** 37.3 ** 38.1 ** 1.02 ** 36.9** 36.5** 37.2 ** 1.02** 12.7 ** 12.8 ** 12.6 ** 15.0 ** 15.2** 14.9 **55.8 ** … … … 57.3**,z 58.5**,z 55.9 **,z 0.96**,z 11.1 ** 10.9 ** 11.3 ** 11.0 ** 10.8** 11.3 **58.8 ** 58.2 ** 59.4 ** 1.02 ** 56.5 55.5 57.5 1.04 10.1 ** 9.9 ** 10.3 ** 10.7 ** 10.6** 10.9 **95.4 ** 97.0 ** 93.6 ** 0.96 ** 91.8 92.7 90.8 0.98 12.1 ** … … 13.3 ** 13.1** 13.4 **76.2 78.4 73.8 0.94 46.5 48.6 44.6 0.92 11.8 ** … … 13.1 ** 12.6** 13.6 **61.0 60.9 61.2 1.01 61.8** 64.2** 59.3 ** 0.92** … … … 12.7 ** 11.9** 13.6 **82.8 82.3 83.3 1.01 87.2 86.9 87.5 1.01 … … … … … …… … … … 60.6** 60.4** 60.9 ** 1.01** 10.7 ** 10.8 ** 10.6 ** 11.3 ** 11.4** 11.1 **… … … … 66.1** 66.4** 65.9 ** 0.99** … … … … … …… … … … 62.7 63.1 62.4 0.99 … … … 9.1 ** 9.5** 8.7 **88.0 ** 86.4 ** 89.6 ** 1.04 ** 89.0**,y 90.0**,y 88.0 **,y 0.98**,y … … … … … …… … … … … … … … … … … … … …… … … … 48.6**,z 48.6**,z 48.6 **,z 1.00**,z … … … … … …… … … … 78.1** 76.8** 79.6 ** 1.04** … … … 11.8 ** 11.3** 12.3 **… … … … 83.1**,z 81.5**,z 84.8 **,z 1.04**,z 11.8 ** 11.8 ** 11.7 ** 12.6 12.3 12.7… … … … 69.6** … … … … … … 13.6 z … …
69.2 ** 64.6 ** 74.0 ** 1.15 ** 61.5**,z 54.8**,z 68.4 **,z 1.25**,z 12.3 ** 12.0 ** 12.6 ** 11.5 z 11.0z 11.9 z
… … … … 38.1 39.1 37.1 0.95 … … … 10.5 ** 10.3** 10.8 **… … … … 89.8** 89.1** 90.5 ** 1.02** … … … 13.2 ** 12.6** 13.8 **70.8 ** 69.8 ** 71.9 ** 1.03 ** 66.4 65.3 67.5 1.03 … … … 12.1 ** 12.0** 12.3 **
55565758596061626364656667686970717273747576777879808182
8384858687888990919293949596979899100101102103104105106107108109110111112113114
SCHOOL LIFE EXPECTANCY(expected number of years of formal schooling)
NET INTAKE RATE (NIR)IN PRIMARY EDUCATION (%)
1998/1999 2002/2003
Total Male FemaleTotal Male Female
1998/1999
Total Male Female GPI(F/M)
2002/2003
Total Male Female GPI(F/M)
Latin America and the Caribbean
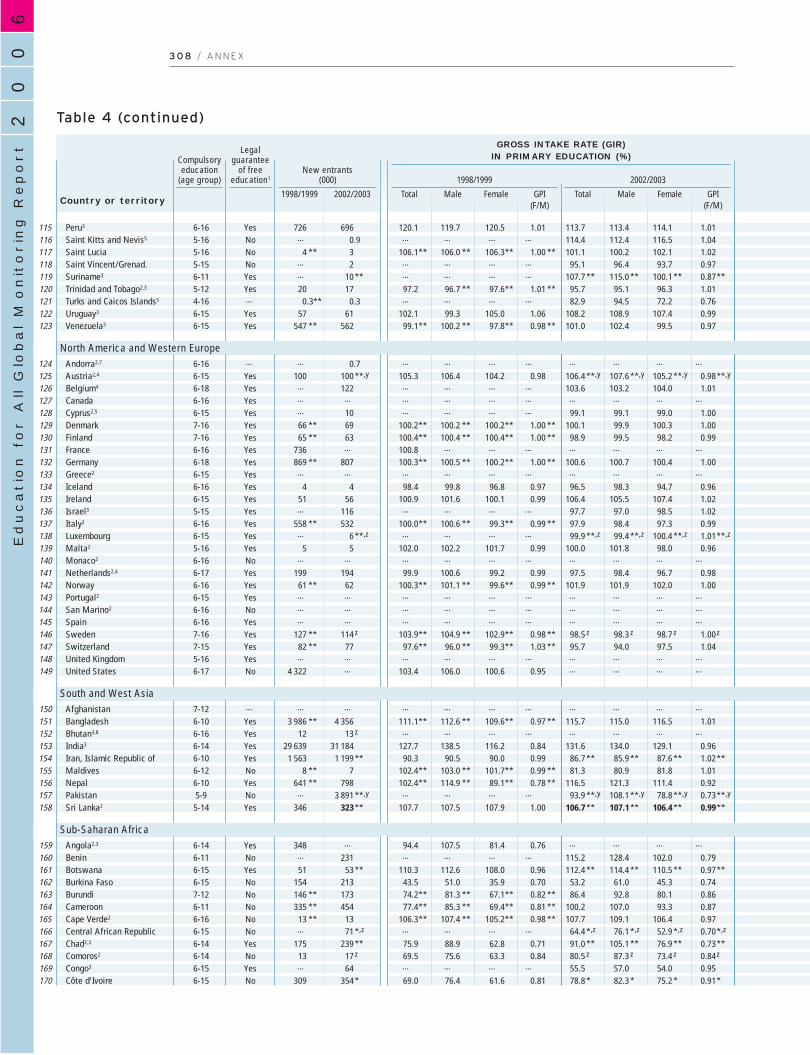
60
02
Education f
or A
ll G
lobal M
onitorin
g R
eport
3 0 8 / A N N E X
Table 4 (continued)
6-16 Yes 726 696 120.1 119.7 120.5 1.01 113.7 113.4 114.1 1.015-16 No … 0.9 … … … … 114.4 112.4 116.5 1.045-16 No 4 ** 3 106.1** 106.0 ** 106.3** 1.00 ** 101.1 100.2 102.1 1.025-15 No … 2 … … … … 95.1 96.4 93.7 0.976-11 Yes … 10 ** … … … … 107.7 ** 115.0 ** 100.1 ** 0.87**5-12 Yes 20 17 97.2 96.7 ** 97.6** 1.01 ** 95.7 95.1 96.3 1.014-16 … 0.3** 0.3 … … … … 82.9 94.5 72.2 0.766-15 Yes 57 61 102.1 99.3 105.0 1.06 108.2 108.9 107.4 0.996-15 Yes 547 ** 562 99.1** 100.2 ** 97.8** 0.98 ** 101.0 102.4 99.5 0.97
6-16 … … 0.7 … … … … … … … …
6-15 Yes 100 100 **,y 105.3 106.4 104.2 0.98 106.4 **,y 107.6 **,y 105.2 **,y 0.98**,y
6-18 Yes … 122 … … … … 103.6 103.2 104.0 1.016-16 Yes … … … … … … … … … …
6-15 Yes … 10 … … … … 99.1 99.1 99.0 1.007-16 Yes 66 ** 69 100.2** 100.2 ** 100.2** 1.00 ** 100.1 99.9 100.3 1.007-16 Yes 65 ** 63 100.4** 100.4 ** 100.4** 1.00 ** 98.9 99.5 98.2 0.996-16 Yes 736 … 100.8 … … … … … … …
6-18 Yes 869 ** 807 100.3** 100.5 ** 100.2** 1.00 ** 100.6 100.7 100.4 1.006-15 Yes … … … … … … … … … …
6-16 Yes 4 4 98.4 99.8 96.8 0.97 96.5 98.3 94.7 0.966-15 Yes 51 56 100.9 101.6 100.1 0.99 106.4 105.5 107.4 1.025-15 Yes … 116 … … … … 97.7 97.0 98.5 1.026-16 Yes 558 ** 532 100.0** 100.6 ** 99.3** 0.99 ** 97.9 98.4 97.3 0.996-15 Yes … 6 **,z … … … … 99.9 **,z 99.4 **,z 100.4 **,z 1.01**,z
5-16 Yes 5 5 102.0 102.2 101.7 0.99 100.0 101.8 98.0 0.966-16 No … … … … … … … … … …
6-17 Yes 199 194 99.9 100.6 99.2 0.99 97.5 98.4 96.7 0.986-16 Yes 61 ** 62 100.3** 101.1 ** 99.6** 0.99 ** 101.9 101.9 102.0 1.006-15 Yes … … … … … … … … … …
6-16 No … … … … … … … … … …
6-16 Yes … … … … … … … … … …
7-16 Yes 127 ** 114 z 103.9** 104.9 ** 102.9** 0.98 ** 98.5 z 98.3 z 98.7 z 1.00 z
7-15 Yes 82 ** 77 97.6** 96.0 ** 99.3** 1.03 ** 95.7 94.0 97.5 1.045-16 Yes … … … … … … … … … …
6-17 No 4 322 … 103.4 106.0 100.6 0.95 … … … …
7-12 … … … … … … … … … … …
6-10 Yes 3 986 ** 4 356 111.1** 112.6 ** 109.6** 0.97 ** 115.7 115.0 116.5 1.016-16 Yes 12 13 z … … … … … … … …
6-14 Yes 29 639 31 184 127.7 138.5 116.2 0.84 131.6 134.0 129.1 0.966-10 Yes 1 563 1 199 ** 90.3 90.5 90.0 0.99 86.7 ** 85.9 ** 87.6 ** 1.02**6-12 No 8 ** 7 102.4** 103.0 ** 101.7** 0.99 ** 81.3 80.9 81.8 1.016-10 Yes 641 ** 798 102.4** 114.9 ** 89.1** 0.78 ** 116.5 121.3 111.4 0.925-9 No … 3 891 **,y … … … … 93.9 **,y 108.1 **,y 78.8 **,y 0.73**,y
5-14 Yes 346 323 ** 107.7 107.5 107.9 1.00 106.7 ** 107.1 ** 106.4 ** 0.99**
6-14 Yes 348 … 94.4 107.5 81.4 0.76 … … … …
6-11 No … 231 … … … … 115.2 128.4 102.0 0.796-15 Yes 51 53 ** 110.3 112.6 108.0 0.96 112.4 ** 114.4 ** 110.5 ** 0.97**6-15 No 154 213 43.5 51.0 35.9 0.70 53.2 61.0 45.3 0.747-12 No 146 ** 173 74.2** 81.3 ** 67.1** 0.82 ** 86.4 92.8 80.1 0.866-11 No 335 ** 454 77.4** 85.3 ** 69.4** 0.81 ** 100.2 107.0 93.3 0.876-16 No 13 ** 13 106.3** 107.4 ** 105.2** 0.98 ** 107.7 109.1 106.4 0.976-15 No … 71 *,z … … … … 64.4 *,z 76.1 *,z 52.9 *,z 0.70*,z
6-14 Yes 175 239 ** 75.9 88.9 62.8 0.71 91.0 ** 105.1 ** 76.9 ** 0.73**6-14 No 13 17 z 69.5 75.6 63.3 0.84 80.5 z 87.3 z 73.4 z 0.84 z
6-15 Yes … 64 … … … … 55.5 57.0 54.0 0.956-15 No 309 354 * 69.0 76.4 61.6 0.81 78.8 * 82.3 * 75.2 * 0.91*
Peru3
Saint Kitts and Nevis5
Saint LuciaSaint Vincent/Grenad.Suriname3
Trinidad and Tobago2,3
Turks and Caicos Islands5
Uruguay3
Venezuela3
Andorra2,7
Austria2,4
Belgium4
CanadaCyprus2,5
DenmarkFinlandFranceGermanyGreece2
IcelandIrelandIsrael3
Italy2
LuxembourgMalta2
Monaco2
Netherlands2,4
NorwayPortugal2
San Marino2
SpainSwedenSwitzerlandUnited KingdomUnited States
AfghanistanBangladeshBhutan3,8
India3
Iran, Islamic Republic ofMaldivesNepalPakistanSri Lanka2
Angola2,3
BeninBotswanaBurkina FasoBurundiCameroonCape Verde2
Central African RepublicChad2,3
Comoros2
Congo3
Côte d’Ivoire
115116117118119120121122123
124125126127128129130131132133134135136137138139140141142143144145146147148149
150151152153154155156157158
159160161162163164165166167168169170
GROSS INTAKE RATE (GIR)IN PRIMARY EDUCATION (%)Compulsory
education(age group)
Legalguarantee
of freeeducation1
New entrants(000)
1998/1999 2002/2003
1998/1999
Country or territoryMale Female
(F/M)Total GPI Male Female
(F/M)Total GPI
2002/2003
GROSS INTAKE RATE (GIR)IN PRIMARY EDUCATION (%)Compulsory
education(age group)
Legalguarantee
of freeeducation1
New entrants(000)
1998/1999 2002/2003
1998/1999
Country or territoryMale Female
(F/M)Total GPI Male Female
(F/M)Total GPI
2002/2003
North America and Western Europe
South and West Asia
Sub-Saharan Africa

S TAT I S T I C A L A N N E X / 3 0 9
Ta b l e 4
… … … … 81.0 81.0 81.1 1.00 … … … 13.8 ** 13.8** 13.8 **… … … … 76.3 75.6 76.9 1.02 … … … 15.9 **,y … …
74.8 ** 74.0 ** 75.5 ** 1.02 ** 71.0** 69.9** 72.2 ** 1.03** … … … … … …… … … … 61.0** 60.5** 61.4 ** 1.01** … … … … … …… … … … 73.9** 75.4** 72.4 ** 0.96** … … … 12.5 **,z 11.6**,z 13.4 **,z
69.2 68.0 ** 70.5 ** 1.04 ** 63.3** 62.1** 64.6 ** 1.04** 11.8 ** 11.5 ** 12.0 ** 11.8 ** 11.6** 12.1 **… … … … 49.7 59.1 40.9 0.69 … … … 12.8 **,z 12.2**,z 13.3 **,z
38.1 ** 36.2 ** 40.1 ** 1.11 ** 34.8**,z 33.4**,z 36.4 **,z 1.09**,z … … … 14.9 ** 14.0** 15.8 **61.0 ** 60.8 ** 61.2 ** 1.01 ** 61.5 61.2 61.9 1.01 … … … 11.8 ** 11.5** 12.0 **
… … … … … … … … … … … … … …… … … … … … … … 15.2 ** 15.2 ** 15.1 ** 14.9 14.5 15.1… … … … … … … … 17.8 ** 17.4 ** 18.2 ** 19.2 18.3 19.9… … … … … … … … 16.0 ** 15.7 ** 16.3 ** 16.0 **,z 15.7**,z 16.4 **,z
… … … … 91.0z 90.3z 91.8 z 1.02 z 12.5 12.3 12.7 13.4 13.3 13.5… … … … 99.8z 99.7z 100.0 z 1.00 z 16.1 ** 15.6 ** 16.6 ** 16.9 15.8 17.6… … … … 94.3** 93.6** 95.0 ** 1.02** 17.5 ** 16.7 ** 18.2 ** 18.3 16.8 19.1… … … … … … … … 15.6 ** 15.3 ** 15.8 ** 15.6 15.1 15.9… … … … … … … … 16.0 ** 16.2 ** 15.8 ** 15.8 15.5 15.7… … … … … … … … 14.2 ** 14.0 ** 14.4 ** 15.8 15.5 16.0… … … … 96.4 98.2 94.5 0.96 16.7 ** 16.0 ** 17.3 ** 18.3 16.6 19.4… … … … 49.3** 46.2** 52.6 ** 1.14** 16.3 ** 15.6 ** 16.7 ** 17.0 16.1 17.7… … … … … … … … 14.8 ** 14.4 ** 15.2 ** 15.6 14.7 16.0… … … … 95.8 96.0 95.7 1.00 14.7 ** 14.5 ** 14.9 ** 15.6 15.1** 16.0 **… … … … 85.9**,z 85.5**,z 86.3 **,z 1.01**,z … … … 13.5 ** 13.3** 13.7 **… … … … 69.7** 71.4** 67.8 ** 0.95** … … … 14.5 14.1 14.6… … … … … … … … … … … … … …
99.3 100.0 98.6 0.99 97.5 98.4 96.7 0.98 16.5 ** 16.7 ** 16.2 ** 16.6 16.4 16.6… … … … … … … … 17.5 ** 16.9 ** 18.0 ** 17.8 16.4 18.5… … … … … … … … 15.8 ** 15.4 ** 16.1 ** 16.1 15.3 16.6… … … … … … … … … … … … … …… … … … … … … … 15.7 ** 15.4 ** 16.0 ** 16.2 15.5 16.6… … … … 95.1z 95.3z 94.8 z 0.99 z 19.0 ** 17.3 ** 20.8 ** 19.1 16.8 20.7… … … … 58.4 58.2 58.6 1.01 15.5 ** 16.0 ** 15.0 ** 15.9 15.8 15.6… … … … … … … … 20.0 ** 19.3 ** 20.7 ** 22.0 19.8 23.5… … … … … … … … … … … 15.7 ** 14.4** 16.3 **
… … … … … … … … … … … … … …
83.3 ** 83.5 ** 83.2 ** 1.00 ** 87.0 85.6 88.5 1.03 8.5 ** 8.7 ** 8.2 ** 8.4 8.2 8.5… … … … … … … … … … … … … …… … … … … … … … … … … 9.7 ** 10.3** 8.9 **43.8 ** 44.3 ** 43.2 ** 0.97 ** 41.4**,y 41.9**,y 40.8 **,y 0.97**,y 11.6 ** 12.2 ** 10.9 ** 11.6 ** 12.1** 11.1 **… … … … 71.8 71.9 71.7 1.00 11.6 … … 11.9 11.8 12.1… … … … … … … … … … … 9.7 ** 10.6** 8.8 **… … … … … … … … … … … 5.4 ** 6.3** 4.5 **95.1 94.5 95.7 1.01 99.8** … … … … … … … … …
25.8 ** 28.7 ** 22.9 ** 0.80 ** … … … … 5.2 ** 5.8 ** 4.6 ** … … …… … … … … … … … 6.9 ** 8.7 ** 5.1 ** … … …
21.5 20.2 22.9 1.14 24.0** 22.4** 25.6 ** 1.14** 11.4 ** 11.3 ** 11.5 ** 11.3 ** 11.2** 11.3 **18.6 21.9 15.2 0.69 21.3 24.6 17.9 0.73 … … … 3.7 ** 4.3** 3.0 **… … … … 33.7 34.1 33.4 0.98 … … … 5.6 ** 6.3** 4.9 **… … … … … … … … 7.6 ** … … 9.2 ** 10.0** 8.4 **68.6 ** 67.8 ** 69.5 ** 1.03 ** 79.2 78.4 80.0 1.02 … … … 11.8 ** 11.8** 11.8 **… … … … … … … … … … … … … …
23.0 26.8 19.1 0.71 30.5z 35.3z 25.7 z 0.73 z … … … … … …
15.5 18.2 ** 12.7 ** 0.70 ** … … … … 6.5 ** 7.0 ** 5.9 ** 7.9 ** 8.7** 7.2 **… … … … … … … … … … … 7.7 **,z 8.4**,z 7.0 **,z
28.2 31.4 25.0 0.80 29.8* 30.7* 28.9 * 0.94* 6.4 ** 7.7 ** 5.1 ** … … …
115116117118119120121122123
124125126127128129130131132133134135136137138139140141142143144145146147148149
150151152153154155156157158
159160161162163164165166167168169170
SCHOOL LIFE EXPECTANCY(expected number of years of formal schooling)
NET INTAKE RATE (NIR)IN PRIMARY EDUCATION (%)
1998/1999 2002/2003
Total Male FemaleTotal Male Female
1998/1999
Total Male Female GPI(F/M)
2002/2003
Total Male Female GPI(F/M)
SCHOOL LIFE EXPECTANCY(expected number of years of formal schooling)
NET INTAKE RATE (NIR)IN PRIMARY EDUCATION (%)
1998/1999 2002/2003
Total Male FemaleTotal Male Female
1998/1999
Total Male Female GPI(F/M)
2002/2003
Total Male Female GPI(F/M)
North America and Western Europe
South and West Asia
Sub-Saharan Africa

60
02
Education f
or A
ll G
lobal M
onitorin
g R
eport
3 1 0 / A N N E X
Table 4 (continued)
6-13 Yes 767 … 52.2 50.5 54.0 1.07 … … … …
7-11 Yes … 16 z … … … … 121.9 z 135.2 z 108.6 z 0.80 z
7-13 No 57 72 54.9 60.3 49.3 0.82 60.2 65.0 55.2 0.857-12 No 1 537 2 026 ** 81.6 96.8 66.3 0.68 95.9 ** 101.0 ** 90.8 ** 0.90**6-16 No … 35 ** … … … … 95.8 ** 95.9 ** 95.7 ** 1.00**… Yes 30 32 ** 89.5 91.6 87.4 0.95 87.2 ** 85.1 ** 89.2 ** 1.05**
6-15 Yes 469 495 ** 87.9 90.9 84.9 0.93 89.2 ** 89.5 ** 89.0 ** 0.99**6-12 No 119 195 53.6 59.6 47.3 0.79 81.1 86.2 75.8 0.887-12 Yes 36 ** … 93.1** 110.0 ** 76.3** 0.69 ** … … … …
6-13 Yes 916 826 ** 104.6 107.3 101.9 0.95 95.7 ** 96.5 ** 94.9 ** 0.98**6-12 No 52 60 108.9 109.3 108.5 0.99 129.2 134.2 124.1 0.926-16 No 50 … 63.0 77.0 48.8 0.63 … … … …
6-14 Yes 495 586 z 109.4 110.6 108.2 0.98 117.9 z 119.4 z 116.4 z 0.98 z
6-13 Yes … 658 … … … … 172.2 169.5 174.9 1.037-15 Yes 173 ** 235 48.5** 55.0 ** 41.9** 0.76 ** 58.5 63.4 53.4 0.84… Yes 22 20 104.3 104.0 104.5 1.00 93.5 92.4 94.7 1.02
6-12 No 521 ** 631 100.5** 109.0 ** 92.0** 0.84 ** 115.1 120.2 110.0 0.916-15 Yes 55 58 101.2 100.3 102.0 1.02 97.9 98.4 97.3 0.997-12 Yes 133 216 42.1 49.6 34.4 0.69 59.0 67.8 49.9 0.746-11 Yes … 5 291 … … … … 144.1 158.4 129.4 0.826-12 Yes 295 404 153.7 136.0 171.3 1.26 166.6 166.3 166.9 1.007-12 Yes 4 5 z 105.5 107.9 103.1 0.96 109.3 z 112.1 z 106.5 z 0.95 z
7-12 Yes 190 266 71.0 72.5 ** 69.4** 0.96 ** 94.5 95.1 93.9 0.996-15 Yes 2 2 113.4 111.2 115.7 1.04 102.2 102.2 102.2 1.00… No … … … … … … … … … …
6-13 … … … … … … … … … … …
7-15 No 1 265 1 169 123.6 126.0 121.1 0.96 115.7 117.9 113.5 0.966-12 No 31 30 101.0 103.6 98.4 0.95 94.5 97.2 91.7 0.946-15 No 139 149 107.7 113.9 101.3 0.89 104.5 109.6 99.4 0.91… No … 1 613 … … … … 189.8 187.4 192.2 1.03
7-13 Yes 669 1 332 ** 65.9 66.8 65.0 0.97 120.1 ** 123.3 ** 116.9 ** 0.95**7-13 No 249 286 82.2 83.1 81.3 0.98 86.4 86.4 86.5 1.006-12 No … 417 … … … … 112.4 113.9 110.9 0.97
… … … … 101.1 102.0 100.2 0.98 101.1 100.2 102.1 1.02
… … … … 93.7 92.7 94.8 1.02 102.6 102.7 102.5 1.00… … … … 100.3 101.1 99.6 0.99 99.4 100.5 98.3 0.98… … … … 104.2 104 104.7 1.01 104.3 106 102.1 0.96
… … … … 99.0 98.9 99.0 1.00 98.5 97.8 99.3 1.01… … … … 99.7 100.5 98.8 0.98 98.8 99.2 98.4 0.99… … … … 100.8 100.3 101.3 1.01 103.8 103.8 103.7 1.00… … … … 108.4 112.5 104.2 0.93 110.8 115.0 108.0 0.94
… … … … 111.3 111.2 111.5 1.00 109.0 111.4 109.1 0.98
… … … … 100.4 100.8 100.0 0.99 99.5 99.3 99.7 1.00
… … … … 105.1 111.2 98.5 0.89 105.6 108.1 105.6 0.98… … … … 88.7 91.3 86.1 0.94 95.8 98.4 94.9 0.96
D. R. Congo3
Equatorial GuineaEritreaEthiopiaGabonGambiaGhana2,3
GuineaGuinea-Bissau3
Kenya3
LesothoLiberia2
Madagascar3
MalawiMali3
Mauritius3
MozambiqueNamibia3
Niger3
Nigeria3
Rwanda3
Sao Tome and PrincipeSenegalSeychelles5
Sierra LeoneSomaliaSouth AfricaSwazilandTogoUgandaU. R. Tanzania3
ZambiaZimbabwe
World
Countries in transitionDeveloped countriesDeveloping countries
Arab States Central and Eastern EuropeCentral AsiaEast Asia and the PacificLatin America and theCaribbeanNorth America and Western EuropeSouth and West AsiaSub-Saharan Africa
GROSS INTAKE RATE (GIR)IN PRIMARY EDUCATION (%)Compulsory
education(age group)
Legalguarantee
of freeeducation1
New entrants(000)
1998/1999 2002/2003
1998/1999
Country or territoryMale Female
(F/M)Total GPI Male Female
(F/M)Total GPI
2002/2003
171172173174175176177178179180181182183184185186187188189190191192193194195196197198199200201202203
I
IIIIIIV
VVI
VIIVIII
IX
X
XIXII
1. Source: Tomasevsky (2003).Background paper for the EFAGlobal Monitoring Report 2003/4.
2. Information on compulsory education comes from the Reports under the United Nations Human Rights Treaties.3. Some primary school fees continue to be charged despite the legal guarantee for free education (World Bank, 2002a; Bentaouet-Kattan, 2005).4. No tuition fees are charged but some direct costs have been reported (World Bank, 2002a; Bentaouet-Kattan, 2005).
Median

S TAT I S T I C A L A N N E X / 3 1 1
Ta b l e 4
23.5 22.5 24.5 1.09 … … … … 4.4 ** … … … … …… … … … 48.3z 61.2z 35.3 z 0.58 z … … … … … …
17.4 18.3 16.5 0.90 26.6 28.2 25.1 0.89 4.4 ** 5.0 ** 3.7 ** 5.1 ** 5.9** 4.3 **21.4 23.8 19.0 0.80 27.1 28.8 25.4 0.88 4.0 ** 5.0 ** 3.0 ** 5.9 ** 6.9** 4.8 **… … … … … … … … 12.1 ** 12.5 ** 11.7 ** … … …
43.0 ** 43.8 ** 42.2 ** 0.96 ** 41.9** 40.7** 43.1 ** 1.06** … … … … … …
29.8 ** 30.2 ** 29.4 ** 0.97 ** 24.5** 24.2** 24.8 ** 1.02** … … … 7.3 ** 7.7** 6.9 **20.4 21.9 18.9 0.86 27.6z 29.0z 26.2 z 0.90 z … … … … … …… … … … … … … … … … … … … …
30.5 ** 30.0 ** 31.0 ** 1.03 ** 31.0** 30.1** 31.9 ** 1.06** … … … 8.5 **,z 8.7**,z 8.3 **,z
18.1 18.3 17.9 0.97 54.7 53.7 55.8 1.04 9.7 9.2 10.3 10.8 ** 10.5 11.1 **… … … … … … … … … … … … … …… … … … 37.1z 36.1z 38.2 z 1.06 z 6.2 ** 6.3 ** 6.0 ** … … …… … … … … … … … … … … 10.9 ** 11.4** 10.4 **… … … … 22.7 25.0 20.3 0.81 3.9 ** … … 4.9 ** … …
76.3 75.9 76.6 1.01 79.2 78.0 80.4 1.03 11.9 ** 11.9 ** 11.8 ** 12.7 ** 12.5** 12.8 **17.4 ** 18.1 ** 16.8 ** 0.93 ** 25.5 25.7 25.2 0.98 … … … … … …
56.1 54.6 57.6 1.06 54.9 53.5 56.3 1.05 12.1 ** 12.0 ** 12.3 ** 11.5 ** 11.4** 11.6 **26.8 32.0 21.3 0.67 41.4 48.3 34.4 0.71 … … … 2.9 **,z 3.5**,z 2.3 **,z
… … … … 87.8** 95.0** 80.2 ** 0.84** … … … 10.2 ** 11.3** 9.0 **… … … … 83.2 81.9 84.5 1.03 7.9 ** … … 8.6 ** 8.9** 8.4 **… … … … … … … … … … … 9.6 **,z 10.0**,z 9.2 **,z
39.5 40.3 ** 38.6 ** 0.96 ** … … … … 5.6 ** … … … … …
68.2 67.6 68.7 1.02 67.9 65.0 70.9 1.09 13.4 … … 13.4 ** 13.3** 13.5 **… … … … … … … … … … … 6.8 **,y 7.9**,y 5.7 **,y
… … … … … … … … … … … … … …
46.8 46.4 47.1 1.02 43.0 43.9 42.0 0.96 13.5 ** 13.3 ** 13.7 ** 13.1 ** 12.8** 13.1 **38.7 37.4 39.9 1.06 44.1 43.8 44.4 1.01 10.4 ** 10.8 ** 10.1 ** 9.6 ** 9.9** 9.3 **43.7 46.4 40.9 0.88 46.0 48.5 43.4 0.89 10.8 ** 13.1 ** 8.5 ** … … …… … … … 70.6 68.9 72.3 1.05 11.9 ** 12.7 ** 11.0 ** 12.0 ** 12.3** 11.7 **11.3 10.5 12.2 1.15 81.3** 82.1** 80.5 ** 0.98** 5.0 ** 5.1 ** 4.9 ** … … …
36.9 36.2 37.5 1.04 35.1 34.0 36.1 1.06 6.9 ** 7.4 ** 6.5 ** 6.9 **,y 7.3**,y 6.5 **,y
… … … … 42.3 41.6 43.0 1.03 … … … 10.1 ** … …
… … … … 69.6 … … … 9.8 10.3 9.4 10.5 10.8 10.2
… … … … 76.8 77.0 76.6 0.99 11.9 11.8 12.0 12.6 12.4 12.8… … … … 78.8 78.4 79.3 1.01 15.7 15.4 16.1 16.1 15.2 16.661.0 60.8 61.2 1.01 65.2 64.2 64.6 1.01 9.1 9.7 8.5 9.9 10.3 9.4
64.3 64.7 63.8 0.99 70.4 70.8 70.1 0.99 9.8 10.6 9.0 10.2 10.7 9.6… … … … 73.8 74.7 73.2 0.98 11.8 11.9 11.8 12.8 12.8 12.8… … … … 66.9 69.8 64.5 0.92 10.9 11.0 10.8 11.5 11.6 11.4… … … … … … … … 10.2 10.4 9.9 11.2 11.3 11.0
… … … … 69.6 … … … 12.2 12.1 12.2 13.1 12.8 13.3
… … … … … … … … 16.2 15.8 16.6 16.4 15.3 17.0
… … … … … … … … 8.4 9.4 7.4 9.1 9.7 8.427.5 30.1 24.8 0.82 41.6 40.9 37.2 0.91 6.7 7.4 6.0 7.8 8.5 7.0
SCHOOL LIFE EXPECTANCY(expected number of years of formal schooling)
NET INTAKE RATE (NIR)IN PRIMARY EDUCATION (%)
1998/1999 2002/2003
Total Male FemaleTotal Male Female
1998/1999
Total Male Female GPI(F/M)
2002/2003
Total Male Female GPI(F/M)
171172173174175176177178179180181182183184185186187188189190191192193194195196197198199200201202203
I
IIIIIIV
VVIVIIVIII
IX
X
XIXII
5. National population data were used to calculateenrolment ratios.6. Children can enter primary school at age 6 or 7.
7. Enrolment ratios were not calculated due to lack of United Nations population data by age.8. Enrolment ratios were not calculated due to inconsistencies between enrolment and theUnited Nations population data.
Data in bold are for 2003/2004.(z) Data are for 2001/2002.(y) Data are for 2000/2001.
Median Weighted average
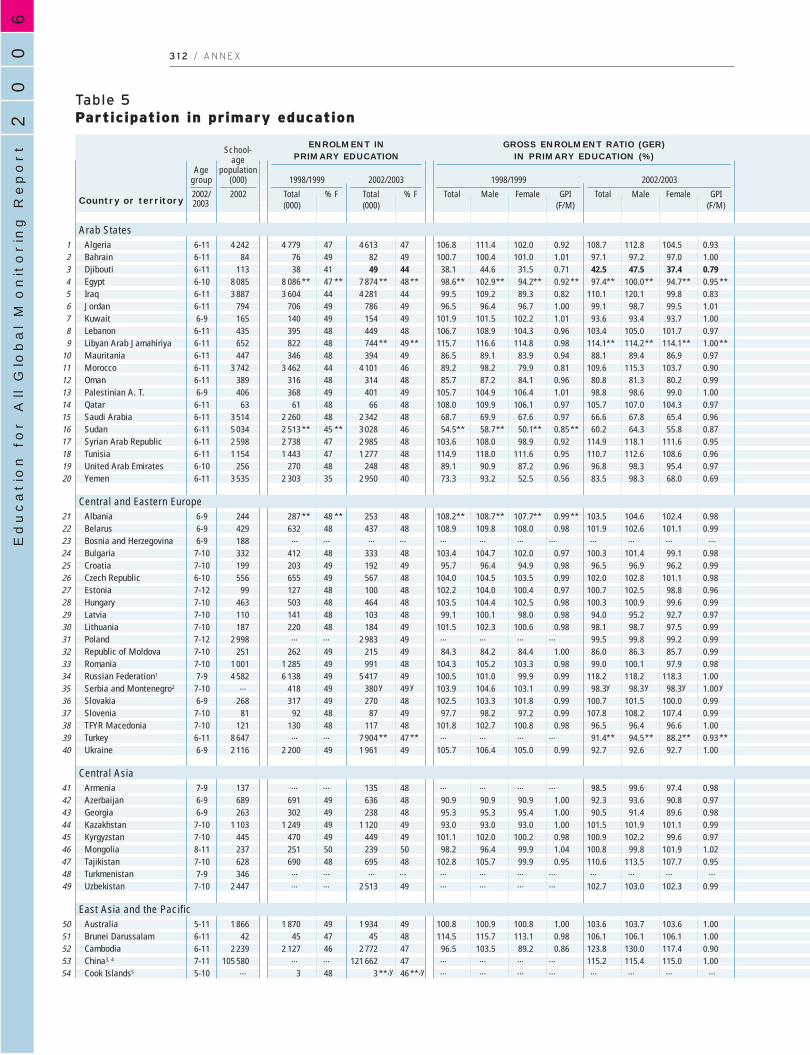
6-11 4 242 4 779 47 4 613 47 106.8 111.4 102.0 0.92 108.7 112.8 104.5 0.936-11 84 76 49 82 49 100.7 100.4 101.0 1.01 97.1 97.2 97.0 1.006-11 113 38 41 49 44 38.1 44.6 31.5 0.71 42.5 47.5 37.4 0.796-10 8 085 8 086 ** 47 ** 7 874 ** 48 ** 98.6** 102.9** 94.2** 0.92 ** 97.4** 100.0** 94.7** 0.95 **6-11 3 887 3 604 44 4 281 44 99.5 109.2 89.3 0.82 110.1 120.1 99.8 0.836-11 794 706 49 786 49 96.5 96.4 96.7 1.00 99.1 98.7 99.5 1.016-9 165 140 49 154 49 101.9 101.5 102.2 1.01 93.6 93.4 93.7 1.00
6-11 435 395 48 449 48 106.7 108.9 104.3 0.96 103.4 105.0 101.7 0.976-11 652 822 48 744 ** 49 ** 115.7 116.6 114.8 0.98 114.1** 114.2** 114.1** 1.00 **6-11 447 346 48 394 49 86.5 89.1 83.9 0.94 88.1 89.4 86.9 0.976-11 3 742 3 462 44 4 101 46 89.2 98.2 79.9 0.81 109.6 115.3 103.7 0.906-11 389 316 48 314 48 85.7 87.2 84.1 0.96 80.8 81.3 80.2 0.996-9 406 368 49 401 49 105.7 104.9 106.4 1.01 98.8 98.6 99.0 1.00
6-11 63 61 48 66 48 108.0 109.9 106.1 0.97 105.7 107.0 104.3 0.976-11 3 514 2 260 48 2 342 48 68.7 69.9 67.6 0.97 66.6 67.8 65.4 0.966-11 5 034 2 513 ** 45 ** 3 028 46 54.5** 58.7** 50.1** 0.85 ** 60.2 64.3 55.8 0.876-11 2 598 2 738 47 2 985 48 103.6 108.0 98.9 0.92 114.9 118.1 111.6 0.956-11 1 154 1 443 47 1 277 48 114.9 118.0 111.6 0.95 110.7 112.6 108.6 0.966-10 256 270 48 248 48 89.1 90.9 87.2 0.96 96.8 98.3 95.4 0.976-11 3 535 2 303 35 2 950 40 73.3 93.2 52.5 0.56 83.5 98.3 68.0 0.69
6-9 244 287 ** 48 ** 253 48 108.2** 108.7** 107.7** 0.99 ** 103.5 104.6 102.4 0.986-9 429 632 48 437 48 108.9 109.8 108.0 0.98 101.9 102.6 101.1 0.996-9 188 … … … … … … … … … … … …
7-10 332 412 48 333 48 103.4 104.7 102.0 0.97 100.3 101.4 99.1 0.987-10 199 203 49 192 49 95.7 96.4 94.9 0.98 96.5 96.9 96.2 0.996-10 556 655 49 567 48 104.0 104.5 103.5 0.99 102.0 102.8 101.1 0.987-12 99 127 48 100 48 102.2 104.0 100.4 0.97 100.7 102.5 98.8 0.967-10 463 503 48 464 48 103.5 104.4 102.5 0.98 100.3 100.9 99.6 0.997-10 110 141 48 103 48 99.1 100.1 98.0 0.98 94.0 95.2 92.7 0.977-10 187 220 48 184 49 101.5 102.3 100.6 0.98 98.1 98.7 97.5 0.997-12 2 998 … … 2 983 49 … … … … 99.5 99.8 99.2 0.997-10 251 262 49 215 49 84.3 84.2 84.4 1.00 86.0 86.3 85.7 0.997-10 1 001 1 285 49 991 48 104.3 105.2 103.3 0.98 99.0 100.1 97.9 0.987-9 4 582 6 138 49 5 417 49 100.5 101.0 99.9 0.99 118.2 118.2 118.3 1.00
7-10 … 418 49 380 y 49 y 103.9 104.6 103.1 0.99 98.3y 98.3y 98.3y 1.00 y
6-9 268 317 49 270 48 102.5 103.3 101.8 0.99 100.7 101.5 100.0 0.997-10 81 92 48 87 49 97.7 98.2 97.2 0.99 107.8 108.2 107.4 0.997-10 121 130 48 117 48 101.8 102.7 100.8 0.98 96.5 96.4 96.6 1.006-11 8 647 … … 7 904 ** 47 ** … … … … 91.4** 94.5** 88.2** 0.93 **6-9 2 116 2 200 49 1 961 49 105.7 106.4 105.0 0.99 92.7 92.6 92.7 1.00
7-9 137 … … 135 48 … … … … 98.5 99.6 97.4 0.986-9 689 691 49 636 48 90.9 90.9 90.9 1.00 92.3 93.6 90.8 0.976-9 263 302 49 238 48 95.3 95.3 95.4 1.00 90.5 91.4 89.6 0.98
7-10 1 103 1 249 49 1 120 49 93.0 93.0 93.0 1.00 101.5 101.9 101.1 0.997-10 445 470 49 449 49 101.1 102.0 100.2 0.98 100.9 102.2 99.6 0.978-11 237 251 50 239 50 98.2 96.4 99.9 1.04 100.8 99.8 101.9 1.027-10 628 690 48 695 48 102.8 105.7 99.9 0.95 110.6 113.5 107.7 0.957-9 346 … … … … … … … … … … … …
7-10 2 447 … … 2 513 49 … … … … 102.7 103.0 102.3 0.99
5-11 1 866 1 870 49 1 934 49 100.8 100.9 100.8 1.00 103.6 103.7 103.6 1.006-11 42 45 47 45 48 114.5 115.7 113.1 0.98 106.1 106.1 106.1 1.006-11 2 239 2 127 46 2 772 47 96.5 103.5 89.2 0.86 123.8 130.0 117.4 0.907-11 105 580 … … 121 662 47 … … … … 115.2 115.4 115.0 1.005-10 … 3 48 3 **,y 46 **,y … … … … … … … …
60
02
Education f
or A
ll G
lobal M
onitorin
g R
eport
3 1 2 / A N N E X
AlgeriaBahrainDjiboutiEgyptIraqJordanKuwaitLebanonLibyan Arab JamahiriyaMauritaniaMoroccoOmanPalestinian A. T.QatarSaudi ArabiaSudanSyrian Arab RepublicTunisiaUnited Arab EmiratesYemen
AlbaniaBelarusBosnia and HerzegovinaBulgariaCroatiaCzech RepublicEstoniaHungaryLatviaLithuaniaPolandRepublic of MoldovaRomaniaRussian Federation1
Serbia and Montenegro2
SlovakiaSloveniaTFYR MacedoniaTurkeyUkraine
ArmeniaAzerbaijanGeorgiaKazakhstanKyrgyzstanMongoliaTajikistanTurkmenistanUzbekistan
AustraliaBrunei DarussalamCambodiaChina3, 4
Cook Islands5
Table 5Participation in primary education
ENROLMENT INPRIMARY EDUCATION
GROSS ENROLMENT RATIO (GER) IN PRIMARY EDUCATION (%)
1998/1999Age
group 2002/2003
Total2002/2003
School-age
population(000)
2002(000)
% F Total(000)
% F
1998/1999
Country or territoryMale Female
(F/M)Total GPI
2002/2003
Male Female(F/M)
Total GPI
123456789
1011121314151617181920
2122232425262728293031323334353637383940
414243444546474849
5051525354
Arab States
Central and Eastern Europe
Central Asia
East Asia and the Pacific

S TAT I S T I C A L A N N E X / 3 1 3
Ta b l e 5
1234567891011121314151617181920
2122232425262728293031323334353637383940
414243444546474849
5051525354
92.1 94.0 90.2 0.96 94.9 96.0 93.6 0.97 353 138 215 218 86 13293.9 93.0 94.9 1.02 89.9 89.2 90.6 1.02 5 3 2 9 5 431.3 36.3 26.2 0.72 35.6 39.5 31.7 0.80 69 32 37 74 35 3990.9** 94.0** 87.6 ** 0.93 ** 91.4** 93.1 ** 89.7** 0.96 ** 746 ** 250 ** 496 ** 692 ** 283 ** 409 **91.2 98.2 83.8 0.85 90.5**,y 97.6 **,y 83.2**,y 0.85 **,y 320 33 287 355 **,y 46 **,y 308 **,y
89.6 89.2 89.9 1.01 92.0 91.3 92.7 1.02 76 40 36 63 35 2888.2 88.1 88.3 1.00 83.4 82.4 84.4 1.02 16 8 8 27 15 1387.5** 89.0** 85.9 ** 0.97 ** 90.6 90.8 90.4 0.99 46 ** 21 ** 26 ** 41 20 21… … … … … … … … … … … … … …
62.6** 64.5** 60.7 ** 0.94 ** 67.5 68.4 66.6 0.97 150 ** 71 ** 78 ** 145 71 7473.1 78.6 67.3 0.86 89.6 92.4 86.8 0.94 1 045 422 622 388 145 24375.9 76.0 75.8 1.00 71.9 71.6 72.2 1.01 89 45 44 109 56 5396.9 96.5 97.4 1.01 90.9 90.8 90.9 1.00 11 6 4 37 19 1897.1 96.6 97.7 1.01 94.5 94.6 94.3 1.00 2 1 1 3.5 1.7 1.756.8 58.7 54.8 0.93 54.4 54.7 54.2 0.99 1 420 695 725 1 602 815 786… … … … … … … … … … … … … …
93.0** 96.4** 89.5 ** 0.93 ** 97.9 100.0 95.7 0.96 185 ** 48 ** 137 ** 54 – 5494.0 95.1 92.9 0.98 97.3 97.3 97.3 1.00 75 32 44 31 16 1578.2 79.1 77.3 0.98 83.1 83.9 82.3 0.98 66 32 34 43 21 2257.4 71.8 42.4 0.59 71.8 83.6 59.4 0.71 1 337 453 883 997 296 701
99.1** 99.4** 98.7 ** 0.99 ** 94.9 95.8 94.0 0.98 2 ** 1 ** 2 ** 12 5 7… … … … 94.3 94.7 ** 93.9** 0.99 ** … … … 25 12 ** 13 **… … … … … … … … … … … … … …
95.6 96.5 94.8 0.98 90.4 90.9 89.9 0.99 17 7 10 32 15 1688.4 89.0 87.6 0.98 89.3 89.8 88.8 0.99 25 12 13 21 10 1190.2 89.9 90.6 1.01 86.5 86.5 86.6 1.00 61 33 29 75 38 3697.0** 97.9** 96.1 ** 0.98 ** 94.9 95.3 94.5 0.99 3.7** 1.4** 2.3** 5 2 389.5 89.8 89.2 0.99 90.6 91.1 90.0 0.99 51 25 26 44 21 2391.0 91.6 90.5 0.99 85.6 86.0 85.2 0.99 13 6 7 16 8 894.5 95.0 94.0 0.99 90.9 91.0 90.8 1.00 12 6 6 17 9 8… … … … 97.9 97.7 98.1 1.00 … … … 63 35 2878.2** … … … 79.0 79.4 78.6 0.99 68 ** … … 53 26 2695.7 96.0 95.4 0.99 88.9 89.4 88.5 0.99 53 25 28 111 55 56… … … … 89.7** 88.9 ** 90.4** 1.02 ** … … … 474 ** 260 ** 214 **… … … … 95.8y 95.7 y 95.9y 1.00 y … … … 16 y 8 y 8 y
… … … … 85.5 85.2 85.8 1.01 … … … 39 20 1993.9 94.4 93.5 0.99 93.4 93.6 93.1 0.99 6 3 3 5.3 2.6 2.794.5 95.6 93.4 0.98 90.8 90.8 90.8 1.00 7 3 4 11 6 5… … … … 86.4 89.1 83.5 0.94 … … … 1 179 477 702… … … … 84.3 84.3 ** 84.4** 1.00 ** … … … 331 170 ** 161 **
… … … … 94.4 95.3 93.5 0.98 … … … 7.6 3.3 4.480.1** 80.0** 80.2 ** 1.00 ** 79.9 81.1 78.6 0.97 151 ** 78 ** 73 ** 139 67 72… … … … 88.7 89.5 88.0 0.98 … … … 30 14 15… … … … 91.5 91.9 91.0 0.99 … … … 94 46 4991.0* 92.0* 90.0 * 0.98 * 89.3 90.9 87.6 0.96 42 * 19 * 23 * 48 20 2789.4 87.8 91.1 1.04 79.0 78.0 80.0 1.03 27 16 11 50 27 2394.3 97.2 91.3 0.94 … … … … 38 10 29 … … …… … … … … … … … … … … … … …… … … … … … … … … … … … … …
94.7 94.3 95.1 1.01 96.8 96.4 97.2 1.01 99 55 45 60 35 26… … … … … … … … … … … … … …
82.5** 86.5** 78.4 ** 0.91 ** 93.3 95.5 90.9 0.95 387 ** 151 ** 236 ** 151 51 100… … … … 94.6**,z 94.3 **,z 95.0**,z 1.01**,z … … … 5 819.9**,z 3 261.8**,z 2 558.1**,z
… … … … … … … … … … … … … …
NET ENROLMENT RATIO (NER)IN PRIMARY EDUCATION (%)
OUT-OF-PRIMARY-SCHOOL CHILDREN(000)
1998/1999
Total Male Female GPI(F/M)
2002/2003
Total Male Female
1998/1999
Total Male Female
2002/2003
Total Male FemaleGPI(F/M)
Arab States
Central and Eastern Europe
Central Asia
East Asia and the Pacific
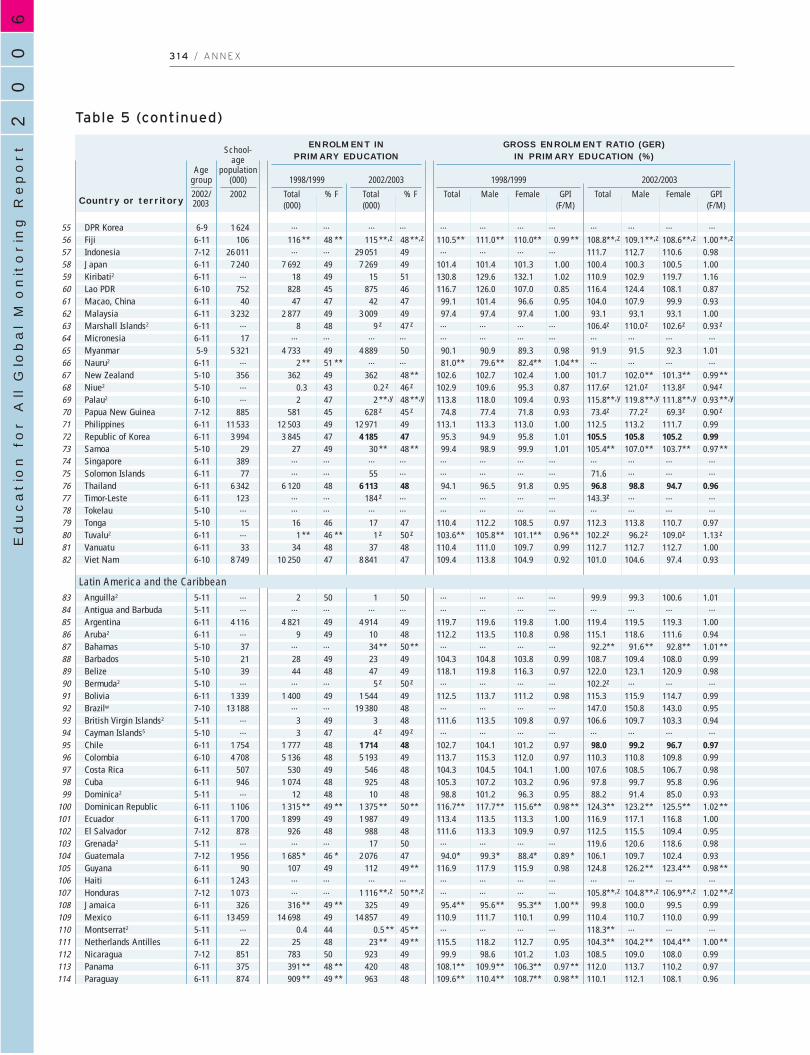
6-9 1 624 … … … … … … … … … … … …
6-11 106 116 ** 48 ** 115 **,z 48 **,z 110.5** 111.0** 110.0** 0.99 ** 108.8**,z 109.1**,z 108.6**,z 1.00 **,z
7-12 26 011 … … 29 051 49 … … … … 111.7 112.7 110.6 0.986-11 7 240 7 692 49 7 269 49 101.4 101.4 101.3 1.00 100.4 100.3 100.5 1.006-11 … 18 49 15 51 130.8 129.6 132.1 1.02 110.9 102.9 119.7 1.166-10 752 828 45 875 46 116.7 126.0 107.0 0.85 116.4 124.4 108.1 0.876-11 40 47 47 42 47 99.1 101.4 96.6 0.95 104.0 107.9 99.9 0.936-11 3 232 2 877 49 3 009 49 97.4 97.4 97.4 1.00 93.1 93.1 93.1 1.006-11 … 8 48 9 z 47 z … … … … 106.4z 110.0z 102.6z 0.93 z
6-11 17 … … … … … … … … … … … …
5-9 5 321 4 733 49 4 889 50 90.1 90.9 89.3 0.98 91.9 91.5 92.3 1.016-11 … 2 ** 51 ** … … 81.0** 79.6** 82.4** 1.04 ** … … … …
5-10 356 362 49 362 48 ** 102.6 102.7 102.4 1.00 101.7 102.0** 101.3** 0.99 **5-10 … 0.3 43 0.2 z 46 z 102.9 109.6 95.3 0.87 117.6z 121.0z 113.8z 0.94 z
6-10 … 2 47 2 **,y 48 **,y 113.8 118.0 109.4 0.93 115.8**,y 119.8**,y 111.8**,y 0.93 **,y
7-12 885 581 45 628 z 45 z 74.8 77.4 71.8 0.93 73.4z 77.2z 69.3z 0.90 z
6-11 11 533 12 503 49 12 971 49 113.1 113.3 113.0 1.00 112.5 113.2 111.7 0.996-11 3 994 3 845 47 4 185 47 95.3 94.9 95.8 1.01 105.5 105.8 105.2 0.995-10 29 27 49 30 ** 48 ** 99.4 98.9 99.9 1.01 105.4** 107.0** 103.7** 0.97 **6-11 389 … … … … … … … … … … … …
6-11 77 … … 55 … … … … … 71.6 … … …
6-11 6 342 6 120 48 6 113 48 94.1 96.5 91.8 0.95 96.8 98.8 94.7 0.966-11 123 … … 184 z … … … … … 143.3z … … …
5-10 … … … … … … … … … … … … …
5-10 15 16 46 17 47 110.4 112.2 108.5 0.97 112.3 113.8 110.7 0.976-11 … 1 ** 46 ** 1 z 50 z 103.6** 105.8** 101.1** 0.96 ** 102.2z 96.2z 109.0z 1.13 z
6-11 33 34 48 37 48 110.4 111.0 109.7 0.99 112.7 112.7 112.7 1.006-10 8 749 10 250 47 8 841 47 109.4 113.8 104.9 0.92 101.0 104.6 97.4 0.93
5-11 … 2 50 1 50 … … … … 99.9 99.3 100.6 1.015-11 … … … … … … … … … … … … …
6-11 4 116 4 821 49 4 914 49 119.7 119.6 119.8 1.00 119.4 119.5 119.3 1.006-11 … 9 49 10 48 112.2 113.5 110.8 0.98 115.1 118.6 111.6 0.945-10 37 … … 34 ** 50 ** … … … … 92.2** 91.6** 92.8** 1.01 **5-10 21 28 49 23 49 104.3 104.8 103.8 0.99 108.7 109.4 108.0 0.995-10 39 44 48 47 49 118.1 119.8 116.3 0.97 122.0 123.1 120.9 0.985-10 … … … 5 z 50 z … … … … 102.2z … … …
6-11 1 339 1 400 49 1 544 49 112.5 113.7 111.2 0.98 115.3 115.9 114.7 0.997-10 13 188 … … 19 380 48 … … … … 147.0 150.8 143.0 0.955-11 … 3 49 3 48 111.6 113.5 109.8 0.97 106.6 109.7 103.3 0.945-10 … 3 47 4 z 49 z … … … … … … … …
6-11 1 754 1 777 48 1 714 48 102.7 104.1 101.2 0.97 98.0 99.2 96.7 0.976-10 4 708 5 136 48 5 193 49 113.7 115.3 112.0 0.97 110.3 110.8 109.8 0.996-11 507 530 49 546 48 104.3 104.5 104.1 1.00 107.6 108.5 106.7 0.986-11 946 1 074 48 925 48 105.3 107.2 103.2 0.96 97.8 99.7 95.8 0.965-11 … 12 48 10 48 98.8 101.2 96.3 0.95 88.2 91.4 85.0 0.936-11 1 106 1 315 ** 49 ** 1 375 ** 50 ** 116.7** 117.7** 115.6** 0.98 ** 124.3** 123.2** 125.5** 1.02 **6-11 1 700 1 899 49 1 987 49 113.4 113.5 113.3 1.00 116.9 117.1 116.8 1.007-12 878 926 48 988 48 111.6 113.3 109.9 0.97 112.5 115.5 109.4 0.955-11 … … … 17 50 … … … … 119.6 120.6 118.6 0.987-12 1 956 1 685 * 46 * 2 076 47 94.0* 99.3* 88.4* 0.89 * 106.1 109.7 102.4 0.936-11 90 107 49 112 49 ** 116.9 117.9 115.9 0.98 124.8 126.2** 123.4** 0.98 **6-11 1 243 … … … … … … … … … … … …
7-12 1 073 … … 1 116 **,z 50 **,z … … … … 105.8**,z 104.8**,z 106.9**,z 1.02 **,z
6-11 326 316 ** 49 ** 325 49 95.4** 95.6** 95.3** 1.00 ** 99.8 100.0 99.5 0.996-11 13 459 14 698 49 14 857 49 110.9 111.7 110.1 0.99 110.4 110.7 110.0 0.995-11 … 0.4 44 0.5 ** 45 ** … … … … 118.3** … … …
6-11 22 25 48 23 ** 49 ** 115.5 118.2 112.7 0.95 104.3** 104.2** 104.4** 1.00 **7-12 851 783 50 923 49 99.9 98.6 101.2 1.03 108.5 109.0 108.0 0.996-11 375 391 ** 48 ** 420 48 108.1** 109.9** 106.3** 0.97 ** 112.0 113.7 110.2 0.976-11 874 909 ** 49 ** 963 48 109.6** 110.4** 108.7** 0.98 ** 110.1 112.1 108.1 0.96
60
02
Education f
or A
ll G
lobal M
onitorin
g R
eport
3 1 4 / A N N E X
DPR KoreaFijiIndonesiaJapanKiribati2
Lao PDRMacao, ChinaMalaysiaMarshall Islands2
MicronesiaMyanmarNauru2
New ZealandNiue2
Palau2
Papua New GuineaPhilippinesRepublic of KoreaSamoaSingaporeSolomon IslandsThailandTimor-LesteTokelauTongaTuvalu2
VanuatuViet Nam
Anguilla2
Antigua and BarbudaArgentinaAruba2
BahamasBarbadosBelizeBermuda2
BoliviaBrazilw
British Virgin Islands2
Cayman Islands5
ChileColombiaCosta RicaCubaDominica2
Dominican RepublicEcuadorEl SalvadorGrenada2
GuatemalaGuyanaHaitiHondurasJamaicaMexicoMontserrat2
Netherlands AntillesNicaraguaPanamaParaguay
Table 5 (continued)
55565758596061626364656667686970717273747576777879808182
8384858687888990919293949596979899
100101102103104105106107108109110111112113114
ENROLMENT INPRIMARY EDUCATION
GROSS ENROLMENT RATIO (GER) IN PRIMARY EDUCATION (%)
1998/1999Age
group 2002/2003
Total2002/
School-age
population(000)
2002(000)
% F Total(000)
% F
1998/1999
Country or territoryMale Female
(F/M)Total GPI
2002/2003
Male Female(F/M)
Total GPI
Latin America and the Caribbean
2003

S TAT I S T I C A L A N N E X / 3 1 5
Ta b l e 5
55565758596061626364656667686970717273747576777879808182
8384858687888990919293949596979899100101102103104105106107108109110111112113114
… … … … … … … … … … … … … …
99.4** 99.3** 99.5 ** 1.00 ** 99.8**,z 99.6 **,z 100.0**,z 1.00 **,z 0.6 ** 0.4 ** 0.2 ** 0.2 **,z 0.2 **,z – **,z
… … … … 92.4 93.3 91.5 0.98 … … … 1 970 884 1 085100.0 100.0 99.9 1.00 99.9 99.8 100.0 1.00 3 – 3 6 6 –… … … … … … … … … … … … … …
80.2 83.6 76.6 0.92 85.0 88.2 81.6 0.93 141 59 82 113 45 6884.3 83.9 84.6 1.01 87.2 87.9 86.4 0.98 7.4 3.9 3.5 5.2 2.5 2.797.4 97.4 97.4 1.00 93.1 93.1 93.1 1.00 76 39 38 223 114 109… … … … 84.4z 85.0 z 83.8z 0.99 z … … … 1.3 z 0.6 z 0.7 z
… … … … … … … … … … … … … …
82.5** 83.1** 81.8 ** 0.99 ** 84.2 83.8 84.5 1.01 921 ** 448 ** 472 ** 843 436 40781.0** 79.6** 82.4 ** 1.04 ** … … … … 0.4 ** 0.2 ** 0.2 ** … … …… … … … 99.7** 100.0 ** 99.4** 0.99 ** … … … 1 ** – ** 1 **… … … … … … … … … … … … … …
96.8** 99.4** 93.9 ** 0.94 ** 96.1**,y 100.0 **,y 92.1**,y 0.92 **,y 0.05** 0.00 ** 0.05 ** 0.1**,y – **,y 0.1**,y
74.8* 77.4* 71.8 * 0.93 * 73.0**,z 76.8 **,z 68.9**,z 0.90 **,z 196 * 93 * 103 * 231 **,z 104 **,z 127 **,z
… … … … 93.7 92.9 94.6 1.02 … … … 722 416 30694.3 93.9 94.8 1.01 99.8 100.0 99.5 1.00 229 129 99 9 – 994.2 93.2 95.2 1.02 97.5** 98.6 ** 96.4** 0.98 ** 2 1 1 0.7 ** 0.2 ** 0.5 **… … … … … … … … … … … … … …… … … … … … … … … … … … … …
79.6** 81.6** 77.6 ** 0.95 ** 85.4 86.6 84.1 0.97 1 327 ** 606 ** 721 ** 922 427 495… … … … … … … … … … … … … …… … … … … … … … … … … … … …
91.7 91.9 91.6 1.00 99.9z 100.0 z 99.7z 1.00 z 1.2 0.6 0.6 0.02z – z 0.02 z
… … … … … … … … … … … … … …
90.5** 90.3** 90.7 ** 1.00 ** 94.1** 93.0 ** 95.2** 1.02 ** 3 ** 2 ** 1 ** 2 ** 1 ** 1 **96.1 … … … 94.0**,z … … … 361 … … 544 **,z … …
… … … … 95.2 94.4 96.1 1.02 … … … 0.1 0.04 0.03… … … … … … … … … … … … … …… … … … … … … … … … … … … …
97.8 97.4 98.1 1.01 99.0 99.7 98.2 0.99 0.2 0.1 0.1 0.1 0.0 0.1… … … … 86.4** 85.1 ** 87.6** 1.03 ** … … … 5 ** 3 ** 2 **99.7** 100.0** 99.3 ** 0.99 ** 100.0 99.9 100.0 1.00 0.1 ** – ** 0.1 ** 0.01 0.01 –94.3** 94.5** 94.1 ** 1.00 ** 99.2 98.4 100.0 1.02 2 ** 1 ** 1 ** 0.3 0.3 –… … … … 100.0**,z … … … … … … – **,z … …
96.0 96.3 95.7 0.99 95.1 94.9 95.3 1.00 50 23 27 66 35 31… … … … 97.3 … … … … … … 359 … …
95.6** 94.5** 96.7 ** 1.02 ** 93.7 94.5 92.9 0.98 0.1 ** 0.07 ** 0.04 ** 0.2 0.1 0.1… … … … … … … … … … … … … …
87.9 88.4 87.4 0.99 84.8 85.4 84.3 0.99 210 102 107 265 130 13586.6 … … … 87.4 87.9 ** 86.9** 0.99 ** 603 … … 593 291 ** 302 **88.5** 87.6** 89.6 ** 1.02 ** 90.4 89.7 91.2 1.02 58 ** 32 ** 26 ** 49 27 2298.9 100.0 97.8 0.98 93.5 94.1 92.9 0.99 11 – 11 62 29 3382.9** 85.9** 79.9 ** 0.93 ** 81.3 83.4 79.2 0.95 2 ** 1 ** 1 ** 2 1 188.3** 87.5** 89.2 ** 1.02 ** 96.4 98.7 ** 94.1** 0.95 ** 131 ** 72 ** 60 ** 40 8 ** 32 **97.0 96.4 97.5 1.01 99.5 99.1 100.0 1.01 51 30 20 8 8 –81.0 74.7 87.5 1.17 90.4 90.4 90.4 1.00 158 107 51 84 43 41… … … … 84.2**,y 88.7 **,y 79.7**,y 0.90 **,y … … … 3 **,y 1 **,y 2 **,y
76.5** 79.0** 73.8 ** 0.93 ** 87.3 88.8 85.7 0.97 422 ** 192 ** 230 ** 249 112 13795.7** 96.2** 95.2 ** 0.99 ** 99.2** 100.0 ** 98.4** 0.98 ** 4 ** 2 ** 2 ** 1 ** – ** 1 **… … … … … … … … … … … … … …… … … … 87.4**,z 86.7 **,z 88.3**,z 1.02 **,z … … … 132 **,z 72 **,z 61 **,z
90.3** 90.2** 90.4 ** 1.00 ** 94.6 94.4 94.8 1.00 32 ** 16 ** 16 ** 18 9 899.5 99.1 100.0 1.01 99.4 98.8 100.0 1.01 61 61 – 83 83 –… … … … … … … … … … … … … …
96.1 95.7 96.5 1.01 88.4** 86.1 ** 90.7** 1.05 ** 0.9 0.5 0.4 3 ** 2 ** 1 **77.9** 76.9** 79.0 ** 1.03 ** 85.5 85.7 85.3 1.00 173 ** 92 ** 81 ** 124 62 6296.5** 96.7** 96.2 ** 0.99 ** 99.6 100.0 99.2 0.99 13 ** 6 ** 7 ** 1 – 191.7** 91.3** 92.1 ** 1.01 ** 89.3 89.1 89.5 1.00 69 ** 37 ** 32 ** 93 48 45
NET ENROLMENT RATIO (NER)IN PRIMARY EDUCATION (%)
OUT-OF-PRIMARY-SCHOOL CHILDREN(000)
1998/1999
Total Male Female GPI(F/M)
2002/2003
Total Male Female
1998/1999
Total Male Female
2002/2003
Total Male FemaleGPI(F/M)
Latin America and the Caribbean

6-11 3 616 4 299 49 4 283 49 122.6 123.4 121.7 0.99 118.4 118.7 118.2 1.005-11 … … … 6 49 … … … … 111.8 108.9 114.9 1.065-11 22 26 49 25 48 114.8 115.9 113.6 0.98 111.8 112.0 111.5 1.005-11 17 … … 19 49 … … … … 107.3 108.8 105.9 0.976-11 51 … … 65 ** 49 ** … … … … 125.8** 126.7** 124.8** 0.98 **5-11 141 172 49 141 49 101.7 102.3 101.1 0.99 100.1 101.4 98.7 0.976-11 … 2 49 2 49 … … … … 85.9 87.9 83.8 0.956-11 334 365 49 365 48 112.8 113.5 112.2 0.99 109.3 110.4 108.1 0.986-11 3 322 3 261 49 3 450 48 100.3 101.2 99.4 0.98 103.9 104.9 102.8 0.98
6-11 … … … 4 47 … … … … … … … …
6-9 368 389 48 380 49 102.2 102.6 101.8 0.99 103.2 103.4 103.1 1.006-11 723 763 49 762 49 103.8 104.3 103.2 0.99 105.3 105.8 104.8 0.996-11 2 420 2 404 49 2 482 **,z 49 **,z 97.7 97.7 97.7 1.00 101.3**,z 101.1**,z 101.6**,z 1.00 **,z
6-11 … 64 48 63 49 97.4 97.6 97.2 1.00 97.6 97.4 97.8 1.007-12 404 372 49 420 49 101.9 102.1 101.8 1.00 103.9 103.9 103.9 1.007-12 385 383 49 393 49 99.2 99.4 99.0 1.00 102.0 102.3 101.6 0.996-10 3 635 3 944 49 3 792 49 105.6 106.2 104.9 0.99 104.3 104.8 103.8 0.996-9 3 323 3 767 49 3 304 49 105.7 106.0 105.3 0.99 99.4 99.6 99.2 1.00
6-11 647 646 48 652 48 95.5 95.7 95.3 1.00 100.8 100.9 100.7 1.006-12 32 30 48 31 48 98.5 99.4 97.6 0.98 99.7 100.1 99.3 0.994-11 424 457 49 448 48 104.1 104.2 103.9 1.00 105.6 105.5 105.7 1.006-11 686 722 49 770 49 112.9 113.4 112.3 0.99 112.2 112.3 112.1 1.006-10 2 748 2 876 48 2 779 48 102.5 103.1 102.0 0.99 101.1 101.5 100.7 0.996-11 34 31 49 34 49 99.6 99.0 100.3 1.01 99.2 99.4 98.9 0.995-10 30 35 49 32 48 106.3 106.0 106.7 1.01 104.4 105.1 103.7 0.996-10 … 2 50 2 y 49 y … … … … … … … …
6-11 1 196 1 268 48 1 291 48 108.3 109.5 107.0 0.98 107.9 109.2 106.6 0.986-12 427 412 49 433 49 101.1 101.1 101.0 1.00 101.3 101.3 101.4 1.006-11 666 815 48 768 48 123.1 125.7 120.3 0.96 115.3 118.0 112.4 0.956-10 … … … … … … … … … … … … …
6-11 2 313 2 580 48 2 488 48 107.4 108.4 106.4 0.98 107.6 108.6 106.6 0.987-12 701 763 49 775 49 109.7 108.1 111.3 1.03 110.5 109.1 112.0 1.037-12 497 530 49 536 49 106.3 106.9 105.7 0.99 107.7 108.1 107.2 0.995-10 4 484 4 661 49 4 488 49 101.8 101.4 102.3 1.01 100.1 100.1 100.0 1.006-11 25 329 24 938 49 24 849 49 100.6 99.3 102.0 1.03 98.1 97.9 98.3 1.00
7-12 3 540 1 046 7 ** 3 267 33 32.7 59.0** 4.5** 0.08 ** 92.3 119.9 62.8 0.526-10 18 320 18 361 48 17 562 50 106.0 107.7 104.2 0.97 95.9 94.1 97.7 1.046-12 … 78 45 91 ** 47 ** … … … … … … … …
6-10 116 787 110 986 43 125 569 47 97.9 106.9 88.2 0.83 107.5 110.6 104.2 0.946-10 7 648 8 667 47 7 029 48 95.6 98.1 93.0 0.95 91.9 93.3 90.4 0.976-12 58 74 49 68 48 134.1 133.5 134.6 1.01 118.0 119.0 117.0 0.985-9 3 294 3 349 ** 42 ** 3 929 45 112.3** 125.7** 97.9** 0.78 ** 119.3 126.1 112.0 0.895-9 20 508 … … 14 045 40 … … … … 68.5 79.6 56.6 0.715-9 1 569 1 802 48 1 702 ** 49 ** 109.2 110.7 107.6 0.97 110.5** 110.8** 110.1** 0.99 **
6-9 1 564 1 342 46 … … 97.1 106.1 88.1 0.83 … … … …
6-11 1 128 872 39 1 233 42 82.7 100.4 65.0 0.65 109.3 126.9 91.6 0.726-12 321 321 50 331 ** 50 ** 102.8 102.8 102.9 1.00 103.3** 103.2** 103.4** 1.00 **7-12 2 192 816 40 1 012 42 41.8 49.6 34.0 0.68 46.2 53.1 39.2 0.747-12 1 158 702 ** 44 ** 895 45 62.7** 69.7** 55.8** 0.80 ** 77.3 85.7 69.0 0.816-11 2 601 2 134 45 2 799 46 87.5 95.9 79.0 0.82 107.6 116.1 99.0 0.856-11 73 92 49 88 49 125.6 128.5 122.7 0.96 120.6 123.6 117.5 0.956-11 633 … … 415 41 … … … … 65.5 77.9 53.3 0.686-11 1 429 840 37 1 119 ** 39 ** 67.0 84.8 49.3 0.58 78.3** 95.3** 61.4** 0.64 **6-11 119 83 45 107 ** 44 ** 75.2 81.2 69.0 0.85 89.6** 98.3** 80.7** 0.82 **6-11 634 276 49 510 48 49.6 50.8 48.4 0.95 80.4 83.3 77.5 0.936-11 2 637 1 911 43 2 046 * 44 * 73.1 83.7 62.4 0.75 77.6* 86.3* 68.8* 0.80 *
60
02
Education f
or A
ll G
lobal M
onitorin
g R
eport
3 1 6 / A N N E X
PeruSaint Kitts and Nevis2
Saint LuciaSaint Vincent/Grenad.SurinameTrinidad and TobagoTurks and Caicos Islands2
UruguayVenezuela
Andorra5
AustriaBelgiumCanadaCyprus2
DenmarkFinlandFranceGermanyGreeceIcelandIrelandIsraelItalyLuxembourgMaltaMonaco5
NetherlandsNorwayPortugalSan MarinoSpainSwedenSwitzerlandUnited KingdomUnited States
AfghanistanBangladeshBhutan6
IndiaIran, Islamic Republic ofMaldivesNepalPakistanSri Lanka
AngolaBeninBotswanaBurkina FasoBurundiCameroonCape VerdeCentral African RepublicChadComorosCongoCôte d’Ivoire
Table 5 (continued)
115116117118119120121122123
124125126127128129130131132133134135136137138139140141142143144145146147148149
150151152153154155156157158
159160161162163164165166167168169170
ENROLMENT INPRIMARY EDUCATION
GROSS ENROLMENT RATIO (GER) IN PRIMARY EDUCATION (%)
1998/1999Age
group 2002/2003
Total2002/
School-age
population(000)
2002(000)
% F Total(000)
% F
1998/1999
Country or territoryMale Female
(F/M)Total GPI
2002/2003
Male Female(F/M)
Total GPI
North America and Western Europe
South and West Asia
Sub-Saharan Africa
2003
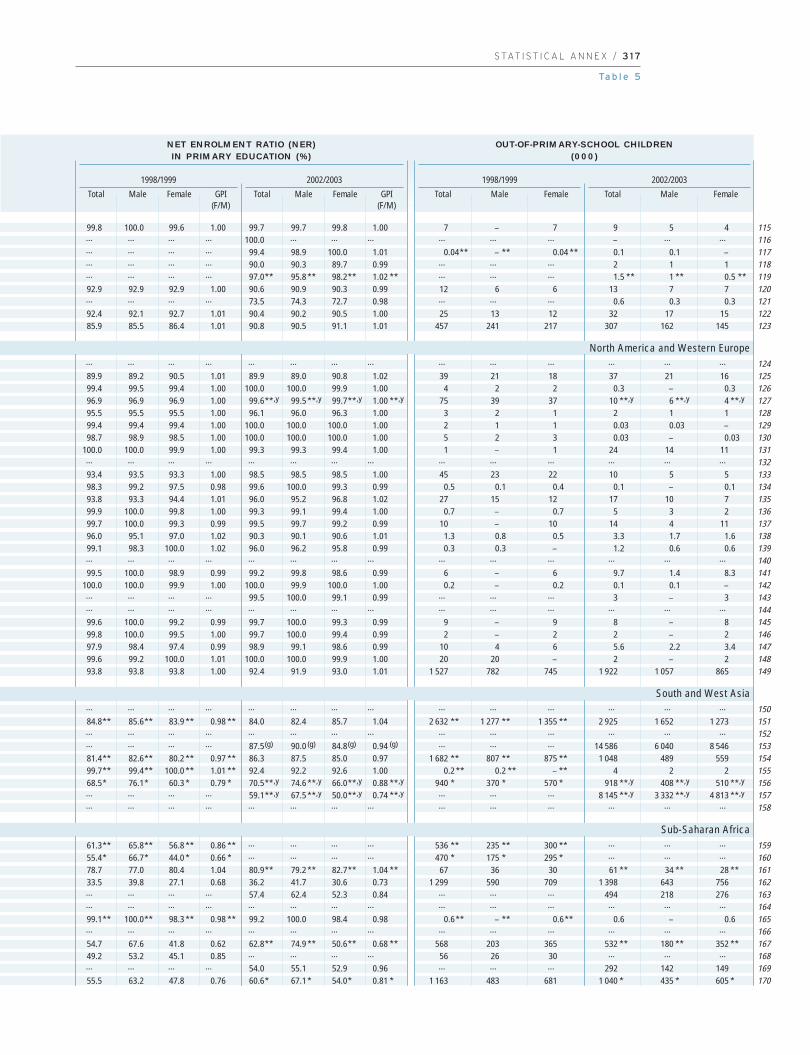
S TAT I S T I C A L A N N E X / 3 1 7
Ta b l e 5
99.8 100.0 99.6 1.00 99.7 99.7 99.8 1.00 7 – 7 9 5 4… … … … 100.0 … … … … … … – … …… … … … 99.4 98.9 100.0 1.01 0.04** – ** 0.04 ** 0.1 0.1 –… … … … 90.0 90.3 89.7 0.99 … … … 2 1 1… … … … 97.0** 95.8 ** 98.2** 1.02 ** … … … 1.5 ** 1 ** 0.5 **92.9 92.9 92.9 1.00 90.6 90.9 90.3 0.99 12 6 6 13 7 7… … … … 73.5 74.3 72.7 0.98 … … … 0.6 0.3 0.392.4 92.1 92.7 1.01 90.4 90.2 90.5 1.00 25 13 12 32 17 1585.9 85.5 86.4 1.01 90.8 90.5 91.1 1.01 457 241 217 307 162 145
… … … … … … … … … … … … … …
89.9 89.2 90.5 1.01 89.9 89.0 90.8 1.02 39 21 18 37 21 1699.4 99.5 99.4 1.00 100.0 100.0 99.9 1.00 4 2 2 0.3 – 0.396.9 96.9 96.9 1.00 99.6**,y 99.5 **,y 99.7**,y 1.00 **,y 75 39 37 10 **,y 6 **,y 4 **,y
95.5 95.5 95.5 1.00 96.1 96.0 96.3 1.00 3 2 1 2 1 199.4 99.4 99.4 1.00 100.0 100.0 100.0 1.00 2 1 1 0.03 0.03 –98.7 98.9 98.5 1.00 100.0 100.0 100.0 1.00 5 2 3 0.03 – 0.03
100.0 100.0 99.9 1.00 99.3 99.3 99.4 1.00 1 – 1 24 14 11… … … … … … … … … … … … … …
93.4 93.5 93.3 1.00 98.5 98.5 98.5 1.00 45 23 22 10 5 598.3 99.2 97.5 0.98 99.6 100.0 99.3 0.99 0.5 0.1 0.4 0.1 – 0.193.8 93.3 94.4 1.01 96.0 95.2 96.8 1.02 27 15 12 17 10 799.9 100.0 99.8 1.00 99.3 99.1 99.4 1.00 0.7 – 0.7 5 3 299.7 100.0 99.3 0.99 99.5 99.7 99.2 0.99 10 – 10 14 4 1196.0 95.1 97.0 1.02 90.3 90.1 90.6 1.01 1.3 0.8 0.5 3.3 1.7 1.699.1 98.3 100.0 1.02 96.0 96.2 95.8 0.99 0.3 0.3 – 1.2 0.6 0.6… … … … … … … … … … … … … …
99.5 100.0 98.9 0.99 99.2 99.8 98.6 0.99 6 – 6 9.7 1.4 8.3100.0 100.0 99.9 1.00 100.0 99.9 100.0 1.00 0.2 – 0.2 0.1 0.1 –… … … … 99.5 100.0 99.1 0.99 … … … 3 – 3… … … … … … … … … … … … … …
99.6 100.0 99.2 0.99 99.7 100.0 99.3 0.99 9 – 9 8 – 899.8 100.0 99.5 1.00 99.7 100.0 99.4 0.99 2 – 2 2 – 297.9 98.4 97.4 0.99 98.9 99.1 98.6 0.99 10 4 6 5.6 2.2 3.499.6 99.2 100.0 1.01 100.0 100.0 99.9 1.00 20 20 – 2 – 293.8 93.8 93.8 1.00 92.4 91.9 93.0 1.01 1 527 782 745 1 922 1 057 865
… … … … … … … … … … … … … …
84.8** 85.6** 83.9 ** 0.98 ** 84.0 82.4 85.7 1.04 2 632 ** 1 277 ** 1 355 ** 2 925 1 652 1 273… … … … … … … … … … … … … …… … … … 87.5(g) 90.0 (g) 84.8(g) 0.94 (g) … … … 14 586 6 040 8 54681.4** 82.6** 80.2 ** 0.97 ** 86.3 87.5 85.0 0.97 1 682 ** 807 ** 875 ** 1 048 489 55999.7** 99.4** 100.0 ** 1.01 ** 92.4 92.2 92.6 1.00 0.2 ** 0.2 ** – ** 4 2 268.5* 76.1* 60.3 * 0.79 * 70.5**,y 74.6 **,y 66.0**,y 0.88 **,y 940 * 370 * 570 * 918 **,y 408 **,y 510 **,y
… … … … 59.1**,y 67.5 **,y 50.0**,y 0.74 **,y … … … 8 145 **,y 3 332 **,y 4 813 **,y
… … … … … … … … … … … … … …
61.3** 65.8** 56.8 ** 0.86 ** … … … … 536 ** 235 ** 300 ** … … …
55.4* 66.7* 44.0 * 0.66 * … … … … 470 * 175 * 295 * … … …
78.7 77.0 80.4 1.04 80.9** 79.2 ** 82.7** 1.04 ** 67 36 30 61 ** 34 ** 28 **33.5 39.8 27.1 0.68 36.2 41.7 30.6 0.73 1 299 590 709 1 398 643 756… … … … 57.4 62.4 52.3 0.84 … … … 494 218 276… … … … … … … … … … … … … …
99.1** 100.0** 98.3 ** 0.98 ** 99.2 100.0 98.4 0.98 0.6** – ** 0.6** 0.6 – 0.6… … … … … … … … … … … … … …
54.7 67.6 41.8 0.62 62.8** 74.9 ** 50.6** 0.68 ** 568 203 365 532 ** 180 ** 352 **49.2 53.2 45.1 0.85 … … … … 56 26 30 … … …… … … … 54.0 55.1 52.9 0.96 … … … 292 142 14955.5 63.2 47.8 0.76 60.6* 67.1 * 54.0* 0.81 * 1 163 483 681 1 040 * 435 * 605 *
115116117118119120121122123
124125126127128129130131132133134135136137138139140141142143144145146147148149
150151152153154155156157158
159160161162163164165166167168169170
NET ENROLMENT RATIO (NER)IN PRIMARY EDUCATION (%)
OUT-OF-PRIMARY-SCHOOL CHILDREN(000)
1998/1999
Total Male Female GPI(F/M)
2002/2003
Total Male Female
1998/1999
Total Male Female
2002/2003
Total Male FemaleGPI(F/M)
North America and Western Europe
South and West Asia
Sub-Saharan Africa
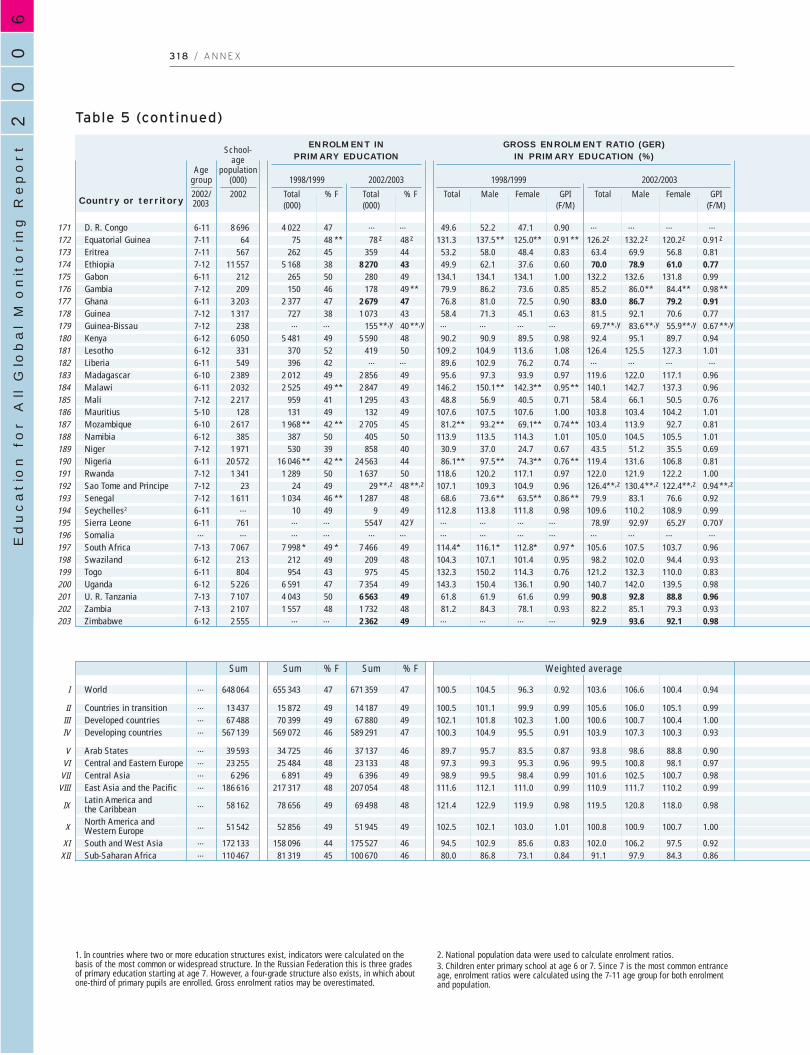
60
02
Education f
or A
ll G
lobal M
onitorin
g R
eport
3 1 8 / A N N E X
Table 5 (continued)
6-11 8 696 4 022 47 … … 49.6 52.2 47.1 0.90 … … … …
7-11 64 75 48 ** 78 z 48 z 131.3 137.5** 125.0** 0.91 ** 126.2z 132.2z 120.2z 0.91 z
7-11 567 262 45 359 44 53.2 58.0 48.4 0.83 63.4 69.9 56.8 0.817-12 11 557 5 168 38 8 270 43 49.9 62.1 37.6 0.60 70.0 78.9 61.0 0.776-11 212 265 50 280 49 134.1 134.1 134.1 1.00 132.2 132.6 131.8 0.997-12 209 150 46 178 49 ** 79.9 86.2 73.6 0.85 85.2 86.0** 84.4** 0.98 **6-11 3 203 2 377 47 2 679 47 76.8 81.0 72.5 0.90 83.0 86.7 79.2 0.917-12 1 317 727 38 1 073 43 58.4 71.3 45.1 0.63 81.5 92.1 70.6 0.777-12 238 … … 155 **,y 40 **,y … … … … 69.7**,y 83.6**,y 55.9**,y 0.67 **,y
6-12 6 050 5 481 49 5 590 48 90.2 90.9 89.5 0.98 92.4 95.1 89.7 0.946-12 331 370 52 419 50 109.2 104.9 113.6 1.08 126.4 125.5 127.3 1.016-11 549 396 42 … … 89.6 102.9 76.2 0.74 … … … …
6-10 2 389 2 012 49 2 856 49 95.6 97.3 93.9 0.97 119.6 122.0 117.1 0.966-11 2 032 2 525 49 ** 2 847 49 146.2 150.1** 142.3** 0.95 ** 140.1 142.7 137.3 0.967-12 2 217 959 41 1 295 43 48.8 56.9 40.5 0.71 58.4 66.1 50.5 0.765-10 128 131 49 132 49 107.6 107.5 107.6 1.00 103.8 103.4 104.2 1.016-10 2 617 1 968 ** 42 ** 2 705 45 81.2** 93.2** 69.1** 0.74 ** 103.4 113.9 92.7 0.816-12 385 387 50 405 50 113.9 113.5 114.3 1.01 105.0 104.5 105.5 1.017-12 1 971 530 39 858 40 30.9 37.0 24.7 0.67 43.5 51.2 35.5 0.696-11 20 572 16 046 ** 42 ** 24 563 44 86.1** 97.5** 74.3** 0.76 ** 119.4 131.6 106.8 0.817-12 1 341 1 289 50 1 637 50 118.6 120.2 117.1 0.97 122.0 121.9 122.2 1.007-12 23 24 49 29 **,z 48 **,z 107.1 109.3 104.9 0.96 126.4**,z 130.4**,z 122.4**,z 0.94 **,z
7-12 1 611 1 034 46 ** 1 287 48 68.6 73.6** 63.5** 0.86 ** 79.9 83.1 76.6 0.926-11 … 10 49 9 49 112.8 113.8 111.8 0.98 109.6 110.2 108.9 0.996-11 761 … … 554 y 42 y … … … … 78.9y 92.9y 65.2y 0.70 y
… … … … … … … … … … … … … …
7-13 7 067 7 998 * 49 * 7 466 49 114.4* 116.1* 112.8* 0.97 * 105.6 107.5 103.7 0.966-12 213 212 49 209 48 104.3 107.1 101.4 0.95 98.2 102.0 94.4 0.936-11 804 954 43 975 45 132.3 150.2 114.3 0.76 121.2 132.3 110.0 0.836-12 5 226 6 591 47 7 354 49 143.3 150.4 136.1 0.90 140.7 142.0 139.5 0.987-13 7 107 4 043 50 6 563 49 61.8 61.9 61.6 0.99 90.8 92.8 88.8 0.967-13 2 107 1 557 48 1 732 48 81.2 84.3 78.1 0.93 82.2 85.1 79.3 0.936-12 2 555 … … 2 362 49 … … … … 92.9 93.6 92.1 0.98
… 648 064 655 343 47 671 359 47 100.5 104.5 96.3 0.92 103.6 106.6 100.4 0.94
… 13 437 15 872 49 14 187 49 100.5 101.1 99.9 0.99 105.6 106.0 105.1 0.99… 67 488 70 399 49 67 880 49 102.1 101.8 102.3 1.00 100.6 100.7 100.4 1.00… 567 139 569 072 46 589 291 47 100.3 104.9 95.5 0.91 103.9 107.3 100.3 0.93
… 39 593 34 725 46 37 137 46 89.7 95.7 83.5 0.87 93.8 98.6 88.8 0.90… 23 255 25 484 48 23 133 48 97.3 99.3 95.3 0.96 99.5 100.8 98.1 0.97… 6 296 6 891 49 6 396 49 98.9 99.5 98.4 0.99 101.6 102.5 100.7 0.98… 186 616 217 317 48 207 054 48 111.6 112.1 111.0 0.99 110.9 111.7 110.2 0.99
… 58 162 78 656 49 69 498 48 121.4 122.9 119.9 0.98 119.5 120.8 118.0 0.98
… 51 542 52 856 49 51 945 49 102.5 102.1 103.0 1.01 100.8 100.9 100.7 1.00
… 172 133 158 096 44 175 527 46 94.5 102.9 85.6 0.83 102.0 106.2 97.5 0.92… 110 467 81 319 45 100 670 46 80.0 86.8 73.1 0.84 91.1 97.9 84.3 0.86
ENROLMENT INPRIMARY EDUCATION
GROSS ENROLMENT RATIO (GER) IN PRIMARY EDUCATION (%)
1998/1999Age
group 2002/2003
Total2002/
School-age
population(000)
2002(000)
% F Total(000)
% F
1998/1999
Country or territoryMale Female
(F/M)Total GPI
2002/2003
Male Female(F/M)
Total GPI
Sum Sum % F Sum % F Weighted average
D. R. CongoEquatorial GuineaEritreaEthiopiaGabonGambiaGhanaGuineaGuinea-BissauKenyaLesothoLiberiaMadagascarMalawiMaliMauritiusMozambiqueNamibiaNigerNigeriaRwandaSao Tome and PrincipeSenegalSeychelles2
Sierra LeoneSomaliaSouth AfricaSwazilandTogoUgandaU. R. TanzaniaZambiaZimbabwe
World
Countries in transitionDeveloped countriesDeveloping countries
Arab States Central and Eastern EuropeCentral AsiaEast Asia and the PacificLatin America and the CaribbeanNorth America andWestern EuropeSouth and West AsiaSub-Saharan Africa
1. In countries where two or more education structures exist, indicators were calculated on thebasis of the most common or widespread structure. In the Russian Federation this is three grades of primary education starting at age 7. However, a four-grade structure also exists, in which aboutone-third of primary pupils are enrolled. Gross enrolment ratios may be overestimated.
2. National population data were used to calculate enrolment ratios.3. Children enter primary school at age 6 or 7. Since 7 is the most common entranceage, enrolment ratios were calculated using the 7-11 age group for both enrolment and population.
171172173174175176177178179180181182183184185186187188189190191192193194195196197198199200201202203
I
IIIIIIV
VVI
VIIVIII
IX
X
XIXII
2003

S TAT I S T I C A L A N N E X / 3 1 9
Ta b l e 5
… … … … … … … … … … … … … …
88.0 96.4** 79.7 ** 0.83 ** 84.6z 91.4 z 77.8z 0.85 z 7 1 ** 6 ** 10 z 3 z 7 z
33.9 36.2 31.6 0.87 45.2 48.7 41.7 0.86 325 158 167 310 147 16435.8 42.4 29.2 0.69 51.1 55.2 46.9 0.85 6 651 2 987 3 664 5 780 2 653 3 126… … … … 78.3**,y 78.9 **,y 77.8**,y 0.99 **,y … … … 45 **,y 22 **,y 23 **,y
66.7 71.0 62.3 0.88 78.8** 79.3 ** 78.2** 0.99 ** 63 27 35 44 ** 22 ** 23 **57.9** 59.8** 55.9 ** 0.93 ** 59.0 … … … 1 304 ** 626 ** 679 ** 1 323 … …
45.3 53.6 36.7 0.69 65.5 72.6 58.1 0.80 681 293 388 455 183 272… … … … … … … … … … … … … …
65.8** 65.3** 66.3 ** 1.01 ** 66.5 66.4 66.5 1.00 2 077 ** 1 057 ** 1 020 ** 2 030 1 019 1 01064.5 60.3 68.7 1.14 85.8 82.9 88.6 1.07 120 67 53 47 28 1943.9 49.7 38.1 0.77 … … … … 248 111 136 … … …
64.5 64.3 64.8 1.01 78.6 78.4 78.7 1.00 746 375 371 511 258 254… … … … … … … … … … … … … …
38.3** 44.5** 32.0 ** 0.72 ** 44.5 50.2 38.7 0.77 1 212 ** 553 ** 660 ** 1 231 559 67193.2 93.1 93.2 1.00 96.6 95.6 97.6 1.02 8 4 4 4 3 247.3** 51.6** 43.0 ** 0.83 ** 55.3 57.7 52.7 0.91 1 277 ** 589 ** 687 ** 1 171 555 61677.9 75.4 80.4 1.07 78.3 75.7 80.9 1.07 75 42 33 84 47 3726.1 31.3 20.8 0.66 38.2 45.1 31.1 0.69 1 264 598 667 1 218 551 668… … … … 67.2** 73.9 ** 60.2** 0.82 ** … … … 6 754 ** 2 731 ** 4 023 **… … … … 86.7 85.1 88.3 1.04 … … … 178 99 7985.5 86.5 84.4 0.98 97.1**,z 100.0 **,z 94.2**,z 0.94 **,z 3.2 1.5 1.2 0.7 **,z – **,z 0.7 **,z
57.9 61.5** 54.1 ** 0.88 ** 68.5 71.2 65.8 0.92 635 293 ** 343 ** 507 234 27399.1 100.0 98.3 0.98 99.6 100.0 99.1 0.99 0.1 – 0.1 0.04 – 0.04… … … … … … … … … … … … … …… … … … … … … … … … … … … …
91.3* 90.8* 91.8 * 1.01 * 89.0 88.7 89.3 1.01 608 * 322 * 286 * 778 402 37667.2 66.5 67.9 1.02 75.3 75.1 75.4 1.00 67 34 33 53 26 2689.8 100.0 79.5 0.80 91.2 98.9 83.3 0.84 74 – 74 71 4 67… … … … … … … … … … … … … …
45.8 45.1 46.6 1.03 77.4** 78.3 ** 76.4** 0.98 ** 3 545 1 803 1 742 1 635 ** 786 ** 849 **68.5 69.6 67.4 0.97 68.4 69.1 67.7 0.98 604 292 312 666 326 339… … … … 79.2 78.5 79.8 1.02 … … … 530 274 256
83.6 86.5 80.6 0.93 84.6 86.5 82.6 0.96 106 724 45 316 61 408 99 876 45 030 54 846
85.4 85.9 84.9 0.99 89.1 89.3 88.9 1.00 2 304 1 135 1 170 1 468 736 73296.6 96.6 96.6 1.00 95.6 95.4 95.9 1.01 2 367 1 210 1 157 2 949 1 593 1 35682.0 85.2 78.6 0.92 83.2 85.3 80.9 0.95 102 052 42 971 59 081 95 459 42 701 52 758
78.1 82.3 73.7 0.90 82.6 85.7 79.2 0.92 8 491 3 501 4 991 6 906 2 882 4 02587.2 88.7 85.7 0.97 89.0 89.9 88.0 0.98 3 340 1 510 1 830 2 569 1 203 1 36688.9 89.4 88.3 0.99 89.9 90.8 89.0 0.98 775 375 400 635 294 34195.7 95.9 95.6 1.00 92.1 92.4 91.8 0.99 8 309 4 158 4 151 14 782 7 410 7 372
94.4 95.1 93.7 0.99 96.4 97.1 95.7 0.99 3 620 1 623 1 997 2 084 858 1 226
96.3 96.3 96.3 1.00 95.3 95.0 95.6 1.01 1 885 967 918 2 421 1 320 1 101
78.6 85.5 71.3 0.83 82.5 85.7 79.1 0.92 35 722 12 534 23 189 30 109 12 698 17 41156.2 59.6 52.7 0.88 63.5 66.9 59.9 0.90 44 581 20 648 23 933 40 370 18 367 22 003
NET ENROLMENT RATIO (NER)IN PRIMARY EDUCATION (%)
OUT-OF-PRIMARY-SCHOOL CHILDREN(000)
1998/1999
Total Male Female GPI(F/M)
2002/2003
Total Male Female
1998/1999
Total Male Female
2002/2003
Total Male FemaleGPI(F/M)
Weighted average Sum
4. Pending agreement on population data, the 2001NER published herein in connection with China’sprimary education is for reference only.5. Enrolment ratios were not calculated due to lackof United Nations population data by age.
6. Enrolment ratios were not calculated due to inconsistencies between enrolment and the United Nations population data.(g) Projected at the national level (593 districts) on the basis of data by age collected for ISCED level 1 in a sample of 193 districts under the District Information System on Education.
Data in bold are for 2003/2004.(z) Data are for 2001/2002.(y) Data are for 2000/2001.
171172173174175176177178179180181182183184185186187188189190191192193194195196197198199200201202203
I
IIIIIIV
VVIVIIVIII
IX
X
XIXII

60
02
Education f
or A
ll G
lobal M
onitorin
g R
eport
3 2 0 / A N N E X
Table 6Internal efficiency: repetition in primary education
6 10.9 12.3 9.3 9.8 11.6 7.7 9.5 11.9 6.7 10.9 13.6 7.96 0.4 ** 0.4 ** 0.4 ** 3.4 ** 3.2 ** 3.5 ** 3.1 ** 3.4 ** 2.8 ** 4.2 ** 4.7 ** 3.7 **6 2.5 ** 2.7 ** 2.4 ** 16.8 ** 16.2 ** 17.6 ** … … … … … …
5 – – – 3.1 ** 3.8 ** 2.4 ** 3.7 ** 4.6 ** 2.7 ** 5.8 ** 7.2 ** 4.3 **6 … … … … … … … … … … … …
6 0.3 0.3 0.3 0.1 0.1 0.2 0.1 0.1 0.1 0.5 0.4 0.54 3.7 3.8 3.5 1.9 1.9 1.9 3.1 3.6 2.6 1.6 1.9 1.36 4.7 5.5 3.8 6.3 7.6 4.9 6.7 8.2 5.1 18.8 21.7 15.66 … … … … … … … … … … … …
6 13.7 13.2 14.2 15.2 14.9 15.6 16.1 16.0 16.3 14.9 14.4 15.36 17.2 18.2 16.1 14.9 16.6 12.9 15.4 17.7 12.8 12.4 14.8 9.46 0.2 0.2 0.1 0.1 0.2 0.1 0.1 0.1 0.1 1.2 1.5 0.94 0.8 0.6 1.0 1.2 1.3 1.2 0.4 0.4 0.4 2.4 2.6 2.36 3.0 ** 3.4 ** 2.5 ** … … … … … … … … …
6 7.7 9.9 5.4 4.9 7.3 2.2 5.3 7.8 2.5 4.2 5.3 3.26 5.3 4.6 6.2 4.7 3.9 5.6 4.8 4.6 5.0 5.7 5.4 6.06 12.9 14.0 11.8 8.9 10.1 7.5 5.8 6.6 4.8 4.2 5.1 3.26 0.2 0.2 0.2 10.2 11.7 8.6 11.1 13.1 8.9 9.5 11.5 7.45 2.8 2.9 2.7 2.4 2.6 2.2 2.1 2.3 1.9 3.1 4.3 1.86 3.6 3.8 3.5 4.1 4.2 4.0 4.9 5.2 4.3 5.5 6.0 4.7
4 5.2 x 5.6 x 4.7 x 4.2 x 5.0 x 3.3 x 3.0 x 3.4 x 2.7 x 3.3 x 3.8 x 2.8 x
4 0.6 0.6 0.6 0.3 0.3 0.3 0.1 0.1 0.1 0.1 0.1 0.14 … … … … … … … … … … … …
4 1.0 1.1 0.8 3.2 3.7 2.6 2.1 2.4 1.7 2.5 2.8 2.24 0.9 1.0 0.8 0.3 0.3 0.2 0.2 0.2 0.1 0.1 0.1 0.15 1.6 1.8 1.5 1.0 1.2 0.8 0.8 0.9 0.7 0.9 1.1 0.86 1.4 1.6 1.2 0.9 1.3 0.6 1.7 2.3 1.0 2.0 2.7 1.14 4.8 5.5 4.0 2.0 2.3 1.7 1.5 1.8 1.1 1.3 1.7 1.04 3.7 4.9 2.5 1.4 1.8 0.9 1.1 1.4 0.7 1.0 1.4 0.74 1.3 1.6 1.0 0.3 0.4 0.3 0.3 0.4 0.2 0.4 0.6 0.26 0.7 … … 0.3 … … 0.4 … … 0.7 … …
4 0.6 0.6 0.6 0.3 0.3 0.3 0.3 0.3 0.3 0.4 0.4 0.44 4.9 5.6 4.2 1.9 2.4 1.4 1.7 2.1 1.3 2.0 2.4 1.63 0.9 … … 0.7 … … 0.6 … … . . .4 1.4 **,x 1.4 **,x 1.4 **,x 1.3 **,x 1.3 **,x 1.3 **,x 0.8 **,x 0.8 **,x 0.8 **,x 0.7 **,x 0.6 **,x 0.7 **,x
4 4.6 4.9 4.2 2.1 2.3 1.9 1.4 1.6 1.2 1.5 1.7 1.34 0.9 1.0 0.7 0.6 0.7 0.4 0.4 0.6 0.3 0.5 0.6 0.44 0.2 0.3 0.2 0.2 0.3 0.1 0.1 0.2 0.0 0.2 0.2 0.16 … … … … … … … … … … … …
4 0.3 0.3 0.2 0.1 0.1 ** 0.1 ** 0.1 0.1 0.1 … … …
3 – – – 0.2 0.2 0.1 0.2 0.2 0.2 . . .4 0.3 0.3 0.2 0.4 0.4 0.3 0.3 0.4 0.3 0.3 0.4 0.34 0.2 0.3 0.2 0.1 0.2 0.1 0.1 0.2 0.1 0.2 0.3 0.14 0.1 0.1 0.0 0.2 0.3 0.1 0.1 0.2 0.1 0.1 0.2 0.14 0.1 0.2 0.1 0.2 0.2 0.1 0.2 0.2 0.1 0.1 0.2 0.14 1.3 1.4 1.2 0.7 0.7 0.6 0.4 0.4 0.3 0.3 0.3 0.34 0.2 0.2 0.2 0.4 0.4 ** 0.4 ** 0.3 0.3 ** 0.3 ** 0.4 0.4 ** 0.4 **3 … … … … … … … … … . . .4 – – – – – – – – – – – –
7 … … … … … … … … … … … …
6 . . . . . . . . . . . .6 17.9 18.5 17.1 11.0 11.9 9.9 8.0 9.0 6.8 5.5 6.2 4.65 1.4 1.6 ** 1.3 ** 0.2 0.2 ** 0.1 ** 0.1 0.2 ** 0.1 ** 0.1 0.1 ** 0.1 **6 … … … … … … … … … … … …
4 … … … … … … … … … … … …
6 . . . . . . . . . . . .
AlgeriaBahrainDjiboutiEgyptIraqJordanKuwaitLebanonLibyan Arab JamahiriyaMauritaniaMoroccoOmanPalestinian A. T.QatarSaudi ArabiaSudanSyrian Arab RepublicTunisiaUnited Arab EmiratesYemen
AlbaniaBelarusBosnia and HerzegovinaBulgariaCroatiaCzech RepublicEstoniaHungaryLatviaLithuaniaPolandRepublic of MoldovaRomaniaRussian FederationSerbia and MontenegroSlovakiaSloveniaTFYR MacedoniaTurkeyUkraine
ArmeniaAzerbaijanGeorgiaKazakhstanKyrgyzstanMongoliaTajikistanTurkmenistanUzbekistan
AustraliaBrunei DarussalamCambodiaChinaCook IslandsDPR KoreaFiji
REPETITION RATES BY GRADE IN PRIMARY EDUCATION (%), 2001/2002
Grade 1 Grade 2 Grade 3 Grade 4
Duration1
of primaryeducation
Total Male Female Total Male Female Total Male Female Total Male Female2002/2003Country or territory
123456789
1011121314151617181920
2122232425262728293031323334353637383940
414243444546474849
50515253545556
Arab States
Central and Eastern Europe
Central Asia
East Asia and the Pacific

S TAT I S T I C A L A N N E X / 3 2 1
Ta b l e 6
11.2 14.0 8.0 15.9 19.0 12.4 . . . 11.9 14.6 8.7 11.6 14.1 8.83.9 ** 4.4 ** 3.4 ** 2.5 ** 3.4 ** 1.4 ** . . . 3.8 4.6 3.1 2.9 3.2 2.5… … … … … … . . . 16.6 16.7 ** 16.4 ** 18.0 17.4 18.79.6 ** 11.8 ** 7.2 ** . . . . . . 6.0 ** 7.1 ** 4.6 ** 4.5 ** 5.6 ** 3.3 **… … … … … … . . . 10.0 10.7 9.2 … … …
0.9 1.0 0.9 1.0 1.1 1.0 . . . 0.7 0.7 0.7 0.5 0.5 0.4. . . . . . . . . 3.3 3.4 3.1 2.5 2.8 2.3
9.7 11.2 8.1 9.5 10.9 8.1 . . . 9.1 10.5 7.7 9.7 11.4 7.9… … … … … … . . . … … … … … …
11.8 11.5 12.2 28.1 26.2 30.1 . . . … … … 15.2 14.8 15.510.6 13.0 7.6 9.4 11.5 6.7 . . . 12.4 14.1 10.2 13.7 15.6 11.5
1.0 1.3 0.7 0.7 0.8 0.6 . . . 8.0 9.5 6.4 0.5 0.7 0.4. . . . . . . . . 2.1 2.2 2.0 1.2 1.2 1.2
… … … 4.6 ** 7.0 ** 2.0 ** . . . 2.7 ** 3.5 ** 1.9 ** … … …
4.6 6.0 3.2 1.9 2.5 1.3 . . . 5.4 6.6 4.2 4.8 6.5 3.06.0 5.8 6.2 5.8 5.7 6.0 . . . … … … 5.1 4.7 5.53.3 3.8 2.7 3.7 4.2 3.2 . . . 6.5 7.2 5.6 6.8 7.6 5.8
12.1 14.2 9.7 8.0 9.6 6.3 . . . 18.3 20.0 16.4 9.2 10.8 7.33.1 4.2 2.0 . . . . . . 3.5 4.4 2.5 2.6 3.2 2.15.4 6.0 4.3 4.6 5.2 3.5 . . . 10.6 11.7 * 8.7 * 4.3 4.8 3.7
. . . . . . . . . 3.9 ** 4.6 ** 3.3 ** 2.8 3.2 2.4… … … … … … . . . 0.5 0.5 0.5 0.2 0.2 0.2… … … … … … . . . … … … … … …
. . . . . . . . . 3.2 3.7 2.7 2.3 2.6 1.9
. . . . . . . . . 0.4 0.5 0.3 0.4 0.4 0.30.9 1.1 0.6 . . . . . . 1.2 1.5 1.0 1.1 1.3 0.92.3 3.6 1.0 3.5 5.4 1.3 . . . 2.5 3.5 1.4 2.3 3.3 1.1
. . . . . . . . . 2.2 2.1 2.2 2.4 2.9 2.0
. . . . . . . . . 2.1 2.7 ** 1.3 ** 1.9 2.5 1.3
. . . . . . . . . 0.9 1.3 0.5 0.6 0.8 0.40.8 … … 0.6 … … . . . 1.2 … … 0.6 … …
. . . . . . . . . 0.9 0.9 ** 0.9 ** 0.4 0.4 0.4
. . . . . . . . . 3.4 4.1 2.6 2.8 3.3 2.2
. . . . . . . . . 1.2 … … 0.8 … …
. . . . . . . . . … … … 1.0 y 1.0 **,y 1.0 **,y
. . . . . . . . . 2.3 2.6 2.0 2.5 2.7 2.2
. . . . . . . . . 1.0 1.3 0.7 0.6 0.7 0.4
. . . . . . . . . 0.0 0.1 0.0 0.2 0.2 0.1… … … … … … . . . … … … … … …
. . . . . . . . . 0.8 … … 0.1 0.2 0.1
. . . . . . . . . … … … 0.1 0.1 0.1
. . . . . . . . . 0.4 0.4 0.4 0.3 0.4 0.3
. . . . . . . . . 0.3 0.5 ** 0.2 ** 0.2 0.2 0.1
. . . . . . . . . 0.3 … … 0.1 0.2 0.1
. . . . . . . . . 0.3 0.4 0.2 0.1 0.2 0.1
. . . . . . . . . 0.9 1.0 0.8 0.6 0.7 0.6
. . . . . . . . . 0.5 0.5 ** 0.6 ** 0.3 0.3 ** 0.3 **
. . . . . . . . . … … … … … …
. . . . . . . . . – – – – – –
… … … … … … … … … … … … … … …
. . . . . . . . . . . . . . .3.7 4.2 3.0 1.9 2.0 1.7 . . . 24.6 ** 25.5 ** 23.5 ** 10.1 10.8 9.30.1 0.1 ** 0.1 ** . . . . . . … … … 0.3 0.4 0.3… … … … … … . . . 0.6 0.9 ** 0.2 ** … … …
. . . . . . . . . … … … … … …
. . . . . . . . . . . . . . .
REPETITION RATES BY GRADE IN PRIMARY EDUCATION (%), 2001/2002
Grade 5
Total Male Female
Grade 6
Total Male Female
Grade 7
Total Male Female
1998/1999 2002/2003
REPEATERS, ALL GRADES (%)
Total Male Female Total Male Female
1234567891011121314151617181920
2122232425262728293031323334353637383940
414243444546474849
50515253545556
Arab States
Central and Eastern Europe
Central Asia
East Asia and the Pacific
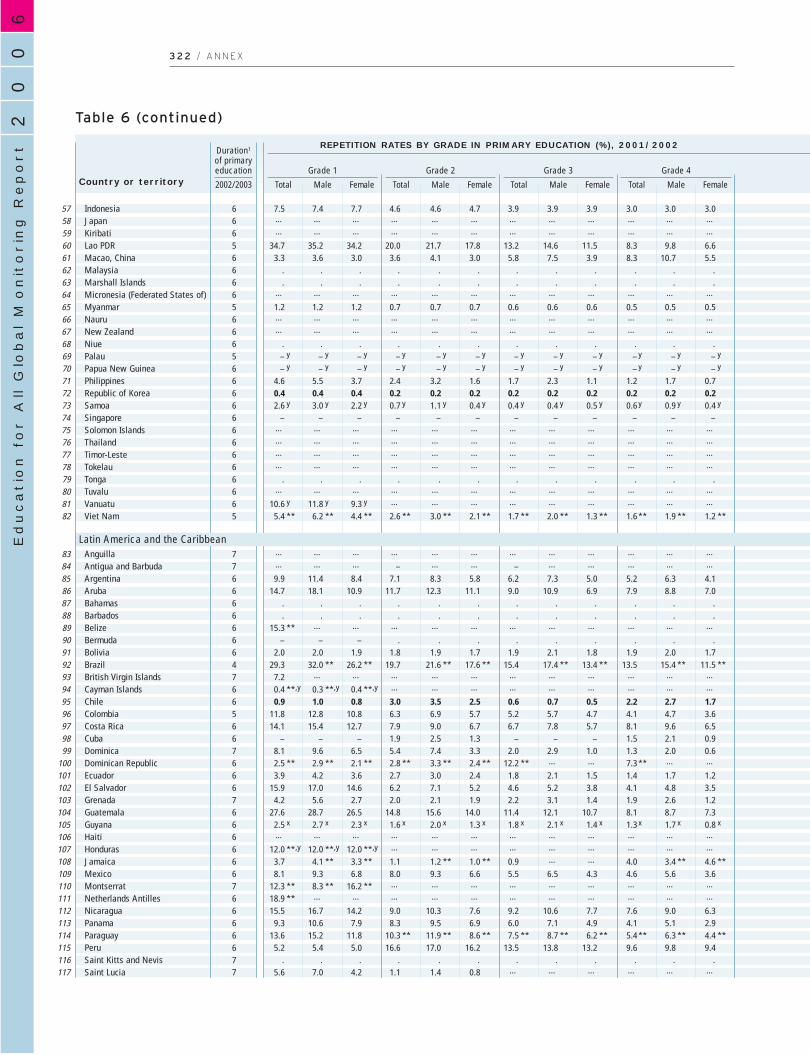
60
02
Education f
or A
ll G
lobal M
onitorin
g R
eport
3 2 2 / A N N E X
Table 6 (continued)
6 7.5 7.4 7.7 4.6 4.6 4.7 3.9 3.9 3.9 3.0 3.0 3.06 … … … … … … … … … … … …
6 … … … … … … … … … … … …
5 34.7 35.2 34.2 20.0 21.7 17.8 13.2 14.6 11.5 8.3 9.8 6.66 3.3 3.6 3.0 3.6 4.1 3.0 5.8 7.5 3.9 8.3 10.7 5.56 . . . . . . . . . . . .6 . . . . . . . . . . . .6 … … … … … … … … … … … …
5 1.2 1.2 1.2 0.7 0.7 0.7 0.6 0.6 0.6 0.5 0.5 0.56 … … … … … … … … … … … …
6 … … … … … … … … … … … …
6 . . . . . . . . . . . .5 – y – y – y – y – y – y – y – y – y – y – y – y
6 – y – y – y – y – y – y – y – y – y – y – y – y
6 4.6 5.5 3.7 2.4 3.2 1.6 1.7 2.3 1.1 1.2 1.7 0.76 0.4 0.4 0.4 0.2 0.2 0.2 0.2 0.2 0.2 0.2 0.2 0.26 2.6 y 3.0 y 2.2 y 0.7 y 1.1 y 0.4 y 0.4 y 0.4 y 0.5 y 0.6 y 0.9 y 0.4 y
6 – – – – – – – – – – – –6 … … … … … … … … … … … …
6 … … … … … … … … … … … …
6 … … … … … … … … … … … …
6 … … … … … … … … … … … …
6 . . . . . . . . . . . .6 … … … … … … … … … … … …
6 10.6 y 11.8 y 9.3 y … … … … … … … … …
5 5.4 ** 6.2 ** 4.4 ** 2.6 ** 3.0 ** 2.1 ** 1.7 ** 2.0 ** 1.3 ** 1.6 ** 1.9 ** 1.2 **
7 … … … … … … … … … … … …
7 … … … – … … – … … … … …
6 9.9 11.4 8.4 7.1 8.3 5.8 6.2 7.3 5.0 5.2 6.3 4.16 14.7 18.1 10.9 11.7 12.3 11.1 9.0 10.9 6.9 7.9 8.8 7.06 . . . . . . . . . . . .6 . . . . . . . . . . . .6 15.3 ** … … … … … … … … … … …
6 – – – . . . . . . . . .6 2.0 2.0 1.9 1.8 1.9 1.7 1.9 2.1 1.8 1.9 2.0 1.74 29.3 32.0 ** 26.2 ** 19.7 21.6 ** 17.6 ** 15.4 17.4 ** 13.4 ** 13.5 15.4 ** 11.5 **7 7.2 … … … … … … … … … … …
6 0.4 **,y 0.3 **,y 0.4 **,y … … … … … … … … …
6 0.9 1.0 0.8 3.0 3.5 2.5 0.6 0.7 0.5 2.2 2.7 1.75 11.8 12.8 10.8 6.3 6.9 5.7 5.2 5.7 4.7 4.1 4.7 3.66 14.1 15.4 12.7 7.9 9.0 6.7 6.7 7.8 5.7 8.1 9.6 6.56 – – – 1.9 2.5 1.3 – – – 1.5 2.1 0.97 8.1 9.6 6.5 5.4 7.4 3.3 2.0 2.9 1.0 1.3 2.0 0.66 2.5 ** 2.9 ** 2.1 ** 2.8 ** 3.3 ** 2.4 ** 12.2 ** … … 7.3 ** … …
6 3.9 4.2 3.6 2.7 3.0 2.4 1.8 2.1 1.5 1.4 1.7 1.26 15.9 17.0 14.6 6.2 7.1 5.2 4.6 5.2 3.8 4.1 4.8 3.57 4.2 5.6 2.7 2.0 2.1 1.9 2.2 3.1 1.4 1.9 2.6 1.26 27.6 28.7 26.5 14.8 15.6 14.0 11.4 12.1 10.7 8.1 8.7 7.36 2.5 x 2.7 x 2.3 x 1.6 x 2.0 x 1.3 x 1.8 x 2.1 x 1.4 x 1.3 x 1.7 x 0.8 x
6 … … … … … … … … … … … …
6 12.0 **,y 12.0 **,y 12.0 **,y … … … … … … … … …
6 3.7 4.1 ** 3.3 ** 1.1 1.2 ** 1.0 ** 0.9 … … 4.0 3.4 ** 4.6 **6 8.1 9.3 6.8 8.0 9.3 6.6 5.5 6.5 4.3 4.6 5.6 3.67 12.3 ** 8.3 ** 16.2 ** … … … … … … … … …
6 18.9 ** … … … … … … … … … … …
6 15.5 16.7 14.2 9.0 10.3 7.6 9.2 10.6 7.7 7.6 9.0 6.36 9.3 10.6 7.9 8.3 9.5 6.9 6.0 7.1 4.9 4.1 5.1 2.96 13.6 15.2 11.8 10.3 ** 11.9 ** 8.6 ** 7.5 ** 8.7 ** 6.2 ** 5.4 ** 6.3 ** 4.4 **6 5.2 5.4 5.0 16.6 17.0 16.2 13.5 13.8 13.2 9.6 9.8 9.47 . . . . . . . . . . . .7 5.6 7.0 4.2 1.1 1.4 0.8 … … … … … …
IndonesiaJapanKiribatiLao PDRMacao, ChinaMalaysiaMarshall IslandsMicronesia (Federated States of)MyanmarNauruNew ZealandNiuePalauPapua New GuineaPhilippinesRepublic of KoreaSamoaSingaporeSolomon IslandsThailandTimor-LesteTokelauTongaTuvaluVanuatuViet Nam
AnguillaAntigua and BarbudaArgentinaArubaBahamasBarbadosBelizeBermudaBoliviaBrazilBritish Virgin IslandsCayman IslandsChileColombiaCosta RicaCubaDominicaDominican RepublicEcuadorEl SalvadorGrenadaGuatemalaGuyanaHaitiHondurasJamaicaMexicoMontserratNetherlands AntillesNicaraguaPanamaParaguayPeruSaint Kitts and NevisSaint Lucia
REPETITION RATES BY GRADE IN PRIMARY EDUCATION (%), 2001/2002
Grade 1 Grade 2 Grade 3 Grade 4
Duration1
of primaryeducation
Total Male Female Total Male Female Total Male Female Total Male Female2002/2003Country or territory
5758596061626364656667686970717273747576777879808182
8384858687888990919293949596979899
100101102103104105106107108109110111112113114115116117
Latin America and the Caribbean

S TAT I S T I C A L A N N E X / 3 2 3
Ta b l e 6
2.1 2.1 2.1 0.3 0.3 0.3 . . . … … … 3.8 3.8 3.8… … … … … … . . . … … … … … …… … … … … … . . . … … … … … …
5.3 6.4 4.0 . . . . . . 20.9 22.4 19.1 19.8 21.0 18.4… … … … … … . . . 6.3 7.3 5.1 7.1 8.9 5.1
. . . . . . . . . . . . . . .
. . . . . . . . . . . . . . .… … … … … … . . . … … … … … …
0.3 0.3 0.3 . . . . . . 1.7 1.7 ** 1.7 ** 0.7 0.7 0.7… … … … … … . . . 0.7 ** 0.9 ** 0.5 ** … … …… … … … … … . . . … … … … … …
. . . . . . . . . . . . . . .– y – y – y . . . . . . – – – – – –– y – y – y – y – y – y . . . – – – – – –
1.0 1.4 0.5 0.5 0.7 0.3 . . . 1.9 2.4 1.4 2.1 2.7 1.40.2 0.2 0.2 0.2 0.2 0.2 . . . . . . 0.2 0.2 0.20.6 y … … 0.3 y … … . . . 1.7 2.4 ** 0.9 ** 0.9 z 1.1 z 0.7 z
– – – – – – . . . – – – – – –… … … … … … . . . … … … … … …… … … … … … . . . 3.5 3.4 3.5 … … …… … … … … … . . . … … … … … …… … … … … … . . . … … … . y . y . y
. . . 28.5 ** 31.0 ** 25.4 ** . . . 7.4 7.9 6.9 6.2 z 6.9 z 5.4 z
… … … … … … . . . 6.5 ** 7.4 ** 5.4 ** … … …… … … … … … . . . 10.9 ** 11.5 ** 10.2 ** 6.7 z 7.5 z 5.9 z
0.2 ** 0.2 ** 0.2 ** … … … . . . 3.8 4.2 3.2 2.4 ** 2.8 ** 1.9 **
… … … … … … … … … 0.3 0.4 0.3 0.8 ** 1.0 ** 0.6 **… … … … … … … … … … … … … … …
4.3 5.2 3.3 3.6 4.5 2.7 . . . 5.3 6.2 4.3 5.9 7.0 4.87.7 8.8 6.6 3.5 3.9 3.2 . . . 7.7 9.5 5.9 9.0 10.3 7.5
. . . . . . . . . . . . . . .
. . . . . . . . . . . . . . .… … … 8.8 ** … … . . . 9.7 10.8 8.4 9.4 ** 11.0 ** 7.7 **
. . . . . . . . . … … … . . .1.9 2.0 1.7 3.8 4.4 3.2 . . . 6.5 6.9 6.2 2.1 2.3 1.9
. . . . . . . . . … … … 20.6 23.0 ** 18.1 **… … … … … … … … … 4.3 ** 4.3 ** 4.2 ** 4.4 4.6 4.2… … … … … … . . . … … … … … …
2.4 3.1 1.6 2.2 2.9 1.5 . . . 3.2 3.8 2.6 2.0 2.4 1.53.1 3.5 2.6 … … … . . . 4.6 5.0 4.2 6.6 7.3 5.96.3 7.4 5.1 0.6 0.7 0.6 . . . 8.7 ** 9.6 ** 7.7 ** 7.5 8.5 6.30.8 1.1 0.5 0.3 0.4 0.2 . . . 1.9 2.6 1.1 0.8 1.1 0.50.9 1.1 0.6 1.1 1.7 0.3 6.9 8.9 4.7 3.6 3.8 3.5 3.8 5.0 2.55.5 ** … … 4.3 ** … … . . . 4.1 ** 4.5 ** 3.7 ** 5.9 ** 7.1 ** 4.6 **0.9 1.1 0.8 0.5 0.6 0.4 . . . 2.7 3.0 2.4 2.0 2.3 1.83.3 4.0 2.6 3.0 3.7 2.4 . . . 7.5 8.3 6.7 7.0 7.8 6.11.4 … … 2.1 … … 4.0 … … … … … 2.7 3.3 2.15.1 5.6 4.4 1.8 2.1 1.5 . . . 14.9 ** 15.8 ** 13.8 ** 14.1 14.8 13.41.1 x 1.4 x 0.8 x 1.3 x 1.4 x 1.1 x . . . 3.1 3.6 2.5 1.6 y 1.9 y 1.3 y
… … … … … … . . . … … … … … …… … … … … … . . . … … … … … …
1.0 … … 6.2 … … . . . … … … 2.8 … …
3.1 3.9 2.3 0.5 0.6 0.4 . . . 6.6 7.6 5.5 5.1 6.1 4.1… … … … … … … … … 0.9 … – 17.0 ** 18.0 ** 15.7 **… … … … … … . . . 12.0 ** 14.5 ** 9.3 ** 12.6 ** 15.6 ** 9.6 **5.5 6.6 4.4 3.1 4.0 2.3 . . . 8.1 9.0 7.2 8.9 10.1 7.72.6 3.3 1.9 1.0 1.3 0.8 . . . … … … 5.4 6.4 4.43.4 ** 4.1 ** 2.6 ** 1.7 ** 2.1 ** 1.2 ** . . . 9.0 ** 10.4 ** 7.6 ** 7.6 8.8 6.38.1 8.4 7.8 3.9 4.1 3.8 . . . 9.8 10.0 9.5 9.9 10.2 9.7
. . . . . . . . . . . . . . .… … … … … … … … … 2.4 ** 2.8 ** 2.0 ** 2.7 3.4 1.9
REPETITION RATES BY GRADE IN PRIMARY EDUCATION (%), 2001/2002
Grade 5
Total Male Female
Grade 6
Total Male Female
Grade 7
Total Male Female
1998/1999 2002/2003
REPEATERS, ALL GRADES (%)
Total Male Female Total Male Female
5758596061626364656667686970717273747576777879808182
8384858687888990919293949596979899100101102103104105106107108109110111112113114115116117
Latin America and the Caribbean

60
02
Education f
or A
ll G
lobal M
onitorin
g R
eport
3 2 4 / A N N E X
Table 6 (continued)
7 8.8 ** … … 4.8 ** … … 8.7 … … 7.6 … …
6 … … … … … … … … … … … …
7 6.6 **,y 7.6 **,y 5.6 **,y 3.2 **,y 4.1 **,y 2.2 **,y 2.6 **,y 3.2 **,y 2.1 **,y 1.8 **,y 2.2 **,y 1.3 **,y
6 9.4 8.7 9.9 5.1 11.5 – 5.6 3.1 8.2 4.6 4.8 4.46 17.0 19.3 14.3 10.7 12.2 9.1 8.0 9.3 6.5 6.2 7.4 5.06 11.7 13.6 9.6 9.0 10.8 7.1 8.8 10.7 6.7 6.7 8.4 4.9
6 … … … – – – – – – – – –4 1.8 **,x 2.1 **,x 1.5 **,x 1.7 **,x 1.9 **,x 1.5 **,x 1.4 **,x 1.7 **,x 1.1 **,x 1.2 **,x 1.4 **,x 1.0 **,x
6 … … … … … … … … … … … …
6 … … … … … … … … … … … …
6 1.3 1.6 1.0 0.1 0.2 0.0 0.1 0.1 0.0 0.0 0.1 –6 . . . . . . . . . . . .6 0.8 1.0 0.6 0.9 1.1 0.7 0.4 0.4 0.3 0.2 0.3 0.25 … … … … … … … … … … … …
4 1.5 1.6 1.4 2.2 2.2 2.1 1.6 1.7 1.5 1.1 1.2 1.06 … … … … … … … … … … … …
7 – – – – – – – – – – – –8 1.0 1.1 0.8 2.1 2.4 1.8 1.7 2.0 1.4 0.9 1.0 0.86 2.2 ** 3.0 ** 1.4 ** 1.1 ** 1.4 ** 0.8 ** 1.2 ** 1.5 ** 0.8 ** 1.2 ** 1.6 ** 0.9 **5 0.4 y 0.5 y 0.3 y 0.3 y 0.4 y 0.2 y 0.2 y 0.3 y 0.2 y 0.2 y 0.3 y 0.1 y
6 6.7 **,y 7.4 **,y 5.8 **,y 5.1 **,y 6.1 **,y 4.1 **,y 6.6 **,y 8.1 **,y 5.1 **,y 4.0 **,y 4.8 **,y 3.2 **,y
6 0.8 0.8 0.8 0.7 0.9 0.5 0.7 0.6 0.7 0.8 0.9 0.65 … … … … … … … … … … … …
6 . . . . . . . . . . . .7 – – – – – – – – – – – –6 … … … … … … … … … … … …
5 … … … … … … … … … … … …
6 … … … … … … … … … … … …
6 … … … … … … … … … … … …
6 … … … … … … … … … … … …
6 … … … … … … … … … … … …
6 … … … … … … … … … … … …
6 … … … … … … … … … … … …
5 6.4 6.6 6.3 5.5 5.6 5.3 7.8 7.4 8.2 6.1 6.3 5.87 14.8 y 15.5 y 14.0 y 13.7 y 14.4 y 12.9 y 14.0 y 14.8 y 13.1 y 11.5 y 12.5 y 10.4 y
5 3.9 3.6 4.3 2.8 2.6 3.1 4.2 4.0 4.6 4.4 4.4 4.65 5.5 ** 6.5 ** 4.4 ** 3.4 ** … … 2.3 ** … … 2.3 ** … …
7 . . . . . . . . . . . .5 36.8 36.9 36.6 17.2 16.4 18.3 13.7 13.6 13.9 14.0 13.6 14.65 … … … … … … … … … … … …
5 0.4 ** 0.5 ** 0.4 ** 0.7 ** 0.7 ** 0.6 ** 0.8 ** 0.9 ** 0.7 ** 0.9 ** 1.1 ** 0.8 **
4 … … … … … … … … … … … …
6 16.8 17.0 16.6 16.8 16.4 17.4 18.5 17.8 19.3 23.5 22.5 25.07 4.0 ** 4.6 ** 3.4 ** 2.2 ** 2.5 ** 1.8 ** 2.1 ** 2.6 ** 1.5 ** 10.8 ** 13.1 ** 8.3 **6 10.1 ** 10.2 ** 10.0 ** 10.9 ** 11.0 ** 10.8 ** 15.3 ** 15.5 ** 15.1 ** 14.6 ** 14.4 ** 14.7 **6 27.1 26.4 28.0 26.6 26.4 26.8 24.8 24.2 25.6 24.3 23.5 25.26 31.5 ** 31.9 ** 31.1 ** 21.9 ** 22.7 ** 21.0 ** 30.6 ** 30.9 ** 30.2 ** 21.6 ** 22.1 ** 20.9 **6 0.8 0.9 0.6 26.8 30.8 22.3 0.7 0.8 0.6 23.8 27.1 20.46 … … … … … … … … … … … …
6 29.4 ** 29.3 ** 29.5 ** 26.3 ** 26.0 ** 26.8 ** 26.1 ** 25.9 ** 26.5 ** 24.2 ** 23.4 ** 25.5 **6 34.5 **,y 35.3 **,y 33.5 **,y … … … … … … … … …
6 30.0 30.6 29.4 20.3 20.1 20.5 34.3 35.1 33.4 29.5 30.6 28.46 13.3 ** 14.0 ** 12.5 ** … … … … … … … … …
6 … … … … … … … … … … … …
5 48.1 **,y 44.6 **,y 51.7 **,y 40.2 **,y 38.1 **,y 42.2 **,y 33.6 **,y 32.8 **,y 34.4 **,y 32.5 **,y 33.0 **,y 32.0 **,y
5 29.8 29.4 30.3 19.6 19.2 20.1 19.0 18.2 20.0 22.5 21.5 23.76 20.3 ** 21.4 ** 18.9 ** 8.2 ** 7.3 ** 9.5 ** 6.9 ** 5.9 ** 8.4 ** 9.6 ** 8.1 ** 11.7 **
Saint Vincent/Grenad.SurinameTrinidad and TobagoTurks and Caicos IslandsUruguayVenezuela
AndorraAustriaBelgiumCanadaCyprusDenmarkFinlandFranceGermanyGreeceIcelandIrelandIsraelItalyLuxembourgMaltaMonacoNetherlandsNorwayPortugalSan MarinoSpainSwedenSwitzerlandUnited KingdomUnited States
AfghanistanBangladeshBhutanIndiaIran, Islamic Republic ofMaldivesNepalPakistanSri Lanka
AngolaBeninBotswanaBurkina FasoBurundiCameroonCape VerdeCentral African RepublicChadComorosCongoCôte d’IvoireDemocratic Rep. of the CongoEquatorial GuineaEritreaEthiopia
REPETITION RATES BY GRADE IN PRIMARY EDUCATION (%), 2001/2002
Grade 1 Grade 2 Grade 3 Grade 4
Duration1
of primaryeducation
Total Male Female Total Male Female Total Male Female Total Male Female2002/2003Country or territory
118119120121122123
124125126127128129130131132133134135136137138139140141142143144145146147148149
150151152153154155156157158
159160161162163164165166167168169170171172173174
North America and Western Europe
South and West Asia
Sub-Saharan Africa

S TAT I S T I C A L A N N E X / 3 2 5
Ta b l e 6
11.2 … … 12.2 … … 18.3 … … … … … 10.0 12.0 7.8… … … … … … . . . … … … … … …
1.9 **,y 2.1 **,y 1.7 **,y 3.7 **,y 3.9 **,y 3.5 **,y 9.0 **,y 8.2 **,y 9.8 **,y 4.7 4.9 4.4 5.0 5.9 4.04.3 5.4 3.2 18.0 20.0 15.7 . . . … … … 9.7 10.9 8.55.0 6.1 3.8 2.2 2.6 1.8 . . . 8.4 9.9 6.9 8.4 9.7 6.94.6 5.7 3.4 1.8 2.3 1.2 . . . 6.7 ** 8.1 ** 5.2 ** 7.5 9.1 5.8
– – – – – – . . . … … … – – –. . . . . . . . . 1.5 1.8 1.3 … … …
… … … … … … . . . … … … … … …… … … … … … . . . … … … … … …
0.01 0.04 0.02 0.1 0.1 0.1 . . . 0.4 0.5 0.3 0.3 0.3 0.2. . . . . . . . . . . . . . .
0.2 0.3 0.1 0.2 0.2 0.1 . . . 0.4 0.6 0.3 0.5 0.6 0.3… … … … … … . . . 4.2 4.2 ** 4.2 **… … … … … … . . . 1.7 1.9 1.5 1.6 1.7 1.5… … … … … … . . . … … … … … …
– – – – – – – – – – – – – – –0.6 0.7 0.6 0.7 0.6 0.8 0.6 0.6 0.6 1.8 2.1 1.6 1.1 1.2 0.91.5 ** 1.8 ** 1.0 ** 1.0 ** 1.2 ** 0.8 ** . . . … … … 1.8 2.2 1.30.3 y 0.4 y 0.3 y … … … . . . 0.4 0.5 0.3 0.3 0.3 0.24.1 **,y 5.2 **,y 2.9 **,y 0.4 **,y 0.5 **,y 0.4 **,y . . . … … … 4.5 **,z 5.4 **,z 3.6 **,z
0.7 0.8 0.5 9.0 9.9 7.9 . . . 2.1 2.4 1.8 2.4 2.6 2.1… … … . . . . . . – – – – – –
. . . . . . . . . . . . . . .– – – – – – … … … … … … – – –
… … … … … … . . . … … … … … …… … … . . . . . . … … … … … …… … … … … … . . . … … … … … …… … … 2.1 x 2.1 x 2.1 x . . . . . . … … …… … … … … … . . . 1.8 1.9 1.6 1.6 1.8 1.5… … … … … … . . . … … … … … …… … … … … … . . . … … … … … …
… … … … … … . . . … … … … … …
5.0 6.1 4.0 . . . . . . 6.7 6.9 6.5 6.2 6.5 6.015.0 y 15.6 y 14.4 y 11.9 y 11.6 y 12.2 y 11.8 y 11.0 y 12.8 y 13.0 13.8 12.1 12.9 ** 13.5 ** 12.3 **
4.6 4.5 4.7 … … … . . . 4.0 4.0 4.1 3.6 3.6 3.61.1 ** … … . . . . . . … … … 3.0 ** 3.6 ** 2.5 **
. . . . . . . . . … … … . . .11.0 10.9 11.1 … … … . . . 24.5 ** 23.8 ** 25.5 ** 21.7 21.6 21.8
… … … … … … . . . … … … … … …
1.0 ** 1.3 ** 0.8 ** . . . . . . 5.1 6.0 4.2 0.8 ** 0.9 ** 0.7 **
. . . . . . . . . 29.5 ** 29.3 ** 29.8 ** … … …
28.9 27.6 31.0 34.6 34.5 34.7 . . . … … … 19.9 19.9 20.01.4 ** 1.8 ** 1.1 ** 1.1 ** 1.4 ** 0.7 ** 0.1 ** 0.2 ** 0.1 ** 3.1 3.7 2.5 3.2 ** 4.0 ** 2.5 **
16.7 ** 15.7 ** 18.2 ** 33.9 ** 33.1 ** 35.1 ** . . . 17.7 17.5 18.0 15.1 15.0 15.234.9 34.0 36.1 45.3 44.5 46.4 . . . 20.3 ** 20.3 ** 20.4 ** 26.5 26.2 26.925.6 ** 26.2 ** 25.0 ** 22.8 ** 24.7 ** 20.6 ** . . . 26.7 ** 26.8 ** 26.5 ** 25.8 26.4 25.1
0.8 1.0 0.6 15.3 17.2 13.4 . . . 11.6 ** 12.8 ** 10.3 ** 13.4 15.5 11.2… … … … … … . . . … … … … … …
20.1 ** 19.3 ** 21.7 ** 23.3 23.8 22.0 . . . 25.9 25.7 26.3 25.3 ** 24.8 ** 25.9 **… … … 29.5 **,y 32.4 **,y 26.1 **,y . . . 26.0 26.4 25.5 28.0 ** 29.3 ** 26.3 **
27.3 28.0 26.6 12.6 13.5 11.7 . . . … … … 27.8 28.4 27.2… … … … … … . . . 23.7 22.8 ** 24.9 ** 17.6 * 17.5 * 17.7 *… … … … … … . . . … … … … … …
33.5 **,y 32.0 **,y 35.0 **,y . . . . . . … … … 40.5 z 38.1 z 43.0 z
16.1 15.1 17.3 . . . . . . 19.4 18.2 20.8 20.7 20.1 21.59.3 ** 7.3 ** 12.5 ** 5.6 ** 4.5 ** 7.6 ** . . . 10.6 9.8 11.9 10.6 ** 10.1 ** 11.2 **
REPETITION RATES BY GRADE IN PRIMARY EDUCATION (%), 2001/2002
Grade 5
Total Male Female
Grade 6
Total Male Female
Grade 7
Total Male Female
1998/1999 2002/2003
REPEATERS, ALL GRADES (%)
Total Male Female Total Male Female
118119120121122123
124125126127128129130131132133134135136137138139140141142143144145146147148149
150151152153154155156157158
159160161162163164165166167168169170171172173174
North America and Western Europe
South and West Asia
Sub-Saharan Africa

60
02
Education f
or A
ll G
lobal M
onitorin
g R
eport
3 2 6 / A N N E X
Table 6 (continued)
6 48.1 ** 49.1 ** 47.0 ** 33.2 ** 33.7 ** 32.6 ** 37.0 ** 38.3 ** 35.6 ** 24.8 ** 25.1 ** 24.5 **6 14.1 ** 14.6 ** 13.7 ** … … … … … … … … …
6 8.9 ** 9.1 ** 8.7 ** … … … … … … … … …
6 22.5 22.3 22.8 17.9 16.9 19.3 19.9 18.8 21.4 20.3 18.7 22.76 … … … … … … … … … … … …
7 8.2 ** 9.5 ** 6.9 ** 7.9 ** 8.3 ** 7.6 ** 8.2 ** 8.4 ** 8.0 ** 9.3 ** 10.2 ** 8.4 **7 27.1 28.9 24.9 25.1 27.8 22.2 25.5 29.2 21.6 19.7 22.8 16.76 … … … … … … … … … … … …
5 41.2 42.4 39.9 31.3 33.0 29.3 33.1 34.4 31.8 26.6 27.1 26.16 17.5 17.9 17.0 17.0 17.3 16.7 15.3 14.4 16.5 12.2 10.8 14.16 13.1 12.9 13.3 14.1 13.7 14.7 21.9 21.8 22.0 23.8 22.9 25.06 . . . . . . . . . . . .5 25.8 25.4 26.1 25.0 24.7 25.4 25.2 24.5 26.2 22.0 21.1 23.37 15.2 15.9 14.5 11.9 ** 14.1 ** 9.6 ** 11.4 ** 13.7 ** 9.1 ** 13.0 ** … …
6 0.9 0.9 0.8 5.5 5.3 5.7 7.2 7.0 7.7 8.4 8.1 9.06 … … … … … … … … … … … …
6 19.3 19.6 19.0 14.8 15.2 14.5 15.3 15.4 15.2 17.9 17.6 18.26 32.6 y 34.6 y 30.2 y 28.9 y 30.0 y 27.7 y 23.7 y 23.7 y 23.6 y 18.2 y 18.7 y 17.7 y
6 10.7 10.7 10.6 12.4 12.4 12.4 12.1 12.1 12.2 14.3 14.1 14.56 . . . . . . . . . . . .6 … … … … … … … … … … … …
7 … … … … … … … … … … … …
7 9.2 ** 9.5 ** 9.0 ** … … … … … … … … …
7 18.6 21.1 15.9 15.3 18.4 11.8 17.7 20.9 14.2 15.6 18.0 13.06 28.9 29.2 28.6 23.1 22.8 23.4 25.0 24.4 25.8 20.4 19.5 21.47 13.8 14.1 13.4 10.0 10.3 9.8 10.8 10.9 10.6 10.6 10.7 10.57 9.2 ** 9.2 ** 9.2 ** 7.0 ** 6.9 ** 7.0 ** 4.6 ** 4.4 ** 4.7 ** 12.1 ** 11.4 ** 12.8 **7 5.4 ** 5.5 ** 5.3 ** 6.7 ** … … 6.9 ** … … 7.9 ** 0.7 0.77 . . . . . . . . . . . .
4.0 4.6 3.4 2.6 2.7 2.6 2.1 2.5 1.6 2.7 3.0 2.5
0.2 0.3 0.2 0.2 0.3 0.1 0.2 0.2 0.1 0.2 0.2 0.11.0 1.1 0.8 0.9 1.1 0.7 0.7 0.6 0.7 0.7 … …
7.6 8.7 6.5 5.4 7.4 3.3 5.4 6.0 4.8 5.4 6.3 4.5
3.7 3.8 3.5 4.7 3.9 5.6 4.9 5.2 4.3 5.5 6.0 4.71.1 1.4 0.9 0.8 … … 0.7 … … 0.8 … …
0.1 0.2 0.1 0.2 0.2 0.1 0.2 0.2 0.1 0.2 0.3 0.10.6 0.6 0.6 0.2 0.2 0.1 0.1 0.2 0.1 0.1 0.1 0.1
8.1 9.3 6.8 5.0 … … 5.2 5.7 4.7 4.1 4.7 3.5
0.8 1.0 0.8 0.5 0.6 0.4 0.3 0.4 0.2 0.2 0.3 0.2
5.9 6.5 5.3 4.5 … … 6.0 5.7 6.4 5.3 5.3 5.216.8 17.0 15.9 15.3 18.4 11.8 15.3 14.4 16.5 17.9 17.6 18.2
GabonGambiaGhanaGuineaGuinea-BissauKenyaLesothoLiberiaMadagascarMalawiMaliMauritiusMozambiqueNamibiaNigerNigeriaRwandaSao Tome and PrincipeSenegalSeychellesSierra LeoneSomaliaSouth AfricaSwazilandTogoUgandaUnited Republic of TanzaniaZambiaZimbabwe
World2
Countries in transitionDeveloped countriesDeveloping countries
Arab States Central and Eastern EuropeCentral AsiaEast Asia and the PacificLatin America and the CaribbeanNorth America and Western EuropeSouth and West AsiaSub-Saharan Africa
REPETITION RATES BY GRADE IN PRIMARY EDUCATION (%), 2001/2002
Grade 1 Grade 2 Grade 3 Grade 4
Duration1
of primaryeducation
Total Male Female Total Male Female Total Male Female Total Male Female2002/2003Country or territory
175176177178179180181182183184185186187188189190191192193194195196197198199200201202203
I
IIIIIIV
VVI
VIIVIII
IX
X
XIXII
1. Duration in this table is defined according to ISCED97 and may differ from that reported nationally. 2. All values shown are medians.Data in bold are for 2002/2003 for repetition rates by grade, and 2003/2004 for percentage of repeaters (all grades).
(z) Data are for 2001/2002.(y) Data are for 2000/2001.(x) Data are for 1999/2000.

S TAT I S T I C A L A N N E X / 3 2 7
Ta b l e 6
27.7 ** 27.4 ** 28.0 ** 19.3 ** 19.0 ** 19.6 ** . . . … … … 34.4 ** 35.1 ** 33.7 **… … … … … … . . . 10.6 10.7 10.5 … … …… … … … … … . . . 4.2 4.3 4.1 5.9 ** 6.1 ** 5.7 **
21.9 20.6 23.9 32.4 31.5 34.1 . . . 26.2 25.5 27.4 20.3 19.8 21.0… … … … … … . . . 24.0 ** 23.6 ** 24.5 ** … … …
9.6 ** … … 8.2 ** … … 11.1 ** … … … … … 9.2 ** 9.7 ** 8.7 **14.7 17.1 12.6 12.6 13.9 11.6 11.9 11.4 12.2 20.3 23.3 17.4 21.2 23.8 18.6
… … … … … … . . . … … … … … …
31.1 31.1 31.1 . . . . . . 28.3 ** 29.2 ** 27.4 ** 29.3 30.3 28.39.6 8.3 11.6 9.9 8.7 11.5 . . . 14.6 14.6 14.6 15.6 15.7 15.5
28.9 28.2 30.0 29.9 29.3 30.9 . . . 17.4 17.2 17.7 19.8 19.6 20.0. . . 22.6 25.0 19.9 . . . 3.6 3.9 3.3 4.7 5.3 4.0
21.3 20.1 23.2 . . . . . . 23.8 ** 23.3 ** 24.4 ** 23.2 22.9 23.618.7 ** … … 11.3 ** … … 10.2 ** … … 12.1 13.6 10.6 13.1 ** 14.6 ** 11.5 **12.5 11.9 13.4 27.9 27.3 28.7 . . . 12.2 12.4 11.8 7.3 7.2 7.5
… … … … … … . . . … … … 2.6 2.5 2.619.8 19.2 20.4 20.8 20.4 21.1 . . . 29.1 29.2 29.0 16.5 16.7 16.418.5 **,y 18.9 **,y 18.2 **,y 35.6 **,y 37.1 **,y 34.1 **,y . . . 30.7 32.6 28.7 25.8 **,z 27.0 **,z 24.5 **,z
16.0 15.6 16.5 27.9 27.4 28.5 . . . 14.4 14.5 ** 14.2 ** 13.8 13.9 13.6. . . . . . . . . . . . . . .
… … … … … … . . . … … … … … …… … … … … … … … … … … … … … …… … … … … … … … … 8.0 * 9.0 * 6.9 * 7.4 8.5 6.3
14.0 15.3 12.7 13.3 14.2 12.5 8.5 9.0 8.0 15.3 17.7 12.8 15.5 17.5 13.221.5 20.6 22.7 19.0 17.6 21.0 . . . 31.2 30.9 31.6 23.7 23.2 24.310.5 10.4 10.7 11.0 10.8 11.1 8.9 9.7 7.8 … … … 10.5 10.8 10.30.4 ** 0.5 ** 0.3 ** 0.7 ** 0.7 ** 0.7 ** 0.01** 0.01** 0.01** 2.9 2.9 3.0 5.5 ** 5.4 ** 5.6 **7.9 ** … … 9.0 ** … … … … … 5.8 6.1 5.6 7.6 8.0 7.1
. . . . . . . . . . . . . . .
1.4 … … 1.1 1.4 0.7 . . . 3.6 3.8 3.5 3.0 3.4 2.5
. . . . . . . . . 0.5 0.5 0.5 0.2 0.2 0.1
. . . – – – . . . 1.2 1.5 1.0 0.8 0.9 0.74.1 4.2 4.1 3.5 3.9 3.2 . . . 6.5 7.1 5.8 6.2 6.5 6.0
5.7 6.0 5.2 4.6 7.0 2.0 . . . 6.5 7.2 5.6 4.8 5.6 3.7. . . . . . . . . 1.2 … … 0.9 … …
. . . . . . . . . 0.3 0.5 0.2 0.2 0.2 0.1– – – … … … . . . 1.2 1.3 0.7 0.3 0.4 0.3
2.8 3.4 2.2 1.8 2.2 1.4 . . . 4.7 4.9 4.4 5.6 6.7 4.5
… … … … … … . . . 0.4 0.5 0.3 0.3 0.3 0.2
4.8 5.3 4.4 … … … . . . 6.7 6.9 6.5 4.9 5.0 4.816.1 15.1 17.3 17.1 17.4 17.2 . . . 17.4 17.5 17.4 15.6 16.7 15.5
REPETITION RATES BY GRADE IN PRIMARY EDUCATION (%), 2001/2002
Grade 5
Total Male Female
Grade 6
Total Male Female
Grade 7
Total Male Female
1998/1999 2002/2003
REPEATERS, ALL GRADES (%)
Total Male Female Total Male Female
175176177178179180181182183184185186187188189190191192193194195196197198199200201202203
I
IIIIIIV
VVIVIIVIII
IX
X
XIXII
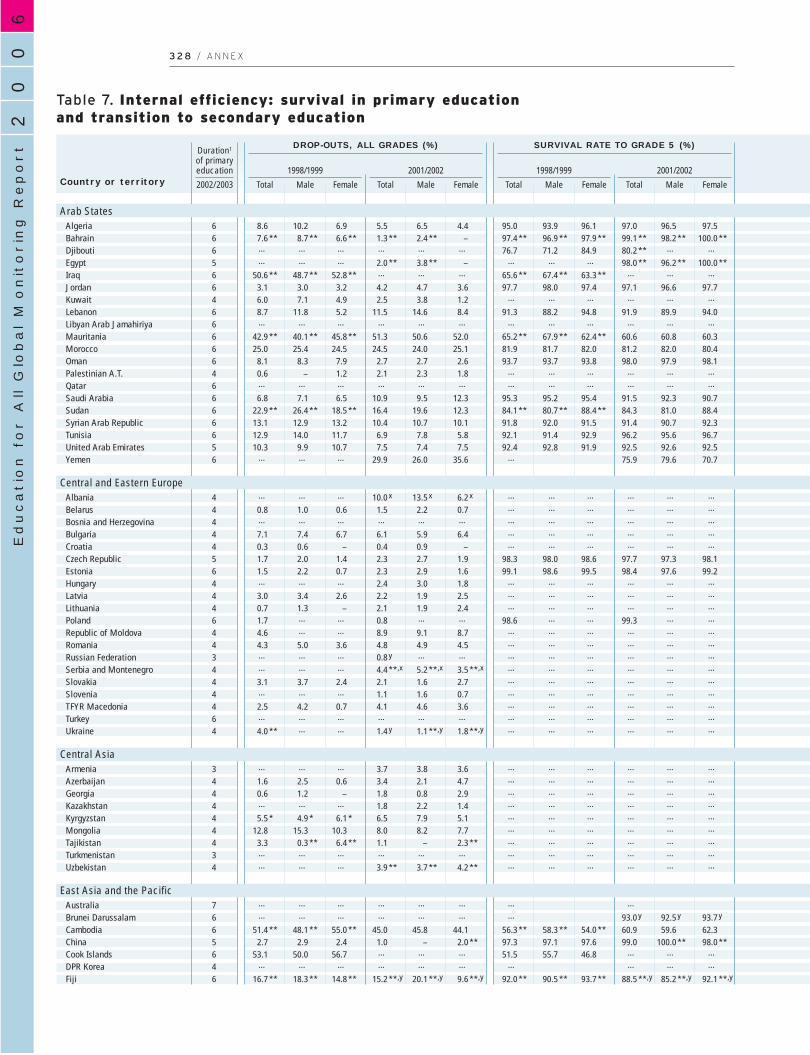
60
02
Education f
or A
ll G
lobal M
onitorin
g R
eport
3 2 8 / A N N E X
Table 7. Internal efficiency: survival in primary education and transition to secondary education
6 8.6 10.2 6.9 5.5 6.5 4.4 95.0 93.9 96.1 97.0 96.5 97.56 7.6 ** 8.7 ** 6.6 ** 1.3 ** 2.4 ** – 97.4 ** 96.9 ** 97.9 ** 99.1 ** 98.2 ** 100.0 **6 … … … … … … 76.7 71.2 84.9 80.2 ** … …
5 … … … 2.0 ** 3.8 ** – … … … 98.0 ** 96.2 ** 100.0 **6 50.6 ** 48.7 ** 52.8 ** … … … 65.6 ** 67.4 ** 63.3 ** … … …
6 3.1 3.0 3.2 4.2 4.7 3.6 97.7 98.0 97.4 97.1 96.6 97.74 6.0 7.1 4.9 2.5 3.8 1.2 … … … … … …
6 8.7 11.8 5.2 11.5 14.6 8.4 91.3 88.2 94.8 91.9 89.9 94.06 … … … … … … … … … … … …
6 42.9 ** 40.1 ** 45.8 ** 51.3 50.6 52.0 65.2 ** 67.9 ** 62.4 ** 60.6 60.8 60.36 25.0 25.4 24.5 24.5 24.0 25.1 81.9 81.7 82.0 81.2 82.0 80.46 8.1 8.3 7.9 2.7 2.7 2.6 93.7 93.7 93.8 98.0 97.9 98.14 0.6 – 1.2 2.1 2.3 1.8 … … … … … …
6 … … … … … … … … … … … …
6 6.8 7.1 6.5 10.9 9.5 12.3 95.3 95.2 95.4 91.5 92.3 90.76 22.9 ** 26.4 ** 18.5 ** 16.4 19.6 12.3 84.1 ** 80.7 ** 88.4 ** 84.3 81.0 88.46 13.1 12.9 13.2 10.4 10.7 10.1 91.8 92.0 91.5 91.4 90.7 92.36 12.9 14.0 11.7 6.9 7.8 5.8 92.1 91.4 92.9 96.2 95.6 96.75 10.3 9.9 10.7 7.5 7.4 7.5 92.4 92.8 91.9 92.5 92.6 92.56 … … … 29.9 26.0 35.6 … 75.9 79.6 70.7
4 … … … 10.0 x 13.5 x 6.2 x … … … … … …
4 0.8 1.0 0.6 1.5 2.2 0.7 … … … … … …
4 … … … … … … … … … … … …
4 7.1 7.4 6.7 6.1 5.9 6.4 … … … … … …
4 0.3 0.6 – 0.4 0.9 – … … … … … …
5 1.7 2.0 1.4 2.3 2.7 1.9 98.3 98.0 98.6 97.7 97.3 98.16 1.5 2.2 0.7 2.3 2.9 1.6 99.1 98.6 99.5 98.4 97.6 99.24 … … … 2.4 3.0 1.8 … … … … … …
4 3.0 3.4 2.6 2.2 1.9 2.5 … … … … … …
4 0.7 1.3 – 2.1 1.9 2.4 … … … … … …
6 1.7 … … 0.8 … … 98.6 … … 99.3 … …
4 4.6 … … 8.9 9.1 8.7 … … … … … …
4 4.3 5.0 3.6 4.8 4.9 4.5 … … … … … …
3 … … … 0.8 y … … … … … … … …
4 … … … 4.4 **,x 5.2 **,x 3.5 **,x … … … … … …
4 3.1 3.7 2.4 2.1 1.6 2.7 … … … … … …
4 … … … 1.1 1.6 0.7 … … … … … …
4 2.5 4.2 0.7 4.1 4.6 3.6 … … … … … …
6 … … … … … … … … … … … …
4 4.0 ** … … 1.4 y 1.1 **,y 1.8 **,y … … … … … …
3 … … … 3.7 3.8 3.6 … … … … … …
4 1.6 2.5 0.6 3.4 2.1 4.7 … … … … … …
4 0.6 1.2 – 1.8 0.8 2.9 … … … … … …
4 … … … 1.8 2.2 1.4 … … … … … …
4 5.5 * 4.9 * 6.1 * 6.5 7.9 5.1 … … … … … …
4 12.8 15.3 10.3 8.0 8.2 7.7 … … … … … …
4 3.3 0.3 ** 6.4 ** 1.1 – 2.3 ** … … … … … …
3 … … … … … … … … … … … …
4 … … … 3.9 ** 3.7 ** 4.2 ** … … … … … …
7 … … … … … … … …
6 … … … … … … … 93.0 y 92.5 y 93.7 y
6 51.4 ** 48.1 ** 55.0 ** 45.0 45.8 44.1 56.3 ** 58.3 ** 54.0 ** 60.9 59.6 62.35 2.7 2.9 2.4 1.0 – 2.0 ** 97.3 97.1 97.6 99.0 100.0 ** 98.0 **6 53.1 50.0 56.7 … … … 51.5 55.7 46.8 … … …
4 … … … … … … … … … …
6 16.7 ** 18.3 ** 14.8 ** 15.2 **,y 20.1 **,y 9.6 **,y 92.0 ** 90.5 ** 93.7 ** 88.5 **,y 85.2 **,y 92.1 **,y
AlgeriaBahrainDjiboutiEgyptIraqJordanKuwaitLebanonLibyan Arab JamahiriyaMauritaniaMoroccoOmanPalestinian A.T.QatarSaudi ArabiaSudanSyrian Arab RepublicTunisiaUnited Arab EmiratesYemen
AlbaniaBelarusBosnia and HerzegovinaBulgariaCroatiaCzech RepublicEstoniaHungaryLatviaLithuaniaPolandRepublic of MoldovaRomaniaRussian FederationSerbia and MontenegroSlovakiaSloveniaTFYR MacedoniaTurkeyUkraine
ArmeniaAzerbaijanGeorgiaKazakhstanKyrgyzstanMongoliaTajikistanTurkmenistanUzbekistan
AustraliaBrunei DarussalamCambodiaChinaCook IslandsDPR KoreaFiji
DROP-OUTS, ALL GRADES (%) SURVIVAL RATE TO GRADE 5 (%)
1998/1999 2001/2002 1998/1999 2001/2002
Duration1
of primaryeducation
Total Male Female Total Male Female Total Male Female Total Male Female2002/2003Country or territory
Arab States
Central and Eastern Europe
Central Asia
East Asia and the Pacific

S TAT I S T I C A L A N N E X / 3 2 9
Ta b l e 7
91.4 89.8 93.1 94.5 93.5 95.6 71.9 ** 68.3 ** 76.1 ** 79.4 76.3 83.092.4 ** 91.3 ** 93.4 ** 98.7 ** 97.6 ** 100.0 ** 98.5 ** 97.2 ** 100.0 ** 96.9 ** 95.3 ** 98.6 **
… … … … … … 42.3 42.6 41.9 58.0 ** 58.8 ** 57.0 **… … … 98.0 ** 96.2 ** 100.0 ** … … … 84.3 ** 82.6 ** 86.3 **
49.4 ** 51.3 ** 47.2 ** … … … 72.6 ** 78.9 ** 64.2 ** … … …
96.9 97.0 96.8 95.8 95.3 96.4 97.1 97.1 97.2 97.4 96.6 98.294.0 92.9 95.1 97.5 96.2 98.8 96.7 97.4 96.1 98.9 97.8 100.091.3 88.2 94.8 88.5 85.4 91.6 85.4 83.7 87.1 86.1 83.5 88.9
… … … … … … … … … … … …
57.1 ** 59.9 ** 54.2 ** 48.7 49.4 48.0 40.6 42.5 38.5 47.3 50.5 44.075.0 74.6 75.5 75.5 76.0 74.9 80.7 79.3 82.8 79.2 78.2 80.591.9 91.7 92.1 97.3 97.3 97.4 94.6 92.7 96.6 99.4 100.0 98.799.4 100.0 98.8 97.9 97.7 98.2 96.5 95.6 97.5 96.7 96.6 96.7
… … … … … … … … … 95.5 **,x 91.4 **,x 100.0 **,x
93.2 92.9 93.5 89.1 90.5 87.7 96.9 100.0 93.6 98.4 99.5 97.377.1 ** 73.6 ** 81.5 ** 83.6 80.4 87.7 78.3 ** … … 90.4 90.5 90.286.9 87.1 86.8 89.6 89.3 89.9 68.5 70.0 66.8 76.6 77.0 76.287.1 86.0 88.3 93.1 92.2 94.2 68.0 ** 66.6 ** 69.6 ** 87.8 85.7 90.189.7 90.1 89.3 92.5 92.6 92.5 96.0 94.6 97.5 97.7 96.1 99.5
… … … 70.1 74.0 64.4 … … … … … …
… … … 90.0 x 86.5 x 93.8 x 93.0 ** 92.8 ** 93.3 ** 94.0 x 93.2 x 94.9 x
99.2 99.0 99.4 98.5 97.8 99.3 99.9 99.7 100.0 99.9 100.0 99.8… … … … … … … … … … … …
92.9 92.6 93.3 93.9 94.1 93.6 … … … 95.8 96.2 95.399.7 99.4 100.0 99.6 99.1 100.0 99.9 100.0 99.8 99.9 99.8 100.098.3 98.0 98.6 97.7 97.3 98.1 … … … 99.1 99.0 99.198.5 97.8 99.3 97.7 97.1 98.4 95.7 93.4 98.1 95.7 93.2 98.4
… … … 97.6 97.0 98.2 99.3 99.9 98.6 98.8 98.6 99.097.0 96.6 97.4 97.8 98.1 97.5 98.3 98.0 98.8 98.8 98.6 98.999.3 98.7 100.0 97.9 98.1 97.6 100.0 99.9 100.0 98.9 99.1 98.798.3 … … 99.2 … … 100.0 … … 98.3 … …
95.4 … … 91.1 90.9 91.3 99.0 99.0 ** 99.0 ** 98.0 97.4 98.695.7 95.0 96.4 95.2 95.1 95.5 … … … 97.7 97.5 98.0
… … … 99.2 y … … … … … 90.0 … …… … … 95.6 **,x 94.8 **,x 96.5 **,x … … … … … …
96.9 96.3 97.6 97.9 98.4 97.3 98.6 ** 98.5 ** 98.8 ** 98.2 98.1 98.3… … … 98.9 98.4 99.3 … … … 99.3 99.2 99.5
97.5 95.8 99.3 95.9 95.4 96.4 99.0 99.8 98.1 97.7 98.0 97.3… … … … … … … … … … … …
96.0 ** … … 98.6 **,y 98.9 **,y 98.2 **,y 100.0 ** … … 99.4 y 98.9 **,y 100.0 **,y
… … … 96.3 96.2 96.4 … … … 97.9 98.6 97.198.4 97.5 99.4 96.6 97.9 95.3 97.5 96.4 98.6 97.8 98.1 97.399.4 98.8 100.0 98.2 99.2 97.1 98.3 97.5 99.1 98.3 98.1 98.5
… … … 98.2 97.8 98.6 … … … 99.4 99.5 99.494.5 * 95.1 * 93.9 * 93.5 92.1 94.9 98.5 * 97.1 * 100.0 * 98.4 96.8 100.087.2 84.7 89.7 92.0 91.8 92.3 94.4 92.5 96.4 99.0 98.3 99.696.7 99.7 ** 93.6 ** 98.9 100.0 ** 97.7 ** 97.1 97.2 ** 96.9 ** 98.2 99.7 ** 96.6 **
… … … … … … … … … … … …… … … 96.1 ** 96.3 ** 95.8 ** … … … 99.6 ** 100.0 ** 99.2 **
… … … … … … … … … … … …… … … … … … 96.6 97.6 95.5 93.3 93.4 93.1
48.6 ** 51.9 ** 45.0 ** 55.0 54.2 55.9 77.4 ** 81.8 ** 71.4 ** 83.2 86.4 79.397.3 97.1 97.6 99.0 100.0 ** 98.0 ** … … … 91.6 91.6 ** 91.6 **46.9 50.0 43.3 … … … 87.7 94.0 81.6 … … …
… … … … … … … … … … … …
83.3 ** 81.7 ** 85.2 ** 84.8 **,y 79.9 **,y 90.4 **,y 95.8 ** 97.8 ** 93.7 ** 98.4 **,y 100.0 **,y 96.6 **,y
AlgeriaBahrainDjibouti
EgyptIraq
JordanKuwait
LebanonLibyan Arab Jamahiriya
MauritaniaMorocco
OmanPalestinian A.T.
QatarSaudi Arabia
SudanSyrian Arab Republic
TunisiaUnited Arab Emirates
Yemen
AlbaniaBelarus
Bosnia and HerzegovinaBulgariaCroatia
Czech RepublicEstonia
HungaryLatvia
LithuaniaPoland
Republic of MoldovaRomania
Russian FederationSerbia and Montenegro
SlovakiaSlovenia
TFYR MacedoniaTurkey
Ukraine
ArmeniaAzerbaijan
GeorgiaKazakhstanKyrgyzstan
MongoliaTajikistan
TurkmenistanUzbekistan
AustraliaBrunei Darussalam
CambodiaChina
Cook IslandsDPR Korea
Fiji
Country or territory
SURVIVAL RATE TO LAST GRADE (%) TRANSITION TO SECONDARY EDUCATION (%)
1998/1999 2001/2002 1998/1999 2001/2002
Total Male Female Total Male Female Total Male Female Total Male Female
Arab States
Central and Eastern Europe
Central Asia
East Asia and the Pacific

60
02
Education f
or A
ll G
lobal M
onitorin
g R
eport
3 3 0 / A N N E X
Table 7 (continued)
6 … … … 13.6 14.3 12.9 … … … 89.1 88.3 89.96 … … … … … … … … … … … …
6 … … … … … … … … … … … …
5 45.7 45.1 46.4 35.9 36.4 35.3 54.3 54.9 53.6 64.1 63.6 64.76 … … … … … … … … … 99.7 99.4 100.06 … … … 15.7 15.9 15.5 … … … 87.1 86.9 87.36 … … … … … … … … … … … …
6 … … … … … … … … … … … …
5 … … … 35.4 36.3 34.4 … … … 64.6 63.7 65.66 … … … … … … … … … … … …
6 … … … … … … … … … … … …
6 … … … … … … 75.8 … … … … …
5 15.8 7.8 24.2 … … … 84.2 92.2 75.8 … … …
6 38.6 38.5 38.8 56.2 y 55.3 y 57.3 y 68.0 67.8 68.2 50.6 y 51.5 y 49.5 y
6 … … … 26.6 31.2 21.5 … … … 76.0 72.2 80.26 0.2 – 0.4 0.1 0.2 – 99.9 100.0 99.7 99.9 99.8 100.06 19.8 … … … … … 82.6 … … 93.8 y 96.0 y 91.5 y
6 … … … … … … … … … … … …
6 … … … … … … … … … … … …
6 8.1 ** 10.3 ** 5.8 ** … … … 94.1 ** 92.3 ** 96.0 ** … … …
6 … … … … … … … … … … … …
6 … … … … … … … … … … … …
6 … … … … … … … … … … … …
6 … … … … … … … … … … … …
6 9.9 ** … … 31.1 x 33.0 x 29.0 x 95.3 ** … … 72.1 x 72.4 x 71.8 x
5 17.2 20.1 13.8 12.9 ** 12.6 ** 13.3 ** 82.8 79.9 86.2 87.1 ** 87.4 ** 86.7 **
7 … … … … … … … … … … … …
7 … … … … … … … … … … … …
6 7.7 9.5 5.8 10.1 11.7 8.4 94.7 93.3 96.1 92.2 91.1 93.46 … … … 6.0 7.9 4.1 96.8 97.4 96.2 95.0 93.9 96.16 … … … 35.2 ** … … … … … 75.2 ** … …
6 … … … 3.2 y … … 94.1 96.4 91.8 98.8 99.9 97.76 23.1 22.5 23.7 20.5 x 21.4 x 19.5 x 77.8 76.2 79.5 81.5 x 81.5 x 81.5 x
6 … … … 4.8 y … … … 96.3 y … …
6 22.8 20.4 25.3 17.7 15.8 19.7 79.4 80.4 78.3 84.4 85.2 83.74 … … … 20.1 y 24.2 **,y 15.5 **,y … … … … … …
7 … … … … … … … … … … … …
6 … … … … … … … … … … … …
6 0.5 1.0 – 1.3 0.8 1.8 99.8 99.6 100.0 99.2 100.0 98.45 36.6 43.8 27.8 30.6 33.7 27.2 63.4 56.2 72.2 69.4 66.3 72.86 … … … 11.6 13.0 10.1 … … … 91.6 90.2 93.16 7.4 7.8 7.0 2.7 3.0 2.3 93.7 93.6 93.9 97.9 97.9 97.97 … … … 21.3 25.1 17.2 … … … 83.7 80.3 87.26 29.4 ** 33.7 ** 24.8 ** 38.5 ** … … 75.1 ** 71.4 ** 79.1 ** 69.1 **6 25.4 25.7 25.1 27.9 28.6 27.2 77.0 76.8 77.2 74.4 73.9 75.06 39.6 ** 39.8 ** 39.4 ** 34.7 36.7 32.6 61.3 ** 60.4 ** 62.3 ** 68.9 67.1 70.87 … … … … … … … … … 79.0 73.0 85.46 45.2 ** 41.7 ** 49.0 ** 39.6 38.1 41.3 60.4 ** 64.1 ** 56.4 ** 65.2 66.6 63.66 7.3 … … 34.9 x 38.5 x 31.1 x 97.4 … … 77.2 x 71.1 x 84.0 x
6 … … … … … … … … … … … …
6 … … … … … … … … … … … …
6 … … … 15.1 … … … … … 89.7 … …
6 12.8 14.0 11.5 8.7 9.6 7.7 89.0 88.0 90.0 93.0 92.3 93.77 … … … … … … … … … … … …
6 … … … 16.9 y … … … … … 88.5 y … …
6 … … … 36.1 38.6 33.5 … … … 64.8 62.5 67.36 … … … 12.0 13.2 10.7 … … … 89.8 89.0 90.66 36.4 ** 37.7 ** 35.0 ** 36.4 ** 38.2 ** 34.6 ** 70.0 ** 68.9 ** 71.2 ** 69.7 ** 68.3 ** 71.2 **6 14.8 14.5 15.1 21.9 20.6 23.3 87.9 88.2 87.6 83.6 84.5 82.77 … … … 27.5 y 24.3 y 29.8 y … … … 78.4 y 74.5 y 83.3 y
7 … … … … … … 90.1 ** … … 96.6 y … …
IndonesiaJapanKiribatiLao PDRMacao, ChinaMalaysiaMarshall IslandsMicronesia (Federated States of)MyanmarNauruNew ZealandNiuePalauPapua New GuineaPhilippinesRepublic of KoreaSamoaSingaporeSolomon IslandsThailandTimor-LesteTokelauTongaTuvaluVanuatuViet Nam
AnguillaAntigua and BarbudaArgentinaArubaBahamasBarbadosBelizeBermudaBoliviaBrazilBritish Virgin IslandsCayman IslandsChileColombiaCosta RicaCubaDominicaDominican RepublicEcuadorEl SalvadorGrenadaGuatemalaGuyanaHaitiHondurasJamaicaMexicoMontserratNetherlands AntillesNicaraguaPanamaParaguayPeruSaint Kitts and NevisSaint Lucia
DROP-OUTS, ALL GRADES (%) SURVIVAL RATE TO GRADE 5 (%)
1998/1999 2001/2002 1998/1999 2001/2002
Duration1
of primaryeducation
Total Male Female Total Male Female Total Male Female Total Male Female2002/2003Country or territory
Latin America and the Caribbean
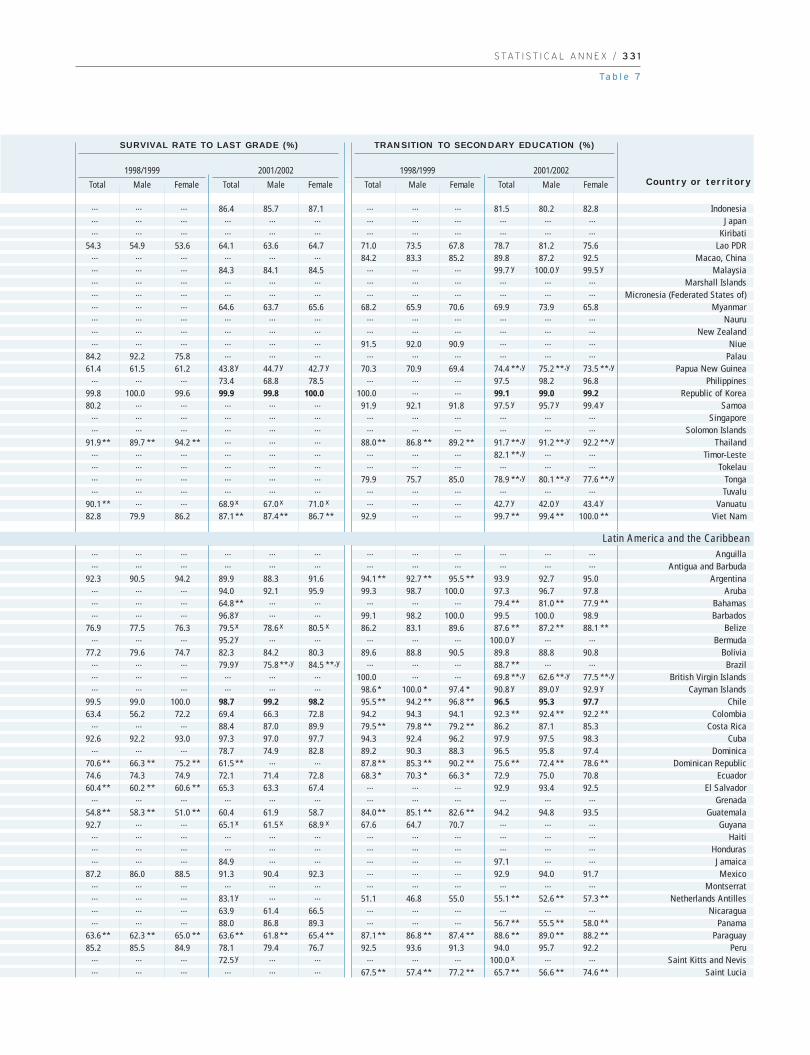
S TAT I S T I C A L A N N E X / 3 3 1
Ta b l e 7
… … … 86.4 85.7 87.1 … … … 81.5 80.2 82.8… … … … … … … … … … … …… … … … … … … … … … … …
54.3 54.9 53.6 64.1 63.6 64.7 71.0 73.5 67.8 78.7 81.2 75.6… … … … … … 84.2 83.3 85.2 89.8 87.2 92.5… … … 84.3 84.1 84.5 … … … 99.7 y 100.0 y 99.5 y
… … … … … … … … … … … …… … … … … … … … … … … …… … … 64.6 63.7 65.6 68.2 65.9 70.6 69.9 73.9 65.8… … … … … … … … … … … …… … … … … … … … … … … …… … … … … … 91.5 92.0 90.9 … … …
84.2 92.2 75.8 … … … … … … … … …
61.4 61.5 61.2 43.8 y 44.7 y 42.7 y 70.3 70.9 69.4 74.4 **,y 75.2 **,y 73.5 **,y
… … … 73.4 68.8 78.5 … … … 97.5 98.2 96.899.8 100.0 99.6 99.9 99.8 100.0 100.0 … … 99.1 99.0 99.280.2 … … … … … 91.9 92.1 91.8 97.5 y 95.7 y 99.4 y
… … … … … … … … … … … …… … … … … … … … … … … …
91.9 ** 89.7 ** 94.2 ** … … … 88.0 ** 86.8 ** 89.2 ** 91.7 **,y 91.2 **,y 92.2 **,y
… … … … … … … … … 82.1 **,y … …… … … … … … … … … … … …… … … … … … 79.9 75.7 85.0 78.9 **,y 80.1 **,y 77.6 **,y
… … … … … … … … … … … …
90.1 ** … … 68.9 x 67.0 x 71.0 x … … … 42.7 y 42.0 y 43.4 y
82.8 79.9 86.2 87.1 ** 87.4 ** 86.7 ** 92.9 … … 99.7 ** 99.4 ** 100.0 **
… … … … … … … … … … … …… … … … … … … … … … … …
92.3 90.5 94.2 89.9 88.3 91.6 94.1 ** 92.7 ** 95.5 ** 93.9 92.7 95.0… … … 94.0 92.1 95.9 99.3 98.7 100.0 97.3 96.7 97.8… … … 64.8 ** … … … … … 79.4 ** 81.0 ** 77.9 **… … … 96.8 y … … 99.1 98.2 100.0 99.5 100.0 98.9
76.9 77.5 76.3 79.5 x 78.6 x 80.5 x 86.2 83.1 89.6 87.6 ** 87.2 ** 88.1 **… … … 95.2 y … … … … … 100.0 y … …
77.2 79.6 74.7 82.3 84.2 80.3 89.6 88.8 90.5 89.8 88.8 90.8… … … 79.9 y 75.8 **,y 84.5 **,y … … … 88.7 ** … …… … … … … … 100.0 … … 69.8 **,y 62.6 **,y 77.5 **,y
… … … … … … 98.6 * 100.0 * 97.4 * 90.8 y 89.0 y 92.9 y
99.5 99.0 100.0 98.7 99.2 98.2 95.5 ** 94.2 ** 96.8 ** 96.5 95.3 97.763.4 56.2 72.2 69.4 66.3 72.8 94.2 94.3 94.1 92.3 ** 92.4 ** 92.2 **
… … … 88.4 87.0 89.9 79.5 ** 79.8 ** 79.2 ** 86.2 87.1 85.392.6 92.2 93.0 97.3 97.0 97.7 94.3 92.4 96.2 97.9 97.5 98.3
… … … 78.7 74.9 82.8 89.2 90.3 88.3 96.5 95.8 97.470.6 ** 66.3 ** 75.2 ** 61.5 ** … … 87.8 ** 85.3 ** 90.2 ** 75.6 ** 72.4 ** 78.6 **74.6 74.3 74.9 72.1 71.4 72.8 68.3 * 70.3 * 66.3 * 72.9 75.0 70.860.4 ** 60.2 ** 60.6 ** 65.3 63.3 67.4 … … … 92.9 93.4 92.5
… … … … … … … … … … … …
54.8 ** 58.3 ** 51.0 ** 60.4 61.9 58.7 84.0 ** 85.1 ** 82.6 ** 94.2 94.8 93.592.7 … … 65.1 x 61.5 x 68.9 x 67.6 64.7 70.7 … … …
… … … … … … … … … … … …… … … … … … … … … … … …… … … 84.9 … … … … … 97.1 … …
87.2 86.0 88.5 91.3 90.4 92.3 … … … 92.9 94.0 91.7… … … … … … … … … … … …… … … 83.1 y … … 51.1 46.8 55.0 55.1 ** 52.6 ** 57.3 **… … … 63.9 61.4 66.5 … … … … … …… … … 88.0 86.8 89.3 … … … 56.7 ** 55.5 ** 58.0 **
63.6 ** 62.3 ** 65.0 ** 63.6 ** 61.8 ** 65.4 ** 87.1 ** 86.8 ** 87.4 ** 88.6 ** 89.0 ** 88.2 **85.2 85.5 84.9 78.1 79.4 76.7 92.5 93.6 91.3 94.0 95.7 92.2
… … … 72.5 y … … … … … 100.0 x … …… … … … … … 67.5 ** 57.4 ** 77.2 ** 65.7 ** 56.6 ** 74.6 **
IndonesiaJapan
KiribatiLao PDR
Macao, ChinaMalaysia
Marshall IslandsMicronesia (Federated States of)
MyanmarNauru
New ZealandNiue
PalauPapua New Guinea
PhilippinesRepublic of Korea
SamoaSingapore
Solomon IslandsThailand
Timor-LesteTokelau
TongaTuvalu
VanuatuViet Nam
AnguillaAntigua and Barbuda
ArgentinaAruba
BahamasBarbados
BelizeBermuda
BoliviaBrazil
British Virgin IslandsCayman Islands
ChileColombia
Costa RicaCuba
DominicaDominican Republic
EcuadorEl Salvador
GrenadaGuatemala
GuyanaHaiti
HondurasJamaicaMexico
MontserratNetherlands Antilles
NicaraguaPanama
ParaguayPeru
Saint Kitts and NevisSaint Lucia
Country or territory
SURVIVAL RATE TO LAST GRADE (%) TRANSITION TO SECONDARY EDUCATION (%)
1998/1999 2001/2002 1998/1999 2001/2002
Total Male Female Total Male Female Total Male Female Total Male Female
Latin America and the Caribbean
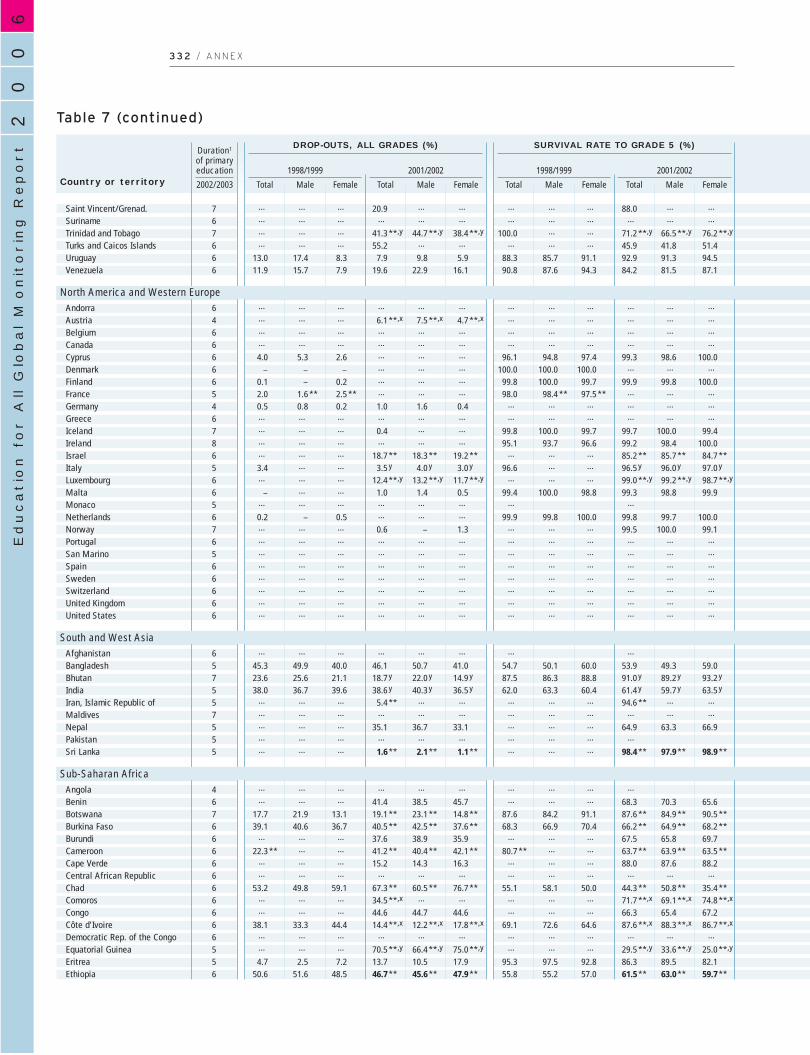
60
02
Education f
or A
ll G
lobal M
onitorin
g R
eport
3 3 2 / A N N E X
Table 7 (continued)
7 … … … 20.9 … … … … … 88.0 … …
6 … … … … … … … … … … … …
7 … … … 41.3 **,y 44.7 **,y 38.4 **,y 100.0 … … 71.2 **,y 66.5 **,y 76.2 **,y
6 … … … 55.2 … … … … … 45.9 41.8 51.46 13.0 17.4 8.3 7.9 9.8 5.9 88.3 85.7 91.1 92.9 91.3 94.56 11.9 15.7 7.9 19.6 22.9 16.1 90.8 87.6 94.3 84.2 81.5 87.1
6 … … … … … … … … … … … …
4 … … … 6.1 **,x 7.5 **,x 4.7 **,x … … … … … …
6 … … … … … … … … … … … …
6 … … … … … … … … … … … …
6 4.0 5.3 2.6 … … … 96.1 94.8 97.4 99.3 98.6 100.06 – – – … … … 100.0 100.0 100.0 … … …
6 0.1 – 0.2 … … … 99.8 100.0 99.7 99.9 99.8 100.05 2.0 1.6 ** 2.5 ** … … … 98.0 98.4 ** 97.5 ** … … …
4 0.5 0.8 0.2 1.0 1.6 0.4 … … … … … …
6 … … … … … … … … … … … …
7 … … … 0.4 … … 99.8 100.0 99.7 99.7 100.0 99.48 … … … … … … 95.1 93.7 96.6 99.2 98.4 100.06 … … … 18.7 ** 18.3 ** 19.2 ** … … … 85.2 ** 85.7 ** 84.7 **5 3.4 … … 3.5 y 4.0 y 3.0 y 96.6 … … 96.5 y 96.0 y 97.0 y
6 … … … 12.4 **,y 13.2 **,y 11.7 **,y … … … 99.0 **,y 99.2 **,y 98.7 **,y
6 – … … 1.0 1.4 0.5 99.4 100.0 98.8 99.3 98.8 99.95 … … … … … … … …
6 0.2 – 0.5 … … … 99.9 99.8 100.0 99.8 99.7 100.07 … … … 0.6 – 1.3 … … … 99.5 100.0 99.16 … … … … … … … … … … … …
5 … … … … … … … … … … … …
6 … … … … … … … … … … … …
6 … … … … … … … … … … … …
6 … … … … … … … … … … … …
6 … … … … … … … … … … … …
6 … … … … … … … … … … … …
6 … … … … … … … …
5 45.3 49.9 40.0 46.1 50.7 41.0 54.7 50.1 60.0 53.9 49.3 59.07 23.6 25.6 21.1 18.7 y 22.0 y 14.9 y 87.5 86.3 88.8 91.0 y 89.2 y 93.2 y
5 38.0 36.7 39.6 38.6 y 40.3 y 36.5 y 62.0 63.3 60.4 61.4 y 59.7 y 63.5 y
5 … … … 5.4 ** … … … … … 94.6 ** … …
7 … … … … … … … … … … … …
5 … … … 35.1 36.7 33.1 … … … 64.9 63.3 66.95 … … … … … … … … … …
5 … … … 1.6 ** 2.1 ** 1.1 ** … … … 98.4 ** 97.9 ** 98.9 **
4 … … … … … … … … … …
6 … … … 41.4 38.5 45.7 … … … 68.3 70.3 65.67 17.7 21.9 13.1 19.1 ** 23.1 ** 14.8 ** 87.6 84.2 91.1 87.6 ** 84.9 ** 90.5 **6 39.1 40.6 36.7 40.5 ** 42.5 ** 37.6 ** 68.3 66.9 70.4 66.2 ** 64.9 ** 68.2 **6 … … … 37.6 38.9 35.9 … … … 67.5 65.8 69.76 22.3 ** … … 41.2 ** 40.4 ** 42.1 ** 80.7 ** … … 63.7 ** 63.9 ** 63.5 **6 … … … 15.2 14.3 16.3 … … … 88.0 87.6 88.26 … … … … … … … … … … … …
6 53.2 49.8 59.1 67.3 ** 60.5 ** 76.7 ** 55.1 58.1 50.0 44.3 ** 50.8 ** 35.4 **6 … … … 34.5 **,x … … … … … 71.7 **,x 69.1 **,x 74.8 **,x
6 … … … 44.6 44.7 44.6 … … … 66.3 65.4 67.26 38.1 33.3 44.4 14.4 **,x 12.2 **,x 17.8 **,x 69.1 72.6 64.6 87.6 **,x 88.3 **,x 86.7 **,x
6 … … … … … … … … … … … …
5 … … … 70.5 **,y 66.4 **,y 75.0 **,y … … … 29.5 **,y 33.6 **,y 25.0 **,y
5 4.7 2.5 7.2 13.7 10.5 17.9 95.3 97.5 92.8 86.3 89.5 82.16 50.6 51.6 48.5 46.7 ** 45.6 ** 47.9 ** 55.8 55.2 57.0 61.5 ** 63.0 ** 59.7 **
Saint Vincent/Grenad.SurinameTrinidad and TobagoTurks and Caicos IslandsUruguayVenezuela
AndorraAustriaBelgiumCanadaCyprusDenmarkFinlandFranceGermanyGreeceIcelandIrelandIsraelItalyLuxembourgMaltaMonacoNetherlandsNorwayPortugalSan MarinoSpainSwedenSwitzerlandUnited KingdomUnited States
AfghanistanBangladeshBhutanIndiaIran, Islamic Republic ofMaldivesNepalPakistanSri Lanka
AngolaBeninBotswanaBurkina FasoBurundiCameroonCape VerdeCentral African RepublicChadComorosCongoCôte d’IvoireDemocratic Rep. of the CongoEquatorial GuineaEritreaEthiopia
DROP-OUTS, ALL GRADES (%) SURVIVAL RATE TO GRADE 5 (%)
1998/1999 2001/2002 1998/1999 2001/2002
Duration1
of primaryeducation
Total Male Female Total Male Female Total Male Female Total Male Female2002/2003Country or territory
North America and Western Europe
South and West Asia
Sub-Saharan Africa

S TAT I S T I C A L A N N E X / 3 3 3
Ta b l e 7
… … … 79.1 … … … … … 51.1 44.2 57.8… … … … … … … … … 12.5 ** 15.2 ** 10.0 **… … … 58.7 **,y 55.3 **,y 61.6 **,y 95.8 94.3 97.3 97.6 ** … …… … … 44.8 … … 49.4 40.0 59.4 71.6 72.0 71.1
87.0 82.6 91.7 92.1 90.2 94.1 … … … 81.7 76.0 87.588.1 84.3 92.1 80.4 77.1 83.9 94.2 94.4 94.1 96.6 96.5 96.7
… … … … … … … … … 94.2 93.4 95.1… … … 93.9 **,x 92.5 **,x 95.3 **,x … … … … … …… … … … … … … … … … … …… … … … … … … … … … … …
96.0 94.7 97.4 … … … 99.8 99.7 100.0 99.4 99.8 98.9… … … … … … 99.9 99.9 100.0 99.6 100.0 99.1… … … … … … 99.7 99.5 100.0 99.9 100.0 99.8
98.0 98.4 ** 97.5 ** … … … 98.7 ** 99.1 ** 98.3 ** 98.9 x … …
99.5 99.2 99.8 99.0 98.4 99.6 99.6 99.6 99.6 99.7 y 100.0 y 99.4 y
… … … … … … … … … … … …… … … 99.6 … … 99.8 100.0 99.5 99.6 99.2 100.0… … … … … … 99.0 98.1 100.0 100.0 … …… … … 81.3 ** 81.7 ** 80.8 ** … … … 69.2 ** 69.1 ** 69.3 **
96.6 … … 96.5 y 96.0 y 97.0 y 96.6 93.4 100.0 99.9 100.0 99.8… … … 87.6 **,y 86.8 **,y 88.3 **,y … … … … … …… … … 99.0 98.6 99.5 … … … 90.7 89.6 92.0… … … … … … … … … … … …
99.8 … … … … … … … … 98.9 x 97.9 x 100.0 x
… … … 99.4 100.0 98.7 … … … … … …… … … … … … … … … … … …… … … … … … … … … … … …… … … … … … … … … … … …… … … … … … … … … 100.0 y 100.0 y 99.9 y
… … … … … … 99.8 99.6 100.0 100.0 100.0 100.0… … … … … … … … … … … …… … … … … … … … … … … …
… … … … … … … … … … … …
54.7 50.1 60.0 53.9 49.3 59.0 75.5 69.9 81.7 89.3 83.0 95.776.4 74.4 78.9 81.3 y 78.0 y 85.1 y 87.6 87.8 87.4 82.5 y 82.4 y 82.6 y
62.0 63.3 60.4 61.4 y 59.7 y 63.5 y 88.8 90.7 86.1 86.7 84.9 89.0… … … 94.6 ** … … … … … 96.0 97.0 94.9… … … … … … … … … … … …… … … 64.9 63.3 66.9 … … … 78.2 80.1 75.9… … … … … … … … … … … …… … … 98.4 ** 97.9 ** 98.9 ** … … … 97.0 ** 96.4 ** 97.7 **
… … … … … … … … … … … …… … … 58.6 61.5 54.3 … … … 51.1 51.1 51.0
82.3 78.1 86.9 80.9 ** 76.9 ** 85.2 ** 95.8 95.2 96.4 93.9 ** 93.6 ** 94.3 **60.9 59.4 63.3 59.5 ** 57.5 ** 62.4 ** 38.4 38.9 37.8 39.9 ** 40.7 ** 38.7 **
… … … 62.4 61.1 64.1 … … … 32.3 **,y … …
77.7 ** … … 58.8 ** 59.6 ** 57.9 ** … … … 26.7 x 27.8 x 25.4 x
… … … 84.8 85.7 83.7 … … … 72.2 68.3 76.2… … … … … … … … … … … …
46.8 50.2 40.9 32.7 ** 39.5 ** 23.3 ** 47.2 48.4 43.8 43.8 **,x 45.6 **,x 39.0 **,x
… … … 65.5 **,x … … … … … 58.2 ** 57.0 ** 59.6 **… … … 55.4 55.3 55.4 … … … 60.0 73.6 46.0
61.9 66.7 55.6 85.6 **,x 87.8 **,x 82.2 **,x 35.2 39.5 28.3 39.7 y 41.9 y 36.3 y
… … … … … … … … … … … …… … … 29.5 **,y 33.6 **,y 25.0 **,y … … … … … …
95.3 97.5 92.8 86.3 89.5 82.1 84.5 86.9 81.5 82.8 86.7 77.649.4 48.4 51.5 53.3 ** 54.4 ** 52.1 ** 92.1 91.5 93.1 93.7 ** 95.0 ** 91.4 **
Saint Vincent/Grenad.Suriname
Trinidad and TobagoTurks and Caicos Islands
UruguayVenezuela
AndorraAustria
BelgiumCanadaCyprus
DenmarkFinlandFrance
GermanyGreeceIcelandIreland
IsraelItaly
LuxembourgMalta
MonacoNetherlands
NorwayPortugal
San MarinoSpain
SwedenSwitzerland
United KingdomUnited States
AfghanistanBangladesh
BhutanIndia
Iran, Islamic Republic ofMaldives
NepalPakistan
Sri Lanka
AngolaBenin
BotswanaBurkina Faso
BurundiCameroon
Cape VerdeCentral African Republic
ChadComoros
CongoCôte d’Ivoire
Democratic Rep. of the CongoEquatorial Guinea
EritreaEthiopia
Country or territory
SURVIVAL RATE TO LAST GRADE (%) TRANSITION TO SECONDARY EDUCATION (%)
1998/1999 2001/2002 1998/1999 2001/2002
Total Male Female Total Male Female Total Male Female Total Male Female
North America and Western Europe
South and West Asia
Sub-Saharan Africa

60
02
Education f
or A
ll G
lobal M
onitorin
g R
eport
3 3 4 / A N N E X
Table 7 (continued)
6 … … … 44.5 ** 46.3 ** 42.6 ** … … … 69.3 ** 67.9 ** 70.7 **6 … … … … … … … … … … … …
6 … … … 40.0 44.7 34.7 … … … 63.3 61.8 64.76 22.1 15.9 31.4 28.6 22.8 35.8 86.9 92.5 79.1 79.7 85.4 72.76 72.5 ** 69.5 ** 76.6 ** … … … 38.1 ** 41.2 ** 33.8 ** … … …
7 … … … 43.8 ** … … … 59.0 ** 60.9 ** 57.2 **7 46.1 53.9 38.3 41.3 50.1 32.2 68.9 61.7 76.1 73.0 65.8 80.56 … … … … … … … … … … … …
5 48.9 49.3 48.4 47.1 47.6 46.6 51.1 50.7 51.6 52.9 52.4 53.46 62.4 59.9 ** 64.9 ** 78.2 83.4 69.1 44.1 49.5 ** 38.8 ** 32.8 29.2 38.16 34.4 ** 32.5 ** 37.2 ** 34.5 30.0 40.3 78.3 ** 79.2 ** 77.1 ** 74.6 77.9 70.56 0.7 1.4 – 2.4 3.8 0.9 99.4 98.9 100.0 98.9 98.2 99.55 58.2 54.8 62.5 50.8 47.3 55.1 41.8 45.2 37.5 49.2 52.7 44.97 28.0 31.9 23.9 14.1 ** … … 83.4 79.8 87.1 94.7 ** … …
6 … … … 33.9 33.2 35.1 … … … 69.1 70.5 67.26 … … … … … … … … … … … …
6 69.8 … … 63.4 64.0 62.8 45.4 … … 46.6 44.9 48.36 … … … 42.3 **,y 48.5 **,y 35.8 **,y … … … 61.5 **,y 58.3 **,y 64.7 **,y
6 … … … 28.6 25.7 31.7 … … … 80.0 82.6 77.26 – … … 1.3 – 2.6 100.0 … … 99.3 100.0 98.66 … … … … … … … … … … … …
7 … … … … … … … … … … … …
7 32.4 * 34.1 * 30.8 * 42.6 x 41.5 x 43.7 x 75.9 * 75.1 * 76.7 * 64.8 x 65.2 x 64.2 x
7 39.7 51.6 24.6 42.7 39.8 45.8 81.5 76.0 87.1 73.2 77.1 69.26 … … … 38.3 32.7 44.8 … … … 68.6 72.6 64.17 … … … 59.3 58.6 60.1 … … … 63.6 62.9 64.47 26.7 29.5 23.8 26.1 ** 26.0 ** 26.1 ** 80.9 78.6 83.3 82.0 ** 81.6 ** 82.5 **7 36.4 28.7 43.9 12.5 ** … … 78.2 83.5 73.0 76.7 **,y 78.7 **,y 74.8 **,y
7 … … … 37.9 ** 38.4 ** 37.5 ** … … … 69.7 ** 68.2 ** 71.2 **
… … … … 15.1 … … … … … 89.7 … …
… 3.3 0.3 6.4 1.8 0.8 2.9 … … … … … …… … … … 2.3 2.8 1.7 … … … … … …… … … … 25.5 27.6 23.3 … … … 81.2 82.0 80.4
… 8.7 11.8 5.2 7.2 7.6 6.6 91.3 88.2 94.8 94.3 94.1 94.6… 2.5 4.2 0.7 2.2 2.4 2.0 … … … … … …… 3.3 0.3 6.4 3.5 3.0 4.1 … … … … … …… … … … … … … … … … … … …
… … … … 20.5 21.4 19.5 … … … 83.9 80.9 87.1
… … … … … … … … … … … … …
… … … … 35.1 36.7 33.1 … … … 64.9 63.3 66.9… … … … 40.5 42.5 37.6 … … … 68.6 72.6 64.1
GabonGambiaGhanaGuineaGuinea-BissauKenyaLesothoLiberiaMadagascarMalawiMaliMauritiusMozambiqueNamibiaNigerNigeriaRwandaSao Tome and PrincipeSenegalSeychellesSierra LeoneSomaliaSouth AfricaSwazilandTogoUgandaUnited Republic of TanzaniaZambiaZimbabwe
World2
Countries in transitionDeveloped countriesDeveloping countries
Arab States Central and Eastern EuropeCentral AsiaEast Asia and the PacificLatin America and the CaribbeanNorth America and Western EuropeSouth and West AsiaSub-Saharan Africa
DROP-OUTS, ALL GRADES (%) SURVIVAL RATE TO GRADE 5 (%)
1998/1999 2001/2002 1998/1999 2001/2002
Duration1
of primaryeducation
Total Male Female Total Male Female Total Male Female Total Male Female2002/2003Country or territory
1. Duration in this table is defined according to ISCED97 and may differ from that reported nationally. 2. All values shown are medians.Data in bold are for 2002/2003.
(y) Data are for 2000/2001.(x) Data are for 1999/2000.
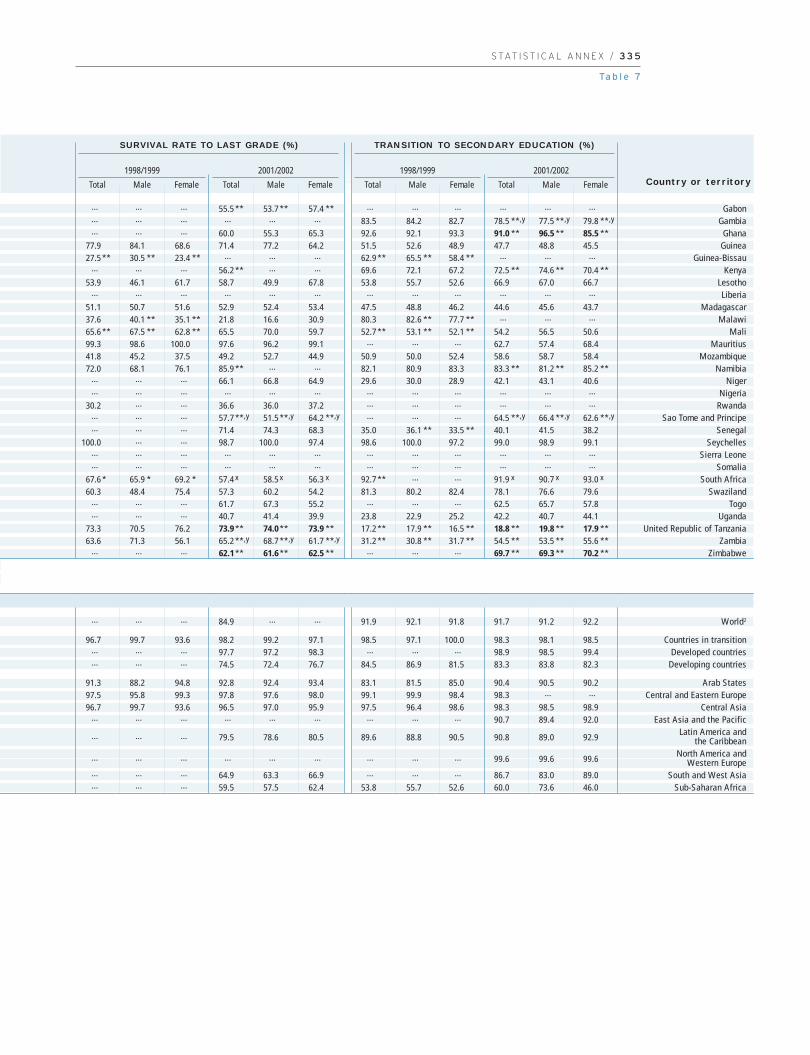
S TAT I S T I C A L A N N E X / 3 3 5
Ta b l e 7
… … … 55.5 ** 53.7 ** 57.4 ** … … … … … …… … … … … … 83.5 84.2 82.7 78.5 **,y 77.5 **,y 79.8 **,y
… … … 60.0 55.3 65.3 92.6 92.1 93.3 91.0 ** 96.5 ** 85.5 **77.9 84.1 68.6 71.4 77.2 64.2 51.5 52.6 48.9 47.7 48.8 45.527.5 ** 30.5 ** 23.4 ** … … … 62.9 ** 65.5 ** 58.4 ** … … …
… … … 56.2 ** … … 69.6 72.1 67.2 72.5 ** 74.6 ** 70.4 **53.9 46.1 61.7 58.7 49.9 67.8 53.8 55.7 52.6 66.9 67.0 66.7
… … … … … … … … … … … …
51.1 50.7 51.6 52.9 52.4 53.4 47.5 48.8 46.2 44.6 45.6 43.737.6 40.1 ** 35.1 ** 21.8 16.6 30.9 80.3 82.6 ** 77.7 ** … … …
65.6 ** 67.5 ** 62.8 ** 65.5 70.0 59.7 52.7 ** 53.1 ** 52.1 ** 54.2 56.5 50.699.3 98.6 100.0 97.6 96.2 99.1 … … … 62.7 57.4 68.441.8 45.2 37.5 49.2 52.7 44.9 50.9 50.0 52.4 58.6 58.7 58.472.0 68.1 76.1 85.9 ** … … 82.1 80.9 83.3 83.3 ** 81.2 ** 85.2 **
… … … 66.1 66.8 64.9 29.6 30.0 28.9 42.1 43.1 40.6… … … … … … … … … … … …
30.2 … … 36.6 36.0 37.2 … … … … … …… … … 57.7 **,y 51.5 **,y 64.2 **,y … … … 64.5 **,y 66.4 **,y 62.6 **,y
… … … 71.4 74.3 68.3 35.0 36.1 ** 33.5 ** 40.1 41.5 38.2100.0 … … 98.7 100.0 97.4 98.6 100.0 97.2 99.0 98.9 99.1
… … … … … … … … … … … …… … … … … … … … … … … …
67.6 * 65.9 * 69.2 * 57.4 x 58.5 x 56.3 x 92.7 ** … … 91.9 x 90.7 x 93.0 x
60.3 48.4 75.4 57.3 60.2 54.2 81.3 80.2 82.4 78.1 76.6 79.6… … … 61.7 67.3 55.2 … … … 62.5 65.7 57.8… … … 40.7 41.4 39.9 23.8 22.9 25.2 42.2 40.7 44.1
73.3 70.5 76.2 73.9 ** 74.0 ** 73.9 ** 17.2 ** 17.9 ** 16.5 ** 18.8 ** 19.8 ** 17.9 **63.6 71.3 56.1 65.2 **,y 68.7 **,y 61.7 **,y 31.2 ** 30.8 ** 31.7 ** 54.5 ** 53.5 ** 55.6 **
… … … 62.1 ** 61.6 ** 62.5 ** … … … 69.7 ** 69.3 ** 70.2 **
… … … 84.9 … … 91.9 92.1 91.8 91.7 91.2 92.2
96.7 99.7 93.6 98.2 99.2 97.1 98.5 97.1 100.0 98.3 98.1 98.5… … … 97.7 97.2 98.3 … … … 98.9 98.5 99.4… … … 74.5 72.4 76.7 84.5 86.9 81.5 83.3 83.8 82.3
91.3 88.2 94.8 92.8 92.4 93.4 83.1 81.5 85.0 90.4 90.5 90.297.5 95.8 99.3 97.8 97.6 98.0 99.1 99.9 98.4 98.3 … …
96.7 99.7 93.6 96.5 97.0 95.9 97.5 96.4 98.6 98.3 98.5 98.9… … … … … … … … … 90.7 89.4 92.0
… … … 79.5 78.6 80.5 89.6 88.8 90.5 90.8 89.0 92.9
… … … … … … … … … 99.6 99.6 99.6
… … … 64.9 63.3 66.9 … … … 86.7 83.0 89.0… … … 59.5 57.5 62.4 53.8 55.7 52.6 60.0 73.6 46.0
GabonGambia
GhanaGuinea
Guinea-BissauKenya
LesothoLiberia
MadagascarMalawi
MaliMauritius
MozambiqueNamibia
NigerNigeria
RwandaSao Tome and Principe
SenegalSeychelles
Sierra LeoneSomalia
South AfricaSwaziland
TogoUganda
United Republic of TanzaniaZambia
Zimbabwe
World2
Countries in transitionDeveloped countries
Developing countries
Arab States Central and Eastern Europe
Central AsiaEast Asia and the Pacific
Latin America and the Caribbean
North America and Western Europe
South and West AsiaSub-Saharan Africa
Country or territory
SURVIVAL RATE TO LAST GRADE (%) TRANSITION TO SECONDARY EDUCATION (%)
1998/1999 2001/2002 1998/1999 2001/2002
Total Male Female Total Male Female Total Male Female Total Male Female

60
02
Education f
or A
ll G
lobal M
onitorin
g R
eport
3 3 6 / A N N E X
Table 8Participation in secondary1 and post-secondary non-tertiary2 education
12-17 4 438 … … 3 548 51 356 40 … … … …
12-17 70 59 51 67 50 15 41 93.9 90.2 97.8 1.0812-18 107 16 42 27 40 2 49 16.2 18.9 13.5 0.7211-16 9 828 7 671 ** 47 ** 8 384 ** 47 ** 2 514 ** 45 ** 80.8** 84.3** 77.2 ** 0.92 **12-17 3 460 1 105 38 1 478 40 63 19 35.7 43.6 27.5 0.6312-17 713 579 49 613 49 35 46 86.9 85.8 88.0 1.0310-17 292 235 ** 49 ** 261 50 14 41 97.8** 96.8** 98.8 1.02 **12-17 441 372 52 350 51 46 40 77.5 74.1 80.9 1.0912-17 762 … … 798 ** 50 ** 178 ** 53 ** … … … …
12-17 373 63 ** 42 ** 84 44 3 35 18.7** 21.7** 15.8 ** 0.73 **12-17 3 904 1 470 43 1 758 45 106 42 37.7 42.0 33.3 0.7912-17 347 229 49 279 48 . . 71.7 71.9 71.5 0.9910-17 663 444 50 583 50 4 29 78.8 77.5 80.3 1.0412-17 55 44 50 52 49 0.6 . 92.3 89.6 95.1 1.0612-17 2 981 1 774 46 1 995 46 68 10 67.9 72.7 62.9 0.8712-16 3 650 965 ** … 1 291 45 29 36 28.5** … … …
12-17 2 656 1 030 47 1 284 47 122 45 40.6 42.5 38.7 0.9112-18 1 481 1 059 49 1 149 51 18 37 72.9 72.3 73.6 1.0211-17 348 202 50 273 49 2 . 82.1 79.0 85.5 1.0812-17 2 903 1 042 26 1 373 30 9 5 41.9 60.3 22.5 0.37
10-17 489 363 ** 49 ** 396 48 20 49 75.8** 74.7** 77.1 ** 1.03 **10-16 1 098 1 143 49 998 50 5 34 97.2 97.4 97.0 1.0010-17 490 … … … … … …
11-17 719 700 48 707 48 199 39 89.4 90.3 88.5 0.9811-18 445 416 49 400 49 146 46 87.6 86.8 88.4 1.0211-18 1 032 928 50 1 000 49 391 47 82.5 80.9 84.3 1.0413-18 128 116 50 123 50 17 34 92.7 91.0 94.6 1.0411-18 973 1 007 49 1 030 49 67 39 95.3 94.5 96.0 1.0211-18 290 255 50 276 49 39 39 88.4 86.8 90.1 1.0411-18 437 407 45 448 49 37 35 95.7 95.5 96.0 1.0113-18 3 727 … … 3 895 48 1 181 39 … … … …
11-17 560 415 50 411 50 23 37 72.2 71.8 72.6 1.0111-18 2 620 2 218 49 2 218 49 650 44 78.9 78.3 79.4 1.0110-16 15 245 … … 14 486 ** … 1 949 ** … … … … …
11-18 … 814 49 761 y 49 y 267 y 47 y 92.3 92.0 92.6 1.0110-18 730 674 50 670 49 218 47 85.2 84.3 86.2 1.0211-18 199 220 49 218 49 87 45 98.7 97.4 100.1 1.0311-18 258 219 48 219 48 59 43 82.3 83.4 81.1 0.9712-16 7 263 … … 5 742 ** 42 ** 1 261 36 ** … … … …
10-16 4 980 … … 4 824 49 326 33 … … … …
10-16 423 … … 368 50 5 41 … … … …
10-16 1 322 929 49 1 094 48 21 34 76.9 77.2 76.7 0.9910-16 562 440 49 450 49 9 27 72.8 73.1 72.3 0.9911-17 2 252 1 966 49 2 067 49 91 36 87.4 87.8 87.1 0.9911-17 805 633 50 739 50 26 36 85.4 84.3 86.4 1.0212-17 374 205 55 313 53 17 50 58.3 51.4 65.2 1.2711-17 1 105 769 46 948 45 26 29 72.6 78.0 67.0 0.8610-16 825 … … … … … … … … … …
11-17 4 363 … … 4 161 49 367 44 … … … …
12-17 1 635 2 433 50 2 514 48 1 102 46 154.8 151.7 158.0 1.0412-18 43 33 51 39 49 2 36 81.6 77.7 85.6 1.1012-17 2 222 318 ** 34 ** 560 38 15 34 16.0** 20.8** 11.0 ** 0.53 **
AlgeriaBahrainDjiboutiEgyptIraqJordanKuwaitLebanonLibyan Arab JamahiriyaMauritaniaMoroccoOmanPalestinian A.T.QatarSaudi ArabiaSudanSyrian Arab RepublicTunisiaUnited Arab EmiratesYemen
AlbaniaBelarusBosnia and HerzegovinaBulgariaCroatiaCzech RepublicEstoniaHungaryLatviaLithuaniaPolandRepublic of MoldovaRomaniaRussian FederationSerbia and Montenegro3
SlovakiaSloveniaTFYR MacedoniaTurkeyUkraine
ArmeniaAzerbaijanGeorgiaKazakhstanKyrgyzstanMongoliaTajikistanTurkmenistanUzbekistan
AustraliaBrunei DarussalamCambodia
ENROLMENT IN SECONDARY EDUCATION
Total enrolment Enrolment in technical
and vocational education
1998/1999Age
group
School-agepopulation
(000) 2002/2003 2002/2003
Country or territory (F/M)20022002/
2003% F Total
(000)Total(000)
% FTotal(000)
1998/1999
MaleTotal Female% F GPI
GROSS ENROLMENT RATIO(GER) IN SECONDARY
EDUCATION (%)
123456789
1011121314151617181920
2122232425262728293031323334353637383940
414243444546474849
505152
Arab States
Central and Eastern Europe
Central Asia
East Asia and the Pacific
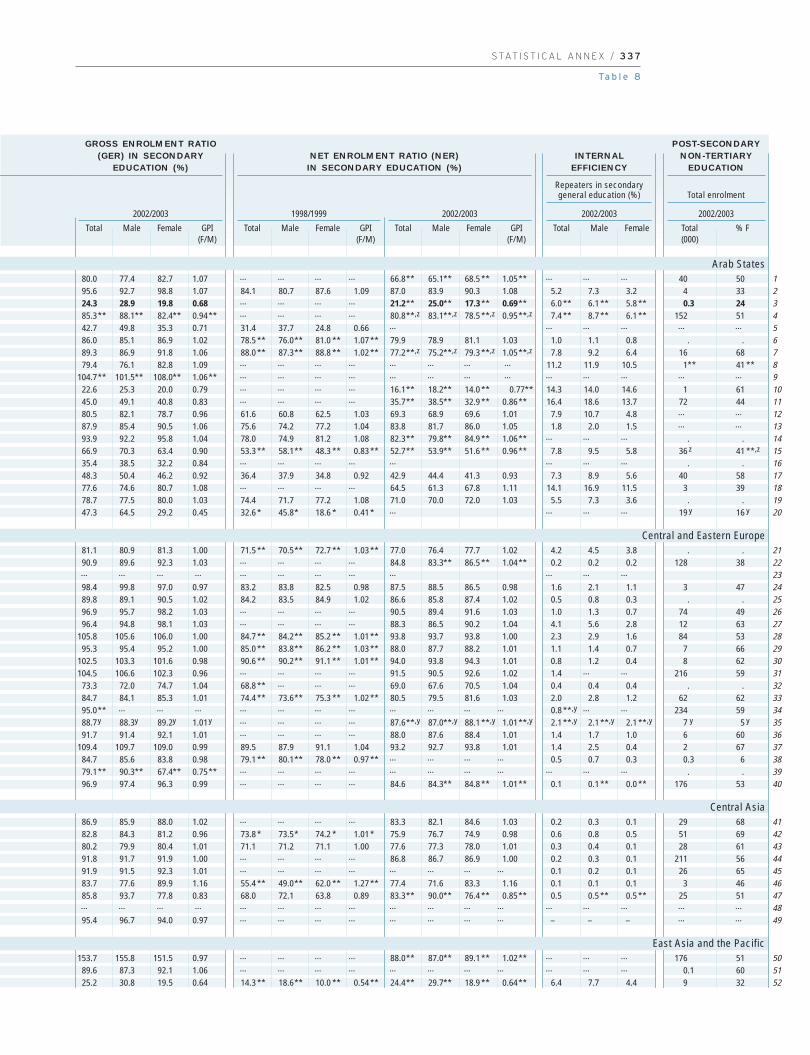
S TAT I S T I C A L A N N E X / 3 3 7
Ta b l e 8
80.0 77.4 82.7 1.07 … … … … 66.8** 65.1** 68.5 ** 1.05** … … … 40 5095.6 92.7 98.8 1.07 84.1 80.7 87.6 1.09 87.0 83.9 90.3 1.08 5.2 7.3 3.2 4 3324.3 28.9 19.8 0.68 … … … … 21.2** 25.0** 17.3 ** 0.69** 6.0 ** 6.1 ** 5.8 ** 0.3 2485.3** 88.1** 82.4** 0.94** … … … … 80.8**,z 83.1**,z 78.5 **,z 0.95**,z 7.4 ** 8.7 ** 6.1 ** 152 5142.7 49.8 35.3 0.71 31.4 37.7 24.8 0.66 … … … … … …
86.0 85.1 86.9 1.02 78.5 ** 76.0** 81.0 ** 1.07 ** 79.9 78.9 81.1 1.03 1.0 1.1 0.8 . .89.3 86.9 91.8 1.06 88.0 ** 87.3** 88.8 ** 1.02 ** 77.2**,z 75.2**,z 79.3 **,z 1.05**,z 7.8 9.2 6.4 16 6879.4 76.1 82.8 1.09 … … … … … … … … 11.2 11.9 10.5 1** 41 **
104.7** 101.5** 108.0** 1.06** … … … … … … … … … … … … …
22.6 25.3 20.0 0.79 … … … … 16.1** 18.2** 14.0 ** 0.77** 14.3 14.0 14.6 1 6145.0 49.1 40.8 0.83 … … … … 35.7** 38.5** 32.9 ** 0.86** 16.4 18.6 13.7 72 4480.5 82.1 78.7 0.96 61.6 60.8 62.5 1.03 69.3 68.9 69.6 1.01 7.9 10.7 4.8 … …
87.9 85.4 90.5 1.06 75.6 74.2 77.2 1.04 83.8 81.7 86.0 1.05 1.8 2.0 1.5 … …
93.9 92.2 95.8 1.04 78.0 74.9 81.2 1.08 82.3** 79.8** 84.9 ** 1.06** … … … . .66.9 70.3 63.4 0.90 53.3 ** 58.1** 48.3 ** 0.83 ** 52.7** 53.9** 51.6 ** 0.96** 7.8 9.5 5.8 36 z 41 **,z
35.4 38.5 32.2 0.84 … … … … … … … … . .48.3 50.4 46.2 0.92 36.4 37.9 34.8 0.92 42.9 44.4 41.3 0.93 7.3 8.9 5.6 40 5877.6 74.6 80.7 1.08 … … … … 64.5 61.3 67.8 1.11 14.1 16.9 11.5 3 3978.7 77.5 80.0 1.03 74.4 71.7 77.2 1.08 71.0 70.0 72.0 1.03 5.5 7.3 3.6 . .47.3 64.5 29.2 0.45 32.6 * 45.8* 18.6 * 0.41 * … … … … 19 y 16 y
81.1 80.9 81.3 1.00 71.5 ** 70.5** 72.7 ** 1.03 ** 77.0 76.4 77.7 1.02 4.2 4.5 3.8 . .90.9 89.6 92.3 1.03 … … … … 84.8 83.3** 86.5 ** 1.04** 0.2 0.2 0.2 128 38… … … … … … … … … … … …
98.4 99.8 97.0 0.97 83.2 83.8 82.5 0.98 87.5 88.5 86.5 0.98 1.6 2.1 1.1 3 4789.8 89.1 90.5 1.02 84.2 83.5 84.9 1.02 86.6 85.8 87.4 1.02 0.5 0.8 0.3 . .96.9 95.7 98.2 1.03 … … … … 90.5 89.4 91.6 1.03 1.0 1.3 0.7 74 4996.4 94.8 98.1 1.03 … … … … 88.3 86.5 90.2 1.04 4.1 5.6 2.8 12 63
105.8 105.6 106.0 1.00 84.7 ** 84.2** 85.2 ** 1.01 ** 93.8 93.7 93.8 1.00 2.3 2.9 1.6 84 5395.3 95.4 95.2 1.00 85.0 ** 83.8** 86.2 ** 1.03 ** 88.0 87.7 88.2 1.01 1.1 1.4 0.7 7 66
102.5 103.3 101.6 0.98 90.6 ** 90.2** 91.1 ** 1.01 ** 94.0 93.8 94.3 1.01 0.8 1.2 0.4 8 62104.5 106.6 102.3 0.96 … … … … 91.5 90.5 92.6 1.02 1.4 … … 216 59
73.3 72.0 74.7 1.04 68.8 ** … … … 69.0 67.6 70.5 1.04 0.4 0.4 0.4 . .84.7 84.1 85.3 1.01 74.4 ** 73.6** 75.3 ** 1.02 ** 80.5 79.5 81.6 1.03 2.0 2.8 1.2 62 6295.0** … … … … … … … … … … … 0.8 **,y … … 234 5988.7y 88.3y 89.2y 1.01 y … … … … 87.6**,y 87.0**,y 88.1 **,y 1.01**,y 2.1 **,y 2.1 **,y 2.1 **,y 7 y 5 y
91.7 91.4 92.1 1.01 … … … … 88.0 87.6 88.4 1.01 1.4 1.7 1.0 6 60109.4 109.7 109.0 0.99 89.5 87.9 91.1 1.04 93.2 92.7 93.8 1.01 1.4 2.5 0.4 2 67
84.7 85.6 83.8 0.98 79.1 ** 80.1** 78.0 ** 0.97 ** … … … … 0.5 0.7 0.3 0.3 679.1** 90.3** 67.4** 0.75** … … … … … … … … … … … . .96.9 97.4 96.3 0.99 … … … … 84.6 84.3** 84.8 ** 1.01** 0.1 0.1 ** 0.0 ** 176 53
86.9 85.9 88.0 1.02 … … … … 83.3 82.1 84.6 1.03 0.2 0.3 0.1 29 6882.8 84.3 81.2 0.96 73.8 * 73.5* 74.2 * 1.01 * 75.9 76.7 74.9 0.98 0.6 0.8 0.5 51 6980.2 79.9 80.4 1.01 71.1 71.2 71.1 1.00 77.6 77.3 78.0 1.01 0.3 0.4 0.1 28 6191.8 91.7 91.9 1.00 … … … … 86.8 86.7 86.9 1.00 0.2 0.3 0.1 211 5691.9 91.5 92.3 1.01 … … … … … … … … 0.1 0.2 0.1 26 6583.7 77.6 89.9 1.16 55.4 ** 49.0** 62.0 ** 1.27 ** 77.4 71.6 83.3 1.16 0.1 0.1 0.1 3 4685.8 93.7 77.8 0.83 68.0 72.1 63.8 0.89 83.3** 90.0** 76.4 ** 0.85** 0.5 0.5 ** 0.5 ** 25 51… … … … … … … … … … … … … … … … …
95.4 96.7 94.0 0.97 … … … … … … … … – – – … …
153.7 155.8 151.5 0.97 … … … … 88.0** 87.0** 89.1 ** 1.02** … … … 176 5189.6 87.3 92.1 1.06 … … … … … … … … … … … 0.1 6025.2 30.8 19.5 0.64 14.3 ** 18.6** 10.0 ** 0.54 ** 24.4** 29.7** 18.9 ** 0.64** 6.4 7.7 4.4 9 32
Repeaters in secondarygeneral education (%) Total enrolment
(F/M)
2002/2003
MaleTotal Female GPI(F/M)
1998/1999
MaleTotal Female GPI(F/M)
2002/2003 2002/2003 2002/2003
MaleTotal Female MaleTotal Female Total(000)
% FGPI
GROSS ENROLMENT RATIO(GER) IN SECONDARY
EDUCATION (%)NET ENROLMENT RATIO (NER) IN SECONDARY EDUCATION (%)
INTERNALEFFICIENCY
POST-SECONDARYNON-TERTIARY
EDUCATION
1234567891011121314151617181920
2122232425262728293031323334353637383940
414243444546474849
505152
Arab States
Central and Eastern Europe
Central Asia
East Asia and the Pacific

60
02
Education f
or A
ll G
lobal M
onitorin
g R
eport
3 3 8 / A N N E X
Table 8 (continued)
12-17 136 109 77 436 … 95 625 47 11 298 48 61.7 … … …
11-18 … 2 50 2 **,y 50 **,y . . … … … …
10-15 2 364 … … … … … … … … … …
12-18 119 … … 96 **,z 50 **,z 3 **,z 37**,z … … … …
13-18 26 141 … … 15 873 49 2 100 43 … … … …
12-17 7 971 8 959 49 8 131 49 1 048 44 101.8 101.1 102.4 1.0112-16 … … … 10 52 … … … … … …
11-16 809 240 40 353 42 5 40 33.4 39.4 27.3 0.6912-17 49 32 51 44 50 3 48 75.5 71.8 79.4 1.1012-18 3 273 2 154 51 2 300 51 141 42 69.4 65.9 73.1 1.1112-17 … 6 50 6 z 50 z . . … … … …
12-17 17 19 … … … … … 109.2 … … …
10-15 6 116 2 059 50 2 383 48 – – 34.9 35.0 34.8 0.9912-17 … 0.7** 51 ** … … … … 53.9** 52.3** 55.6 ** 1.06 **11-17 411 433 50 483 … 56 … 114.3 110.9 117.8 1.0611-16 … 0.3 47 0.2 z 50 z . . 101.4 111.9 91.7 0.8211-17 … 2 49 2 **,y 48 **,y . . 101.2 98.2 104.5 1.0713-18 723 133 40 185 41 17 27 20.4 23.2 17.3 0.7512-15 7 226 5 117 51 6 069 51 . . 75.8 72.5 79.3 1.0912-17 4 076 4 368 48 3 646 47 546 48 99.9 99.9 99.9 1.0011-17 30 22 50 23 ** 50 ** . . 74.9 71.2 78.9 1.1112-15 235 … … … … … … … … … …
12-18 75 … … 46 … … … … … … …
12-17 6 596 … … 5 010 50 625 45 … … … …
12-17 138 … … 47 z … – z … … … … …
11-16 … … … … … … … … … … …
11-16 14 14 51 15 50 … … 93.3 87.8 99.3 1.1312-17 … 0.8 ** 45 ** 0.9 z 46 z … … 78.3** 83.1** 73.1 ** 0.88 **12-18 35 10 ** 43 ** 10 50 … … 33.1** 36.1** 29.9 ** 0.83 **11-17 12 794 7 401 47 9 266 47 310 51 61.9 65.1 58.6 0.90
12-16 … 1 53 1 ** 51 ** 0.1 ** 58 ** … … … …
12-16 … … … … … … … … … … …
12-17 3 986 3 556 51 3 976 51 1 271 52 89.0 85.7 92.5 1.0812-16 … 6 51 7 52 1 38 100.6 98.6 102.7 1.0411-16 35 … … 32 ** 50 ** . . … … … …
11-15 20 22 ** 51 ** 21 50 0.1 23 104.0** 101.3** 106.7 ** 1.05 **11-16 36 22 51 28 ** 51 ** 1 ** 59 ** 64.8 62.3 67.4 1.0811-17 … … … 5 z 51 z . . … … … …
12-17 1 154 756 48 997 ** 48 ** 40 ** 66 ** 72.3 74.9 69.7 0.9311-17 24 345 … … 26 789 52 484 70 … … … …
12-16 … 2 47 2 54 0.3 53 98.8 103.3 94.1 0.9111-16 … 2 48 2 z 50 z . . … … … …
12-17 1 684 1 246 50 1 557 49 387 46 79.6 78.0 81.3 1.0411-16 5 261 3 549 52 3 723 52 286 55 70.6 66.9 74.5 1.1112-16 435 227 51 289 50 54 50 56.8 54.5 59.2 1.0912-17 1 013 740 50 938 48 272 39 79.4 77.1 81.8 1.0612-16 … 7 53 8 52 0.4 61 85.5 78.5 92.8 1.1812-17 1 122 610 ** 55 ** 658 ** 54 ** 30 ** 55 ** 56.1** 49.5** 63.0 ** 1.27 **12-17 1 643 904 50 973 50 216 53 56.4 55.7 57.2 1.0313-18 784 402 49 463 50 91 ** 52 ** 50.2 50.4 50.0 0.9912-16 … … … 15 49 1 29 … … … …
13-17 1 426 400 * 47 * 608 47 174 51 30.7* 31.9* 29.5 * 0.92 *12-16 73 66 50 69 ** 50 ** … … 81.1 80.5 81.8 1.0212-18 1 490 … … … … … … … … … …
13-18 940 … … … … … … … … … …
12-16 273 231 ** 50 ** 230 50 0.4 42 84.1** 83.2** 85.1 ** 1.02 **12-17 12 890 8 722 50 10 188 51 1 592 59 69.1 68.3 69.9 1.02
ChinaCook Islands4
DPR KoreaFijiIndonesiaJapanKiribati3
Lao PDRMacao, ChinaMalaysiaMarshall Islands3
Micronesia MyanmarNauru3
New ZealandNiue3
Palau3
Papua New GuineaPhilippinesRepublic of KoreaSamoaSingaporeSolomon IslandsThailandTimor-LesteTokelauTongaTuvalu3
VanuatuViet Nam
Anguilla3
Antigua and BarbudaArgentinaAruba3
BahamasBarbadosBelizeBermuda3
BoliviaBrazilBritish Virgin Islands3
Cayman Islands4
ChileColombiaCosta RicaCubaDominica3
Dominican RepublicEcuadorEl SalvadorGrenada3
GuatemalaGuyanaHaitiHondurasJamaicaMexico
ENROLMENT IN SECONDARY EDUCATION
Total enrolment Enrolment in technical
and vocational education
1998/1999Age
group
School-agepopulation
(000) 2002/2003 2002/2003
Country or territory (F/M)20022002/ % F Total
(000)Total(000)
% FTotal(000)
1998/1999
MaleTotal Female% F GPI
GROSS ENROLMENT RATIO(GER) IN SECONDARY
EDUCATION (%)
535455565758596061626364656667686970717273747576777879808182
8384858687888990919293949596979899
100101102103104105106107108109
Latin America and the Caribbean
2003

S TAT I S T I C A L A N N E X / 3 3 9
Ta b l e 8
70.3 71.2 69.2 0.97 … … … … … … … … 0.3 0.3 0.2 612 38… … … … … … … … … … … … 4.3 **,y … … 0.04**,y 69 **,y
… … … … … … … … … … … … … … … … …
80.4**,z 77.6**,z 83.2**,z 1.07**,z … … … … 76.0**,z 73.4**,z 78.7 **,z 1.07**,z . . . . .60.7 61.1 60.3 0.99 … … … … 54.0 54.3 53.6 0.99 0.4 0.7 0.2 . .
102.0 101.8 102.2 1.00 … … … … 99.8** … … … … … … 14 63104.4 98.0 111.1 1.13 … … … … … … … … … … … … …
43.7 50.0 37.2 0.74 26.7 29.9 23.5 0.79 35.1 38.3 31.8 0.83 2.0 2.8 1.0 20 4290.9 88.0 94.0 1.07 61.9 58.4 65.6 1.12 74.3 70.7 78.0 1.10 11.2 13.3 9.1 . .70.3 66.7 74.1 1.11 68.9 65.4 72.6 1.11 70.0 66.4 73.8 1.11 … … … 173 4675.7z 75.0z 76.4z 1.02 z … … … … 64.9z 63.7z 66.2 z 1.04 z 3.1 **,z 3.1 **,z 3.2 **,z 0.05 z 27 z
… … … … … … … … … … … … . z . z . z … …
39.0 40.1 37.8 0.94 31.2 ** 31.4** 31.0 ** 0.99 ** 35.1 36.2 33.9 0.94 2.2 2.2 2.3 . .… … … … … … … … … … … … … … … … …
117.5 … … … 92.1 91.5 92.6 1.01 92.7 91.3 94.1 1.03 … … … 45 5393.8z 94.6z 93.0z 0.98 z … … … … 93.8z 94.6z 93.0 z 0.98 z . . . . .88.8**,y 88.6**,y 88.9**,y 1.00**,y … … … … … … … … … … … … …
25.5 28.4 22.3 0.79 20.4 * 23.2* 17.3 * 0.75 * 23.7**,z 26.3**,z 20.7 **,z 0.79**,z – z – z – z . .84.0 79.9 88.2 1.10 50.8 48.6 53.1 1.09 59.3 54.2 64.6 1.19 2.3 3.6 1.1 452 4690.5 90.3 90.7 1.00 96.5 96.4 96.6 1.00 87.9 87.8 88.0 1.00 0.3 0.3 0.2 . .75.9** 72.5** 79.5** 1.10** 65.8 62.9 69.1 1.10 62.1** 59.1** 65.4 ** 1.11** 2.2 z 2.4 z 2.0 z 0.2 60… … … … … … … … … … … … – y – y – y … …
61.5 … … … … … … … … … … … … … … . .76.7 76.6 76.7 1.00 … … … … … … … … … … … 17 7234.6z … … … … … … … 20.3**,y … … … … … … . .… … … … … … … … … … … … … … … . .
102.8 96.1 110.7 1.15 68.5 64.2 73.2 1.14 71.7**,z 67.5**,z 76.7 **,z 1.14**,z 5.7 z 5.8 z 5.6 z 1 z 40 z
84.4z 87.2z 81.3z 0.93 z … … … … … 6.3 **,z 5.8 **,z 6.8 **,z … …
27.8 26.8 28.9 1.08 … … … … 27.5z … … … . . . 2 z 37 z
72.4 75.2 69.6 0.93 55.2 ** … … … 65.3**,z … … … 1.3 ** 1.9 ** 0.7 ** . .
108.3** 108.4** 108.2** 1.00** … … … … 100.0** … … … – – – 0.1 73… … … … … … … … … … … … – z – z – z … …
99.7 96.9 102.7 1.06 73.6 ** 71.0** 76.3 ** 1.07 ** 81.3 78.8 83.8 1.06 8.3 10.0 6.5 . .103.1 99.5 106.7 1.07 79.3 76.4 82.1 1.07 75.3 71.9 78.7 1.09 z 14.7 15.5 14.0 . .
91.3** 90.0** 92.6** 1.03** … … … … 75.8** 74.4** 77.3 ** 1.04** . . . … …
105.8 105.0 106.6 1.02 88.2 ** 86.4** 90.0 ** 1.04 ** 89.8 89.9 89.7 1.00 – – – 4 5077.8** 75.8** 79.8** 1.05** 56.4 ** 54.2** 58.7 ** 1.08 ** 69.0** 67.3** 70.7 ** 1.05** 7.0 7.7 6.3 2 5986.1z … … … … … … … 86.1z … … … . . . . .86.4** 87.9** 84.8** 0.97** … … … … 71.2** 71.9** 70.5 ** 0.98** 3.5 4.1 2.8 … …
110.0 104.9 115.3 1.10 … … … … 74.9 71.9 77.9 1.08 17.4 … … . .94.7 87.8 101.5 1.16 79.8 ** 81.1** 78.4 ** 0.97 ** 77.6** 71.4** 83.7 ** 1.17** 9.5 ** 12.3 ** 7.1 ** 0.8 ** 69 **… … … … … … … … … … … … … … … 0.04*,z 54 *,z
91.2 90.6 91.8 1.01 70.3 68.8 71.9 1.05 80.8 80.2 81.4 1.01 2.2 2.7 1.7 . .70.8 67.3 74.4 1.11 54.0 ** … … … 55.3** 52.7** 57.9 ** 1.10** 4.5 ** 5.3 ** 3.7 ** . .66.5 64.1 69.0 1.08 48.5 ** 46.5** 50.7 ** 1.09 ** 52.7 50.3 55.1 1.09 9.5 10.8 8.3 . .92.6 93.5 91.6 0.98 75.2 71.4 79.3 1.11 86.2 86.4 86.1 1.00 1.4 1.8 1.0 24 79
113.9 107.7 120.2 1.12 65.5 55.7 75.7 1.36 91.8** 86.0** 97.8 ** 1.14** 7.4 9.0 5.9 2 6058.7** 52.6** 65.0** 1.23** 39.5 ** 34.6** 44.7 ** 1.29 ** 35.5** 30.5** 40.8 ** 1.34** 3.1 ** 4.0 ** 2.4 ** . .59.2 58.7 59.7 1.02 46.1 45.4 46.8 1.03 50.4 49.6 51.2 1.03 3.9 4.7 3.1 . .59.0 58.8 59.2 1.01 39.6 ** 39.9** 39.4 ** 0.99 ** 48.6** 48.0** 49.2 ** 1.02** 2.4 **,z 3.1 **,z 1.7 **,z . .
148.7 151.9 145.5 0.96 … … … … 100.0** … … … 8.5 10.7 6.3 1 6642.7 44.3 41.0 0.93 21.3 ** 21.7** 20.8 ** 0.96 ** 29.7 30.4 28.9 0.95 3.1 3.5 2.5 . .94.7** 91.9** 97.7** 1.06** 74.2 ** 72.2** 76.3 ** 1.06 ** 76.4**,y 75.0**,y 77.9 **,y 1.04**,y 7.2 y 8.6 y 5.8 y 1**,z 73 **,z
… … … … … … … … … … … … … … … … …… … … … … … … … … … … … … … … . .84.1 83.1 85.1 1.02 79.5 ** 78.8** 80.2 ** 1.02 ** 75.4** 73.9** 77.0 ** 1.04** 1.6 2.3 ** 0.8 ** 42 z 59 z
79.0 75.6 82.6 1.09 54.9 ** 55.1** 54.8 ** 1.00 ** 62.6 61.3 63.9 1.04 1.9 2.5 1.3 . .
Repeaters in secondarygeneral education (%) Total enrolment
(F/M)
2002/2003
MaleTotal Female GPI(F/M)
1998/1999
MaleTotal Female GPI(F/M)
2002/2003 2002/2003 2002/2003
MaleTotal Female MaleTotal Female Total(000)
% FGPI
GROSS ENROLMENT RATIO(GER) IN SECONDARY
EDUCATION (%)NET ENROLMENT RATIO (NER) IN SECONDARY EDUCATION (%)
INTERNALEFFICIENCY
POST-SECONDARYNON-TERTIARY
EDUCATION
535455565758596061626364656667686970717273747576777879808182
8384858687888990919293949596979899100101102103104105106107108109
Latin America and the Caribbean

60
02
Education f
or A
ll G
lobal M
onitorin
g R
eport
3 4 0 / A N N E X
Table 8 (continued)
12-16 … 0.3 47 0.3** 49 ** . . … … … …
12-17 21 15 54 15 ** 52 ** 6 ** 54 ** 74.9 69.0 80.9 1.1713-17 631 287 ** 54 ** 383 53 19 56 48.4** 44.3** 52.5 ** 1.18 **12-17 356 229 ** 51 ** 251 51 103 49 67.5** 65.0** 70.1 ** 1.08 **12-17 799 368 50 519 50 ** 45 48 ** 50.8 49.6 52.1 1.0512-16 2 832 2 212 48 2 540 48 . . 81.7 84.0 79.4 0.9512-16 … … … 4 55 . . … … … …
12-16 15 12 57 13 56 0.3 40 76.4 66.6 86.1 1.2912-16 14 … … 10 52 2 34 … … … …
12-17 56 … … 41 ** 56 ** 18 ** 52 ** … … … …
12-16 131 117 ** 52 ** 108 ** 51 ** 3 ** 53 ** 81.7** 78.5** 85.0 ** 1.08 **12-16 … 1 51 1 ** 49 ** 0.1 ** 49 ** … … … …
12-17 314 … … 332 52 28 45 … … … …
12-16 2 670 1 439 54 1 866 53 57 51 56.9 51.2 62.8 1.23
12-17 … … … 3 50 0.2 46 … … … …
10-17 765 748 48 764 47 267 43 98.8 100.9 96.6 0.9612-17 735 1 033 51 1 181 51 693 51 142.4 137.3 147.7 1.0812-17 2 514 2 565 49 2 622 **,z 49 **,z 102 **,z 36 **,z 105.3 105.6 105.0 0.9912-17 … 63 49 65 49 4 18 93.2 91.8 94.7 1.0313-18 346 422 50 447 50 118 46 125.6 122.1 129.2 1.0613-18 388 480 51 497 51 178 50 120.9 115.8 126.2 1.0911-17 5 379 5 955 49 5 859 49 1 457 45 109.6 109.5 109.6 1.0010-18 8 447 8 185 48 8 447 48 1 730 43 98.2 99.0 97.3 0.9812-17 732 771 49 714 49 134 41 93.9 93.3 94.5 1.0113-19 30 32 50 35 50 7 38 109.4 106.2 112.7 1.0612-16 300 346 50 321 51 . . 105.4 102.2 108.7 1.0612-17 647 569 49 603 48 125 42 90.8 91.0 90.6 1.0011-18 4 561 4 450 49 4 528 48 ** 699 45 91.7 92.2 91.1 0.9912-18 36 … … 35 50 12 48 … … … …
11-17 40 … … 38 48 2 24 … … … …
11-17 … 3 51 3 y 48 y 0.5 y 44 y … … … …
12-17 1 161 1 365 48 1 415 49 489 47 124.4 127.1 121.6 0.9613-18 336 378 49 385 49 124 45 120.3 118.9 121.7 1.0212-17 680 848 51 766 51 106 46 109.5 105.3 114.0 1.0811-18 … … … … … … … … … … …
12-17 2 599 3 299 50 3 053 50 410 48 108.9 105.4 112.6 1.0713-18 662 964 55 918 53 258 53 160.1 141.0 180.2 1.2813-19 568 544 47 556 47 175 40 99.9 103.8 95.8 0.9211-17 5 437 8 053 52 9 706 54 5 302 58 156.9 148.3 165.7 1.1212-17 25 336 22 445 … 23 854 49 . . 94.9 … … …
13-18 3 012 … … 362 z – z – z – z … … … …
11-17 23 212 9 134 47 11 024 51 126 26 42.4 43.3 41.5 0.9613-16 … 17 44 29 ** 45 ** 0.5 ** 39 ** … … … …
11-17 153 514 67 090 39 81 050 43 710 15 46.6 54.4 38.1 0.7011-17 12 869 9 727 47 10 024 47 819 38 77.4 80.2 74.4 0.9313-17 38 12 51 25 53 … … 36.5 35.7 37.3 1.0510-16 4 047 1 265 40 1 822 42 16 22 35.5 41.2 29.3 0.7110-16 25 462 … … 5 734 40 83 18 … … … …
10-17 2 721 … … 2 320 ** 51 ** … … … … … …
10-16 2 241 292 * 44 * 414 z 44 z 77 z 39 z 14.7* 16.5* 13.0 * 0.78 *12-18 1 131 213 31 312 32 29 25 21.1 29.1 13.2 0.4513-17 218 148 52 159 ** 51 ** 5 ** 30 ** 71.2 67.7 74.6 1.1013-19 2 062 173 38 237 40 18 50 9.4 11.8 7.1 0.60
Montserrat3
Netherlands AntillesNicaraguaPanamaParaguayPeruSaint Kitts and Nevis3
Saint LuciaSaint Vincent/Grenad.SurinameTrinidad and TobagoTurks and Caicos Islands3
UruguayVenezuela
Andorra4
AustriaBelgiumCanadaCyprus3
DenmarkFinlandFranceGermanyGreeceIcelandIrelandIsraelItalyLuxembourgMaltaMonaco4
NetherlandsNorwayPortugalSan MarinoSpainSwedenSwitzerlandUnited KingdomUnited States
AfghanistanBangladeshBhutan5
IndiaIran, Islamic Republic ofMaldivesNepalPakistanSri Lanka
AngolaBeninBotswanaBurkina Faso
ENROLMENT IN SECONDARY EDUCATION
Total enrolment Enrolment in technical
and vocational education
1998/1999Age
group
School-agepopulation
(000) 2002/2003 2002/2003
Country or territory (F/M)20022002/ % F Total
(000)Total(000)
% FTotal(000)
1998/1999
MaleTotal Female% F GPI
GROSS ENROLMENT RATIO(GER) IN SECONDARY
EDUCATION (%)
110111112113114115116117118119120121122123
124125126127128129130131132133134135136137138139140141142143144145146147148149
150151152153154155156157158
159160161162
North America and Western Europe
South and West Asia
Sub-Saharan Africa
2003
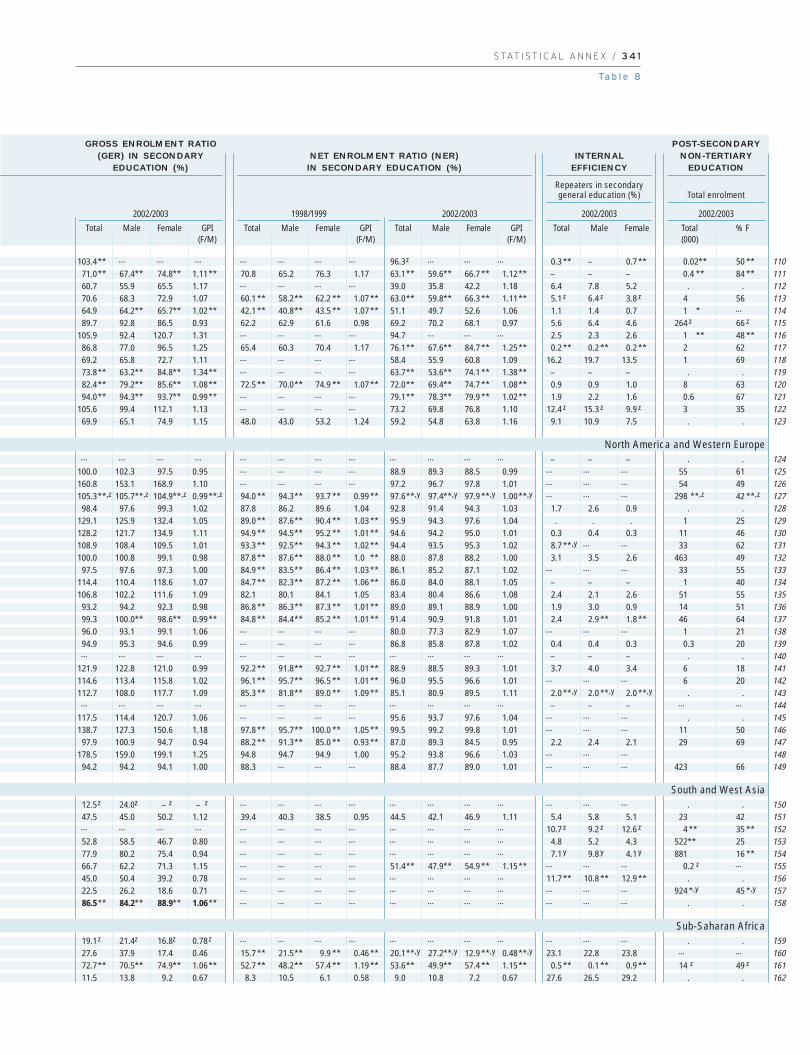
S TAT I S T I C A L A N N E X / 3 4 1
Ta b l e 8
103.4** … … … … … … … 96.3z … … … 0.3 ** – 0.7 ** 0.02** 50 **71.0** 67.4** 74.8** 1.11** 70.8 65.2 76.3 1.17 63.1** 59.6** 66.7 ** 1.12** – – – 0.4 ** 84 **60.7 55.9 65.5 1.17 … … … … 39.0 35.8 42.2 1.18 6.4 7.8 5.2 . .70.6 68.3 72.9 1.07 60.1 ** 58.2** 62.2 ** 1.07 ** 63.0** 59.8** 66.3 ** 1.11** 5.1 z 6.4 z 3.8 z 4 5664.9 64.2** 65.7** 1.02** 42.1 ** 40.8** 43.5 ** 1.07 ** 51.1 49.7 52.6 1.06 1.1 1.4 0.7 1 * …
89.7 92.8 86.5 0.93 62.2 62.9 61.6 0.98 69.2 70.2 68.1 0.97 5.6 6.4 4.6 264 z 66 z
105.9 92.4 120.7 1.31 … … … … 94.7 … … … 2.5 2.3 2.6 1 ** 48 **86.8 77.0 96.5 1.25 65.4 60.3 70.4 1.17 76.1** 67.6** 84.7 ** 1.25** 0.2 ** 0.2 ** 0.2 ** 2 6269.2 65.8 72.7 1.11 … … … … 58.4 55.9 60.8 1.09 16.2 19.7 13.5 1 6973.8** 63.2** 84.8** 1.34** … … … … 63.7** 53.6** 74.1 ** 1.38** – – – . .82.4** 79.2** 85.6** 1.08** 72.5 ** 70.0** 74.9 ** 1.07 ** 72.0** 69.4** 74.7 ** 1.08** 0.9 0.9 1.0 8 6394.0** 94.3** 93.7** 0.99** … … … … 79.1** 78.3** 79.9 ** 1.02** 1.9 2.2 1.6 0.6 67
105.6 99.4 112.1 1.13 … … … … 73.2 69.8 76.8 1.10 12.4 z 15.3 z 9.9 z 3 3569.9 65.1 74.9 1.15 48.0 43.0 53.2 1.24 59.2 54.8 63.8 1.16 9.1 10.9 7.5 . .
… … … … … … … … … … … … – – – . .100.0 102.3 97.5 0.95 … … … … 88.9 89.3 88.5 0.99 … … … 55 61160.8 153.1 168.9 1.10 … … … … 97.2 96.7 97.8 1.01 … … … 54 49105.3**,z 105.7**,z 104.9**,z 0.99**,z 94.0 ** 94.3** 93.7 ** 0.99 ** 97.6**,y 97.4**,y 97.9 **,y 1.00**,y … … … 298 **,z 42 **,z
98.4 97.6 99.3 1.02 87.8 86.2 89.6 1.04 92.8 91.4 94.3 1.03 1.7 2.6 0.9 . .129.1 125.9 132.4 1.05 89.0 ** 87.6** 90.4 ** 1.03 ** 95.9 94.3 97.6 1.04 . . . 1 25128.2 121.7 134.9 1.11 94.9 ** 94.5** 95.2 ** 1.01 ** 94.6 94.2 95.0 1.01 0.3 0.4 0.3 11 46108.9 108.4 109.5 1.01 93.3 ** 92.5** 94.3 ** 1.02 ** 94.4 93.5 95.3 1.02 8.7 **,y … … 33 62100.0 100.8 99.1 0.98 87.8 ** 87.6** 88.0 ** 1.0 ** 88.0 87.8 88.2 1.00 3.1 3.5 2.6 463 49
97.5 97.6 97.3 1.00 84.9 ** 83.5** 86.4 ** 1.03 ** 86.1 85.2 87.1 1.02 … … … 33 55114.4 110.4 118.6 1.07 84.7 ** 82.3** 87.2 ** 1.06 ** 86.0 84.0 88.1 1.05 – – – 1 40106.8 102.2 111.6 1.09 82.1 80.1 84.1 1.05 83.4 80.4 86.6 1.08 2.4 2.1 2.6 51 55
93.2 94.2 92.3 0.98 86.8 ** 86.3** 87.3 ** 1.01 ** 89.0 89.1 88.9 1.00 1.9 3.0 0.9 14 5199.3 100.0** 98.6** 0.99** 84.8 ** 84.4** 85.2 ** 1.01 ** 91.4 90.9 91.8 1.01 2.4 2.9 ** 1.8 ** 46 6496.0 93.1 99.1 1.06 … … … … 80.0 77.3 82.9 1.07 … … … 1 2194.9 95.3 94.6 0.99 … … … … 86.8 85.8 87.8 1.02 0.4 0.4 0.3 0.3 20… … … … … … … … … … … … – – – . .
121.9 122.8 121.0 0.99 92.2 ** 91.8** 92.7 ** 1.01 ** 88.9 88.5 89.3 1.01 3.7 4.0 3.4 6 18114.6 113.4 115.8 1.02 96.1 ** 95.7** 96.5 ** 1.01 ** 96.0 95.5 96.6 1.01 … … … 6 20112.7 108.0 117.7 1.09 85.3 ** 81.8** 89.0 ** 1.09 ** 85.1 80.9 89.5 1.11 2.0 **,y 2.0 **,y 2.0 **,y . .… … … … … … … … … … … … – – – … …
117.5 114.4 120.7 1.06 … … … … 95.6 93.7 97.6 1.04 … … … . .138.7 127.3 150.6 1.18 97.8 ** 95.7** 100.0 ** 1.05 ** 99.5 99.2 99.8 1.01 … … … 11 50
97.9 100.9 94.7 0.94 88.2 ** 91.3** 85.0 ** 0.93 ** 87.0 89.3 84.5 0.95 2.2 2.4 2.1 29 69178.5 159.0 199.1 1.25 94.8 94.7 94.9 1.00 95.2 93.8 96.6 1.03 … … …
94.2 94.2 94.1 1.00 88.3 … … … 88.4 87.7 89.0 1.01 … … … 423 66
12.5z 24.0z – z – z … … … … … … … … … … … . .47.5 45.0 50.2 1.12 39.4 40.3 38.5 0.95 44.5 42.1 46.9 1.11 5.4 5.8 5.1 23 42… … … … … … … … … … … … 10.7 z 9.2 z 12.6 z 4 ** 35 **52.8 58.5 46.7 0.80 … … … … … … … … 4.8 5.2 4.3 522** 2577.9 80.2 75.4 0.94 … … … … … … … … 7.1 y 9.8 y 4.1 y 881 16 **66.7 62.2 71.3 1.15 … … … … 51.4** 47.9** 54.9 ** 1.15** … … … 0.2 z …
45.0 50.4 39.2 0.78 … … … … … … … … 11.7 ** 10.8 ** 12.9 ** . .22.5 26.2 18.6 0.71 … … … … … … … … … … … 924 *,y 45 *,y
86.5** 84.2** 88.9** 1.06** … … … … … … … … … … … . .
19.1z 21.4z 16.8z 0.78 z … … … … … … … … … … … . .27.6 37.9 17.4 0.46 15.7 ** 21.5** 9.9 ** 0.46 ** 20.1**,y 27.2**,y 12.9 **,y 0.48**,y 23.1 22.8 23.8 … …
72.7** 70.5** 74.9** 1.06** 52.7 ** 48.2** 57.4 ** 1.19 ** 53.6** 49.9** 57.4 ** 1.15** 0.5 ** 0.1 ** 0.9 ** 14 z 49 z
11.5 13.8 9.2 0.67 8.3 10.5 6.1 0.58 9.0 10.8 7.2 0.67 27.6 26.5 29.2 . .
Repeaters in secondarygeneral education (%) Total enrolment
(F/M)
2002/2003
MaleTotal Female GPI(F/M)
1998/1999
MaleTotal Female GPI(F/M)
2002/2003 2002/2003 2002/2003
MaleTotal Female MaleTotal Female Total(000)
% FGPI
GROSS ENROLMENT RATIO(GER) IN SECONDARY
EDUCATION (%)NET ENROLMENT RATIO (NER) IN SECONDARY EDUCATION (%)
INTERNALEFFICIENCY
POST-SECONDARYNON-TERTIARY
EDUCATION
110111112113114115116117118119120121122123
124125126127128129130131132133134135136137138139140141142143144145146147148149
150151152153154155156157158
159160161162
North America and Western Europe
South and West Asia
Sub-Saharan Africa
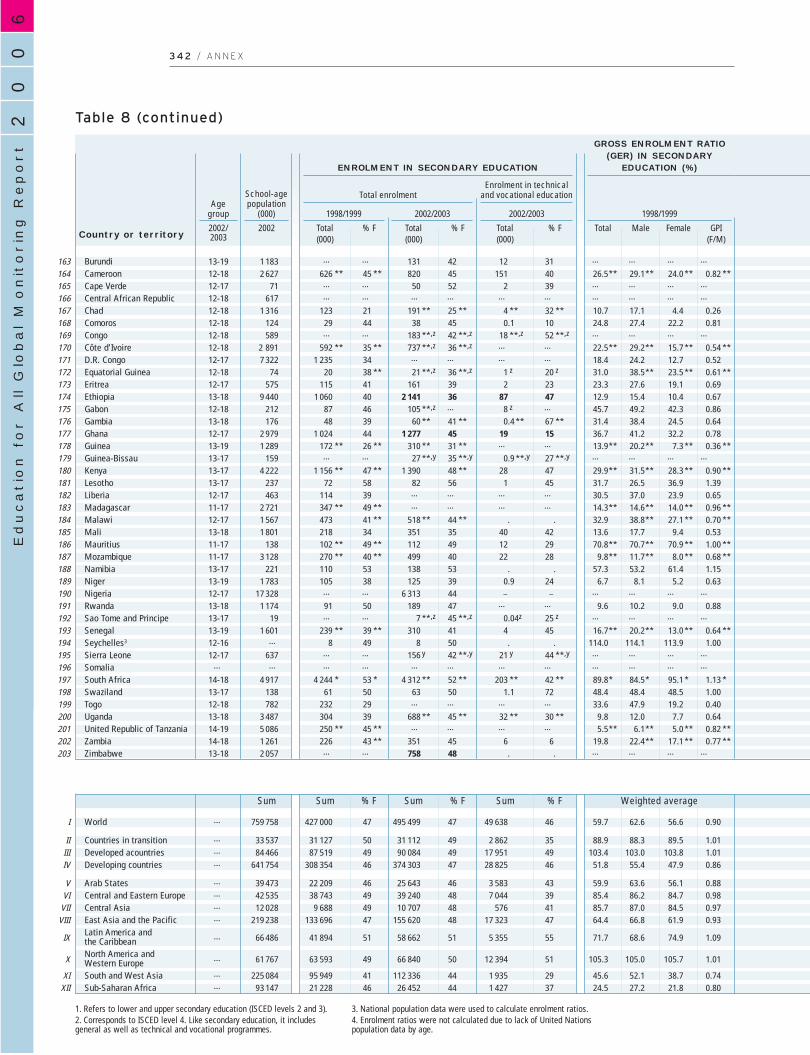
60
02
Education f
or A
ll G
lobal M
onitorin
g R
eport
3 4 2 / A N N E X
Table 8 (continued)
13-19 1 183 … … 131 42 12 31 … … … …
12-18 2 627 626 ** 45 ** 820 45 151 40 26.5** 29.1** 24.0 ** 0.82 **12-17 71 … … 50 52 2 39 … … … …
12-18 617 … … … … … … … … … …
12-18 1 316 123 21 191 ** 25 ** 4 ** 32 ** 10.7 17.1 4.4 0.2612-18 124 29 44 38 45 0.1 10 24.8 27.4 22.2 0.8112-18 589 … … 183 **,z 42 **,z 18 **,z 52 **,z … … … …
12-18 2 891 592 ** 35 ** 737 **,z 36 **,z … … 22.5** 29.2** 15.7 ** 0.54 **12-17 7 322 1 235 34 … … … … 18.4 24.2 12.7 0.5212-18 74 20 38 ** 21 **,z 36 **,z 1 z 20 z 31.0 38.5** 23.5 ** 0.61 **12-17 575 115 41 161 39 2 23 23.3 27.6 19.1 0.6913-18 9 440 1 060 40 2 141 36 87 47 12.9 15.4 10.4 0.6712-18 212 87 46 105 **,z … 8 z … 45.7 49.2 42.3 0.8613-18 176 48 39 60 ** 41 ** 0.4 ** 67 ** 31.4 38.4 24.5 0.6412-17 2 979 1 024 44 1 277 45 19 15 36.7 41.2 32.2 0.7813-19 1 289 172 ** 26 ** 310 ** 31 ** … … 13.9** 20.2** 7.3 ** 0.36 **13-17 159 … … 27 **,y 35 **,y 0.9 **,y 27 **,y … … … …
13-17 4 222 1 156 ** 47 ** 1 390 48 ** 28 47 29.9** 31.5** 28.3 ** 0.90 **13-17 237 72 58 82 56 1 45 31.7 26.5 36.9 1.3912-17 463 114 39 … … … … 30.5 37.0 23.9 0.6511-17 2 721 347 ** 49 ** … … … … 14.3** 14.6** 14.0 ** 0.96 **12-17 1 567 473 41 ** 518 ** 44 ** . . 32.9 38.8** 27.1 ** 0.70 **13-18 1 801 218 34 351 35 40 42 13.6 17.7 9.4 0.5311-17 138 102 ** 49 ** 112 49 12 29 70.8** 70.7** 70.9 ** 1.00 **11-17 3 128 270 ** 40 ** 499 40 22 28 9.8** 11.7** 8.0 ** 0.68 **13-17 221 110 53 138 53 . . 57.3 53.2 61.4 1.1513-19 1 783 105 38 125 39 0.9 24 6.7 8.1 5.2 0.6312-17 17 328 … … 6 313 44 – – … … … …
13-18 1 174 91 50 189 47 … … 9.6 10.2 9.0 0.8813-17 19 … … 7 **,z 45 **,z 0.04z 25 z … … … …
13-19 1 601 239 ** 39 ** 310 41 4 45 16.7** 20.2** 13.0 ** 0.64 **12-16 … 8 49 8 50 . . 114.0 114.1 113.9 1.0012-17 637 … … 156 y 42 **,y 21 y 44 **,y … … … …
… … … … … … … … … … … …
14-18 4 917 4 244 * 53 * 4 312 ** 52 ** 203 ** 42 ** 89.8* 84.5* 95.1 * 1.13 *13-17 138 61 50 63 50 1.1 72 48.4 48.4 48.5 1.0012-18 782 232 29 … … … … 33.6 47.9 19.2 0.4013-18 3 487 304 39 688 ** 45 ** 32 ** 30 ** 9.8 12.0 7.7 0.6414-19 5 086 250 ** 45 ** … … … … 5.5** 6.1** 5.0 ** 0.82 **14-18 1 261 226 43 ** 351 45 6 6 19.8 22.4** 17.1 ** 0.77 **13-18 2 057 … … 758 48 . . … … … …
… 759 758 427 000 47 495 499 47 49 638 46 59.7 62.6 56.6 0.90
… 33 537 31 127 50 31 112 49 2 862 35 88.9 88.3 89.5 1.01… 84 466 87 519 49 90 084 49 17 951 49 103.4 103.0 103.8 1.01… 641 754 308 354 46 374 303 47 28 825 46 51.8 55.4 47.9 0.86
… 39 473 22 209 46 25 643 46 3 583 43 59.9 63.6 56.1 0.88… 42 535 38 743 49 39 240 48 7 044 39 85.4 86.2 84.7 0.98… 12 028 9 688 49 10 707 48 576 41 85.7 87.0 84.5 0.97… 219 238 133 696 47 155 620 48 17 323 47 64.4 66.8 61.9 0.93
… 66 486 41 894 51 58 662 51 5 355 55 71.7 68.6 74.9 1.09
… 61 767 63 593 49 66 840 50 12 394 51 105.3 105.0 105.7 1.01
… 225 084 95 949 41 112 336 44 1 935 29 45.6 52.1 38.7 0.74… 93 147 21 228 46 26 452 44 1 427 37 24.5 27.2 21.8 0.80
BurundiCameroonCape VerdeCentral African RepublicChadComorosCongoCôte d’IvoireD.R. CongoEquatorial GuineaEritreaEthiopiaGabonGambiaGhanaGuineaGuinea-BissauKenyaLesothoLiberiaMadagascarMalawiMaliMauritiusMozambiqueNamibiaNigerNigeriaRwandaSao Tome and PrincipeSenegalSeychelles3
Sierra LeoneSomaliaSouth AfricaSwazilandTogoUgandaUnited Republic of TanzaniaZambiaZimbabwe
World
Countries in transitionDeveloped acountriesDeveloping countries
Arab StatesCentral and Eastern EuropeCentral AsiaEast Asia and the PacificLatin America and the CaribbeanNorth America and Western EuropeSouth and West AsiaSub-Saharan Africa
ENROLMENT IN SECONDARY EDUCATION
Total enrolment Enrolment in technical
and vocational education
1998/1999Age
group
School-agepopulation
(000) 2002/2003 2002/2003
Country or territory (F/M)20022002/ % F Total
(000)Total(000)
% FTotal(000)
1998/1999
MaleTotal Female% F GPI
GROSS ENROLMENT RATIO(GER) IN SECONDARY
EDUCATION (%)
163164165166167168169170171172173174175176177178179180181182183184185186187188189190191192193194195196197198199200201202203
I
IIIIIIV
VVI
VIIVIII
IX
X
XIXII
1. Refers to lower and upper secondary education (ISCED levels 2 and 3).2. Corresponds to ISCED level 4. Like secondary education, it includesgeneral as well as technical and vocational programmes.
3. National population data were used to calculate enrolment ratios.4. Enrolment ratios were not calculated due to lack of United Nationspopulation data by age.
Sum Sum % F Sum Sum% F % F Weighted average
2003
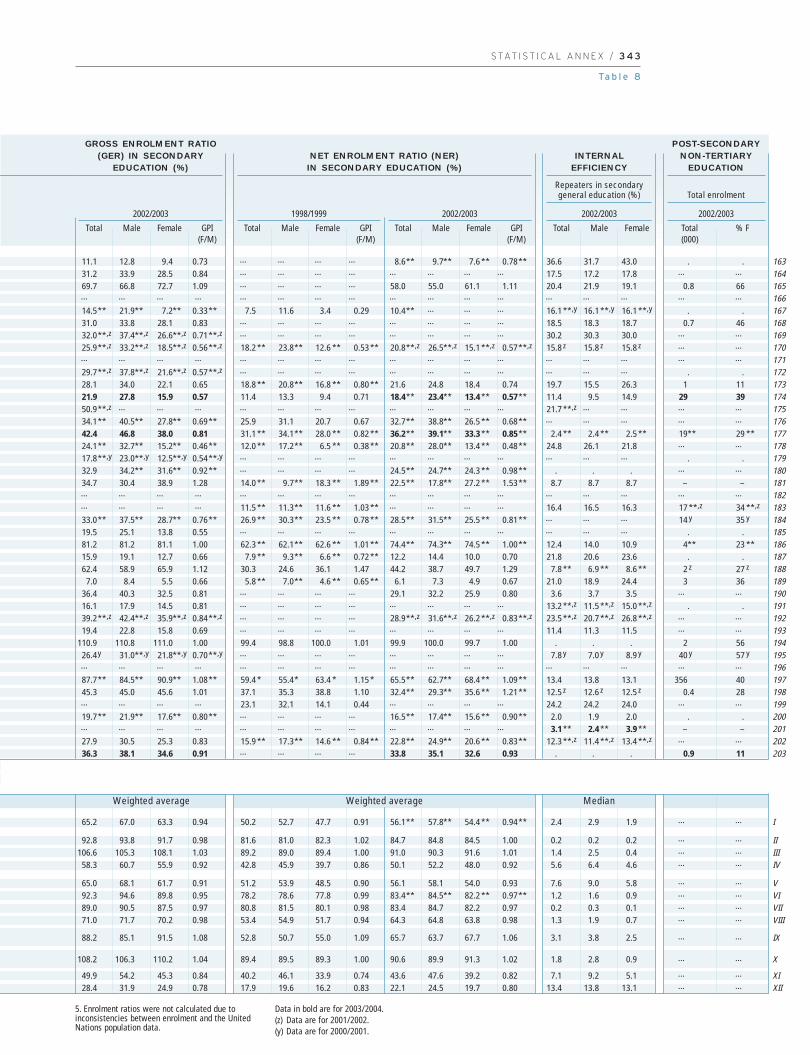
S TAT I S T I C A L A N N E X / 3 4 3
Ta b l e 8
11.1 12.8 9.4 0.73 … … … … 8.6** 9.7** 7.6 ** 0.78** 36.6 31.7 43.0 . .31.2 33.9 28.5 0.84 … … … … … … … … 17.5 17.2 17.8 … …
69.7 66.8 72.7 1.09 … … … … 58.0 55.0 61.1 1.11 20.4 21.9 19.1 0.8 66… … … … … … … … … … … … … … … … …
14.5** 21.9** 7.2** 0.33** 7.5 11.6 3.4 0.29 10.4** … … … 16.1 **,y 16.1 **,y 16.1 **,y . .31.0 33.8 28.1 0.83 … … … … … … … … 18.5 18.3 18.7 0.7 4632.0**,z 37.4**,z 26.6**,z 0.71**,z … … … … … … … … 30.2 30.3 30.0 … …
25.9**,z 33.2**,z 18.5**,z 0.56**,z 18.2 ** 23.8** 12.6 ** 0.53 ** 20.8**,z 26.5**,z 15.1 **,z 0.57**,z 15.8 z 15.8 z 15.8 z … …… … … … … … … … … … … … … … … … …
29.7**,z 37.8**,z 21.6**,z 0.57**,z … … … … … … … … … … … . .28.1 34.0 22.1 0.65 18.8 ** 20.8** 16.8 ** 0.80 ** 21.6 24.8 18.4 0.74 19.7 15.5 26.3 1 1121.9 27.8 15.9 0.57 11.4 13.3 9.4 0.71 18.4** 23.4** 13.4 ** 0.57** 11.4 9.5 14.9 29 3950.9**,z … … … … … … … … … … … 21.7 **,z … … … …
34.1** 40.5** 27.8** 0.69** 25.9 31.1 20.7 0.67 32.7** 38.8** 26.5 ** 0.68** … … … … …
42.4 46.8 38.0 0.81 31.1 ** 34.1** 28.0 ** 0.82 ** 36.2** 39.1** 33.3 ** 0.85** 2.4 ** 2.4 ** 2.5 ** 19** 29 **24.1** 32.7** 15.2** 0.46** 12.0 ** 17.2** 6.5 ** 0.38 ** 20.8** 28.0** 13.4 ** 0.48** 24.8 26.1 21.8 … …
17.8**,y 23.0**,y 12.5**,y 0.54**,y … … … … … … … … … … … . .32.9 34.2** 31.6** 0.92** … … … … 24.5** 24.7** 24.3 ** 0.98** . . . … …
34.7 30.4 38.9 1.28 14.0 ** 9.7** 18.3 ** 1.89 ** 22.5** 17.8** 27.2 ** 1.53** 8.7 8.7 8.7 – –… … … … … … … … … … … … … … … … …… … … … 11.5 ** 11.3** 11.6 ** 1.03 ** … … … … 16.4 16.5 16.3 17 **,z 34 **,z
33.0** 37.5** 28.7** 0.76** 26.9 ** 30.3** 23.5 ** 0.78 ** 28.5** 31.5** 25.5 ** 0.81** … … … 14 y 35 y
19.5 25.1 13.8 0.55 … … … … … … … … … … … . .81.2 81.2 81.1 1.00 62.3 ** 62.1** 62.6 ** 1.01 ** 74.4** 74.3** 74.5 ** 1.00** 12.4 14.0 10.9 4** 23 **15.9 19.1 12.7 0.66 7.9 ** 9.3** 6.6 ** 0.72 ** 12.2 14.4 10.0 0.70 21.8 20.6 23.6 . .62.4 58.9 65.9 1.12 30.3 24.6 36.1 1.47 44.2 38.7 49.7 1.29 7.8 ** 6.9 ** 8.6 ** 2 z 27 z
7.0 8.4 5.5 0.66 5.8 ** 7.0** 4.6 ** 0.65 ** 6.1 7.3 4.9 0.67 21.0 18.9 24.4 3 3636.4 40.3 32.5 0.81 … … … … 29.1 32.2 25.9 0.80 3.6 3.7 3.5 … …
16.1 17.9 14.5 0.81 … … … … … … … … 13.2 **,z 11.5 **,z 15.0 **,z . .39.2**,z 42.4**,z 35.9**,z 0.84**,z … … … … 28.9**,z 31.6**,z 26.2 **,z 0.83**,z 23.5 **,z 20.7 **,z 26.8 **,z … …
19.4 22.8 15.8 0.69 … … … … … … … … 11.4 11.3 11.5 … …
110.9 110.8 111.0 1.00 99.4 98.8 100.0 1.01 99.9 100.0 99.7 1.00 . . . 2 5626.4y 31.0**,y 21.8**,y 0.70**,y … … … … … … … … 7.8 y 7.0 y 8.9 y 40 y 57 y
… … … … … … … … … … … … … … … … …
87.7** 84.5** 90.9** 1.08** 59.4 * 55.4* 63.4 * 1.15 * 65.5** 62.7** 68.4 ** 1.09** 13.4 13.8 13.1 356 4045.3 45.0 45.6 1.01 37.1 35.3 38.8 1.10 32.4** 29.3** 35.6 ** 1.21** 12.5 z 12.6 z 12.5 z 0.4 28… … … … 23.1 32.1 14.1 0.44 … … … … 24.2 24.2 24.0 … …
19.7** 21.9** 17.6** 0.80** … … … … 16.5** 17.4** 15.6 ** 0.90** 2.0 1.9 2.0 . .… … … … … … … … … … … … 3.1 ** 2.4 ** 3.9 ** – –27.9 30.5 25.3 0.83 15.9 ** 17.3** 14.6 ** 0.84 ** 22.8** 24.9** 20.6 ** 0.83** 12.3 **,z 11.4 **,z 13.4 **,z … …
36.3 38.1 34.6 0.91 … … … … 33.8 35.1 32.6 0.93 . . . 0.9 11
65.2 67.0 63.3 0.94 50.2 52.7 47.7 0.91 56.1** 57.8** 54.4 ** 0.94** 2.4 2.9 1.9 … …
92.8 93.8 91.7 0.98 81.6 81.0 82.3 1.02 84.7 84.8 84.5 1.00 0.2 0.2 0.2 … …
106.6 105.3 108.1 1.03 89.2 89.0 89.4 1.00 91.0 90.3 91.6 1.01 1.4 2.5 0.4 … …
58.3 60.7 55.9 0.92 42.8 45.9 39.7 0.86 50.1 52.2 48.0 0.92 5.6 6.4 4.6 … …
65.0 68.1 61.7 0.91 51.2 53.9 48.5 0.90 56.1 58.1 54.0 0.93 7.6 9.0 5.8 … …
92.3 94.6 89.8 0.95 78.2 78.6 77.8 0.99 83.4** 84.5** 82.2 ** 0.97** 1.2 1.6 0.9 … …
89.0 90.5 87.5 0.97 80.8 81.5 80.1 0.98 83.4 84.7 82.2 0.97 0.2 0.3 0.1 … …
71.0 71.7 70.2 0.98 53.4 54.9 51.7 0.94 64.3 64.8 63.8 0.98 1.3 1.9 0.7 … …
88.2 85.1 91.5 1.08 52.8 50.7 55.0 1.09 65.7 63.7 67.7 1.06 3.1 3.8 2.5 … …
108.2 106.3 110.2 1.04 89.4 89.5 89.3 1.00 90.6 89.9 91.3 1.02 1.8 2.8 0.9 … …
49.9 54.2 45.3 0.84 40.2 46.1 33.9 0.74 43.6 47.6 39.2 0.82 7.1 9.2 5.1 … …
28.4 31.9 24.9 0.78 17.9 19.6 16.2 0.83 22.1 24.5 19.7 0.80 13.4 13.8 13.1 … …
Repeaters in secondarygeneral education (%) Total enrolment
(F/M)
2002/2003
MaleTotal Female GPI(F/M)
1998/1999
MaleTotal Female GPI(F/M)
2002/2003 2002/2003 2002/2003
MaleTotal Female MaleTotal Female Total(000)
% FGPI
GROSS ENROLMENT RATIO(GER) IN SECONDARY
EDUCATION (%)NET ENROLMENT RATIO (NER) IN SECONDARY EDUCATION (%)
INTERNALEFFICIENCY
POST-SECONDARYNON-TERTIARY
EDUCATION
163164165166167168169170171172173174175176177178179180181182183184185186187188189190191192193194195196197198199200201202203
I
IIIIIIV
VVIVIIVIII
IX
X
XIXII
5. Enrolment ratios were not calculated due toinconsistencies between enrolment and the UnitedNations population data.
Data in bold are for 2003/2004.(z) Data are for 2001/2002.(y) Data are for 2000/2001.
Weighted average MedianWeighted average

60
02
Education f
or A
ll G
lobal M
onitorin
g R
eport
3 4 4 / A N N E X
Table 9AParticipation in tertiary education
456 ** … … 683 ** … … 15.1 ** … … …
11 4 ** 7 ** 19 7 12 20.7 15.0 ** 27.8 ** 1.86 **0.2 … … 1.1 0.6 0.5 0.3 … … …
2 447 ** … … 2 154 … … 38.3 ** … … …
272 179 93 318 **,z 210 **,z 108 **,z 12.9 16.7 9.1 0.54… … … 186 91 95 … … … …
32 ** 10 ** 22 ** … … … 20.9 ** 12.2 ** 31.6 ** 2.58 **113 56 57 144 66 78 35.5 35.1 35.9 1.02308 158 ** 150 ** 375 ** 182 ** 193 ** 56.1 56.8 ** 55.4 ** 0.98 **
13 … … 9 ** 7 ** 2 ** 5.5 … … …
273 159 114 336 185 151 9.4 10.8 8.0 0.74… … … 20 **,z 8 **,z 12 **,z … … … …
66 36 30 105 53 52 24.8 26.2 23.3 0.899 ** 3 ** 6 ** 8 2 6 25.2 ** 11.7 ** 45.7 ** 3.89 **
350 150 199 525 219 306 20.2 16.8 23.8 1.41201 106 95 … … … 6.8 7.1 6.5 0.92… … … … … … … … … …
157 ** 81 ** 76 ** 263 119 145 17.3 ** 17.5 ** 17.0 ** 0.97 **40 ** 13 ** 27 ** 68 ** 23 ** 45 ** 19.7 ** 10.6 ** 34.0 ** 3.22 **
164 130 34 … … … 11.2 17.1 4.8 0.28
… … … 44 16 27 … … … …
353 155 198 489 210 279 48.4 41.6 55.4 1.33… … … … … … … … … …
270 109 161 231 109 122 43.5 34.5 52.9 1.5396 45 51 122 57 65 31.9 29.6 34.2 1.16
231 116 115 287 142 145 26.1 25.7 26.5 1.0349 21 28 64 24 39 51.0 42.3 60.0 1.42
279 128 151 390 169 221 33.4 29.9 37.1 1.2482 32 51 119 46 73 50.5 38.5 62.6 1.63
107 43 64 168 67 101 45.5 36.1 55.0 1.521 399 601 798 1 983 837 1 147 45.7 38.5 53.1 1.38
104 46 58 114 50 64 29.4 25.8 33.1 1.28408 200 208 644 294 350 21.3 20.4 22.1 1.08… … … 8 151 ** 3 572 ** 4 579 ** … … … …
197 92 106 209 y 97 y 112 y 34.0 31.1 37.0 1.19123 59 64 158 74 84 26.5 25.2 27.9 1.11
79 35 44 101 44 57 52.8 45.3 60.7 1.3435 16 19 46 20 26 22.0 19.3 24.7 1.28… … … 1 918 1 108 811 … … … …
1 737 821 916 2 296 1 061 * 1 235 * 47.3 44.1 50.5 1.15
… … … 79 35 44 … … … …
108 66 42 121 67 54 16.2 20.0 12.4 0.62130 63 68 155 80 76 32.2 30.4 34.1 1.12324 151 173 603 261 342 23.7 22.0 25.5 1.16131 65 67 201 92 109 30.4 29.8 30.9 1.04
65 23 42 98 37 61 26.1 18.1 34.1 1.8876 57 19 97 73 24 13.8 20.3 7.1 0.35… … … … … … … … … …… … … 394 221 173 … … … …
869 399 470 1 012 466 547 63.9 57.4 70.7 1.233 1 2 4.4 1.6 2.8 9.4 6.5 12.4 1.90
… … … 43 31 ** 12 ** … … … …
AlgeriaBahrainDjiboutiEgyptIraqJordanKuwaitLebanonLibyan Arab JamahiriyaMauritaniaMoroccoOmanPalestinian Autonomous TerritoriesQatarSaudi ArabiaSudanSyrian Arab RepublicTunisiaUnited Arab EmiratesYemen
AlbaniaBelarusBosnia and HerzegovinaBulgariaCroatiaCzech RepublicEstoniaHungaryLatviaLithuaniaPolandRepublic of MoldovaRomaniaRussian FederationSerbia and Montenegro2
SlovakiaSloveniaThe former Yugoslav Rep. of MacedoniaTurkeyUkraine
ArmeniaAzerbaijanGeorgiaKazakhstanKyrgyzstanMongoliaTajikistanTurkmenistanUzbekistan
AustraliaBrunei DarussalamCambodia
ENROLMENT IN TERTIARY EDUCATION
Total students enrolled(000)
Gross enrolment ratio (GER)(%)
1998/1999 2002/2003
Country or territoryMale Female
(F/M)Total Male FemaleTotal
1998/1999
Male FemaleTotal GPI
123456789
1011121314151617181920
2122232425262728293031323334353637383940
414243444546474849
505152
Arab States
Central and Eastern Europe
Central Asia
East Asia and the Pacific
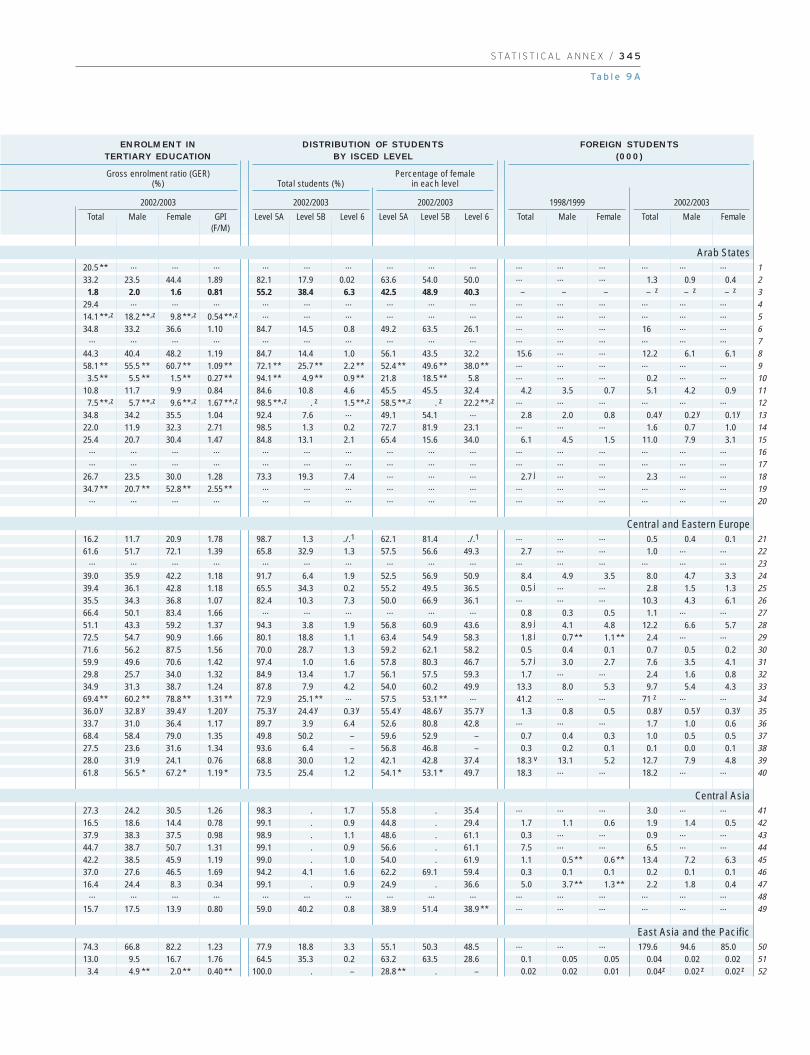
S TAT I S T I C A L A N N E X / 3 4 5
Ta b l e 9 A
20.5 ** … … … … … … … … … … … … … … …
33.2 23.5 44.4 1.89 82.1 17.9 0.02 63.6 54.0 50.0 … … … 1.3 0.9 0.41.8 2.0 1.6 0.81 55.2 38.4 6.3 42.5 48.9 40.3 – – – – z – z – z
29.4 … … … … … … … … … … … … … … …
14.1 **,z 18.2 **,z 9.8 **,z 0.54 **,z … … … … … … … … … … … …
34.8 33.2 36.6 1.10 84.7 14.5 0.8 49.2 63.5 26.1 … … … 16 … …… … … … … … … … … … … … … … … …
44.3 40.4 48.2 1.19 84.7 14.4 1.0 56.1 43.5 32.2 15.6 … … 12.2 6.1 6.158.1 ** 55.5 ** 60.7 ** 1.09 ** 72.1 ** 25.7 ** 2.2 ** 52.4 ** 49.6 ** 38.0 ** … … … … … …
3.5 ** 5.5 ** 1.5 ** 0.27 ** 94.1 ** 4.9 ** 0.9 ** 21.8 18.5 ** 5.8 … … … 0.2 … …
10.8 11.7 9.9 0.84 84.6 10.8 4.6 45.5 45.5 32.4 4.2 3.5 0.7 5.1 4.2 0.97.5 **,z 5.7 **,z 9.6 **,z 1.67 **,z 98.5 **,z . z 1.5 **,z 58.5 **,z . z 22.2 **,z … … … … … …
34.8 34.2 35.5 1.04 92.4 7.6 … 49.1 54.1 … 2.8 2.0 0.8 0.4 y 0.2 y 0.1y
22.0 11.9 32.3 2.71 98.5 1.3 0.2 72.7 81.9 23.1 … … … 1.6 0.7 1.025.4 20.7 30.4 1.47 84.8 13.1 2.1 65.4 15.6 34.0 6.1 4.5 1.5 11.0 7.9 3.1
… … … … … … … … … … … … … … … …… … … … … … … … … … … … … … … …
26.7 23.5 30.0 1.28 73.3 19.3 7.4 … … … 2.7 j … … 2.3 … …
34.7 ** 20.7 ** 52.8 ** 2.55 ** … … … … … … … … … … … …… … … … … … … … … … … … … … … …
16.2 11.7 20.9 1.78 98.7 1.3 ./.1 62.1 81.4 ./.1 … … … 0.5 0.4 0.161.6 51.7 72.1 1.39 65.8 32.9 1.3 57.5 56.6 49.3 2.7 … … 1.0 … …
… … … … … … … … … … … … … … … …
39.0 35.9 42.2 1.18 91.7 6.4 1.9 52.5 56.9 50.9 8.4 4.9 3.5 8.0 4.7 3.339.4 36.1 42.8 1.18 65.5 34.3 0.2 55.2 49.5 36.5 0.5 j … … 2.8 1.5 1.335.5 34.3 36.8 1.07 82.4 10.3 7.3 50.0 66.9 36.1 … … … 10.3 4.3 6.166.4 50.1 83.4 1.66 … … … … … … 0.8 0.3 0.5 1.1 … …
51.1 43.3 59.2 1.37 94.3 3.8 1.9 56.8 60.9 43.6 8.9 j 4.1 4.8 12.2 6.6 5.772.5 54.7 90.9 1.66 80.1 18.8 1.1 63.4 54.9 58.3 1.8 j 0.7 ** 1.1 ** 2.4 … …
71.6 56.2 87.5 1.56 70.0 28.7 1.3 59.2 62.1 58.2 0.5 0.4 0.1 0.7 0.5 0.259.9 49.6 70.6 1.42 97.4 1.0 1.6 57.8 80.3 46.7 5.7 j 3.0 2.7 7.6 3.5 4.129.8 25.7 34.0 1.32 84.9 13.4 1.7 56.1 57.5 59.3 1.7 … … 2.4 1.6 0.834.9 31.3 38.7 1.24 87.8 7.9 4.2 54.0 60.2 49.9 13.3 8.0 5.3 9.7 5.4 4.369.4 ** 60.2 ** 78.8 ** 1.31 ** 72.9 25.1 ** … 57.5 53.1 ** … 41.2 … … 71 z … …
36.0 y 32.8 y 39.4 y 1.20 y 75.3 y 24.4 y 0.3 y 55.4 y 48.6 y 35.7 y 1.3 0.8 0.5 0.8 y 0.5 y 0.3y
33.7 31.0 36.4 1.17 89.7 3.9 6.4 52.6 80.8 42.8 … … … 1.7 1.0 0.668.4 58.4 79.0 1.35 49.8 50.2 – 59.6 52.9 – 0.7 0.4 0.3 1.0 0.5 0.527.5 23.6 31.6 1.34 93.6 6.4 – 56.8 46.8 – 0.3 0.2 0.1 0.1 0.0 0.128.0 31.9 24.1 0.76 68.8 30.0 1.2 42.1 42.8 37.4 18.3 v 13.1 5.2 12.7 7.9 4.861.8 56.5 * 67.2 * 1.19 * 73.5 25.4 1.2 54.1 * 53.1 * 49.7 18.3 … … 18.2 … …
27.3 24.2 30.5 1.26 98.3 . 1.7 55.8 . 35.4 … … … 3.0 … …
16.5 18.6 14.4 0.78 99.1 . 0.9 44.8 . 29.4 1.7 1.1 0.6 1.9 1.4 0.537.9 38.3 37.5 0.98 98.9 . 1.1 48.6 . 61.1 0.3 … … 0.9 … …
44.7 38.7 50.7 1.31 99.1 . 0.9 56.6 . 61.1 7.5 … … 6.5 … …
42.2 38.5 45.9 1.19 99.0 . 1.0 54.0 . 61.9 1.1 0.5 ** 0.6 ** 13.4 7.2 6.337.0 27.6 46.5 1.69 94.2 4.1 1.6 62.2 69.1 59.4 0.3 0.1 0.1 0.2 0.1 0.116.4 24.4 8.3 0.34 99.1 . 0.9 24.9 . 36.6 5.0 3.7 ** 1.3 ** 2.2 1.8 0.4
… … … … … … … … … … … … … … … …
15.7 17.5 13.9 0.80 59.0 40.2 0.8 38.9 51.4 38.9 ** … … … … … …
74.3 66.8 82.2 1.23 77.9 18.8 3.3 55.1 50.3 48.5 … … … 179.6 94.6 85.013.0 9.5 16.7 1.76 64.5 35.3 0.2 63.2 63.5 28.6 0.1 0.05 0.05 0.04 0.02 0.02
3.4 4.9 ** 2.0 ** 0.40 ** 100.0 . – 28.8 ** . – 0.02 0.02 0.01 0.04z 0.02 z 0.02 z
FOREIGN STUDENTS(000)
DISTRIBUTION OF STUDENTSBY ISCED LEVEL
ENROLMENT INTERTIARY EDUCATION
Gross enrolment ratio (GER)(%)
(F/M)
2002/2003
Male FemaleTotal
Total students (%)
2002/2003
Level 5B Level 6Level 5A
Percentage of female in each level
2002/2003
Level 5B Level 6Level 5A
1998/1999 2002/2003
GPI Male FemaleTotal Male FemaleTotal
1234567891011121314151617181920
2122232425262728293031323334353637383940
414243444546474849
505152
Arab States
Central and Eastern Europe
Central Asia
East Asia and the Pacific

60
02
Education f
or A
ll G
lobal M
onitorin
g R
eport
3 4 6 / A N N E X
Table 9A (continued)
6 366 … … 15 186 8 529 6 657 6.2 … … …
. . . . . . . . . .… … … … … … … … … …… … … … … … … … … …… … … 3 441 1 930 1 511 … … … …
3 941 2 180 1 760 3 984 2 169 1 816 43.7 47.3 40.0 0.85… … … … … … … … … …
12 8 4 28 18 10 2.6 3.4 1.7 0.497 4 3 26 17 10 27.6 31.4 24.1 0.77
443 216 226 632 284 348 22.9 22.0 23.8 1.08… … … 0.9 z 0.4 z 0.5 z … … … …
2 … … … … … 15.3 … … …… … … 555 **,z … … … … … …
. . . . . . . . . .161 67 94 185 76 109 62.2 50.9 73.9 1.45
. . . . . . . . . .… … … 0.5 **,z 0.2 **,z 0.3 **,z … … … …
10 6 4 … … … 2.1 2.8 1.5 0.542 209 995 1 213 2 427 1 086 1 341 29.4 26.0 32.8 1.262 636 1 713 923 3 223 2 045 1 178 64.7 81.8 46.7 0.57
1.5 0.8 0.7 1.2 **,z 0.7 **,z 0.5 **,z 8.1 8.3 7.8 0.95… … … … … … … … … …
. . . . . . . . . .1 814 846 969 2 251 1 043 1 208 30.7 28.6 32.8 1.15
… … … 6 *,z 3 *,z 3 *,z … … … …… … … . . . … … … …… … … 0.4 **,z 0.2 **,z 0.2 **,z … … … …
. . . . . . . . . .… … … 0.7 z … … … … … …
810 462 348 797 ** 456 ** 341 ** 10.9 12.4 9.4 0.76
. . . . . . . . . .
. . . . . . . . . .1 527 632 ** 894 ** 2 027 825 1 202 46.9 38.5 ** 55.5 ** 1.44 **
1.4 0.6 0.8 1.7 0.7 1.0 26.3 24.5 28.0 1.14… … … … … … … … … …
7 2 5 8 y 2 y 6 y 32.0 19.6 44.6 2.28… … … 0.5 0.2 * 0.3 * … … … …… … … 2.0 **,z 0.9 **,z 1.1 **,z … … … …
228 148 ** 80 ** 311 … … 30.9 40.0 ** 21.8 ** 0.55 **2 204 992 1 211 3 579 1 558 2 021 13.6 12.3 15.0 1.22
. . . . . . . . . .0.4** 0.1 ** 0.3 ** 0.4 y 0.1 y 0.3 y … … … …
407 219 187 567 296 271 33.8 36.0 31.5 0.88823 ** 400 ** 423 ** 990 480 509 21.2 ** 20.4 ** 21.9 ** 1.07 **
58 ** 27 ** 30 ** 77 37 40 16.8 ** 15.5 ** 18.2 ** 1.18 **156 * 74 ** 82 ** 236 103 133 18.9 * 17.6 ** 20.4 ** 1.16 **
. . . . . . . . . .… … … 287 111 176 … … … …… … … … … … … … … …
118 53 65 113 52 62 18.3 16.4 20.2 1.23. . . . . . . . . .
… … … 112 64 48 … … … …… … … 5 2 ** 3 ** … … … …… … … … … … … … … …
78 35 ** 43 ** 97 **,z 42 **,z 54 **,z 13.5 11.9 ** 15.2 ** 1.27 **… … … 46 ** 14 ** 32 ** … … … …
1 838 950 888 2 237 1 126 1 110 18.3 19.2 17.4 0.91. . . . . . . . . .
ChinaCook IslandsDemocratic People’s Republic of KoreaFijiIndonesiaJapanKiribatiLao People’s Democratic RepublicMacao, ChinaMalaysiaMarshall Islands2
Micronesia (Federated States of)MyanmarNauruNew ZealandNiuePalau2
Papua New GuineaPhilippinesRepublic of KoreaSamoaSingaporeSolomon IslandsThailandTimor-LesteTokelauTongaTuvaluVanuatuViet Nam
AnguillaAntigua and BarbudaArgentinaAruba2
BahamasBarbadosBelizeBermuda2
BoliviaBrazilBritish Virgin IslandsCayman Islands3
ChileColombiaCosta RicaCubaDominicaDominican RepublicEcuadorEl SalvadorGrenadaGuatemalaGuyanaHaitiHondurasJamaicaMexicoMontserrat
ENROLMENT IN TERTIARY EDUCATION
Total students enrolled(000)
Gross enrolment ratio (GER)(%)
1998/1999 2002/2003
Country or territoryMale Female
(F/M)Total Male FemaleTotal
1998/1999
Male FemaleTotal GPI
535455565758596061626364656667686970717273747576777879808182
8384858687888990919293949596979899
100101102103104105106107108109110
Latin America and the Caribbean

S TAT I S T I C A L A N N E X / 3 4 7
Ta b l e 9 A
15.8 17.1 14.4 0.84 50.8 48.5 0.7 44.0 44.0 28.1 … … … … … …
. . . . . . . . . . . . . . . .… … … … … … … … … … … … … … … …… … … … … … … … … … … … … … … …
16.4 18.2 14.5 0.80 72.4 25.9 1.7 42.4 48.8 34.7 0.3 … … 0.4 z … …
50.7 53.9 47.4 0.88 73.8 24.5 1.7 39.7 64.4 27.9 56.6 32.0 24.5 87 45 42… … … … … … … … … … … … … … … …
5.3 6.7 3.8 0.57 32.6 67.4 . 38.4 34.5 . 0.08 0.07 0.01 0.10 0.09 0.0180.8 107.5 56.4 0.52 88.2 11.2 0.6 33.1 64.0 30.5 … … … 17.5 13.0 4.529.3 25.7 33.0 1.28 48.8 50.5 0.7 58.1 52.5 34.0 3.1 j … … 28 … …
18.1 z 15.8 z 20.4 z 1.29 z 13.6 z 86.4 z . 56.9 z 56.4 z . … … … … … …… … … … … … … … … … … … … … … …
11.5 **,z … … … 99.3 **,z 0.5 **,z 0.2 **,z … … … … … … … … …
. . . . . . . . . . . . . . . .73.9 58.8 90.1 1.53 72.5 25.5 2.0 58.7 59.8 48.7 … … … 17.7 8.8 8.9
. . . . . . . . . . . . . . . .39.3 **,z 26.5 **,z 54.4 **,z 2.05 **,z 100.0 **,z . . 63.4 **,z . . … … … 0.01y … …
… … … … … … … … … … 0.3 0.2 0.1 … … …
30.0 26.4 33.8 1.28 90.1 9.4 0.4 55.4 53.3 61.8 3.5 … … 4.7 … …
85.4 105.1 64.5 0.61 58.8 40.0 1.1 36.9 36.2 29.5 … … … 8 4 46.5 **,z 6.8 **,z 6.2 **,z 0.90 **,z 19.6 **,z 80.4 **,z – **,z 39.8 **,z 45.5 **,z – **,z 0.1 0.08 0.03 0.1 y … …… … … … … … … … … … … … … … … …
. . . . . . . . . . . . . . . .38.8 35.8 41.8 1.17 82.6 17.0 0.3 54.3 50.4 62.2 1.9 j … … 4.1j,q,z … …
12.0 *,z 9.7 *,z 15.3 *,z 1.58 *,z … … … … … … … … … … … …
. . . . . . . . . . . . . . . .3.6 **,z 3.0 **,z 4.2 **,z 1.40 **,z … … … … … … … … … … … …
. . . . … … … … … … . . . . . .4.0 z … … … 98.8 z . 1.2 z … … … … … … … … …
10.0 ** 11.4 ** 8.6 ** 0.76 ** 69.6 ** 27.7 ** 2.7 ** 51.7 ** 21.1 ** 36.7 ** 0.5 0.4 0.1 0.9 z 0.7 z 0.2z
. . . . . . . . . . . . . . . .
. . . . . . . . . . . . . . . .59.8 48.1 71.7 1.49 74.0 25.7 0.3 55.6 70.0 57.3 2.8 l … … 3 … …
30.3 25.0 35.4 1.42 22.8 77.2 . 79.0 53.5 . … … … 0.09 0.08 ** 0.01**… … … … … … … … … … … … … … … …
38.1 y 22.1 y 54.6 y 2.47 y 49.4 y 45.0 y 5.6 **,y 66.1 y 77.3 y 57.8 **,y … … … 0.6 y 0.2 **,y 0.4**,y
2.0 1.4 * 2.6 * 1.91 * 100.0 . . 64.9 * . . . . . . . .62.4 **,z … … … . 100.0 **,z . … 55.1 **,z … … … … … … …
39.4 … … … … … … … … … 1.1 … … … … …
20.6 17.8 23.4 1.32 … … 2.8 … … 55.4 … … … … … …
. . . . . . . . . . . . . . . .… … … … 79.5 y 20.5 y . 71.6 y 86.3 y . … … … 0.1 y … …
45.4 46.7 44.1 0.94 83.0 16.7 0.3 48.2 46.2 39.9 … … … 5 … …
24.3 23.4 25.4 1.09 74.8 ** 19.2 6.0 ** 53.0 ** 46.1 49.2 ** … … … … … …
19.4 18.0 20.8 1.16 85.2 14.6 0.1 54.0 42.6 53.1 … … … 0.9 0.4 ** 0.533.7 28.9 38.7 1.34 98.9 . 1.1 56.4 . 36.6 3.7 hf … … 17.2 … …
. . . . . . . . . . . . . . . .34.5 26.0 43.4 1.67 91.0 8.4 0.6 64.8 25.1 39.5 … … … … … …
… … … … … … … … … … … … … … … …
17.4 15.8 19.1 1.21 … … … … … … 0.6 … … 0.5 0.2 0.3. . . . . . . . . . . . . . . .
9.3 10.5 8.2 0.78 95.4 4.6 . 41.9 66.1 . … … … … … …
6.1 4.7 ** 7.5 ** 1.58 ** 90.3 9.7 – 61.8 ** 53.0 ** – … … … … … …… … … … … … … … … … … … … … … …
15.2 **,z 13.2 **,z 17.3 **,z 1.31 **,z 93.2 **,z 5.1 **,z 1.7 **,z 56.2 **,z 58.7 **,z 41.0 **,z … … … … … …
17.5 ** 10.4 ** 24.6 ** 2.36 ** 36.5 ** 56.2 ** 7.2 ** 72.7 ** 68.0 ** 71.1 ** 0.6 … … … … …
22.4 22.8 22.1 0.97 96.6 2.9 0.5 50.0 40.7 39.2 2.3 … … 1.9 z … …
. . . . . . . . . . . . . . . .
FOREIGN STUDENTS(000)
DISTRIBUTION OF STUDENTSBY ISCED LEVEL
ENROLMENT INTERTIARY EDUCATION
Gross enrolment ratio (GER)(%)
(F/M)
2002/2003
Male FemaleTotal
Total students (%)
2002/2003
Level 5B Level 6Level 5A
Percentage of female in each level
2002/2003
Level 5B Level 6Level 5A
1998/1999 2002/2003
GPI Male FemaleTotal Male FemaleTotal
535455565758596061626364656667686970717273747576777879808182
8384858687888990919293949596979899100101102103104105106107108109110
Latin America and the Caribbean
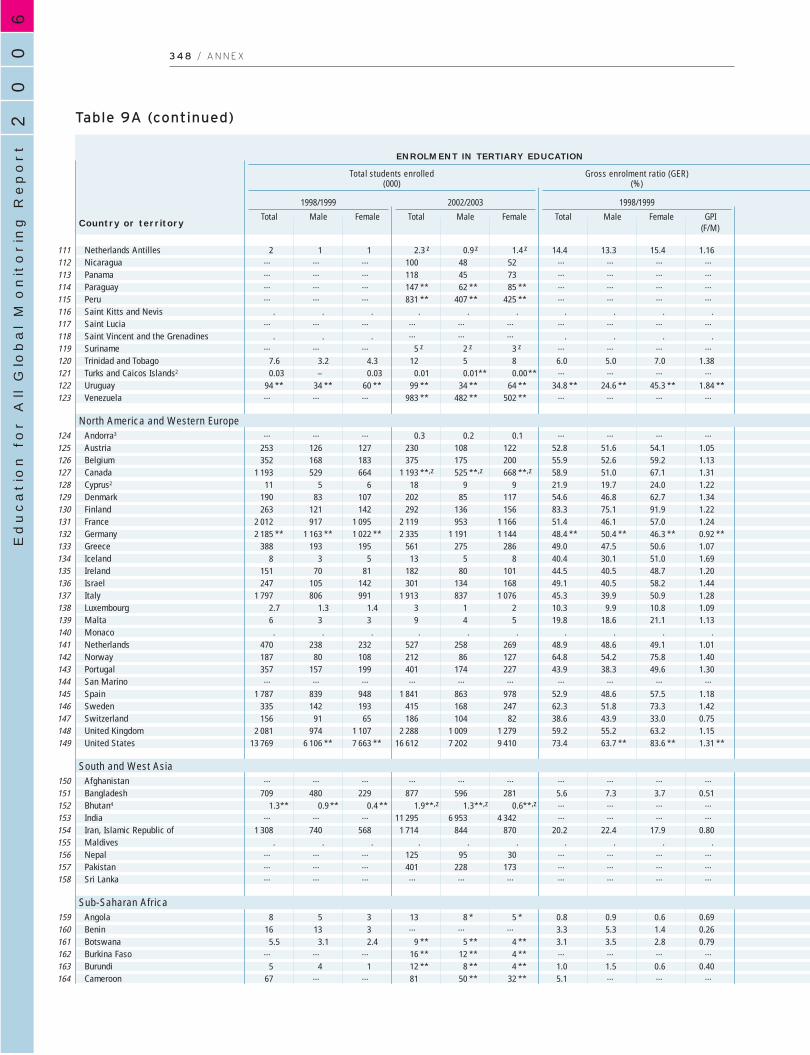
60
02
Education f
or A
ll G
lobal M
onitorin
g R
eport
3 4 8 / A N N E X
Table 9A (continued)
2 1 1 2.3 z 0.9 z 1.4 z 14.4 13.3 15.4 1.16… … … 100 48 52 … … … …… … … 118 45 73 … … … …… … … 147 ** 62 ** 85 ** … … … …… … … 831 ** 407 ** 425 ** … … … …
. . . . . . . . . .… … … … … … … … … …
. . . … … … . . . .… … … 5 z 2 z 3 z … … … …
7.6 3.2 4.3 12 5 8 6.0 5.0 7.0 1.380.03 – 0.03 0.01 0.01** 0.00** … … … …
94 ** 34 ** 60 ** 99 ** 34 ** 64 ** 34.8 ** 24.6 ** 45.3 ** 1.84 **… … … 983 ** 482 ** 502 ** … … … …
… … … 0.3 0.2 0.1 … … … …
253 126 127 230 108 122 52.8 51.6 54.1 1.05352 168 183 375 175 200 55.9 52.6 59.2 1.13
1 193 529 664 1 193 **,z 525 **,z 668 **,z 58.9 51.0 67.1 1.3111 5 6 18 9 9 21.9 19.7 24.0 1.22
190 83 107 202 85 117 54.6 46.8 62.7 1.34263 121 142 292 136 156 83.3 75.1 91.9 1.22
2 012 917 1 095 2 119 953 1 166 51.4 46.1 57.0 1.242 185 ** 1 163 ** 1 022 ** 2 335 1 191 1 144 48.4 ** 50.4 ** 46.3 ** 0.92 **
388 193 195 561 275 286 49.0 47.5 50.6 1.078 3 5 13 5 8 40.4 30.1 51.0 1.69
151 70 81 182 80 101 44.5 40.5 48.7 1.20247 105 142 301 134 168 49.1 40.5 58.2 1.44
1 797 806 991 1 913 837 1 076 45.3 39.9 50.9 1.282.7 1.3 1.4 3 1 2 10.3 9.9 10.8 1.096 3 3 9 4 5 19.8 18.6 21.1 1.13. . . . . . . . . .
470 238 232 527 258 269 48.9 48.6 49.1 1.01187 80 108 212 86 127 64.8 54.2 75.8 1.40357 157 199 401 174 227 43.9 38.3 49.6 1.30… … … … … … … … … …
1 787 839 948 1 841 863 978 52.9 48.6 57.5 1.18335 142 193 415 168 247 62.3 51.8 73.3 1.42156 91 65 186 104 82 38.6 43.9 33.0 0.75
2 081 974 1 107 2 288 1 009 1 279 59.2 55.2 63.2 1.1513 769 6 106 ** 7 663 ** 16 612 7 202 9 410 73.4 63.7 ** 83.6 ** 1.31 **
… … … … … … … … … …
709 480 229 877 596 281 5.6 7.3 3.7 0.511.3** 0.9 ** 0.4 ** 1.9**,z 1.3**,z 0.6**,z … … … …
… … … 11 295 6 953 4 342 … … … …
1 308 740 568 1 714 844 870 20.2 22.4 17.9 0.80. . . . . . . . . .
… … … 125 95 30 … … … …… … … 401 228 173 … … … …… … … … … … … … … …
8 5 3 13 8 * 5 * 0.8 0.9 0.6 0.6916 13 3 … … … 3.3 5.3 1.4 0.26
5.5 3.1 2.4 9 ** 5 ** 4 ** 3.1 3.5 2.8 0.79… … … 16 ** 12 ** 4 ** … … … …
5 4 1 12 ** 8 ** 4 ** 1.0 1.5 0.6 0.4067 … … 81 50 ** 32 ** 5.1 … … …
Netherlands AntillesNicaraguaPanamaParaguayPeruSaint Kitts and NevisSaint LuciaSaint Vincent and the GrenadinesSurinameTrinidad and TobagoTurks and Caicos Islands2
UruguayVenezuela
Andorra3
AustriaBelgiumCanadaCyprus2
DenmarkFinlandFranceGermanyGreeceIcelandIrelandIsraelItalyLuxembourgMaltaMonacoNetherlandsNorwayPortugalSan MarinoSpainSwedenSwitzerlandUnited KingdomUnited States
AfghanistanBangladeshBhutan4
IndiaIran, Islamic Republic ofMaldivesNepalPakistanSri Lanka
AngolaBeninBotswanaBurkina FasoBurundiCameroon
ENROLMENT IN TERTIARY EDUCATION
Total students enrolled(000)
Gross enrolment ratio (GER)(%)
1998/1999 2002/2003
Country or territoryMale Female
(F/M)Total Male FemaleTotal
1998/1999
Male FemaleTotal GPI
111112113114115116117118119120121122123
124125126127128129130131132133134135136137138139140141142143144145146147148149
150151152153154155156157158
159160161162163164
North America and Western Europe
South and West Asia
Sub-Saharan Africa

S TAT I S T I C A L A N N E X / 3 4 9
Ta b l e 9 A
14.0 z 11.3 z 16.7 z 1.48 z 15.1 z 64.2 z 20.7 z 44.2 z 59.1 z 72.9 z … … … … … …
18.3 17.5 19.2 1.10 95.5 4.5 . 51.8 59.3 . … … … … … …
43.2 32.2 54.6 1.69 86.2 13.8 0.0 64.2 49.1 63.0 … … … … … …
27.0 ** 22.6 ** 31.5 ** 1.39 ** 79.1 ** 20.6 ** … 54.7 ** 68.6 ** … … … … … … …
31.9 ** 30.8 ** 33.0 ** 1.07 ** 54.1 ** 45.8 ** – 47.0 55.9 – … … … … … …
. . . . . . . . . . . . . . . .… … … … … … … … … … … … … … … …… … … … … … … … … … . . . . . .
12.2 z 9.2 z 15.4 z 1.69 z 62.7 **,z 37.3 **,z . 49.1 **,z 83.6 **,z . … … … … … …
8.9 6.9 10.9 1.59 54.5 27.9 17.6 60.0 66.1 56.5 1.0 0.5 0.5 1.2 z 0.4 *,z 0.8*,z
0.7 1.0 ** 0.4 ** 0.44 ** . 100.0 . . 33.3 ** . . . . . . .37.4 ** 25.5 ** 49.7 ** 1.95 ** 76.3 ** 23.6 ** … 59.9 82.9 … … … … 2.1 y … …
40.2 ** 38.8 ** 41.8 ** 1.08 ** 61.6 ** 34.3 ** 4.1 ** 47.3 ** 57.6 ** … … … … 0.1 … …
… … … … 28.1 71.9 . 64.0 42.7 . … … … 0.03** … …
48.9 44.5 53.5 1.20 81.9 11.4 6.7 51.9 65.7 44.6 29.8 15.2 14.6 31 15 1661.1 55.9 66.5 1.19 46.7 51.5 1.7 50.4 56.5 39.0 36.1 18.9 17.2 42 … …
57.7 **,z 49.6 **,z 66.2 **,z 1.34 **,z 72.5 **,z 25.4 **,z 2.2 **,z 57.7 **,z 52.3 **,z 44.6 **,z 35.5 j 20.0 15.6 … … …
32.3 31.9 32.8 1.03 19.5 80.0 0.5 76.7 42.9 41.8 1.9 1.1 0.7 5 4 166.9 55.2 79.2 1.43 88.9 8.7 2.4 59.9 41.7 42.2 12.3 4.8 7.5 18 8 1087.5 79.8 95.6 1.20 93.0 0.2 6.8 53.8 40.0 49.7 4.8 2.8 2.0 7 4 355.5 48.9 62.5 1.28 71.4 24.0 4.6 55.5 55.2 46.6 131.0 ± … … 222 114 10851.0 51.1 51.0 1.00 81.5 14.6 … 47.3 61.5 … 178.2 96.2 82.0 241 122 11974.2 70.8 77.7 1.10 64.0 32.5 3.4 52.5 48.7 42.8 … … … 12 … …
62.7 44.8 81.2 1.81 94.1 5.6 0.3 64.5 50.9 53.3 0.2 0.1 0.1 0.6 0.2 0.451.6 44.6 59.0 1.32 62.2 35.7 2.1 57.1 53.8 46.9 7.2 eo … … 10 5 557.4 49.5 65.8 1.33 77.7 19.6 2.6 57.0 50.7 52.7 … … … … … …
56.9 48.9 65.3 1.34 97.3 1.1 1.6 56.2 65.5 50.9 23.5 11.7 11.8 36 16 2012.1 11.2 13.0 1.17 59.6 39.5 0.9 54.1 52.1 51.9 0.7 j … … … … …
30.2 25.3 35.4 1.40 78.0 21.6 0.5 55.8 61.5 38.1 0.3 j 0.1 0.2 0.4 0.2 0.2. . . . . . . . . . . . . . . .
58.1 55.7 60.6 1.09 97.5 1.3 1.3 51.0 59.6 41.0 13.6 7.4 6.3 21 9 1180.7 63.5 98.7 1.55 94.7 3.4 2.0 60.4 51.2 41.9 9.0 4.2 4.8 11 6 555.7 47.5 64.2 1.35 94.7 1.4 4.0 56.7 53.0 54.6 … … … 15 8 8
… … … … … … … … … … … … … … … …
61.9 56.6 67.4 1.19 82.6 13.5 4.0 53.7 50.5 51.0 33.0 16.2 16.7 54 24 3083.3 65.7 102.0 1.55 91.3 3.5 5.2 60.8 46.6 46.5 24.4 13.5 11.0 32 18 1448.7 53.1 44.1 0.83 71.4 20.6 8.0 45.7 41.5 38.3 25.3 14.2 11.1 33 18 1564.3 56.8 71.9 1.27 63.6 32.7 3.7 54.1 60.8 43.0 232.5 124.2 108.3 255 132 12383.2 70.5 96.4 1.37 74.8 23.3 1.8 56.9 56.3 50.5 451.9 262.6 189.4 586 … …
… … … … … … … … … … … … … … … …
6.2 8.2 4.1 0.50 90.7 9.1 0.2 33.8 14.4 28.3 … … … 0.4 … …… … … … 23.5 **,z 76.5 **,z . 31.9 **,z 34.3 **,z . … … … … … …
11.9 14.1 9.6 0.68 98.6 0.8 0.6 38.5 35.0 36.5 … … … 7.7 … …
21.1 20.4 21.9 1.07 75.6 23.6 0.8 53.9 41.7 23.4 … … … 1.5 0.9 0.6. . . . . . . . . . . . . . . .
5.3 7.7 2.7 0.34 99.4 . 0.6 24.2 . 20.1 … … … … … …
2.8 3.1 2.5 0.81 97.8 0.1 2.1 43.4 32.7 31.0 … … … 0.4 … …… … … … … … … … … … … … … – – –
1.0 1.2 * 0.8 * 0.65 * 100.0 . . 39.9 * . . 0.05 0.02 0.03 … … …… … … … … … … … … … … … … … … …
4.7 ** 5.4 ** 4.0 ** 0.75 ** 88.5 ** 11.4 ** 0.1 ** 44.6 ** 28.5 ** 60.0 ** … … … … … …
1.4 ** 2.1 ** 0.7 ** 0.34 ** … … … … … … … … … … … …
2.0 ** 2.8 ** 1.3 ** 0.45 ** … … … … … … 0.1 … … 0.5 z … …
5.5 6.7 ** 4.2 ** 0.63 ** … … … … … … … … … … … …
FOREIGN STUDENTS(000)
DISTRIBUTION OF STUDENTSBY ISCED LEVEL
ENROLMENT INTERTIARY EDUCATION
Gross enrolment ratio (GER)(%)
(F/M)
2002/2003
Male FemaleTotal
Total students (%)
2002/2003
Level 5B Level 6Level 5A
Percentage of female in each level
2002/2003
Level 5B Level 6Level 5A
1998/1999 2002/2003
GPI Male FemaleTotal Male FemaleTotal
111112113114115116117118119120121122123
124125126127128129130131132133134135136137138139140141142143144145146147148149
150151152153154155156157158
159160161162163164
North America and Western Europe
South and West Asia
Sub-Saharan Africa

60
02
Education f
or A
ll G
lobal M
onitorin
g R
eport
3 5 0 / A N N E X
Table 9A (continued)
… … … 2.2 1.0 1.2 … … … …
6 5 1 … … … 1.9 3.3 0.6 0.18… … … … … … … … … …
0.6 0.4 0.3 1.7 1.0 0.7 1.0 1.2 0.9 0.7511 ** 8 ** 2 ** 12 ** 10 ** 2 ** 3.7 ** 5.8 ** 1.5 ** 0.26 **97 71 25 … … … 7.1 10.4 3.7 0.3660 ** … … … … … 1.4 ** … … …… … … … … … … … … …
4 3 1 6 ** 5 ** 1 ** 1.2 2.2 0.3 0.1652 43 10 172 129 43 1.0 1.6 0.4 0.23
7.5 4.8 2.7 … … … 6.8 8.9 4.8 0.54… … … … … … … … … …… … … 70 48 22 … … … …… … … … … … … … … …… … … … … … … … … …… … … 99 **,z 64 **,z 34 **,z … … … …
4 1 3 6 2 4 2.2 1.7 2.7 1.61… … … … … … … … … …
31 17 14 33 18 15 2.3 2.5 2.1 0.843.2 2.3 0.9 4.5 3.2 1.3 0.3 0.5 0.2 0.37
19 … … 28 ** … … 1.8 … … …
7.6 4.1 3.5 17 7 10 7.1 7.6 6.6 0.87… … … … … … … … … …
11 5 6 14 ** 7 ** 6 ** 6.6 6.2 7.1 1.14… … … 14 **,z 10 **,z 3 **,z … … … …… … … 948 568 ** 380 ** … … … …
6 … … 20 13 7 0.9 … … …
. . . 0.2**,z 0.1**,z 0.1**,z . . . .29 … … … … … 3.7 … … …
. . . . . . . . . .… … … 9 **,z 6 **,z 3 **,z … … … …… … … … … … … … … …
634 293 341 675 312 363 15.3 14.2 16.3 1.155 3 2 5 ** 2 ** 3 ** 4.9 5.3 4.5 0.85
15 12 3 … … … 3.8 6.4 1.3 0.2141 27 ** 14 ** 74 ** 49 ** 26 ** 2.0 2.7 ** 1.4 ** 0.52 **19 15 4 31 22 10 0.6 1.0 0.3 0.2623 16 7 25 **,y 17 **,y 8 **,y 2.3 3.2 1.5 0.46… … … 56 ** 34 ** 22 ** … … … …
… … … … … … 21.2 20.4 21.9 1.07
… … … … … … 29.9 27.8 32.0 1.15… … … … … … 48.4 43.9 52.9 1.21… … … … … … 11.0 14.7 7.1 0.48
… … … … … … 19.7 10.6 34.0 3.22… … … … … … 38.7 32.8 43.8 1.34… … … … … … 24.9 21.1 28.2 1.33… … … … … … … … … …… … … … … … … … … …… … … … … … 49.1 40.5 58.2 1.44… … … … … … … … … …… … … … … … 2.3 2.5 2.1 0.84
Cape VerdeCentral African RepublicChadComorosCongoCôte d’IvoireDemocratic Rep. of the CongoEquatorial GuineaEritreaEthiopiaGabonGambiaGhanaGuineaGuinea-BissauKenyaLesothoLiberiaMadagascarMalawiMaliMauritiusMozambiqueNamibiaNigerNigeriaRwandaSao Tome and PrincipeSenegalSeychellesSierra LeoneSomaliaSouth AfricaSwazilandTogoUgandaUnited Republic of TanzaniaZambiaZimbabwe
World
Countries in transitionDeveloped countriesDeveloping countries
Arab StatesCentral and Eastern EuropeCentral AsiaEast Asia and the PacificLatin America and the CaribbeanNorth America and Western EuropeSouth and West AsiaSub-Saharan Africa
ENROLMENT IN TERTIARY EDUCATION
Total students enrolled(000)
Gross enrolment ratio (GER)(%)
1998/1999 2002/2003
Country or territoryMale Female
(F/M)Total Male FemaleTotal
1998/1999
Male FemaleTotal GPI
165166167168169170171172173174175176177178179180181182183184185186187188189190191192193194195196197198199200201202203
I
IIIIIIV
VVI
VIIVIII
IXX
XIXII
1. Data are included in ISCED level 5A.2. National population data were usedto calculate enrolment ratios.
3. Enrolment ratios were notcalculated due to lack of UnitedNations population data by age.
4. Enrolment ratios were not calculated dueto inconsistencies between enrolment andthe United Nations population data.
(eo) Full-time only.(hf) Data refer to ISCED level 5A only.(j) Data refer to ISCED levels 5A and 6 only.
Sum Median
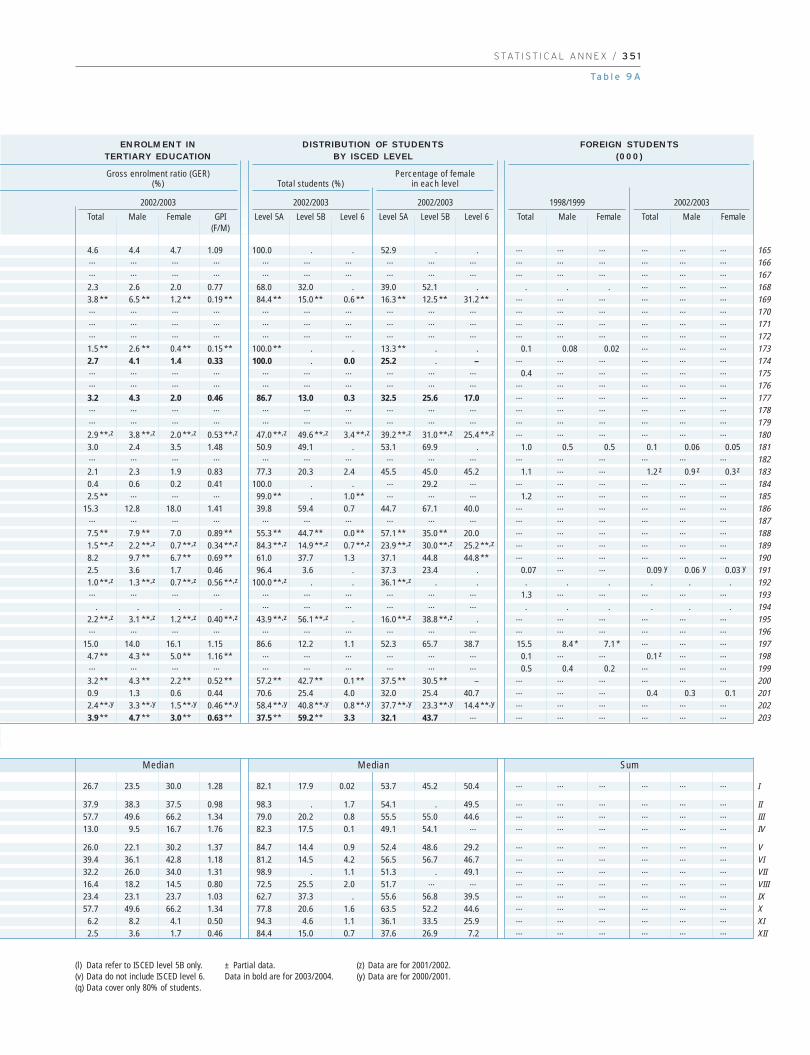
S TAT I S T I C A L A N N E X / 3 5 1
Ta b l e 9 A
4.6 4.4 4.7 1.09 100.0 . . 52.9 . . … … … … … …… … … … … … … … … … … … … … … …… … … … … … … … … … … … … … … …
2.3 2.6 2.0 0.77 68.0 32.0 . 39.0 52.1 . . . . … … …
3.8 ** 6.5 ** 1.2 ** 0.19 ** 84.4 ** 15.0 ** 0.6 ** 16.3 ** 12.5 ** 31.2 ** … … … … … …… … … … … … … … … … … … … … … …… … … … … … … … … … … … … … … …… … … … … … … … … … … … … … … …
1.5 ** 2.6 ** 0.4 ** 0.15 ** 100.0 ** . . 13.3 ** . . 0.1 0.08 0.02 … … …
2.7 4.1 1.4 0.33 100.0 . 0.0 25.2 . – … … … … … …… … … … … … … … … … 0.4 … … … … …… … … … … … … … … … … … … … … …
3.2 4.3 2.0 0.46 86.7 13.0 0.3 32.5 25.6 17.0 … … … … … …… … … … … … … … … … … … … … … …… … … … … … … … … … … … … … … …
2.9 **,z 3.8 **,z 2.0 **,z 0.53 **,z 47.0 **,z 49.6 **,z 3.4 **,z 39.2 **,z 31.0 **,z 25.4 **,z … … … … … …
3.0 2.4 3.5 1.48 50.9 49.1 . 53.1 69.9 . 1.0 0.5 0.5 0.1 0.06 0.05… … … … … … … … … … … … … … … …
2.1 2.3 1.9 0.83 77.3 20.3 2.4 45.5 45.0 45.2 1.1 … … 1.2 z 0.9 z 0.3z
0.4 0.6 0.2 0.41 100.0 . . … 29.2 … … … … … … …
2.5 ** … … … 99.0 ** . 1.0 ** … … … 1.2 … … … … …
15.3 12.8 18.0 1.41 39.8 59.4 0.7 44.7 67.1 40.0 … … … … … …… … … … … … … … … … … … … … … …
7.5 ** 7.9 ** 7.0 0.89 ** 55.3 ** 44.7 ** 0.0 ** 57.1 ** 35.0 ** 20.0 … … … … … …
1.5 **,z 2.2 **,z 0.7 **,z 0.34 **,z 84.3 **,z 14.9 **,z 0.7 **,z 23.9 **,z 30.0 **,z 25.2 **,z … … … … … …
8.2 9.7 ** 6.7 ** 0.69 ** 61.0 37.7 1.3 37.1 44.8 44.8 ** … … … … … …
2.5 3.6 1.7 0.46 96.4 3.6 . 37.3 23.4 . 0.07 … … 0.09 y 0.06 y 0.03 y
1.0 **,z 1.3 **,z 0.7 **,z 0.56 **,z 100.0 **,z . . 36.1 **,z . . . . . . . .… … … … … … … … … … 1.3 … … … … …
. . . . … … … … … … . . . . . .2.2 **,z 3.1 **,z 1.2 **,z 0.40 **,z 43.9 **,z 56.1 **,z . 16.0 **,z 38.8 **,z . … … … … … …… … … … … … … … … … … … … … … …
15.0 14.0 16.1 1.15 86.6 12.2 1.1 52.3 65.7 38.7 15.5 8.4 * 7.1 * … … …
4.7 ** 4.3 ** 5.0 ** 1.16 ** … … … … … … 0.1 … … 0.1 z … …… … … … … … … … … … 0.5 0.4 0.2 … … …
3.2 ** 4.3 ** 2.2 ** 0.52 ** 57.2 ** 42.7 ** 0.1 ** 37.5 ** 30.5 ** – … … … … … …
0.9 1.3 0.6 0.44 70.6 25.4 4.0 32.0 25.4 40.7 … … … 0.4 0.3 0.12.4 **,y 3.3 **,y 1.5 **,y 0.46 **,y 58.4 **,y 40.8 **,y 0.8 **,y 37.7 **,y 23.3 **,y 14.4 **,y … … … … … …
3.9 ** 4.7 ** 3.0 ** 0.63 ** 37.5 ** 59.2 ** 3.3 32.1 43.7 … … … … … … …
26.7 23.5 30.0 1.28 82.1 17.9 0.02 53.7 45.2 50.4 … … … … … …
37.9 38.3 37.5 0.98 98.3 . 1.7 54.1 . 49.5 … … … … … …
57.7 49.6 66.2 1.34 79.0 20.2 0.8 55.5 55.0 44.6 … … … … … …
13.0 9.5 16.7 1.76 82.3 17.5 0.1 49.1 54.1 … … … … … … …
26.0 22.1 30.2 1.37 84.7 14.4 0.9 52.4 48.6 29.2 … … … … … …
39.4 36.1 42.8 1.18 81.2 14.5 4.2 56.5 56.7 46.7 … … … … … …
32.2 26.0 34.0 1.31 98.9 . 1.1 51.3 . 49.1 … … … … … …
16.4 18.2 14.5 0.80 72.5 25.5 2.0 51.7 … … … … … … … …
23.4 23.1 23.7 1.03 62.7 37.3 . 55.6 56.8 39.5 … … … … … …
57.7 49.6 66.2 1.34 77.8 20.6 1.6 63.5 52.2 44.6 … … … … … …
6.2 8.2 4.1 0.50 94.3 4.6 1.1 36.1 33.5 25.9 … … … … … …
2.5 3.6 1.7 0.46 84.4 15.0 0.7 37.6 26.9 7.2 … … … … … …
FOREIGN STUDENTS(000)
DISTRIBUTION OF STUDENTSBY ISCED LEVEL
ENROLMENT INTERTIARY EDUCATION
Gross enrolment ratio (GER)(%)
(F/M)
2002/2003
Male FemaleTotal
Total students (%)
2002/2003
Level 5B Level 6Level 5A
Percentage of female in each level
2002/2003
Level 5B Level 6Level 5A
1998/1999 2002/2003
GPI Male FemaleTotal Male FemaleTotal
165166167168169170171172173174175176177178179180181182183184185186187188189190191192193194195196197198199200201202203
I
IIIIIIV
VVIVIIVIIIIXXXIXII
(l) Data refer to ISCED level 5B only.(v) Data do not include ISCED level 6.(q) Data cover only 80% of students.
(z) Data are for 2001/2002.(y) Data are for 2000/2001.
± Partial data.Data in bold are for 2003/2004.
Median Median Sum

60
02
Education f
or A
ll G
lobal M
onitorin
g R
eport
3 5 2 / A N N E X
Table 9B. Tertiary education: distribution of students by field of study and femaleshare in each field, 2002/2003
683 ** … … … … … … … … … …
19 62 3 7 50 10 11 . 7 3 71.1 45 . 21 51 20 2 . . 6 –
2 154 … … … … … … … … … 100318 **,z 34 **,z … … … … … … … … …
186 51 15 15 26 18 12 1 10 1 2… … … … … … … … … … …
144 54 3 19 39 16 12 0.4 8 3 0.5375 ** 51 ** … … … … … … … … …
9 ** 21 ** 3 ** 24 ** 57 ** 10 ** – 0.2 ** 1 ** – 5 **336 45 2 26 47 15 4 1 4 1 1
20 **,z 58 **,z … … … … … … … … …
105 49 22 17 29 11 8 0.5 12 – 0.38 73 17 15 41 12 4 . 3 . 8
525 58 53 14 11 8 8 1 4 – 1… … … … … … … … … … …… … … … … … … … … … …
263 55 1 21 27 22 9 2 7 – 1168 ** 66 ** … … … … … … … … …… … … … … … … … … … …
44 62 33 10 32 3 9 3 9 2 …
489 57 … … … … … … … … …… … … … … … … … … … …
231 53 9 9 41 5 22 2 6 6 0.1122 53 5 10 35 7 17 4 8 15 …
287 51 12 9 27 10 20 4 13 4 0.464 62 10 11 38 10 12 2 10 7 …
390 57 13 7 40 7 14 3 7 7 …
119 62 15 7 53 7 10 2 4 4 …
168 60 15 7 37 6 20 3 9 4 …
1 983 58 13 9 42 6 14 2 3 6 7114 56 … … … … … … … … …
644 54 3 11 43 5 22 3 6 3 38 151 ** 56 ** … … … … … … … … 100 z
209 y 54 y 4 y 10 y 33 y 5 y 24 y 5 y 12 y 7 y 0.3 y
158 53 16 6 28 9 18 4 12 7 …
101 56 10 7 44 5 17 3 7 7 …
46 56 13 11 28 8 20 5 10 6 …
1 918 42 12 5 17 7 14 3 5 3 342 296 54 * 8 5 42 4 22 5 6 5 2
79 55 17 4 35 0.3 6 2 8 2 26121 45 … … … … … … … … …
155 49 7 19 32 4 23 3 8 3 0.0603 57 … … … … … … … … …
201 54 25 5 42 6 10 1 3 8 …
98 62 12 11 35 7 19 3 7 5 197 25 14 z 39 z 20 z 11 z 8 z 3 z 4 z 1 z …… … … … … … … … … … …
394 44 … … … … … … … … …
1 012 54 8 11 36 13 11 2 13 4 24.4 63 55 11 13 4 3 . 12 . 3
43 29 ** 1 z 11 z 57 z 14 z 3 z 3 z 3 z 5 z 3 z
15 186 44 … … … … … … … … …
AlgeriaBahrainDjiboutiEgyptIraqJordanKuwaitLebanonLibyan Arab JamahiriyaMauritaniaMoroccoOmanPalestinian A. T.QatarSaudi ArabiaSudanSyrian Arab RepublicTunisiaUnited Arab EmiratesYemen
AlbaniaBelarusBosnia and HerzegovinaBulgariaCroatiaCzech RepublicEstoniaHungaryLatviaLithuaniaPolandRepublic of MoldovaRomaniaRussian FederationSerbia and MontenegroSlovakiaSloveniaTFYR MacedoniaTurkeyUkraine
ArmeniaAzerbaijanGeorgiaKazakhstanKyrgyzstanMongoliaTajikistanTurkmenistanUzbekistan
AustraliaBrunei DarussalamCambodiaChina
PERCENTAGE DISTRIBUTION BY FIELD OF STUDY
(000) % F
Total enrolment EducationHumanities
and arts
Socialsciences,business and law Science
Engineering,manufac-turing and
construction Agriculture
Health and
welfare Services
Not known or
unspecifiedCountry or territory
Arab States
Central and Eastern Europe
Central Asia
East Asia and the Pacific

S TAT I S T I C A L A N N E X / 3 5 3
Ta b l e 9 B
… … … … … … … … …
67 83 60 71 24 . 84 69 67. 52 52 18 25 . . 52 –
… … … … … … … … …… … … … … … … … …
79 66 37 51 30 – 50 84 45… … … … … … … … …
94 72 56 42 21 49 64 31 78… … … … … … … … …
13 24 23 14 – 60 6 – 19 **55 51 45 34 22 25 64 46 32… … … … … … … … …
71 61 34 49 35 18 42 – 3191 93 65 72 16 . 100 . 5586 31 30 41 1 32 40 – 8… … … … … … … … …… … … … … … … … …… … … … … … … – …… … … … … … … … …… … … … … … … … …
77 72 56 63 26 48 65 50 –… … … … … … … … …… … … … … … … … …
69 60 58 52 34 43 64 45 5592 71 65 46 25 43 72 29 –73 61 57 34 21 51 74 38 288 75 63 39 28 50 87 49 –72 65 64 35 20 46 77 56 …
84 80 64 33 22 44 86 49 –78 74 67 37 28 50 82 45 –73 69 63 43 22 55 73 51 69… … … … … … … … …
75 66 62 59 29 38 66 52 40… … … … … … … … 57 z
85 y 75 y 60 y 59 y 29 y 41 y 73 y 32 y 36 y
75 54 59 34 29 36 77 36 .79 73 63 30 23 54 78 45 .77 68 61 58 29 34 73 43 .49 56 44 39 19 35 58 29 46… … … … … … … … …
76 46 48 38 27 25 50 10 69… … … … … … … … …
64 77 39 70 31 25 72 11 73… … … … … … … … …
82 61 50 56 31 16 56 17 –75 72 65 50 48 64 83 35 61… … … … … … … … …… … … … … … … … …… … … … … … … … …
74 65 56 35 20 46 76 52 5267 51 60 48 40 . 75 . 5631 z 32 z 32 z 17 z 4 z 14 z 30 z 41 z 22 z
… … … … … … … … …
AlgeriaBahrainDjibouti
EgyptIraq
JordanKuwait
LebanonLibyan Arab Jamahiriya
MauritaniaMorocco
OmanPalestinian Autonomous Territories
QatarSaudi Arabia
SudanSyrian Arab Republic
TunisiaUnited Arab Emirates
Yemen
AlbaniaBelarus
Bosnia and HerzegovinaBulgariaCroatia
Czech RepublicEstonia
HungaryLatvia
LithuaniaPoland
Republic of MoldovaRomania
Russian FederationSerbia and Montenegro
SlovakiaSlovenia
The former Yugoslav Rep. of MacedoniaTurkey
Ukraine
ArmeniaAzerbaijan
GeorgiaKazakhstanKyrgyzstan
MongoliaTajikistan
TurkmenistanUzbekistan
AustraliaBrunei Darussalam
CambodiaChina
PERCENTAGE OF FEMALES IN EACH FIELD
EducationHumanities
and arts
Socialsciences,business and law Science
Engineering,manufac-turing and
construction Agriculture
Health and
welfare Services
Not known or
unspecifiedCountry or territory
Arab States
Central and Eastern Europe
Central Asia
East Asia and the Pacific

60
02
Education f
or A
ll G
lobal M
onitorin
g R
eport
3 5 4 / A N N E X
Table 9B (continued)
. . . . . . . . . . .… … … … … … … … … … …… … … … … … … … … … …
3 441 44 … … … … … … … … 1003 984 46 7 17 30 3 17 2 11 7 7
… … … … … … … … … … …
28 36 29 . 20 1 7 9 2 4 2826 36 4 4 82 3 2 – 4 1 …
632 55 7 13 27 16 24 2 4 0.2 70.9 z 56 z … … … … … … … … …
… … … … … … … … … … …
555 **,z … 1 y 32 y 23 y 37 y 5 y 1 y 1 y 0.0 y …
. . … … … … … … … … …
185 59 10 19 30 13 6 1 11 4 5. . … … … … … … … … …
0.5 **,z 63 **,z … … … … … … … … …… … … … … … … … … … …
2 427 55 17 3 31 12 12 3 9 4 73 223 37 6 18 20 10 31 1 7 7 –
1.2 **,z 44 **,z 23 y 8 y 34 y 9 y 5 y 11 y 3 y 3 y 5 y
… … … … … … … … … … …
. . … … … … … … … … …
2 251 54 … … … … … … … … 100 z
6 *,z 53 *,z … … … … … … … … …
. . . . . . . . . . .0.4**,z 58 **,z … … … … … … … … …
. . … … … … … … … … …
0.7 z … … … … … … … … … …
797 ** 43 ** 23 z 4 z 39 z – z 20 z 6 z 4 z – z 5 z
. . . . . . . . . . .z
. . . . . . . . . . .z
2 027 59 3 7 35 7 7 3 10 1 261.7 59 11 . 44 . 26 . 19 . …
… … … … … … … … … … …
8 y 71 y … … … … … … … … …
0.5 65 * … … … … … … … … …
2.0**,z 55 **,z . y 12 y 17 y 8 y .y .y .y .y 63 y
311 … … … … … … … … … …
3 579 56 … … … … … … … … 100. . … … … … … … … … …
0.4 y 75 y … … … … … … … … …
567 48 14 6 35 2 30 5 9 – –990 51 11 z 3 z 43 z 3 z 29 z 2 z 9 z … …
77 52 20 7 28 12 14 3 6 1 9236 56 … … … … … … … … …
. . … … … … … … … … …
287 61 … … … … … … … … …… … … … … … … … … … …
113 54 10 1 51 10 12 … 14 0.1 …
. . … … … … … … … … …
112 43 13 1 44 2 17 2 6 . 165 61 ** … … … … … … … … …
… … … … … … … … … … …
97 **,z 56 **,z … … … … … … … … …
46 ** 70 ** … … … … … … … … 100 z
2 237 50 11 4 42 13 19 2 8 2 0.3. . … … … … … … … … …
2.3 z 60 z 5 y . y 41 y .y 32 y .y 22 y .y …
100 52 … … … … … … … … …
Cook IslandsDPR KoreaFijiIndonesiaJapanKiribatiLao PDRMacao, ChinaMalaysiaMarshall IslandsMicronesia MyanmarNauruNew ZealandNiuePalauPapua New GuineaPhilippinesRepublic of KoreaSamoaSingaporeSolomon IslandsThailandTimor-LesteTokelauTongaTuvaluVanuatuViet Nam
AnguillaAntigua and BarbudaArgentinaArubaBahamasBarbadosBelizeBermudaBoliviaBrazilBritish Virgin IslandsCayman IslandsChileColombiaCosta RicaCubaDominicaDominican RepublicEcuadorEl SalvadorGrenadaGuatemalaGuyanaHaitiHondurasJamaicaMexicoMontserratNetherlands AntillesNicaragua
PERCENTAGE DISTRIBUTION BY FIELD OF STUDY
(000) % F
Total enrolment EducationHumanities
and arts
Socialsciences,business and law Science
Engineering,manufac-turing and
construction Agriculture
Health and
welfare Services
Not known or
unspecifiedCountry or territory
Latin America and the Caribbean

S TAT I S T I C A L A N N E X / 3 5 5
Ta b l e 9 B
. . . . . . . . .… … … … … … … … …… … … … … … … … …… … … … … … … … 4471 67 34 25 12 41 64 80 50… … … … … … … … …
40 . 41 36 10 18 57 17 40… … … … … … … … …
65 61 68 50 31 66 70 64 67… … … … … … … … …… … … … … … … … …… … … … … … … … …… … … … … … … … …
82 65 57 40 32 47 80 51 45… … … … … … … … …… … … … … … … … …… … … … … … … … …
75 57 65 54 30 52 73 15 1670 57 36 31 16 29 62 34 –67 y 57 y 37 y 41 y 4 y 29 y 81 y 12 y 44 y
… … … … … … … … …… … … … … … … … …… … … … … … … … 52 z
… … … … … … … … …
. . . . . . . . .… … … … … … … … …… … … … … … … … …… … … … … … … … …
56 z 69 z 49 z – z 14 z 34 z 40 z – z 43 z
. . . . . . . . .
. . . . . . . . .78 63 58 45 30 43 67 47 6992 . 66 . 14 . 88 . .… … … … … … … … …… … … … … … … … …… … … … … … … … …
. y 67 y 72 y 4 y . y . y . y . y 55 y
… … … … … … … … …… … … … … … … … 56… … … … … … … … …… … … … … … … … …
73 55 54 48 22 44 68 – –64 z 47 z 58 z 52 z 33 z 36 z 71 z … …
74 57 54 35 25 35 65 47 63… … … … … … … … .… … … … … … … … …… … … … … … … … …… … … … … … … … …
74 44 57 41 25 … 70 36 .… … … … … … … … …
61 53 45 72 19 24 55 . 44… … … … … … … … …… … … … … … … … …… … … … … … … … …… … … … … … … … 69 z
68 55 57 41 24 30 62 55 45… … … … … … … … …
95 y . y 72 y . y 15 y . y 85 y . y . y
… … … … … … … … …
Cook IslandsDemocratic People’s Republic of Korea
FijiIndonesia
JapanKiribati
Lao People’s Democratic RepublicMacao, China
MalaysiaMarshall Islands
Micronesia (Federated States of)Myanmar
NauruNew Zealand
NiuePalau
Papua New GuineaPhilippines
Republic of KoreaSamoa
SingaporeSolomon Islands
ThailandTimor-Leste
TokelauTongaTuvalu
VanuatuViet Nam
AnguillaAntigua and Barbuda
ArgentinaAruba
BahamasBarbados
BelizeBermuda
BoliviaBrazil
British Virgin IslandsCayman Islands
ChileColombia
Costa RicaCuba
DominicaDominican Republic
EcuadorEl Salvador
GrenadaGuatemala
GuyanaHaiti
HondurasJamaicaMexico
MontserratNetherlands Antilles
Nicaragua
PERCENTAGE OF FEMALES IN EACH FIELD
EducationHumanities
and arts
Socialsciences,business and law Science
Engineering,manufac-turing and
construction Agriculture
Health and
welfare Services
Not known or
unspecifiedCountry or territory
Latin America and the Caribbean

60
02
Education f
or A
ll G
lobal M
onitorin
g R
eport
3 5 6 / A N N E X
Table 9B (continued)
118 62 16 7 42 4 18 1 7 3 2147 ** 58 ** … … … … … … … … 100 **831 ** 51 ** … … … … … … … … 100 **
. . … … … … … … … … …… … … … … … … … … … …… … … … … … … … … … …
5 z 62 z 38 z 3 z 35 z 8 z 10 z 1 z .z 1 z 3 z
12 61 11 z 12 z 25 z 14 z 21 z 4 z 11 z 2 z 0.0 z
0.01 33 ** … … … … … … … … …
99 ** 65 ** … … … … … … … … …
983 ** 51 ** … … … … … … … … …
0.3 49 – 4 43 31 – – 22 – …
230 53 15 12 36 12 14 1 9 2 0.3375 53 13 10 30 8 11 2 17 1 8
1 193 **,z 56 **,z … … … … … … … … …
18 49 12 10 44 13 3 0.1 4 14 …
202 58 11 17 24 9 11 2 25 2 …
292 53 5 15 22 12 27 2 13 4 …
2 119 55 … … … … … … … … …
2 335 49 7 16 26 14 15 1 14 2 …
561 51 7 z 14 z 32 z 16 z 14 z 6 z 7 z 5 z …
13 64 20 14 35 11 7 1 12 2 …
182 56 5 18 20 14 11 1 10 4 17301 56 16 11 34 12 19 0.5 6 – 1
1 913 56 6 15 38 8 16 2 12 2 0.23 53 22 z 13 z 41 z 10 z 8 z … 7 z … …
9 57 20 11 37 5 8 0.3 18 1 …
. . . . . . . . . . .527 51 14 8 41 6 10 2 16 2 2212 60 15 10 31 11 6 1 18 3 4401 57 12 9 32 8 21 2 11 5 …… … … … … … … … … … …
1 841 53 8 11 34 13 18 3 9 5 0.2415 60 15 13 26 10 17 1 16 2 0.2186 44 10 13 38 12 14 1 9 3 0.4
2 288 56 8 16 25 13 8 1 17 – 1316 612 57 … … … … … … … … 100
… … … … … … … … … … …
877 32 3 41 38 11 2 1 2 0.1 21.9**,z 34 **,z … … … … … … … … …
11 295 38 1 z – z 52 z 15 z 5 z – z 1 z – z 25 z
1 714 51 … … … … … … … … …
. . . . . . . . . . .125 24 … … … … … … … … …
401 43 … … … … … … … … …… … … … … … … … … … …
13 40 * 35 . 37 10 9 . 7 . 3… … … … … … … … … … …
9 ** 43 ** 26 z 22 z 29 z 14 z 4 z 1 z 2 z 0.4 z …
16 ** 25 ** … … … … … … … … …
12 ** 32 ** 25 z 14 z 28 z 5 z 5 z 4 z 6 z .z 13 z
81 39 ** … … … … … … … … …
2.2 53 … … … … … … … … …… … … … … … … … … … …… … … … … … … … … … …
PanamaParaguayPeruSaint Kitts and NevisSaint LuciaSaint Vincent/Grenad.SurinameTrinidad and TobagoTurks and Caicos IslandsUruguayVenezuela
AndorraAustriaBelgiumCanadaCyprusDenmarkFinlandFranceGermanyGreeceIcelandIrelandIsraelItalyLuxembourgMaltaMonacoNetherlandsNorwayPortugalSan MarinoSpainSwedenSwitzerlandUnited KingdomUnited States
AfghanistanBangladeshBhutanIndiaIran, Islamic Republic ofMaldivesNepalPakistanSri Lanka
AngolaBeninBotswanaBurkina FasoBurundiCameroonCape VerdeCentral African RepublicChad
PERCENTAGE DISTRIBUTION BY FIELD OF STUDY
(000) % F
Total enrolment EducationHumanities
and arts
Socialsciences,business and law Science
Engineering,manufac-turing and
construction Agriculture
Health and
welfare Services
Not known or
unspecifiedCountry or territory
North America and Western Europe
South and West Asia
Sub-Saharan Africa

S TAT I S T I C A L A N N E X / 3 5 7
Ta b l e 9 B
79 65 67 53 29 33 78 67 79… … … … … … … . 58 **… … … … … … … … 51… … … … … … … … …… … … … … … … … …… … … … … … … … …
60 z 81 z 69 z 67 z 33 z 67 z . z 79 z 69 z
74 z 78 z 70 z 57 z 27 z 58 z 57 z 72 z 100 z
… … … … … … … … …… … … … … … … … …… … … … … … … … …
– 92 50 15 – – 86 – –75 65 55 35 20 60 67 52 5871 59 53 30 20 50 73 47 45… … … … … … … … …
89 59 47 32 8 – 70 38 –70 63 49 32 33 51 81 23 –81 71 63 42 19 49 84 67 …… … … … … … … … …
69 65 47 33 19 46 73 54 …
68 z 73 z 54 z 37 z 27 z 43 z 72 z 42 z . z
84 66 59 37 28 40 83 83 .81 66 60 43 18 41 79 53 5683 65 58 45 23 58 76 – 6488 74 57 49 27 44 65 48 68… … … … … … … … …
74 58 53 33 28 30 65 33 .. . . . . . . . .
74 56 47 23 12 48 75 52 3878 62 56 32 24 53 82 44 6283 64 60 50 27 56 77 51 .… … … … … … … … …
77 62 59 36 27 45 76 60 4478 63 61 43 29 56 82 58 7470 59 44 26 14 43 66 54 4372 62 56 36 19 58 78 – 55… … … … … … … … 57
… … … … … … … … …
38 35 32 25 11 19 41 28 31… … … … … … … … …
43 z – z 42 z 39 z 25 z – z 41 z – z 35 z
… … … … … … … … …
. . . . . . . . .… … … … … … … … …… … … … … … … … …… … … … … … … … …
… . … … … . … . …… … … … … … … … …
52 z 56 z 44 z 24 z 16 z 14 z 68 z 34 z . z
… … … … … … … … …
33 z 19 z 40 z 18 z 9 z 15 z 23 z . z 39 z
… … … … … … … … …… … … … … … … … …… … … … … … … … …… … … … … … … … …
PanamaParaguay
PeruSaint Kitts and Nevis
Saint LuciaSaint Vincent and the Grenadines
SurinameTrinidad and Tobago
Turks and Caicos IslandsUruguay
Venezuela
AndorraAustria
BelgiumCanadaCyprus
DenmarkFinlandFrance
GermanyGreeceIcelandIreland
IsraelItaly
LuxembourgMalta
MonacoNetherlands
NorwayPortugal
San MarinoSpain
SwedenSwitzerland
United KingdomUnited States
AfghanistanBangladesh
BhutanIndia
Iran, Islamic Republic ofMaldives
NepalPakistan
Sri Lanka
AngolaBenin
BotswanaBurkina Faso
BurundiCameroon
Cape VerdeCentral African Republic
Chad
PERCENTAGE OF FEMALES IN EACH FIELD
EducationHumanities
and arts
Socialsciences,business and law Science
Engineering,manufac-turing and
construction Agriculture
Health and
welfare Services
Not known or
unspecifiedCountry or territory
North America and Western Europe
South and West Asia
Sub-Saharan Africa
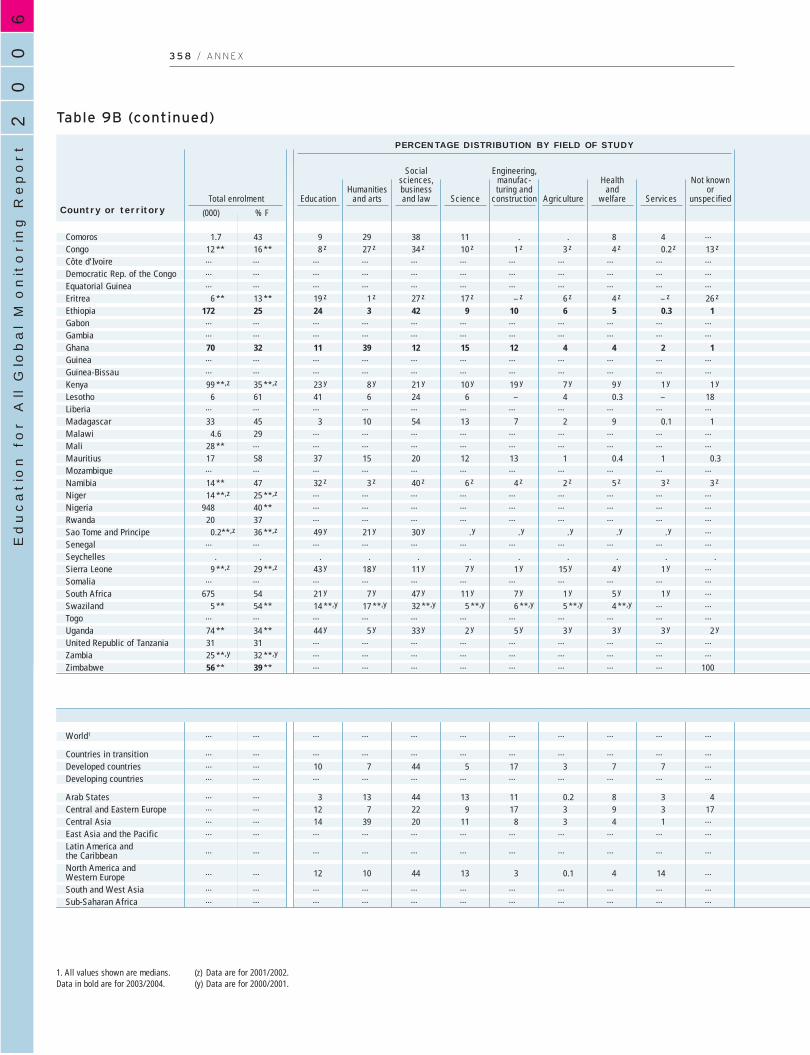
60
02
Education f
or A
ll G
lobal M
onitorin
g R
eport
3 5 8 / A N N E X
Table 9B (continued)
1.7 43 9 29 38 11 . . 8 4 …
12 ** 16 ** 8 z 27 z 34 z 10 z 1 z 3 z 4 z 0.2 z 13 z
… … … … … … … … … … …… … … … … … … … … … …… … … … … … … … … … …
6 ** 13 ** 19 z 1 z 27 z 17 z – z 6 z 4 z – z 26 z
172 25 24 3 42 9 10 6 5 0.3 1… … … … … … … … … … …… … … … … … … … … … …
70 32 11 39 12 15 12 4 4 2 1… … … … … … … … … … …… … … … … … … … … … …
99 **,z 35 **,z 23 y 8 y 21 y 10 y 19 y 7 y 9 y 1 y 1 y
6 61 41 6 24 6 – 4 0.3 – 18… … … … … … … … … … …
33 45 3 10 54 13 7 2 9 0.1 14.6 29 … … … … … … … … …
28 ** … … … … … … … … … …
17 58 37 15 20 12 13 1 0.4 1 0.3… … … … … … … … … … …
14 ** 47 32 z 3 z 40 z 6 z 4 z 2 z 5 z 3 z 3 z
14 **,z 25 **,z … … … … … … … … …
948 40 ** … … … … … … … … …
20 37 … … … … … … … … …
0.2**,z 36 **,z 49 y 21 y 30 y .y .y .y .y .y …… … … … … … … … … … …
. . . . . . . . . . .9 **,z 29 **,z 43 y 18 y 11 y 7 y 1 y 15 y 4 y 1 y …
… … … … … … … … … … …
675 54 21 y 7 y 47 y 11 y 7 y 1 y 5 y 1 y …
5 ** 54 ** 14 **,y 17 **,y 32 **,y 5 **,y 6 **,y 5 **,y 4 **,y … …… … … … … … … … … … …
74 ** 34 ** 44 y 5 y 33 y 2 y 5 y 3 y 3 y 3 y 2 y
31 31 … … … … … … … … …
25 **,y 32 **,y … … … … … … … … …
56 ** 39 ** … … … … … … … … 100
… … … … … … … … … … …
… … … … … … … … … … …… … 10 7 44 5 17 3 7 7 …… … … … … … … … … … …
… … 3 13 44 13 11 0.2 8 3 4… … 12 7 22 9 17 3 9 3 17… … 14 39 20 11 8 3 4 1 …… … … … … … … … … … …
… … … … … … … … … … …
… … 12 10 44 13 3 0.1 4 14 …
… … … … … … … … … … …… … … … … … … … … … …
ComorosCongoCôte d’IvoireDemocratic Rep. of the CongoEquatorial GuineaEritreaEthiopiaGabonGambiaGhanaGuineaGuinea-BissauKenyaLesothoLiberiaMadagascarMalawiMaliMauritiusMozambiqueNamibiaNigerNigeriaRwandaSao Tome and PrincipeSenegalSeychellesSierra LeoneSomaliaSouth AfricaSwazilandTogoUgandaUnited Republic of TanzaniaZambiaZimbabwe
World1
Countries in transitionDeveloped countriesDeveloping countries
Arab StatesCentral and Eastern EuropeCentral AsiaEast Asia and the PacificLatin America and the CaribbeanNorth America and Western EuropeSouth and West AsiaSub-Saharan Africa
PERCENTAGE DISTRIBUTION BY FIELD OF STUDY
(000) % F
Total enrolment EducationHumanities
and arts
Socialsciences,business and law Science
Engineering,manufac-turing and
construction Agriculture
Health and
welfare Services
Not known or
unspecifiedCountry or territory
1. All values shown are medians.Data in bold are for 2003/2004.
(z) Data are for 2001/2002.(y) Data are for 2000/2001.

S TAT I S T I C A L A N N E X / 3 5 9
Ta b l e 9 B
53 36 47 27 . . 55 57 .9 z 13 z 16 z 16 z 10 z 31 z 24 y 44 z 19 z
… … … … … … … … …… … … … … … … … …… … … … … … … … …
9 z 32 z 19 z 7 z – z 10 z 12 z – z 15 z
19 26 33 24 11 18 26 39 17… … … … … … … … …… … … … … … … … …
36 37 42 27 8 20 37 22 …… … … … … … … … …… … … … … … … … …
42 y 33 y 48 y 28 y 13 y 27 y 44 y 35 y 24 y
68 53 50 30 – 46 94 – 76… … … … … … … … …
45 59 49 31 20 37 52 51 40… … … … … … … … …… … … … … … … … …
71 69 55 51 22 57 22 26 53… … … … … … … … …
55 z 60 z 56 z 40 z 16 z 35 z 81 z 62 z 50 z
… … … … … … … … …… … … … … … … … …… … … … … … … … …
26 y 61 y 35 y . y . y . y . y . y . y
… … … … … … … … …
. . . . . . . . .33 y 31 y 21 y 27 y 25 y 20 y 29 y 34 y . y
… … … … … … … … …
71 y 65 y 53 y 43 y 17 y 37 y 72 y 75 y …
43 y 62 y 48 y 41 y 15 y 33 y 72 y … …… … … … … … … … …
33 y 38 y 38 y 24 y 18 y 17 y 42 y 56 y 48 y
… … … … … … … … …… … … … … … … … …… … … … … … … … 41
… … … … … … … … …
… … … … … … … … …
75 65 59 47 25 49 66 52 49… … … … … … … … …
… … … … … … … … …
77 72 56 63 26 48 65 50 –… … … … … … … … …… … … … … … … … …
… … … … … … … … …
76 63 57 35 24 53 71 56 51
… … … … … … … … …… … … … … … … … …
ComorosCongo
Côte d’IvoireDemocratic Rep. of the Congo
Equatorial GuineaEritrea
EthiopiaGabon
GambiaGhana
GuineaGuinea-Bissau
KenyaLesothoLiberia
MadagascarMalawi
MaliMauritius
MozambiqueNamibia
NigerNigeria
RwandaSao Tome and Principe
SenegalSeychelles
Sierra LeoneSomalia
South AfricaSwaziland
TogoUganda
United Republic of TanzaniaZambia
Zimbabwe
World 1
Countries in transitionDeveloped countries
Developing countries
Arab StatesCentral and Eastern Europe
Central AsiaEast Asia and the Pacific
Latin America and the Caribbean
North America and Western Europe
South and West AsiaSub-Saharan Africa
PERCENTAGE OF FEMALES IN EACH FIELD
EducationHumanities
and arts
Socialsciences,business and law Science
Engineering,manufac-turing and
construction Agriculture
Health and
welfare Services
Not known or
unspecifiedCountry or territory
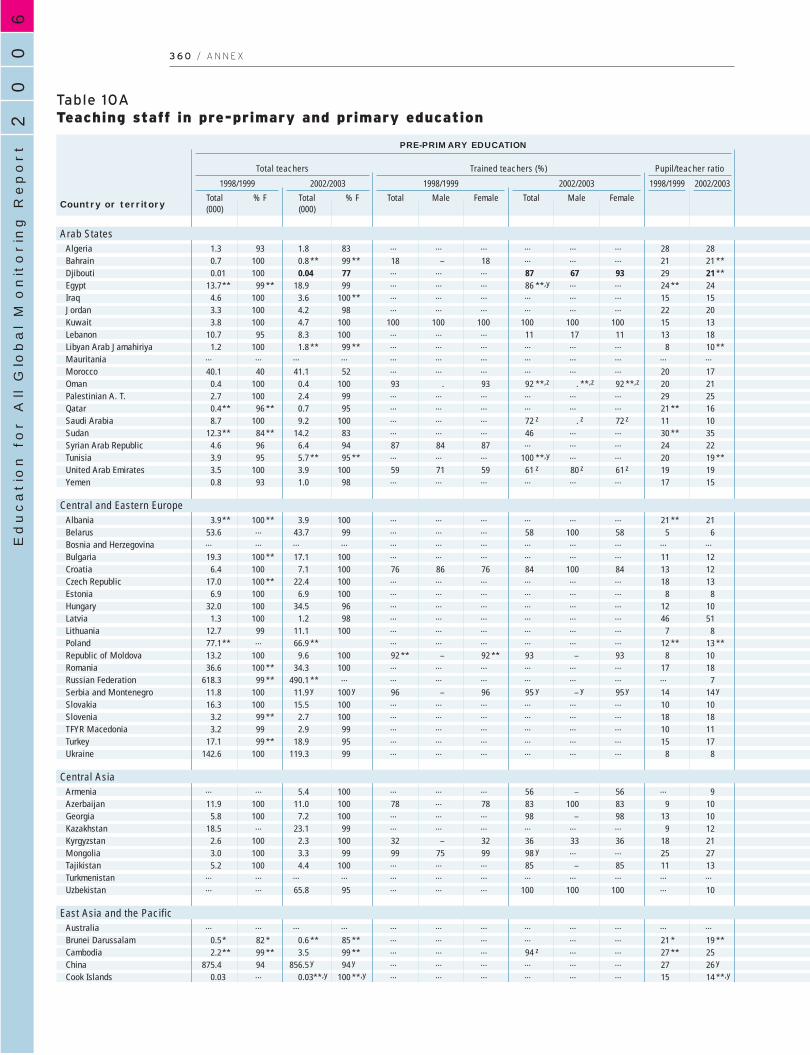
60
02
Education f
or A
ll G
lobal M
onitorin
g R
eport
3 6 0 / A N N E X
Table 10ATeaching staff in pre-primary and primary education
1.3 93 1.8 83 … … … … … … 28 280.7 100 0.8 ** 99 ** 18 – 18 … … … 21 21 **0.01 100 0.04 77 … … … 87 67 93 29 21 **
13.7** 99 ** 18.9 99 … … … 86 **,y … … 24 ** 244.6 100 3.6 100 ** … … … … … … 15 153.3 100 4.2 98 … … … … … … 22 203.8 100 4.7 100 100 100 100 100 100 100 15 13
10.7 95 8.3 100 … … … 11 17 11 13 181.2 100 1.8 ** 99 ** … … … … … … 8 10 **
… … … … … … … … … … … …
40.1 40 41.1 52 … … … … … … 20 170.4 100 0.4 100 93 . 93 92 **,z . **,z 92 **,z 20 212.7 100 2.4 99 … … … … … … 29 250.4** 96 ** 0.7 95 … … … … … … 21 ** 168.7 100 9.2 100 … … … 72 z . z 72 z 11 10
12.3** 84 ** 14.2 83 … … … 46 … … 30 ** 354.6 96 6.4 94 87 84 87 … … … 24 223.9 95 5.7 ** 95 ** … … … 100 **,y … … 20 19 **3.5 100 3.9 100 59 71 59 61 z 80 z 61 z 19 190.8 93 1.0 98 … … … … … … 17 15
3.9** 100 ** 3.9 100 … … … … … … 21 ** 2153.6 … 43.7 99 … … … 58 100 58 5 6… … … … … … … … … … … …
19.3 100 ** 17.1 100 … … … … … … 11 126.4 100 7.1 100 76 86 76 84 100 84 13 12
17.0 100 ** 22.4 100 … … … … … … 18 136.9 100 6.9 100 … … … … … … 8 8
32.0 100 34.5 96 … … … … … … 12 101.3 100 1.2 98 … … … … … … 46 51
12.7 99 11.1 100 … … … … … … 7 877.1** … 66.9 ** … … … … … … 12 ** 13 **13.2 100 9.6 100 92 ** – 92 ** 93 – 93 8 1036.6 100 ** 34.3 100 … … … … … … 17 18
618.3 99 ** 490.1 ** … … … … … … … … 711.8 100 11.9 y 100 y 96 – 96 95 y – y 95 y 14 14 y
16.3 100 15.5 100 … … … … … … 10 103.2 99 ** 2.7 100 … … … … … … 18 183.2 99 2.9 99 … … … … … … 10 11
17.1 99 ** 18.9 95 … … … … … … 15 17142.6 100 119.3 99 … … … … … … 8 8
… … 5.4 100 … … … 56 – 56 … 911.9 100 11.0 100 78 … 78 83 100 83 9 10
5.8 100 7.2 100 … … … 98 – 98 13 1018.5 … 23.1 99 … … … … … … 9 12
2.6 100 2.3 100 32 – 32 36 33 36 18 213.0 100 3.3 99 99 75 99 98 y … … 25 275.2 100 4.4 100 … … … 85 – 85 11 13
… … … … … … … … … … … …… … 65.8 95 … … … 100 100 100 … 10
… … … … … … … … … … … …
0.5* 82 * 0.6 ** 85 ** … … … … … … 21 * 19 **2.2** 99 ** 3.5 99 ** … … … 94 z … … 27 ** 25
875.4 94 856.5 y 94 y … … … … … … 27 26 y
0.03 … 0.03**,y 100 **,y … … … … … … 15 14 **,y
AlgeriaBahrainDjiboutiEgyptIraqJordanKuwaitLebanonLibyan Arab JamahiriyaMauritaniaMoroccoOmanPalestinian A. T. QatarSaudi ArabiaSudanSyrian Arab RepublicTunisiaUnited Arab EmiratesYemen
AlbaniaBelarusBosnia and HerzegovinaBulgariaCroatiaCzech RepublicEstoniaHungaryLatviaLithuaniaPolandRepublic of MoldovaRomaniaRussian FederationSerbia and MontenegroSlovakiaSloveniaTFYR MacedoniaTurkeyUkraine
ArmeniaAzerbaijanGeorgiaKazakhstanKyrgyzstanMongoliaTajikistanTurkmenistanUzbekistan
AustraliaBrunei DarussalamCambodiaChinaCook Islands
PRE-PRIMARY EDUCATION
1998/1999
Total teachers
1998/1999
Trained teachers (%) Pupil/teacher ratio
Total(000)
% F
2002/2003
Total(000)
% F Total Male Female
2002/2003 1998/1999 2002/2003
Total Male FemaleCountry or territory
Arab States
Central and Eastern Europe
Central Asia
East Asia and the Pacific
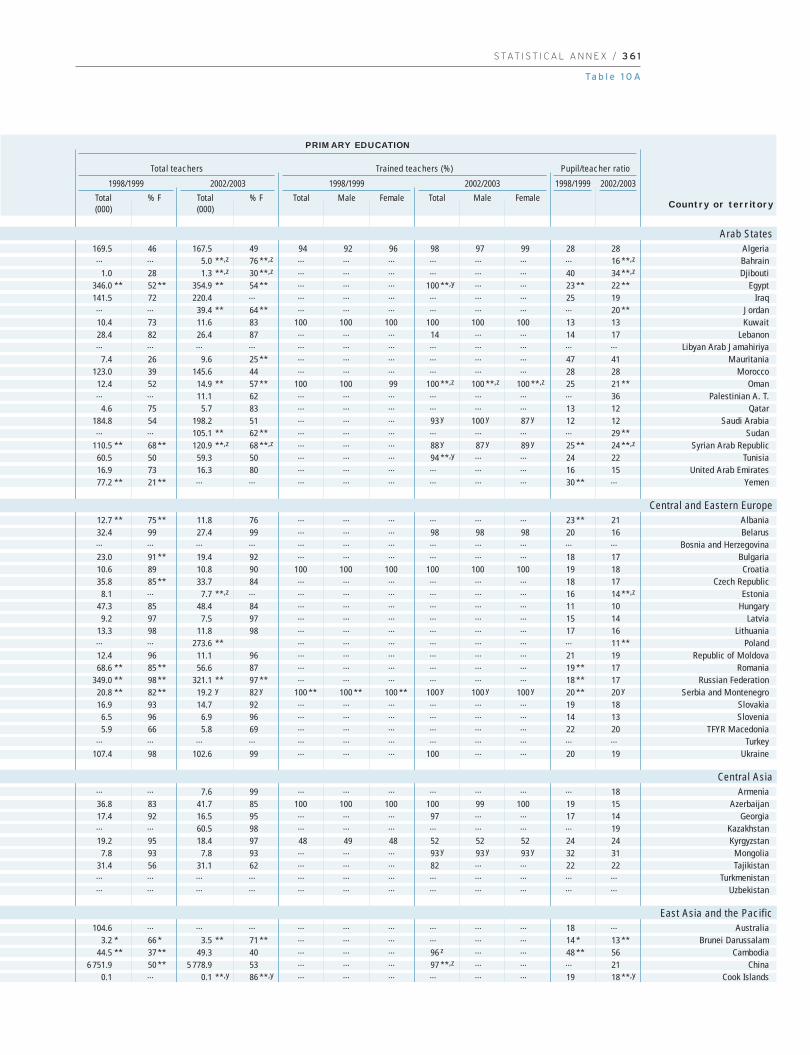
S TAT I S T I C A L A N N E X / 3 6 1
Ta b l e 1 0 A
AlgeriaBahrainDjibouti
EgyptIraq
JordanKuwait
LebanonLibyan Arab Jamahiriya
MauritaniaMorocco
OmanPalestinian A. T.
QatarSaudi Arabia
SudanSyrian Arab Republic
TunisiaUnited Arab Emirates
Yemen
AlbaniaBelarus
Bosnia and HerzegovinaBulgariaCroatia
Czech RepublicEstonia
HungaryLatvia
LithuaniaPoland
Republic of MoldovaRomania
Russian FederationSerbia and Montenegro
SlovakiaSlovenia
TFYR MacedoniaTurkey
Ukraine
ArmeniaAzerbaijan
GeorgiaKazakhstanKyrgyzstan
MongoliaTajikistan
TurkmenistanUzbekistan
AustraliaBrunei Darussalam
CambodiaChina
Cook Islands
169.5 46 167.5 49 94 92 96 98 97 99 28 28… … 5.0 **,z 76 **,z … … … … … … … 16 **,z
1.0 28 1.3 **,z 30 **,z … … … … … … 40 34 **,z
346.0 ** 52 ** 354.9 ** 54 ** … … … 100 **,y … … 23 ** 22 **141.5 72 220.4 … … … … … … … 25 19… … 39.4 ** 64 ** … … … … … … … 20 **10.4 73 11.6 83 100 100 100 100 100 100 13 1328.4 82 26.4 87 … … … 14 … … 14 17… … … … … … … … … … … …
7.4 26 9.6 25 ** … … … … … … 47 41123.0 39 145.6 44 … … … … … … 28 28
12.4 52 14.9 ** 57 ** 100 100 99 100 **,z 100 **,z 100 **,z 25 21 **… … 11.1 62 … … … … … … … 36
4.6 75 5.7 83 … … … … … … 13 12184.8 54 198.2 51 … … … 93 y 100 y 87 y 12 12… … 105.1 ** 62 ** … … … … … … … 29 **
110.5 ** 68 ** 120.9 **,z 68 **,z … … … 88 y 87 y 89 y 25 ** 24 **,z
60.5 50 59.3 50 … … … 94 **,y … … 24 2216.9 73 16.3 80 … … … … … … 16 1577.2 ** 21 ** … … … … … … … … 30 ** …
12.7 ** 75 ** 11.8 76 … … … … … … 23 ** 2132.4 99 27.4 99 … … … 98 98 98 20 16… … … … … … … … … … … …
23.0 91 ** 19.4 92 … … … … … … 18 1710.6 89 10.8 90 100 100 100 100 100 100 19 1835.8 85 ** 33.7 84 … … … … … … 18 17
8.1 … 7.7 **,z … … … … … … … 16 14 **,z
47.3 85 48.4 84 … … … … … … 11 109.2 97 7.5 97 … … … … … … 15 14
13.3 98 11.8 98 … … … … … … 17 16… … 273.6 ** … … … … … … … 11 **12.4 96 11.1 96 … … … … … … 21 1968.6 ** 85 ** 56.6 87 … … … … … … 19 ** 17
349.0 ** 98 ** 321.1 ** 97 ** … … … … … … 18 ** 1720.8 ** 82 ** 19.2 y 82 y 100 ** 100 ** 100 ** 100 y 100 y 100 y 20 ** 20 y
16.9 93 14.7 92 … … … … … … 19 186.5 96 6.9 96 … … … … … … 14 135.9 66 5.8 69 … … … … … … 22 20
… … … … … … … … … … … …
107.4 98 102.6 99 … … … 100 … … 20 19
… … 7.6 99 … … … … … … … 1836.8 83 41.7 85 100 100 100 100 99 100 19 1517.4 92 16.5 95 … … … 97 … … 17 14… … 60.5 98 … … … … … … … 1919.2 95 18.4 97 48 49 48 52 52 52 24 24
7.8 93 7.8 93 … … … 93 y 93 y 93 y 32 3131.4 56 31.1 62 … … … 82 … … 22 22… … … … … … … … … … … …… … … … … … … … … … … …
104.6 … … … … … … … … … 18 …
3.2 * 66 * 3.5 ** 71 ** … … … … … … 14 * 13 **44.5 ** 37 ** 49.3 40 … … … 96 z … … 48 ** 56
6 751.9 50 ** 5 778.9 53 … … … 97 **,z … … … 210.1 … 0.1 **,y 86 **,y … … … … … … 19 18 **,y
PRIMARY EDUCATION
1998/1999
Total teachers
1998/1999
Trained teachers (%) Pupil/teacher ratio
Total(000)
% F Total(000)
% F
2002/2003
Total Male Female
2002/2003 1998/1999 2002/2003
Total Male FemaleCountry or territory
Arab States
Central and Eastern Europe
Central Asia
East Asia and the Pacific

60
02
Education f
or A
ll G
lobal M
onitorin
g R
eport
3 6 2 / A N N E X
Table 10A (continued)
… … … … … … … … … … … …… … … … … … … … … … … …
90.5** 98 ** 137.1 98 … … … 71 **,y … … 17 ** 1396.0 … 102.0 98 ** … … … … … … 31 30… … … … … … … … … … … …
2.1 100 2.4 100 86 100 86 82 100 82 18 160.5 100 0.5 100 93 – 93 98 . 98 31 27
23.1 100 25.1 99 … … … … … … 25 230.1 … 0.1 z 60 z … … … 100 z 100 z 100 z 11 12 z
… … … … … … … … … … … …
1.9 … … … … … … … … … 22 …… … … … … … … … … … … …… … 8.8 99 … … … … … … … 11
0.0 100 0.01 z 100 z … … … 100 z . z 100 z 14 6 z
… … 0.1 **,y 98 **,y … … … … … … … 10 **,y
1.4 41 2.5 z 42 z 100 100 100 100 z 100 z 100 z 34 30 z
18.0 … 23.7 96 100 ** … … … … … 33 3222.7 100 26.1 99 … … … … … … 24 21… … 0.1 ** 94 ** … … … … … … … 41 **… … … … … … … … … … … …… … … … … … … … … … … …
111.3 79 … … … … … … … … 25 …… … … … … … … … … … … …… … … … … … … … … … … …
0.1 100 0.1 **,y 100 **,y 50 – 50 … … … 10 18 **,y
… … 0.04 z 100 z … … … 33 z . z 33 z … 18 z
… … 0.8 z 99 z … … … 42 z – z 43 z … 10 z
94.0 100 103.2 100 ** 44 – 44 56 y . y 56 y 23 21
0.03 100 0.04 97 38 – 38 55 100 54 18 12… … … … … … … … … … … …
55.0 96 53.5 97 … … … 83 **,y … … 21 240.1 100 0.1 99 100 – 100 99 100 99 26 22
… … 0.3 ** 100 ** … … … 60 z . z 60 z … 11 **0.3** 99 ** 0.4 ** 99 ** 84 ** – 85 ** 84 ** – ** 85 ** 17 ** 16 **0.2 98 0.2 99 … … … 68 ** 50 ** 68 ** 19 18
… … 0.1 z 100 z … … … 100 z . z 100 z … 7 z
4.8** 93 ** 5.1 95 … … … 84 66 85 42 ** 44265.7 98 297.5 96 … … … 87 **,y … … 20 19
0.1 98 0.1 100 … … … 20 . 20 7 130.1 96 0.1 z 98 z … … … 97 z 100 z 97 z 9 10 z
… … 17.2 99 … … … 91 **,y … … … 2358.3 94 ** 50.7 95 … … … … … … 17 21
3.3 97 5.6 96 … … … 79 … … 20 1825.7 98 26.6 100 98 – 100 100 . 100 19 18
0.1 100 0.1 100 75 – 75 75 . 75 18 128.2 95 7.1 ** 96 ** … … … 75 z 75 **,z 75 **,z 24 27 **
10.2 90 12.3 88 … … … 71 60 72 18 17… … … … … … … … … … … …… … 0.2 99 … … … 32 – 33 … 15
9.2* … 17.0 … … … … 100 z … … 27 * 232.1 99 2.2 **,z 99 **,z 38 41 38 40 y 10 y 40 y 18 16 **,z
… … … … … … … … … … … …… … 6.3 **,z … … … … … … … … 19 **,z
5.5 … 6.5 99 … … … 67 **,y … … 25 21150.1 94 163.3 … … … … … … … 22 22
0.01 100 0.01** 100 ** … … … 100 z . z 100 z 12 11 **0.3 99 0.3 ** 100 ** 100 100 100 100 z 100 z 100 z 21 19 **4.7 97 7.2 97 35 24 36 30 15 30 31 252.1** 97 ** 3.5 97 … … … 54 … … 22 ** 20
DPR KoreaFijiIndonesiaJapanKiribatiLao PDRMacao, ChinaMalaysiaMarshall IslandsMicronesia (Federated States of)MyanmarNauruNew ZealandNiuePalauPapua New GuineaPhilippinesRepublic of KoreaSamoaSingaporeSolomon IslandsThailandTimor-LesteTokelauTongaTuvaluVanuatuViet Nam
AnguillaAntigua and BarbudaArgentinaArubaBahamasBarbadosBelizeBermudaBoliviaBrazilBritish Virgin IslandsCayman IslandsChileColombiaCosta RicaCubaDominicaDominican RepublicEcuadorEl SalvadorGrenadaGuatemalaGuyanaHaitiHondurasJamaicaMexicoMontserratNetherlands AntillesNicaraguaPanama
PRE-PRIMARY EDUCATION
1998/1999
Total teachers
1998/1999
Trained teachers (%) Pupil/teacher ratio
Total(000)
% F
2002/2003
Total(000)
% F Total Male Female
2002/2003 1998/1999 2002/2003
Total Male FemaleCountry or territory
Latin America and the Caribbean
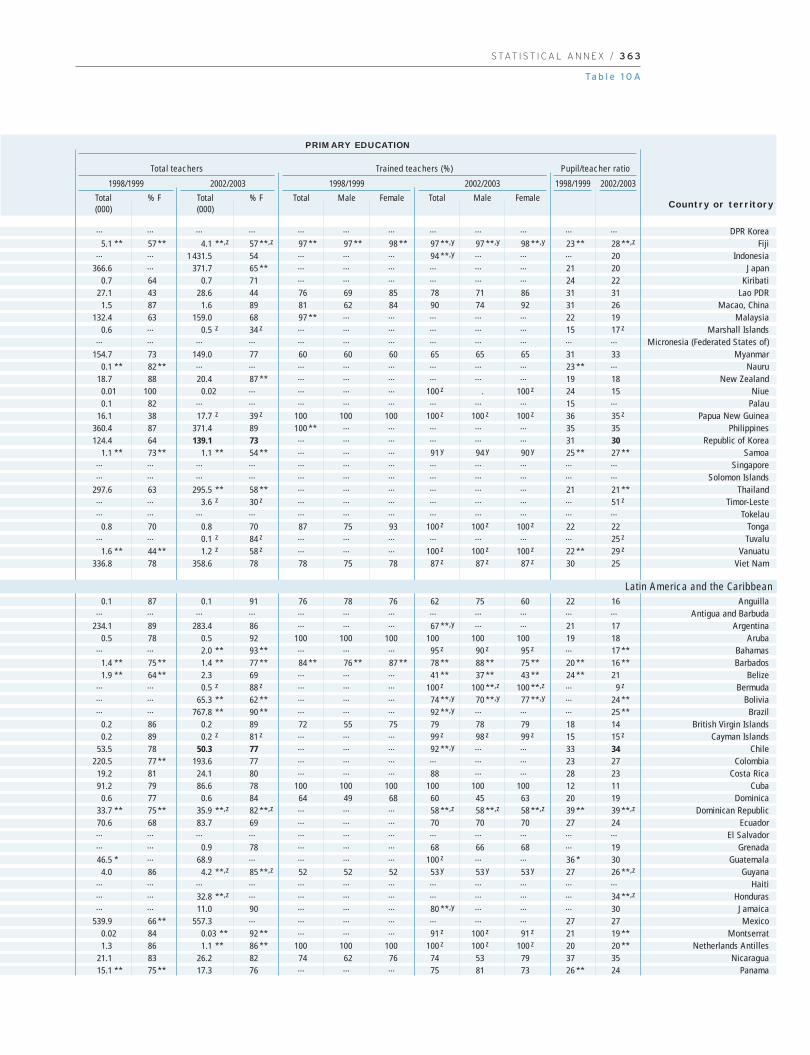
S TAT I S T I C A L A N N E X / 3 6 3
Ta b l e 1 0 A
… … … … … … … … … … … …
5.1 ** 57 ** 4.1 **,z 57 **,z 97 ** 97 ** 98 ** 97 **,y 97 **,y 98 **,y 23 ** 28 **,z
… … 1 431.5 54 … … … 94 **,y … … … 20366.6 … 371.7 65 ** … … … … … … 21 20
0.7 64 0.7 71 … … … … … … 24 2227.1 43 28.6 44 76 69 85 78 71 86 31 31
1.5 87 1.6 89 81 62 84 90 74 92 31 26132.4 63 159.0 68 97 ** … … … … … 22 19
0.6 … 0.5 z 34 z … … … … … … 15 17 z
… … … … … … … … … … … …
154.7 73 149.0 77 60 60 60 65 65 65 31 330.1 ** 82 ** … … … … … … … … 23 ** …
18.7 88 20.4 87 ** … … … … … … 19 180.01 100 0.02 … … … … 100 z . 100 z 24 150.1 82 … … … … … … … … 15 …
16.1 38 17.7 z 39 z 100 100 100 100 z 100 z 100 z 36 35 z
360.4 87 371.4 89 100 ** … … … … … 35 35124.4 64 139.1 73 … … … … … … 31 30
1.1 ** 73 ** 1.1 ** 54 ** … … … 91 y 94 y 90 y 25 ** 27 **… … … … … … … … … … … …… … … … … … … … … … … …
297.6 63 295.5 ** 58 ** … … … … … … 21 21 **… … 3.6 z 30 z … … … … … … … 51 z
… … … … … … … … … … … …
0.8 70 0.8 70 87 75 93 100 z 100 z 100 z 22 22… … 0.1 z 84 z … … … … … … … 25 z
1.6 ** 44 ** 1.2 z 58 z … … … 100 z 100 z 100 z 22 ** 29 z
336.8 78 358.6 78 78 75 78 87 z 87 z 87 z 30 25
0.1 87 0.1 91 76 78 76 62 75 60 22 16… … … … … … … … … … … …
234.1 89 283.4 86 … … … 67 **,y … … 21 170.5 78 0.5 92 100 100 100 100 100 100 19 18
… … 2.0 ** 93 ** … … … 95 z 90 z 95 z … 17 **1.4 ** 75 ** 1.4 ** 77 ** 84 ** 76 ** 87 ** 78 ** 88 ** 75 ** 20 ** 16 **1.9 ** 64 ** 2.3 69 … … … 41 ** 37 ** 43 ** 24 ** 21
… … 0.5 z 88 z … … … 100 z 100 **,z 100 **,z … 9 z
… … 65.3 ** 62 ** … … … 74 **,y 70 **,y 77 **,y … 24 **… … 767.8 ** 90 ** … … … 92 **,y … … … 25 **
0.2 86 0.2 89 72 55 75 79 78 79 18 140.2 89 0.2 z 81 z … … … 99 z 98 z 99 z 15 15 z
53.5 78 50.3 77 … … … 92 **,y … … 33 34220.5 77 ** 193.6 77 … … … … … … 23 27
19.2 81 24.1 80 … … … 88 … … 28 2391.2 79 86.6 78 100 100 100 100 100 100 12 11
0.6 77 0.6 84 64 49 68 60 45 63 20 1933.7 ** 75 ** 35.9 **,z 82 **,z … … … 58 **,z 58 **,z 58 **,z 39 ** 39 **,z
70.6 68 83.7 69 … … … 70 70 70 27 24… … … … … … … … … … … …… … 0.9 78 … … … 68 66 68 … 1946.5 * … 68.9 … … … … 100 z … … 36 * 30
4.0 86 4.2 **,z 85 **,z 52 52 52 53 y 53 y 53 y 27 26 **,z
… … … … … … … … … … … …… … 32.8 **,z … … … … … … … … 34 **,z
… … 11.0 90 … … … 80 **,y … … … 30539.9 66 ** 557.3 … … … … … … … 27 27
0.02 84 0.03 ** 92 ** … … … 91 z 100 z 91 z 21 19 **1.3 86 1.1 ** 86 ** 100 100 100 100 z 100 z 100 z 20 20 **
21.1 83 26.2 82 74 62 76 74 53 79 37 3515.1 ** 75 ** 17.3 76 … … … 75 81 73 26 ** 24
DPR KoreaFiji
IndonesiaJapan
KiribatiLao PDR
Macao, ChinaMalaysia
Marshall IslandsMicronesia (Federated States of)
MyanmarNauru
New ZealandNiue
PalauPapua New Guinea
PhilippinesRepublic of Korea
SamoaSingapore
Solomon IslandsThailand
Timor-LesteTokelau
TongaTuvalu
VanuatuViet Nam
AnguillaAntigua and Barbuda
ArgentinaAruba
BahamasBarbados
BelizeBermuda
BoliviaBrazil
British Virgin IslandsCayman Islands
ChileColombia
Costa RicaCuba
DominicaDominican Republic
EcuadorEl Salvador
GrenadaGuatemala
GuyanaHaiti
HondurasJamaicaMexico
MontserratNetherlands Antilles
NicaraguaPanama
PRIMARY EDUCATION
1998/1999
Total teachers
1998/1999
Trained teachers (%) Pupil/teacher ratio
Total(000)
% F Total(000)
% F
2002/2003
Total Male Female
2002/2003 1998/1999 2002/2003
Total Male FemaleCountry or territory
Latin America and the Caribbean
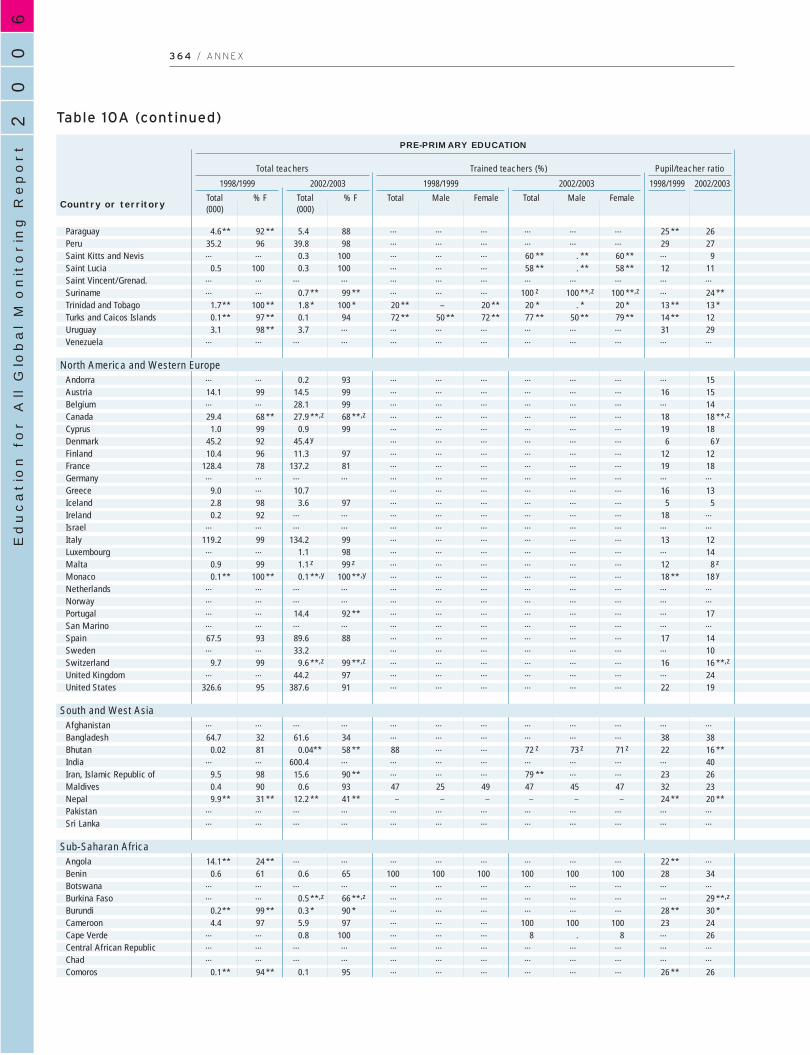
60
02
Education f
or A
ll G
lobal M
onitorin
g R
eport
3 6 4 / A N N E X
Table 10A (continued)
4.6** 92 ** 5.4 88 … … … … … … 25 ** 2635.2 96 39.8 98 … … … … … … 29 27… … 0.3 100 … … … 60 ** . ** 60 ** … 9
0.5 100 0.3 100 … … … 58 ** . ** 58 ** 12 11… … … … … … … … … … … …… … 0.7 ** 99 ** … … … 100 z 100 **,z 100 **,z … 24 **
1.7** 100 ** 1.8 * 100 * 20 ** – 20 ** 20 * . * 20 * 13 ** 13 *0.1** 97 ** 0.1 94 72 ** 50 ** 72 ** 77 ** 50 ** 79 ** 14 ** 123.1 98 ** 3.7 … … … … … … … 31 29
… … … … … … … … … … … …
… … 0.2 93 … … … … … … … 1514.1 99 14.5 99 … … … … … … 16 15… … 28.1 99 … … … … … … … 1429.4 68 ** 27.9 **,z 68 **,z … … … … … … 18 18 **,z
1.0 99 0.9 99 … … … … … … 19 1845.2 92 45.4 y … … … … … … 6 6 y
10.4 96 11.3 97 … … … … … … 12 12128.4 78 137.2 81 … … … … … … 19 18… … … … … … … … … … … …
9.0 … 10.7 … … … … … … 16 132.8 98 3.6 97 … … … … … … 5 50.2 92 … … … … … … … … 18 …
… … … … … … … … … … … …
119.2 99 134.2 99 … … … … … … 13 12… … 1.1 98 … … … … … … … 14
0.9 99 1.1 z 99 z … … … … … … 12 8 z
0.1** 100 ** 0.1 **,y 100 **,y … … … … … … 18 ** 18 y
… … … … … … … … … … … …… … … … … … … … … … … …… … 14.4 92 ** … … … … … … … 17… … … … … … … … … … … …
67.5 93 89.6 88 … … … … … … 17 14… … 33.2 … … … … … … … 10
9.7 99 9.6 **,z 99 **,z … … … … … … 16 16 **,z
… … 44.2 97 … … … … … … … 24326.6 95 387.6 91 … … … … … … 22 19
… … … … … … … … … … … …
64.7 32 61.6 34 … … … … … … 38 380.02 81 0.04** 58 ** 88 … … 72 z 73 z 71 z 22 16 **
… … 600.4 … … … … … … … … 409.5 98 15.6 90 ** … … … 79 ** … … 23 260.4 90 0.6 93 47 25 49 47 45 47 32 239.9** 31 ** 12.2 ** 41 ** – – – – – – 24 ** 20 **
… … … … … … … … … … … …… … … … … … … … … … … …
14.1** 24 ** … … … … … … … … 22 ** …
0.6 61 0.6 65 100 100 100 100 100 100 28 34… … … … … … … … … … … …… … 0.5 **,z 66 **,z … … … … … … … 29 **,z
0.2** 99 ** 0.3 * 90 * … … … … … … 28 ** 30 *4.4 97 5.9 97 … … … 100 100 100 23 24
… … 0.8 100 … … … 8 . 8 … 26… … … … … … … … … … … …… … … … … … … … … … … …
0.1** 94 ** 0.1 95 … … … … … … 26 ** 26
ParaguayPeruSaint Kitts and NevisSaint LuciaSaint Vincent/Grenad.SurinameTrinidad and TobagoTurks and Caicos IslandsUruguayVenezuela
AndorraAustriaBelgiumCanadaCyprusDenmarkFinlandFranceGermanyGreeceIcelandIrelandIsraelItalyLuxembourgMaltaMonacoNetherlandsNorwayPortugalSan MarinoSpainSwedenSwitzerlandUnited KingdomUnited States
AfghanistanBangladeshBhutanIndiaIran, Islamic Republic ofMaldivesNepalPakistanSri Lanka
AngolaBeninBotswanaBurkina FasoBurundiCameroonCape VerdeCentral African RepublicChadComoros
PRE-PRIMARY EDUCATION
1998/1999
Total teachers
1998/1999
Trained teachers (%) Pupil/teacher ratio
Total(000)
% F
2002/2003
Total(000)
% F Total Male Female
2002/2003 1998/1999 2002/2003
Total Male FemaleCountry or territory
North America and Western Europe
South and West Asia
Sub-Saharan Africa
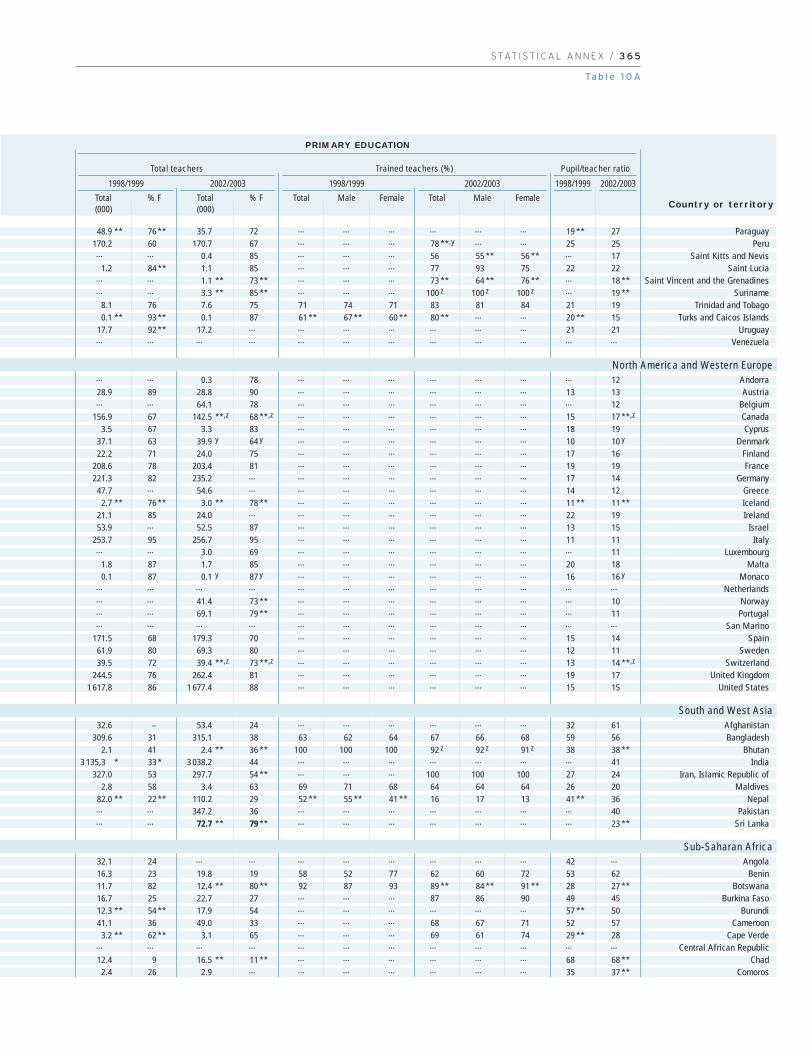
S TAT I S T I C A L A N N E X / 3 6 5
Ta b l e 1 0 A
48.9 ** 76 ** 35.7 72 … … … … … … 19 ** 27170.2 60 170.7 67 … … … 78 **,y … … 25 25… … 0.4 85 … … … 56 55 ** 56 ** … 17
1.2 84 ** 1.1 85 … … … 77 93 75 22 22… … 1.1 ** 73 ** … … … 73 ** 64 ** 76 ** … 18 **… … 3.3 ** 85 ** … … … 100 z 100 z 100 z … 19 **
8.1 76 7.6 75 71 74 71 83 81 84 21 190.1 ** 93 ** 0.1 87 61 ** 67 ** 60 ** 80 ** … … 20 ** 15
17.7 92 ** 17.2 … … … … … … … 21 21… … … … … … … … … … … …
… … 0.3 78 … … … … … … … 1228.9 89 28.8 90 … … … … … … 13 13… … 64.1 78 … … … … … … … 12
156.9 67 142.5 **,z 68 **,z … … … … … … 15 17 **,z
3.5 67 3.3 83 … … … … … … 18 1937.1 63 39.9 y 64 y … … … … … … 10 10 y
22.2 71 24.0 75 … … … … … … 17 16208.6 78 203.4 81 … … … … … … 19 19221.3 82 235.2 … … … … … … … 17 14
47.7 … 54.6 … … … … … … … 14 122.7 ** 76 ** 3.0 ** 78 ** … … … … … … 11 ** 11 **
21.1 85 24.0 … … … … … … … 22 1953.9 … 52.5 87 … … … … … … 13 15
253.7 95 256.7 95 … … … … … … 11 11… … 3.0 69 … … … … … … … 11
1.8 87 1.7 85 … … … … … … 20 180.1 87 0.1 y 87 y … … … … … … 16 16 y
… … … … … … … … … … … …… … 41.4 73 ** … … … … … … … 10… … 69.1 79 ** … … … … … … … 11… … … … … … … … … … … …
171.5 68 179.3 70 … … … … … … 15 1461.9 80 69.3 80 … … … … … … 12 1139.5 72 39.4 **,z 73 **,z … … … … … … 13 14 **,z
244.5 76 262.4 81 … … … … … … 19 171 617.8 86 1 677.4 88 … … … … … … 15 15
32.6 – 53.4 24 … … … … … … 32 61309.6 31 315.1 38 63 62 64 67 66 68 59 56
2.1 41 2.4 ** 36 ** 100 100 100 92 z 92 z 91 z 38 38 **3 135,3 * 33 * 3 038.2 44 … … … … … … … 41
327.0 53 297.7 54 ** … … … 100 100 100 27 242.8 58 3.4 63 69 71 68 64 64 64 26 20
82.0 ** 22 ** 110.2 29 52 ** 55 ** 41 ** 16 17 13 41 ** 36… … 347.2 36 … … … … … … … 40… … 72.7 ** 79 ** … … … … … … … 23 **
32.1 24 … … … … … … … … 42 …
16.3 23 19.8 19 58 52 77 62 60 72 53 6211.7 82 12.4 ** 80 ** 92 87 93 89 ** 84 ** 91 ** 28 27 **16.7 25 22.7 27 … … … 87 86 90 49 4512.3 ** 54 ** 17.9 54 … … … … … … 57 ** 5041.1 36 49.0 33 … … … 68 67 71 52 57
3.2 ** 62 ** 3.1 65 … … … 69 61 74 29 ** 28… … … … … … … … … … … …
12.4 9 16.5 ** 11 ** … … … … … … 68 68 **2.4 26 2.9 … … … … … … … 35 37 **
ParaguayPeru
Saint Kitts and NevisSaint Lucia
Saint Vincent and the GrenadinesSuriname
Trinidad and TobagoTurks and Caicos Islands
UruguayVenezuela
AndorraAustria
BelgiumCanadaCyprus
DenmarkFinlandFrance
GermanyGreeceIcelandIreland
IsraelItaly
LuxembourgMalta
MonacoNetherlands
NorwayPortugal
San MarinoSpain
SwedenSwitzerland
United KingdomUnited States
AfghanistanBangladesh
BhutanIndia
Iran, Islamic Republic ofMaldives
NepalPakistan
Sri Lanka
AngolaBenin
BotswanaBurkina Faso
BurundiCameroon
Cape VerdeCentral African Republic
ChadComoros
PRIMARY EDUCATION
1998/1999
Total teachers
1998/1999
Trained teachers (%) Pupil/teacher ratio
Total(000)
% F Total(000)
% F
2002/2003
Total Male Female
2002/2003 1998/1999 2002/2003
Total Male FemaleCountry or territory
North America and Western Europe
South and West Asia
Sub-Saharan Africa
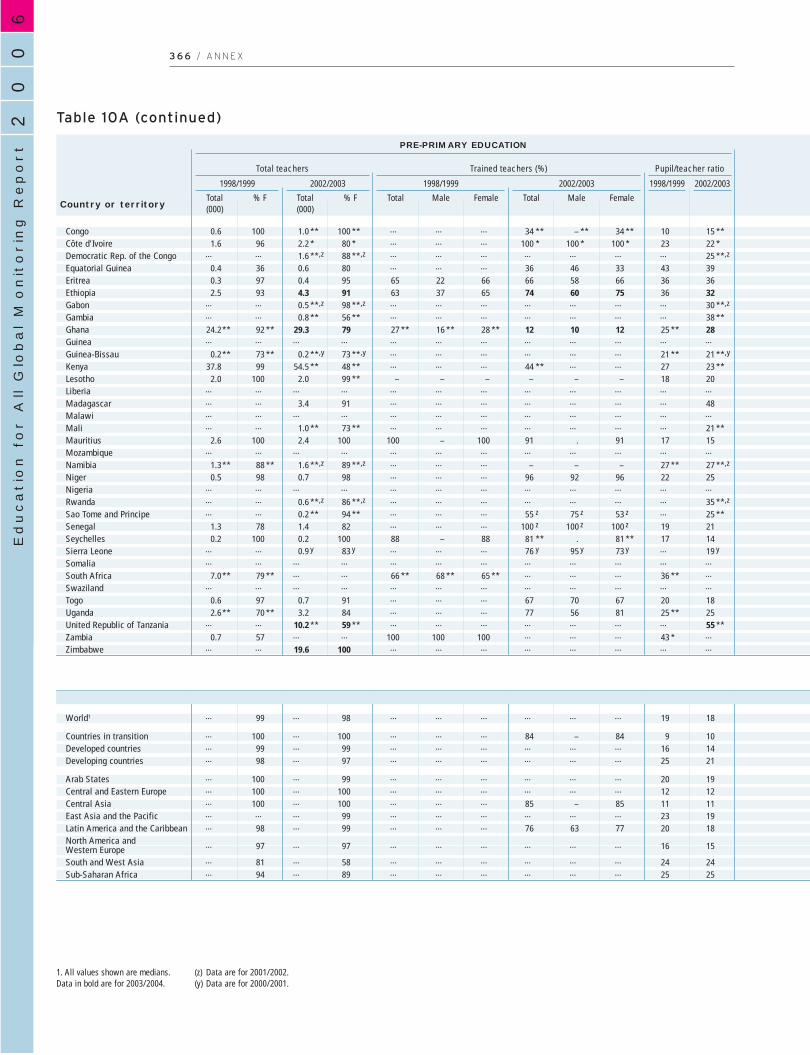
60
02
Education f
or A
ll G
lobal M
onitorin
g R
eport
3 6 6 / A N N E X
Table 10A (continued)
0.6 100 1.0 ** 100 ** … … … 34 ** – ** 34 ** 10 15 **1.6 96 2.2 * 80 * … … … 100 * 100 * 100 * 23 22 *
… … 1.6 **,z 88 **,z … … … … … … … 25 **,z
0.4 36 0.6 80 … … … 36 46 33 43 390.3 97 0.4 95 65 22 66 66 58 66 36 362.5 93 4.3 91 63 37 65 74 60 75 36 32
… … 0.5 **,z 98 **,z … … … … … … … 30 **,z
… … 0.8 ** 56 ** … … … … … … … 38 **24.2** 92 ** 29.3 79 27 ** 16 ** 28 ** 12 10 12 25 ** 28… … … … … … … … … … … …
0.2** 73 ** 0.2 **,y 73 **,y … … … … … … 21 ** 21 **,y
37.8 99 54.5 ** 48 ** … … … 44 ** … … 27 23 **2.0 100 2.0 99 ** – – – – – – 18 20
… … … … … … … … … … … …… … 3.4 91 … … … … … … … 48… … … … … … … … … … … …… … 1.0 ** 73 ** … … … … … … … 21 **
2.6 100 2.4 100 100 – 100 91 . 91 17 15… … … … … … … … … … … …
1.3** 88 ** 1.6 **,z 89 **,z … … … – – – 27 ** 27 **,z
0.5 98 0.7 98 … … … 96 92 96 22 25… … … … … … … … … … … …… … 0.6 **,z 86 **,z … … … … … … … 35 **,z
… … 0.2 ** 94 ** … … … 55 z 75 z 53 z … 25 **1.3 78 1.4 82 … … … 100 z 100 z 100 z 19 210.2 100 0.2 100 88 – 88 81 ** . 81 ** 17 14
… … 0.9 y 83 y … … … 76 y 95 y 73 y … 19 y
… … … … … … … … … … … …
7.0** 79 ** … … 66 ** 68 ** 65 ** … … … 36 ** …… … … … … … … … … … … …
0.6 97 0.7 91 … … … 67 70 67 20 182.6** 70 ** 3.2 84 … … … 77 56 81 25 ** 25
… … 10.2 ** 59 ** … … … … … … … 55 **0.7 57 … … 100 100 100 … … … 43 * …
… … 19.6 100 … … … … … … … …
… 99 … 98 … … … … … … 19 18
… 100 … 100 … … … 84 – 84 9 10… 99 … 99 … … … … … … 16 14… 98 … 97 … … … … … … 25 21
… 100 … 99 … … … … … … 20 19… 100 … 100 … … … … … … 12 12… 100 … 100 … … … 85 – 85 11 11… … … 99 … … … … … … 23 19… 98 … 99 … … … 76 63 77 20 18
… 97 … 97 … … … … … … 16 15
… 81 … 58 … … … … … … 24 24… 94 … 89 … … … … … … 25 25
CongoCôte d’IvoireDemocratic Rep. of the CongoEquatorial GuineaEritreaEthiopiaGabonGambiaGhanaGuineaGuinea-BissauKenyaLesothoLiberiaMadagascarMalawiMaliMauritiusMozambiqueNamibiaNigerNigeriaRwandaSao Tome and PrincipeSenegalSeychellesSierra LeoneSomaliaSouth AfricaSwazilandTogoUgandaUnited Republic of TanzaniaZambiaZimbabwe
World1
Countries in transitionDeveloped countriesDeveloping countries
Arab StatesCentral and Eastern EuropeCentral AsiaEast Asia and the PacificLatin America and the CaribbeanNorth America and Western EuropeSouth and West AsiaSub-Saharan Africa
PRE-PRIMARY EDUCATION
1998/1999
Total teachers
1998/1999
Trained teachers (%) Pupil/teacher ratio
Total(000)
% F
2002/2003
Total(000)
% F Total Male Female
2002/2003 1998/1999 2002/2003
Total Male FemaleCountry or territory
1. All values shown are medians.Data in bold are for 2003/2004.
(z) Data are for 2001/2002.(y) Data are for 2000/2001.
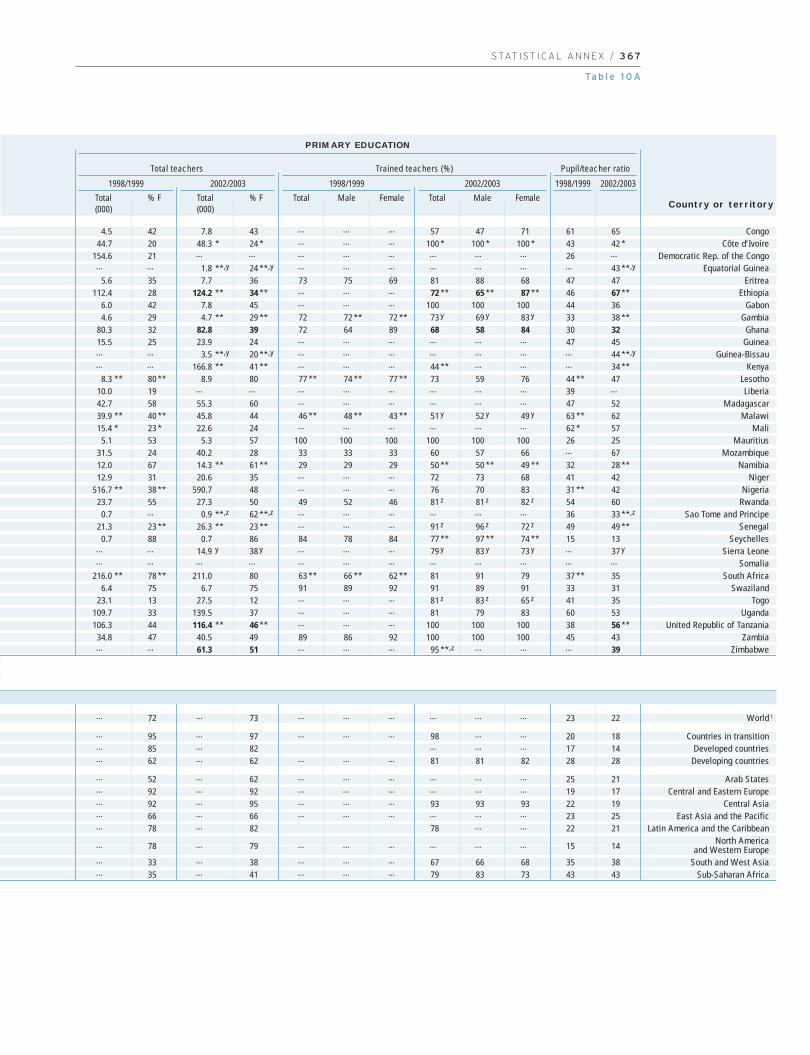
S TAT I S T I C A L A N N E X / 3 6 7
Ta b l e 1 0 A
4.5 42 7.8 43 … … … 57 47 71 61 6544.7 20 48.3 * 24 * … … … 100 * 100 * 100 * 43 42 *
154.6 21 … … … … … … … … 26 …… … 1.8 **,y 24 **,y … … … … … … … 43 **,y
5.6 35 7.7 36 73 75 69 81 88 68 47 47112.4 28 124.2 ** 34 ** … … … 72 ** 65 ** 87 ** 46 67 **
6.0 42 7.8 45 … … … 100 100 100 44 364.6 29 4.7 ** 29 ** 72 72 ** 72 ** 73 y 69 y 83 y 33 38 **
80.3 32 82.8 39 72 64 89 68 58 84 30 3215.5 25 23.9 24 … … … … … … 47 45… … 3.5 **,y 20 **,y … … … … … … … 44 **,y
… … 166.8 ** 41 ** … … … 44 ** … … … 34 **8.3 ** 80 ** 8.9 80 77 ** 74 ** 77 ** 73 59 76 44 ** 47
10.0 19 … … … … … … … … 39 …
42.7 58 55.3 60 … … … … … … 47 5239.9 ** 40 ** 45.8 44 46 ** 48 ** 43 ** 51 y 52 y 49 y 63 ** 6215.4 * 23 * 22.6 24 … … … … … … 62 * 57
5.1 53 5.3 57 100 100 100 100 100 100 26 2531.5 24 40.2 28 33 33 33 60 57 66 … 6712.0 67 14.3 ** 61 ** 29 29 29 50 ** 50 ** 49 ** 32 28 **12.9 31 20.6 35 … … … 72 73 68 41 42
516.7 ** 38 ** 590.7 48 … … … 76 70 83 31 ** 4223.7 55 27.3 50 49 52 46 81 z 81 z 82 z 54 60
0.7 … 0.9 **,z 62 **,z … … … … … … 36 33 **,z
21.3 23 ** 26.3 ** 23 ** … … … 91 z 96 z 72 z 49 49 **0.7 88 0.7 86 84 78 84 77 ** 97 ** 74 ** 15 13
… … 14.9 y 38 y … … … 79 y 83 y 73 y … 37 y
… … … … … … … … … … … …
216.0 ** 78 ** 211.0 80 63 ** 66 ** 62 ** 81 91 79 37 ** 356.4 75 6.7 75 91 89 92 91 89 91 33 31
23.1 13 27.5 12 … … … 81 z 83 z 65 z 41 35109.7 33 139.5 37 … … … 81 79 83 60 53106.3 44 116.4 ** 46 ** … … … 100 100 100 38 56 **
34.8 47 40.5 49 89 86 92 100 100 100 45 43… … 61.3 51 … … … 95 **,z … … … 39
… 72 … 73 … … … … … … 23 22
… 95 … 97 … … … 98 … … 20 18… 85 … 82 … … … 17 14… 62 … 62 … … … 81 81 82 28 28
… 52 … 62 … … … … … … 25 21… 92 … 92 … … … … … … 19 17… 92 … 95 … … … 93 93 93 22 19… 66 … 66 … … … … … … 23 25… 78 … 82 78 … … 22 21
… 78 … 79 … … … … … … 15 14
… 33 … 38 … … … 67 66 68 35 38… 35 … 41 … … … 79 83 73 43 43
CongoCôte d’Ivoire
Democratic Rep. of the CongoEquatorial Guinea
EritreaEthiopia
GabonGambia
GhanaGuinea
Guinea-BissauKenya
LesothoLiberia
MadagascarMalawi
MaliMauritius
MozambiqueNamibia
NigerNigeria
RwandaSao Tome and Principe
SenegalSeychelles
Sierra LeoneSomalia
South AfricaSwaziland
TogoUganda
United Republic of TanzaniaZambia
Zimbabwe
World 1
Countries in transitionDeveloped countries
Developing countries
Arab StatesCentral and Eastern Europe
Central AsiaEast Asia and the Pacific
Latin America and the CaribbeanNorth America
and Western EuropeSouth and West Asia
Sub-Saharan Africa
PRIMARY EDUCATION
1998/1999
Total teachers
1998/1999
Trained teachers (%) Pupil/teacher ratio
Total(000)
% F Total(000)
% F
2002/2003
Total Male Female
2002/2003 1998/1999 2002/2003
Total Male FemaleCountry or territory

60
02
Education f
or A
ll G
lobal M
onitorin
g R
eport
3 6 8 / A N N E X
Table 10BTeaching staff in secondary and tertiary education
… … 170.3 ** 48 ** … … …… … 5.2 **,z 54 **,z … … …
0.7 22 0.7 **,z 23 **,z … … …
454.0** 41 ** 485.2 ** 41 ** … … …
56.1** 69 ** 84.1 … … … …… … … … … … …
22.3** 56 ** 23.7 **,z 56 **,z 100 ** 100 ** 100 **42.1** 51 ** 46.2 53 … … …… … … … … … …
2.4 10 3.2 12 … … …
87.9** 33 ** 97.1 ** 33 ** … … …
12.9 50 16.9 ** 50 ** 100 100 100… … 22.4 46 … … …
4.4** 57 ** 5.1 56 … … …
138.8 55 171.3 49 … … …… … 50.6 ** 55 ** … … …
70.2** 47 ** 62.8 **,y 51 **,y … … …
56.5** 40 ** 58.3 **,z 46 **,z … … …
16.3 55 20.1 54 52 46 5673.8** 19 ** … … … … …
22.2** 54 ** 22.4 56 … … …
106.9 77 105.9 79 … … …… … … … … … …
56.0 73 ** 57.5 77 … … …
33.4 64 36.8 67 100 100 10072.3 62 ** 93.1 67 … … …
11.1 … 12.3 **,z … … … …
100.2 71 94.0 74 … … …
24.8 80 24.8 82 … … …
36.3** 79 ** 41.2 ** 80 ** … … …… … 315.2 ** … … … …
33.0 72 31.0 75 … … …
177.3** 64 ** 164.6 66 … … …… … … … … … …
58.8** 58 ** 55.9 y 61 y 100 ** 100 ** 100 **53.7** 72 ** 51.8 73 … … …
16.8 69 15.8 70 … … …
13.4 49 14.0 52 … … …… … … … … … …… … 367.4 78 … … …
… … 36.0 84 … … …
118.5 63 125.4 65 100 100 10057.8 77 49.0 82 … … …… … 176.1 84 … … …
48.1 68 52.7 71 … … …
11.0 69 14.5 70 … … …
46.9 42 54.9 45 … … …… … … … … … …… … … … … … …
… … … … … … …
3.1* 47 * 3.5 53 … … …
18.1** 27 ** 23.7 30 … … …… … 5 138.0 43 … … …… … … … … … …
AlgeriaBahrainDjiboutiEgyptIraqJordanKuwaitLebanonLibyan Arab JamahiriyaMauritaniaMoroccoOmanPalestinian Autonomous TerritoriesQatarSaudi ArabiaSudanSyrian Arab RepublicTunisiaUnited Arab EmiratesYemen
AlbaniaBelarusBosnia and HerzegovinaBulgariaCroatiaCzech RepublicEstoniaHungaryLatviaLithuaniaPolandRepublic of MoldovaRomaniaRussian FederationSerbia and MontenegroSlovakiaSloveniaThe former Yugoslav Rep. of MacedoniaTurkeyUkraine
ArmeniaAzerbaijanGeorgiaKazakhstanKyrgyzstanMongoliaTajikistanTurkmenistanUzbekistan
AustraliaBrunei DarussalamCambodiaChinaCook Islands
SECONDARY EDUCATION1
1998/1999
Total teachers
1998/1999
Trained teachers (%)
2002/2003
Total(000)
% FTotal(000)
% F Total Male FemaleCountry or territory
Arab States
Central and Eastern Europe
Central Asia
East Asia and the Pacific
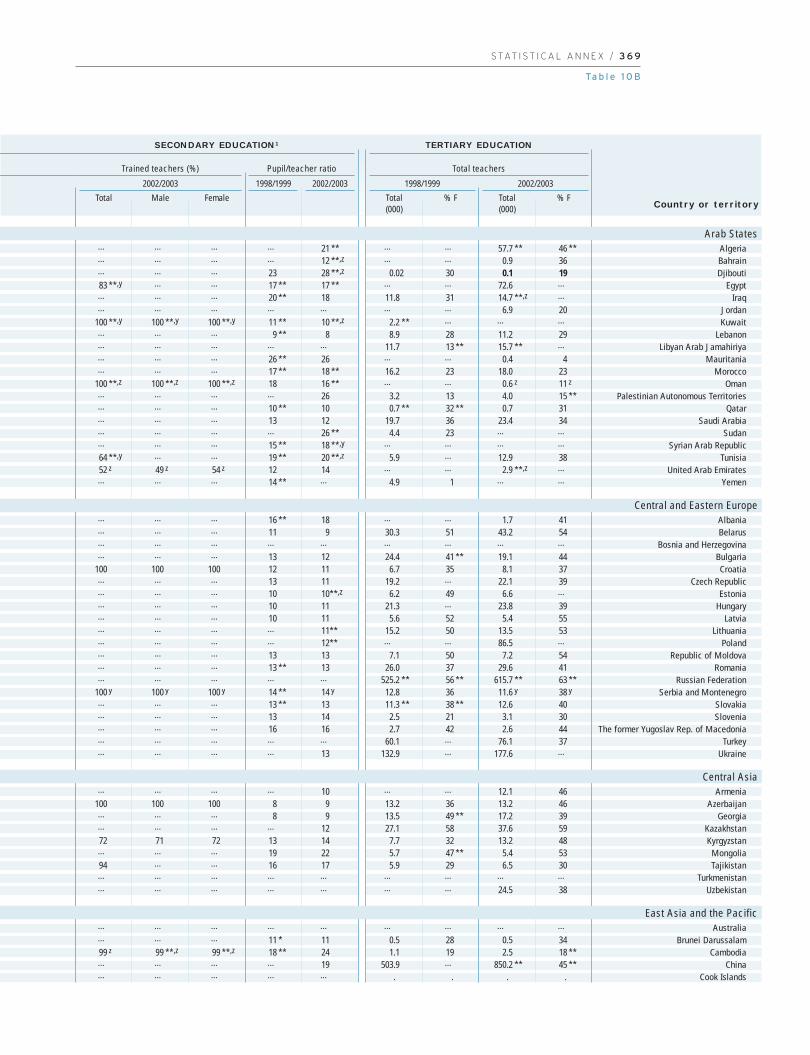
S TAT I S T I C A L A N N E X / 3 6 9
Ta b l e 1 0 B
… … … … 21 ** … … 57.7 ** 46 **… … … … 12 **,z … … 0.9 36… … … 23 28 **,z 0.02 30 0.1 1983 **,y … … 17 ** 17 ** … … 72.6 …… … … 20 ** 18 11.8 31 14.7 **,z …… … … … … … … 6.9 20
100 **,y 100 **,y 100 **,y 11 ** 10 **,z 2.2 ** … … …… … … 9 ** 8 8.9 28 11.2 29… … … … … 11.7 13 ** 15.7 ** …… … … 26 ** 26 … … 0.4 4… … … 17 ** 18 ** 16.2 23 18.0 23
100 **,z 100 **,z 100 **,z 18 16 ** … … 0.6 z 11 z
… … … … 26 3.2 13 4.0 15 **… … … 10 ** 10 0.7 ** 32 ** 0.7 31… … … 13 12 19.7 36 23.4 34… … … … 26 ** 4.4 23 … …… … … 15 ** 18 **,y … … … …
64 **,y … … 19 ** 20 **,z 5.9 … 12.9 3852 z 49 z 54 z 12 14 … … 2.9 **,z …… … … 14 ** … 4.9 1 … …
… … … 16 ** 18 … … 1.7 41… … … 11 9 30.3 51 43.2 54… … … … … … … … …… … … 13 12 24.4 41 ** 19.1 44
100 100 100 12 11 6.7 35 8.1 37… … … 13 11 19.2 … 22.1 39… … … 10 10**,z 6.2 49 6.6 …… … … 10 11 21.3 … 23.8 39… … … 10 11 5.6 52 5.4 55… … … … 11** 15.2 50 13.5 53… … … … 12** … … 86.5 …… … … 13 13 7.1 50 7.2 54… … … 13 ** 13 26.0 37 29.6 41… … … … … 525.2 ** 56 ** 615.7 ** 63 **
100 y 100 y 100 y 14 ** 14 y 12.8 36 11.6 y 38 y
… … … 13 ** 13 11.3 ** 38 ** 12.6 40… … … 13 14 2.5 21 3.1 30… … … 16 16 2.7 42 2.6 44… … … … … 60.1 … 76.1 37… … … … 13 132.9 … 177.6 …
… … … … 10 … … 12.1 46100 100 100 8 9 13.2 36 13.2 46… … … 8 9 13.5 49 ** 17.2 39… … … … 12 27.1 58 37.6 5972 71 72 13 14 7.7 32 13.2 48… … … 19 22 5.7 47 ** 5.4 5394 … … 16 17 5.9 29 6.5 30… … … … … … … … …… … … … … … … 24.5 38
… … … … … … … … …… … … 11 * 11 0.5 28 0.5 3499 z 99 **,z 99 **,z 18 ** 24 1.1 19 2.5 18 **… … … … 19 503.9 … 850.2 ** 45 **… … … … … . . . .
AlgeriaBahrainDjibouti
EgyptIraq
JordanKuwait
LebanonLibyan Arab Jamahiriya
MauritaniaMorocco
OmanPalestinian Autonomous Territories
QatarSaudi Arabia
SudanSyrian Arab Republic
TunisiaUnited Arab Emirates
Yemen
AlbaniaBelarus
Bosnia and HerzegovinaBulgariaCroatia
Czech RepublicEstonia
HungaryLatvia
LithuaniaPoland
Republic of MoldovaRomania
Russian FederationSerbia and Montenegro
SlovakiaSlovenia
The former Yugoslav Rep. of MacedoniaTurkey
Ukraine
ArmeniaAzerbaijan
GeorgiaKazakhstanKyrgyzstan
MongoliaTajikistan
TurkmenistanUzbekistan
AustraliaBrunei Darussalam
CambodiaChina
Cook Islands
SECONDARY EDUCATION1 TERTIARY EDUCATION
1998/1999
Total teachersTrained teachers (%) Pupil/teacher ratio
Total(000)
% F Total(000)
% F
2002/2003
Country or territory
1998/1999 2002/20032002/2003
Total Male Female
Arab States
Central and Eastern Europe
Central Asia
East Asia and the Pacific

60
02
Education f
or A
ll G
lobal M
onitorin
g R
eport
3 7 0 / A N N E X
Table 10B (continued)
… … … … … … …… … 5.8 **,z 49 **,z … … …… … 1 115.1 41 … … …
629.8 … 615.2 31 ** … … …… … … … … … …
11.8 40 13.8 42 98 97 981.4 56 1.8 57 59 50 66
111.2** 60 ** 129.8 63 … … …
0.3 … 0.4 z 39 z … … …… … … … … … …
68.4 76 73.1 78 69 ** 73 ** 69 **… … … … … … …
24.8 64 36.5 z 59 z … … …
0.02 60 0.02 **,z 50 **,z … … …
0.2 51 … … … … …
6.0 35 7.6 z 36 z 100 100 100150.2 76 163.6 51 100 ** … …
192.5 40 206.2 49 … … …
1.1** 56 ** 1.1 ** 59 ** … … …… … … … … … …… … … … … … …
241.7 60 215.8 ** 54 ** … … …… … 1.6 z … … … …… … … … … … …
1.4 32 1.0 **,y 50 **,y 59 45 90… … 0.04z 83 z … … …
0.4** 47 ** 0.4 y 49 y … … …
258.3 65 362.1 65 … … …
0.1** 65 ** 0.1 ** 63 ** 60 ** 65 ** 57 **… … … … … … …
257.8 69 229.2 66 … … …
0.4** 49 ** 0.5 50 100 ** 100 ** 100 **… … 2.1 ** 67 ** … … …
1.2** 58 ** 1.4 ** 59 ** 64 ** 63 ** 64 **0.9** 62 ** 1.2 ** 65 ** … … …
… … 0.7 z 67 z … … …… … 41.0 ** 51 ** … … …… … 1 401.1 79 … … …
0.1** 62 ** 0.2 65 … … …
0.2** 51 ** 0.2 **,z 55 **,z … … …… … 47.1 ** 63 ** … … …
184.6** 50 ** 177.9 50 … … …
12.0 53 15.4 54 … … …
64.9 60 80.4 57 94 94 940.3** 68 ** 0.5 61 30 ** 27 ** 31 **
22.1** 58 ** 24.7 **,z 72 **,z … … …
53.9** 50 ** 73.3 * 49 * … … …… … … … … … …… … 0.7 ** 63 ** … … …
27.2* … 44.4 … … … …
3.6** 63 ** 3.4 ** 70 ** 58 ** 59 ** 58 **… … … … … … …… … … … … … …… … 11.3 67 … … …… … 594.4 … … … …
0.03 ** 69 ** 0.03** 55 ** … … …
1.0 53 1.2 ** 55 ** 100 100 1007.7* 58 * 11.3 * 56 * 44 * 36 * 50 *
14.3** 55 ** 15.6 57 … … …
Democratic People’s Republic of KoreaFijiIndonesiaJapanKiribatiLao People’s Democratic RepublicMacao, ChinaMalaysiaMarshall IslandsMicronesia (Federated States of)MyanmarNauruNew ZealandNiuePalauPapua New GuineaPhilippinesRepublic of KoreaSamoaSingaporeSolomon IslandsThailandTimor-LesteTokelauTongaTuvaluVanuatuViet Nam
AnguillaAntigua and BarbudaArgentinaArubaBahamasBarbadosBelizeBermudaBoliviaBrazilBritish Virgin IslandsCayman IslandsChileColombiaCosta RicaCubaDominicaDominican RepublicEcuadorEl SalvadorGrenadaGuatemalaGuyanaHaitiHondurasJamaicaMexicoMontserratNetherlands AntillesNicaraguaPanama
SECONDARY EDUCATION1
1998/1999
Total teachers
1998/1999
Trained teachers (%)
2002/2003
Total(000)
% FTotal(000)
% F Total Male FemaleCountry or territory
Latin America and the Caribbean
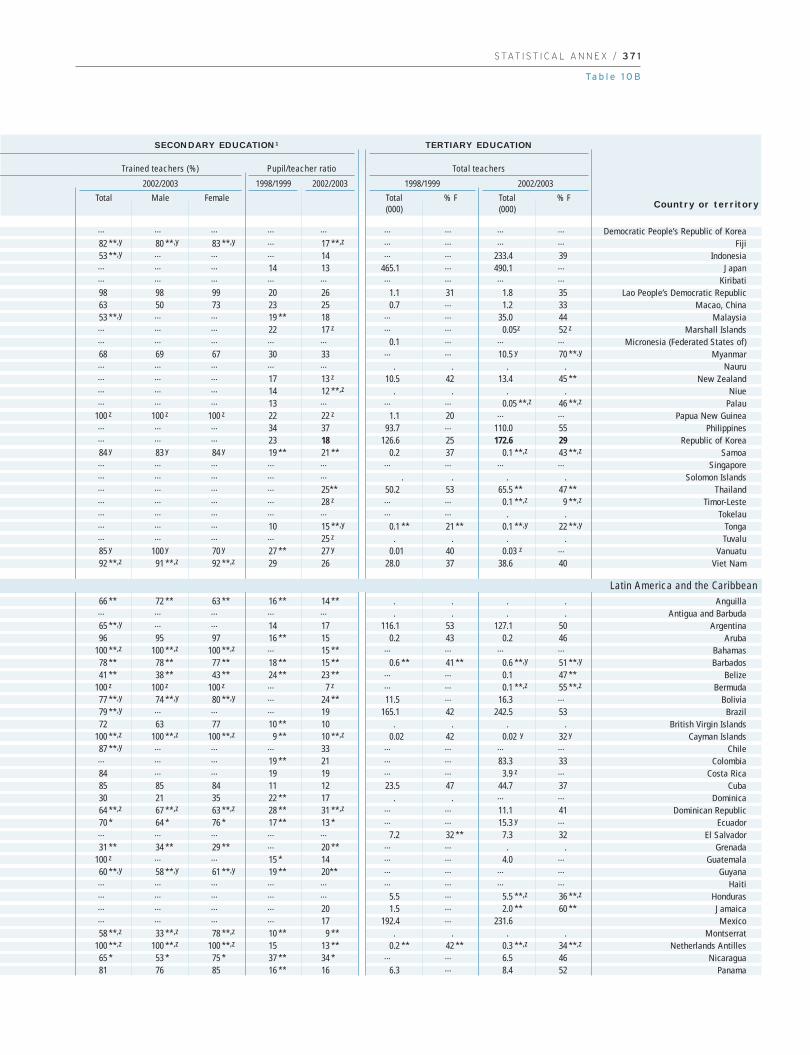
S TAT I S T I C A L A N N E X / 3 7 1
Ta b l e 1 0 B
… … … … … … … … …
82 **,y 80 **,y 83 **,y … 17 **,z … … … …
53 **,y … … … 14 … … 233.4 39… … … 14 13 465.1 … 490.1 …… … … … … … … … …
98 98 99 20 26 1.1 31 1.8 3563 50 73 23 25 0.7 … 1.2 3353 **,y … … 19 ** 18 … … 35.0 44… … … 22 17 z … … 0.05z 52 z
… … … … … 0.1 … … …
68 69 67 30 33 … … 10.5 y 70 **,y
… … … … … . . . .… … … 17 13 z 10.5 42 13.4 45 **… … … 14 12 **,z . . . .… … … 13 … … … 0.05 **,z 46 **,z
100 z 100 z 100 z 22 22 z 1.1 20 … …… … … 34 37 93.7 … 110.0 55… … … 23 18 126.6 25 172.6 2984 y 83 y 84 y 19 ** 21 ** 0.2 37 0.1 **,z 43 **,z
… … … … … … … … …… … … … … . . . .… … … … 25** 50.2 53 65.5 ** 47 **… … … … 28 z … … 0.1 **,z 9 **,z
… … … … … … … . .… … … 10 15 **,y 0.1 ** 21 ** 0.1 **,y 22 **,y
… … … … 25 z . . . .85 y 100 y 70 y 27 ** 27 y 0.01 40 0.03 z …
92 **,z 91 **,z 92 **,z 29 26 28.0 37 38.6 40
66 ** 72 ** 63 ** 16 ** 14 ** . . . .… … … … … . . . .65 **,y … … 14 17 116.1 53 127.1 5096 95 97 16 ** 15 0.2 43 0.2 46
100 **,z 100 **,z 100 **,z … 15 ** … … … …
78 ** 78 ** 77 ** 18 ** 15 ** 0.6 ** 41 ** 0.6 **,y 51 **,y
41 ** 38 ** 43 ** 24 ** 23 ** … … 0.1 47 **100 z 100 z 100 z … 7 z … … 0.1 **,z 55 **,z
77 **,y 74 **,y 80 **,y … 24 ** 11.5 … 16.3 …
79 **,y … … … 19 165.1 42 242.5 5372 63 77 10 ** 10 . . . .
100 **,z 100 **,z 100 **,z 9 ** 10 **,z 0.02 42 0.02 y 32 y
87 **,y … … … 33 … … … …… … … 19 ** 21 … … 83.3 3384 … … 19 19 … … 3.9 z …
85 85 84 11 12 23.5 47 44.7 3730 21 35 22 ** 17 . . … …
64 **,z 67 **,z 63 **,z 28 ** 31 **,z … … 11.1 4170 * 64 * 76 * 17 ** 13 * … … 15.3 y …… … … … … 7.2 32 ** 7.3 3231 ** 34 ** 29 ** … 20 ** … … . .
100 z … … 15 * 14 … … 4.0 …
60 **,y 58 **,y 61 **,y 19 ** 20** … … … …… … … … … … … … …… … … … … 5.5 … 5.5 **,z 36 **,z
… … … … 20 1.5 … 2.0 ** 60 **… … … … 17 192.4 … 231.658 **,z 33 **,z 78 **,z 10 ** 9 ** . . . .
100 **,z 100 **,z 100 **,z 15 13 ** 0.2 ** 42 ** 0.3 **,z 34 **,z
65 * 53 * 75 * 37 ** 34 * … … 6.5 4681 76 85 16 ** 16 6.3 … 8.4 52
Democratic People’s Republic of KoreaFiji
IndonesiaJapan
KiribatiLao People’s Democratic Republic
Macao, ChinaMalaysia
Marshall IslandsMicronesia (Federated States of)
MyanmarNauru
New ZealandNiue
PalauPapua New Guinea
PhilippinesRepublic of Korea
SamoaSingapore
Solomon IslandsThailand
Timor-LesteTokelau
TongaTuvalu
VanuatuViet Nam
AnguillaAntigua and Barbuda
ArgentinaAruba
BahamasBarbados
BelizeBermuda
BoliviaBrazil
British Virgin IslandsCayman Islands
ChileColombia
Costa RicaCuba
DominicaDominican Republic
EcuadorEl Salvador
GrenadaGuatemala
GuyanaHaiti
HondurasJamaicaMexico
MontserratNetherlands Antilles
NicaraguaPanama
SECONDARY EDUCATION1 TERTIARY EDUCATION
1998/1999
Total teachersTrained teachers (%) Pupil/teacher ratio
Total(000)
% F Total(000)
% F
2002/2003
Country or territory
1998/1999 2002/20032002/2003
Total Male Female
Latin America and the Caribbean

60
02
Education f
or A
ll G
lobal M
onitorin
g R
eport
3 7 2 / A N N E X
Table 10B (continued)
… … 43.8 61 … … …
128.4** 41 ** 134.3 44 … … …… … 0.4 ** 67 ** … … …
0.7** 64 ** 0.8 ** 63 ** … … …… … 0.4 ** 59 ** … … …… … 2.7 ** 61 ** … … …
5.4** 59 ** 5.7 ** 61 ** 56 ** 58 ** 54 **0.1** 61 ** 0.1 ** 64 ** … … …
15.9 … 18.4 ** … … … …… … … … … … …
… … 0.4 56 … … …
72.6 57 72.6 60 … … …… … 117.7 57 … … …
136.7 … 148.0 **,z 68 **,z … … …
4.9** 51 ** 5.3 60 … … …
44.2 45 43.9 y 48 y … … …
39.3 64 … … … … …
495.2 57 510.9 58 … … …
532.6 51 595.4 … … … …
74.7 … 83.0 … … … …
2.5** 58 ** 2.8 ** 62 ** … … …… … … … … … …
54.9 … 60.9 71 … … …
422.1 65 428.2 65 … … …… … 3.3 43 … … …
3.6 48 3.8 53 … … …
0.4 61 0.4 y 61 y … … …… … 108.1 43 … … …… … 41.9 58 ** … … …… … 87.3 69 ** … … …… … … … … … …… … 274.8 … … … …
63.1 … 72.1 56 … … …
50.3 39 48.0 **,z 40 **,z … … …
469.5 56 483.8 60 … … …
1 503.9 56 1 599.3 61 … … …
… … … … … … …
251.5 13 320.8 14 28 26 430.5 33 0.9 ** 39 ** 100 100 100
… … 2 490.6 35 … … …
322.0 45 352.5 48 ** … … …
0.7 24 1.7 33 76 75 7939.9 9 52.5 14 … … …… … … … … … …… … 117.9 ** 63 ** … … …
16.0* 33 * … … … … …
9.0** 12 ** 11.9 **,y 11 **,y … … …
8.5 46 … … 80 83 786.2** … 7.6 11 … … …
… … 6.9 21 … … …
26.4** 28 ** 38.8 … … … …… … 2.1 41 … … …… … … … … … …
3.6 5 4.4 **,y 4 **,y … … …… … 3.4 11 … … …
ParaguayPeruSaint Kitts and NevisSaint LuciaSaint Vincent and the GrenadinesSurinameTrinidad and TobagoTurks and Caicos IslandsUruguayVenezuela
AndorraAustriaBelgiumCanadaCyprusDenmarkFinlandFranceGermanyGreeceIcelandIrelandIsraelItalyLuxembourgMaltaMonacoNetherlandsNorwayPortugalSan MarinSpainSwedenSwitzerlandUnited KingdomUnited States
AfghanistanBangladeshBhutanIndiaIran, Islamic Republic ofMaldivesNepalPakistanSri Lanka
AngolaBeninBotswanaBurkina FasoBurundiCameroonCape VerdeCentral African RepublicChadComoros
SECONDARY EDUCATION1
1998/1999
Total teachers
1998/1999
Trained teachers (%)
2002/2003
Total(000)
% FTotal(000)
% F Total Male FemaleCountry or territory
North America and Western Europe
South and West Asia
Sub-Saharan Africa
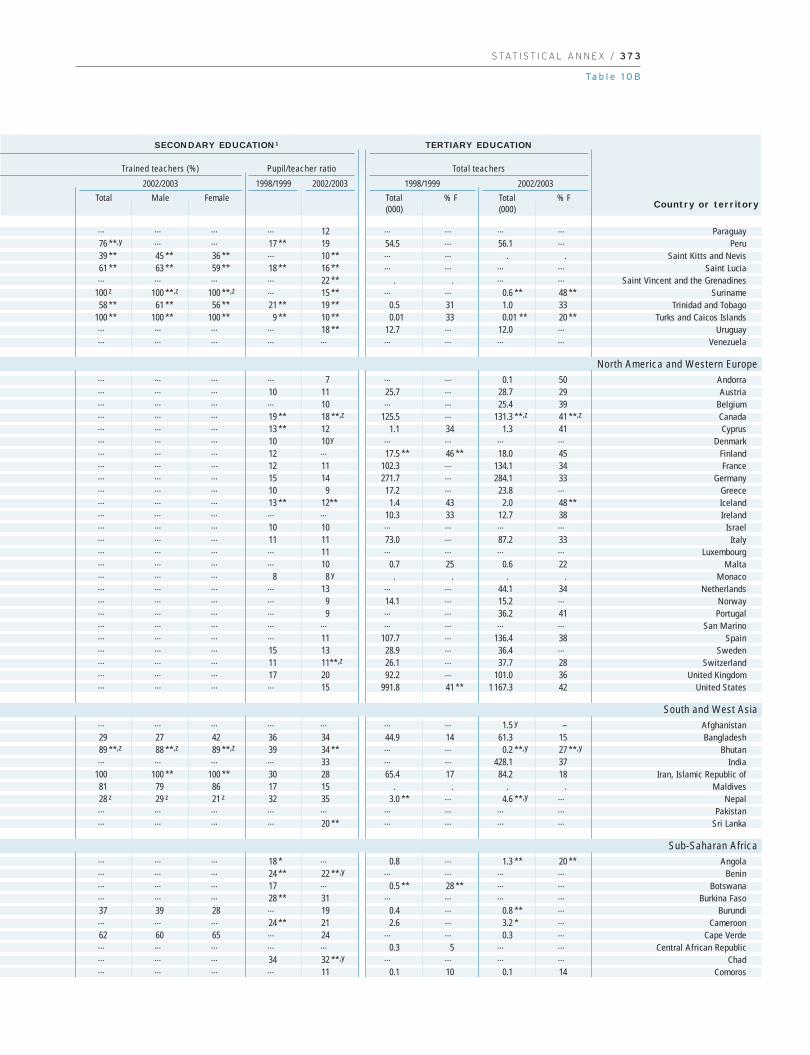
S TAT I S T I C A L A N N E X / 3 7 3
Ta b l e 1 0 B
… … … … 12 … … … …
76 **,y … … 17 ** 19 54.5 … 56.1 …
39 ** 45 ** 36 ** … 10 ** … … . .61 ** 63 ** 59 ** 18 ** 16 ** … … … …… … … … 22 ** . . … …
100 z 100 **,z 100 **,z … 15 ** … … 0.6 ** 48 **58 ** 61 ** 56 ** 21 ** 19 ** 0.5 31 1.0 33
100 ** 100 ** 100 ** 9 ** 10 ** 0.01 33 0.01 ** 20 **… … … … 18 ** 12.7 … 12.0 …… … … … … … … … …
… … … … 7 … … 0.1 50… … … 10 11 25.7 … 28.7 29… … … … 10 … … 25.4 39… … … 19 ** 18 **,z 125.5 … 131.3 **,z 41 **,z
… … … 13 ** 12 1.1 34 1.3 41… … … 10 10y … … … …… … … 12 … 17.5 ** 46 ** 18.0 45… … … 12 11 102.3 … 134.1 34… … … 15 14 271.7 … 284.1 33… … … 10 9 17.2 … 23.8 …… … … 13 ** 12** 1.4 43 2.0 48 **… … … … … 10.3 33 12.7 38… … … 10 10 … … … …… … … 11 11 73.0 … 87.2 33… … … … 11 … … … …… … … … 10 0.7 25 0.6 22… … … 8 8 y . . . .… … … … 13 … … 44.1 34… … … … 9 14.1 … 15.2 …… … … … 9 … … 36.2 41… … … … … … … … …… … … … 11 107.7 … 136.4 38… … … 15 13 28.9 … 36.4 …… … … 11 11**,z 26.1 … 37.7 28… … … 17 20 92.2 … 101.0 36… … … … 15 991.8 41 ** 1 167.3 42
… … … … … … … 1.5 y –29 27 42 36 34 44.9 14 61.3 1589 **,z 88 **,z 89 **,z 39 34 ** … … 0.2 **,y 27 **,y
… … … … 33 … … 428.1 37100 100 ** 100 ** 30 28 65.4 17 84.2 1881 79 86 17 15 . . . .28 z 29 z 21 z 32 35 3.0 ** … 4.6 **,y …… … … … … … … … …… … … … 20 ** … … … …
… … … 18 * … 0.8 … 1.3 ** 20 **… … … 24 ** 22 **,y … … … …… … … 17 … 0.5 ** 28 ** … …… … … 28 ** 31 … … … …
37 39 28 … 19 0.4 … 0.8 ** …… … … 24 ** 21 2.6 … 3.2 * …
62 60 65 … 24 … … 0.3 …… … … … … 0.3 5 … …… … … 34 32 **,y … … … …… … … … 11 0.1 10 0.1 14
ParaguayPeru
Saint Kitts and NevisSaint Lucia
Saint Vincent and the GrenadinesSuriname
Trinidad and TobagoTurks and Caicos Islands
UruguayVenezuela
AndorraAustria
BelgiumCanadaCyprus
DenmarkFinlandFrance
GermanyGreeceIcelandIreland
IsraelItaly
LuxembourgMalta
MonacoNetherlands
NorwayPortugal
San MarinoSpain
SwedenSwitzerland
United KingdomUnited States
AfghanistanBangladesh
BhutanIndia
Iran, Islamic Republic ofMaldives
NepalPakistan
Sri Lanka
AngolaBenin
BotswanaBurkina Faso
BurundiCameroon
Cape VerdeCentral African Republic
ChadComoros
SECONDARY EDUCATION1 TERTIARY EDUCATION
1998/1999
Total teachersTrained teachers (%) Pupil/teacher ratio
Total(000)
% F Total(000)
% F
2002/2003
Country or territory
1998/1999 2002/20032002/2003
Total Male Female
North America and Western Europe
South and West Asia
Sub-Saharan Africa

60
02
Education f
or A
ll G
lobal M
onitorin
g R
eport
3 7 4 / A N N E X
Table 10B (continued)
… … 7.7 **,y 9 **,y … … …
20.1** … … … … … …
89.5 10 … … … … …
0.9** 5 ** … … … … …
2.3 12 3.0 11 56 55 66… … 45.1 ** 9 ** … … …
3.1** 16 ** … … … … …
2.4** 15 ** 2.4 ** 17 ** 66 ** 65 ** 66 **52.2 22 67.9 24 ** 74 70 89
5.8** 11 ** … … … … …… … … … … … …
44.3** 35 ** 48.0 **,y 35 **,y 93 ** 91 ** 96 **3.1** 51 ** 3.5 54 ** 84 ** 85 ** 84 **6.6 16 … … … … …
20.4** 44 ** … … … … …
7.5** 47 ** 11.4 ** 24 ** … … …
7.7* 14 * … … … … …
5.1** 46 ** 5.9 50 … … …… … 14.8 z 19 z … … …
5.1** 47 ** 5.6 ** 58 ** … … …
4.3 18 4.1 19 … … …… … 180.3 38 … … …… … 7.1 19 … … …… … … … … … …
9.4** 14 ** 10.7 **,z 14 **,z … … …
0.6 53 0.5 55 88 85 89… … 5.8 y 27 y … … …… … … … … … …
143.8** 50 ** 146.5 ** 51 ** 89 ** 86 ** 93 **3.4** 46 ** 3.9 ** 47 ** 99 ** 99 ** 99 **6.6 13 … … … … …
… … 31.0 y 21 **,y … … …… … … … … … …
10.0 26 9.9 ** 27 ** … … …… … 34.0 40 … … …
… 51 … 55 … … …
… 70 … 78 … … …… 61 … 61 … … …… 47 … 50 … … …
… 48 … 50 … … …… 70 … 73 … … …… 68 … 71 … … …… 56 … 50 … … …… 58 … 61 … … …… 56 … 59 … … …… 24 … 35 … … …… 22 … 22 … … …
CongoCôte d’IvoireDemocratic Rep. of the CongoEquatorial GuineaEritreaEthiopiaGabonGambiaGhanaGuineaGuinea-BissauKenyaLesothoLiberiaMadagascarMalawiMaliMauritiusMozambiqueNamibiaNigerNigeriaRwandaSao Tome and PrincipeSenegalSeychellesSierra LeoneSomaliaSouth AfricaSwazilandTogoUgandaUnited Republic of TanzaniaZambiaZimbabwe
World
Countries in transitionDeveloped countriesDeveloping countries
Arab States Central and Eastern EuropeCentral AsiaEast Asia and the PacificLatin America and the CaribbeanNorth America and Western EuropeSouth and West AsiaSub-Saharan Africa
SECONDARY EDUCATION1
1998/1999
Total teachers
1998/1999
Trained teachers (%)
2002/2003
Total(000)
% FTotal(000)
% F Total Male FemaleCountry or territory
1. Refers to lower and upper secondary education (ISCED levels 2 and 3).2. All values shown are medians.
Data in bold are for 2003/2004. (z) Data are for 2001/2002.(y) Data are for 2000/2001.
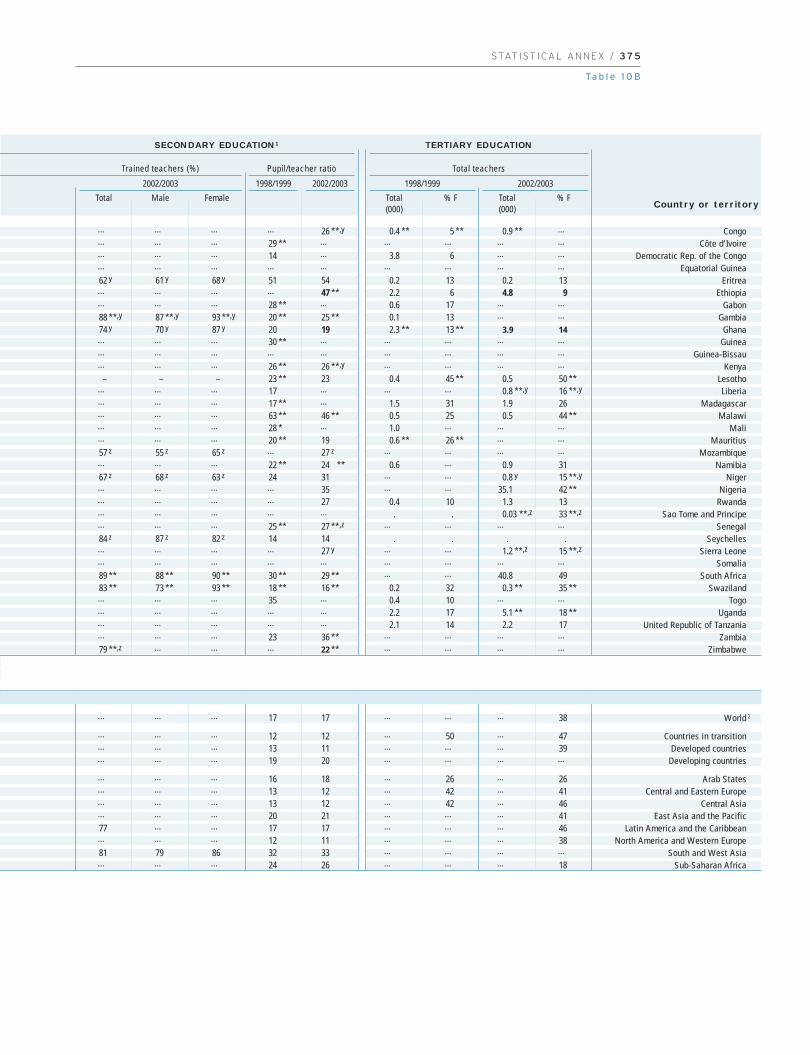
S TAT I S T I C A L A N N E X / 3 7 5
Ta b l e 1 0 B
… … … … 26 **,y 0.4 ** 5 ** 0.9 ** …… … … 29 ** … … … … …… … … 14 … 3.8 6 … …… … … … … … … … …
62 y 61 y 68 y 51 54 0.2 13 0.2 13… … … … 47 ** 2.2 6 4.8 9… … … 28 ** … 0.6 17 … …
88 **,y 87 **,y 93 **,y 20 ** 25 ** 0.1 13 … …
74 y 70 y 87 y 20 19 2.3 ** 13 ** 3.9 14… … … 30 ** … … … … …… … … … … … … … …… … … 26 ** 26 **,y … … … …
– – – 23 ** 23 0.4 45 ** 0.5 50 **… … … 17 … … … 0.8 **,y 16 **,y
… … … 17 ** … 1.5 31 1.9 26… … … 63 ** 46 ** 0.5 25 0.5 44 **… … … 28 * … 1.0 … … …… … … 20 ** 19 0.6 ** 26 ** … …
57 z 55 z 65 z … 27 z … … … …… … … 22 ** 24 ** 0.6 … 0.9 3167 z 68 z 63 z 24 31 … … 0.8 y 15 **,y
… … … … 35 … … 35.1 42 **… … … … 27 0.4 10 1.3 13… … … … … . . 0.03 **,z 33 **,z
… … … 25 ** 27 **,z … … … …
84 z 87 z 82 z 14 14 . . . .… … … … 27 y … … 1.2 **,z 15 **,z
… … … … … … … … …
89 ** 88 ** 90 ** 30 ** 29 ** … … 40.8 4983 ** 73 ** 93 ** 18 ** 16 ** 0.2 32 0.3 ** 35 **… … … 35 … 0.4 10 … …… … … … … 2.2 17 5.1 ** 18 **… … … … … 2.1 14 2.2 17… … … 23 36 ** … … … …
79 **,z … … … 22 ** … … … …
… … … 17 17 … … … 38
… … … 12 12 … 50 … 47… … … 13 11 … … … 39… … … 19 20 … … … …
… … … 16 18 … 26 … 26… … … 13 12 … 42 … 41… … … 13 12 … 42 … 46… … … 20 21 … … … 4177 … … 17 17 … … … 46… … … 12 11 … … … 3881 79 86 32 33 … … … …… … … 24 26 … … … 18
CongoCôte d’Ivoire
Democratic Rep. of the CongoEquatorial Guinea
EritreaEthiopia
GabonGambia
GhanaGuinea
Guinea-BissauKenya
LesothoLiberia
MadagascarMalawi
MaliMauritius
MozambiqueNamibia
NigerNigeria
RwandaSao Tome and Principe
SenegalSeychelles
Sierra LeoneSomalia
South AfricaSwaziland
TogoUganda
United Republic of TanzaniaZambia
Zimbabwe
World 2
Countries in transitionDeveloped countries
Developing countries
Arab StatesCentral and Eastern Europe
Central AsiaEast Asia and the Pacific
Latin America and the CaribbeanNorth America and Western Europe
South and West AsiaSub-Saharan Africa
SECONDARY EDUCATION1 TERTIARY EDUCATION
1998/1999
Total teachersTrained teachers (%) Pupil/teacher ratio
Total(000)
% F Total(000)
% F
2002/2003
Country or territory
1998/1999 2002/20032002/2003
Total Male Female

60
02
Education f
or A
ll G
lobal M
onitorin
g R
eport
3 7 6 / A N N E X
Table 11Private enrolment and education finance
. . . . . . … … … … … … … …
100 99 19 22 13 15 … … … … … … … 1 731 **100 77 9 15 14 21 3.4** … … … … … … …
54 48**,z 7** 8**,y 4** … … … … … … … … …
. . . . . . … … … … … … … …
100 97 z 29 29 17 16 6.2** … … … … … 216 23924 32 32 31 27** 27 … … … … … … … …
78 76 66 64 55 51 … 2.7 … 12.3 … 96.5 … …
. 15** . 3** . 3** … … … … … … … …… … 2 4 … 9 4.0** … 16.6** … … … … …
100 100 4 5 5 5 6.1 6.6 26.1 26.4 90.8 92.3 210 217100 100 5 4 0.9 1 4.3 4.8** … … 93.1 87.3** 800 880 **100 100 9 8 5 4 … … … … … … … …
100 96 37 43 26 32 … … … … 93.9* … … …
50 48 6 7 5 8 8.2 … … … … … … …
90** 90 2** 4 9** 13** … … … … … … … …
67 71 4 4 5 4 … … … … … … … 13188 86 z 0.7 0.9 8 4 7.9 6.7 … 18.2z … 88.4 … 346 **68 70 44 54 31 38 … … … 22.5** … 93.2** … 1 53237 45 1 2 1 2 … 10.3**,z … 32.8y … … … …
. 2 y . 2 . 3 … … … … … … … …
. . 0.1 0.1 0.04 0.1 6.0** 6.0**,y … … … … … …… … … … … … … … … … … … … …
0.1 0.3 0.3 0.4 0.6 0.8 3.3 3.6z … … … 98.9**,z 223 305 **,z
5 8 0.1 0.2 0.7 1 … 4.6 … 10.0 … 90.2 … 1 054 **2 2 0.8 1 6 7 4.0 4.6 … 9.6z 85.4 89.8 623 8140.7 1 1 2 1 2 6.4 6.0 … … … 86.1 605 9353 4 5 5 6 10 4.9 5.8 … 14.1y 91.3** 90.0 932 ** 1 2871 3 1 0.9 0.8 1 6.3 5.8 … … … 94.2**,y … 677 **,y
… 0.3 … 0.3 … 0.3 … 6.0 … … … 95.9 … …
3 6 … 1 … 6 5.1 5.7 … 12.8 … 93.8 … 1 121… 0.8 … 1 … 1 … 4.5 … 21.4 … 92.7 … 65 **… 1 … 0.1 … 0.6 3.6** 3.6 … … … 90.9 … 211 **… 2** 0.3 0.4 … 0.3** 3.8** 3.8 … 11.5z … … … …
. . . . 0.01 0.02 y … 3.3y … … 94.8 … 733 …
0.4 0.7 4 4 5 6 … 4.4 … 7.5z … 94.4 … 5201 1 0.1 0.1 0.8 2 … … … … … … … …
. . . . … 0.5 … 3.5 … … … … … …
6 3.0 … 2** … 2** 2.9 3.7z … … … 94.4**,z … 286 **,z
0.04 0.3 0.3 0.4 … 0.4 4.5 5.5 14.6 20.3 97.1 … 77 ** …
… 2 … 0.9 … 0.7** … 3.1** … … … 98.6z … 36 **,z
– 0.1 – 0.1 – 0.3 3.4 3.4 22.0 20.7 99.2** 98.0 … 54 **0.1 – 0.5 3 0.7 3 2.0 2.2 10.4 11.8 … … … …
10 5 0.5 0.6 0.8 0.8 … 3.2 … … … … … …
1 1 0.2 0.3 0.2 0.2 5.2 3.2** … 18.6z 95.2 98.7** … …
4 3**,z 0.5 2 0.1 2 6.5 8.6 … … … 95.1 … 157. . . . . . 2.6 2.9 … 17.8 … 96.0 … …
… … … … … … … … … … … … … …
. . . . . . … … … … … … … …
… 66 27 28 24 24 z 4.9 5.0 … … 95.9** 96.0 2 844 ** 3 34666 65 36 35 12 11 3.0 … 9.3** 9.1**,y 94.8 98.3y … …
22 ** 24 2 0.9 0.6** 0.4z 1.3 1.9 10.2 15.3z 63.8 95.3z 7 18 z
AlgeriaBahrainDjiboutiEgyptIraqJordanKuwaitLebanonLibyan Arab JamahiriyaMauritaniaMoroccoOmanPalestinian A. T.QatarSaudi ArabiaSudanSyrian Arab RepublicTunisiaUnited Arab EmiratesYemen
AlbaniaBelarusBosnia and HerzegovinaBulgariaCroatiaCzech RepublicEstoniaHungaryLatviaLithuaniaPolandRepublic of MoldovaRomaniaRussian FederationSerbia and MontenegroSlovakiaSloveniaTFYR MacedoniaTurkeyUkraine
ArmeniaAzerbaijanGeorgiaKazakhstanKyrgyzstanMongoliaTajikistanTurkmenistanUzbekistan
AustraliaBrunei DarussalamCambodia
EDUCATION FINANCEPRIVATE ENROLMENT AS %
OF TOTAL ENROLMENT
Public current expenditure on primary
education per pupil (unit cost)
in constant 2002 US$
Public currentexpenditure oneducation as % of total publicexpenditure
on education
Total publicexpenditure
on education as % of total governmentexpenditure
Total publicexpenditure
on education as % of GNP
Secondaryeducation
Primaryeducation
Pre-primaryeducation
1998 20021998/1999
2002/2003
1998/1999
2002/2003
1998/1999
2002/2003 1998 2002 1998 2002 1998 2002Country or territory
123456789
1011121314151617181920
2122232425262728293031323334353637383940
414243444546474849
505152
Arab States
Central and Eastern Europe
Central Asia
East Asia and the Pacific
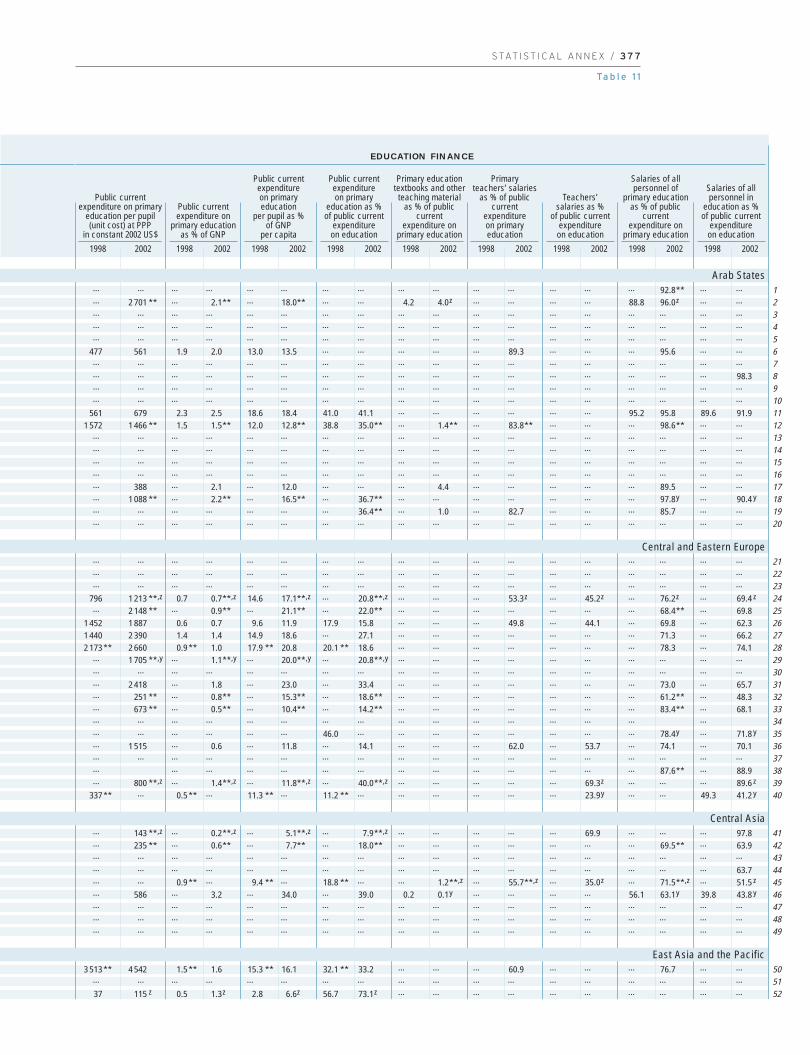
S TAT I S T I C A L A N N E X / 3 7 7
Ta b l e 1 1
… … … … … … … … … … … … … … … 92.8** … …… 2 701 ** … 2.1** … 18.0** … … 4.2 4.0z … … … … 88.8 96.0z … …… … … … … … … … … … … … … … … … … …… … … … … … … … … … … … … … … … … …… … … … … … … … … … … … … … … … … …
477 561 1.9 2.0 13.0 13.5 … … … … … 89.3 … … … 95.6 … …… … … … … … … … … … … … … … … … … …… … … … … … … … … … … … … … … … … 98.3… … … … … … … … … … … … … … … … … …… … … … … … … … … … … … … … … … … …
561 679 2.3 2.5 18.6 18.4 41.0 41.1 … … … … … … 95.2 95.8 89.6 91.91 572 1 466 ** 1.5 1.5** 12.0 12.8** 38.8 35.0** … 1.4** … 83.8** … … … 98.6** … …
… … … … … … … … … … … … … … … … … …… … … … … … … … … … … … … … … … … …… … … … … … … … … … … … … … … … … …… … … … … … … … … … … … … … … … … …… 388 … 2.1 … 12.0 … … … 4.4 … … … … … 89.5 … …… 1 088 ** … 2.2** … 16.5** … 36.7** … … … … … … … 97.8y … 90.4 y
… … … … … … … 36.4** … 1.0 … 82.7 … … … 85.7 … …… … … … … … … … … … … … … … … … … …
… … … … … … … … … … … … … … … … … …… … … … … … … … … … … … … … … … … …… … … … … … … … … … … … … … … … … …
796 1 213 **,z 0.7 0.7**,z 14.6 17.1**,z … 20.8**,z … … … 53.3z … 45.2z … 76.2z … 69.4 z
… 2 148 ** … 0.9** … 21.1** … 22.0** … … … … … … … 68.4** … 69.81 452 1 887 0.6 0.7 9.6 11.9 17.9 15.8 … … … 49.8 … 44.1 … 69.8 … 62.31 440 2 390 1.4 1.4 14.9 18.6 … 27.1 … … … … … … … 71.3 … 66.22 173 ** 2 660 0.9 ** 1.0 17.9 ** 20.8 20.1 ** 18.6 … … … … … … … 78.3 … 74.1
… 1 705 **,y … 1.1**,y … 20.0**,y … 20.8**,y … … … … … … … … … …… … … … … … … … … … … … … … … … … …… 2 418 … 1.8 … 23.0 … 33.4 … … … … … … … 73.0 … 65.7… 251 ** … 0.8** … 15.3** … 18.6** … … … … … … … 61.2** … 48.3… 673 ** … 0.5** … 10.4** … 14.2** … … … … … … … 83.4** … 68.1… … … … … … … … … … … … … … … …… … … … … … 46.0 … … … … … … … … 78.4y … 71.8 y
… 1 515 … 0.6 … 11.8 … 14.1 … … … 62.0 … 53.7 … 74.1 … 70.1… … … … … … … … … … … … … … … … … …… … … … … … … … … … … … … … 87.6** … 88.9… 800 **,z … 1.4**,z … 11.8**,z … 40.0**,z … … … … … 69.3z … … … 89.6 z
337 ** … 0.5 ** … 11.3 ** … 11.2 ** … … … … … … 23.9y … … 49.3 41.2 y
… 143 **,z … 0.2**,z … 5.1**,z … 7.9**,z … … … … … 69.9 … … … 97.8… 235 ** … 0.6** … 7.7** … 18.0** … … … … … … … 69.5** … 63.9… … … … … … … … … … … … … … … … … …… … … … … … … … … … … … … … … … … 63.7… … 0.9 ** … 9.4 ** … 18.8 ** … … 1.2**,z … 55.7**,z … 35.0z … 71.5**,z … 51.5 z
… 586 … 3.2 … 34.0 … 39.0 0.2 0.1y … … … … 56.1 63.1y 39.8 43.8 y
… … … … … … … … … … … … … … … … … …… … … … … … … … … … … … … … … … … …… … … … … … … … … … … … … … … … … …
3 513 ** 4 542 1.5 ** 1.6 15.3 ** 16.1 32.1 ** 33.2 … … … 60.9 … … … 76.7 … …… … … … … … … … … … … … … … … … … …
37 115 z 0.5 1.3z 2.8 6.6z 56.7 73.1z … … … … … … … … … …
EDUCATION FINANCE
Public current expenditure on primary
education per pupil (unit cost) at PPP
in constant 2002 US$
Public currentexpenditure on
primary educationas % of GNP
Public currentexpenditure on primaryeducation
per pupil as % of GNP
per capita
Public currentexpenditure on primary
education as % of public current
expenditure on education
Primary educationtextbooks and other
teaching material as % of public
current expenditure on
primary education
Primary teachers’ salaries
as % of publiccurrent
expenditure on primaryeducation
Teachers’ salaries as %
of public currentexpenditure
on education
Salaries of allpersonnel of
primary educationas % of public
current expenditure on
primary education
Salaries of allpersonnel in
education as % of public current
expenditure on education
1998 2002 1998 2002 1998 2002 1998 2002 1998 2002 1998 2002 1998 2002 1998 20021998 2002
1234567891011121314151617181920
2122232425262728293031323334353637383940
414243444546474849
505152
Arab States
Central and Eastern Europe
Central Asia
East Asia and the Pacific
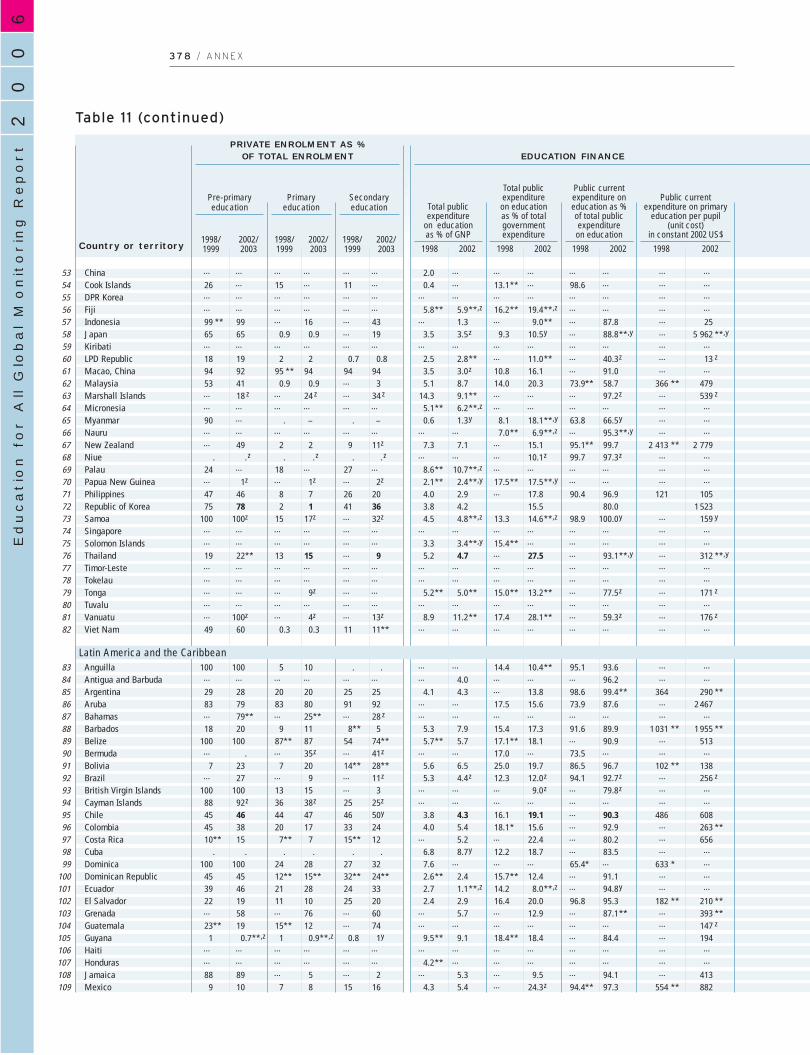
60
02
Education f
or A
ll G
lobal M
onitorin
g R
eport
3 7 8 / A N N E X
Table 11 (continued)
… … … … … … 2.0 … … … … … … …
26 … 15 … 11 … 0.4 … 13.1** … 98.6 … … …… … … … … … … … … … … … … …… … … … … … 5.8** 5.9**,z 16.2** 19.4**,z … … … …
99 ** 99 … 16 … 43 … 1.3 … 9.0** … 87.8 … 2565 65 0.9 0.9 … 19 3.5 3.5z 9.3 10.5y … 88.8**,y … 5 962 **,y
… … … … … … … … … … … … … …
18 19 2 2 0.7 0.8 2.5 2.8** … 11.0** … 40.3z … 13 z
94 92 95 ** 94 94 94 3.5 3.0z 10.8 16.1 … 91.0 … …
53 41 0.9 0.9 … 3 5.1 8.7 14.0 20.3 73.9** 58.7 366 ** 479… 18 z … 24 z … 34 z 14.3 9.1** … … … 97.2z … 539 z
… … … … … … 5.1** 6.2**,z … … … … … …
90 … . – . – 0.6 1.3y 8.1 18.1**,y 63.8 66.5y … …… … … … … … … … 7.0** 6.9**,z … 95.3**,y … …… 49 2 2 9 11z 7.3 7.1 … 15.1 95.1** 99.7 2 413 ** 2 779
. .z . .z . .z … … … 10.1z 99.7 97.3z … …
24 … 18 … 27 … 8.6** 10.7**,z … … … … … …… 1z … 1z … 2z 2.1** 2.4**,y 17.5** 17.5**,y … … … …
47 46 8 7 26 20 4.0 2.9 … 17.8 90.4 96.9 121 10575 78 2 1 41 36 3.8 4.2 15.5 80.0 1 523
100 100z 15 17z … 32z 4.5 4.8**,z 13.3 14.6**,z 98.9 100.0y … 159 y
… … … … … … … … … … … … … …… … … … … … 3.3 3.4**,y 15.4** … … … … …
19 22** 13 15 … 9 5.2 4.7 … 27.5 … 93.1**,y … 312 **,y
… … … … … … … … … … … … … …… … … … … … … … … … … … … …… … … 9z … … 5.2** 5.0** 15.0** 13.2** … 77.5z … 171 z
… … … … … … … … … … … … … …… 100z … 4z … 13z 8.9 11.2** 17.4 28.1** … 59.3z … 176 z
49 60 0.3 0.3 11 11** … … … … … … … …
100 100 5 10 . . … … 14.4 10.4** 95.1 93.6 … …… … … … … … … 4.0 … … … 96.2 … …
29 28 20 20 25 25 4.1 4.3 … 13.8 98.6 99.4** 364 290 **83 79 83 80 91 92 … … 17.5 15.6 73.9 87.6 … 2 467… 79** … 25** … 28 z … … … … … … … …
18 20 9 11 8** 5 5.3 7.9 15.4 17.3 91.6 89.9 1 031 ** 1 955 **100 100 87** 87 54 74** 5.7** 5.7 17.1** 18.1 … 90.9 … 513… . … 35z … 41z … … 17.0 … 73.5 … … …
7 23 7 20 14** 28** 5.6 6.5 25.0 19.7 86.5 96.7 102 ** 138… 27 … 9 … 11z 5.3 4.4z 12.3 12.0z 94.1 92.7z … 256 z
100 100 13 15 … 3 … … … 9.0z … 79.8z … …
88 92z 36 38z 25 25z … … … … … … … …
45 46 44 47 46 50y 3.8 4.3 16.1 19.1 … 90.3 486 60845 38 20 17 33 24 4.0 5.4 18.1* 15.6 … 92.9 … 263 **10** 15 7** 7 15** 12 … 5.2 … 22.4 … 80.2 … 656
. . . . . . 6.8 8.7y 12.2 18.7 … 83.5 … …
100 100 24 28 27 32 7.6 … … … 65.4* … 633 * …
45 45 12** 15** 32** 24** 2.6** 2.4 15.7** 12.4 … 91.1 … …
39 46 21 28 24 33 2.7 1.1**,z 14.2 8.0**,z … 94.8y … …
22 19 11 10 25 20 2.4 2.9 16.4 20.0 96.8 95.3 182 ** 210 **… 58 … 76 … 60 … 5.7 … 12.9 … 87.1** … 393 **23** 19 15** 12 … 74 … … … … … … … 147 z
1 0.7**,z 1 0.9**,z 0.8 1y 9.5** 9.1 18.4** 18.4 … 84.4 … 194… … … … … … … … … … … … … …… … … … … … 4.2** … … … … … … …
88 89 … 5 … 2 … 5.3 … 9.5 … 94.1 … 4139 10 7 8 15 16 4.3 5.4 … 24.3z 94.4** 97.3 554 ** 882. . 38.0 38.7 ** . . … … 6.8 ** 3.3 z 58.9 94.0 z … …
ChinaCook IslandsDPR KoreaFijiIndonesiaJapanKiribatiLPD RepublicMacao, ChinaMalaysiaMarshall IslandsMicronesia MyanmarNauruNew ZealandNiuePalauPapua New GuineaPhilippinesRepublic of KoreaSamoaSingaporeSolomon IslandsThailandTimor-LesteTokelauTongaTuvaluVanuatuViet Nam
AnguillaAntigua and BarbudaArgentinaArubaBahamasBarbadosBelizeBermudaBoliviaBrazilBritish Virgin IslandsCayman IslandsChileColombiaCosta RicaCubaDominicaDominican RepublicEcuadorEl SalvadorGrenadaGuatemalaGuyanaHaitiHondurasJamaicaMexicoMontserrat
EDUCATION FINANCEPRIVATE ENROLMENT AS %
OF TOTAL ENROLMENT
Public current expenditure on primary
education per pupil (unit cost)
in constant 2002 US$
Public currentexpenditure oneducation as % of total publicexpenditure
on education
Total publicexpenditure
on education as % of total governmentexpenditure
Total publicexpenditure
on education as % of GNP
Secondaryeducation
Primaryeducation
Pre-primaryeducation
1998 2002 1998 2002 1998 2002 1998 2002Country or territory
535455565758596061626364656667686970717273747576777879808182
8384858687888990919293949596979899
100101102103104105106107108109110
Latin America and the Caribbean
1998/1999
2002/2003
1998/1999
2002/2003
1998/1999
2002/2003

S TAT I S T I C A L A N N E X / 3 7 9
Ta b l e 1 1
… … … … … … … … … … … … … … … … … …… … 0.2 … … … 53.0 … … … … … … … … … … …… … … … … … … … … … … … … … … … … …… … … … … … … … … … … … … … … … … …… 98 … 0.4 … 3.2 … 38.7 … … … 78.3 … 80.7 … 80.8 … 89.6… 4 124 **,y … 1.1**,y … 18.9**,y … 35.3**,y … … … … … … … 88.1z … 86.5 z
… … … … … … … … … … … … … … … … … …… 68 z … 0.7z … 4.5z … 54.3z … … … … … … … … … …… … … … … … … … … … … … … … … 88.9 … …
858 ** 1 119 1.4 ** 1.6 10.7 ** 13.0 37.5 ** 31.8 … … … 71.2 … 55.6 … 83.8 … 67.3… … … 4.0z … 23.0z … 45.0z … 1.7z … 68.6z … 59.6z … 78.9z … 76.9 z
… … … … … … … … … … … … … … … … … …… … … … … … … … … … … … … … … … … …… … … … … … … 45.6**,y … … … … … … … … … …
3 014 ** 4 062 1.8 ** 1.8 19.0 ** 19.2 26.7 ** 25.5 … … … … … … … … … …… … … … … … 31.9 29.1z … … … … … … … … … …… … … … … … … … … … … … … … … … … …… … … … … … … … … … … … … … … … … …
496 449 2.2 1.6 12.6 9.9 59.8 57.6 … … … 87.5y … 83.0y … 92.0 … 89.62 580 … 1.2 … 13.2 … 34.2 … … … 63.8 … 56.1 … 73.2 … 68.0
… 596 y … 1.8y … 11.2y … 42.9y … … … … … … … … … …… … … … … … … … … … … … … … … … … …… … … … … … … … … … … … … … … … … …… 985 **,y … 1.7**,y … 16.4**,y … 33.6**,y … … … … … … … … … …… … … … … … … … … … … … … … … … … …… … … … … … … … … … … … … … … … … …… 807 z … 2.2z … 13.2z … 59.1z … … … … … … … … … …… … … … … … … … … … … … … … … … … …… 472 z … 2.8z … 15.4z … 43.9z … 1.2z … 98.8z … 94.5z … 98.8z … 97.9 z
… … … … … … … … … … … … … … … … … …
… … … … … … 26.1 39.5 6.0 4.8 78.0 91.2 … 85.9 90.4 95.2 … 91.6… … … 1.1 … … … 28.3 … 0.4 … 90.1 … 69.5 … 93.5 … 73.3
551 1 173 ** 1.4 1.5** 10.8 11.7** 35.2 35.4** … … … 59.9 … 68.4 … 89.3 … 89.6… … … … … … 31.2 29.3 … … … … … … … 95.9 … 94.8… … … … … … … … … … … … … … … … … …
1 630 ** 3 173 ** 1.2 ** 1.8** 11.1 ** 21.6** 24.4 ** 25.9** 0.1 1.5** … … … … 93.9 75.0** 98.1 77.9… 936 … 2.8 … 15.1 … 54.8 … 0.8y … … … … … 97.5** … 77.3 ** … … … … … … 43.0 … … … … … … … … … … …
224 ** 383 2.0 ** 2.8 11.3 ** 15.8 40.8 ** 44.9 … … … … … … … … … …… 663 z 1.6 1.2z … 10.6z 32.8 29.5z … … … … … … … 78.7z … 80.3 z
… … … … … … … 29.5z … … … … … … … 96.1z … …… … … … … … … … … … … … … … … … … …
864 1 452 1.5 1.6 12.5 14.6 … 40.5 … … … … … … … 72.2 … 66.4… 906 ** … 1.8** … 14.8** … 35.2** … … … … … 91.0z … … … …… 1 357 … 2.2 … 16.5 … 52.2 … … … … … … … … … …… … … 2.9**,y … 32.0**,y … 34.4 … 1.3 … … … … … 70.6 … 60.1
935 * … 3.0 * … 19.1 * … 61.0 * … … … … … … … … … … …… … … 1.1**,z … 6.4**,z … 45.5**,z … 1.7z … … … 65.6 … 79.7z … 82.2… … … … … … … … … … … … … … … … … 82.4 y
402 ** 462 ** 1.3 ** 1.5** 8.6 ** 9.7** 58.1 ** 53.4** … … … … … … … 75.1** … 73.5… 705 ** … 1.7** … 10.6** … 35.3** … – … 93.5 … 79.6 … 96.1 … 90.8… 330 z … 1.3z … 7.7z … … … 1.8z … … … … … 89.1z … 97.5 y
… 884 … 3.2 … 22.2 … 42.4 … … … 63.5 … 61.5 … 63.5 … 64.2… … … … … … … … … … … … … … … … … …… … … … … … … … … … … … … … … … … …… 547 … 1.7 … 13.8 … 34.5 … … … 77.4 … 63.1z … 85.5 … 79.5 z
1 011 ** 1 252 1.5 ** 2.1 9.5 ** 14.2 35.6 ** 39.3 … … … 85.7 … 77.6 … 95.9 … 90.9… … … … … … … 19.7z … 1.6z 87.6 79.9**,z 78.6 45.3**,z 100.0 92.5z 93.4 56.5z
EDUCATION FINANCE
Public current expenditure on primary
education per pupil (unit cost) at PPP
in constant 2002 US$
Public currentexpenditure on
primary educationas % of GNP
Public currentexpenditure on primaryeducation
per pupil as % of GNP
per capita
Public currentexpenditure on primary
education as % of public current
expenditure on education
Primary educationtextbooks and other
teaching material as % of public
current expenditure on
primary education
Primary teachers’ salaries
as % of publiccurrent
expenditure on primaryeducation
Teachers’ salaries as %
of public currentexpenditure
on education
Salaries of allpersonnel of
primary educationas % of public
current expenditure on
primary education
Salaries of allpersonnel in
education as % of public current
expenditure on education
1998 2002 1998 2002 1998 2002 1998 2002 1998 2002 1998 2002 1998 2002 1998 20021998 2002
535455565758596061626364656667686970717273747576777879808182
8384858687888990919293949596979899100101102103104105106107108109110
Latin America and the Caribbean

60
02
Education f
or A
ll G
lobal M
onitorin
g R
eport
3 8 0 / A N N E X
Table 11 (continued)
75 75** 74 73** 79 81** … … 14.1** 12.8z … 93.4z … …
17 ** 16 16 ** 16 32 ** 29 3.0 3.2 8.2 15.0 … 90.8 … 5723 ** 18 10 ** 10 16 ** 15 5.3** 4.6 … 7.7 96.1** 96.5z 535 ** 425 z
32 28 15 ** 16 29 26 4.5 4.4 … 11.4 … 95.7 … 112… 16 … 14 … 17 3.3 3.1 … 17.1 86.2 93.8 136 134… 61 … 15 … 3 6.0 3.7 13.8 7.9** … 99.7 … 603
100 100 2 ** 3 … 5** 8.1 8.2** 20.7 … 81.4 … … …… … … 5 … 33 4.9 10.5 6.5 20.3 … 93.0 … 604… 46** … 48** … 21** … … … … … … … …
100 ** 100* 5 28 8 ** 28** 3.5 4.6** 13.1 13.4z 90.2 90.6z 581 994 **,z
47 64 18 24 9 12** … … 13.6 16.5 91.1 78.7 … …
23 19 15 13 … 11 2.6 2.6 … 9.6 … 100.0**,z … 441 **,z
20 17 15 14 30 25 … … … … … … … …
… 2 … 1 … 4 … … … … … … … …
25 26 4 4 8 9 6.4 5.8 … 11.1z 93.0** 96.2 5 481 ** 5 68356 53 55 54 … 57 … 6.2 … … … … … 4 382 **,z
5 8**,z 5 6**,z 6 6**,z 6.0 5.4y … 12.7y 98.4** 98.1**,y … …
54 42 4 5 10 12 … 6.4 … … … 88.4 … 2 757… … 11 11z 12 11z 8.4 8.6 … 15.4z 95.2** 93.6 7 475 ** 7 10010 8 1 1 6 8 … 6.4 … 12.7z … 92.4 … 3 97713 13 15 15 25 25 5.8 5.6 … 11.4y 87.6 91.6 3 345 3 80954 59 2 3 7 7 4.7 4.6z … 9.5z 91.9** 92.7**,z 3 739 ** 3 778 **,z
3 3 7 8 5 6 3.3 … … … 80.2** … 1 253 ** …
5 8 1 1 4 4 7.4 7.8** … … 87.5** 89.5** … 6 42945 … 0.9 0.9 0.4 0.7 5.0 6.8 … 13.5y 93.3** 89.7 2 593 ** 4 201
7 4 … . … . 7.7 7.8 … … 91.5** 94.2 3 076 ** 3 42630 31 7 7 6 5 4.8 4.8 … 10.3z 95.3** 93.4 4 325 ** 4 775
5 5 7 7 … 18 … … … … … … … …
37 38 36 37 … 28 4.9 4.6 … … 90.3 95.6 908 1 49726 25y 31 30y 23 25y … … … … … 93.5y … …
69 69 68 69 85 83 4.9 5.2 … 10.7z 95.7** 94.6 3 545 ** 4 18340 40 1 2 7 6 7.6 7.6 … 16.2y 89.6 92.5 10 409 ** 7 595 **52 49 9 11 12 15 … … … 12.7z … … … …… . … . … . … … … … … … … …
32 35 33 33 28 29 4.6 4.5 … 11.3z 91.1** 91.4 2 500 ** 2 80910 14 3 5 2 4z 7.8 7.7 … 12.8z … 100.0**,z … 6 013 **,z
6 7 3 4 8 7 5.0 5.5** … 15.1y 90.2** 91.0** 7 769 ** 8 069 **6 7 5 5 53 58 4.6 5.2z 11.4 11.5z … … …
34 40 12 11 10 9 5.4 5.6z … 17.1y … … … 7 516 **,y
… … … … … … … … … … … … … …… … 36 39 95 96 2.3 2.3 15.7 15.5 63.7 84.5 13 24
100 100*,z 2 1z – 0.3**,z … 5.9y … 12.9y … 67.6y … …… 4 … 17 … 42 3.2 4.1y 12.6 12.7y … 99.5**,y … 58 **,z
… 8 … 4** … 6** 4.6 4.9 18.7 17.7 90.9 89.9 … 17927 41 … 2 … 11 3.9** … 11.2** … 76.4** … … …… 80 … 15 … 28 2.9** 3.4 12.5** 14.9 73.6** 76.8 16 ** 18 **… 25 … 29 … 25** 1.9** 1.8**,y 8.5** 7.8**,y … … … …… … … 2** … 2** 3.1 … … … 82.7** … … …
23 … 5 … 18 * … 3.2 3.4**,z … … 88.7 93.7**,z … …
20 31**,z 7 6 18 19 2.5 3.3** … … … … … 36 **… … 4 5** 6 4** … 2.3y … 25.6y … … … 147 y
34 … 11 13 33 34**,z … … … … … … … …
49 60 0.8** 1** … … 4.0** 4.0 … 13.0 … 90.9 … 10
Netherlands AntillesNicaraguaPanamaParaguayPeruSaint Kitts and NevisSaint LuciaSaint Vincent/Grenad.SurinameTrinidad and TobagoTurks and Caicos IslandsUruguayVenezuela
AndorraAustriaBelgiumCanadaCyprusDenmarkFinlandFranceGermanyGreeceIcelandIrelandIsraelItalyLuxembourgMaltaMonacoNetherlandsNorwayPortugalSan MarinoSpainSwedenSwitzerlandUnited KingdomUnited States
AfghanistanBangladeshBhutanIndiaIran, Islamic Republic ofMaldivesNepalPakistanSri Lanka
AngolaBeninBotswanaBurkina FasoBurundi
EDUCATION FINANCEPRIVATE ENROLMENT AS %
OF TOTAL ENROLMENT
Public current expenditure on primary
education per pupil (unit cost)
in constant 2002 US$
Public currentexpenditure oneducation as % of total publicexpenditure
on education
Total publicexpenditure
on education as % of total governmentexpenditure
Total publicexpenditure
on education as % of GNP
Secondaryeducation
Primaryeducation
Pre-primaryeducation
1998 2002 1998 2002 1998 2002 1998 2002Country or territory
111112113114115116117118119120121122123
124125126127128129130131132133134135136137138139140141142143144145146147148149
150151152153154155156157158
159160161162163
North America and Western Europe
South and West Asia
Sub-Saharan Africa
1998/1999
2002/2003
1998/1999
2002/2003
1998/1999
2002/2003

S TAT I S T I C A L A N N E X / 3 8 1
Ta b l e 1 1
… … … … … … … … … … … … … … … … … …… 187 … 1.3 … 7.8 … 46.4 … 10.2 … … … … … 85.0 … 88.2
784 ** 645 z 1.9 ** 1.5z 14.1 ** 11.3z 38.3 ** 34.6z … … … … … … … 90.6 … 86.0… 518 … 2.0 … 11.7 … 46.6 … … … 74.3 … 74.8 … 85.2 … 88.1
275 318 1.1 1.0 6.7 6.5 40.4 36.1 … … … 89.1z … 80.5z … 93.7 … 82.8… 966 … 1.3 … 7.9 … 33.7 0.7 0.6**,z 80.0 76.1**,z 78.9 73.3**,z 90.2 80.9**,z 88.6 85.4 z
… … … … … … … … … … … … … … … … … …… 1 070 … 3.3 … 21.0 … 33.6 … 1.5 … 93.7 … 48.7 … 93.8 … 48.9… … … … … … … … … … … … … … … … … …
946 1 270 **,z 1.3 1.7z 9.6 15.3**,z 41.3 41.9z 0.3 … 85.5 … 57.0 … 86.9 93.1z 85.9 87.3 z
… … … … … … … 18.6** … 1.7** 75.0 ** 67.9** 55.1 70.8 83.3 ** 83.3** 57.9 80.3… 691 **,z … 1.2**,z … 11.2**,z … 37.2**,z … … … 45.0 … 46.1 … 58.9 … 62.1… … … … … … … … … … … … … … … … … …
… … … … … … … … … 1.2 … 92.6 … 79.2 … 98.8 … 98.85 243 ** 6 549 1.1 ** 1.1 23.8 ** 23.4 19.3 ** 19.7 … … … 67.1 … 59.8 … 74.0 … 73.9
… 5 399 **,z … 1.3**,z … 17.9**,z … … … … … 63.3 … 63.8 … 87.9 … 84.9… … … … … … … … … … … … … 51.4y … … … 73.7 y
… … 1.7 … 19.4 … 30.3 … … … 79.8 … 80.4 … 89.9 … 89.46 143 ** 6 827 1.8 ** 1.8 25.2 ** 22.4 22.2 ** 21.7 … … … 51.3 … 50.9 … 78.6 … 78.3
… 4 117 … 1.2 … 16.3 … 20.8 … … … 57.7 … 48.7 … 67.9 … 65.23 106 4 262 1.0 1.0 15.2 16.4 19.9 20.2 … … … … … … … 82.0 … 80.83 446 ** 4 511 **,z 0.8 ** 0.6**,z 16.5 ** 15.5**,z 17.5 ** 14.9**,z … … … … … … … 83.7z … 82.4 z
1 593 ** … 0.7 ** … 12.0 ** … 26.9 ** … … … … … … 75.9z … … … …… 6 429 … 2.4 … 22.3 … 35.1** … … … … … … … 74.4 … 73.4 z
2 613 ** 4 930 1.5 ** 2.0 12.4 ** 17.3 32.8 ** 32.5 … … … 79.8 … 68.2 … 89.9 … 80.03 291 ** 4 237 2.4 ** 2.6 19.2 ** 21.2 34.1 ** 35.4 … … … … … … … 72.5 … 72.64 797 ** 6 148 1.1 ** 1.2 22.8 ** 24.1 25.1 ** 26.1 … … … 71.8 … 60.6 … 82.1 … 77.3
… … … … … … … … … … … 75.5 … 70.0z … 85.4 … 86.4 z
1 560 2 709 1.0 1.1 10.5 13.4 21.7 24.7 … … … 60.5 … 59.9 … 93.4 … 85.8… … … … … … … 16.2y … … … … … … 99.3 98.7y 98.7 97.6 y
3 582 ** 4 703 1.2 ** 1.4 14.8 ** 17.0 25.2 ** 27.8 … … … … … … … 68.6 … 70.610 045 ** 6 622 ** 2.4 ** 1.7** 26.2 ** 18.0** 35.7 ** 24.5** … … … … … … … 79.6** … 76.0
… … … … … … … … … … … … … … … … … …… … … … … … … … … … … … … … … … … …
3 061 ** 3 776 1.1 ** 1.1 17.9 ** 18.4 27.4 ** 27.1 … … … 78.0 … 72.5 … 86.7 … 83.9… 6 177 **,z … 2.0**,z … 22.7**,z … 27.3**,z … … … 52.6 … … … 70.9 … 63.9 z
5 651 ** 6 600 ** 1.4 ** 1.5** 19.5 ** 20.5** 31.6 ** 30.5** … … … 71.3 … 67.2 … 84.4 … 83.1… … … … … … … … … … … 51.1z … 54.3z … 75.0z … 75.7 z
… 7 423 **,y … 1.8**,y … 20.8**,y … … … … … 55.5z … 47.6z … 81.1z … 74.2 z
… … … … … … … … … … … … … … … … … …
51 114 0.6 0.8 4.2 6.8 38.9 43.3 … … … … … … … … … …… … … … … … … … … … … … … … … … … …… 321 **,z … 1.4**,z … 12.4**,z … 37.6**,y … … … 87.5y … … … 92.6y … 93.9 y
… 727 … 1.1 … 10.7 … 25.0 … … … … … … … … … …… … … … … … … … … … … … … … … … … …
88 ** 108 ** 1.1 ** 1.3** 7.5 ** 8.0** 52.7 ** 49.1** … … … … … … … … … …… … … … … … … … … … … … … … … … … …… … … … … … … … … … … … … … … … … …
… … … … … … … … … … … … … … … … … …… 94 ** … 1.7** … 8.9** … … … … … … … … … … … …… 345 y … 1.1y … 5.7y … … … … … … … … … … … …… … … … … … … … … … … … … … … … … …… 64 … 1.5 … 11.0 … 40.5 … … … … … … … 99.6 … 80.4
EDUCATION FINANCE
Public current expenditure on primary
education per pupil (unit cost) at PPP
in constant 2002 US$
Public currentexpenditure on
primary educationas % of GNP
Public currentexpenditure on primaryeducation
per pupil as % of GNP
per capita
Public currentexpenditure on primary
education as % of public current
expenditure on education
Primary educationtextbooks and other
teaching material as % of public
current expenditure on
primary education
Primary teachers’ salaries
as % of publiccurrent
expenditure on primaryeducation
Teachers’ salaries as %
of public currentexpenditure
on education
Salaries of allpersonnel of
primary educationas % of public
current expenditure on
primary education
Salaries of allpersonnel in
education as % of public current
expenditure on education
1998 2002 1998 2002 1998 2002 1998 2002 1998 2002 1998 2002 1998 2002 1998 20021998 2002
111112113114115116117118119120121122123
124125126127128129130131132133134135136137138139140141142143144145146147148149
150151152153154155156157158
159160161162163
North America and Western Europe
South and West Asia
Sub-Saharan Africa
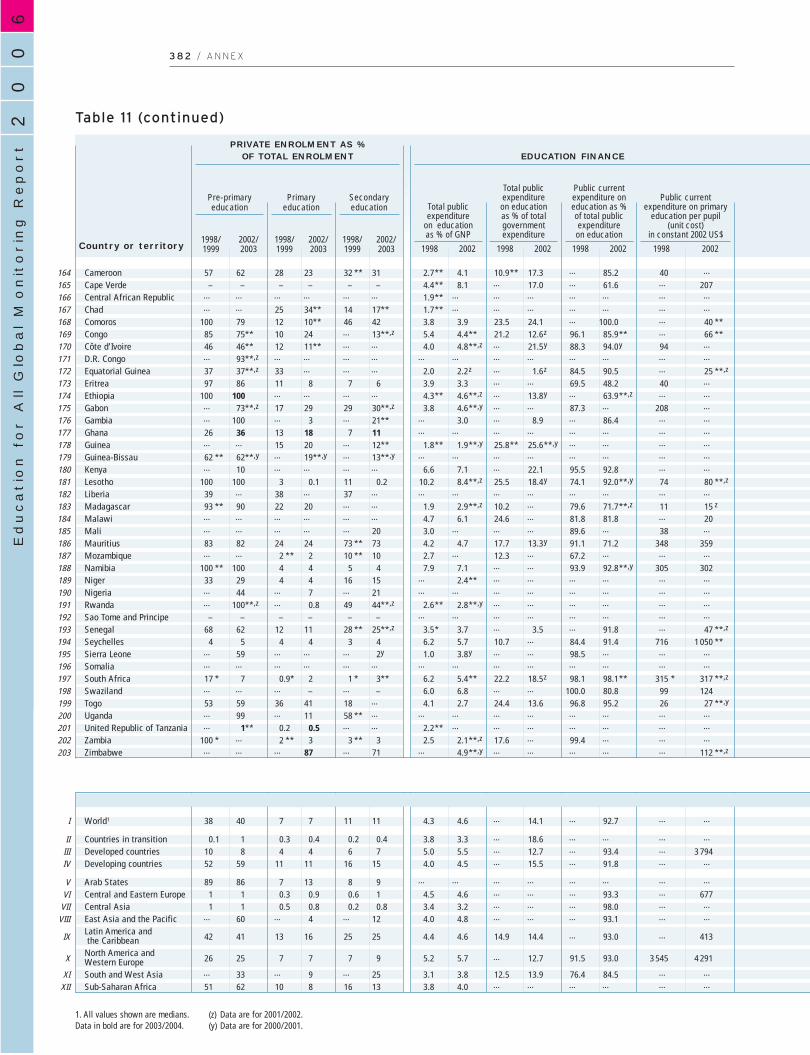
60
02
Education f
or A
ll G
lobal M
onitorin
g R
eport
3 8 2 / A N N E X
Table 11 (continued)
57 62 28 23 32 ** 31 2.7** 4.1 10.9** 17.3 … 85.2 40 …
– – – – – – 4.4** 8.1 … 17.0 … 61.6 … 207… … … … … … 1.9** … … … … … … …… … 25 34** 14 17** 1.7** … … … … … … …
100 79 12 10** 46 42 3.8 3.9 23.5 24.1 … 100.0 … 40 **85 75** 10 24 … 13**,z 5.4 4.4** 21.2 12.6z 96.1 85.9** … 66 **46 46** 12 11** … … 4.0 4.8**,z … 21.5y 88.3 94.0y 94 …… 93**,z … … … … … … … … … … … …
37 37**,z 33 … … … 2.0 2.2z … 1.6z 84.5 90.5 … 25 **,z
97 86 11 8 7 6 3.9 3.3 … … 69.5 48.2 40 …
100 100 … … … … 4.3** 4.6**,z … 13.8y … 63.9**,z … …… 73**,z 17 29 29 30**,z 3.8 4.6**,y … … 87.3 … 208 …… 100 … 3 … 21** … 3.0 … 8.9 … 86.4 … …
26 36 13 18 7 11 … … … … … … … …… … 15 20 … 12** 1.8** 1.9**,y 25.8** 25.6**,y … … … …
62 ** 62**,y … 19**,y … 13**,y … … … … … … … …… 10 … … … … 6.6 7.1 … 22.1 95.5 92.8 … …
100 100 3 0.1 11 0.2 10.2 8.4**,z 25.5 18.4y 74.1 92.0**,y 74 80 **,z
39 … 38 … 37 … … … … … … … … …
93 ** 90 22 20 … … 1.9 2.9**,z 10.2 … 79.6 71.7**,z 11 15 z
… … … … … … 4.7 6.1 24.6 … 81.8 81.8 … 20… … … … … 20 3.0 … … … 89.6 … 38 …
83 82 24 24 73 ** 73 4.2 4.7 17.7 13.3y 91.1 71.2 348 359… … 2 ** 2 10 ** 10 2.7 … 12.3 … 67.2 … … …
100 ** 100 4 4 5 4 7.9 7.1 … … 93.9 92.8**,y 305 30233 29 4 4 16 15 … 2.4** … … … … … …… 44 … 7 … 21 … … … … … … … …… 100**,z … 0.8 49 44**,z 2.6** 2.8**,y … … … … … …
– – – – – – … … … … … … … …
68 62 12 11 28 ** 25**,z 3.5* 3.7 … 3.5 … 91.8 … 47 **,z
4 5 4 4 3 4 6.2 5.7 10.7 … 84.4 91.4 716 1 050 **… 59 … … … 2y 1.0 3.8y … … 98.5 … … …… … … … … … … … … … … … … …
17 * 7 0.9* 2 1 * 3** 6.2 5.4** 22.2 18.5z 98.1 98.1** 315 * 317 **,z
… … … – … – 6.0 6.8 … … 100.0 80.8 99 12453 59 36 41 18 … 4.1 2.7 24.4 13.6 96.8 95.2 26 27 **,y
… 99 … 11 58 ** … … … … … … … … …… 1** 0.2 0.5 … … 2.2** … … … … … … …
100 * … 2 ** 3 3 ** 3 2.5 2.1**,z 17.6 … 99.4 … … …… … … 87 … 71 … 4.9**,y … … … … … 112 **,z
38 40 7 7 11 11 4.3 4.6 … 14.1 … 92.7 … …
0.1 1 0.3 0.4 0.2 0.4 3.8 3.3 … 18.6 … … … …
10 8 4 4 6 7 5.0 5.5 … 12.7 … 93.4 … 3 79452 59 11 11 16 15 4.0 4.5 … 15.5 … 91.8 … …
89 86 7 13 8 9 … … … … … … … …
1 1 0.3 0.9 0.6 1 4.5 4.6 … … … 93.3 … 6771 1 0.5 0.8 0.2 0.8 3.4 3.2 … … … 98.0 … …
… 60 … 4 … 12 4.0 4.8 … … … 93.1 … …
42 41 13 16 25 25 4.4 4.6 14.9 14.4 … 93.0 … 413
26 25 7 7 7 9 5.2 5.7 … 12.7 91.5 93.0 3 545 4 291
… 33 … 9 … 25 3.1 3.8 12.5 13.9 76.4 84.5 … …
51 62 10 8 16 13 3.8 4.0 … … … … … …
CameroonCape VerdeCentral African RepublicChadComorosCongoCôte d’IvoireD.R. CongoEquatorial GuineaEritreaEthiopiaGabonGambiaGhanaGuineaGuinea-BissauKenyaLesothoLiberiaMadagascarMalawiMaliMauritiusMozambiqueNamibiaNigerNigeriaRwandaSao Tome and PrincipeSenegalSeychellesSierra LeoneSomaliaSouth AfricaSwazilandTogoUgandaUnited Republic of TanzaniaZambiaZimbabwe
World1
Countries in transitionDeveloped countriesDeveloping countries
Arab States Central and Eastern EuropeCentral AsiaEast Asia and the PacificLatin America andthe Caribbean
North America and Western EuropeSouth and West AsiaSub-Saharan Africa
EDUCATION FINANCEPRIVATE ENROLMENT AS %
OF TOTAL ENROLMENT
Public current expenditure on primary
education per pupil (unit cost)
in constant 2002 US$
Public currentexpenditure oneducation as % of total publicexpenditure
on education
Total publicexpenditure
on education as % of total governmentexpenditure
Total publicexpenditure
on education as % of GNP
Secondaryeducation
Primaryeducation
Pre-primaryeducation
1998 2002 1998 2002 1998 2002 1998 2002Country or territory
164165166167168169170171172173174175176177178179180181182183184185186187188189190191192193194195196197198199200201202203
I
IIIIIIV
VVI
VIIVIII
IX
X
XIXII
1. All values shown are medians.Data in bold are for 2003/2004.
(z) Data are for 2001/2002.(y) Data are for 2000/2001.
1998/1999
2002/2003
1998/1999
2002/2003
1998/1999
2002/2003
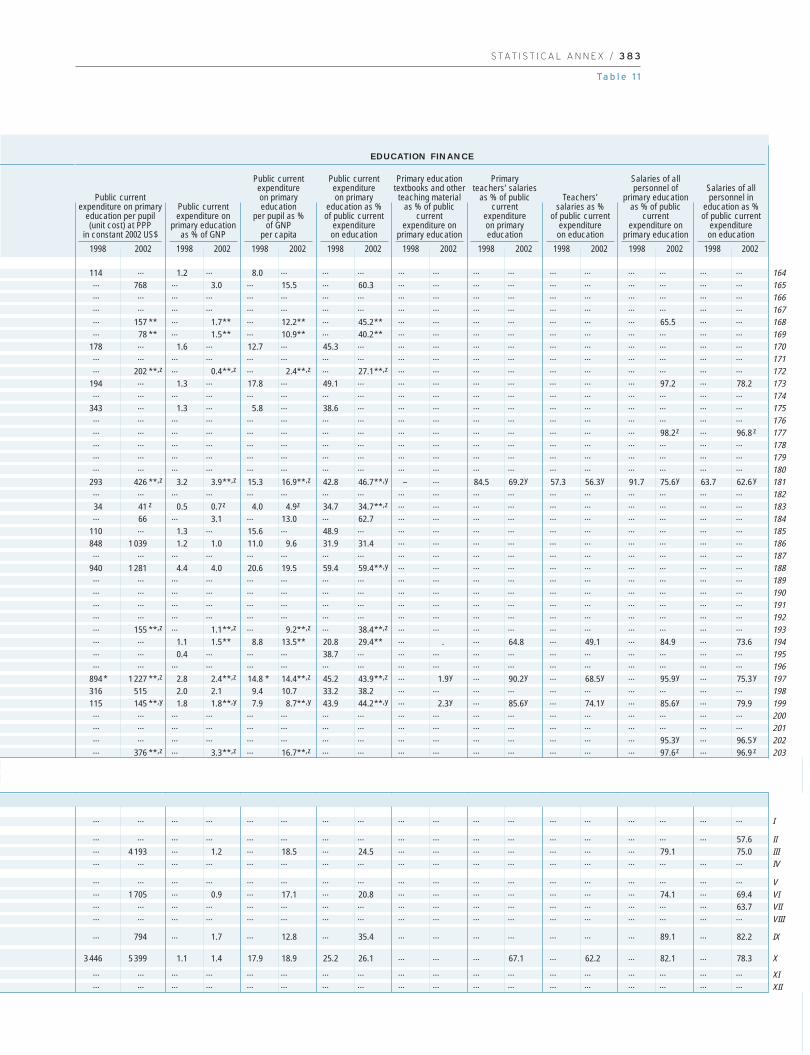
S TAT I S T I C A L A N N E X / 3 8 3
Ta b l e 1 1
114 … 1.2 … 8.0 … … … … … … … … … … … … …… 768 … 3.0 … 15.5 … 60.3 … … … … … … … … … …… … … … … … … … … … … … … … … … … …… … … … … … … … … … … … … … … … … …… 157 ** … 1.7** … 12.2** … 45.2** … … … … … … … 65.5 … …… 78 ** … 1.5** … 10.9** … 40.2** … … … … … … … … … …
178 … 1.6 … 12.7 … 45.3 … … … … … … … … … … …… … … … … … … … … … … … … … … … … …… 202 **,z … 0.4**,z … 2.4**,z … 27.1**,z … … … … … … … … … …
194 … 1.3 … 17.8 … 49.1 … … … … … … … … 97.2 … 78.2… … … … … … … … … … … … … … … … … …
343 … 1.3 … 5.8 … 38.6 … … … … … … … … … … …… … … … … … … … … … … … … … … … … …… … … … … … … … … … … … … … … 98.2z … 96.8 z
… … … … … … … … … … … … … … … … … …… … … … … … … … … … … … … … … … … …… … … … … … … … … … … … … … … … … …
293 426 **,z 3.2 3.9**,z 15.3 16.9**,z 42.8 46.7**,y – … 84.5 69.2y 57.3 56.3y 91.7 75.6y 63.7 62.6 y
… … … … … … … … … … … … … … … … … …
34 41 z 0.5 0.7z 4.0 4.9z 34.7 34.7**,z … … … … … … … … … …… 66 … 3.1 … 13.0 … 62.7 … … … … … … … … … …
110 … 1.3 … 15.6 … 48.9 … … … … … … … … … … …
848 1 039 1.2 1.0 11.0 9.6 31.9 31.4 … … … … … … … … … …… … … … … … … … … … … … … … … … … …
940 1 281 4.4 4.0 20.6 19.5 59.4 59.4**,y … … … … … … … … … …… … … … … … … … … … … … … … … … … …… … … … … … … … … … … … … … … … … …… … … … … … … … … … … … … … … … … …… … … … … … … … … … … … … … … … … …… 155 **,z … 1.1**,z … 9.2**,z … 38.4**,z … … … … … … … … … …… … 1.1 1.5** 8.8 13.5** 20.8 29.4** … . … 64.8 … 49.1 … 84.9 … 73.6… … 0.4 … … … 38.7 … … … … … … … … … … …… … … … … … … … … … … … … … … … … …
894 * 1 227 **,z 2.8 2.4**,z 14.8 * 14.4**,z 45.2 43.9**,z … 1.9y … 90.2y … 68.5y … 95.9y … 75.3 y
316 515 2.0 2.1 9.4 10.7 33.2 38.2 … … … … … … … … … …
115 145 **,y 1.8 1.8**,y 7.9 8.7**,y 43.9 44.2**,y … 2.3y … 85.6y … 74.1y … 85.6y … 79.9… … … … … … … … … … … … … … … … … …… … … … … … … … … … … … … … … … … …… … … … … … … … … … … … … … … 95.3y … 96.5 y
… 376 **,z … 3.3**,z … 16.7**,z … … … … … … … … … 97.6z … 96.9 z
… … … … … … … … … … … … … … … … … …
… … … … … … … … … … … … … … … … … 57.6… 4 193 … 1.2 … 18.5 … 24.5 … … … … … … … 79.1 75.0… … … … … … … … … … … … … … … … … …
… … … … … … … … … … … … … … … … … …… 1 705 … 0.9 … 17.1 … 20.8 … … … … … … … 74.1 … 69.4… … … … … … … … … … … … … … … … … 63.7… … … … … … … … … … … … … … … … … …
… 794 … 1.7 … 12.8 … 35.4 … … … … … … … 89.1 … 82.2
3 446 5 399 1.1 1.4 17.9 18.9 25.2 26.1 … … … 67.1 … 62.2 … 82.1 … 78.3
… … … … … … … … … … … … … … … … … …… … … … … … … … … … … … … … … … … …
EDUCATION FINANCE
Public current expenditure on primary
education per pupil (unit cost) at PPP
in constant 2002 US$
Public currentexpenditure on
primary educationas % of GNP
Public currentexpenditure on primaryeducation
per pupil as % of GNP
per capita
Public currentexpenditure on primary
education as % of public current
expenditure on education
Primary educationtextbooks and other
teaching material as % of public
current expenditure on
primary education
Primary teachers’ salaries
as % of publiccurrent
expenditure on primaryeducation
Teachers’ salaries as %
of public currentexpenditure
on education
Salaries of allpersonnel of
primary educationas % of public
current expenditure on
primary education
Salaries of allpersonnel in
education as % of public current
expenditure on education
1998 2002 1998 2002 1998 2002 1998 2002 1998 2002 1998 2002 1998 2002 1998 20021998 2002
164165166167168169170171172173174175176177178179180181182183184185186187188189190191192193194195196197198199200201202203
I
IIIIIIV
VVIVIIVIII
IX
X
XIXII

60
02
Education f
or A
ll G
lobal M
onitorin
g R
eport
3 8 4 / A N N E X
Table 12Trends in basic or proxy indicators to measure EFA goals 1, 2 and 3
… … 2.5 1.01 3.8 0.9927.1 1.02 32.9 0.95 36.7 0.94
0.7 1.46 0.4 1.50 1.2 0.996.1 0.99 10.1 0.95 13.7 0.957.8 0.95 5.2 0.98 3.8 0.98
20.8 0.88 28.6 0.91 30.4 0.9332.9 1.01 78.3 1.01 69.9 1.00… … 66.0 0.97 74.8 0.98… … 5.0 0.98** 7.8 ** 0.96**… … … … 1.9 …
60.7 0.46 64.3 0.52 56.1 0.623.1 0.89 5.6 0.87 5.5 0.84
13.8 … 39.9 0.97 27.4 0.9628.3 0.93 25.6 0.98 33.9 0.92
6.8 0.87 5.1 0.91 4.9 0.94**19.7 0.57 21.3 … 26.6 0.86
6.2 0.88 8.4 0.90 10.5 0.947.7 … 13.5 0.95 21.6 ** 0.99**
53.0 0.97 61.6 0.97 75.3 0.990.7 0.94 0.7 0.87 0.7 0.93
58.6 … 41.7 ** 1.09** 47.0 1.0384.1 … 81.2 0.92 101.9 0.98… … … … … …
91.6 1.01 64.3 0.99 75.5 0.9828.2 0.99 41.1 0.98 45.5 0.9795.0 0.97 90.5 1.06 102.0 1.0074.9 0.99 86.8 0.98 112.9 0.99
113.4 0.97 79.4 0.98 80.5 0.9744.7 1.01 50.9 0.95 74.3 0.9457.5 1.01 50.2 0.97 58.3 0.9746.7 … 49.8 1.01 50.6 1.0072.7 0.95 40.3 0.96 46.9 0.9776.0 1.04 61.8 1.02 76.4 1.0374.0 … … … 93.9 0.94**… … 44.1 0.99 43.7 y 1.01y
86.1 … 81.7 … 86.9 0.9873.6 0.95 72.0 0.91 67.7 0.96… … 27.3 1.01 28.5 1.01
4.2 0.92 6.0 0.94 7.6 0.9485.0 0.92 47.5 0.98 76.4 0.98
36.6 … … … 34.6 1.0718.8 0.84 20.9 0.89 24.6 1.0058.9 … 35.4 0.99 42.7 1.0672.4 … 13.9 0.95 29.4 0.9833.5 1.02 10.5 0.78 11.3 0.9539.1 1.24 24.7 1.21 33.8 1.1415.8 … 8.5 0.76 10.1 0.94… … … … … …
73.1 … … … 28.1 0.94
71.3 1.00 … … 101.7 1.0047.2 0.95 50.6 1.03 48.5 1.01
3.9 0.90 5.2 ** 1.03** 7.0 1.05
AlgeriaBahrainDjiboutiEgyptIraqJordanKuwaitLebanonLibyan Arab JamahiriyaMauritaniaMoroccoOmanPalestinian Autonomous TerritoriesQatarSaudi ArabiaSudan2
Syrian Arab RepublicTunisiaUnited Arab EmiratesYemen
AlbaniaBelarusBosnia and HerzegovinaBulgariaCroatiaCzech RepublicEstoniaHungaryLatviaLithuaniaPolandRepublic of MoldovaRomaniaRussian Federation3
Serbia and Montenegro4
SlovakiaSloveniaThe former Yugoslav Rep. of MacedoniaTurkeyUkraine
ArmeniaAzerbaijanGeorgiaKazakhstanKyrgyzstanMongoliaTajikistanTurkmenistanUzbekistan
AustraliaBrunei DarussalamCambodia
GOAL 1
Early childhood care and education
GROSS ENROLMENT RATIO (GER) IN PRE-PRIMARY EDUCATION
1990/1991
Total (%) (F/M)
GPI Total (%) (F/M)
GPI Total (%) (F/M)
GPI
1998/1999 2002/2003
Country or territory
Arab States
Central and Eastern Europe
Central Asia
East Asia and the Pacific

S TAT I S T I C A L A N N E X / 3 8 5
Ta b l e 1 2
93.2 0.88 92.1 0.96 94.9 0.97 77.3 0.79 90.1* 0.92*99.0 1.00 93.9 1.02 89.9 1.02 95.6 0.99 99.3* 1.00*31.3 0.71 ** 31.3 0.72 35.6 0.80 73.2 0.78 … …
83.7** 0.84 ** 90.9 ** 0.93 ** 91.4 ** 0.96 ** 61.3 0.72 73.2* 0.85*94.2** 0.88 ** 91.2 0.85 90.5 **,y 0.85 **,y 41.0 0.44 … …
94.1 1.01 89.6 1.01 92.0 1.02 96.7 0.97 99.1* 1.00*49.0** 0.93 ** 88.2 1.00 83.4 1.02 87.5 0.99 93.1 1.0277.8** 0.96 ** 87.5 ** 0.97 ** 90.6 0.99 92.1 0.93 … …
96.1** 0.96 ** … … … … 91.0 0.84 97.0 0.9435.3** 0.74 ** 62.6 ** 0.94 ** 67.5 0.97 45.8 0.65 61.3* 0.82*56.8 0.70 73.1 0.86 89.6 0.94 55.3 0.62 69.5 0.7969.3 0.95 75.9 1.00 71.9 1.01 85.6 0.79 98.5 0.98… … 96.9 1.01 90.9 1.00 … … 98.7* 1.00*89.4 0.98 97.1 1.01 94.5 1.00 90.3 1.05 98.6* …
58.7 0.81 56.8 0.93 54.4 0.99 85.4 0.86 95.9* 0.96*43.3** 0.75 ** … … … … 65.0 0.71 74.6* 0.85* 92.3 0.91 93.0 ** 0.93 ** 97.9 0.96 79.9 0.73 95.2* 0.96*93.9 0.92 94.0 0.98 97.3 1.00 84.1 0.81 94.3* 0.96*99.1 0.98 78.2 0.98 83.1 0.98 84.7 1.08 91.4 1.0851.7** 0.38 ** 57.4 0.59 71.8 0.71 50.0 0.34 67.9 0.60
95.1** 1.01 ** 99.1 ** 0.99 ** 94.9 0.98 94.8 0.94 99.4* 1.00*86.2** 0.95 ** … … 94.3 0.99 ** 99.8 1.00 99.8* 1.00*… … … … … … … … 99.6* 1.00*86.1 0.99 95.6 0.98 90.4 0.99 99.4 1.00 98.2* 1.00*74.2 1.00 88.4 0.98 89.3 0.99 99.6 1.00 99.6* 1.00*86.7** 1.00 ** 90.2 1.01 86.5 1.00 … … … …
99.5** 0.99 ** 97.0 ** 0.98 ** 94.9 0.99 99.8 1.00 99.8* 1.00*91.3 1.01 89.5 0.99 90.6 0.99 99.7 1.00 99.5* 1.00*92.1** 0.99 ** 91.0 0.99 85.6 0.99 … … 99.7* 1.00*… … 94.5 0.99 90.9 1.00 99.8 1.00 99.7* 1.00*96.7 1.00 … … 97.9 1.00 … … … …
88.8** 0.99 ** 78.2 ** … 79.0 0.99 99.8 1.00 98.7* 1.01*81.2** 1.00 ** 95.7 0.99 88.9 0.99 99.3 1.00 97.8* 1.00*98.6** 1.00 ** … … 89.7 ** 1.02 ** 99.8 1.00 99.7* 1.00*69.4 1.02 … … 95.8 y 1.00 y … … 99.4* 1.00*… … … … 85.5 1.01 … … 99.6* 1.00*99.7** 1.01 ** 93.9 0.99 93.4 0.99 99.8 1.00 99.8 1.0094.4 0.99 94.5 0.98 90.8 1.00 … … 98.7* 0.99*89.5 0.92 ** … … 86.4 0.94 92.7 0.91 96.6* 0.96*80.2** 1.00 ** … … 84.3 1.00 ** 99.8 1.00 99.8* 1.00*
… … … … 94.4 0.98 99.5 1.00 99.8* 1.00*100.0** 1.00 ** 80.1 ** 1.00 ** 79.9 0.97 … … 99.9* 1.00*
97.1** 1.00 ** … … 88.7 0.98 … … … …
87.6** 0.99 ** … … 91.5 0.99 99.8 1.00 99.8* 1.00*92.3** 1.00 ** 91.0 * 0.98 * 89.3 0.96 … … 99.7* 1.00*90.1** 1.02 ** 89.4 1.04 79.0 1.03 … … 97.7* 1.01*76.7** 0.98 ** 94.3 0.94 … … 99.8 1.00 99.8* 1.00*… … … … … … … … 99.8* 1.00*78.2** 0.99 ** … … … … 99.6 1.00 99.7 1.00
99.2 1.00 94.7 1.01 96.8 1.01 … … … …
89.7** 0.95 ** … … … … 97.9 1.01 98.9* 1.00*66.6** 0.83 ** 82.5 ** 0.91 ** 93.3 0.95 73.5 0.81 83.4* 0.90*
AlgeriaBahrainDjibouti
EgyptIraq
JordanKuwait
LebanonLibyan Arab Jamahiriya
MauritaniaMorocco
OmanPalestinian Autonomous Territories
QatarSaudi Arabia
Sudan 2
Syrian Arab RepublicTunisia
United Arab EmiratesYemen
AlbaniaBelarus
Bosnia and HerzegovinaBulgariaCroatia
Czech RepublicEstonia
HungaryLatvia
LithuaniaPoland
Republic of MoldovaRomania
Russian Federation 3
Serbia and Montenegro 4
SlovakiaSlovenia
The former Yugoslav Rep. of MacedoniaTurkey
Ukraine
ArmeniaAzerbaijan
GeorgiaKazakhstanKyrgyzstan
MongoliaTajikistan
TurkmenistanUzbekistan
AustraliaBrunei Darussalam
Cambodia
GOAL 2 GOAL 3
Universal primary education Learning needs of all youth and adults
NET ENROLMENT RATIO (NER) IN PRIMARY EDUCATION YOUTH LITERACY RATE (15-24)
1990/1991
Total (%) (F/M)
GPI
1998/1999
Total (%) (F/M)
GPI
2002/2003
Total (%) (F/M)
GPI
1990
Total(%) (F/M)
GPI
2000-20041
Total(%) (F/M)
GPICountry or territory
Arab States
Central and Eastern Europe
Central Asia
East Asia and the Pacific
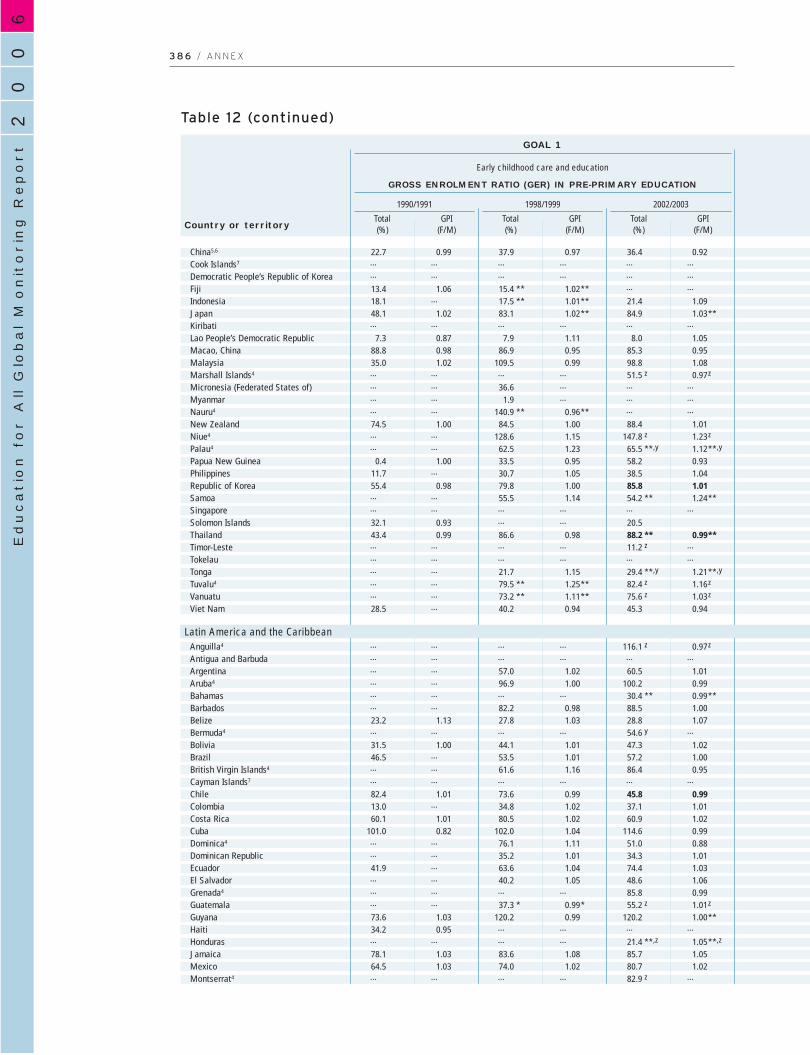
60
02
Education f
or A
ll G
lobal M
onitorin
g R
eport
3 8 6 / A N N E X
Table 12 (continued)
22.7 0.99 37.9 0.97 36.4 0.92… … … … … …… … … … … …
13.4 1.06 15.4 ** 1.02** … …
18.1 … 17.5 ** 1.01** 21.4 1.0948.1 1.02 83.1 1.02** 84.9 1.03**… … … … … …
7.3 0.87 7.9 1.11 8.0 1.0588.8 0.98 86.9 0.95 85.3 0.9535.0 1.02 109.5 0.99 98.8 1.08… … … … 51.5 z 0.97z
… … 36.6 … … …… … 1.9 … … …… … 140.9 ** 0.96** … …
74.5 1.00 84.5 1.00 88.4 1.01… … 128.6 1.15 147.8 z 1.23z
… … 62.5 1.23 65.5 **,y 1.12**,y
0.4 1.00 33.5 0.95 58.2 0.9311.7 … 30.7 1.05 38.5 1.0455.4 0.98 79.8 1.00 85.8 1.01… … 55.5 1.14 54.2 ** 1.24**… … … … … …
32.1 0.93 … … 20.543.4 0.99 86.6 0.98 88.2 ** 0.99**… … … … 11.2 z …… … … … … …… … 21.7 1.15 29.4 **,y 1.21**,y
… … 79.5 ** 1.25** 82.4 z 1.16z
… … 73.2 ** 1.11** 75.6 z 1.03z
28.5 … 40.2 0.94 45.3 0.94
… … … … 116.1 z 0.97z
… … … … … …… … 57.0 1.02 60.5 1.01… … 96.9 1.00 100.2 0.99… … … … 30.4 ** 0.99**… … 82.2 0.98 88.5 1.0023.2 1.13 27.8 1.03 28.8 1.07… … … … 54.6 y …
31.5 1.00 44.1 1.01 47.3 1.0246.5 … 53.5 1.01 57.2 1.00… … 61.6 1.16 86.4 0.95… … … … … …
82.4 1.01 73.6 0.99 45.8 0.9913.0 … 34.8 1.02 37.1 1.0160.1 1.01 80.5 1.02 60.9 1.02
101.0 0.82 102.0 1.04 114.6 0.99… … 76.1 1.11 51.0 0.88… … 35.2 1.01 34.3 1.0141.9 … 63.6 1.04 74.4 1.03… … 40.2 1.05 48.6 1.06… … … … 85.8 0.99… … 37.3 * 0.99* 55.2 z 1.01z
73.6 1.03 120.2 0.99 120.2 1.00**34.2 0.95 … … … …… … … … 21.4 **,z 1.05**,z
78.1 1.03 83.6 1.08 85.7 1.0564.5 1.03 74.0 1.02 80.7 1.02… … … … 82.9 z …
China5,6
Cook Islands7
Democratic People’s Republic of KoreaFijiIndonesiaJapanKiribatiLao People’s Democratic RepublicMacao, ChinaMalaysiaMarshall Islands4
Micronesia (Federated States of)MyanmarNauru4
New ZealandNiue4
Palau4
Papua New GuineaPhilippinesRepublic of KoreaSamoaSingaporeSolomon IslandsThailandTimor-LesteTokelauTongaTuvalu4
VanuatuViet Nam
Anguilla4
Antigua and BarbudaArgentinaAruba4
BahamasBarbadosBelizeBermuda4
BoliviaBrazilBritish Virgin Islands4
Cayman Islands7
ChileColombiaCosta RicaCubaDominica4
Dominican RepublicEcuadorEl SalvadorGrenada4
GuatemalaGuyanaHaitiHondurasJamaicaMexicoMontserrat4
GOAL 1
Early childhood care and education
GROSS ENROLMENT RATIO (GER) IN PRE-PRIMARY EDUCATION
1990/1991
Total (%) (F/M)
GPI Total (%) (F/M)
GPI Total (%) (F/M)
GPI
1998/1999 2002/2003
Country or territory
Latin America and the Caribbean
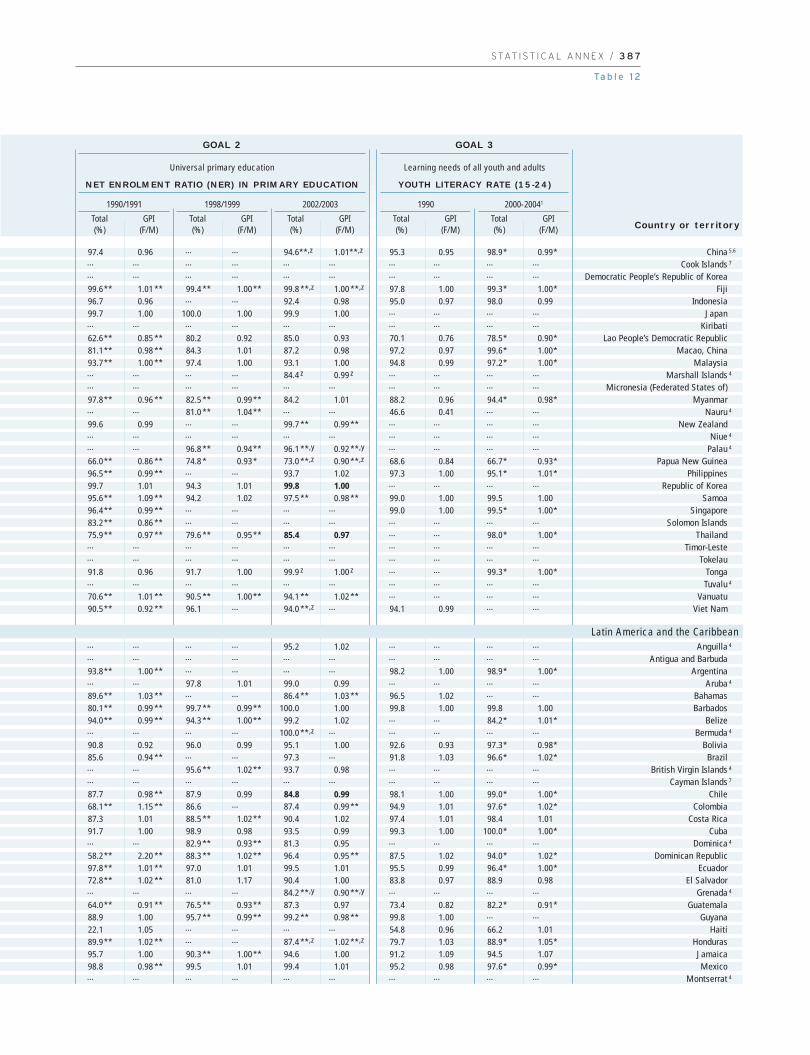
S TAT I S T I C A L A N N E X / 3 8 7
Ta b l e 1 2
97.4 0.96 … … 94.6**,z 1.01**,z 95.3 0.95 98.9* 0.99*… … … … … … … … … …… … … … … … … … … …
99.6** 1.01 ** 99.4 ** 1.00 ** 99.8 **,z 1.00 **,z 97.8 1.00 99.3* 1.00*96.7 0.96 … … 92.4 0.98 95.0 0.97 98.0 0.9999.7 1.00 100.0 1.00 99.9 1.00 … … … …… … … … … … … … … …
62.6** 0.85 ** 80.2 0.92 85.0 0.93 70.1 0.76 78.5* 0.90*81.1** 0.98 ** 84.3 1.01 87.2 0.98 97.2 0.97 99.6* 1.00*93.7** 1.00 ** 97.4 1.00 93.1 1.00 94.8 0.99 97.2* 1.00*… … … … 84.4 z 0.99 z … … … …… … … … … … … … … …
97.8** 0.96 ** 82.5 ** 0.99 ** 84.2 1.01 88.2 0.96 94.4* 0.98*… … 81.0 ** 1.04 ** … … 46.6 0.41 … …
99.6 0.99 … … 99.7 ** 0.99 ** … … … …… … … … … … … … … …… … 96.8 ** 0.94 ** 96.1 **,y 0.92 **,y … … … …
66.0** 0.86 ** 74.8 * 0.93 * 73.0 **,z 0.90 **,z 68.6 0.84 66.7* 0.93*96.5** 0.99 ** … … 93.7 1.02 97.3 1.00 95.1* 1.01*99.7 1.01 94.3 1.01 99.8 1.00 … … … …
95.6** 1.09 ** 94.2 1.02 97.5 ** 0.98 ** 99.0 1.00 99.5 1.0096.4** 0.99 ** … … … … 99.0 1.00 99.5* 1.00*83.2** 0.86 ** … … … … … … … …
75.9** 0.97 ** 79.6 ** 0.95 ** 85.4 0.97 … … 98.0* 1.00*… … … … … … … … … …… … … … … … … … … …
91.8 0.96 91.7 1.00 99.9 z 1.00 z … … 99.3* 1.00*… … … … … … … … … …
70.6** 1.01 ** 90.5 ** 1.00 ** 94.1 ** 1.02 ** … … … …
90.5** 0.92 ** 96.1 … 94.0 **,z … 94.1 0.99 … …
… … … … 95.2 1.02 … … … …… … … … … … … … … …
93.8** 1.00 ** … … … … 98.2 1.00 98.9* 1.00*… … 97.8 1.01 99.0 0.99 … … … …
89.6** 1.03 ** … … 86.4 ** 1.03 ** 96.5 1.02 … …
80.1** 0.99 ** 99.7 ** 0.99 ** 100.0 1.00 99.8 1.00 99.8 1.0094.0** 0.99 ** 94.3 ** 1.00 ** 99.2 1.02 … … 84.2* 1.01*… … … … 100.0 **,z … … … … …
90.8 0.92 96.0 0.99 95.1 1.00 92.6 0.93 97.3* 0.98*85.6 0.94 ** … … 97.3 … 91.8 1.03 96.6* 1.02*… … 95.6 ** 1.02 ** 93.7 0.98 … … … …… … … … … … … … … …
87.7 0.98 ** 87.9 0.99 84.8 0.99 98.1 1.00 99.0* 1.00*68.1** 1.15 ** 86.6 … 87.4 0.99 ** 94.9 1.01 97.6* 1.02*87.3 1.01 88.5 ** 1.02 ** 90.4 1.02 97.4 1.01 98.4 1.0191.7 1.00 98.9 0.98 93.5 0.99 99.3 1.00 100.0* 1.00*… … 82.9 ** 0.93 ** 81.3 0.95 … … … …
58.2** 2.20 ** 88.3 ** 1.02 ** 96.4 0.95 ** 87.5 1.02 94.0* 1.02*97.8** 1.01 ** 97.0 1.01 99.5 1.01 95.5 0.99 96.4* 1.00*72.8** 1.02 ** 81.0 1.17 90.4 1.00 83.8 0.97 88.9 0.98… … … … 84.2 **,y 0.90 **,y … … … …
64.0** 0.91 ** 76.5 ** 0.93 ** 87.3 0.97 73.4 0.82 82.2* 0.91*88.9 1.00 95.7 ** 0.99 ** 99.2 ** 0.98 ** 99.8 1.00 … …
22.1 1.05 … … … … 54.8 0.96 66.2 1.0189.9** 1.02 ** … … 87.4 **,z 1.02 **,z 79.7 1.03 88.9* 1.05*95.7 1.00 90.3 ** 1.00 ** 94.6 1.00 91.2 1.09 94.5 1.0798.8 0.98 ** 99.5 1.01 99.4 1.01 95.2 0.98 97.6* 0.99*… … … … … … … … … …
China 5,6
Cook Islands 7
Democratic People’s Republic of KoreaFiji
IndonesiaJapan
KiribatiLao People’s Democratic Republic
Macao, ChinaMalaysia
Marshall Islands 4
Micronesia (Federated States of)Myanmar
Nauru 4
New ZealandNiue 4
Palau 4
Papua New GuineaPhilippines
Republic of KoreaSamoa
SingaporeSolomon Islands
ThailandTimor-Leste
TokelauTongaTuvalu 4
VanuatuViet Nam
Anguilla 4
Antigua and BarbudaArgentina
Aruba 4
BahamasBarbados
BelizeBermuda 4
BoliviaBrazil
British Virgin Islands 4
Cayman Islands 7
ChileColombia
Costa RicaCuba
Dominica 4
Dominican RepublicEcuador
El SalvadorGrenada 4
GuatemalaGuyana
HaitiHondurasJamaicaMexico
Montserrat 4
GOAL 2 GOAL 3
Universal primary education Learning needs of all youth and adults
NET ENROLMENT RATIO (NER) IN PRIMARY EDUCATION YOUTH LITERACY RATE (15-24)
1990/1991
Total (%) (F/M)
GPI
1998/1999
Total (%) (F/M)
GPI
2002/2003
Total (%) (F/M)
GPI
1990
Total(%) (F/M)
GPI
2000-20041
Total(%) (F/M)
GPICountry or territory
Latin America and the Caribbean

60
02
Education f
or A
ll G
lobal M
onitorin
g R
eport
3 8 8 / A N N E X
Table 12 (continued)
… … 100.3 1.03 86.2 ** 0.99**12.1 1.09 24.7 1.02 27.7 1.0353.4 1.00 37.7 ** 0.96** 55.8 1.0127.1 1.03 25.5 1.03 30.0 1.0129.6 … 56.1 1.02 57.9 1.02… … … … 163.5 0.9054.4 … 85.2 0.99 64.1 1.1444.6 1.11 … … … …
79.2 0.99 … … 94.2 ** 0.98**8.8 1.02 59.8 ** 1.01** 66.4 * 1.03**
… … … … 125.0 1.0042.6 1.03 56.0 1.01 63.4 1.0240.8 1.02 44.2 1.03 52.7 1.01
… … … … … …
68.9 0.99 81.5 0.99 86.4 1.00104.0 1.00 109.9 0.99 116.1 0.99
60.8 1.00 66.0 1.01 64.6 **,z 0.98**,z
48.0 0.99 59.8 1.02 59.6 1.0099.0 1.00 91.0 1.00 91.6 1.0033.6 … 48.3 0.99 56.0 0.9983.3 1.00 110.6 1.00 112.7 1.00… … 93.6 0.98 99.6 0.9556.7 1.00 68.4 1.02 67.7 1.04… … 108.3 0.99 124.8 1.02
101.2 0.98 … … … …
85.4 … 106.0 0.98 112.2 1.0093.9 1.01 95.4 0.98 101.4 0.9892.4 … 72.9 0.99 85.5 1.01
102.6 0.93 102.7 0.99 100.0 1.03… … … … … …
99.2 1.01 97.8 0.99 87.3 0.9988.4 … 75.4 1.06 83.9 …
52.7 0.99 66.3 1.00 72.9 1.02… … … … … …
59.4 1.03 99.4 0.99 111.3 1.0064.7 … 76.1 1.01 81.1 1.0059.7 1.00 93.9 0.99 99.7 1.0053.2 0.99 77.5 1.01 77.7 1.0162.7 0.97 57.4 0.97 58.2 …
… … … … … …… … 22.3 1.08 20.6 1.07… … … … … …
3.4 0.89 19.5 0.99 34.0 1.0111.9 0.95 13.3 1.05 30.7 1.12… … 45.9 1.00 46.6 1.02… … 12.1 ** 0.73** 17.6 0.86… … … … 47.3 0.88… … … … … …
54.4 0.51 25.5 0.53 … …
2.6 0.83 4.6 0.94 5.2 0.95… … … … … …
0.7 1.01 1.7 1.01 1.1 **,z 0.92**,z
… … 0.8 1.01 1.3 0.9812.4 1.01 11.6 0.95 14.9 1.01
Netherlands AntillesNicaraguaPanamaParaguayPeruSaint Kitts and Nevis4
Saint LuciaSaint Vincent and the GrenadinesSurinameTrinidad and TobagoTurks and Caicos Islands4
UruguayVenezuela
Andorra7
AustriaBelgiumCanadaCyprus4
DenmarkFinlandFranceGermanyGreeceIcelandIrelandIsraelItalyLuxembourgMaltaMonaco7
NetherlandsNorwayPortugalSan MarinoSpainSwedenSwitzerlandUnited KingdomUnited States
AfghanistanBangladeshBhutan8
India9
Iran, Islamic Republic ofMaldivesNepalPakistanSri Lanka2
AngolaBeninBotswanaBurkina FasoBurundiCameroon
GOAL 1
Early childhood care and education
GROSS ENROLMENT RATIO (GER) IN PRE-PRIMARY EDUCATION
1990/1991
Total (%) (F/M)
GPI Total (%) (F/M)
GPI Total (%) (F/M)
GPI
1998/1999 2002/2003
Country or territory
North America and Western Europe
South and West Asia
Sub-Saharan Africa
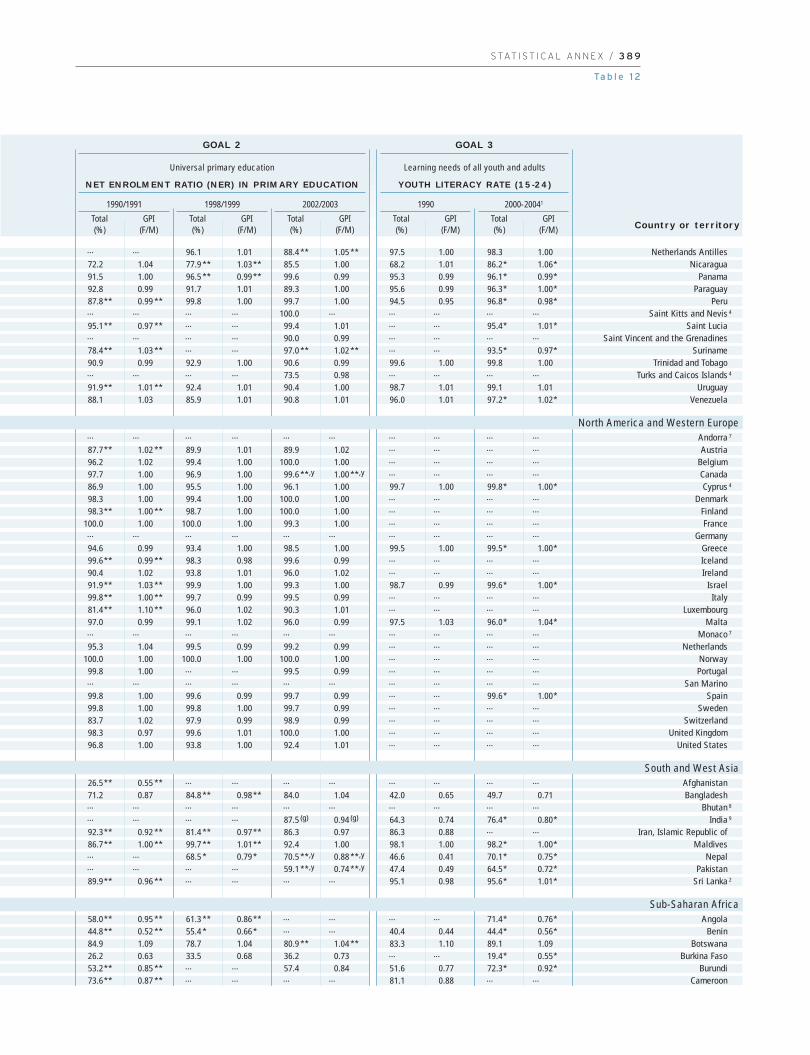
S TAT I S T I C A L A N N E X / 3 8 9
Ta b l e 1 2
… … 96.1 1.01 88.4 ** 1.05 ** 97.5 1.00 98.3 1.0072.2 1.04 77.9 ** 1.03 ** 85.5 1.00 68.2 1.01 86.2* 1.06*91.5 1.00 96.5 ** 0.99 ** 99.6 0.99 95.3 0.99 96.1* 0.99*92.8 0.99 91.7 1.01 89.3 1.00 95.6 0.99 96.3* 1.00*87.8** 0.99 ** 99.8 1.00 99.7 1.00 94.5 0.95 96.8* 0.98*… … … … 100.0 … … … … …
95.1** 0.97 ** … … 99.4 1.01 … … 95.4* 1.01*… … … … 90.0 0.99 … … … …
78.4** 1.03 ** … … 97.0 ** 1.02 ** … … 93.5* 0.97*90.9 0.99 92.9 1.00 90.6 0.99 99.6 1.00 99.8 1.00… … … … 73.5 0.98 … … … …
91.9** 1.01 ** 92.4 1.01 90.4 1.00 98.7 1.01 99.1 1.0188.1 1.03 85.9 1.01 90.8 1.01 96.0 1.01 97.2* 1.02*
… … … … … … … … … …
87.7** 1.02 ** 89.9 1.01 89.9 1.02 … … … …
96.2 1.02 99.4 1.00 100.0 1.00 … … … …
97.7 1.00 96.9 1.00 99.6 **,y 1.00 **,y … … … …
86.9 1.00 95.5 1.00 96.1 1.00 99.7 1.00 99.8* 1.00*98.3 1.00 99.4 1.00 100.0 1.00 … … … …
98.3** 1.00 ** 98.7 1.00 100.0 1.00 … … … …
100.0 1.00 100.0 1.00 99.3 1.00 … … … …… … … … … … … … … …
94.6 0.99 93.4 1.00 98.5 1.00 99.5 1.00 99.5* 1.00*99.6** 0.99 ** 98.3 0.98 99.6 0.99 … … … …
90.4 1.02 93.8 1.01 96.0 1.02 … … … …
91.9** 1.03 ** 99.9 1.00 99.3 1.00 98.7 0.99 99.6* 1.00*99.8** 1.00 ** 99.7 0.99 99.5 0.99 … … … …
81.4** 1.10 ** 96.0 1.02 90.3 1.01 … … … …
97.0 0.99 99.1 1.02 96.0 0.99 97.5 1.03 96.0* 1.04*… … … … … … … … … …
95.3 1.04 99.5 0.99 99.2 0.99 … … … …
100.0 1.00 100.0 1.00 100.0 1.00 … … … …
99.8 1.00 … … 99.5 0.99 … … … …… … … … … … … … … …
99.8 1.00 99.6 0.99 99.7 0.99 … … 99.6* 1.00*99.8 1.00 99.8 1.00 99.7 0.99 … … … …
83.7 1.02 97.9 0.99 98.9 0.99 … … … …
98.3 0.97 99.6 1.01 100.0 1.00 … … … …
96.8 1.00 93.8 1.00 92.4 1.01 … … … …
26.5** 0.55 ** … … … … … … … …
71.2 0.87 84.8 ** 0.98 ** 84.0 1.04 42.0 0.65 49.7 0.71… … … … … … … … … …… … … … 87.5 (g) 0.94 (g) 64.3 0.74 76.4* 0.80* 92.3** 0.92 ** 81.4 ** 0.97 ** 86.3 0.97 86.3 0.88 … …
86.7** 1.00 ** 99.7 ** 1.01 ** 92.4 1.00 98.1 1.00 98.2* 1.00* … … 68.5 * 0.79 * 70.5 **,y 0.88 **,y 46.6 0.41 70.1* 0.75*… … … … 59.1 **,y 0.74 **,y 47.4 0.49 64.5* 0.72*89.9** 0.96 ** … … … … 95.1 0.98 95.6* 1.01*
58.0** 0.95 ** 61.3 ** 0.86 ** … … … … 71.4* 0.76*44.8** 0.52 ** 55.4 * 0.66 * … … 40.4 0.44 44.4* 0.56*84.9 1.09 78.7 1.04 80.9 ** 1.04 ** 83.3 1.10 89.1 1.0926.2 0.63 33.5 0.68 36.2 0.73 … … 19.4* 0.55*53.2** 0.85 ** … … 57.4 0.84 51.6 0.77 72.3* 0.92*73.6** 0.87 ** … … … … 81.1 0.88 … …
Netherlands AntillesNicaragua
PanamaParaguay
PeruSaint Kitts and Nevis 4
Saint LuciaSaint Vincent and the Grenadines
SurinameTrinidad and Tobago
Turks and Caicos Islands 4
UruguayVenezuela
Andorra 7
AustriaBelgiumCanadaCyprus 4
DenmarkFinlandFrance
GermanyGreeceIcelandIreland
IsraelItaly
LuxembourgMalta
Monaco 7
NetherlandsNorwayPortugal
San MarinoSpain
SwedenSwitzerland
United KingdomUnited States
AfghanistanBangladesh
Bhutan 8
India 9
Iran, Islamic Republic ofMaldives
NepalPakistan
Sri Lanka 2
AngolaBenin
BotswanaBurkina Faso
BurundiCameroon
GOAL 2 GOAL 3
Universal primary education Learning needs of all youth and adults
NET ENROLMENT RATIO (NER) IN PRIMARY EDUCATION YOUTH LITERACY RATE (15-24)
1990/1991
Total (%) (F/M)
GPI
1998/1999
Total (%) (F/M)
GPI
2002/2003
Total (%) (F/M)
GPI
1990
Total(%) (F/M)
GPI
2000-20041
Total(%) (F/M)
GPICountry or territory
North America and Western Europe
South and West Asia
Sub-Saharan Africa

60
02
Education f
or A
ll G
lobal M
onitorin
g R
eport
3 9 0 / A N N E X
Table 12 (continued)
… … … … 59.2 1.025.7 … … … 2.6 1.05
… … … … … …… … 2.2 1.07 2.4 0.91
2.3 1.00 1.8 1.59 4.1 ** 1.06**0.9 0.94 2.6 0.97 3.5 * 0.97*
… … … … 0.8 **,z 0.98**,z
… … 30.9 1.04 … …… … 5.3 0.89 5.9 1.00
1.6 1.01 1.5 0.97 2.1 0.95… … … … 13.9 **,z …… … 19.7 0.91 18.3 1.03… … 37.0 0.99 47.0 0.97… … … … … …… … 3.2 ** 1.05** 3.2 **,y 1.05**,y
32.9 1.13 38.3 1.07 48.2 0.99… … 24.9 1.13* 29.6 0.94… … 43.3 0.74 … …… … 3.4 ** 1.02** 10.0 …… … … … … …… … 1.9 1.08 1.6 ** 1.00**56.0 0.99 98.0 1.02 88.6 1.01… … … … … …
14.2 1.13 20.1 ** 1.11** 27.5 1.301.5 0.94 1.1 1.03 1.4 1.01
… … … … 12.0 0.94… … … … 2.5 **,z 0.99**,z
… … 25.5 ** 1.06** 25.8 ** 1.11**2.4 1.04 2.9 1.00 3.4 1.10
… … 112.8 1.03 98.6 0.96… … … … 4.1 y …… … … … … …
16.5 1.03 24.2 * 0.99* 31.6 1.0214.0 1.83 … … … …
3.2 0.98 2.7 1.00 2.8 0.99… … 4.0 1.00 4.3 1.04… … … … 23.9 ** 0.99**… … 2.3 * 1.19* … …… … … … 39.8 …
… … 42.5 1.00 48.6 1.03
72.4 … 28.1 0.95 34.6 1.0772.5 0.98 76.1 1.01 81.1 1.00… … 32.9 0.95 34.3 1.01
10.8 … 13.5 0.95 17.7 0.9874.0 … 50.5 0.96 74.3 0.9437.9 … 17.4 0.91 28.8 0.9632.1 0.93 53.1 1.08 56.2 1.0743.6 1.07 58.4 1.02 60.9 1.0268.9 0.99 81.5 0.99 86.8 0.99… … 19.5 0.99 32.3 1.06… … 4.6 0.94 5.6 0.98
Cape VerdeCentral African RepublicChadComorosCongoCôte d’IvoireDemocratic Rep. of the CongoEquatorial GuineaEritreaEthiopiaGabonGambiaGhanaGuineaGuinea-BissauKenyaLesothoLiberiaMadagascarMalawiMaliMauritiusMozambiqueNamibiaNigerNigeriaRwandaSao Tome and PrincipeSenegalSeychelles4
Sierra LeoneSomaliaSouth AfricaSwazilandTogoUgandaUnited Republic of TanzaniaZambiaZimbabwe
World
Countries in transitionDeveloped countriesDeveloping countries
Arab StatesCentral and Eastern EuropeCentral AsiaEast Asia and the PacificLatin America and the CaribbeanNorth America and Western EuropeSouth and West AsiaSub-Saharan Africa
GOAL 1
Early childhood care and education
GROSS ENROLMENT RATIO (GER) IN PRE-PRIMARY EDUCATION
1990/1991
Total (%) (F/M)
GPI Total (%) (F/M)
GPI Total (%) (F/M)
GPI
1998/1999 2002/2003
Country or territory
Median
1. Data refer to the most recent year available during theperiod specified. See introduction to the Statistical annexfor broader explanation of national literacy definitions,assessment methods, sources and years of data.2. Literacy data for the most recent year do not includesome geographic regions.
3. In countries where two or more educationstructures exist, indicators were calculated on thebasis of the most common or widespread structure.In the Russian Federation this is three grades of primary education starting at age 7. However, a four-grade structure also exists, in which aboutone-third of primary pupils are enrolled.
4. National population data were used to calculate enrolment ratios.5. Children enter primary school at age 6or 7. Since 7 is the most common entranceage, enrolment ratios were calculatedusing the 7-11 age group for bothenrolments and population.

S TAT I S T I C A L A N N E X / 3 9 1
Ta b l e 1 2
93.8** 0.95 ** 99.1 ** 0.98 ** 99.2 0.98 81.5 0.87 89.1 0.9453.5 0.66 … … … … 52.1 0.60 58.5* 0.67*36.5** 0.45 ** 54.7 0.62 62.8 ** 0.68 ** 48.0 0.65 37.3* 0.42*56.7** 0.73 ** 49.2 0.85 … … 56.7 0.78 59.0 0.7979.3** 0.93 ** … … 54.0 0.96 92.5 0.95 97.8 0.9945.6 0.71 ** 55.5 0.76 60.6 * 0.81 * 52.6 0.62 59.8* 0.74*54.5 0.78 … … … … 68.9 0.72 68.7* 0.80*90.5** 0.97 ** 88.0 0.83 ** 84.6 z 0.85 z 92.7 0.92 93.8* 1.00*16.1** 0.99 ** 33.9 0.87 45.2 0.86 60.9 0.68 … …
23.3** 0.75 ** 35.8 0.69 51.1 0.85 43.0 0.66 57.4 0.8286.0** 1.00 ** … … 78.3 **,y 0.99 **,y … … … …
48.0** 0.71 ** 66.7 0.88 78.8 ** 0.99 ** 42.2 0.68 … …
52.4** 0.87 ** 57.9 ** 0.93 ** 59.0 … 81.8 0.86 … …
25.5** 0.51 ** 45.3 0.69 65.5 0.80 44.1 0.43 … …
38.0** 0.56 ** … … … … … … … …
74.3** 1.00 ** 65.8 ** 1.01 ** 66.5 1.00 89.8 0.93 80.3* 1.01*73.0 1.24 64.5 1.14 85.8 1.07 87.2 1.26 … …… … 43.9 0.77 … … 57.2 0.51 70.8 0.6464.8** 1.00 ** 64.5 1.01 78.6 1.00 72.2 0.86 70.1* 0.94*49.8 0.92 … … … … 63.2 0.68 76.3* 0.86*20.4 0.61 38.3 ** 0.72 ** 44.5 0.77 … … 24.2* 0.52*94.9 1.01 93.2 1.00 96.6 1.02 91.1 1.00 94.5* 1.02*44.7 0.76 ** 47.3 ** 0.83 ** 55.3 0.91 48.8 0.48 62.8 0.6483.2** 1.09 ** 77.9 1.07 78.3 1.07 87.4 1.04 92.3* 1.03*24.0 0.58 26.1 0.66 38.2 0.69 17.0 0.37 19.8* 0.54*59.9** 0.78 ** … … 67.2 ** 0.82 ** 73.6 0.82 88.6 0.9567.4 0.99 … … 86.7 1.04 72.7 0.86 76.5* 0.98*… … 85.5 0.98 97.1 **,z 0.94 **,z … … … …
47.1** 0.74 ** 57.9 0.88 ** 68.5 0.92 40.1 0.60 49.1* 0.70*… … 99.1 0.98 99.6 0.99 … … 99.1* 1.01*41.0** 0.73 ** … … … … … … 38.2* 0.64*… … … … … … … … … …
87.9** 1.03 ** 91.3 * 1.01 * 89.0 1.01 88.5 1.00 93.9* 1.01*77.2 1.04 67.2 1.02 75.3 1.00 85.1 1.01 88.1* 1.03*75.2 0.71 89.8 0.80 91.2 0.84 63.5 0.60 74.0* 0.76*52.7** 0.82 ** … … … … 70.1 0.76 80.2 0.8649.6 1.02 45.8 1.03 77.4 ** 0.98 ** 83.1 0.87 78.4* 0.94*79.1** 0.96 ** 68.5 0.97 68.4 0.98 81.2 0.88 69.4* 0.91* 85.7** 1.00 ** … … 79.2 1.02 93.9 0.95 97.6 0.97
81.7 0.88 83.6 0.93 84.6 0.96 88.2 0.91 87.5 0.93
89.0 0.99 85.4 0.99 89.1 1.00 99.2 1.00 99.7 1.0096.2 1.00 96.6 1.00 95.6 1.01 99.7 1.00 99.7 1.0079.5 0.86 82.0 0.92 83.2 0.95 85.8 0.88 85.0 0.91
74.8 0.81 78.1 0.90 82.6 0.92 77.3 0.71 78.3 0.8590.1 0.98 87.2 0.97 89.0 0.98 99.2 0.98 98.9 0.9984.8 0.99 88.9 0.99 89.9 0.98 97.8 1.00 99.7 1.0095.9 0.96 95.7 1.00 92.1 0.99 97.2 0.96 97.9 0.9986.4 0.99 94.4 0.99 96.4 0.99 92.7 1.00 95.9 1.0197.0 1.00 96.3 1.00 95.3 1.01 99.7 1.00 99.8 1.0072.7 0.67 78.6 0.83 82.5 0.92 71.1 0.72 73.1 0.8054.5 0.86 56.2 0.88 63.5 0.90 74.8 0.80 72.0 0.88
Cape VerdeCentral African Republic
ChadComoros
CongoCôte d’Ivoire
Democratic Rep. of the CongoEquatorial Guinea
EritreaEthiopia
GabonGambia
GhanaGuinea
Guinea-BissauKenya
LesothoLiberia
MadagascarMalawi
MaliMauritius
MozambiqueNamibia
NigerNigeria
RwandaSao Tome and Principe
SenegalSeychelles 4
Sierra LeoneSomalia
South AfricaSwaziland
TogoUganda
United Republic of TanzaniaZambia
Zimbabwe
World
Countries in transitionDeveloped countries
Developing countries
Arab StatesCentral and Eastern Europe
Central AsiaEast Asia and the Pacific
Latin America and the CaribbeanNorth America and Western Europe
South and West AsiaSub-Saharan Africa
GOAL 2 GOAL 3
Universal primary education Learning needs of all youth and adults
NET ENROLMENT RATIO (NER) IN PRIMARY EDUCATION YOUTH LITERACY RATE (15-24)
1990/1991
Total (%) (F/M)
GPI
1998/1999
Total (%) (F/M)
GPI
2002/2003
Total (%) (F/M)
GPI
1990
Total(%) (F/M)
GPI
2000-20041
Total(%) (F/M)
GPICountry or territory
Weighted average Weighted average
6. Pending agreement on population data, the 2001 NERpublished herein in connection with China’s primary education is for reference only.7. Enrolment ratios were not calculated due to lack of UnitedNations population data by age.8. Enrolment ratios were not calculated due to inconsistenciesbetween enrolment and the United Nations population data.
9. Literacy rates for the most recent year were derived from the absolute numbers of illiterates and literates provided to the UIS through its literacy questionnaire.(g) Projected at the national level (593 districts) on the basis of data by age collected for ISCED level 1 in a sample of 193districts under the District Information System on Education.
Data in bold are for 2003/2004.(z) Data are for 2001/2002.(y) Data are for 2000/2001.

60
02
Education f
or A
ll G
lobal M
onitorin
g R
eport
3 9 2 / A N N E X
Table 13Trends in basic or proxy indicators to measure EFA goals 4 and 5
52.9 0.64 69.8* 0.76 * 100.5 0.85 106.8 0.92 108.7 0.9382.1 0.86 87.7* 0.90 * 110.0 1.00 100.7 1.01 97.1 1.0053.0 0.59 … … 37.7 0.71 38.1 0.71 42.5 0.7947.1 0.56 55.6* 0.65 * 91.5 0.83 98.6** 0.92** 97.4** 0.95 **35.7 0.38 115.6 0.84 99.5 0.82 110.1 0.8381.5 0.80 89.9* 0.89 * 100.6 1.01 96.5 1.00 99.1 1.0176.7 0.91 82.9 0.96 60.2 0.95 101.9 1.01 93.6 1.0080.3 0.83 … … 113.2 ** 0.96 ** 106.7 0.96 103.4 0.9768.1 0.62 81.7 0.77 104.7 0.94 115.7 0.98 114.1** 1.00 **34.8 0.52 51.2* 0.53 * 50.3 0.73 86.5 0.94 88.1 0.9738.7 0.47 50.7 0.61 65.2 0.69 89.2 0.81 109.6 0.9054.7 0.57 74.4 0.80 84.9 0.92 85.7 0.96 80.8 0.99… … 91.9* 0.91 * … … 105.7 1.01 98.8 1.0077.0 0.98 89.2* … * 100.5 0.93 108.0 0.97 105.7 0.9766.2 0.66 79.4* 0.80 * 72.7 0.86 68.7 0.97 66.6 0.9645.8 0.53 59.0* 0.72 * 52.3 0.77 54.5** 0.85** 60.2 0.8764.8 0.58 82.9* 0.82 * 102.2 0.90 103.6 0.92 114.9 0.9559.1 0.65 74.3* 0.78 * 113.7 0.89 114.9 0.95 110.7 0.9671.0 0.99 77.3 1.07 110.8 0.97 89.1 0.96 96.8 0.9732.7 0.23 49.0 0.41 65.4 ** 0.35 ** 73.3 0.56 83.5 0.69
77.0 0.77 98.7* 0.99 * 100.2 1.00 108.2** 0.99** 103.5 0.9899.5 1.00 99.6* 1.00 * 96.0 0.96 ** 108.9 0.98 101.9 0.99… … 94.6* 0.93 * … … … … … …
97.2 0.98 98.2* 0.99 * 97.6 0.97 103.4 0.97 100.3 0.9896.9 0.96 98.1* 0.98 * 79.7 0.99 95.7 0.98 96.5 0.99… … … … 96.4 1.00 104.0 0.99 102.0 0.9899.8 1.00 99.8* 1.00 * 110.8 0.97 102.2 0.97 100.7 0.9699.1 1.00 99.3* 1.00 * 94.5 1.00 103.5 0.98 100.3 0.99… … 99.7* 1.00 * 96.5 0.99 99.1 0.98 94.0 0.9799.3 1.00 99.6* 1.00 * 94.0 0.95 101.5 0.98 98.1 0.99… … … … 98.4 0.99 … … 99.5 0.9997.5 0.97 96.2* 0.98 * 93.1 1.00 84.3 1.00 86.0 0.9997.1 0.97 97.3* 0.98 * 91.3 1.00 104.3 0.98 99.0 0.9899.2 0.99 99.4* 1.00 * 109.2 1.00 100.5 0.99 118.2 1.00… … 96.4* 0.95 * 72.0 1.02 103.9 0.99 98.3y 1.00 y
… … 99.6* 1.00 * … … 102.5 0.99 100.7 0.9999.6 1.00 99.7 1.00 108.3 … 97.7 0.99 107.8 0.99… … 96.1* 0.96 * 99.3 0.98 101.8 0.98 96.5 1.0077.9 0.74 88.3* 0.85 * 99.1 0.92 … … 91.4** 0.93 **99.4 0.99 99.4* 0.99 * 88.8 1.00 105.7 0.99 92.7 1.00
97.5 0.97 99.4* 0.99 * … … … … 98.5 0.98… … 98.8* 0.99 * 110.6 ** 0.99 ** 90.9 1.00 92.3 0.97… … … … 97.3 1.00 95.3 1.00 90.5 0.9898.8 0.99 99.5* 1.00 * 88.2 0.99 ** 93.0 1.00 101.5 0.99… … 98.7* 0.99 * 92.8 1.00 101.1 0.98 100.9 0.97… … 97.8* 1.00 * 97.2 1.02 98.2 1.04 100.8 1.0298.2 0.98 99.5* 1.00 * 91.0 0.98 102.8 0.95 110.6 0.95… … 98.8* 0.99 * … … … … … …
98.7 0.98 99.3 0.99 81.4 0.98 … … 102.7 0.99
… … … … 107.7 0.99 100.8 1.00 103.6 1.0085.5 0.87 92.7* 0.95 * 115.3 0.94 114.5 0.98 106.1 1.0062.0 0.63 73.6* 0.76 * 83.4 0.81 ** 96.5 0.86 123.8 0.90
AlgeriaBahrainDjiboutiEgyptIraqJordanKuwaitLebanonLibyan Arab JamahiriyaMauritaniaMoroccoOmanPalestinian Autonomous TerritoriesQatarSaudi ArabiaSudan2
Syrian Arab RepublicTunisiaUnited Arab EmiratesYemen
AlbaniaBelarusBosnia and HerzegovinaBulgariaCroatiaCzech RepublicEstoniaHungaryLatviaLithuaniaPolandRepublic of MoldovaRomaniaRussian Federation3
Serbia and Montenegro4
SlovakiaSloveniaThe former Yugoslav Rep. of MacedoniaTurkeyUkraine
ArmeniaAzerbaijanGeorgiaKazakhstanKyrgyzstanMongoliaTajikistanTurkmenistanUzbekistan
AustraliaBrunei DarussalamCambodia
GOAL 5
Gender parity in primary education
GROSS ENROLMENT RATIO
1990/1991
Total(%) (F/M)
GPI
1998/1999
Total(%) (F/M)
GPI
2002/2003
Total(%) (F/M)
GPI
GOAL 4
Improving levels of adult literacy
ADULT LITERACY RATE (15 and over)
1990
Total(%) (F/M)
GPI
2000-20041
Total(%) (F/M)
GPICountry or territory
Arab States
Central and Eastern Europe
Central Asia
East Asia and the Pacific

S TAT I S T I C A L A N N E X / 3 9 3
Ta b l e 1 3
60.9 0.81 … … 80.0 1.0799.7 1.03 93.9 1.08 95.6 1.0711.6 0.66 16.2 0.72 24.3 0.6870.8 0.79 80.8 ** 0.92 ** 85.3 ** 0.94 **49.0 0.64 35.7 0.63 42.7 0.7163.3 1.04 86.9 1.03 86.0 1.0242.9 0.98 97.8 ** 1.02 ** 89.3 1.06… … 77.5 1.09 79.4 1.0985.9 … … … 104.7 ** 1.06 **13.4 0.46 18.7 ** 0.73 ** 22.6 0.7935.5 0.73 37.7 0.79 45.0 0.8344.9 0.81 71.7 0.99 80.5 0.96… … 78.8 1.04 87.9 1.0683.6 1.06 92.3 1.06 93.9 1.0443.7 0.79 67.9 0.87 66.9 0.9021.5 0.79 28.5 ** … 35.4 0.8448.8 0.73 40.6 0.91 48.3 0.9244.4 0.79 72.9 1.02 77.6 1.0865.4 1.21 82.1 1.08 78.7 1.03… … 41.9 0.37 47.3 0.45
78.3 0.86 75.8 ** 1.03 ** 81.1 1.0095.3 … 97.2 1.00 90.9 1.03… … … … … …
75.2 1.04 89.4 0.98 98.4 0.9769.2 1.09 87.6 1.02 89.8 1.0291.2 0.97 82.5 1.04 96.9 1.0398.5 1.11 92.7 1.04 96.4 1.0378.6 1.01 95.3 1.02 105.8 1.0091.0 1.00 88.4 1.04 95.3 1.0091.7 … 95.7 1.01 102.5 0.9881.5 1.05 … … 104.5 0.9680.0 1.09 72.2 1.01 73.3 1.0492.0 0.99 78.9 1.01 84.7 1.0193.3 1.06 … … 95.0 ** …
63.4 1.03 92.3 1.01 88.7 y 1.01 y
… … 85.2 1.02 91.7 1.0191.1 … 98.7 1.03 109.4 0.9955.7 0.99 82.3 0.97 84.7 0.9848.2 0.63 … … 79.1 ** 0.75 **92.8 … … … 96.9 0.99
… … … … 86.9 1.0287.5 1.01 76.9 0.99 82.8 0.9694.9 0.97 72.8 0.99 80.2 1.0197.5 1.04 87.4 0.99 91.8 1.00
100.1 1.02 85.4 1.02 91.9 1.0182.4 1.14 58.3 1.27 83.7 1.16
102.1 … 72.6 0.86 85.8 0.83… … … … … …
99.4 0.91 … … 95.4 0.97
81.7 1.04 154.8 1.04 153.7 0.9768.7 1.07 81.6 1.10 89.6 1.0628.9 0.43 16.0 ** 0.53 ** 25.2 0.64
AlgeriaBahrainDjibouti
EgyptIraq
JordanKuwait
LebanonLibyan Arab Jamahiriya
MauritaniaMorocco
OmanPalestinian Autonomous Territories
QatarSaudi Arabia
Sudan 2
Syrian Arab RepublicTunisia
United Arab EmiratesYemen
AlbaniaBelarus
Bosnia and HerzegovinaBulgariaCroatia
Czech RepublicEstonia
HungaryLatvia
LithuaniaPoland
Republic of MoldovaRomania
Russian Federation 3
Serbia and Montenegro 4
SlovakiaSlovenia
The former Yugoslav Rep. of MacedoniaTurkey
Ukraine
ArmeniaAzerbaijan
GeorgiaKazakhstanKyrgyzstan
MongoliaTajikistan
TurkmenistanUzbekistan
AustraliaBrunei Darussalam
Cambodia
GOAL 5
Gender parity in secondary education
GROSS ENROLMENT RATIO
2002/2003
Total(%) (F/M)
GPI
1998/1999
Total(%) (F/M)
GPI
1990/1991
Total(%) (F/M)
GPICountry or territory
Arab States
Central and Eastern Europe
Central Asia
East Asia and the Pacific

60
02
Education f
or A
ll G
lobal M
onitorin
g R
eport
3 9 4 / A N N E X
Table 13 (continued)
78.3 0.79 90.9* 0.91 * 125.2 0.93 … … 115.2 1.00… … … … … … … … … …… … … … … … … … … …
88.6 0.93 92.9* 0.97 * 131.4 1.00 ** 110.5** 0.99** 108.8**,z 1.00 **,z
79.5 0.84 87.9 0.90 114.3 0.98 … … 111.7 0.98… … … … 99.7 1.00 101.4 1.00 100.4 1.00… … … … … … 130.8 1.02 110.9 1.1656.5 0.61 68.7* 0.79 * 103.4 0.79 116.7 0.85 116.4 0.8790.5 0.92 91.3* 0.92 * 98.6 0.96 99.1 0.95 104.0 0.9380.7 0.86 88.7* 0.93 * 93.7 1.00 97.4 1.00 93.1 1.00… … … … … … … … 106.4z 0.93 z
… … … … … … … … … …
80.7 0.85 89.7* 0.92 * 108.6 0.95 90.1 0.98 91.9 1.0130.4 0.30 … … … … 81.0** 1.04** … …… … … … 105.6 0.98 102.6 1.00 101.7 0.99 **… … … … … … 102.9 0.87 117.6z 0.94 z
… … … … … … 113.8 0.93 115.8**,y 0.93 **,y
56.6 0.75 57.3* 0.80 * 66.2 0.86 74.8 0.93 73.4z 0.90 z
91.7 0.99 92.6* 1.00 * 109.5 0.99 113.1 1.00 112.5 0.99… … … … 104.9 1.01 95.3 1.01 105.5 0.9998.0 0.99 98.7 0.99 121.7 1.09 99.4 1.01 105.4** 0.97 **88.8 0.88 92.5* 0.92 * 103.7 0.97 … … … …… … … … 85.8 0.86 … … 71.6 …… … 92.6* 0.95 * 98.1 0.96 94.1 0.95 96.8 0.96… … … … … … … … 143.3z …… … … … … … … … … …… … 98.9* 1.00 * 105.8 0.96 110.4 0.97 112.3 0.97… … … … … … 103.6** 0.96** 102.2z 1.13 z
… … 74.0* … * 96.0 0.98 110.4 0.99 112.7 1.00… … 90.3* 0.93 * 106.9 0.93 ** 109.4 0.92 101.0 0.93
… … … … … … … … 99.9 1.01… … … … … … … … … …
95.7 1.00 97.2* 1.00 * 106.3 1.04 ** 119.7 1.00 119.4 1.00… … … … … … 112.2 0.98 115.1 0.9494.4 1.02 … … 95.6 1.03 ** … … 92.2** 1.01 **99.4 1.00 99.7 1.00 93.0 1.00 104.3 0.99 108.7 0.99… … 76.9* 1.01 * 111.5 0.98 118.1 0.97 122.0 0.98… … … … … … … … 102.2z …
78.1 0.80 86.5* 0.87 * 94.8 0.91 112.5 0.98 115.3 0.9982.0 0.98 88.4* 1.00 * 105.3 0.94 ** … … 147.0 0.95… … … … … … 111.6 0.97 106.6 0.94… … … … … … … … … …
94.0 0.99 95.7* 1.00 * 99.9 0.98 102.7 0.97 98.0 0.9788.4 0.99 94.2* 1.01 * 102.2 1.15 113.7 0.97 110.3 0.9993.9 1.00 95.8 1.00 101.9 0.99 104.3 1.00 107.6 0.9895.1 1.00 99.8* 1.00 * 97.7 0.97 105.3 0.96 97.8 0.96… … … … … … 98.8 0.95 88.2 0.9379.4 0.99 87.7* 0.99 * 94.8 ** 1.02 ** 116.7** 0.98** 124.3** 1.02 **87.6 0.94 91.0* 0.97 * 116.5 0.99 ** 113.4 1.00 116.9 1.0072.4 0.91 79.7 0.94 81.1 1.01 111.6 0.97 112.5 0.95… … … … … … … … 119.6 0.9861.0 0.77 69.1* 0.84 * 77.6 0.88 ** 94.0* 0.89* 106.1 0.9397.2 0.98 … … 93.6 0.98 116.9 0.98 124.8 0.98 **39.7 0.87 51.9 0.93 47.8 0.94 … … … …
68.1 0.98 80.0* 1.01 * 109.0 ** 1.05 ** … … 105.8**,z 1.02 **,z
82.2 1.10 87.6 1.09 101.3 0.99 95.4** 1.00** 99.8 0.9987.3 0.93 90.3* 0.96 * 113.9 0.98 110.9 0.99 110.4 0.99… … … … … … … … 118.3** …
China5
Cook Islands6
Democratic People’s Republic of KoreaFijiIndonesiaJapanKiribati4
Lao People’s Democratic RepublicMacao, ChinaMalaysiaMarshall Islands4
Micronesia (Federated States of)MyanmarNauru4
New ZealandNiue4
Palau4
Papua New GuineaPhilippinesRepublic of KoreaSamoaSingaporeSolomon IslandsThailandTimor-LesteTokelauTongaTuvalu4
VanuatuViet Nam
Anguilla4
Antigua and BarbudaArgentinaAruba4
BahamasBarbadosBelizeBermuda4
BoliviaBrazilBritish Virgin Islands4
Cayman Islands6
ChileColombiaCosta RicaCubaDominica4
Dominican RepublicEcuadorEl SalvadorGrenadaGuatemalaGuyanaHaitiHondurasJamaicaMexicoMontserrat4
GOAL 5
Gender parity in primary education
GROSS ENROLMENT RATIO
1990/1991
Total(%) (F/M)
GPI
1998/1999
Total(%) (F/M)
GPI
2002/2003
Total(%) (F/M)
GPI
GOAL 4
Improving levels of adult literacy
ADULT LITERACY RATE (15 and over)
1990
Total(%) (F/M)
GPI
2000-20041
Total(%) (F/M)
GPICountry or territory
Latin America and the Caribbean

S TAT I S T I C A L A N N E X / 3 9 5
Ta b l e 1 3
48.7 0.75 61.7 … 70.3 0.97… … … … … …… … … … … …
58.2 ** … … … 80.4 **,z 1.07 **,z
45.5 0.83 … … 60.7 0.9997.1 1.02 101.8 1.01 102.0 1.00… … … … 104.4 1.1324.4 * 0.62 * 33.4 0.69 43.7 0.7465.1 * 1.11 * 75.5 1.10 90.9 1.0756.3 1.07 69.4 1.11 70.3 1.11… … … … 75.7 z 1.02 z
… … 109.2 … … …
22.4 0.98 34.9 0.99 39.0 0.94… … 53.9 ** 1.06 ** … …
89.1 1.02 114.3 1.06 117.5 …… … 101.4 0.82 93.8 z 0.98 z
… … 101.2 1.07 88.8 **,y 1.00 **,y
11.5 0.59 20.4 0.75 25.5 0.7970.7 1.04 75.8 1.09 84.0 1.1089.8 0.97 99.9 1.00 90.5 1.0036.1 1.22 74.9 1.11 75.9 ** 1.10 **68.1 0.93 … … … …
14.0 0.63 … … 61.5 …
30.8 0.94 … … 76.7 1.00… … … … 34.6 z …… … … … … …
97.1 1.01 93.3 1.13 102.8 1.15… … 78.3 ** 0.88 ** 84.4 z 0.93 z
16.7 0.79 33.1 ** 0.83 ** 27.8 1.0832.2 … 61.9 0.90 72.4 0.93
… … … … 108.3 ** 1.00 **… … … … … …
71.1 … 89.0 1.08 99.7 1.06… … 100.6 1.04 103.1 1.07… … … … 91.3 ** 1.03 **… … 104.0 ** 1.05 ** 105.8 1.0243.9 1.15 64.8 1.08 77.8 ** 1.05 **… … … … 86.1 z …
36.7 0.85 72.3 0.93 86.4 ** 0.97 **38.4 … … … 110.0 1.10… … 98.8 0.91 94.7 1.16… … … … … …
73.5 1.08 79.6 1.04 91.2 1.0149.8 * 1.13 * 70.6 1.11 70.8 1.1143.0 1.05 56.8 1.09 66.5 1.0888.9 1.14 79.4 1.06 92.6 0.98… … 85.5 1.18 113.9 1.12… … 56.1 ** 1.27 ** 58.7 ** 1.23 **55.3 * … 56.4 1.03 59.2 1.0226.4 * 1.06 * 50.2 0.99 59.0 1.01… … … … 148.7 0.96… … 30.7 * 0.92 * 42.7 0.9378.7 1.06 81.1 1.02 94.7 ** 1.06 **20.6 * 0.96 * … … … …… … … … … …
65.3 1.06 84.1 ** 1.02 ** 84.1 1.0253.3 1.01 69.1 1.02 79.0 1.09… … … … 103.4 ** …
China 5
Cook Islands 6
Democratic People’s Republic of KoreaFiji
IndonesiaJapan
Kiribati 4
Lao People’s Democratic RepublicMacao, China
MalaysiaMarshall Islands 4
Micronesia (Federated States of)Myanmar
Nauru 4
New ZealandNiue 4
Palau 4
Papua New GuineaPhilippines
Republic of KoreaSamoa
SingaporeSolomon Islands
ThailandTimor-Leste
TokelauTongaTuvalu 4
VanuatuViet Nam
Anguilla 4
Antigua and BarbudaArgentina
Aruba 4
BahamasBarbados
BelizeBermuda 4
BoliviaBrazil
British Virgin Islands 4
Cayman Islands 6
ChileColombia
Costa RicaCuba
Dominica 4
Dominican RepublicEcuador
El SalvadorGrenada
GuatemalaGuyana
HaitiHondurasJamaicaMexico
Montserrat 4
GOAL 5
Gender parity in secondary education
GROSS ENROLMENT RATIO
2002/2003
Total(%) (F/M)
GPI
1998/1999
Total(%) (F/M)
GPI
1990/1991
Total(%) (F/M)
GPICountry or territory
Latin America and the Caribbean
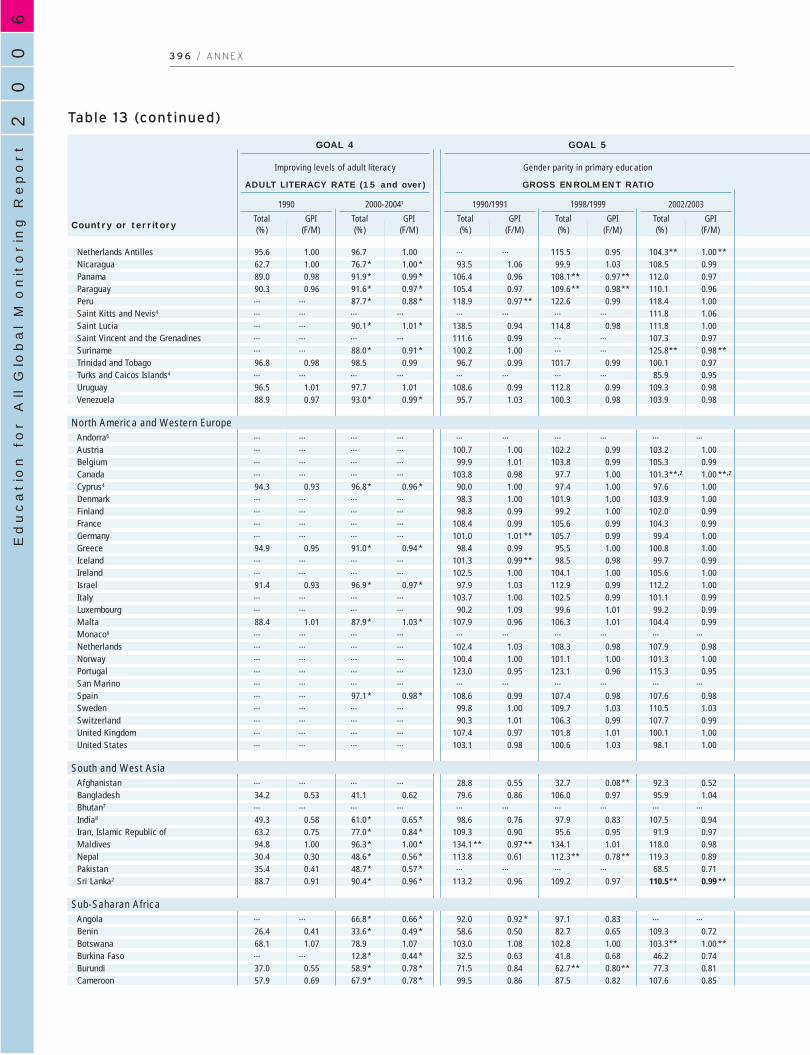
60
02
Education f
or A
ll G
lobal M
onitorin
g R
eport
3 9 6 / A N N E X
Table 13 (continued)
95.6 1.00 96.7 1.00 … … 115.5 0.95 104.3** 1.00 **62.7 1.00 76.7* 1.00 * 93.5 1.06 99.9 1.03 108.5 0.9989.0 0.98 91.9* 0.99 * 106.4 0.96 108.1** 0.97** 112.0 0.9790.3 0.96 91.6* 0.97 * 105.4 0.97 109.6** 0.98** 110.1 0.96… … 87.7* 0.88 * 118.9 0.97 ** 122.6 0.99 118.4 1.00… … … … … … … … 111.8 1.06… … 90.1* 1.01 * 138.5 0.94 114.8 0.98 111.8 1.00… … … … 111.6 0.99 … … 107.3 0.97… … 88.0* 0.91 * 100.2 1.00 … … 125.8** 0.98 **96.8 0.98 98.5 0.99 96.7 0.99 101.7 0.99 100.1 0.97… … … … … … … … 85.9 0.9596.5 1.01 97.7 1.01 108.6 0.99 112.8 0.99 109.3 0.9888.9 0.97 93.0* 0.99 * 95.7 1.03 100.3 0.98 103.9 0.98
… … … … … … … … … …… … … … 100.7 1.00 102.2 0.99 103.2 1.00… … … … 99.9 1.01 103.8 0.99 105.3 0.99… … … … 103.8 0.98 97.7 1.00 101.3**,z 1.00 **,z
94.3 0.93 96.8* 0.96 * 90.0 1.00 97.4 1.00 97.6 1.00… … … … 98.3 1.00 101.9 1.00 103.9 1.00… … … … 98.8 0.99 99.2 1.00 102.0 0.99… … … … 108.4 0.99 105.6 0.99 104.3 0.99… … … … 101.0 1.01 ** 105.7 0.99 99.4 1.0094.9 0.95 91.0* 0.94 * 98.4 0.99 95.5 1.00 100.8 1.00… … … … 101.3 0.99 ** 98.5 0.98 99.7 0.99… … … … 102.5 1.00 104.1 1.00 105.6 1.0091.4 0.93 96.9* 0.97 * 97.9 1.03 112.9 0.99 112.2 1.00… … … … 103.7 1.00 102.5 0.99 101.1 0.99… … … … 90.2 1.09 99.6 1.01 99.2 0.9988.4 1.01 87.9* 1.03 * 107.9 0.96 106.3 1.01 104.4 0.99… … … … … … … … … …… … … … 102.4 1.03 108.3 0.98 107.9 0.98… … … … 100.4 1.00 101.1 1.00 101.3 1.00… … … … 123.0 0.95 123.1 0.96 115.3 0.95… … … … … … … … … …… … 97.1* 0.98 * 108.6 0.99 107.4 0.98 107.6 0.98… … … … 99.8 1.00 109.7 1.03 110.5 1.03… … … … 90.3 1.01 106.3 0.99 107.7 0.99… … … … 107.4 0.97 101.8 1.01 100.1 1.00… … … … 103.1 0.98 100.6 1.03 98.1 1.00
… … … … 28.8 0.55 32.7 0.08** 92.3 0.5234.2 0.53 41.1 0.62 79.6 0.86 106.0 0.97 95.9 1.04… … … … … … … … … …
49.3 0.58 61.0* 0.65 * 98.6 0.76 97.9 0.83 107.5 0.9463.2 0.75 77.0* 0.84 * 109.3 0.90 95.6 0.95 91.9 0.9794.8 1.00 96.3* 1.00 * 134.1 ** 0.97 ** 134.1 1.01 118.0 0.9830.4 0.30 48.6* 0.56 * 113.8 0.61 112.3** 0.78** 119.3 0.8935.4 0.41 48.7* 0.57 * … … … … 68.5 0.7188.7 0.91 90.4* 0.96 * 113.2 0.96 109.2 0.97 110.5** 0.99 **
… … 66.8* 0.66 * 92.0 0.92 * 97.1 0.83 … …
26.4 0.41 33.6* 0.49 * 58.6 0.50 82.7 0.65 109.3 0.7268.1 1.07 78.9 1.07 103.0 1.08 102.8 1.00 103.3** 1.00 **… … 12.8* 0.44 * 32.5 0.63 41.8 0.68 46.2 0.7437.0 0.55 58.9* 0.78 * 71.5 0.84 62.7** 0.80** 77.3 0.8157.9 0.69 67.9* 0.78 * 99.5 0.86 87.5 0.82 107.6 0.85
Netherlands AntillesNicaraguaPanamaParaguayPeruSaint Kitts and Nevis4
Saint LuciaSaint Vincent and the GrenadinesSurinameTrinidad and TobagoTurks and Caicos Islands4
UruguayVenezuela
Andorra6
AustriaBelgiumCanadaCyprus4
DenmarkFinlandFranceGermanyGreeceIcelandIrelandIsraelItalyLuxembourgMaltaMonaco6
NetherlandsNorwayPortugalSan MarinoSpainSwedenSwitzerlandUnited KingdomUnited States
AfghanistanBangladeshBhutan7
India8
Iran, Islamic Republic ofMaldivesNepalPakistanSri Lanka2
AngolaBeninBotswanaBurkina FasoBurundiCameroon
GOAL 5
Gender parity in primary education
GROSS ENROLMENT RATIO
1990/1991
Total(%) (F/M)
GPI
1998/1999
Total(%) (F/M)
GPI
2002/2003
Total(%) (F/M)
GPI
GOAL 4
Improving levels of adult literacy
ADULT LITERACY RATE (15 and over)
1990
Total(%) (F/M)
GPI
2000-20041
Total(%) (F/M)
GPICountry or territory
North America and Western Europe
South and West Asia
Sub-Saharan Africa
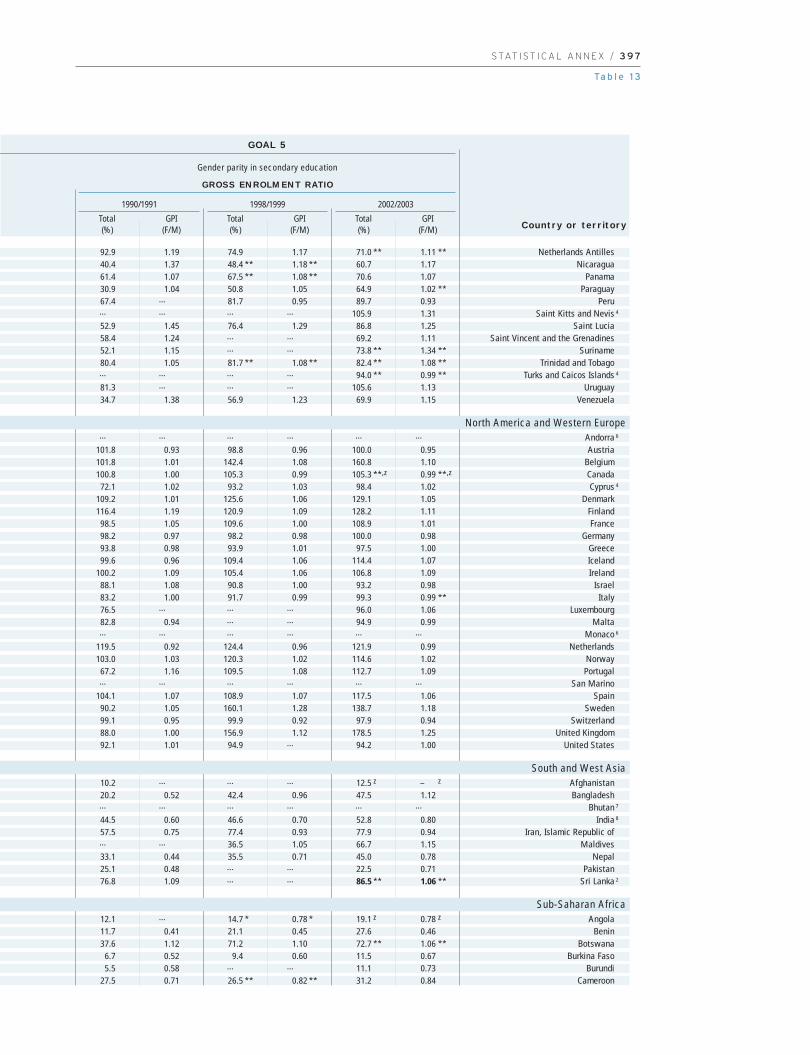
S TAT I S T I C A L A N N E X / 3 9 7
Ta b l e 1 3
92.9 1.19 74.9 1.17 71.0 ** 1.11 **40.4 1.37 48.4 ** 1.18 ** 60.7 1.1761.4 1.07 67.5 ** 1.08 ** 70.6 1.0730.9 1.04 50.8 1.05 64.9 1.02 **67.4 … 81.7 0.95 89.7 0.93… … … … 105.9 1.3152.9 1.45 76.4 1.29 86.8 1.2558.4 1.24 … … 69.2 1.1152.1 1.15 … … 73.8 ** 1.34 **80.4 1.05 81.7 ** 1.08 ** 82.4 ** 1.08 **… … … … 94.0 ** 0.99 **81.3 … … … 105.6 1.1334.7 1.38 56.9 1.23 69.9 1.15
… … … … … …
101.8 0.93 98.8 0.96 100.0 0.95101.8 1.01 142.4 1.08 160.8 1.10100.8 1.00 105.3 0.99 105.3 **,z 0.99 **,z
72.1 1.02 93.2 1.03 98.4 1.02109.2 1.01 125.6 1.06 129.1 1.05116.4 1.19 120.9 1.09 128.2 1.11
98.5 1.05 109.6 1.00 108.9 1.0198.2 0.97 98.2 0.98 100.0 0.9893.8 0.98 93.9 1.01 97.5 1.0099.6 0.96 109.4 1.06 114.4 1.07
100.2 1.09 105.4 1.06 106.8 1.0988.1 1.08 90.8 1.00 93.2 0.9883.2 1.00 91.7 0.99 99.3 0.99 **76.5 … … … 96.0 1.0682.8 0.94 … … 94.9 0.99… … … … … …
119.5 0.92 124.4 0.96 121.9 0.99103.0 1.03 120.3 1.02 114.6 1.02
67.2 1.16 109.5 1.08 112.7 1.09… … … … … …
104.1 1.07 108.9 1.07 117.5 1.0690.2 1.05 160.1 1.28 138.7 1.1899.1 0.95 99.9 0.92 97.9 0.9488.0 1.00 156.9 1.12 178.5 1.2592.1 1.01 94.9 … 94.2 1.00
10.2 … … … 12.5 z – z
20.2 0.52 42.4 0.96 47.5 1.12… … … … … …
44.5 0.60 46.6 0.70 52.8 0.8057.5 0.75 77.4 0.93 77.9 0.94… … 36.5 1.05 66.7 1.1533.1 0.44 35.5 0.71 45.0 0.7825.1 0.48 … … 22.5 0.7176.8 1.09 … … 86.5 ** 1.06 **
12.1 … 14.7 * 0.78 * 19.1 z 0.78 z
11.7 0.41 21.1 0.45 27.6 0.4637.6 1.12 71.2 1.10 72.7 ** 1.06 **
6.7 0.52 9.4 0.60 11.5 0.675.5 0.58 … … 11.1 0.73
27.5 0.71 26.5 ** 0.82 ** 31.2 0.84
Netherlands AntillesNicaragua
PanamaParaguay
PeruSaint Kitts and Nevis 4
Saint LuciaSaint Vincent and the Grenadines
SurinameTrinidad and Tobago
Turks and Caicos Islands 4
UruguayVenezuela
Andorra 6
AustriaBelgiumCanadaCyprus 4
DenmarkFinlandFrance
GermanyGreeceIcelandIreland
IsraelItaly
LuxembourgMalta
Monaco 6
NetherlandsNorwayPortugal
San MarinoSpain
SwedenSwitzerland
United KingdomUnited States
AfghanistanBangladesh
Bhutan 7
India 8
Iran, Islamic Republic ofMaldives
NepalPakistan
Sri Lanka 2
AngolaBenin
BotswanaBurkina Faso
BurundiCameroon
GOAL 5
Gender parity in secondary education
GROSS ENROLMENT RATIO
2002/2003
Total(%) (F/M)
GPI
1998/1999
Total(%) (F/M)
GPI
1990/1991
Total(%) (F/M)
GPICountry or territory
North America and Western Europe
South and West Asia
Sub-Saharan Africa

60
02
Education f
or A
ll G
lobal M
onitorin
g R
eport
3 9 8 / A N N E X
Table 13 (continued)
63.8 0.71 75.7 0.80 113.8 0.94 ** 125.6 0.96 120.6 0.9533.2 0.44 48.6* 0.52 * 65.5 0.63 … … 65.5 0.6827.7 0.51 25.5* 0.31 * 54.7 0.45 67.0 0.58 78.3** 0.64 **53.8 0.76 56.2 0.77 75.0 0.73 75.2 0.85 89.6** 0.82 **67.1 0.75 82.8 0.87 116.8 0.90 49.6 0.95 80.4 0.9338.5 0.51 48.1* 0.64 * 65.1 0.71 73.1 0.75 77.6* 0.80 *47.5 0.56 65.3* 0.65 * 70.6 0.75 49.6 0.90 … …
73.3 0.71 84.2* 0.83 * 162.6 ** 0.95 ** 131.3 0.91** 126.2z 0.91 z
46.4 0.59 … … 21.3 0.94 53.2 0.83 63.4 0.8128.6 0.53 41.5 0.69 31.8 0.66 49.9 0.60 70.0 0.77… … … … 141.8 ** 0.98 ** 134.1 1.00 132.2 0.9925.6 0.62 … … 61.1 0.68 79.9 0.85 85.2 0.98 **58.5 0.67 54.1* 0.73 * 72.1 0.83 76.8 0.90 83.0 0.9127.2 0.30 … … 34.0 0.47 58.4 0.63 81.5 0.77… … … … 49.9 ** 0.55 ** … … 69.7**,y 0.67 **,y
70.8 0.75 73.6* 0.90 * 94.5 0.95 90.2 0.98 92.4 0.9478.0 1.37 81.4* 1.23 * 112.1 1.21 109.2 1.08 126.4 1.0139.2 0.41 55.9 0.54 … … 89.6 0.74 … …
58.0 0.75 70.6* 0.85 * 93.6 0.98 95.6 0.97 119.6 0.9651.8 0.53 64.1* 0.72 * 68.0 0.83 146.2 0.95** 140.1 0.96… … 19.0* 0.44 * 25.3 0.60 48.8 0.71 58.4 0.7679.8 0.88 84.3* 0.91 * 109.2 1.00 107.6 1.00 103.8 1.0133.5 0.37 46.5 0.50 63.9 0.76 81.2** 0.74** 103.4 0.8174.9 0.94 85.0* 0.96 * 123.9 1.09 113.9 1.01 105.0 1.0111.4 0.28 14.4* 0.48 * 27.8 0.58 30.9 0.67 43.5 0.6948.7 0.65 66.8 0.80 91.9 0.78 86.1** 0.76** 119.4 0.8153.3 0.70 64.0* 0.84 * 71.3 0.98 118.6 0.97 122.0 1.00… … … … … … 107.1 0.96 126.4**,z 0.94 **,z
28.4 0.49 39.3* 0.57 * 57.5 0.73 68.6 0.86** 79.9 0.92… … 91.9* 1.01 * … … 112.8 0.98 109.6 0.99… … 29.6* 0.52 * 50.3 0.69 … … 78.9y 0.70 y
… … … … … … … … … …
81.2 0.98 82.4* 0.96 * 106.6 0.99 114.4* 0.97* 105.6 0.9671.6 0.95 79.2* 0.97 * 97.7 0.98 104.3 0.95 98.2 0.9344.2 0.47 53.0* 0.56 * 110.0 0.66 132.3 0.76 121.2 0.8356.1 0.63 68.9 0.75 68.7 0.80 143.3 0.90 140.7 0.9862.9 0.68 69.4* 0.80 * 67.2 0.98 61.8 0.99 90.8 0.9668.2 0.75 67.9* 0.78 * 93.7 0.91 ** 81.2 0.93 82.2 0.9380.7 0.87 90.0 0.92 103.6 0.99 … … 92.9 0.98
75.4 0.84 81.9 0.88 99.1 0.89 100.5 0.92 103.6 0.94
99.2 0.99 99.4 0.99 97.0 0.99 100.5 0.99 105.6 0.9998.0 0.99 98.7 0.99 101.9 0.99 102.1 1.00 100.6 1.0067.0 0.76 76.4 0.83 98.8 0.87 100.3 0.91 103.9 0.93
50.0 0.56 62.7 0.69 85.7 0.80 89.7 0.87 93.8 0.9096.2 0.97 97.4 0.97 98.0 0.98 97.3 0.96 99.5 0.9798.7 0.99 99.2 0.99 89.4 0.99 98.9 0.99 101.6 0.9881.8 0.84 91.4 0.92 116.9 0.94 111.6 0.99 110.9 0.9985.0 0.96 89.7 0.98 104.3 0.98 121.4 0.98 119.5 0.9897.9 0.99 98.7 0.99 104.0 0.99 102.5 1.01 100.8 1.0047.5 0.58 58.6 0.66 92.2 0.76 94.5 0.83 102.0 0.9249.9 0.67 59.7 0.76 73.5 0.83 80.0 0.84 91.1 0.86
Cape VerdeCentral African RepublicChadComorosCongoCôte d’IvoireDemocratic Rep. of the CongoEquatorial GuineaEritreaEthiopiaGabonGambiaGhanaGuineaGuinea-BissauKenyaLesothoLiberiaMadagascarMalawiMaliMauritiusMozambiqueNamibiaNigerNigeriaRwandaSao Tome and PrincipeSenegalSeychelles4
Sierra LeoneSomaliaSouth AfricaSwazilandTogoUgandaUnited Republic of TanzaniaZambiaZimbabwe
World
Countries in transitionDeveloped countriesDeveloping countries
Arab StatesCentral and Eastern EuropeCentral AsiaEast Asia and the PacificLatin America and the CaribbeanNorth America and Western EuropeSouth and West AsiaSub-Saharan Africa
GOAL 5
Gender parity in primary education
GROSS ENROLMENT RATIO
1990/1991
Total(%) (F/M)
GPI
1998/1999
Total(%) (F/M)
GPI
2002/2003
Total(%) (F/M)
GPI
GOAL 4
Improving levels of adult literacy
ADULT LITERACY RATE (15 and over)
1990
Total(%) (F/M)
GPI
2000-20041
Total(%) (F/M)
GPICountry or territory
Weighted average Weighted average
1. Data refer to the most recent year available during the period specified.See introduction to the Statistical annex for broader explanation of nationalliteracy definitions, assessment methods, sources and years of data.2. Literacy data for the most recent year do not include some geographicregions.
3. In countries where two or more education structures exist, indicators were calculated on the basis of themost common or widespread structure. In the Russian Federation this is three grades of primary educationstarting at age 7. However, a four-grade structure also exists, in which about one-third of primary pupils are enrolled. Gross enrolment ratios may be overestimated.4. National population data were used to calculate enrolment ratios.

S TAT I S T I C A L A N N E X / 3 9 9
Ta b l e 1 3
20.9 * … … … 69.7 1.0911.5 0.40 … … … …
7.0 0.20 10.7 0.26 14.5 ** 0.33 **17.6 * 0.65 * 24.8 0.81 31.0 0.8346.2 0.72 … … 32.0 **,z 0.71 **,z
21.3 0.48 22.5 ** 0.54 ** 25.9 **,z 0.56 **,z
… … 18.4 0.52 … …… … 31.0 0.61 ** 29.7 **,z 0.57 **,z
… … 23.3 0.69 28.1 0.6513.5 0.75 12.9 0.67 21.9 0.57… … 45.7 0.86 50.9 **,z …
18.4 0.49 31.4 0.64 34.1 ** 0.69 **34.7 0.63 36.7 0.78 42.4 0.81
9.5 0.33 13.9 ** 0.36 ** 24.1 ** 0.46 **… … … … 17.8 **,y 0.54 **,y
23.8 0.74 29.9 ** 0.90 ** 32.9 0.92 **25.4 1.47 31.7 1.39 34.7 1.28… … 30.5 0.65 … …
17.6 0.97 14.3 ** 0.96 ** … …
8.0 0.46 32.9 0.70 ** 33.0 ** 0.76 **6.6 0.51 13.6 0.53 19.5 0.55
52.9 1.01 70.8 ** 1.00 ** 81.2 1.006.9 0.57 9.8 ** 0.68 ** 15.9 0.66
38.9 1.26 57.3 1.15 62.4 1.126.5 0.43 6.7 0.63 7.0 0.66
24.8 0.77 … … 36.4 0.818.2 0.76 9.6 0.88 16.1 0.81
… … … … 39.2 **,z 0.84 **,z
16.3 0.53 16.7 ** 0.64 ** 19.4 0.69… … 114.0 1.00 110.9 1.0016.6 0.57 … … 26.4 y 0.70 **,y
… … … … … …
66.3 1.16 89.8 * 1.13 * 87.7 ** 1.08 **41.3 0.93 48.4 1.00 45.3 1.0122.7 0.34 33.6 0.40 … …
12.5 0.56 9.8 0.64 19.7 ** 0.80 **4.7 0.70 5.5 ** 0.82 ** … …
19.6 … 19.8 0.77 ** 27.9 0.8346.9 0.87 … … 36.3 0.91
56.3 1.07 59.7 0.90 65.2 0.94
95.1 … 88.9 1.01 92.8 0.9891.7 … 103.4 1.01 106.6 1.0339.7 … 51.8 0.86 58.3 0.92
48.8 0.73 59.9 0.88 65.0 0.9186.3 1.03 85.4 0.98 92.3 0.9597.5 1.04 85.7 0.97 89.0 0.9752.5 0.91 64.4 0.93 71.0 0.9853.3 1.01 71.7 1.09 88.2 1.0898.5 1.05 105.3 1.01 108.2 1.0433.1 0.44 45.6 0.74 49.9 0.8417.6 0.81 24.5 0.80 28.4 0.78
Cape VerdeCentral African Republic
ChadComoros
CongoCôte d’Ivoire
Democratic Rep. of the CongoEquatorial Guinea
EritreaEthiopia
GabonGambia
GhanaGuinea
Guinea-BissauKenya
LesothoLiberia
MadagascarMalawi
MaliMauritius
MozambiqueNamibia
NigerNigeria
RwandaSao Tome and Principe
SenegalSeychelles 4
Sierra LeoneSomalia
South AfricaSwaziland
TogoUganda
United Republic of TanzaniaZambia
Zimbabwe
World
Countries in transitionDeveloped countries
Developing countries
Arab StatesCentral and Eastern Europe
Central AsiaEast Asia and the Pacific
Latin America and the CaribbeanNorth America and Western Europe
South and West AsiaSub-Saharan Africa
GOAL 5
Gender parity in secondary education
GROSS ENROLMENT RATIO
2002/2003
Total(%) (F/M)
GPI
1998/1999
Total(%) (F/M)
GPI
1990/1991
Total(%) (F/M)
GPICountry or territory
Median Weighted average
5. Children enter primary school at age 6 or 7. Since 7 is the most common entrance age, enrolment ratios were calculated using the 7-11 age group for both enrolments and population.6. Enrolment ratios were not calculated due to lack of UnitedNations population data by age.
7. Enrolment ratios were not calculated due to inconsistenciesbetween enrolment and the United Nations population data.8. Literacy rates for the most recent year were derived fromthe absolute numbers of illiterates and literates provided tothe UIS through its literacy questionnaire.
Data in bold are for 2003/2004.(y) Data are for 2000/2001.(z) Data are for 2001/2002.

60
02
Education f
or A
ll G
lobal M
onitorin
g R
eport
4 0 0 / A N N E X
Table 14Trends in basic or proxy indicators to measure EFA goal 6
10.3 … … … … … 12.4** … … 94.5 0.99 95.0 1.02 97.0 1.0113.5 13.2 13.7 12.8** 12.3** 13.4** 13.5** 12.9** 14.2 ** 89.2 1.01 97.4 ** 1.01 ** 99.1** 1.02**… … … 3.5** … … 4.4** 5.1** 3.8** 87.3 … 76.7 1.19 80.2** …
9.7 10.8 8.5 12.4** … … 11.6** … … … … … … 98.0** 1.04**… … … 8.9** 10.1** 7.5** … … … … … 65.6 ** 0.94 ** … …
12.5 12.4 12.7 … … … 12.8** 12.7** 13.0 ** 99.1 1.02 97.7 0.99 97.1 1.01… … … 13.5** 12.9** 14.3** … … … … … … … … …… … … 12.6** 12.4** 12.7** 13.2** 12.9** 13.5 ** … … 91.3 1.07 91.9 1.0513.0 … … … … … 16.4** 15.9** 17.0 ** … … … … … …
4.1 5.0 3.2 6.9** … … 7.1** 7.4** 6.7 ** 75.3 0.99 65.2 ** 0.92 ** 60.6 0.996.6 7.8 5.4 8.2** 9.1** 7.3** 9.9** 10.5** 9.2 ** 75.1 1.02 81.9 1.00 81.2 0.988.2 8.8 7.7 … … … 10.4**,z 10.5**,z 10.4 **,z 96.9 0.99 93.7 1.00 98.0 1.00
… … … 11.9 11.7 11.9 12.9 12.4 13.1 … … … … … …
12.3 11.8 13.2 13.3** 12.6** 14.3** 13.1** 12.6** 13.7 ** 64.1 1.02 … … … …
7.8 8.4 7.2 9.7** 9.8** 9.5** 9.6** 9.7** 9.5 ** 82.9 1.03 95.3 1.00 91.5 0.984.4 5.0 3.9 5.1** … … … … … 93.8 1.09 84.1 ** 1.10 ** 84.3 1.09
10.0 10.9 8.9 … … … … … … 96.0 0.98 91.8 0.99 91.4 1.0210.4 11.3 9.5 12.7** 12.8** 12.5** 13.3** 13.0** 13.6 ** 86.6 0.83 92.1 1.02 96.2 1.0111.0 10.6 11.7 11.2** 10.7** 12.1** 12.1** 11.4** 13.1 ** 80.0 0.99 92.4 0.99 92.5 1.00… … … 7.8** 10.6** 4.9** … … … … … … 75.9 0.89
11.5 11.7 11.3 … … … 11.4 11.2 11.6 … … … … … …
13.1 … … 13.8** 13.6** 14.0** 14.2 13.7 14.6 … … … … … …… … … … … … … … … … … … … … …
12.3 12.3 12.3 12.7 12.2 13.1 12.8 12.7 12.8 90.6 0.99 … … … …
10.2 … … 12.5 12.2 12.6 13.1 12.8 13.3 … … … … … …
11.9 12.1 11.7 … … … 14.9 14.6 15.1 … … 98.3 1.01 97.7 1.0112.8 12.6 13.0 13.9 13.2 14.6 15.8 14.4 16.7 … … 99.1 1.01 98.4 1.0211.4 11.4 11.4 14.0** 13.8** 14.3** 15.6 14.9 16.1 97.6 … … … … …
12.4 12.2 12.5 13.7 12.8 14.4 15.2 13.8 16.1 … … … … … …… … … … … … 15.8 14.9 16.5 … … … … … …
12.2 12.0 12.4 … … … 15.6 14.9 16.1 97.8 … 98.6 … 99.3 …
11.9 … … 9.9** 9.7** 10.1** 10.1 9.8 10.4 … … … … … …
11.5 11.5 11.4 11.8 11.6 12.0 12.7 12.3 13.0 … … … … … …
12.5 12.0 13.0 … … … 13.5** … … … … … … … …… … … 13.3 13.2 13.4 12.9**,y 12.7**,y 13.1 **,y … … … … … …… … … 13.1** 13.0** 13.3** 14.0 13.7 14.1 … … … … … …… … … 14.3** 13.6** 14.8** 16.3** 15.5** 16.8 ** … … … … … …
11.0 11.0 11.0 11.9 11.9 11.9 11.2** 11.0** 11.5 ** … … … … … …
8.5 9.5 7.4 … … … 10.9** 11.8** 9.9 ** 97.6 0.99 … … … …
12.3 … … … … … 13.4 13.0* 13.7 * 97.7 … … … … …
… … … … … … 10.9 10.5 11.2 … … … … … …
10.5 10.8 10.3 10.0 10.1 9.9 10.6 10.7 10.4 … … … … … …
12.4 12.3 12.4 10.8** 10.6** 10.9** 11.3** 11.2** 11.3 ** … … … … … …
12.4 … … 11.5 11.3 11.7 13.5** 13.1** 13.9 ** … … … … … …
10.4 … … 11.6 11.3 11.8 12.8 12.5 13.1 … … … … … …
9.4 8.8 10.0 8.7** 7.8** 9.6** 11.0 10.0 11.9 … … … … … …
11.7 … … 9.9** 10.7** 9.1** 11.3 12.2 10.2 … … … … … …… … … … … … … … … … … … … … …
11.6 … … … … … 11.6** 11.8** 11.4 ** … … … … … …
13.2 13.0 13.4 19.6** 19.0** 19.9** 20.6 19.4 20.8 … … … … … …… … … 13.1** 12.7** 13.4** 13.4** 13.1** 13.8 ** … … … … 93.0y 1.01y
7.0 … … … … … 9.1** 9.9** 8.3 ** … … 56.3 ** 0.93 ** 60.9 1.05
AlgeriaBahrainDjiboutiEgyptIraqJordanKuwaitLebanonLibyan Arab JamahiriyaMauritaniaMoroccoOmanPalestinian A. T.QatarSaudi ArabiaSudanSyrian Arab RepublicTunisiaUnited Arab EmiratesYemen
AlbaniaBelarusBosnia and HerzegovinaBulgariaCroatiaCzech RepublicEstoniaHungaryLatviaLithuaniaPolandRepublic of MoldovaRomaniaRussian FederationSerbia and MontenegroSlovakiaSloveniaTFYR MacedoniaTurkeyUkraine
ArmeniaAzerbaijanGeorgiaKazakhstanKyrgyzstanMongoliaTajikistanTurkmenistanUzbekistan
AustraliaBrunei DarussalamCambodia
GOAL 6. Educational quality in primary education
SCHOOL LIFE EXPECTANCY(expected number of years of formal schooling)
SURVIVAL RATETO GRADE 5
1990/1991
Total Male Female
1998/1999
Total Male Female
2002/2003 1990/1991 1998/1999 2001/2002
Total Male Female(%) (F/M)
Country or territory Total GPI(%) (F/M)
Total GPI(%) (F/M)
Total GPI
123456789
1011121314151617181920
2122232425262728293031323334353637383940
414243444546474849
505152
Arab States
Central and Eastern Europe
Central Asia
East Asia and the Pacific

S TAT I S T I C A L A N N E X / 4 0 1
Ta b l e 1 4
28 28 28 39 46 49 94 98 … … … … … … … … …
19 … 16 **,z 54 … 76 **,z … … … … 2.1** … … 1 731 ** … … 2 701 ** 43 40 34 **,z 37 28 30 **,z … … 2.0 … … 411 … … … … …
24 23 ** 22 ** 52 52 ** 54 ** … 100 **,y … … … … … … … … …
25 25 19 70 72 … … … … … … … … … … … …
25 … 20 ** 62 … 64 ** … … … 1.9 2.0 … 216 239 … 477 56118 13 13 61 73 83 100 100 1.5 … … … … … … … …… 14 17 … 82 87 … 14 … … … … … … … … …
14 … … … … … … … … … … … … … … … …
45 47 41 18 26 25 ** … … 1.3 … … 50 … … 111 … …
27 28 28 37 39 44 … … … 2.3 2.5 … 210 217 … 561 67928 25 21 ** 47 52 57 ** 100 100 **,z 1.7 1.5 1.5** 677 800 880 ** 988 1 572 1 466 ** … … 36 … … 62 … … … … … … … … … … …
11 13 12 72 75 83 … … … … … … … … … … …
16 12 12 48 54 51 … 93 y … … … … … … … … …
34 … 29 ** 51 … 62 ** … … … … … … … … … … …
25 25 ** 24 **,z 64 68 ** 68 **,z … 88 y … … 2.1 … … 131 … … 38828 24 22 45 50 50 … 94 **,y … … 2.2** … … 346 ** … … 1 088 ** 18 16 15 64 73 80 … … … … … … … 1 532 … … …… 30 ** … … 21 ** … … … … … … … … … … … …
19 23 ** 21 55 75 ** 76 … … … … … … … … … … …… 20 16 … 99 99 … 98 1.6 … … … … … … … …… … … … … … … … … … … … … … … … …
15 18 17 77 91 ** 92 … … 2.6 0.7 0.7**,z … 223 305 **,z … 796 1 213 **,z
19 19 18 75 89 90 100 100 … … 0.9** … … 1 054 ** … … 2 148 ** 23 18 17 … 85 ** 84 … … … 0.6 0.7 … 623 814 … 1 452 1 887… 16 14 **,z … … … … … … 1.4 1.4 … 605 935 … 1 440 2 39013 11 10 84 85 84 … … 2.3 0.9 ** 1.0 1 110 932 ** 1 287 3 146 2 173 ** 2 66015 15 14 … 97 97 … … … … 1.1**,y … … 677 **,y … … 1 705 **,y
18 17 16 94 98 98 … … … … … … … … … … …
16 … 11 ** … … … … … 1.8 … 1.8 435 … 1 121 1 682 … 2 41823 21 19 97 96 96 … … … … 0.8** … … 65 ** … … 251 ** 22 19 ** 17 84 85 ** 87 … … 1.2 … 0.5** 501 … 211 ** 1 616 … 673 ** 22 18 ** 17 99 98 ** 97 ** … … … … … … … … … … …… 20 ** 20 y … 82 ** 82 y 100 ** 100 y … … … … 733 … … … …… 19 18 … 93 92 … … … … 0.6 … … 520 … … 1 515… 14 13 … 96 96 … … … … … … … … … … …
21 22 20 … 66 69 … … … … … … … … …
30 … … 43 … … … … 1.1 … 1.4**,z 212 … 286 **,z 336 … 800 **,z
22 20 19 98 98 99 … 100 … 0.5 ** … … 77 ** … … 337 ** …
… … 18 … … 99 … … … … 0.2**,z … … 36 **,z … … 143 **,z
… 19 15 … 83 85 100 100 … … 0.6** … … 54 ** … … 235 ** 17 17 14 92 92 95 … 97 … … … … … … … … …
21 … 19 96 … 98 … … … … … … … … … … …… 24 24 81 95 97 48 52 … 0.9 ** … … … … … … …
28 32 31 90 93 93 … 93 y … … 3.2 … … 157 … … 58621 22 22 49 56 62 … 82 … … … … … … … … …… … … … … … … … … … … … … … … … …
24 … … 79 … … … … … … … … … … … … …
… 18 … … … … … … … 1.5 ** 1.6 … 2 844 ** 3 346 … 3 513 ** 4 542… 14 * 13 ** … 66 * 71 ** … … 0.5 … … … … … … … …
33 48 ** 56 31 37 ** 40 … 96 z … 0.5 1.3z … 7 18 z … 37 115 z
GOAL 6. Educational quality in primary education
PUPIL/TEACHERRATIO
% FEMALETEACHERS
PUBLIC CURRENTEXPENDITURE ON
PRIMARY EDUCATION AS % GNP
TRAINEDTEACHERSas % of total
PUBLIC CURRENTEXPENDITURE ON PRIMARY
EDUCATION PER PUPIL(unit cost) in constant 2002 US$
PUBLIC CURRENTEXPENDITURE ON PRIMARY
EDUCATION PER PUPIL(unit cost) at PPP
in constant 2002 US$
1990/1991
1998/1999
2002/2003
1990/1991
1998/1999
2002/2003
1998/1999
2002/2003
1990 1998 2002 1990 1998 2002 1990 1998 2002
1234567891011121314151617181920
2122232425262728293031323334353637383940
414243444546474849
505152
Arab States
Central and Eastern Europe
Central Asia
East Asia and the Pacific
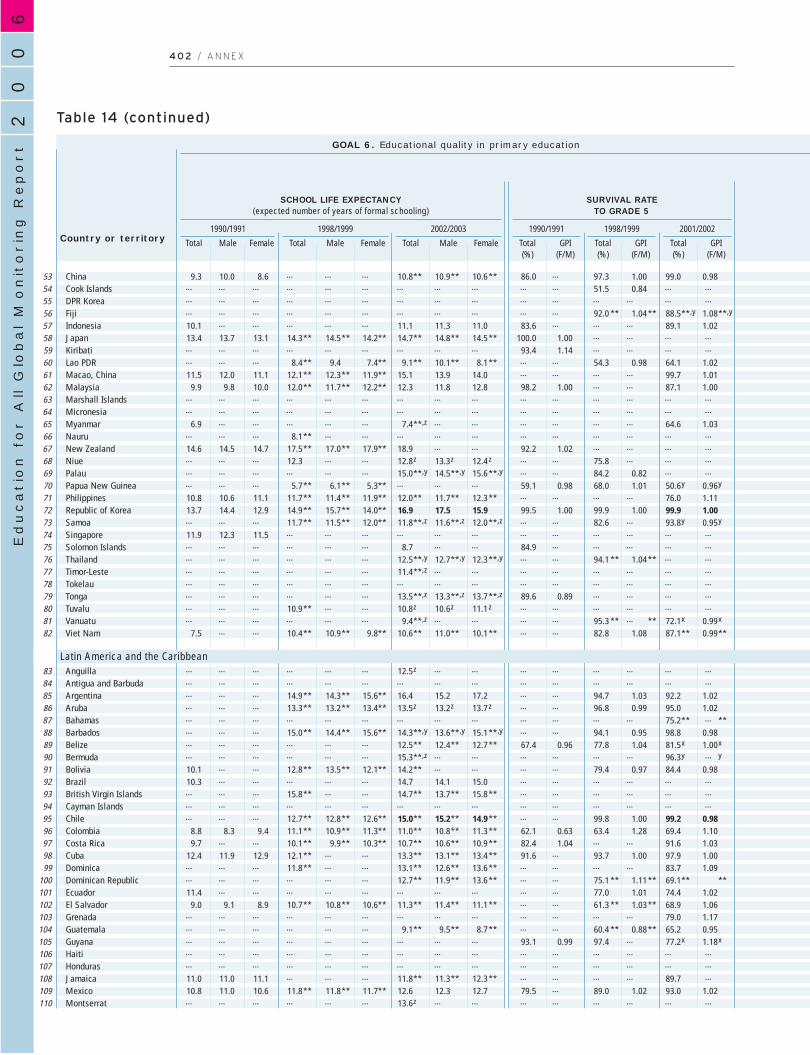
60
02
Education f
or A
ll G
lobal M
onitorin
g R
eport
4 0 2 / A N N E X
Table 14 (continued)
9.3 10.0 8.6 … … … 10.8** 10.9** 10.6 ** 86.0 … 97.3 1.00 99.0 0.98… … … … … … … … … … … 51.5 0.84 … …… … … … … … … … … … … … … … …… … … … … … … … … … … 92.0 ** 1.04 ** 88.5**,y 1.08**,y
10.1 … … … … … 11.1 11.3 11.0 83.6 … … … 89.1 1.0213.4 13.7 13.1 14.3** 14.5** 14.2** 14.7** 14.8** 14.5 ** 100.0 1.00 … … … …… … … … … … … … … 93.4 1.14 … … … …… … … 8.4** 9.4 7.4** 9.1** 10.1** 8.1 ** … … 54.3 0.98 64.1 1.0211.5 12.0 11.1 12.1** 12.3** 11.9** 15.1 13.9 14.0 … … … … 99.7 1.01
9.9 9.8 10.0 12.0** 11.7** 12.2** 12.3 11.8 12.8 98.2 1.00 … … 87.1 1.00… … … … … … … … … … … … … … …… … … … … … … … … … … … … … …
6.9 … … … … … 7.4**,z … … … … … … 64.6 1.03… … … 8.1** … … … … … … … … … … …
14.6 14.5 14.7 17.5** 17.0** 17.9** 18.9 … … 92.2 1.02 … … … …… … … 12.3 … … 12.8z 13.3z 12.4 z … … 75.8 … … …… … … … … … 15.0**,y 14.5**,y 15.6 **,y … … 84.2 0.82 … …… … … 5.7** 6.1** 5.3** … … … 59.1 0.98 68.0 1.01 50.6y 0.96y
10.8 10.6 11.1 11.7** 11.4** 11.9** 12.0** 11.7** 12.3 ** … … … … 76.0 1.1113.7 14.4 12.9 14.9** 15.7** 14.0** 16.9 17.5 15.9 99.5 1.00 99.9 1.00 99.9 1.00… … … 11.7** 11.5** 12.0** 11.8**,z 11.6**,z 12.0 **,z … … 82.6 … 93.8y 0.95y
11.9 12.3 11.5 … … … … … … … … … … … …… … … … … … 8.7 … … 84.9 … … … … …… … … … … … 12.5**,y 12.7**,y 12.3 **,y … … 94.1 ** 1.04 ** … …… … … … … … 11.4**,z … … … … … … … …… … … … … … … … … … … … … … …… … … … … … 13.5**,z 13.3**,z 13.7 **,z 89.6 0.89 … … … …… … … 10.9** … … 10.8z 10.6z 11.1 z … … … … … …… … … … … … 9.4**,z … … … … 95.3 ** … ** 72.1x 0.99x
7.5 … … 10.4** 10.9** 9.8** 10.6** 11.0** 10.1 ** … … 82.8 1.08 87.1** 0.99**
… … … … … … 12.5z … … … … … … … …… … … … … … … … … … … … … … …… … … 14.9** 14.3** 15.6** 16.4 15.2 17.2 … … 94.7 1.03 92.2 1.02… … … 13.3** 13.2** 13.4** 13.5z 13.2z 13.7 z … … 96.8 0.99 95.0 1.02… … … … … … … … … … … … … 75.2** … **… … … 15.0** 14.4** 15.6** 14.3**,y 13.6**,y 15.1 **,y … … 94.1 0.95 98.8 0.98… … … … … … 12.5** 12.4** 12.7 ** 67.4 0.96 77.8 1.04 81.5x 1.00x
… … … … … … 15.3**,z … … … … … … 96.3y … y
10.1 … … 12.8** 13.5** 12.1** 14.2** … … … … 79.4 0.97 84.4 0.9810.3 … … … … … 14.7 14.1 15.0 … … … … … …… … … 15.8** … … 14.7** 13.7** 15.8 ** … … … … … …… … … … … … … … … … … … … … …… … … 12.7** 12.8** 12.6** 15.0** 15.2** 14.9** … … 99.8 1.00 99.2 0.98
8.8 8.3 9.4 11.1** 10.9** 11.3** 11.0** 10.8** 11.3 ** 62.1 0.63 63.4 1.28 69.4 1.109.7 … … 10.1** 9.9** 10.3** 10.7** 10.6** 10.9 ** 82.4 1.04 … … 91.6 1.03
12.4 11.9 12.9 12.1** … … 13.3** 13.1** 13.4 ** 91.6 … 93.7 1.00 97.9 1.00… … … 11.8** … … 13.1** 12.6** 13.6 ** … … … … 83.7 1.09… … … … … … 12.7** 11.9** 13.6 ** … … 75.1 ** 1.11 ** 69.1** **11.4 … … … … … … … … … … 77.0 1.01 74.4 1.02
9.0 9.1 8.9 10.7** 10.8** 10.6** 11.3** 11.4** 11.1 ** … … 61.3 ** 1.03 ** 68.9 1.06… … … … … … … … … … … … … 79.0 1.17… … … … … … 9.1** 9.5** 8.7 ** … … 60.4 ** 0.88 ** 65.2 0.95… … … … … … … … … 93.1 0.99 97.4 … 77.2x 1.18x
… … … … … … … … … … … … … … …… … … … … … … … … … … … … … …
11.0 11.0 11.1 … … … 11.8** 11.3** 12.3 ** … … … … 89.7 …
10.8 11.0 10.6 11.8** 11.8** 11.7** 12.6 12.3 12.7 79.5 … 89.0 1.02 93.0 1.02… … … … … … 13.6z … … … … … … … …
ChinaCook IslandsDPR KoreaFijiIndonesiaJapanKiribatiLao PDRMacao, ChinaMalaysiaMarshall IslandsMicronesia MyanmarNauruNew ZealandNiuePalauPapua New GuineaPhilippinesRepublic of KoreaSamoaSingaporeSolomon IslandsThailandTimor-LesteTokelauTongaTuvaluVanuatuViet Nam
AnguillaAntigua and BarbudaArgentinaArubaBahamasBarbadosBelizeBermudaBoliviaBrazilBritish Virgin IslandsCayman IslandsChileColombiaCosta RicaCubaDominicaDominican RepublicEcuadorEl SalvadorGrenadaGuatemalaGuyanaHaitiHondurasJamaicaMexicoMontserrat
GOAL 6. Educational quality in primary education
SCHOOL LIFE EXPECTANCY(expected number of years of formal schooling)
SURVIVAL RATETO GRADE 5
1990/1991
Total Male Female
1998/1999
Total Male Female
2002/2003 1990/1991 1998/1999 2001/2002
Total Male Female(%) (F/M)
Country or territory Total GPI(%) (F/M)
Total GPI(%) (F/M)
Total GPI
535455565758596061626364656667686970717273747576777879808182
8384858687888990919293949596979899
100101102103104105106107108109110
Latin America and the Caribbean
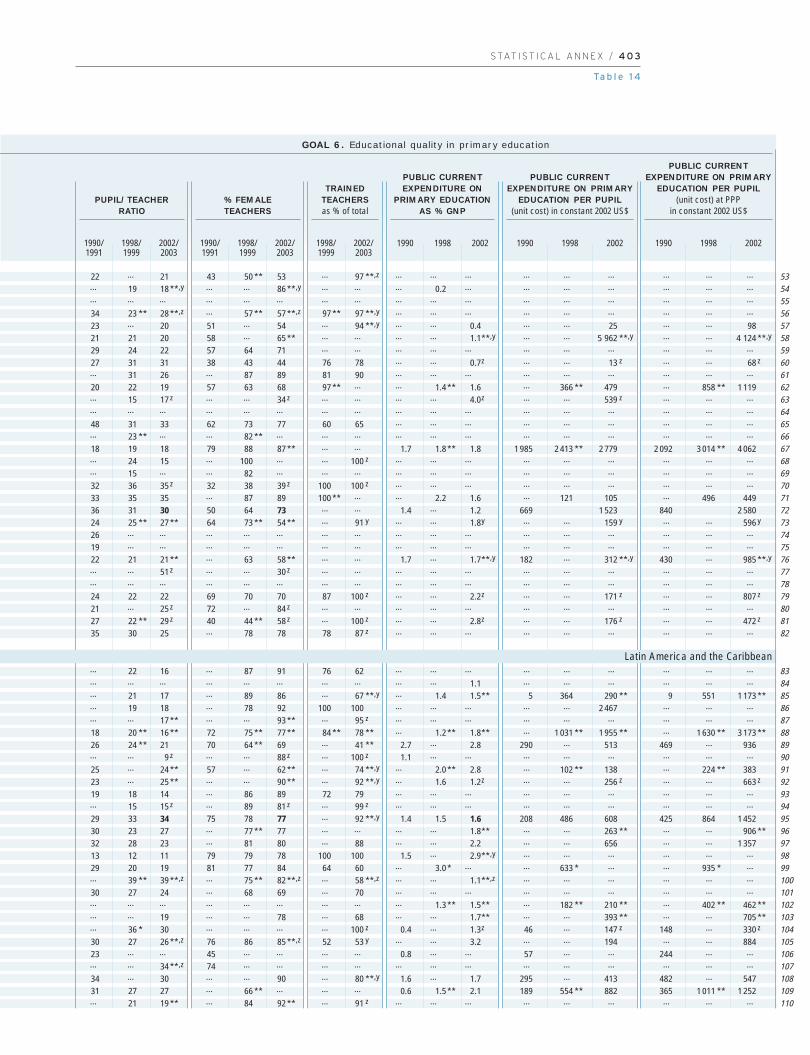
S TAT I S T I C A L A N N E X / 4 0 3
Ta b l e 1 4
22 … 21 43 50 ** 53 … 97 **,z … … … … … … … … …… 19 18 **,y … … 86 **,y … … … 0.2 … … … … … … …… … … … … … … … … … … … … … … … …
34 23 ** 28 **,z … 57 ** 57 **,z 97 ** 97 **,y … … … … … … … … …
23 … 20 51 … 54 … 94 **,y … … 0.4 … … 25 … … 9821 21 20 58 … 65 ** … … … … 1.1**,y … … 5 962 **,y … … 4 124 **,y
29 24 22 57 64 71 … … … … … … … … … … …
27 31 31 38 43 44 76 78 … … 0.7z … … 13 z … … 68 z
… 31 26 … 87 89 81 90 … … … … … … … … …
20 22 19 57 63 68 97 ** … … 1.4 ** 1.6 … 366 ** 479 … 858 ** 1 119… 15 17 z … … 34 z … … … … 4.0z … … 539 z … … …… … … … … … … … … … … … … … … … …
48 31 33 62 73 77 60 65 … … … … … … … … …… 23 ** … … 82 ** … … … … … … … … … … … …
18 19 18 79 88 87 ** … … 1.7 1.8 ** 1.8 1 985 2 413 ** 2 779 2 092 3 014 ** 4 062… 24 15 … 100 … … 100 z … … … … … … … … …… 15 … … 82 … … … … … … … … … … … …
32 36 35 z 32 38 39 z 100 100 z … … … … … … … … …
33 35 35 … 87 89 100 ** … … 2.2 1.6 … 121 105 … 496 44936 31 30 50 64 73 … … 1.4 … 1.2 669 1 523 840 2 58024 25 ** 27 ** 64 73 ** 54 ** … 91 y … … 1.8y … … 159 y … … 596 y
26 … … … … … … … … … … … … … … … …
19 … … … … … … … … … … … … … … … …
22 21 21 ** … 63 58 ** … … 1.7 … 1.7**,y 182 … 312 **,y 430 … 985 **,y
… … 51 z … … 30 z … … … … … … … … … … …… … … … … … … … … … … … … … … … …
24 22 22 69 70 70 87 100 z … … 2.2z … … 171 z … … 807 z
21 … 25 z 72 … 84 z … … … … … … … … … … …
27 22 ** 29 z 40 44 ** 58 z … 100 z … … 2.8z … … 176 z … … 472 z
35 30 25 … 78 78 78 87 z … … … … … … … … …
… …
… 22 16 … 87 91 76 62 … … … … … … … … …… … … … … … … … … … 1.1 … … … … … …… 21 17 … 89 86 … 67 **,y … 1.4 1.5** 5 364 290 ** 9 551 1 173 ** … 19 18 … 78 92 100 100 … … … … … 2 467 … … …… … 17 ** … … 93 ** … 95 z … … … … … … … … …
18 20 ** 16 ** 72 75 ** 77 ** 84 ** 78 ** … 1.2 ** 1.8** … 1 031 ** 1 955 ** … 1 630 ** 3 173 ** 26 24 ** 21 70 64 ** 69 … 41 ** 2.7 … 2.8 290 … 513 469 … 936… … 9 z … … 88 z … 100 z 1.1 … … … … … … … …
25 … 24 ** 57 … 62 ** … 74 **,y … 2.0 ** 2.8 … 102 ** 138 … 224 ** 38323 … 25 ** … … 90 ** … 92 **,y … 1.6 1.2z … … 256 z … … 663 z
19 18 14 … 86 89 72 79 … … … … … … … … …… 15 15 z … 89 81 z … 99 z … … … … … … … … …
29 33 34 75 78 77 … 92 **,y 1.4 1.5 1.6 208 486 608 425 864 1 45230 23 27 … 77 ** 77 … … … … 1.8** … … 263 ** … … 906 ** 32 28 23 … 81 80 … 88 … … 2.2 … … 656 … … 1 35713 12 11 79 79 78 100 100 1.5 … 2.9**,y … … … … … …
29 20 19 81 77 84 64 60 … 3.0 * … … 633 * … … 935 * …… 39 ** 39 **,z … 75 ** 82 **,z … 58 **,z … … 1.1**,z … … … … … …
30 27 24 … 68 69 … 70 … … … … … … … … …… … … … … … … … … 1.3 ** 1.5** … 182 ** 210 ** … 402 ** 462 ** … … 19 … … 78 … 68 … … 1.7** … … 393 ** … … 705 ** … 36 * 30 … … … … 100 z 0.4 … 1.3z 46 … 147 z 148 … 330 z
30 27 26 **,z 76 86 85 **,z 52 53 y … … 3.2 … … 194 … … 88423 … … 45 … … … … 0.8 … … 57 … … 244 … …… … 34 **,z 74 … … … … … … … … … … … … …
34 … 30 … … 90 … 80 **,y 1.6 … 1.7 295 … 413 482 … 54731 27 27 … 66 ** … … … 0.6 1.5 ** 2.1 189 554 ** 882 365 1 011 ** 1 252… 21 19 ** … 84 92 ** … 91 z … … … … … … … … …
GOAL 6. Educational quality in primary education
PUPIL/TEACHERRATIO
% FEMALETEACHERS
PUBLIC CURRENTEXPENDITURE ON
PRIMARY EDUCATION AS % GNP
TRAINEDTEACHERSas % of total
PUBLIC CURRENTEXPENDITURE ON PRIMARY
EDUCATION PER PUPIL(unit cost) in constant 2002 US$
PUBLIC CURRENTEXPENDITURE ON PRIMARY
EDUCATION PER PUPIL(unit cost) at PPP
in constant 2002 US$
1990 1998 2002 1990 1998 2002 1990 1998 2002
535455565758596061626364656667686970717273747576777879808182
8384858687888990919293949596979899100101102103104105106107108109110
Latin America and the Caribbean
1990/1991
1998/1999
2002/2003
1990/1991
1998/1999
2002/2003
1998/1999
2002/2003

60
02
Education f
or A
ll G
lobal M
onitorin
g R
eport
4 0 4 / A N N E X
Table 14 (continued)
… … … 12.3** 12.0** 12.6** 11.5z 11.0z 11.9 z … … … … 88.5y …
8.3 7.7 8.8 … … … 10.5** 10.3** 10.8 ** 45.6 … … … 64.8 1.0811.2 … … … … … 13.2** 12.6** 13.8 ** … … … … 89.8 1.02
8.6 8.7 8.5 … … … 12.1** 12.0** 12.3 ** 70.5 1.04 70.0 ** 1.03 ** 69.7** 1.04**12.2 … … … … … 13.8** 13.8** 13.8 ** … … 87.9 0.99 83.6 0.98… … … … … … 15.9**,y … … … … … … 78.4y 1.12y
12.9 12.6 13.1 … … … … … … … … 90.1 ** … ** 96.6y …… … … … … … … … … … … … … 88.0 …… … … … … … 12.5**,z 11.6**,z 13.4 **,z … … … … … …
11.1 11.1 11.2 11.8** 11.5** 12.0** 11.8** 11.6** 12.1 ** 97.9 1.04 100.0 … 71.2**,y 1.15**,y
… … … … … … 12.8**,z 12.2**,z 13.3 **,z … … … … 45.9 1.2312.9 … … … … … 14.9** 14.0** 15.8 ** 94.5 1.03 88.3 1.06 92.9 1.0410.8 … … … … … 11.8** 11.5** 12.0 ** 86.1 1.09 90.8 1.08 84.2 1.07
… … … … … … … … … … … … … … …
13.8 14.2 13.4 15.2** 15.2** 15.1** 14.9 14.5 15.1 … … … … … …
14.0 14.0 14.1 17.8** 17.4** 18.2** 19.2 18.3 19.9 … … … … … …
16.9 16.4 17.3 16.0** 15.7** 16.3** 16.0**,z 15.7**,z 16.4 **,z … … … … … …
10.3 10.3 10.4 12.5 12.3 12.7 13.4 13.3 13.5 99.9 … 96.1 1.03 99.3 1.0114.3 14.1 14.5 16.1** 15.6** 16.6** 16.9 15.8 17.6 94.2 1.00 100.0 1.00 … …
15.2 14.5 16.0 17.5** 16.7** 18.2** 18.3 16.8 19.1 99.8 1.00 99.8 1.00 99.9 1.0014.3 14.0 14.6 15.6** 15.3** 15.8** 15.6 15.1 15.9 96.4 … 98.0 0.99 … …
14.5 … … 16.0** 16.2** 15.8** 15.8 15.5 15.7 … … … … … …
13.4 13.5 13.3 14.2** 14.0** 14.4** 15.8 15.5 16.0 99.7 1.00 … … … …
15.3 15.3 15.3 16.7** 16.0** 17.3** 18.3 16.6 19.4 … … 99.8 1.00 99.7 0.9912.7 12.6 12.8 16.3** 15.6** 16.7** 17.0 16.1 17.7 99.5 1.01 95.1 1.03 99.2 1.0213.2 12.9 13.4 14.8** 14.4** 15.2** 15.6 14.7 16.0 … … … … 85.2** 0.99**13.4 13.5 13.4 14.7** 14.5** 14.9** 15.6 15.1** 16.0 ** 99.6 1.01 96.6 … 96.5y 1.01y
… … … … … … 13.5** 13.3** 13.7 ** … … … … 99.0**,y 1.00**,y
12.9 13.2 12.5 … … … 14.5 14.1 14.6 99.3 1.01 99.4 0.99 99.3 1.01… … … … … … … … … 82.9 0.81 … …
15.2 15.6 14.9 16.5** 16.7** 16.2** 16.6 16.4 16.6 … … 99.9 1.00 99.8 1.0014.4 14.1 14.7 17.5** 16.9** 18.0** 17.8 16.4 18.5 99.6 1.01 … … 99.5 0.9912.5 12.2 12.7 15.8** 15.4** 16.1** 16.1 15.3 16.6 … … … … … …… … … … … … … … … 88.1 1.27 … … … …
14.6 14.3 14.8 15.7** 15.4** 16.0** 16.2 15.5 16.6 … … … … … …
13.1 12.8 13.4 19.0** 17.3** 20.8** 19.1 16.8 20.7 99.8 1.00 … … … …
13.8 14.2 13.3 15.5** 16.0** 15.0** 15.9 15.8 15.6 79.7 0.98 … … … …
14.2 14.4 14.0 20.0** 19.3** 20.7** 22.0 19.8 23.5 … … … … … …
15.3 14.9 15.7 … … … 15.7** 14.4** 16.3 ** … … … … … …
2.5 … … … … … … … … … … … …
5.6 6.4 4.7 8.5** 8.7** 8.2** 8.4 8.2 8.5 … … 54.7 1.20 53.9 1.20… … … … … … … … … … … 87.5 1.03 91.0y 1.05y
8.1 9.6 6.6 … … … 9.7** 10.3** 8.9 ** … … 62.0 0.95 61.4y …
9.7 10.7 8.6 11.6** 12.2** 10.9** 11.6** 12.1** 11.1 ** 89.9 0.98 … … 94.6** … **… … … 11.6 … … 11.9 11.8 12.1 … … … … … …
7.7 9.8 5.5 … … … 9.7** 10.6** 8.8 ** … … … … 64.9 1.064.7 6.1 3.2 … … … 5.4** 6.3** 4.5 ** … … … … …
12.0 11.9 12.1 … … … … … … 94.4 1.01 … … 98.4** 1.01**
4.8 … … 5.2** 5.8** 4.6** … … … … … … … … …
4.2 5.7 2.6 6.9** 8.7** 5.1** … … … 55.1 1.02 … … 68.3 0.939.4 9.1 9.8 11.4** 11.3** 11.5** 11.3** 11.2** 11.3 ** 96.6 1.07 87.6 1.08 87.6** 1.07**2.5 3.1 1.9 … … … 3.7** 4.3** 3.0 ** 69.7 0.96 68.3 1.05 66.2** 1.05**4.9 5.4 4.4 … … … 5.6** 6.3** 4.9 ** 61.8 0.89 … … 67.5 1.06
Netherlands AntillesNicaraguaPanamaParaguayPeruSaint Kitts and NevisSaint LuciaSaint Vincent/Grenad.SurinameTrinidad and TobagoTurks and Caicos IslandsUruguayVenezuela
AndorraAustriaBelgiumCanadaCyprusDenmarkFinlandFranceGermanyGreeceIcelandIrelandIsraelItalyLuxembourgMaltaMonacoNetherlandsNorwayPortugalSan MarinoSpainSwedenSwitzerlandUnited KingdomUnited States
AfghanistanBangladeshBhutanIndiaIran, Islamic Republic ofMaldivesNepalPakistanSri Lanka
AngolaBeninBotswanaBurkina FasoBurundi
GOAL 6. Educational quality in primary education
SCHOOL LIFE EXPECTANCY(expected number of years of formal schooling)
SURVIVAL RATETO GRADE 5
1990/1991
Total Male Female
1998/1999
Total Male Female
2002/2003 1990/1991 1998/1999 2001/2002
Total Male Female(%) (F/M)
Country or territory Total GPI(%) (F/M)
Total GPI(%) (F/M)
Total GPI
111112113114115116117118119120121122123
124125126127128129130131132133134135136137138139140141142143144145146147148149
150151152153154155156157158
159160161162163
North America and Western Europe
South and West Asia
Sub-Saharan Africa
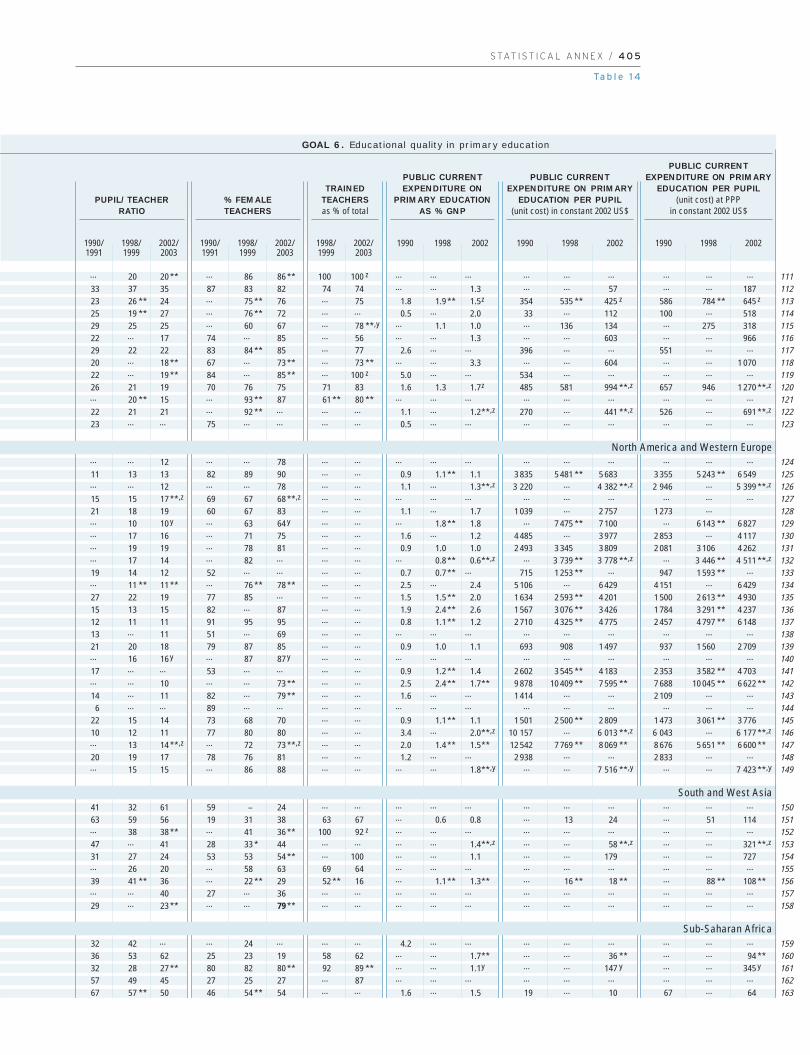
S TAT I S T I C A L A N N E X / 4 0 5
Ta b l e 1 4
… 20 20 ** … 86 86 ** 100 100 z … … … … … … … … …
33 37 35 87 83 82 74 74 … … 1.3 … … 57 … … 18723 26 ** 24 … 75 ** 76 … 75 1.8 1.9 ** 1.5z 354 535 ** 425 z 586 784 ** 645 z
25 19 ** 27 … 76 ** 72 … … 0.5 … 2.0 33 … 112 100 … 51829 25 25 … 60 67 … 78 **,y … 1.1 1.0 … 136 134 … 275 31822 … 17 74 … 85 … 56 … … 1.3 … … 603 … … 96629 22 22 83 84 ** 85 … 77 2.6 … … 396 … … 551 … …
20 … 18 ** 67 … 73 ** … 73 ** … … 3.3 … … 604 … … 1 07022 … 19 ** 84 … 85 ** … 100 z 5.0 … … 534 … … … … …
26 21 19 70 76 75 71 83 1.6 1.3 1.7z 485 581 994 **,z 657 946 1 270 **,z
… 20 ** 15 … 93 ** 87 61 ** 80 ** … … … … … … … … …
22 21 21 … 92 ** … … … 1.1 … 1.2**,z 270 … 441 **,z 526 … 691 **,z
23 … … 75 … … … … 0.5 … … … … … … … …
… … 12 … … 78 … … … … … … … … … … …
11 13 13 82 89 90 … … 0.9 1.1 ** 1.1 3 835 5 481 ** 5 683 3 355 5 243 ** 6 549… … 12 … … 78 … … 1.1 … 1.3**,z 3 220 … 4 382 **,z 2 946 … 5 399 **,z
15 15 17 **,z 69 67 68 **,z … … … … … … … … … … …
21 18 19 60 67 83 … … 1.1 … 1.7 1 039 … 2 757 1 273 …… 10 10 y … 63 64 y … … … 1.8 ** 1.8 … 7 475 ** 7 100 … 6 143 ** 6 827… 17 16 … 71 75 … … 1.6 … 1.2 4 485 … 3 977 2 853 … 4 117… 19 19 … 78 81 … … 0.9 1.0 1.0 2 493 3 345 3 809 2 081 3 106 4 262… 17 14 … 82 … … … … 0.8 ** 0.6**,z … 3 739 ** 3 778 **,z … 3 446 ** 4 511 **,z
19 14 12 52 … … … … 0.7 0.7 ** … 715 1 253 ** … 947 1 593 ** …… 11 ** 11 ** … 76 ** 78 ** … … 2.5 … 2.4 5 106 … 6 429 4 151 … 6 42927 22 19 77 85 … … … 1.5 1.5 ** 2.0 1 634 2 593 ** 4 201 1 500 2 613 ** 4 93015 13 15 82 … 87 … … 1.9 2.4 ** 2.6 1 567 3 076 ** 3 426 1 784 3 291 ** 4 23712 11 11 91 95 95 … … 0.8 1.1 ** 1.2 2 710 4 325 ** 4 775 2 457 4 797 ** 6 14813 … 11 51 … 69 … … … … … … … … … … …
21 20 18 79 87 85 … … 0.9 1.0 1.1 693 908 1 497 937 1 560 2 709… 16 16 y … 87 87 y … … … … … … … … … … …
17 … … 53 … … … … 0.9 1.2 ** 1.4 2 602 3 545 ** 4 183 2 353 3 582 ** 4 703… … 10 … … 73 ** … … 2.5 2.4 ** 1.7** 9 878 10 409 ** 7 595 ** 7 688 10 045 ** 6 622 ** 14 … 11 82 … 79 ** … … 1.6 … … 1 414 … … 2 109 … …
6 … … 89 … … … … … … … … … … … … …
22 15 14 73 68 70 … … 0.9 1.1 ** 1.1 1 501 2 500 ** 2 809 1 473 3 061 ** 3 77610 12 11 77 80 80 … … 3.4 … 2.0**,z 10 157 … 6 013 **,z 6 043 … 6 177 **,z
… 13 14 **,z … 72 73 **,z … … 2.0 1.4 ** 1.5** 12 542 7 769 ** 8 069 ** 8 676 5 651 ** 6 600 ** 20 19 17 78 76 81 … … 1.2 … … 2 938 … … 2 833 … …… 15 15 … 86 88 … … … … 1.8**,y … … 7 516 **,y … … 7 423 **,y
41 32 61 59 – 24 … … … … … … … … … … …
63 59 56 19 31 38 63 67 … 0.6 0.8 … 13 24 … 51 114… 38 38 ** … 41 36 ** 100 92 z … … … … … … … … …
47 … 41 28 33 * 44 … … … … 1.4**,z … … 58 **,z … … 321 **,z
31 27 24 53 53 54 ** … 100 … … 1.1 … … 179 … … 727… 26 20 … 58 63 69 64 … … … … … … … … …
39 41 ** 36 … 22 ** 29 52 ** 16 … 1.1 ** 1.3** … 16 ** 18 ** … 88 ** 108 ** … … 40 27 … 36 … … … … … … … … … … …
29 … 23 ** … … 79 ** … … … … … … … … … … …
32 42 … … 24 … … … 4.2 … … … … … … … …
36 53 62 25 23 19 58 62 … … 1.7** … … 36 ** … … 94 ** 32 28 27 ** 80 82 80 ** 92 89 ** … … 1.1y … … 147 y … … 345 y
57 49 45 27 25 27 … 87 … … … … … … … … …
67 57 ** 50 46 54 ** 54 … … 1.6 … 1.5 19 … 10 67 … 64
GOAL 6. Educational quality in primary education
PUPIL/TEACHERRATIO
% FEMALETEACHERS
PUBLIC CURRENTEXPENDITURE ON
PRIMARY EDUCATION AS % GNP
TRAINEDTEACHERSas % of total
PUBLIC CURRENTEXPENDITURE ON PRIMARY
EDUCATION PER PUPIL(unit cost) in constant 2002 US$
PUBLIC CURRENTEXPENDITURE ON PRIMARY
EDUCATION PER PUPIL(unit cost) at PPP
in constant 2002 US$
1990 1998 2002 1990 1998 2002 1990 1998 2002
111112113114115116117118119120121122123
124125126127128129130131132133134135136137138139140141142143144145146147148149
150151152153154155156157158
159160161162163
North America and Western Europe
South and West Asia
Sub-Saharan Africa
1990/1991
1998/1999
2002/2003
1990/1991
1998/1999
2002/2003
1998/1999
2002/2003

60
02
Education f
or A
ll G
lobal M
onitorin
g R
eport
4 0 6 / A N N E X
Table 14 (continued)
8.3 … … 7.6** … … 9.2** 10.0** 8.4 ** … … 80.7 ** … ** 63.7** 0.99**… … … … … … 11.8** 11.8** 11.8 ** … … … … 88.0 1.01
4.9 6.2 3.6 … … … … … … 24.0 0.90 … … … …… … … … … … … … … 53.1 0.75 55.1 0.86 44.3** 0.70**… … … 6.5** 7.0** 5.9** 7.9** 8.7** 7.2 ** … … … … 71.7**,x 1.08**,x
11.0 12.1 9.9 … … … 7.7**,z 8.4**,z 7.0 **,z 62.7 1.15 … … 66.3 1.03… … … 6.4** 7.7** 5.1** … … … 73.0 0.94 69.1 0.89 87.6**,x 0.98**,x
… … … 4.4** … … … … … 54.7 0.86 … … … …… … … … … … … … … … … … … 29.5**,y 0.74**,y
… … … 4.4** 5.0** 3.7** 5.1** 5.9** 4.3 ** … … 95.3 0.95 86.3 0.922.8 3.4 2.3 4.0** 5.0** 3.0** 5.9** 6.9** 4.8** … … 55.8 1.03 61.5** 0.95**
… … … 12.1** 12.5** 11.7** … … … … … … … 69.3** 1.04**… … … … … … … … … … … … … … …
6.5 7.5 5.6 … … … 7.3** 7.7** 6.9 ** 80.5 0.98 … … 63.3 1.052.8 4.0 1.7 … … … … … … 58.8 0.76 86.9 0.86 79.7 0.85
… … … … … … … … … … … 38.1 ** 0.82 ** … …
8.4 8.8 7.9 … … … 8.5**,z 8.7**,z 8.3 **,z … … … 59.0** 0.94**9.8 8.8 10.8 9.7 9.2 10.3 10.8** 10.5 11.1 ** 70.7 1.42 68.9 1.23 73.0 1.22
… … … … … … … … … … … … … … …
6.3 6.4 6.2 6.2** 6.3** 6.0** … … … 21.7 0.95 51.1 1.02 52.9 1.026.3 7.1 5.5 … … … 10.9** 11.4** 10.4 ** 64.5 0.80 44.1 0.78 32.8 1.302.0 2.5 1.4 3.9** … … 4.9** … … 72.5 0.95 78.3 ** 0.97 ** 74.6 0.90
10.3 10.4 10.3 11.9** 11.9** 11.8** 12.7** 12.5** 12.8 ** 98.4 1.00 99.4 1.01 98.9 1.01… … … … … … … … … 32.9 0.76 41.8 0.83 49.2 0.85… … … 12.1** 12.0** 12.3** 11.5** 11.4** 11.6 ** … … 83.4 1.09 94.7** … **
2.2 … … … … … 2.9**,z 3.5**,z 2.3 **,z 62.4 1.06 … … 69.1 0.95… … … … … … 10.2** 11.3** 9.0 ** … … … … … …… … … 7.9** … … 8.6** 8.9** 8.4 ** 60.0 0.97 45.4 … 46.6 1.08… … … … … … 9.6**,z 10.0**,z 9.2 **,z … … … … 61.5**,y 1.11**,y
4.8 … … 5.6** … … … … … 84.5 … … … 80.0 0.93… … … 13.4 … … 13.4** 13.3** 13.5 ** … … 100.0 … 99.3 0.99
4.8 … … … … … 6.8**,y 7.9**,y 5.7 **,y … … … … … …… … … … … … … … … … … … … … …
11.5 11.4 11.6 13.5** 13.3** 13.7** 13.1** 12.8** 13.1 ** 75.3 1.09 75.9 * 1.02 * 64.8x 0.99x
9.4 9.6 9.1 10.4** 10.8** 10.1** 9.6** 9.9** 9.3 ** 76.2 1.05 81.5 1.15 73.2 0.908.8 11.3 6.3 10.8** 13.1** 8.5** … … … 50.7 0.81 … … 68.6 0.885.2 5.9 4.5 11.9** 12.7** 11.0** 12.0** 12.3** 11.7 ** … … … … 63.6 1.025.3 … … 5.0** 5.1** 4.9** … … … 78.9 1.05 80.9 1.06 82.0** 1.01**7.8 … … 6.9** 7.4** 6.5** 6.9**,y 7.3**,y 6.5 **,y … … 78.2 0.87 98.5** … **9.8 … … … … … 10.1** … … 92.4 0.85 … … 69.7** 1.04**
9.3 9.9 8.4 9.8 10.3 9.4 10.5 10.8 10.2 … … … … 89.7 …
12.2 11.9 12.8 11.9 11.8 12.0 12.6 12.4 12.8 … … … … … …
14.2 14.1 14.3 15.7 15.4 16.1 16.1 15.2 16.6 … … … … … …
8.4 9.2 7.4 9.1 9.7 8.5 9.9 10.3 9.4 … … … … 81.2 0.98
8.6 9.1 7.3 9.8 10.6 9.0 10.2 10.7 9.6 87.3 … 91.3 1.07 94.3 1.0111.4 … … 11.8 11.9 11.8 12.8 12.8 12.8 … … … … … …
11.6 … … 10.9 11.0 10.8 11.5 11.6 11.4 … … … … …
9.6 10.4 9.2 10.2 10.4 9.9 11.2 11.3 11.0 … … … … … …
10.4 … … 12.2 12.1 12.2 13.1 12.8 13.3 … … … … 83.9 1.08
14.7 14.6 15.0 16.2 15.8 16.6 16.4 15.3 17.0 99.5 1.01 … … … …
7.6 9.0 6.2 8.4 9.4 7.4 9.1 9.7 8.4 … … … … 64.9 1.066.0 6.6 5.5 6.7 7.4 6.0 7.8 8.5 7.0 64.5 0.80 … … 68.6 0.88
CameroonCape VerdeCentral African RepublicChadComorosCongoCôte d’IvoireD. R. CongoEquatorial GuineaEritreaEthiopiaGabonGambiaGhanaGuineaGuinea-BissauKenyaLesothoLiberiaMadagascarMalawiMaliMauritiusMozambiqueNamibiaNigerNigeriaRwandaSao Tome and PrincipeSenegalSeychellesSierra LeoneSomaliaSouth AfricaSwazilandTogoUgandaUnited Republic of TanzaniaZambiaZimbabwe
World
Countries in transitionDeveloped countriesDeveloping countries
Arab StatesCentral and Eastern EuropeCentral AsiaEast Asia and the PacificLatin America and the CaribbeanNorth America and Western EuropeSouth and West AsiaSub-Saharan Africa
GOAL 6. Educational quality in primary education
SCHOOL LIFE EXPECTANCY(expected number of years of formal schooling)
SURVIVAL RATETO GRADE 5
1990/1991
Total Male Female
1998/1999
Total Male Female
2002/2003 1990/1991 1998/1999 2001/2002
Total Male Female(%) (F/M)
Country or territory Total GPI(%) (F/M)
Total GPI(%) (F/M)
Total GPI
164165166167168169170171172173174175176177178179180181182183184185186187188189190191192193194195196197198199200201202203
I
IIIIIIV
VVI
VIIVIII
IX
X
XIXII
Data in bold are for 2003/2004. (z) Data are for 2001/2002. (y) Data are for 2000/2001. (x) Data are for 1999/2000.
Weighted average Median

S TAT I S T I C A L A N N E X / 4 0 7
Ta b l e 1 4
51 52 57 30 36 33 … 68 … 1.2 … … 40 … … 114 …… 29 ** 28 … 62 ** 65 … 69 … … 3.0 … … 207 … … 76877 … … 25 … … … … 1.1 … … 32 … … 63 … …
66 68 68 ** 6 9 11 ** … … … … … … … … … … …
37 35 37 ** … 26 … … … … … 1.7** … … 40 ** … … 157 ** 65 61 65 32 42 43 … 57 … … 1.5** … … 66 ** … … 78 ** 37 43 42 * 18 20 24 * … 100 * … 1.6 … … 94 … … 178 …
40 26 … 24 21 … … … … … … … … … … … …… … 43 **,y … … 24 **,y … … … … 0.4**,z … … 25 **,z … … 202 **,z
… 47 47 45 35 36 73 81 … 1.3 … … 40 … … 194 …
36 46 67 ** 24 28 34 ** … 72 ** 1.5 … … 24 … … 74 … …… 44 36 … 42 45 … 100 … 1.3 … … 208 … … 343 …
31 33 38 ** 31 29 29 ** 72 73 y 1.3 … … 35 … … 150 … …
29 30 32 36 32 39 72 68 0.8 … … 16 … … 53 … …
40 47 45 23 25 24 … … … … … … … … … … …… … 44 **,y … … 20 **,y … … … … … … … … … … …
31 … 34 ** 38 … 41 ** … 44 ** 3.2 … … 57 … … 143 … …
55 44 ** 47 80 80 ** 80 77 ** 73 … 3.2 3.9**,z … 74 80 **,z … 293 426 **,z
… 39 … … 19 … … … … … … … … … … … …
40 47 52 … 58 60 … … … 0.5 0.7z … 11 15 z … 34 41 z
61 63 ** 62 31 40 ** 44 46 ** 51 y 1.1 … 3.1 11 … 20 20 … 6647 62 * 57 25 23 * 24 … … … 1.3 … … 38 … … 110 …
21 26 25 44 53 57 100 100 1.2 1.2 1.0 235 348 359 550 848 1 03955 … 67 23 24 28 33 60 1.0 … … 13 … … 40 … …… 32 28 ** … 67 61 ** 29 50 ** … 4.4 4.0 … 305 302 … 940 1 28142 41 42 33 31 35 … 72 … … … … … … … … …
41 31 ** 42 43 38 ** 48 … 76 … … … … … … … … …
57 54 60 46 55 50 49 81 z … … … … … … … … …… 36 33 **,z … … 62 **,z … … … … … … … … … … …
53 49 49 ** 27 23 ** 23 ** … 91 z 1.7 … 1.1**,z 80 … 47 **,z 117 … 155 **,z
… 15 13 … 88 86 84 77 ** 2.3 1.1 1.5** 701 716 1 050 ** … … …
35 … 37 y … … 38 y … 79 y … 0.4 … … … … … … …… … … … … … … … … … … … … … … … …… 37 ** 35 … 78 ** 80 63 ** 81 4.1 2.8 2.4**,z 472 315 * 317 **,z 1 208 894 * 1 227 **,z
33 33 31 79 75 75 91 91 1.4 2.0 2.1 72 99 124 217 316 51558 41 35 19 13 12 … 81 z 1.6 1.8 1.8**,y 29 26 27 **,y 82 115 145 **,y
29 60 53 30 33 37 … 81 … … … … … … … … …
35 38 56 41 44 46 ** … 100 … … … … … … … … …
44 45 43 … 47 49 89 100 … … … … … … … … …
36 … 39 39 … 51 … 95 **,z 4.3 … 3.3**,z 164 … 112 **,z 423 … 376 **,z
27 23 22 57 72 73 … … … … … … … … … … …
22 20 18 94 95 97 … 98 … … … … … … … … …
18 17 14 77 85 82 … 1.4 … 1.2 … … 3 794 … … 4 19330 28 28 47 62 62 … 81 … … … … … … … … …
25 25 21 51 52 62 … … … … … … … … … … …
20 19 17 84 92 92 … … … … 0.9 … … 677 … … 1 70521 22 19 85 92 95 … 93 … … … … … … … … …
26 23 25 … 66 66 … … … … … … … … … … …
25 22 21 … 78 82 78 … … 1.7 … … 413 … … 794
15 15 14 77 78 79 … … 1.2 1.1 1.4 2 656 3 545 4 291 2 405 3 446 5 399
40 35 38 28 33 38 … 67 … … … … … … … … …
40 43 43 31 35 41 … 79 … … … … … … … … …
GOAL 6. Educational quality in primary education
PUPIL/TEACHERRATIO
% FEMALETEACHERS
PUBLIC CURRENTEXPENDITURE ON
PRIMARY EDUCATION AS % GNP
TRAINEDTEACHERSas % of total
PUBLIC CURRENTEXPENDITURE ON PRIMARY
EDUCATION PER PUPIL(unit cost) in constant 2002 US$
PUBLIC CURRENTEXPENDITURE ON PRIMARY
EDUCATION PER PUPIL(unit cost) at PPP
in constant 2002 US$
1990 1998 2002 1990 1998 2002 1990 1998 2002
164165166167168169170171172173174175176177178179180181182183184185186187188189190191192193194195196197198199200201202203
I
IIIIIIV
VVIVIIVIII
IX
X
XIXII
Median Median Median Median Median Median
1990/1991
1998/1999
2002/2003
1990/1991
1998/1999
2002/2003
1998/1999
2002/2003