table 1a year endorsement subject area/content cumulative
TRANSCRIPT

1. Content Knowledge
Below are the measures used specifically for addressing the content knowledge or teacher candidates at the University of
Nebraska–Lincoln.
Table 1A
Grade Point Average in the Content Area and Cumulative GPA
Year Endorsement Subject Area/Content
GPA
Cumulative GPA Total Students
2014-2015 Secondary
Education
3.49 3.56 95
Elementary
Education
3.43 3.57 125
Special
Education
3.82 3.68 59
Early
Childhood
3.81 3.70 25
Content area
2015-2016 Secondary Education
3.54250 3.55747 108
Elementary Education
3.36632 3.56379 153

Special Education
3.80480 3.64881 72
Early Childhood Education
3.74777 3.58203 40
Content area
Table 1B
Grade Point Average in the Content Area and Cumulative GPA
Year Code Subject
Area/Content
GPA
Cumulative
GPA
Total
Students
Notes
2014-
2015
BECE 3.21 2.79 1 Business & Cooperative Education
BMIT 3.35 3.32 6 Business, Marketing & Information Education
CYEC 3.85 3.74 18 Inclusive Early Childhood Education
CYFC 3.37 3.24 4 Family & Consumer Science Education 6-12
ECED 3.57 3.65 6 Elementary Education & Early Childhood Education
ELED 3.43 3.52 83 Elementary Education K-6
EMATH 3.25 3.61 13 Mathematics 7-12
ENGL 3.79 3.78 15 English

ESPAN 3.67 3.58 9 Spanish
LART 3.63 3.67 4 Language Arts
NTSC 3.50 3.64 12 Science (Field endorsement)
PHSC 3.67 3.78 1 Physics
SPEN ( 3.44 3.54 1 English and Speech ( old program)
SPM7 3.29 3.68 37 Elementary & Special Education K-6
SPM8 3.65 3.47 4 Special Education 7-12
SSCI 3.40 3.49 27 Social Science Education 7-12
2015-16
AEDU 3.45000 3.43140 10 Agriculture Education
CYEC 3.77413 3.62275 24 Inclusive Early Childhood Education
CYFC 3.64486 3.60000 7 Family & Consumer Science, 6-12
ECED 3.58122 9 Elementary Education & Early Childhood Education
ELAT 3.80000 3.68300 1 English/language Arts
ELED 3.36632 3.54869 103 Elementary Education
ENGL 3.66375 3.65475 12 English
ERSS 3.13100 3.09600 1 Earth and space Science
MATH 3.25427 3.48267 15 Math
MUED 3.57743 3.54290 21 Music Education
NTSC 3.13850 3.40900 4 Science (formerly natural science)(old endorsement)
SCIE 3.38650 3.52800 2 Science (new science endorsement)

SENG 4.00000 3.99000 1 Secondary English????
SPAN 3.77157 3.61343 7 Spanish
SPM7 3.63335 37 Elementary and Special Education, K-6
SPM8 3.87173 3.75764 11 Special Education, 7-12
SSCI 3.56767 3.59950 12 Social Science
Table 2A
Praxis II—September 2014—August 2015
Pass Rate Based on Nebraska Cut Score
Praxis II – September 2014 – August 2015
Pass Rate Based on Nebraska Cut Score
Endrsmnt Test
#
Cut
Scor
e
UN-L
N
UN-L
#
Passing
UN-L #
Failing
UN-L
%age
Pass
UN-L
Mean
Sta
te
N
State
%age
Pass
State
Mean
Natio
nal N
National
%age
Nation
al
Mean
Curr Sup. None
Principal 5411 145 1 1 0 100 123 93.5 163.85 2778 83.59 164.95
Supt 6021 152 1 1 0 100 163 26 96.15 167.23 637 96.39 168.15
Unified 5024 160 17 16 1 94.2 174.47 101 77.23 168.15 1917 78.87 167.57

Agric Ed 5701 147 19 18 1 94.74 166.53 20 95 166.65 436 95.64 167.52
BMIT 5101 154 8 8 0 100 174.25 36 100 174.64 1848 89.72 170.45
ELED 5017 153 151 142 9 94.04 170.66 803 90.78 167.94 4491 91.27 168.74
FACS 5122 153 12 7 5 58.33 158.42 17 58.82 160.00 630 77.46 160.21
ITE None
Math 5161 146 30 26 4 86.67 163.87 101 77.23 158.12 8090 65.7 153.20
Music 5114 152 20 20 0 100 173.90 61 88.52 164.28 1178 85.48 164.50
Science 5435 148 12 12 0 100 176.25 53 94.34 173.00 3091 81.11 163.75
Biology 5235 148 3 3 0 100 160.67 21 80.95 159.62 3910 83.43 162.16
Chemistry 5245 140 1 1 0 100 176.00 7 100 161.57 1582 84.39 159.79
Earth &
Space Sc
5571 147 2 2 0 100 162.00 3 67 157 816 84.44 164.48
Physics 5265 131 1 1 0 100 169 6 83.33 147.50 951 80.34 150.34
LA & Sec.
English
5039 168 22 18 4 81.82 175.86 109 76.15 173.33 2831 75.27 173.28
Soc. Sci. 5081 154 27 23 4 85.19 168 88 77.27 165.02 6037 79.41 165.57
SPED 5354 151 42 42 0 100 175.40 239 98.33 172.08 5825 95.91 171.85
SPED HH 5272 160 10 10 0 100 173.9 11 100 173.45 125 70.40 163.72
ECSE 5691 159 1 1 0 100 191 1 100 191 761 91.33 173.71
SPED V I 5282 163 1 1 0 100 167 1 100 167 169 73.96 167.24

SLPA 5331 162 13 11 2 84.62 173 35 91.43 174.51 8384 92.20 176.41
French 5174 162 1 1 0 100 168 5 80 175.20 482 69.92 169.59
German 5183 163 1 1 0 100 183 2 100 182 122 70.49 170.50
Latin 5601 155 0 0 0 0 0 0 0 0 91 84.62 175.30
Russian None
Spanish 5195 156 0 0 0 0 0 0 0 0 1 100 178
School
Counslr
5421 156 0 0 0 0 0 31 96.76 169.97 3196 90.18 168.57
School
Psychlgst
5402 147 7 7 0 100 175.29 23 100 170.83 2633 97.27 169.02
TOTAL 403 373 30 92.56%
Table 2B
Praxis II—September 2015—August 2016
Pass Rate Based on Nebraska Cut Score
Endrsmnt Test
#
Cut
Scor
e
UN-L
N
UN-L
#
Passing
UN-L #
Failing
UN-L
%age
Pass
UN-L
Mean
Sta
te
N
State
%age
Pass
State
Mean
Natio
nal N
National
%age
Nation
al
Mean

Curr Sup. None
Principal 5411 145 21 20 1 95.24 171.33 286 98.25 166.33 3070 94.40 164.17
Supt 6021 152 3 3 0 100.00 171.67 27 100 169.59 658 94.68 168.32
Unified 5024 160 27 26 1 96.30 173.93 110 84.55 167.56 2450 79.63 167.25
Agric Ed 5701 147 5 5 0 100.00 170.00 7 100.00 167.29 398 96.98 168.69
BMIT 5101 154 6 5 1 83.33 172.33 35 97.14 174.31 1821 88.69 169.89
ELED 5017 153 197 190 7 96.45 171.98 849 94.35 168.85 4996 92.77 169.15
FACS 5122 153 20 19 1 95.00 165.65 31 96.77 164.48 1049 80.46 160.84
ITE None
Math 5161 146 25 22 3 88.00 166.32 102 86.27 159.63 7961 66.66 153.77
Music 5114 152 27 26 1 96.30 175.41 92 92.39 167.29 1191 85.14 164.58
Science 5435 148 15 15 0 100.00 175.87 53 98.11 175.34 2848 81.85 164.12
Biology 5235 148 13 12 1 92.31 165.23 31 93.55 164.65 3556 85.18 163.10
Chemistry 5245 140 3 2 1 66.67 159.67 6 83.33 165.33 1545 84.53 158.76
Earth &
Space Sc
5571 147 3 2 1 66.67 156 4 75.00 156.00 721 84.60 164.47
Physics 5265 131 2 2 0 100.00 167 9 100.00 165.11 844 81.52 150.77
LA & Sec.
English
5039 168 24 23 1 95.83 177.58 130 89.23 176.12 2943 76.79 173.51
Soc. Sci. 5081 154 18 18 0 100.00 170.06 90 90.00 169.38 5599 80.62 165.76
SPED 5354 151 52 52 0 100.00 176.49 316 99.68 173.80 5977 96.29 171.97

SPED HH 5272 160 2 2 0 100.00 176.00 7 100.00 170.14 136 88.97 168.82
ECSE 5691 159 7 7 0 100.00 184.29 8 100.00 182.85 816 93.01 173.88
SPED VI 5282 163 4 3 1 75.00 168.75 4 75.00 168.75 142 71.13 166.97
SLPA 5331 162 4 3 1 75.00 173.25 9 77.78 167.89 9013 93.38 176.21
French 5174 162 1 0 1 0 159.00 4 50.00 168.00 407 67.57 168.57
German 5183 163 2 2 0 100.00 197.5 3 100.00 186.33 116 66.38 171.88
Latin 5601 155 - - - - - 2 100.00 174.5 52 84.62 176.02
Russian None
Spanish 5195 156 9 6 3 66.67 161.89 36 72.22 166 1842 73.13 167.22
School
Counselor
5421 156 2 2 0 100.00 177.00 66 96.97 171.39 3327 89.93 168.90
School
Psychlgst
5402 147 11 11 0 100.00 178.00 38 100.00 170.66 2586 97.56 169.36
TOTAL 503 478 25 95.03%
Response from College of Education & Human Sciences Student Teaching Instrument Teacher Candidate Summative
Evaluation on Subject Matter Knowledge for the 2014-2015 Academic Year for Teaching in General (Item 1).
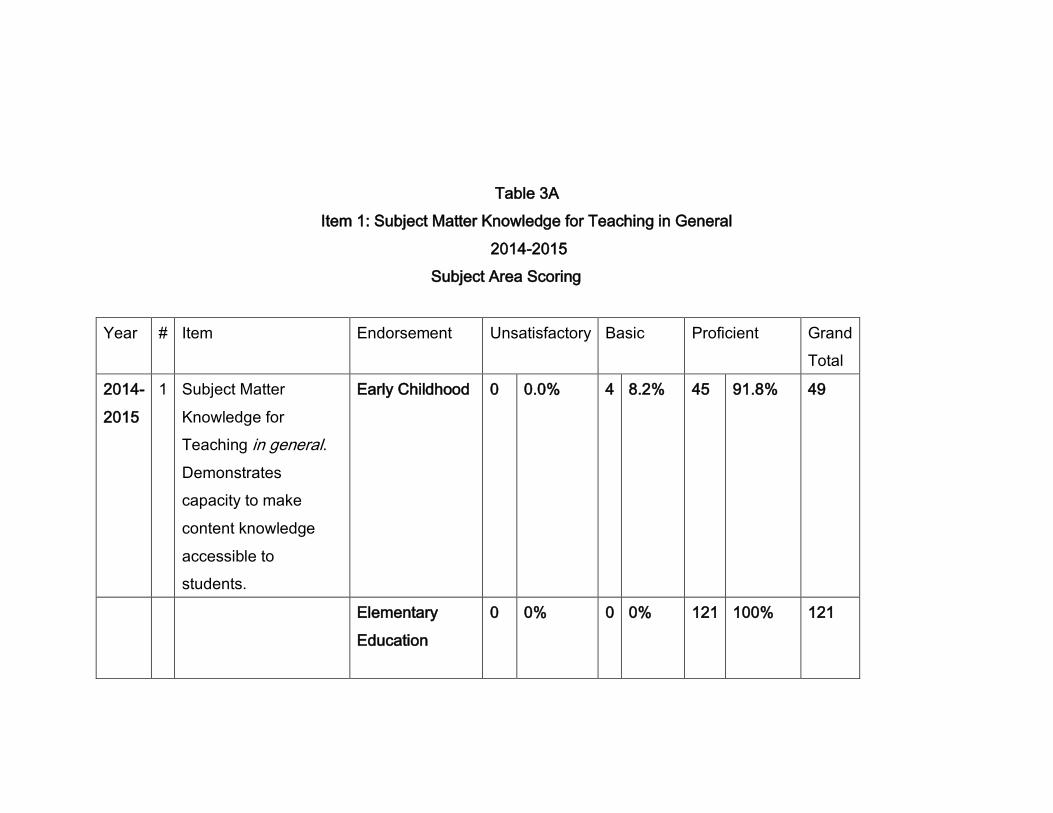
Table 3A
Item 1: Subject Matter Knowledge for Teaching in General
2014-2015
Subject Area Scoring
Year # Item Endorsement Unsatisfactory Basic Proficient Grand
Total
2014-
2015
1 Subject Matter
Knowledge for
Teaching in general.
Demonstrates
capacity to make
content knowledge
accessible to
students.
Early Childhood 0 0.0% 4 8.2% 45 91.8% 49
Elementary
Education
0 0% 0 0% 121 100% 121

Secondary
Education
0 0% 9 7.5% 111 92.5% 120
Special
Education
0 0% 5 10.2% 44 89.8% 49
Response from College of Education & Human Sciences Student Teaching Instrument Teacher Candidate Summative
Evaluation for the 2015-2016 Academic Year on Subject Matter Knowledge for Teaching (Item 3—Table 3B)—LIVETEXT
version.
Table 3B
Item 3: Subject Matter Knowledge for Teaching in General
2015-2016
Subject Area Scoring
Year # Item Endorsement Unacceptable Emergent Sufficient Advanced Grand
Total

2015-
2016
3 Subject Matter
Knowledge for
Teaching.
Subject matter
Knowledge for
Teaching. Make
content
knowledge
accessible for
students
Early Childhood Education
0 0.00% 0 0.00% 13 38.24% 21 13.00% 34
Elementary Education
0 0.00% 3 1.63% 71 38.59% 110 59.78% 184
Secondary Education
0 0.00% 4 4.60% 48 55.17% 35 40.23% 87
Special Education
0 0.00% 2 2.35% 29 34.12% 54 63.53% 85

Responses from First Year Administrator Survey: Preparation of Candidate to Teach Content Area.
Table 4
Standards 4.1, 4.2 and 4.3 – Content Knowledge
Indicator Endorsement Rare Occasional Frequent Consistent
Grand
Information
Total
4.1 --The
teacher
understands the
central
concepts, tools
of inquiry, and
structures
of the
discipline(s)
s/he teaches.
2014-2015
Early Childhood 0.00% 1 14.29% 2 28.57% 4 57.14% 7
Elementary 0.00% 2 3.23% 22 35.48% 38 61.29% 62
Middle Grades 0.00% 0.00% 1 25.00% 3 75.00% 4
Content (Subject
Area)
Endorsements 0.00% 3 5.08% 17 28.81% 39 66.10% 59
Special Education 1 5.88% 1 5.88% 6 35.29% 9 52.94% 17
Total 1 0.67% 7 4.70% 48 32.21% 93 62.42% 149
2015-2016 Rare Occasional Frequent Consistent Total
Early Childhood 0.00% 0.00% 2 0.00% 2 0.00% 4

Elementary 1 1.89% 0.00% 27 50.94% 25 47.17% 53
Middle Grades 0.00% 0.00% 1 100.00% 0.00% 1
Content (Subject Area) Endorsements
0.00% 1 1.45% 25 36.23% 43 62.32% 69
Special Education 0.00% 2 10.00% 10 50.00% 8 40.00% 20
Total 1 0.68% 3 2.04% 65 44.22% 78 53.06% 147
4.2 The
teacher creates
learning
experiences that
make these
aspects of the
discipline
accessible and
meaningful for
students
to assure
mastery of
content.
2014-2015 Rare Occasional Frequent Consistent Total
Early Childhood 0.00% 1 14.29% 2 28.57% 4 57.14% 7
Elementary 0.00% 4 6.45% 24 38.71% 34 54.84% 62
Middle Grades 0.00% 0.00% 1 25.00% 3 75.00% 4
Content (Subject
Area)
Endorsements 0.00% 3 5.08% 24 40.68% 32 54.24% 59
Special Education 0.00% 3 17.65% 4 23.53% 10 58.82% 17
Total 0.00% 11 7.38% 55 36.91% 83 55.70% 149
2015-2016 Rare Occasional Frequent Consistent Total
Early Childhood 0.00% 0.00% 2 0.00% 2 0.00% 4 Elementary 1 1.89% 3 5.66% 25 47.17% 24 45.28% 53
Middle Grades 0.00% 0.00% 1 100.00% 0.00% 1
Content (Subject Area) Endorsements
0.00% 3 4.35% 25 36.23% 41 59.42% 69
Special Education 0.00% 1 5.00% 10 50.00% 9 45.00% 20
Total

4.3 The
teacher
integrates
Nebraska
Content
Standards
and/or
professional
standards
within
instruction.
2014-2015 Rare Occasional Frequent Consistent Total
Early Childhood 0.00% 7 11.29% 2 28.57% 4 57.14% 7
Elementary 0.00% 0.00% 19 30.65% 36 58.06% 62
Middle Grades 0.00% 1 6.25% 1 25.00% 3 75.00% 4
Content (Subject
Area)
Endorsements
0.00% 1 14.29% 24 40.68% 32 54.24% 59
Special Education 1 6.25% 12 8.11% 6 37.50% 8 50.00% 16
Total 1 0.68% 1 14.29% 52 35.14% 83 56.08% 148
2015-2016 Rare Occasional Frequent Consistent Total
Early Childhood 0.00% 0.00% 1 0.00% 3 0.00% 4
Elementary 1 1.92% 0.00% 20 38.46% 31 59.62% 52 Middle Grades 0.00% 0.00% 0.00% 0.00% 0
Content (Subject Area) Endorsements
0.00% 2 2.90% 20 28.99% 47 68.12% 69
Special Education 0.00% 1 5.00% 9 45.00% 10 50.00% 20
Total 1 0.69% 3 2.07% 50 34.48% 91 62.76% 145

Responses from First Year Candidate Survey: Items Related to Preparation to Teach Content Knowledge (Item 1) and
Prepared to Teach Content Area (Item 2).
Table 5
Item 1: Prepared to Teach Content Area
Year # Item Endorsement Strongly
Disagree
Disagre
e
Neither
Agree nor
Disagree
Agree Strongly
Agree
Grand
Total
2014
-
2015
1 I am well
prepared to
teach in my
content area.
Early
Childhood
Education
0 0% 0 0% 1 8.3% 9 75.0
%
2 16.7% 12
Elementary
Education
0 0% 3 6.1% 3 6.1% 3
0
61.2
%
13 26.5% 49
Secondary
Education
0 0% 1 2.0% 1 2.0% 3
3
67.3
%
14 28.6% 49
Special
Education
0 0% 2 9.5% 2 9.5% 1
1
52.4
%
6 28.6% 21

2015
-
2016
1 I am well
prepared to
teach in my
content area.
Early
Childhood
Education
0 0.00%
0 0.00%
1 12.50% 2 25.00%
5 62.50%
8
Elementary
Education
0 0.00%
1 2.00%
2 4.00% 30
60.00%
17 34.00%
50
Secondary
Education
0 0.00%
1 1.61%
4 6.45% 44
70.97%
13 20.97%
62
Special
Education
0 0.00%
0 0.00%
0 0.00% 15
68.18%
7 31.82%
22
Table 6
Item 2: Prepared to Teach Content Area
Year # Item Endorsement Strongly
Disagree
Disagree Neither
Agree nor
Disagree
Agree Strongly
Agree
Grand
Total

2014
-
2015
2 I am confident
in my level of
subject matter
knowledge.
Early
Childhood
Education
0 0% 0 0% 3 25.0% 7 58.3% 2 16.7% 12
Elementary
Education
0 0% 3 6.1% 4 8.2% 26 53.1% 16 32.7% 49
Secondary
Education
0 0% 0 0% 2 4.1% 27 55.1% 20 40.8% 49
Special
Education
0 0% 0 0% 3 14.3% 11 52.4% 7 33.3% 21
2015-
2016
2 I am confident
in my subject
matter
knowledge.
Early Childhood Education
0 0.00% 0 0.00% 1 12.50% 4 50.00% 3 37.50% 8
Elementary Education
0 0.00% 1 2.00% 3 6.00% 26 52.00% 20 40.00% 50

Secondary Education
0 0.00% 0 0.00% 6 9.68% 31 50.00% 25 40.32% 62
Special Education
0 0.00% 0 0.00% 1 4.55% 14 63.64% 7 31.82% 22