table 26.1 illicit drug use in the past month and illicit
TRANSCRIPT
MO-1
160203 MISSOURI
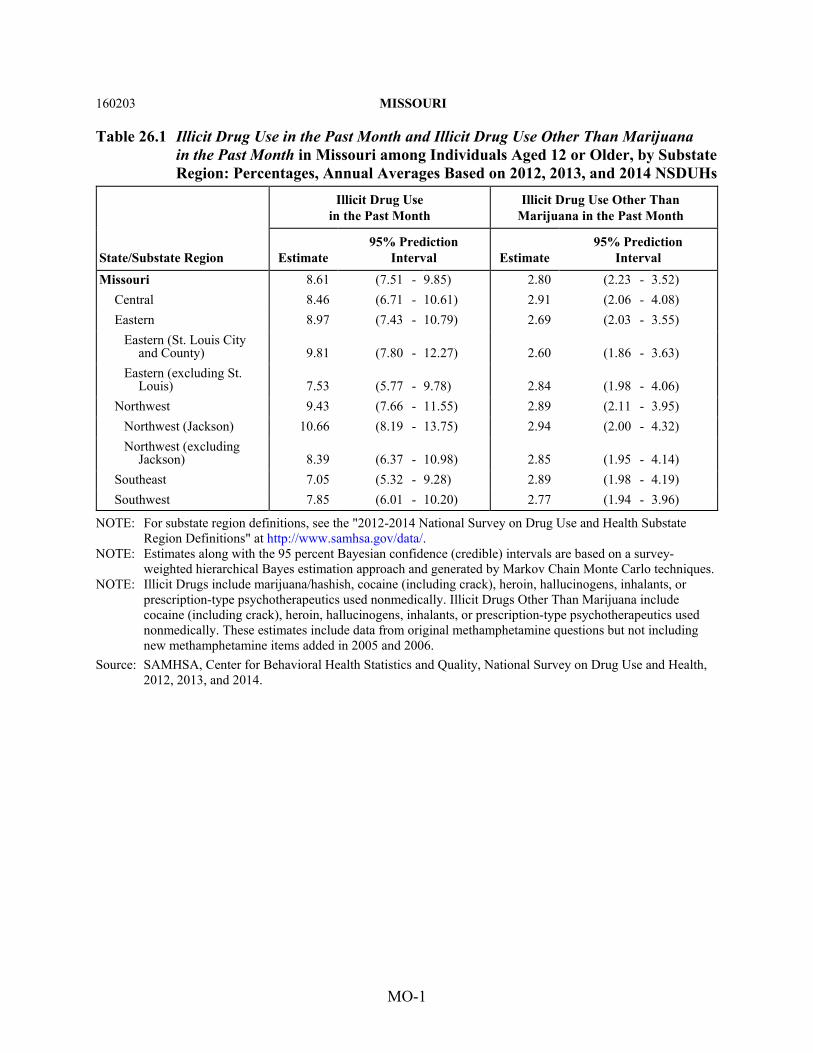
Table 26.1 Illicit Drug Use in the Past Month and Illicit Drug Use Other Than Marijuana in the Past Month in Missouri among Individuals Aged 12 or Older, by Substate Region: Percentages, Annual Averages Based on 2012, 2013, and 2014 NSDUHs
State/Substate Region
Illicit Drug Use in the Past Month
Illicit Drug Use Other Than Marijuana in the Past Month
Estimate 95% Prediction
Interval Estimate 95% Prediction
Interval Missouri 8.61 (7.51 - 9.85) 2.80 (2.23 - 3.52)
Central 8.46 (6.71 - 10.61) 2.91 (2.06 - 4.08) Eastern 8.97 (7.43 - 10.79) 2.69 (2.03 - 3.55)
Eastern (St. Louis City and County) 9.81 (7.80 - 12.27) 2.60 (1.86 - 3.63)
Eastern (excluding St. Louis) 7.53 (5.77 - 9.78) 2.84 (1.98 - 4.06)
Northwest 9.43 (7.66 - 11.55) 2.89 (2.11 - 3.95) Northwest (Jackson) 10.66 (8.19 - 13.75) 2.94 (2.00 - 4.32) Northwest (excluding
Jackson) 8.39 (6.37 - 10.98) 2.85 (1.95 - 4.14) Southeast 7.05 (5.32 - 9.28) 2.89 (1.98 - 4.19) Southwest 7.85 (6.01 - 10.20) 2.77 (1.94 - 3.96)
NOTE: For substate region definitions, see the "2012-2014 National Survey on Drug Use and Health Substate Region Definitions" at http://www.samhsa.gov/data/.
NOTE: Estimates along with the 95 percent Bayesian confidence (credible) intervals are based on a survey-weighted hierarchical Bayes estimation approach and generated by Markov Chain Monte Carlo techniques.
NOTE: Illicit Drugs include marijuana/hashish, cocaine (including crack), heroin, hallucinogens, inhalants, or prescription-type psychotherapeutics used nonmedically. Illicit Drugs Other Than Marijuana include cocaine (including crack), heroin, hallucinogens, inhalants, or prescription-type psychotherapeutics used nonmedically. These estimates include data from original methamphetamine questions but not including new methamphetamine items added in 2005 and 2006.
Source: SAMHSA, Center for Behavioral Health Statistics and Quality, National Survey on Drug Use and Health, 2012, 2013, and 2014.
MO-2
160203 MISSOURI
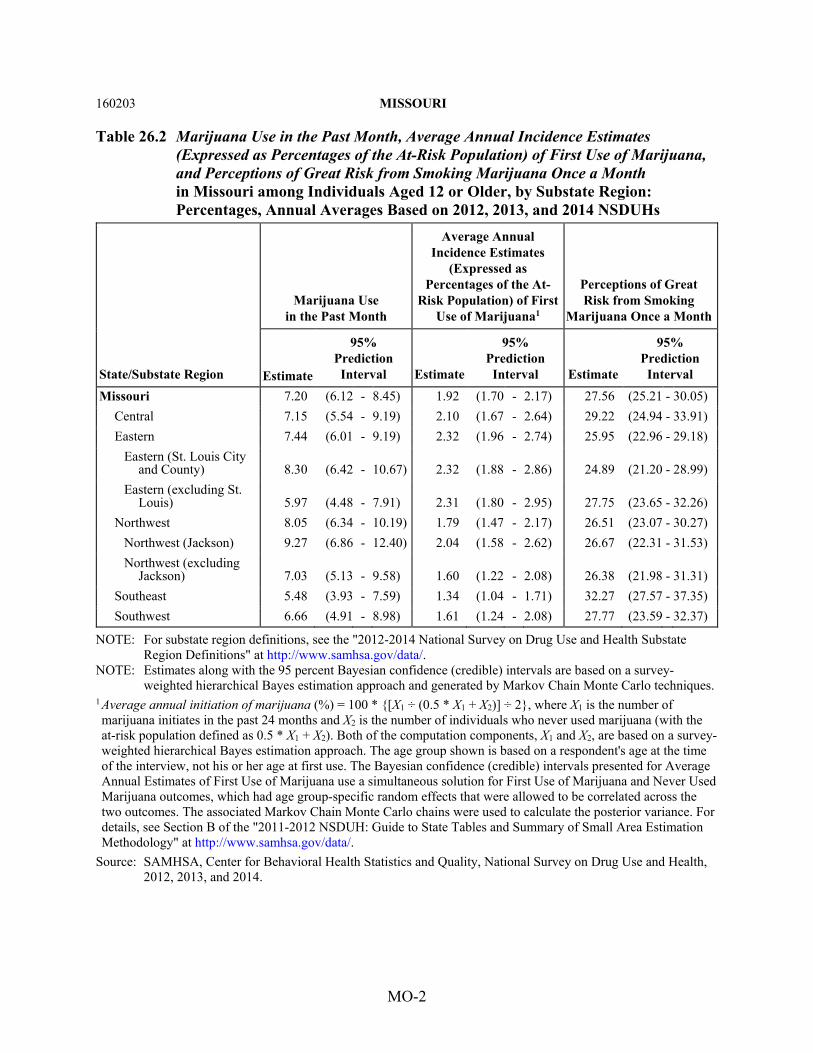
Table 26.2 Marijuana Use in the Past Month, Average Annual Incidence Estimates (Expressed as Percentages of the At-Risk Population) of First Use of Marijuana, and Perceptions of Great Risk from Smoking Marijuana Once a Month in Missouri among Individuals Aged 12 or Older, by Substate Region: Percentages, Annual Averages Based on 2012, 2013, and 2014 NSDUHs
State/Substate Region
Marijuana Use in the Past Month
Average Annual Incidence Estimates
(Expressed as Percentages of the At-
Risk Population) of First Use of Marijuana1
Perceptions of Great Risk from Smoking
Marijuana Once a Month
Estimate
95% Prediction Interval Estimate
95% Prediction
Interval Estimate
95% Prediction
Interval Missouri 7.20 (6.12 - 8.45) 1.92 (1.70 - 2.17) 27.56 (25.21 - 30.05)
Central 7.15 (5.54 - 9.19) 2.10 (1.67 - 2.64) 29.22 (24.94 - 33.91) Eastern 7.44 (6.01 - 9.19) 2.32 (1.96 - 2.74) 25.95 (22.96 - 29.18)
Eastern (St. Louis City and County) 8.30 (6.42 - 10.67) 2.32 (1.88 - 2.86) 24.89 (21.20 - 28.99)
Eastern (excluding St. Louis) 5.97 (4.48 - 7.91) 2.31 (1.80 - 2.95) 27.75 (23.65 - 32.26)
Northwest 8.05 (6.34 - 10.19) 1.79 (1.47 - 2.17) 26.51 (23.07 - 30.27) Northwest (Jackson) 9.27 (6.86 - 12.40) 2.04 (1.58 - 2.62) 26.67 (22.31 - 31.53) Northwest (excluding
Jackson) 7.03 (5.13 - 9.58) 1.60 (1.22 - 2.08) 26.38 (21.98 - 31.31) Southeast 5.48 (3.93 - 7.59) 1.34 (1.04 - 1.71) 32.27 (27.57 - 37.35) Southwest 6.66 (4.91 - 8.98) 1.61 (1.24 - 2.08) 27.77 (23.59 - 32.37)
NOTE: For substate region definitions, see the "2012-2014 National Survey on Drug Use and Health Substate Region Definitions" at http://www.samhsa.gov/data/.
NOTE: Estimates along with the 95 percent Bayesian confidence (credible) intervals are based on a survey-weighted hierarchical Bayes estimation approach and generated by Markov Chain Monte Carlo techniques.
1 Average annual initiation of marijuana (%) = 100 * {[X1 ÷ (0.5 * X1 + X2)] ÷ 2}, where X1 is the number of marijuana initiates in the past 24 months and X2 is the number of individuals who never used marijuana (with the at-risk population defined as 0.5 * X1 + X2). Both of the computation components, X1 and X2, are based on a survey-weighted hierarchical Bayes estimation approach. The age group shown is based on a respondent's age at the time of the interview, not his or her age at first use. The Bayesian confidence (credible) intervals presented for Average Annual Estimates of First Use of Marijuana use a simultaneous solution for First Use of Marijuana and Never Used Marijuana outcomes, which had age group-specific random effects that were allowed to be correlated across the two outcomes. The associated Markov Chain Monte Carlo chains were used to calculate the posterior variance. For details, see Section B of the "2011-2012 NSDUH: Guide to State Tables and Summary of Small Area Estimation Methodology" at http://www.samhsa.gov/data/.
Source: SAMHSA, Center for Behavioral Health Statistics and Quality, National Survey on Drug Use and Health, 2012, 2013, and 2014.
MO-3
160203 MISSOURI
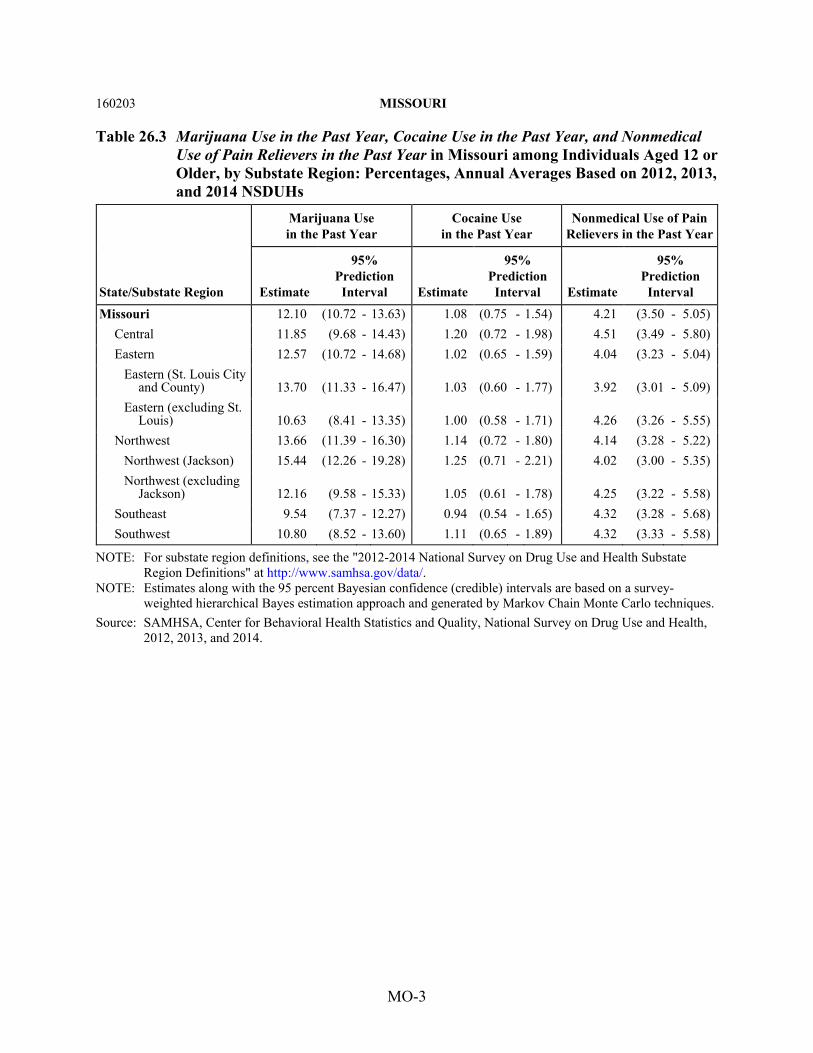
Table 26.3 Marijuana Use in the Past Year, Cocaine Use in the Past Year, and Nonmedical Use of Pain Relievers in the Past Year in Missouri among Individuals Aged 12 or Older, by Substate Region: Percentages, Annual Averages Based on 2012, 2013, and 2014 NSDUHs
State/Substate Region
Marijuana Use in the Past Year
Cocaine Use in the Past Year
Nonmedical Use of Pain Relievers in the Past Year
Estimate
95% Prediction Interval Estimate
95% Prediction Interval Estimate
95% Prediction
Interval Missouri 12.10 (10.72 - 13.63) 1.08 (0.75 - 1.54) 4.21 (3.50 - 5.05)
Central 11.85 (9.68 - 14.43) 1.20 (0.72 - 1.98) 4.51 (3.49 - 5.80) Eastern 12.57 (10.72 - 14.68) 1.02 (0.65 - 1.59) 4.04 (3.23 - 5.04)
Eastern (St. Louis City and County) 13.70 (11.33 - 16.47) 1.03 (0.60 - 1.77) 3.92 (3.01 - 5.09)
Eastern (excluding St. Louis) 10.63 (8.41 - 13.35) 1.00 (0.58 - 1.71) 4.26 (3.26 - 5.55)
Northwest 13.66 (11.39 - 16.30) 1.14 (0.72 - 1.80) 4.14 (3.28 - 5.22) Northwest (Jackson) 15.44 (12.26 - 19.28) 1.25 (0.71 - 2.21) 4.02 (3.00 - 5.35) Northwest (excluding
Jackson) 12.16 (9.58 - 15.33) 1.05 (0.61 - 1.78) 4.25 (3.22 - 5.58) Southeast 9.54 (7.37 - 12.27) 0.94 (0.54 - 1.65) 4.32 (3.28 - 5.68) Southwest 10.80 (8.52 - 13.60) 1.11 (0.65 - 1.89) 4.32 (3.33 - 5.58)
NOTE: For substate region definitions, see the "2012-2014 National Survey on Drug Use and Health Substate Region Definitions" at http://www.samhsa.gov/data/.
NOTE: Estimates along with the 95 percent Bayesian confidence (credible) intervals are based on a survey-weighted hierarchical Bayes estimation approach and generated by Markov Chain Monte Carlo techniques.
Source: SAMHSA, Center for Behavioral Health Statistics and Quality, National Survey on Drug Use and Health, 2012, 2013, and 2014.
MO-4
160203 MISSOURI
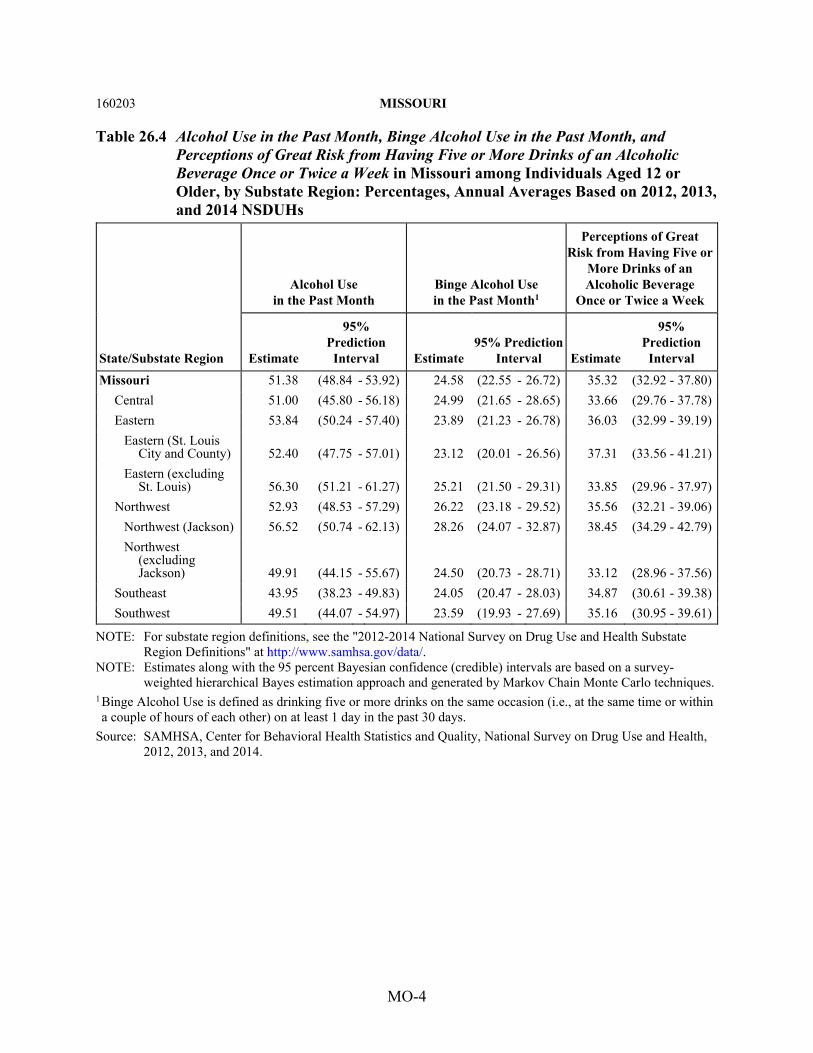
Table 26.4 Alcohol Use in the Past Month, Binge Alcohol Use in the Past Month, and Perceptions of Great Risk from Having Five or More Drinks of an Alcoholic Beverage Once or Twice a Week in Missouri among Individuals Aged 12 or Older, by Substate Region: Percentages, Annual Averages Based on 2012, 2013, and 2014 NSDUHs
State/Substate Region
Alcohol Use in the Past Month
Binge Alcohol Use in the Past Month1
Perceptions of Great Risk from Having Five or
More Drinks of an Alcoholic Beverage
Once or Twice a Week
Estimate
95% Prediction
Interval Estimate 95% Prediction
Interval Estimate
95% Prediction
Interval Missouri 51.38 (48.84 - 53.92) 24.58 (22.55 - 26.72) 35.32 (32.92 - 37.80)
Central 51.00 (45.80 - 56.18) 24.99 (21.65 - 28.65) 33.66 (29.76 - 37.78) Eastern 53.84 (50.24 - 57.40) 23.89 (21.23 - 26.78) 36.03 (32.99 - 39.19)
Eastern (St. Louis City and County) 52.40 (47.75 - 57.01) 23.12 (20.01 - 26.56) 37.31 (33.56 - 41.21)
Eastern (excluding St. Louis) 56.30 (51.21 - 61.27) 25.21 (21.50 - 29.31) 33.85 (29.96 - 37.97)
Northwest 52.93 (48.53 - 57.29) 26.22 (23.18 - 29.52) 35.56 (32.21 - 39.06) Northwest (Jackson) 56.52 (50.74 - 62.13) 28.26 (24.07 - 32.87) 38.45 (34.29 - 42.79) Northwest
(excluding Jackson) 49.91 (44.15 - 55.67) 24.50 (20.73 - 28.71) 33.12 (28.96 - 37.56)
Southeast 43.95 (38.23 - 49.83) 24.05 (20.47 - 28.03) 34.87 (30.61 - 39.38) Southwest 49.51 (44.07 - 54.97) 23.59 (19.93 - 27.69) 35.16 (30.95 - 39.61)
NOTE: For substate region definitions, see the "2012-2014 National Survey on Drug Use and Health Substate Region Definitions" at http://www.samhsa.gov/data/.
NOTE: Estimates along with the 95 percent Bayesian confidence (credible) intervals are based on a survey-weighted hierarchical Bayes estimation approach and generated by Markov Chain Monte Carlo techniques.
1 Binge Alcohol Use is defined as drinking five or more drinks on the same occasion (i.e., at the same time or within a couple of hours of each other) on at least 1 day in the past 30 days.
Source: SAMHSA, Center for Behavioral Health Statistics and Quality, National Survey on Drug Use and Health, 2012, 2013, and 2014.
MO-5
160203 MISSOURI
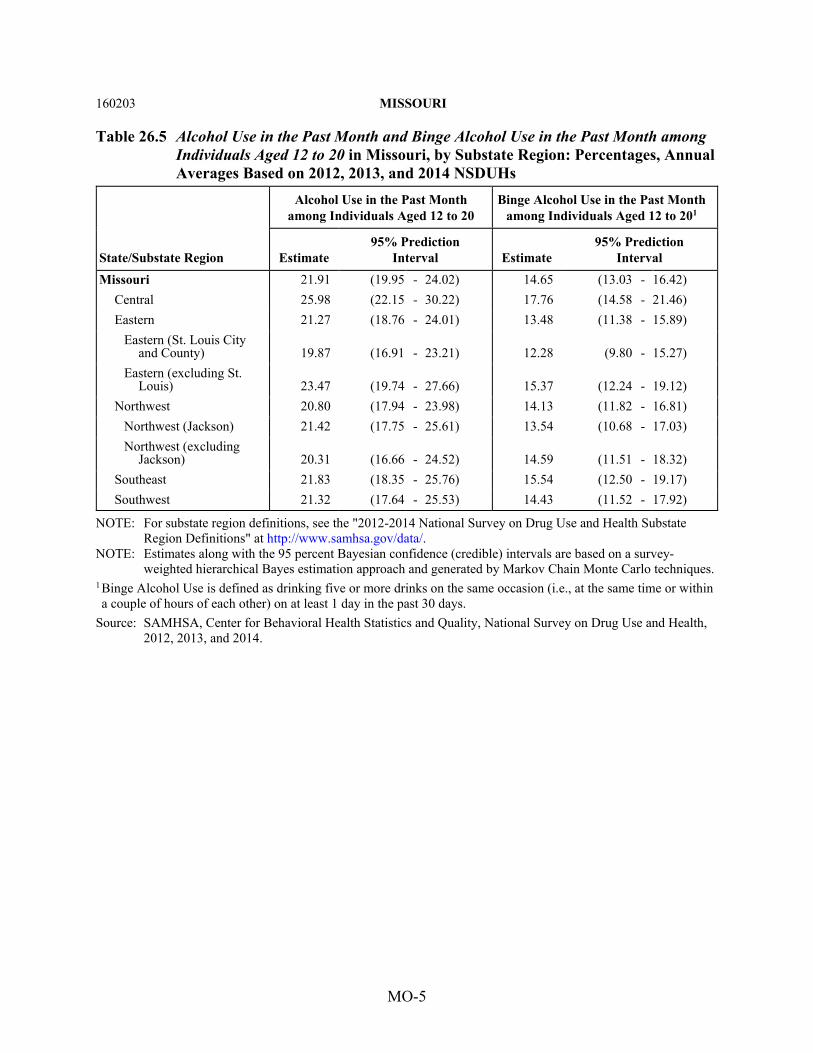
Table 26.5 Alcohol Use in the Past Month and Binge Alcohol Use in the Past Month among Individuals Aged 12 to 20 in Missouri, by Substate Region: Percentages, Annual Averages Based on 2012, 2013, and 2014 NSDUHs
State/Substate Region
Alcohol Use in the Past Month among Individuals Aged 12 to 20
Binge Alcohol Use in the Past Month among Individuals Aged 12 to 201
Estimate 95% Prediction
Interval Estimate 95% Prediction
Interval Missouri 21.91 (19.95 - 24.02) 14.65 (13.03 - 16.42)
Central 25.98 (22.15 - 30.22) 17.76 (14.58 - 21.46) Eastern 21.27 (18.76 - 24.01) 13.48 (11.38 - 15.89)
Eastern (St. Louis City and County) 19.87 (16.91 - 23.21) 12.28 (9.80 - 15.27)
Eastern (excluding St. Louis) 23.47 (19.74 - 27.66) 15.37 (12.24 - 19.12)
Northwest 20.80 (17.94 - 23.98) 14.13 (11.82 - 16.81) Northwest (Jackson) 21.42 (17.75 - 25.61) 13.54 (10.68 - 17.03) Northwest (excluding
Jackson) 20.31 (16.66 - 24.52) 14.59 (11.51 - 18.32) Southeast 21.83 (18.35 - 25.76) 15.54 (12.50 - 19.17) Southwest 21.32 (17.64 - 25.53) 14.43 (11.52 - 17.92)
NOTE: For substate region definitions, see the "2012-2014 National Survey on Drug Use and Health Substate Region Definitions" at http://www.samhsa.gov/data/.
NOTE: Estimates along with the 95 percent Bayesian confidence (credible) intervals are based on a survey-weighted hierarchical Bayes estimation approach and generated by Markov Chain Monte Carlo techniques.
1 Binge Alcohol Use is defined as drinking five or more drinks on the same occasion (i.e., at the same time or within a couple of hours of each other) on at least 1 day in the past 30 days.
Source: SAMHSA, Center for Behavioral Health Statistics and Quality, National Survey on Drug Use and Health, 2012, 2013, and 2014.
MO-6
160203 MISSOURI
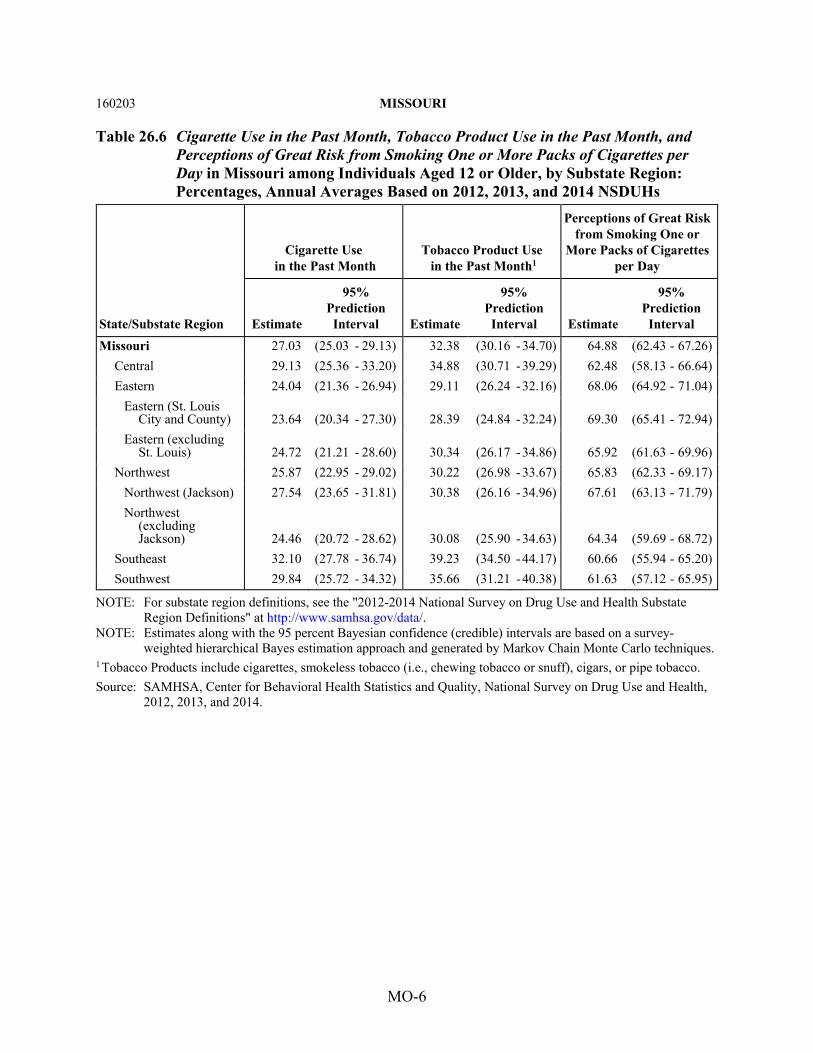
Table 26.6 Cigarette Use in the Past Month, Tobacco Product Use in the Past Month, and Perceptions of Great Risk from Smoking One or More Packs of Cigarettes per Day in Missouri among Individuals Aged 12 or Older, by Substate Region: Percentages, Annual Averages Based on 2012, 2013, and 2014 NSDUHs
State/Substate Region
Cigarette Use in the Past Month
Tobacco Product Use in the Past Month1
Perceptions of Great Risk from Smoking One or
More Packs of Cigarettes per Day
Estimate
95% Prediction Interval Estimate
95% Prediction
Interval Estimate
95% Prediction
Interval Missouri 27.03 (25.03 - 29.13) 32.38 (30.16 - 34.70) 64.88 (62.43 - 67.26)
Central 29.13 (25.36 - 33.20) 34.88 (30.71 - 39.29) 62.48 (58.13 - 66.64) Eastern 24.04 (21.36 - 26.94) 29.11 (26.24 - 32.16) 68.06 (64.92 - 71.04)
Eastern (St. Louis City and County) 23.64 (20.34 - 27.30) 28.39 (24.84 - 32.24) 69.30 (65.41 - 72.94)
Eastern (excluding St. Louis) 24.72 (21.21 - 28.60) 30.34 (26.17 - 34.86) 65.92 (61.63 - 69.96)
Northwest 25.87 (22.95 - 29.02) 30.22 (26.98 - 33.67) 65.83 (62.33 - 69.17) Northwest (Jackson) 27.54 (23.65 - 31.81) 30.38 (26.16 - 34.96) 67.61 (63.13 - 71.79) Northwest
(excluding Jackson) 24.46 (20.72 - 28.62) 30.08 (25.90 - 34.63) 64.34 (59.69 - 68.72)
Southeast 32.10 (27.78 - 36.74) 39.23 (34.50 - 44.17) 60.66 (55.94 - 65.20) Southwest 29.84 (25.72 - 34.32) 35.66 (31.21 - 40.38) 61.63 (57.12 - 65.95)
NOTE: For substate region definitions, see the "2012-2014 National Survey on Drug Use and Health Substate Region Definitions" at http://www.samhsa.gov/data/.
NOTE: Estimates along with the 95 percent Bayesian confidence (credible) intervals are based on a survey-weighted hierarchical Bayes estimation approach and generated by Markov Chain Monte Carlo techniques.
1 Tobacco Products include cigarettes, smokeless tobacco (i.e., chewing tobacco or snuff), cigars, or pipe tobacco. Source: SAMHSA, Center for Behavioral Health Statistics and Quality, National Survey on Drug Use and Health,
2012, 2013, and 2014.
MO-7
160203 MISSOURI
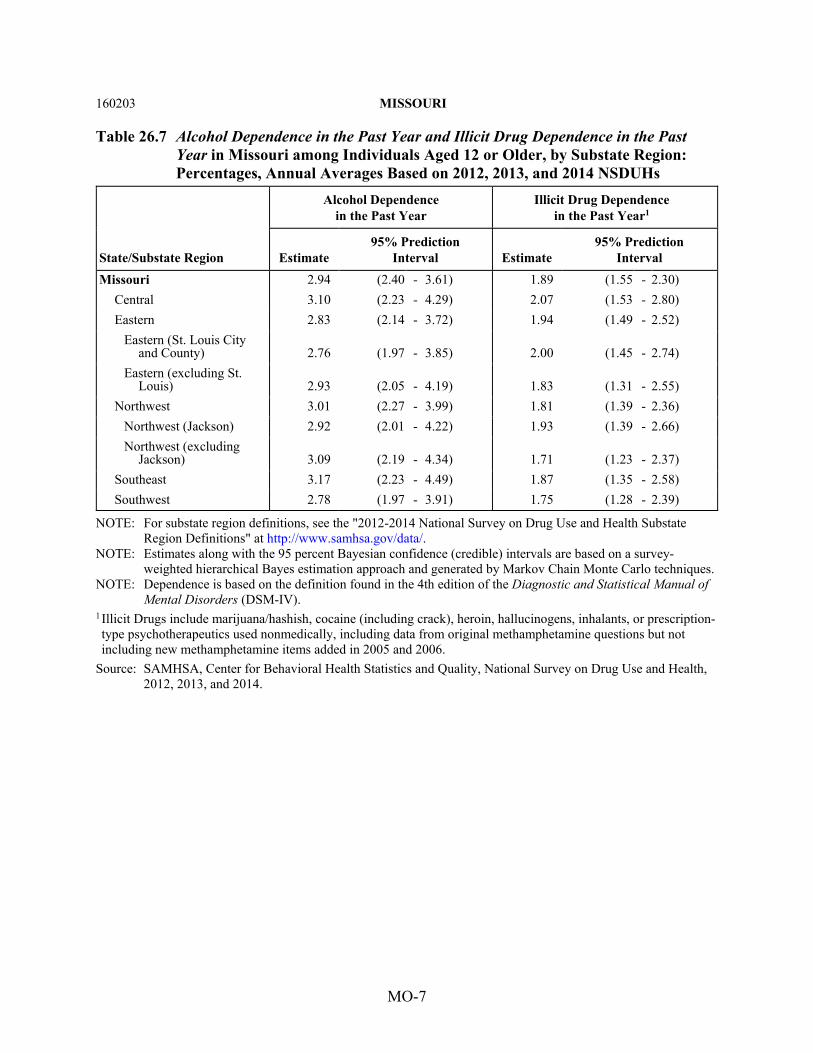
Table 26.7 Alcohol Dependence in the Past Year and Illicit Drug Dependence in the Past Year in Missouri among Individuals Aged 12 or Older, by Substate Region: Percentages, Annual Averages Based on 2012, 2013, and 2014 NSDUHs
State/Substate Region
Alcohol Dependence in the Past Year
Illicit Drug Dependence in the Past Year1
Estimate 95% Prediction
Interval Estimate 95% Prediction
Interval Missouri 2.94 (2.40 - 3.61) 1.89 (1.55 - 2.30)
Central 3.10 (2.23 - 4.29) 2.07 (1.53 - 2.80) Eastern 2.83 (2.14 - 3.72) 1.94 (1.49 - 2.52)
Eastern (St. Louis City and County) 2.76 (1.97 - 3.85) 2.00 (1.45 - 2.74)
Eastern (excluding St. Louis) 2.93 (2.05 - 4.19) 1.83 (1.31 - 2.55)
Northwest 3.01 (2.27 - 3.99) 1.81 (1.39 - 2.36) Northwest (Jackson) 2.92 (2.01 - 4.22) 1.93 (1.39 - 2.66) Northwest (excluding
Jackson) 3.09 (2.19 - 4.34) 1.71 (1.23 - 2.37) Southeast 3.17 (2.23 - 4.49) 1.87 (1.35 - 2.58) Southwest 2.78 (1.97 - 3.91) 1.75 (1.28 - 2.39)
NOTE: For substate region definitions, see the "2012-2014 National Survey on Drug Use and Health Substate Region Definitions" at http://www.samhsa.gov/data/.
NOTE: Estimates along with the 95 percent Bayesian confidence (credible) intervals are based on a survey-weighted hierarchical Bayes estimation approach and generated by Markov Chain Monte Carlo techniques.
NOTE: Dependence is based on the definition found in the 4th edition of the Diagnostic and Statistical Manual of Mental Disorders (DSM-IV).
1 Illicit Drugs include marijuana/hashish, cocaine (including crack), heroin, hallucinogens, inhalants, or prescription-type psychotherapeutics used nonmedically, including data from original methamphetamine questions but not including new methamphetamine items added in 2005 and 2006.
Source: SAMHSA, Center for Behavioral Health Statistics and Quality, National Survey on Drug Use and Health, 2012, 2013, and 2014.
MO-8
160203 MISSOURI
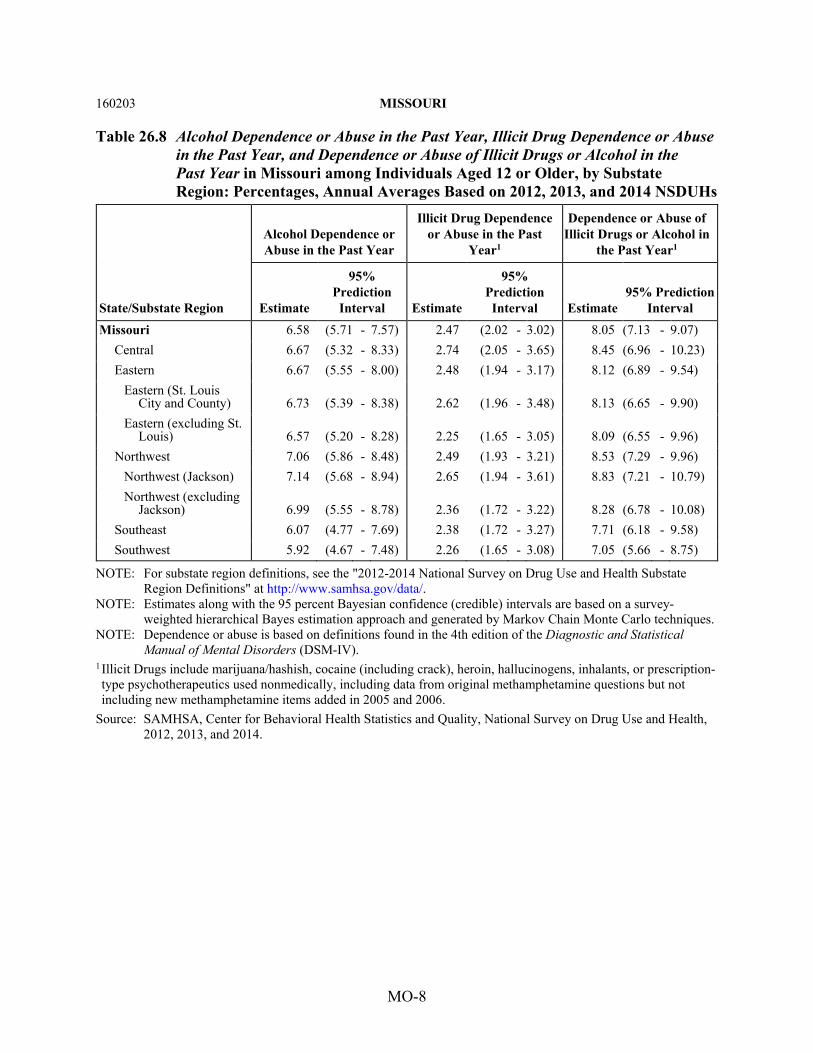
Table 26.8 Alcohol Dependence or Abuse in the Past Year, Illicit Drug Dependence or Abuse in the Past Year, and Dependence or Abuse of Illicit Drugs or Alcohol in the Past Year in Missouri among Individuals Aged 12 or Older, by Substate Region: Percentages, Annual Averages Based on 2012, 2013, and 2014 NSDUHs
State/Substate Region
Alcohol Dependence or Abuse in the Past Year
Illicit Drug Dependence or Abuse in the Past
Year1
Dependence or Abuse of Illicit Drugs or Alcohol in
the Past Year1
Estimate
95% Prediction
Interval Estimate
95% Prediction Interval Estimate
95% Prediction Interval
Missouri 6.58 (5.71 - 7.57) 2.47 (2.02 - 3.02) 8.05 (7.13 - 9.07) Central 6.67 (5.32 - 8.33) 2.74 (2.05 - 3.65) 8.45 (6.96 - 10.23) Eastern 6.67 (5.55 - 8.00) 2.48 (1.94 - 3.17) 8.12 (6.89 - 9.54)
Eastern (St. Louis City and County) 6.73 (5.39 - 8.38) 2.62 (1.96 - 3.48) 8.13 (6.65 - 9.90)
Eastern (excluding St. Louis) 6.57 (5.20 - 8.28) 2.25 (1.65 - 3.05) 8.09 (6.55 - 9.96)
Northwest 7.06 (5.86 - 8.48) 2.49 (1.93 - 3.21) 8.53 (7.29 - 9.96) Northwest (Jackson) 7.14 (5.68 - 8.94) 2.65 (1.94 - 3.61) 8.83 (7.21 - 10.79) Northwest (excluding
Jackson) 6.99 (5.55 - 8.78) 2.36 (1.72 - 3.22) 8.28 (6.78 - 10.08) Southeast 6.07 (4.77 - 7.69) 2.38 (1.72 - 3.27) 7.71 (6.18 - 9.58) Southwest 5.92 (4.67 - 7.48) 2.26 (1.65 - 3.08) 7.05 (5.66 - 8.75)
NOTE: For substate region definitions, see the "2012-2014 National Survey on Drug Use and Health Substate Region Definitions" at http://www.samhsa.gov/data/.
NOTE: Estimates along with the 95 percent Bayesian confidence (credible) intervals are based on a survey-weighted hierarchical Bayes estimation approach and generated by Markov Chain Monte Carlo techniques.
NOTE: Dependence or abuse is based on definitions found in the 4th edition of the Diagnostic and Statistical Manual of Mental Disorders (DSM-IV).
1 Illicit Drugs include marijuana/hashish, cocaine (including crack), heroin, hallucinogens, inhalants, or prescription-type psychotherapeutics used nonmedically, including data from original methamphetamine questions but not including new methamphetamine items added in 2005 and 2006.
Source: SAMHSA, Center for Behavioral Health Statistics and Quality, National Survey on Drug Use and Health, 2012, 2013, and 2014.
MO-9
160203 MISSOURI
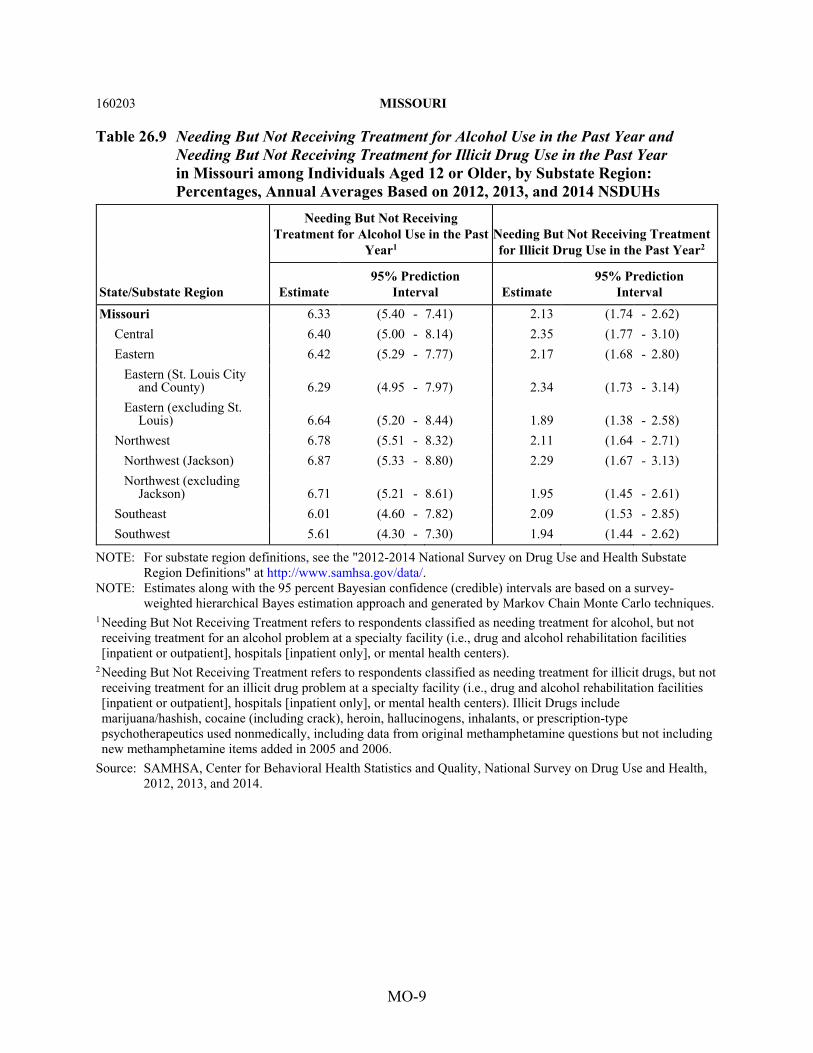
Table 26.9 Needing But Not Receiving Treatment for Alcohol Use in the Past Year and Needing But Not Receiving Treatment for Illicit Drug Use in the Past Year in Missouri among Individuals Aged 12 or Older, by Substate Region: Percentages, Annual Averages Based on 2012, 2013, and 2014 NSDUHs
State/Substate Region
Needing But Not Receiving Treatment for Alcohol Use in the Past
Year1 Needing But Not Receiving Treatment for Illicit Drug Use in the Past Year2
Estimate 95% Prediction
Interval Estimate 95% Prediction
Interval Missouri 6.33 (5.40 - 7.41) 2.13 (1.74 - 2.62)
Central 6.40 (5.00 - 8.14) 2.35 (1.77 - 3.10) Eastern 6.42 (5.29 - 7.77) 2.17 (1.68 - 2.80)
Eastern (St. Louis City and County) 6.29 (4.95 - 7.97) 2.34 (1.73 - 3.14)
Eastern (excluding St. Louis) 6.64 (5.20 - 8.44) 1.89 (1.38 - 2.58)
Northwest 6.78 (5.51 - 8.32) 2.11 (1.64 - 2.71) Northwest (Jackson) 6.87 (5.33 - 8.80) 2.29 (1.67 - 3.13) Northwest (excluding
Jackson) 6.71 (5.21 - 8.61) 1.95 (1.45 - 2.61) Southeast 6.01 (4.60 - 7.82) 2.09 (1.53 - 2.85) Southwest 5.61 (4.30 - 7.30) 1.94 (1.44 - 2.62)
NOTE: For substate region definitions, see the "2012-2014 National Survey on Drug Use and Health Substate Region Definitions" at http://www.samhsa.gov/data/.
NOTE: Estimates along with the 95 percent Bayesian confidence (credible) intervals are based on a survey-weighted hierarchical Bayes estimation approach and generated by Markov Chain Monte Carlo techniques.
1 Needing But Not Receiving Treatment refers to respondents classified as needing treatment for alcohol, but not receiving treatment for an alcohol problem at a specialty facility (i.e., drug and alcohol rehabilitation facilities [inpatient or outpatient], hospitals [inpatient only], or mental health centers).
2 Needing But Not Receiving Treatment refers to respondents classified as needing treatment for illicit drugs, but not receiving treatment for an illicit drug problem at a specialty facility (i.e., drug and alcohol rehabilitation facilities [inpatient or outpatient], hospitals [inpatient only], or mental health centers). Illicit Drugs include marijuana/hashish, cocaine (including crack), heroin, hallucinogens, inhalants, or prescription-type psychotherapeutics used nonmedically, including data from original methamphetamine questions but not including new methamphetamine items added in 2005 and 2006.
Source: SAMHSA, Center for Behavioral Health Statistics and Quality, National Survey on Drug Use and Health, 2012, 2013, and 2014.
MO-10
160203 MISSOURI
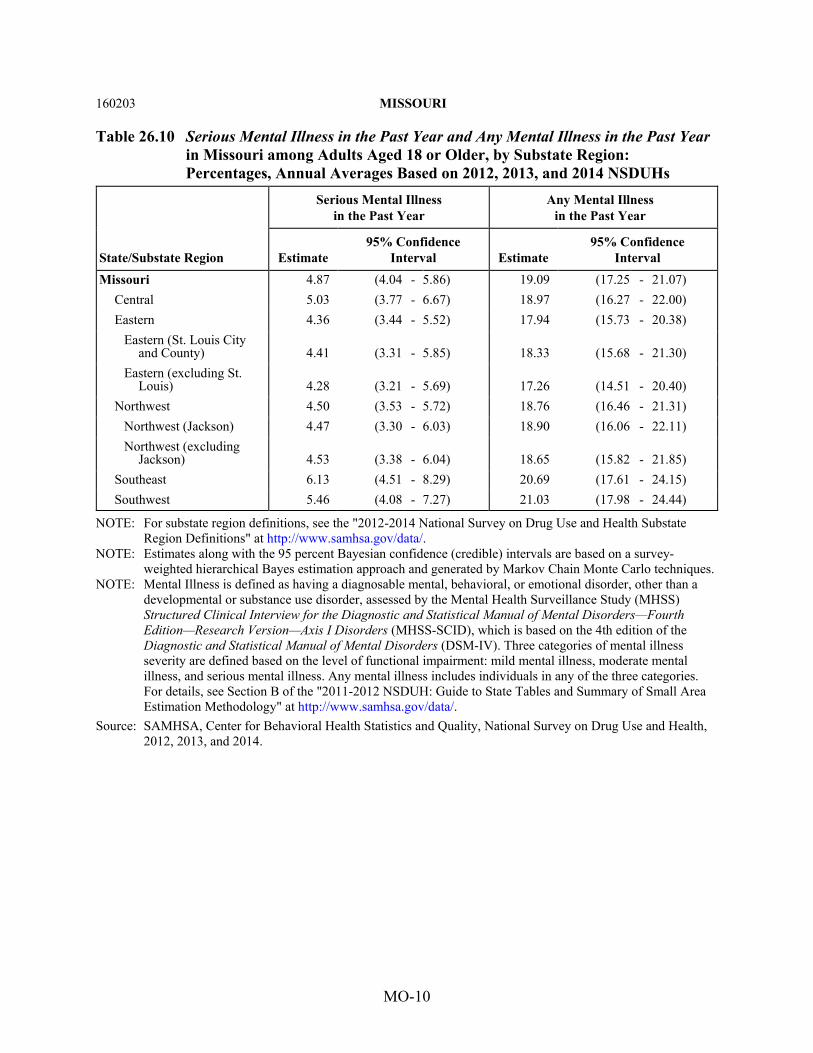
Table 26.10 Serious Mental Illness in the Past Year and Any Mental Illness in the Past Year in Missouri among Adults Aged 18 or Older, by Substate Region: Percentages, Annual Averages Based on 2012, 2013, and 2014 NSDUHs
State/Substate Region
Serious Mental Illness in the Past Year
Any Mental Illness in the Past Year
Estimate 95% Confidence
Interval Estimate 95% Confidence
Interval Missouri 4.87 (4.04 - 5.86) 19.09 (17.25 - 21.07)
Central 5.03 (3.77 - 6.67) 18.97 (16.27 - 22.00) Eastern 4.36 (3.44 - 5.52) 17.94 (15.73 - 20.38)
Eastern (St. Louis City and County) 4.41 (3.31 - 5.85) 18.33 (15.68 - 21.30)
Eastern (excluding St. Louis) 4.28 (3.21 - 5.69) 17.26 (14.51 - 20.40)
Northwest 4.50 (3.53 - 5.72) 18.76 (16.46 - 21.31) Northwest (Jackson) 4.47 (3.30 - 6.03) 18.90 (16.06 - 22.11) Northwest (excluding
Jackson) 4.53 (3.38 - 6.04) 18.65 (15.82 - 21.85) Southeast 6.13 (4.51 - 8.29) 20.69 (17.61 - 24.15) Southwest 5.46 (4.08 - 7.27) 21.03 (17.98 - 24.44)
NOTE: For substate region definitions, see the "2012-2014 National Survey on Drug Use and Health Substate Region Definitions" at http://www.samhsa.gov/data/.
NOTE: Estimates along with the 95 percent Bayesian confidence (credible) intervals are based on a survey-weighted hierarchical Bayes estimation approach and generated by Markov Chain Monte Carlo techniques.
NOTE: Mental Illness is defined as having a diagnosable mental, behavioral, or emotional disorder, other than a developmental or substance use disorder, assessed by the Mental Health Surveillance Study (MHSS) Structured Clinical Interview for the Diagnostic and Statistical Manual of Mental Disorders—Fourth Edition—Research Version—Axis I Disorders (MHSS-SCID), which is based on the 4th edition of the Diagnostic and Statistical Manual of Mental Disorders (DSM-IV). Three categories of mental illness severity are defined based on the level of functional impairment: mild mental illness, moderate mental illness, and serious mental illness. Any mental illness includes individuals in any of the three categories. For details, see Section B of the "2011-2012 NSDUH: Guide to State Tables and Summary of Small Area Estimation Methodology" at http://www.samhsa.gov/data/.
Source: SAMHSA, Center for Behavioral Health Statistics and Quality, National Survey on Drug Use and Health, 2012, 2013, and 2014.
MO-11
160203 MISSOURI
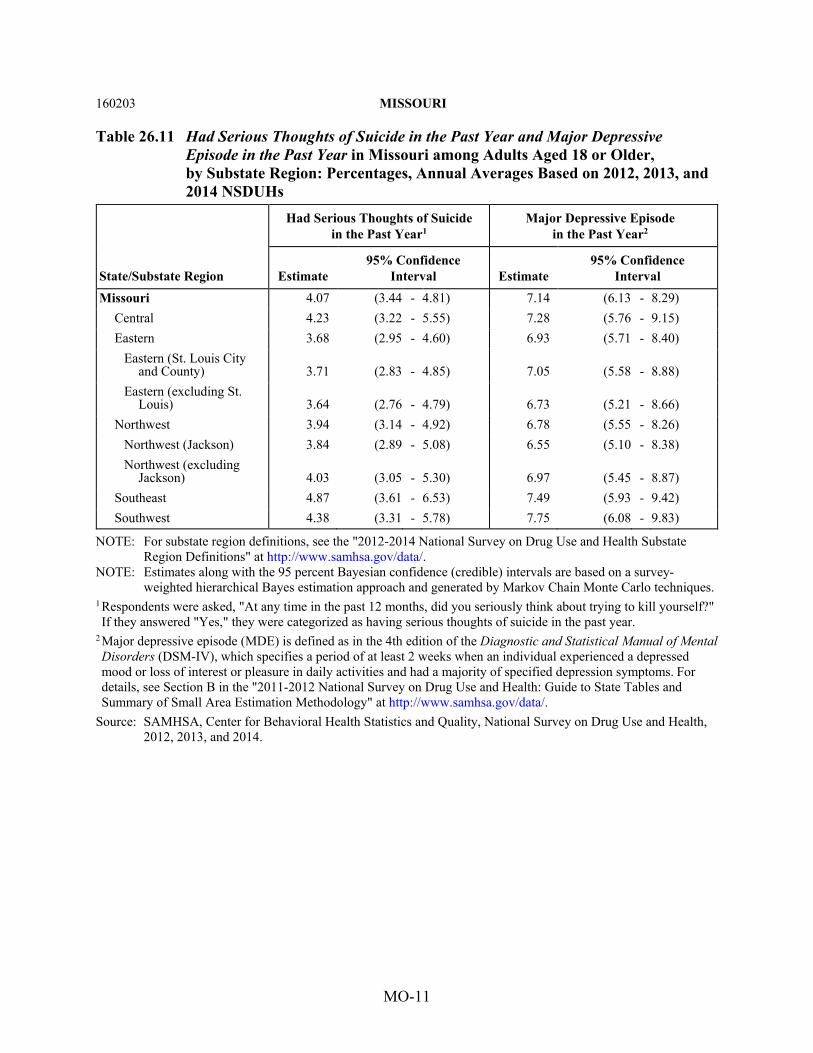
Table 26.11 Had Serious Thoughts of Suicide in the Past Year and Major Depressive Episode in the Past Year in Missouri among Adults Aged 18 or Older, by Substate Region: Percentages, Annual Averages Based on 2012, 2013, and 2014 NSDUHs
State/Substate Region
Had Serious Thoughts of Suicide in the Past Year1
Major Depressive Episode in the Past Year2
Estimate 95% Confidence
Interval Estimate 95% Confidence
Interval Missouri 4.07 (3.44 - 4.81) 7.14 (6.13 - 8.29)
Central 4.23 (3.22 - 5.55) 7.28 (5.76 - 9.15) Eastern 3.68 (2.95 - 4.60) 6.93 (5.71 - 8.40)
Eastern (St. Louis City and County) 3.71 (2.83 - 4.85) 7.05 (5.58 - 8.88)
Eastern (excluding St. Louis) 3.64 (2.76 - 4.79) 6.73 (5.21 - 8.66)
Northwest 3.94 (3.14 - 4.92) 6.78 (5.55 - 8.26) Northwest (Jackson) 3.84 (2.89 - 5.08) 6.55 (5.10 - 8.38) Northwest (excluding
Jackson) 4.03 (3.05 - 5.30) 6.97 (5.45 - 8.87) Southeast 4.87 (3.61 - 6.53) 7.49 (5.93 - 9.42) Southwest 4.38 (3.31 - 5.78) 7.75 (6.08 - 9.83)
NOTE: For substate region definitions, see the "2012-2014 National Survey on Drug Use and Health Substate Region Definitions" at http://www.samhsa.gov/data/.
NOTE: Estimates along with the 95 percent Bayesian confidence (credible) intervals are based on a survey-weighted hierarchical Bayes estimation approach and generated by Markov Chain Monte Carlo techniques.
1 Respondents were asked, "At any time in the past 12 months, did you seriously think about trying to kill yourself?" If they answered "Yes," they were categorized as having serious thoughts of suicide in the past year.
2 Major depressive episode (MDE) is defined as in the 4th edition of the Diagnostic and Statistical Manual of Mental Disorders (DSM-IV), which specifies a period of at least 2 weeks when an individual experienced a depressed mood or loss of interest or pleasure in daily activities and had a majority of specified depression symptoms. For details, see Section B in the "2011-2012 National Survey on Drug Use and Health: Guide to State Tables and Summary of Small Area Estimation Methodology" at http://www.samhsa.gov/data/.
Source: SAMHSA, Center for Behavioral Health Statistics and Quality, National Survey on Drug Use and Health, 2012, 2013, and 2014.
MO-12
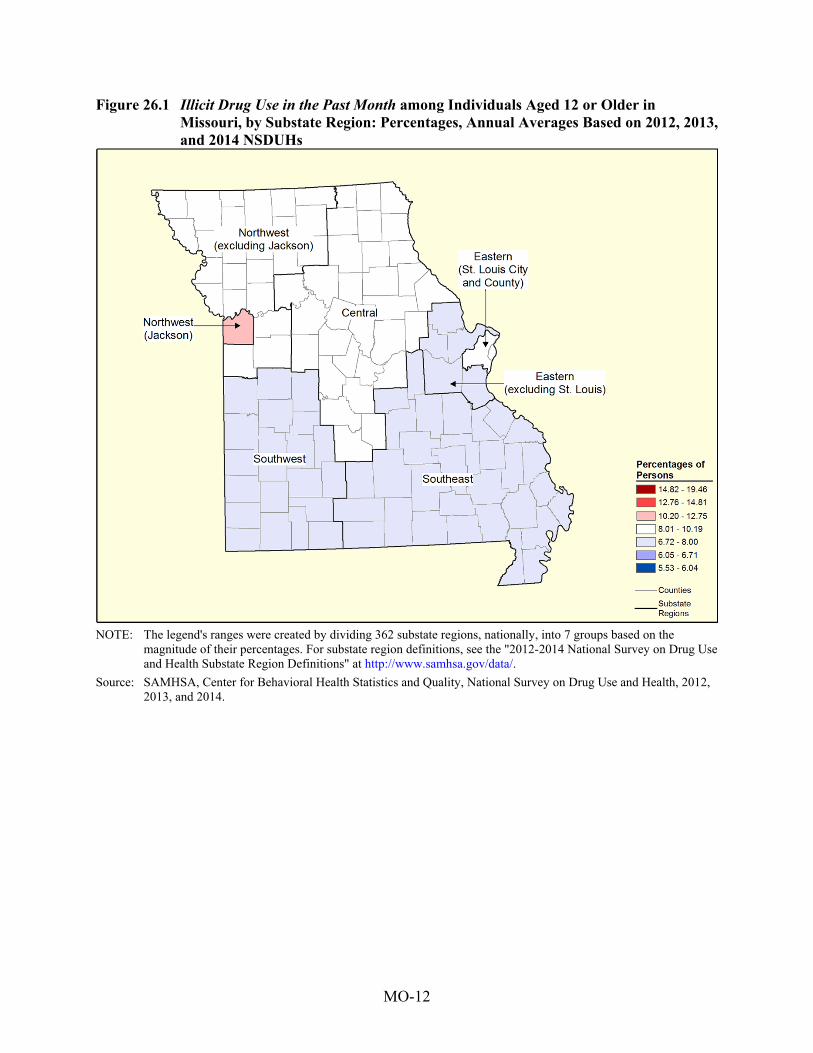
Figure 26.1 Illicit Drug Use in the Past Month among Individuals Aged 12 or Older in Missouri, by Substate Region: Percentages, Annual Averages Based on 2012, 2013, and 2014 NSDUHs
NOTE: The legend's ranges were created by dividing 362 substate regions, nationally, into 7 groups based on the
magnitude of their percentages. For substate region definitions, see the "2012-2014 National Survey on Drug Use and Health Substate Region Definitions" at http://www.samhsa.gov/data/.
Source: SAMHSA, Center for Behavioral Health Statistics and Quality, National Survey on Drug Use and Health, 2012, 2013, and 2014.

MO-13
Figure 26.2 Marijuana Use in the Past Year among Individuals Aged 12 or Older in Missouri, by Substate Region: Percentages, Annual Averages Based on 2012, 2013, and 2014 NSDUHs
NOTE: The legend's ranges were created by dividing 362 substate regions, nationally, into 7 groups based on the
magnitude of their percentages. For substate region definitions, see the "2012-2014 National Survey on Drug Use and Health Substate Region Definitions" at http://www.samhsa.gov/data/.
Source: SAMHSA, Center for Behavioral Health Statistics and Quality, National Survey on Drug Use and Health, 2012, 2013, and 2014.
MO-14
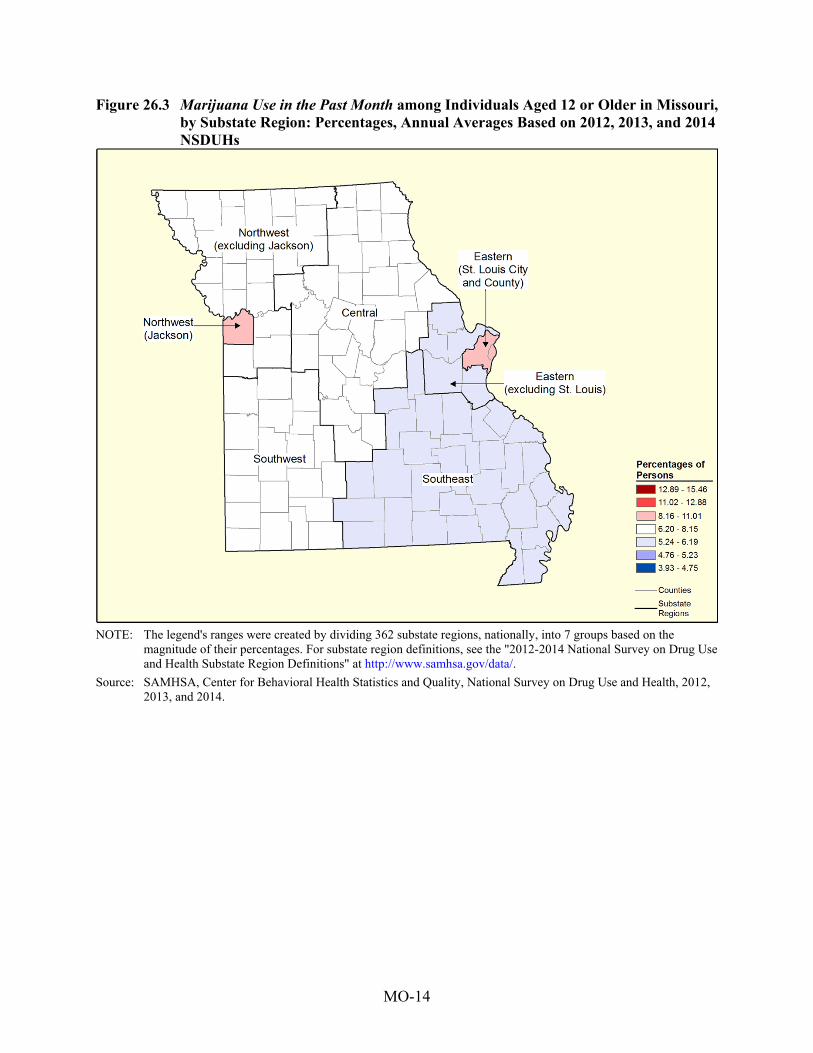
Figure 26.3 Marijuana Use in the Past Month among Individuals Aged 12 or Older in Missouri, by Substate Region: Percentages, Annual Averages Based on 2012, 2013, and 2014 NSDUHs
NOTE: The legend's ranges were created by dividing 362 substate regions, nationally, into 7 groups based on the
magnitude of their percentages. For substate region definitions, see the "2012-2014 National Survey on Drug Use and Health Substate Region Definitions" at http://www.samhsa.gov/data/.
Source: SAMHSA, Center for Behavioral Health Statistics and Quality, National Survey on Drug Use and Health, 2012, 2013, and 2014.
MO-15
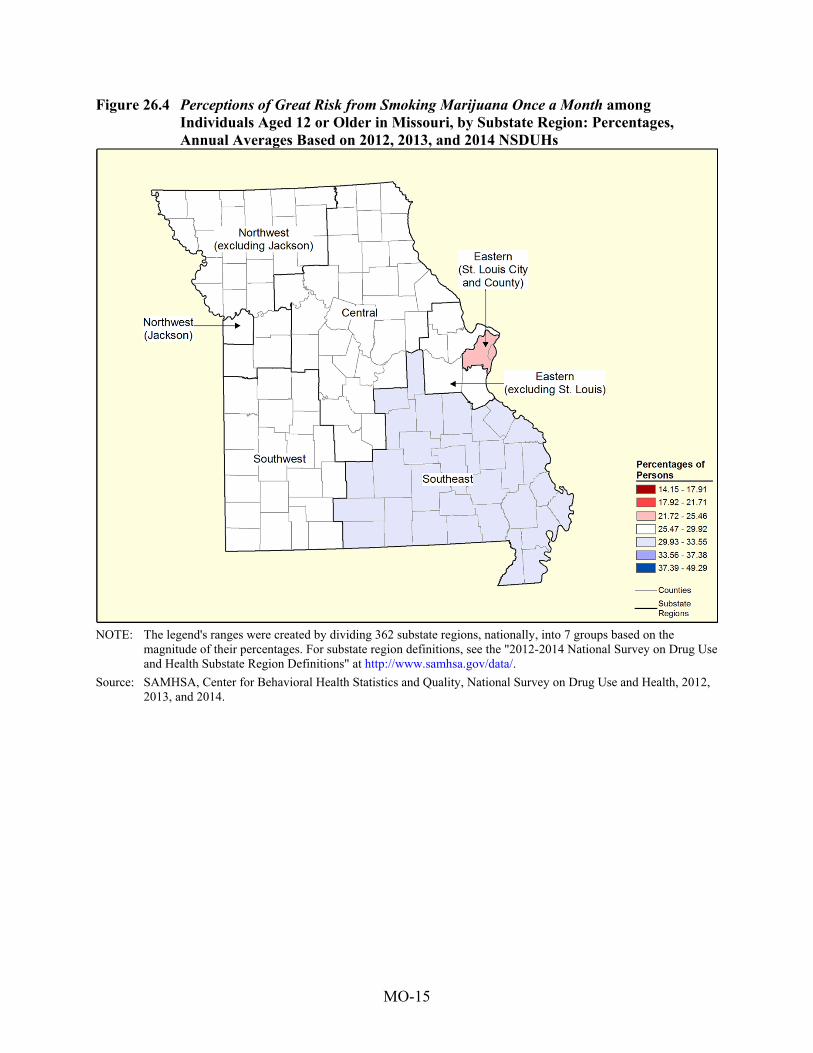
Figure 26.4 Perceptions of Great Risk from Smoking Marijuana Once a Month among Individuals Aged 12 or Older in Missouri, by Substate Region: Percentages, Annual Averages Based on 2012, 2013, and 2014 NSDUHs
NOTE: The legend's ranges were created by dividing 362 substate regions, nationally, into 7 groups based on the
magnitude of their percentages. For substate region definitions, see the "2012-2014 National Survey on Drug Use and Health Substate Region Definitions" at http://www.samhsa.gov/data/.
Source: SAMHSA, Center for Behavioral Health Statistics and Quality, National Survey on Drug Use and Health, 2012, 2013, and 2014.
MO-16
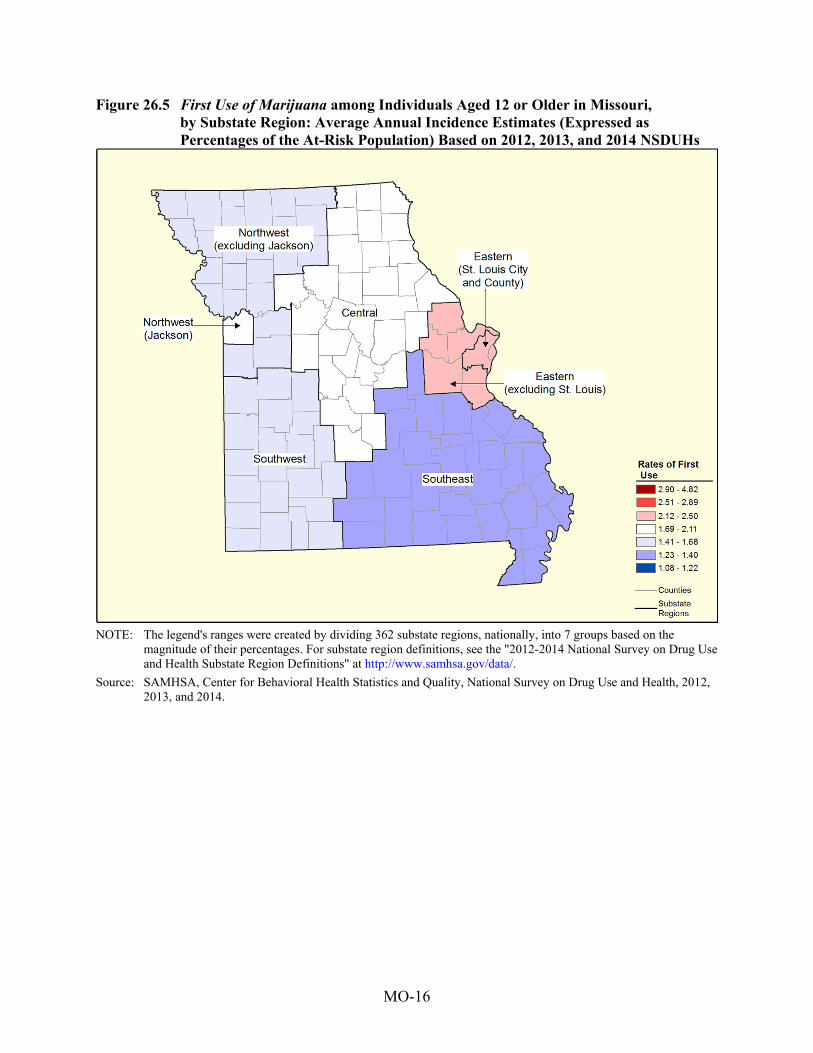
Figure 26.5 First Use of Marijuana among Individuals Aged 12 or Older in Missouri, by Substate Region: Average Annual Incidence Estimates (Expressed as Percentages of the At-Risk Population) Based on 2012, 2013, and 2014 NSDUHs
NOTE: The legend's ranges were created by dividing 362 substate regions, nationally, into 7 groups based on the
magnitude of their percentages. For substate region definitions, see the "2012-2014 National Survey on Drug Use and Health Substate Region Definitions" at http://www.samhsa.gov/data/.
Source: SAMHSA, Center for Behavioral Health Statistics and Quality, National Survey on Drug Use and Health, 2012, 2013, and 2014.
MO-17
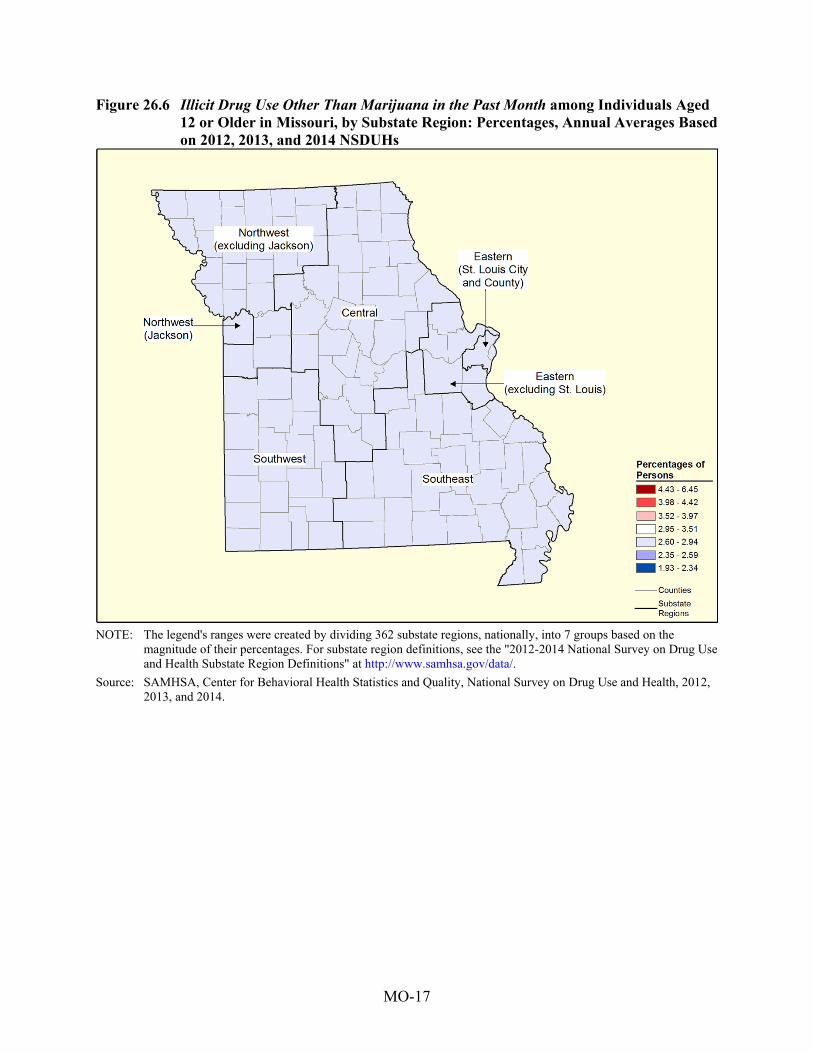
Figure 26.6 Illicit Drug Use Other Than Marijuana in the Past Month among Individuals Aged 12 or Older in Missouri, by Substate Region: Percentages, Annual Averages Based on 2012, 2013, and 2014 NSDUHs
NOTE: The legend's ranges were created by dividing 362 substate regions, nationally, into 7 groups based on the
magnitude of their percentages. For substate region definitions, see the "2012-2014 National Survey on Drug Use and Health Substate Region Definitions" at http://www.samhsa.gov/data/.
Source: SAMHSA, Center for Behavioral Health Statistics and Quality, National Survey on Drug Use and Health, 2012, 2013, and 2014.

MO-18
Figure 26.7 Cocaine Use in the Past Year among Individuals Aged 12 or Older in Missouri, by Substate Region: Percentages, Annual Averages Based on 2012, 2013, and 2014 NSDUHs
NOTE: The legend's ranges were created by dividing 362 substate regions, nationally, into 7 groups based on the
magnitude of their percentages. For substate region definitions, see the "2012-2014 National Survey on Drug Use and Health Substate Region Definitions" at http://www.samhsa.gov/data/.
Source: SAMHSA, Center for Behavioral Health Statistics and Quality, National Survey on Drug Use and Health, 2012, 2013, and 2014.
MO-19
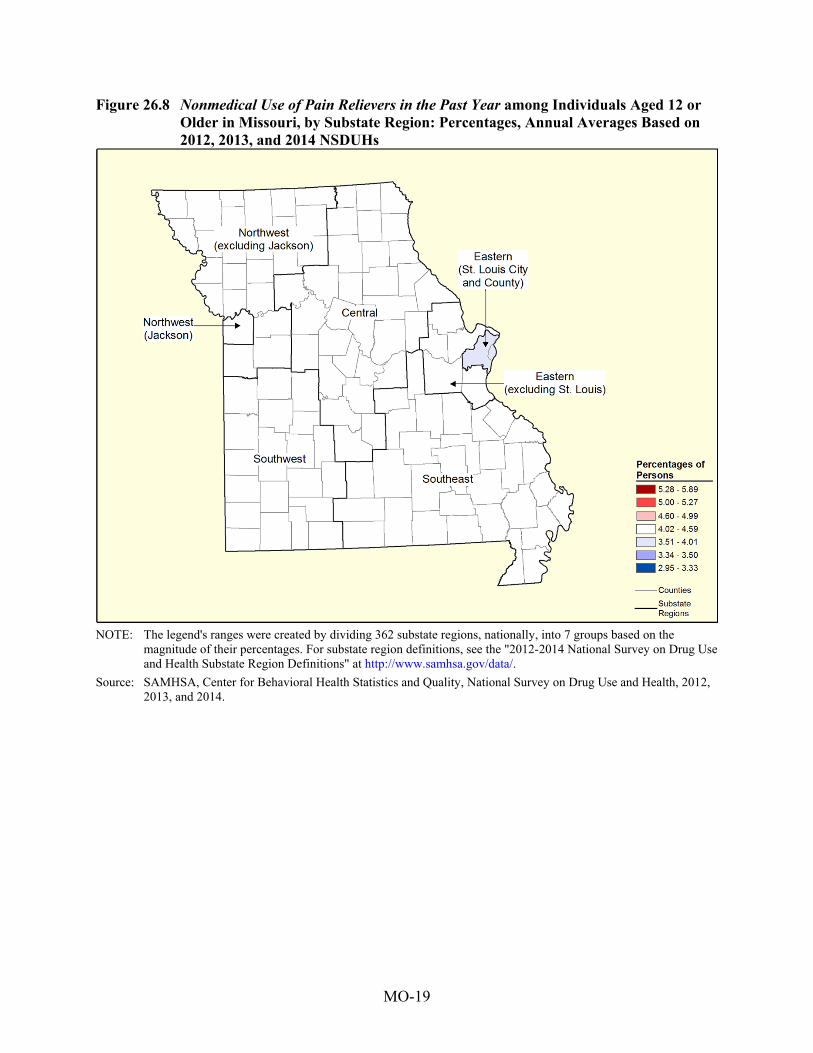
Figure 26.8 Nonmedical Use of Pain Relievers in the Past Year among Individuals Aged 12 or Older in Missouri, by Substate Region: Percentages, Annual Averages Based on 2012, 2013, and 2014 NSDUHs
NOTE: The legend's ranges were created by dividing 362 substate regions, nationally, into 7 groups based on the
magnitude of their percentages. For substate region definitions, see the "2012-2014 National Survey on Drug Use and Health Substate Region Definitions" at http://www.samhsa.gov/data/.
Source: SAMHSA, Center for Behavioral Health Statistics and Quality, National Survey on Drug Use and Health, 2012, 2013, and 2014.
MO-20
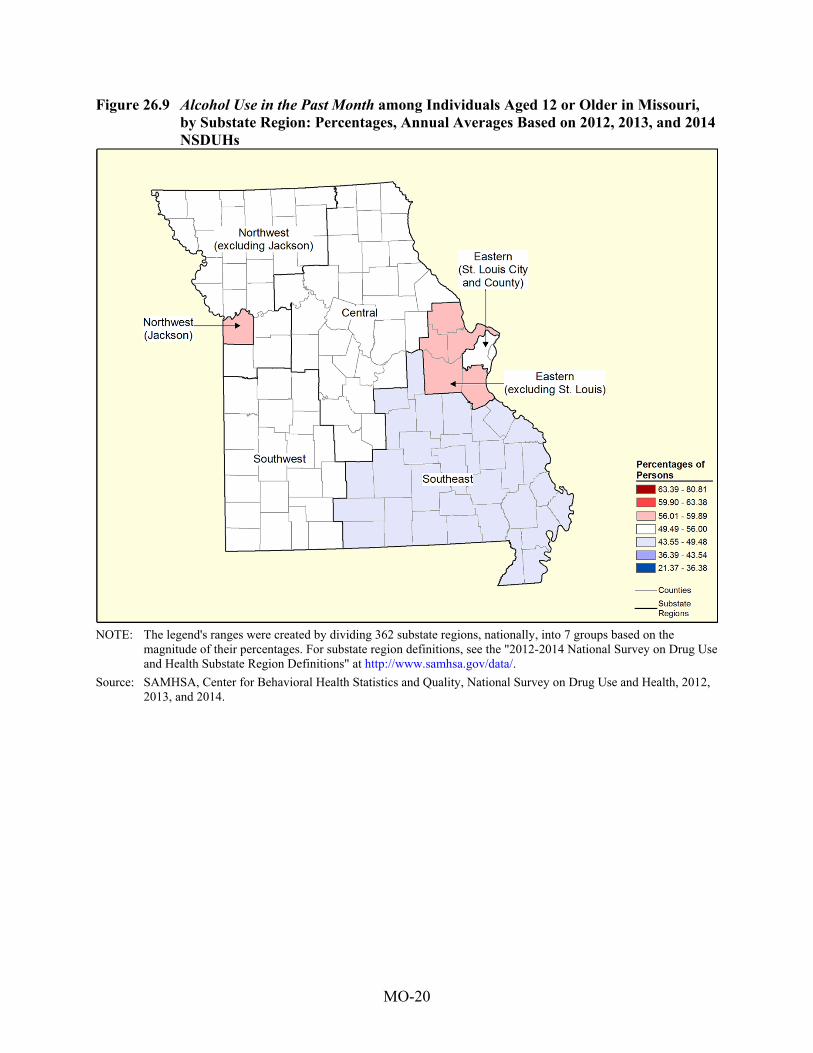
Figure 26.9 Alcohol Use in the Past Month among Individuals Aged 12 or Older in Missouri, by Substate Region: Percentages, Annual Averages Based on 2012, 2013, and 2014 NSDUHs
NOTE: The legend's ranges were created by dividing 362 substate regions, nationally, into 7 groups based on the
magnitude of their percentages. For substate region definitions, see the "2012-2014 National Survey on Drug Use and Health Substate Region Definitions" at http://www.samhsa.gov/data/.
Source: SAMHSA, Center for Behavioral Health Statistics and Quality, National Survey on Drug Use and Health, 2012, 2013, and 2014.
MO-21
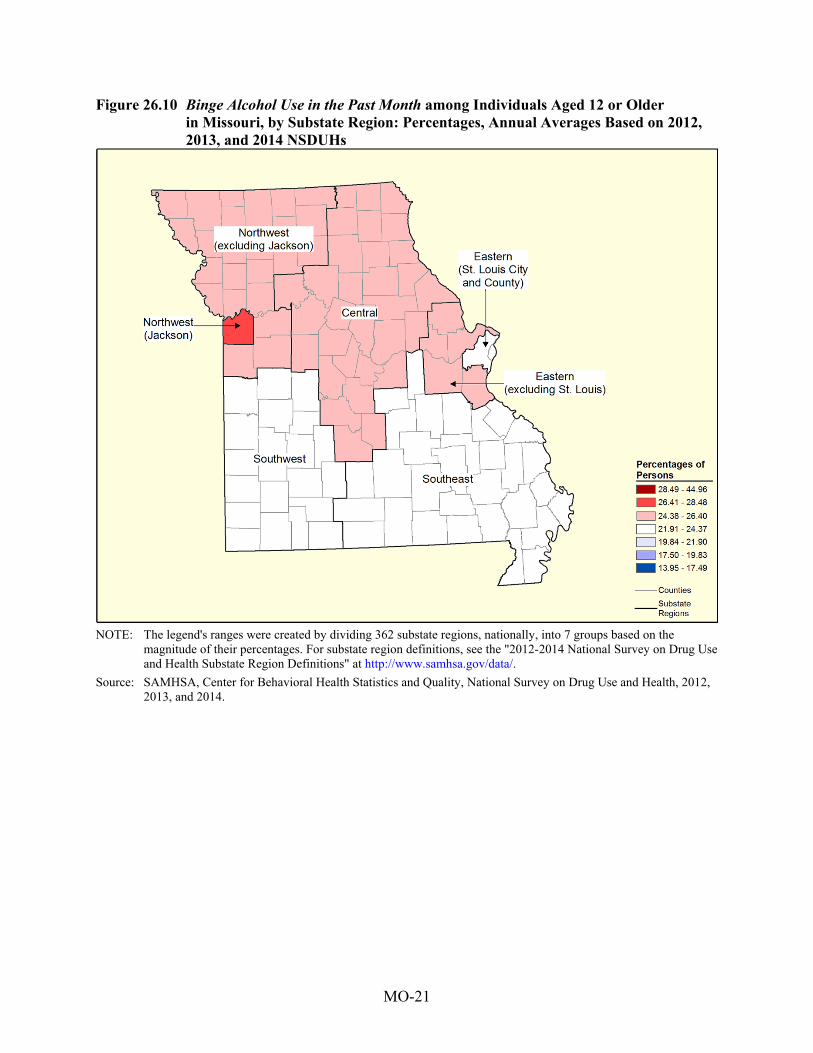
Figure 26.10 Binge Alcohol Use in the Past Month among Individuals Aged 12 or Older in Missouri, by Substate Region: Percentages, Annual Averages Based on 2012, 2013, and 2014 NSDUHs
NOTE: The legend's ranges were created by dividing 362 substate regions, nationally, into 7 groups based on the
magnitude of their percentages. For substate region definitions, see the "2012-2014 National Survey on Drug Use and Health Substate Region Definitions" at http://www.samhsa.gov/data/.
Source: SAMHSA, Center for Behavioral Health Statistics and Quality, National Survey on Drug Use and Health, 2012, 2013, and 2014.
MO-22
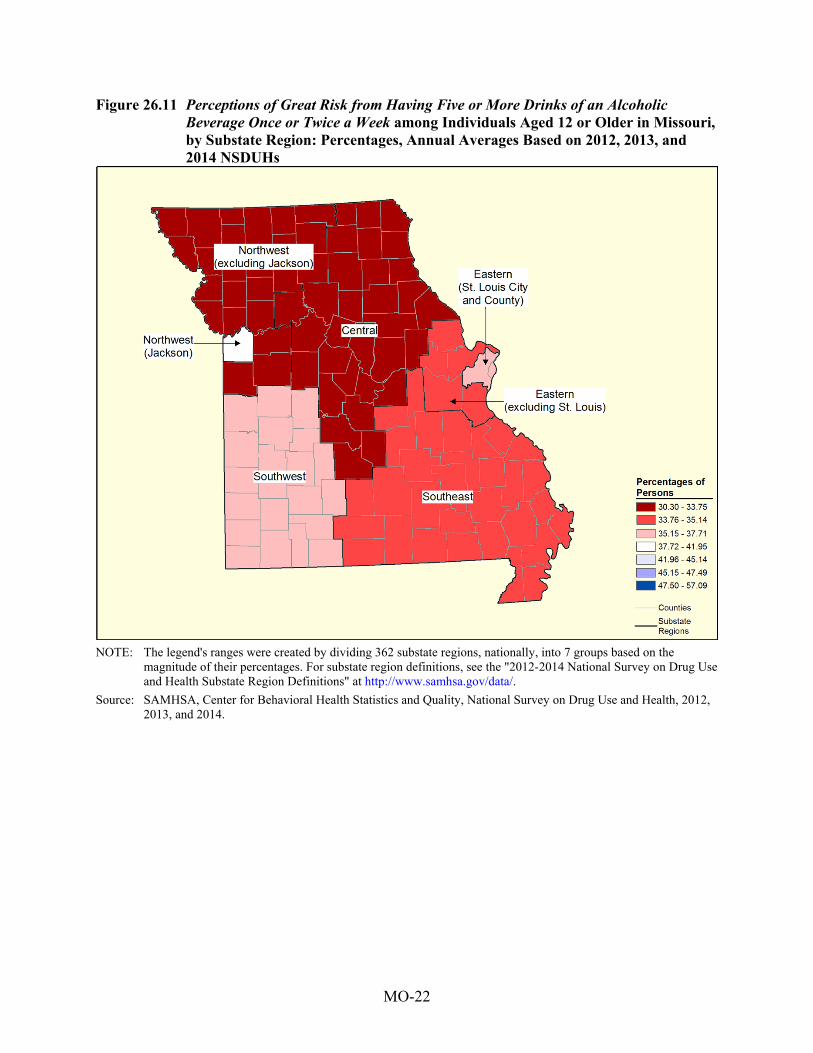
Figure 26.11 Perceptions of Great Risk from Having Five or More Drinks of an Alcoholic Beverage Once or Twice a Week among Individuals Aged 12 or Older in Missouri, by Substate Region: Percentages, Annual Averages Based on 2012, 2013, and 2014 NSDUHs
NOTE: The legend's ranges were created by dividing 362 substate regions, nationally, into 7 groups based on the
magnitude of their percentages. For substate region definitions, see the "2012-2014 National Survey on Drug Use and Health Substate Region Definitions" at http://www.samhsa.gov/data/.
Source: SAMHSA, Center for Behavioral Health Statistics and Quality, National Survey on Drug Use and Health, 2012, 2013, and 2014.
MO-23
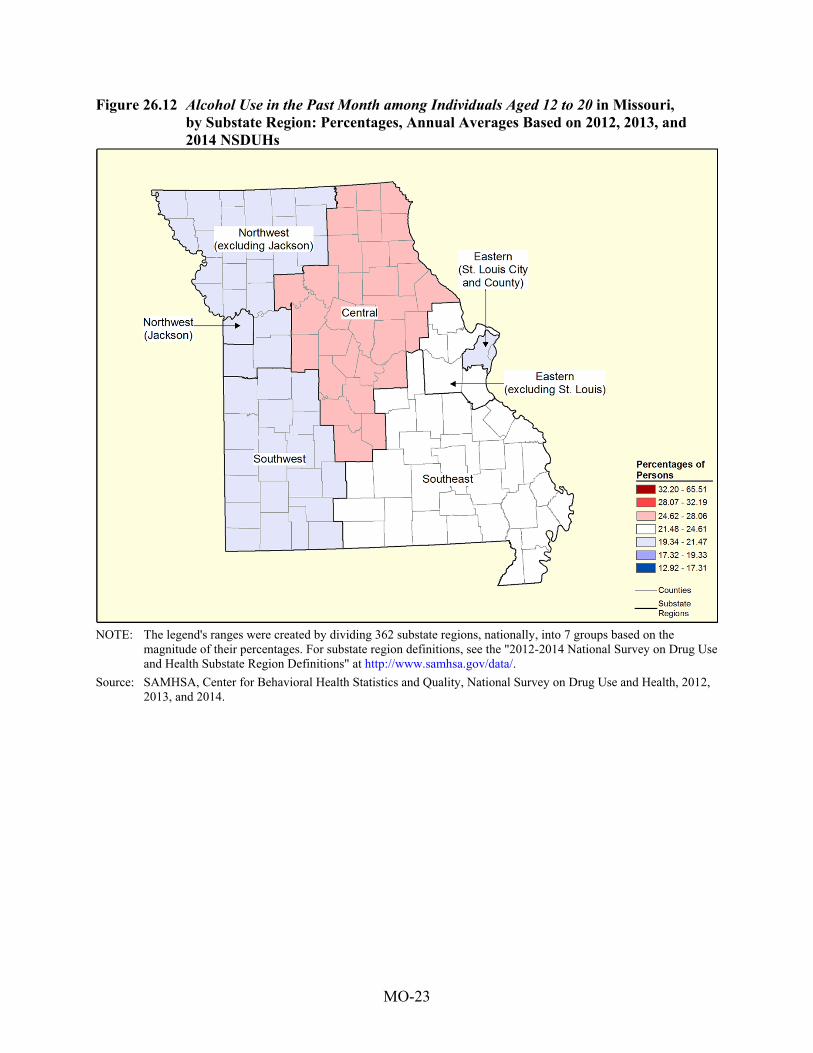
Figure 26.12 Alcohol Use in the Past Month among Individuals Aged 12 to 20 in Missouri, by Substate Region: Percentages, Annual Averages Based on 2012, 2013, and 2014 NSDUHs
NOTE: The legend's ranges were created by dividing 362 substate regions, nationally, into 7 groups based on the
magnitude of their percentages. For substate region definitions, see the "2012-2014 National Survey on Drug Use and Health Substate Region Definitions" at http://www.samhsa.gov/data/.
Source: SAMHSA, Center for Behavioral Health Statistics and Quality, National Survey on Drug Use and Health, 2012, 2013, and 2014.
MO-24
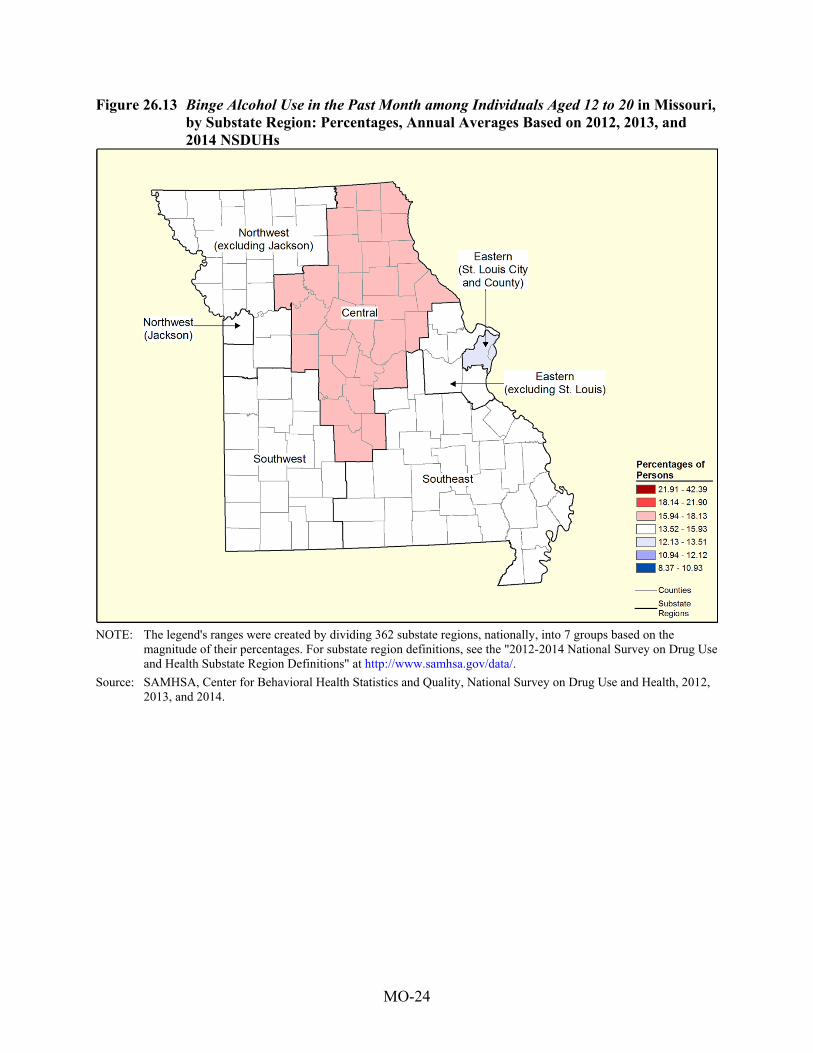
Figure 26.13 Binge Alcohol Use in the Past Month among Individuals Aged 12 to 20 in Missouri, by Substate Region: Percentages, Annual Averages Based on 2012, 2013, and 2014 NSDUHs
NOTE: The legend's ranges were created by dividing 362 substate regions, nationally, into 7 groups based on the
magnitude of their percentages. For substate region definitions, see the "2012-2014 National Survey on Drug Use and Health Substate Region Definitions" at http://www.samhsa.gov/data/.
Source: SAMHSA, Center for Behavioral Health Statistics and Quality, National Survey on Drug Use and Health, 2012, 2013, and 2014.
MO-25
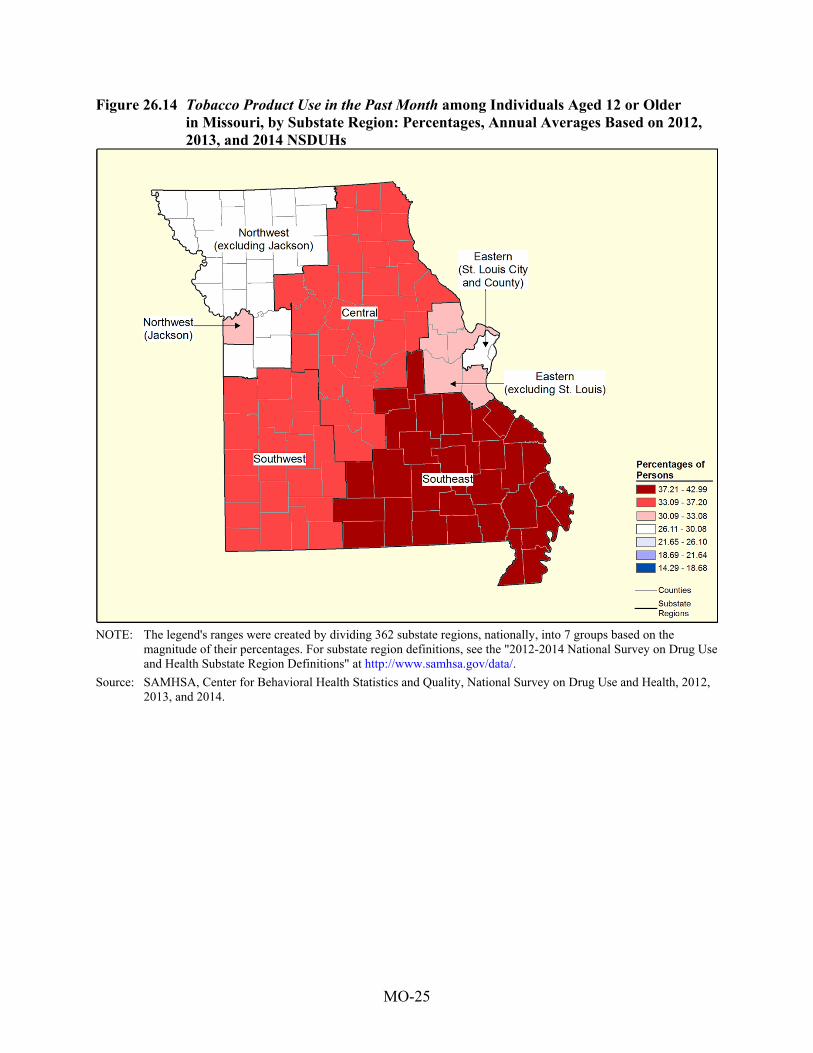
Figure 26.14 Tobacco Product Use in the Past Month among Individuals Aged 12 or Older in Missouri, by Substate Region: Percentages, Annual Averages Based on 2012, 2013, and 2014 NSDUHs
NOTE: The legend's ranges were created by dividing 362 substate regions, nationally, into 7 groups based on the
magnitude of their percentages. For substate region definitions, see the "2012-2014 National Survey on Drug Use and Health Substate Region Definitions" at http://www.samhsa.gov/data/.
Source: SAMHSA, Center for Behavioral Health Statistics and Quality, National Survey on Drug Use and Health, 2012, 2013, and 2014.

MO-26
Figure 26.15 Cigarette Use in the Past Month among Individuals Aged 12 or Older in Missouri, by Substate Region: Percentages, Annual Averages Based on 2012, 2013, and 2014 NSDUHs
NOTE: The legend's ranges were created by dividing 362 substate regions, nationally, into 7 groups based on the
magnitude of their percentages. For substate region definitions, see the "2012-2014 National Survey on Drug Use and Health Substate Region Definitions" at http://www.samhsa.gov/data/.
Source: SAMHSA, Center for Behavioral Health Statistics and Quality, National Survey on Drug Use and Health, 2012, 2013, and 2014.
MO-27
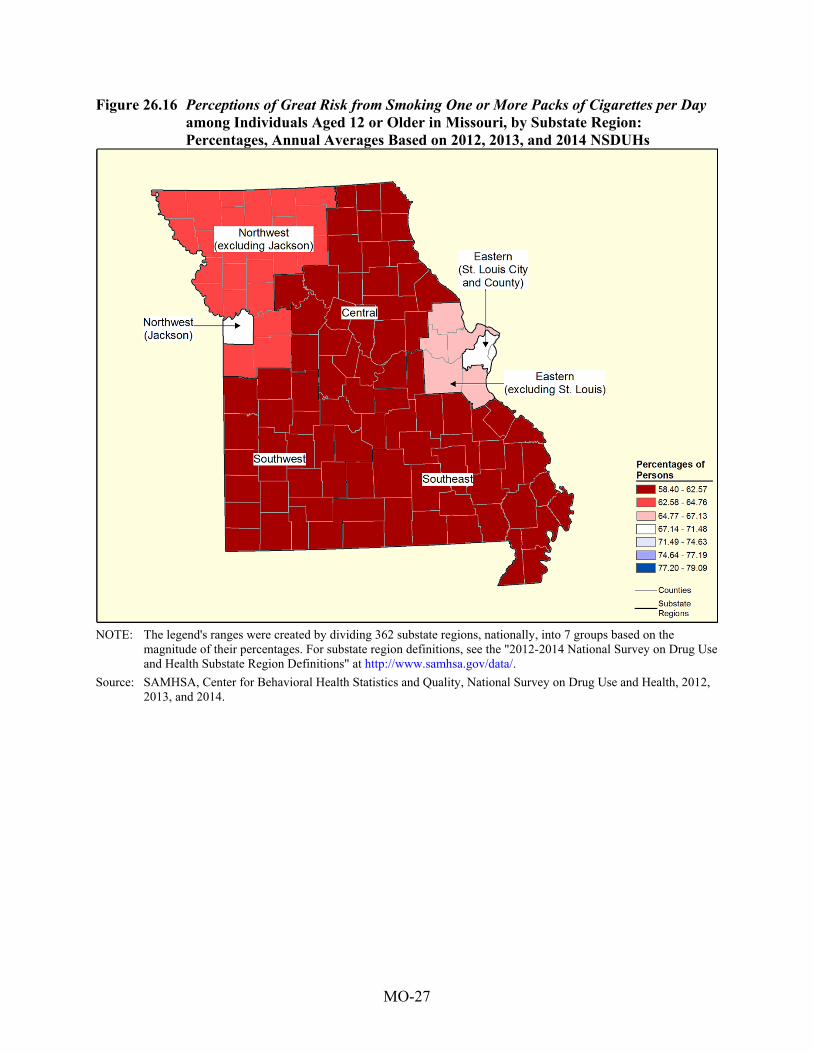
Figure 26.16 Perceptions of Great Risk from Smoking One or More Packs of Cigarettes per Day among Individuals Aged 12 or Older in Missouri, by Substate Region: Percentages, Annual Averages Based on 2012, 2013, and 2014 NSDUHs
NOTE: The legend's ranges were created by dividing 362 substate regions, nationally, into 7 groups based on the
magnitude of their percentages. For substate region definitions, see the "2012-2014 National Survey on Drug Use and Health Substate Region Definitions" at http://www.samhsa.gov/data/.
Source: SAMHSA, Center for Behavioral Health Statistics and Quality, National Survey on Drug Use and Health, 2012, 2013, and 2014.
MO-28
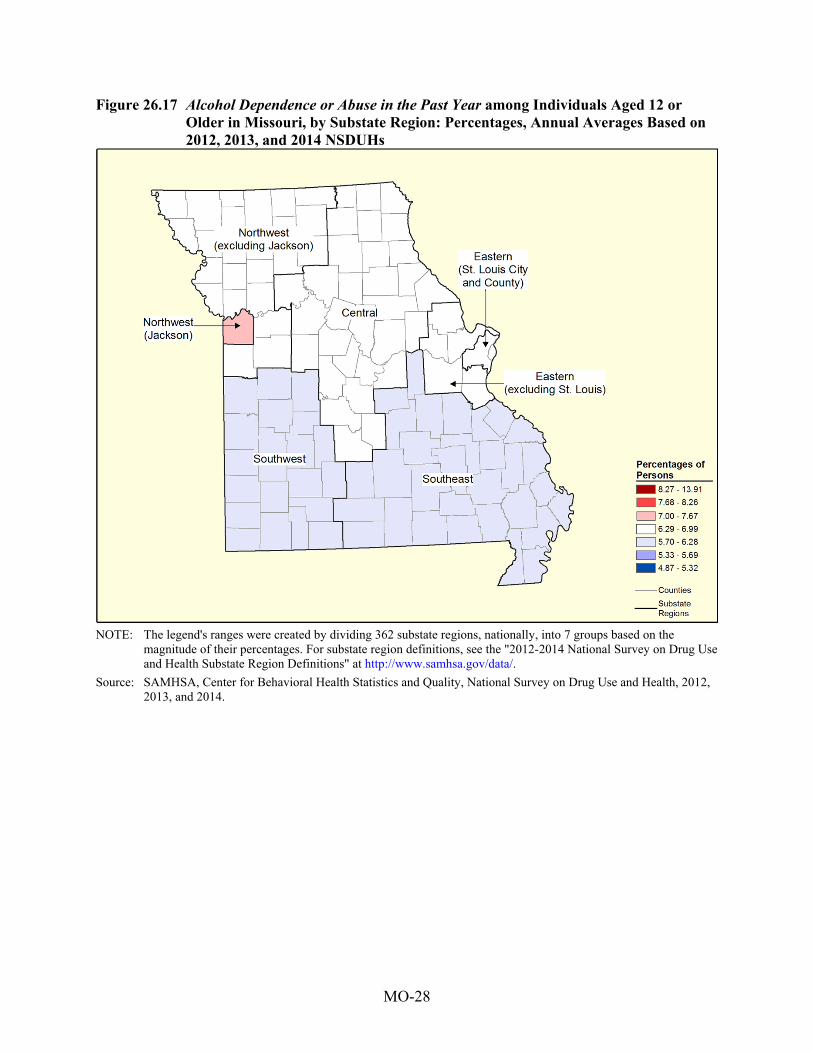
Figure 26.17 Alcohol Dependence or Abuse in the Past Year among Individuals Aged 12 or Older in Missouri, by Substate Region: Percentages, Annual Averages Based on 2012, 2013, and 2014 NSDUHs
NOTE: The legend's ranges were created by dividing 362 substate regions, nationally, into 7 groups based on the
magnitude of their percentages. For substate region definitions, see the "2012-2014 National Survey on Drug Use and Health Substate Region Definitions" at http://www.samhsa.gov/data/.
Source: SAMHSA, Center for Behavioral Health Statistics and Quality, National Survey on Drug Use and Health, 2012, 2013, and 2014.
MO-29
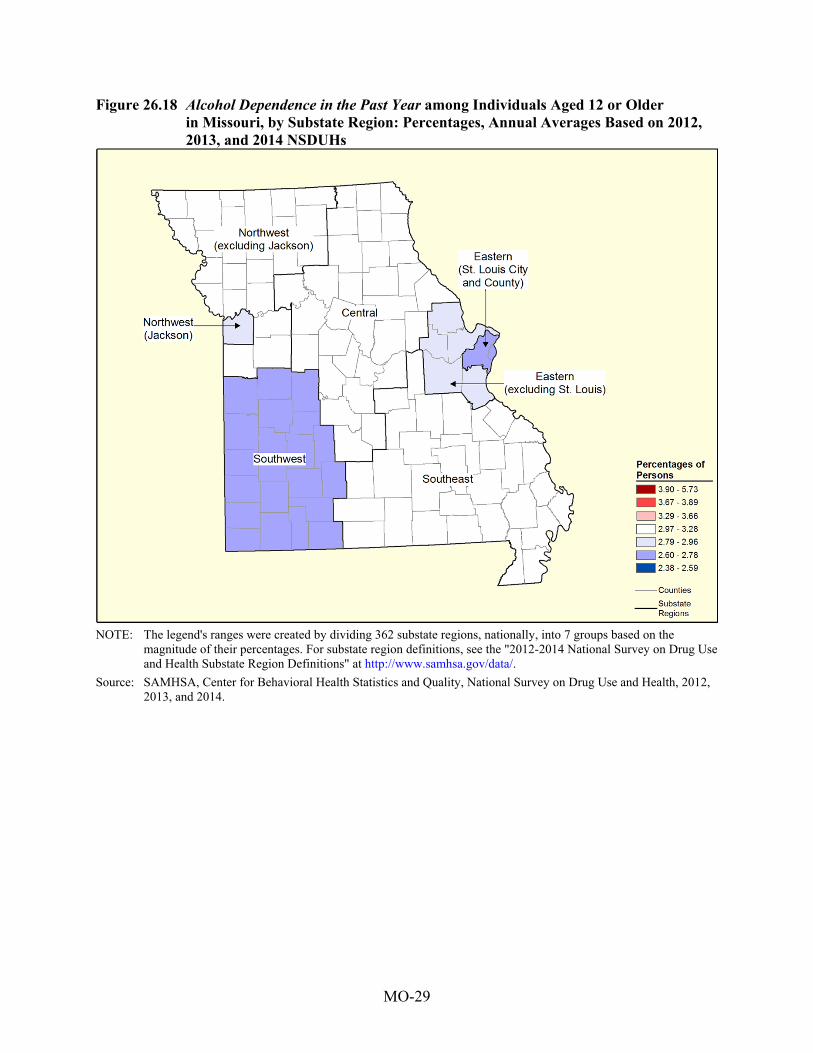
Figure 26.18 Alcohol Dependence in the Past Year among Individuals Aged 12 or Older in Missouri, by Substate Region: Percentages, Annual Averages Based on 2012, 2013, and 2014 NSDUHs
NOTE: The legend's ranges were created by dividing 362 substate regions, nationally, into 7 groups based on the
magnitude of their percentages. For substate region definitions, see the "2012-2014 National Survey on Drug Use and Health Substate Region Definitions" at http://www.samhsa.gov/data/.
Source: SAMHSA, Center for Behavioral Health Statistics and Quality, National Survey on Drug Use and Health, 2012, 2013, and 2014.
MO-30
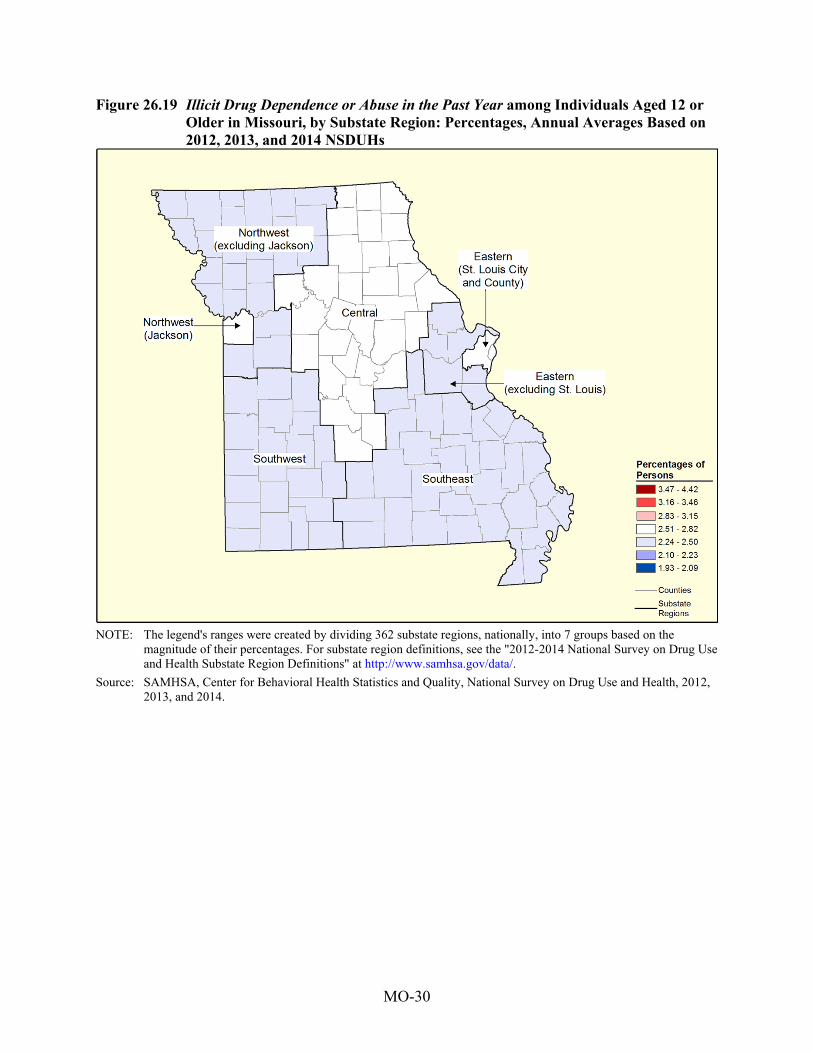
Figure 26.19 Illicit Drug Dependence or Abuse in the Past Year among Individuals Aged 12 or Older in Missouri, by Substate Region: Percentages, Annual Averages Based on 2012, 2013, and 2014 NSDUHs
NOTE: The legend's ranges were created by dividing 362 substate regions, nationally, into 7 groups based on the
magnitude of their percentages. For substate region definitions, see the "2012-2014 National Survey on Drug Use and Health Substate Region Definitions" at http://www.samhsa.gov/data/.
Source: SAMHSA, Center for Behavioral Health Statistics and Quality, National Survey on Drug Use and Health, 2012, 2013, and 2014.

MO-31
Figure 26.20 Illicit Drug Dependence in the Past Year among Individuals Aged 12 or Older in Missouri, by Substate Region: Percentages, Annual Averages Based on 2012, 2013, and 2014 NSDUHs
NOTE: The legend's ranges were created by dividing 362 substate regions, nationally, into 7 groups based on the
magnitude of their percentages. For substate region definitions, see the "2012-2014 National Survey on Drug Use and Health Substate Region Definitions" at http://www.samhsa.gov/data/.
Source: SAMHSA, Center for Behavioral Health Statistics and Quality, National Survey on Drug Use and Health, 2012, 2013, and 2014.
MO-32
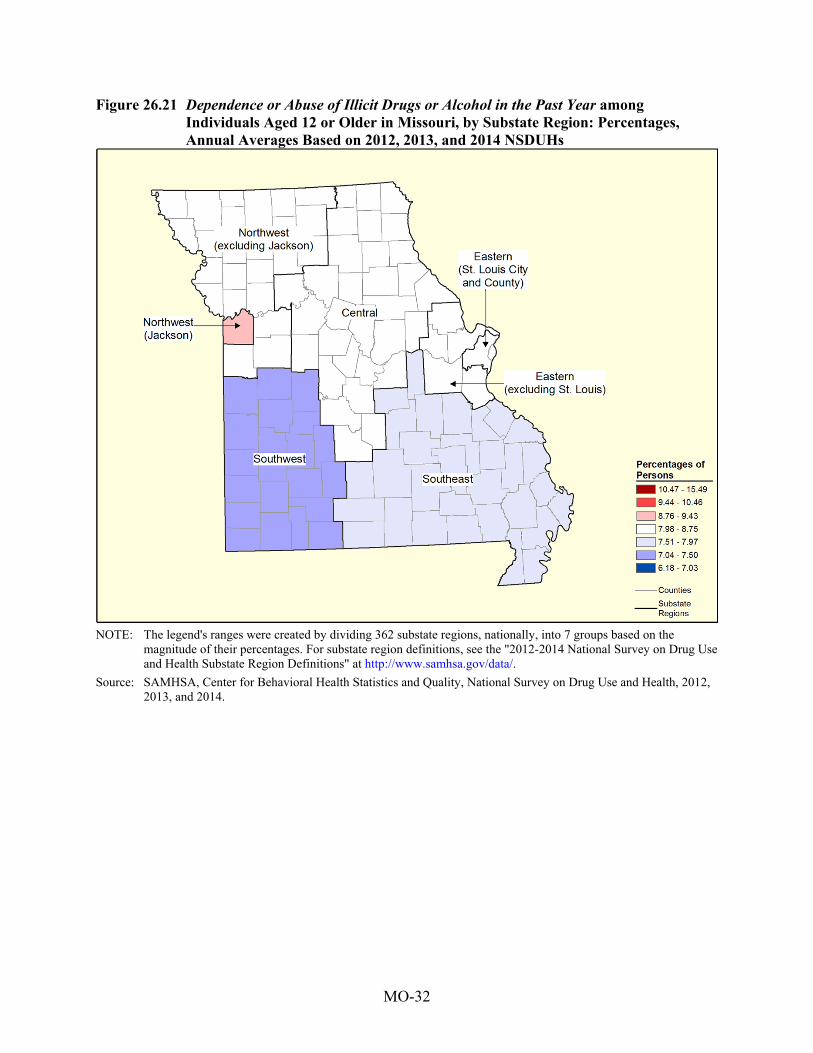
Figure 26.21 Dependence or Abuse of Illicit Drugs or Alcohol in the Past Year among Individuals Aged 12 or Older in Missouri, by Substate Region: Percentages, Annual Averages Based on 2012, 2013, and 2014 NSDUHs
NOTE: The legend's ranges were created by dividing 362 substate regions, nationally, into 7 groups based on the
magnitude of their percentages. For substate region definitions, see the "2012-2014 National Survey on Drug Use and Health Substate Region Definitions" at http://www.samhsa.gov/data/.
Source: SAMHSA, Center for Behavioral Health Statistics and Quality, National Survey on Drug Use and Health, 2012, 2013, and 2014.
MO-33
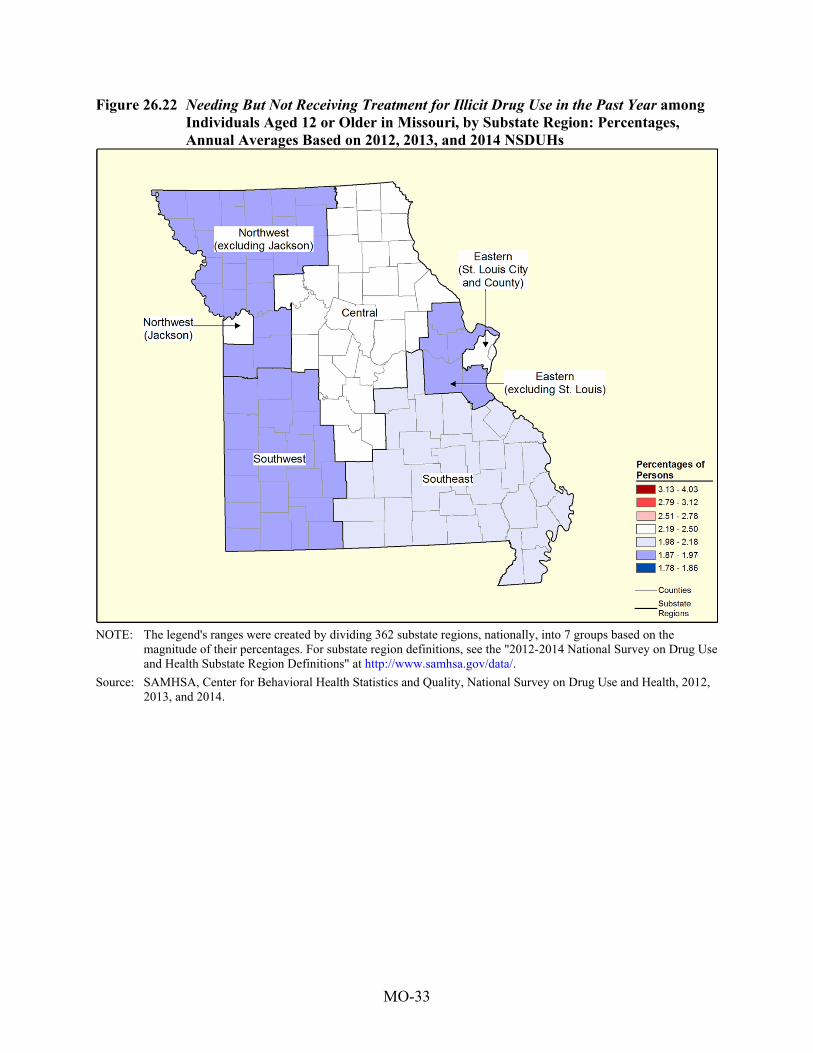
Figure 26.22 Needing But Not Receiving Treatment for Illicit Drug Use in the Past Year among Individuals Aged 12 or Older in Missouri, by Substate Region: Percentages, Annual Averages Based on 2012, 2013, and 2014 NSDUHs
NOTE: The legend's ranges were created by dividing 362 substate regions, nationally, into 7 groups based on the
magnitude of their percentages. For substate region definitions, see the "2012-2014 National Survey on Drug Use and Health Substate Region Definitions" at http://www.samhsa.gov/data/.
Source: SAMHSA, Center for Behavioral Health Statistics and Quality, National Survey on Drug Use and Health, 2012, 2013, and 2014.
MO-34
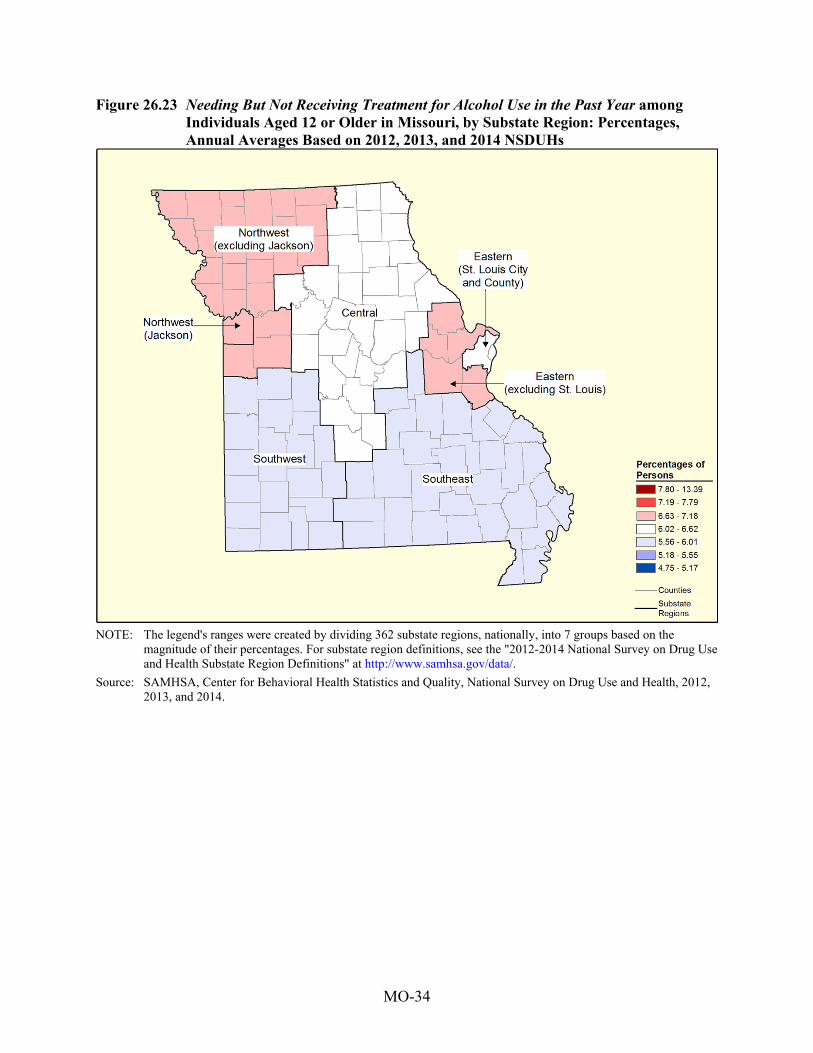
Figure 26.23 Needing But Not Receiving Treatment for Alcohol Use in the Past Year among Individuals Aged 12 or Older in Missouri, by Substate Region: Percentages, Annual Averages Based on 2012, 2013, and 2014 NSDUHs
NOTE: The legend's ranges were created by dividing 362 substate regions, nationally, into 7 groups based on the
magnitude of their percentages. For substate region definitions, see the "2012-2014 National Survey on Drug Use and Health Substate Region Definitions" at http://www.samhsa.gov/data/.
Source: SAMHSA, Center for Behavioral Health Statistics and Quality, National Survey on Drug Use and Health, 2012, 2013, and 2014.
MO-35
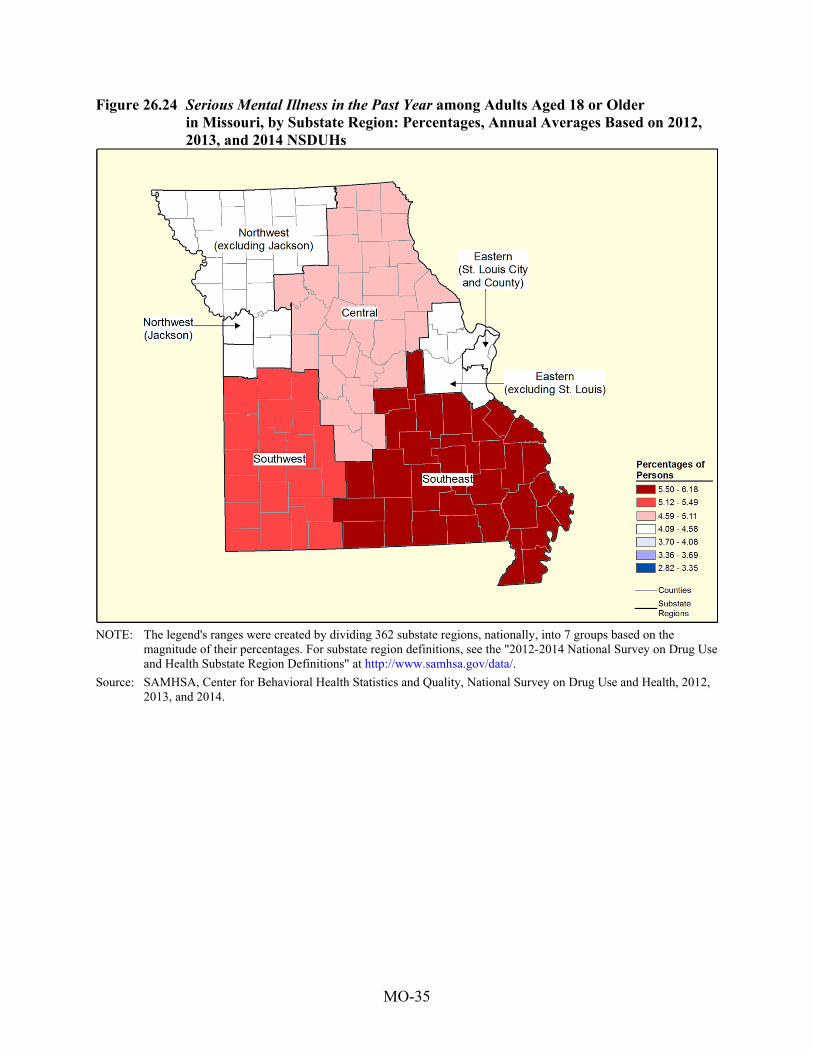
Figure 26.24 Serious Mental Illness in the Past Year among Adults Aged 18 or Older in Missouri, by Substate Region: Percentages, Annual Averages Based on 2012, 2013, and 2014 NSDUHs
NOTE: The legend's ranges were created by dividing 362 substate regions, nationally, into 7 groups based on the
magnitude of their percentages. For substate region definitions, see the "2012-2014 National Survey on Drug Use and Health Substate Region Definitions" at http://www.samhsa.gov/data/.
Source: SAMHSA, Center for Behavioral Health Statistics and Quality, National Survey on Drug Use and Health, 2012, 2013, and 2014.

MO-36
Figure 26.25 Any Mental Illness in the Past Year among Adults Aged 18 or Older in Missouri, by Substate Region: Percentages, Annual Averages Based on 2012, 2013, and 2014 NSDUHs
NOTE: The legend's ranges were created by dividing 362 substate regions, nationally, into 7 groups based on the
magnitude of their percentages. For substate region definitions, see the "2012-2014 National Survey on Drug Use and Health Substate Region Definitions" at http://www.samhsa.gov/data/.
Source: SAMHSA, Center for Behavioral Health Statistics and Quality, National Survey on Drug Use and Health, 2012, 2013, and 2014.
MO-37
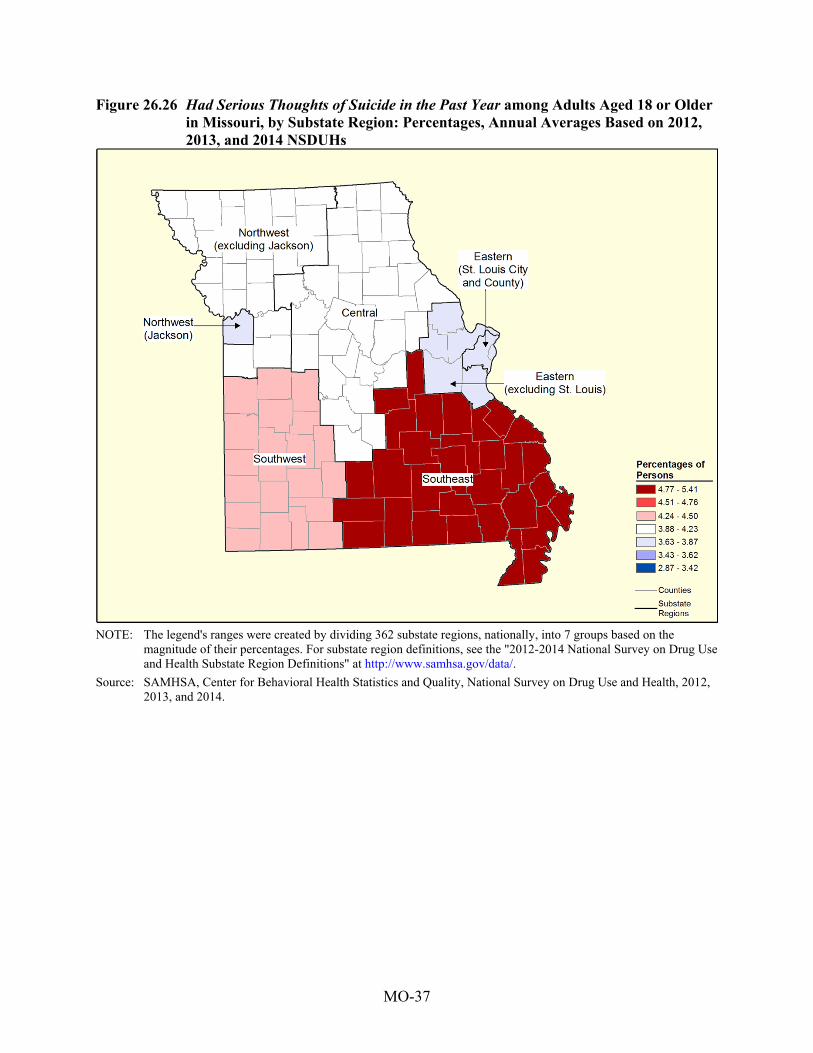
Figure 26.26 Had Serious Thoughts of Suicide in the Past Year among Adults Aged 18 or Older in Missouri, by Substate Region: Percentages, Annual Averages Based on 2012, 2013, and 2014 NSDUHs
NOTE: The legend's ranges were created by dividing 362 substate regions, nationally, into 7 groups based on the
magnitude of their percentages. For substate region definitions, see the "2012-2014 National Survey on Drug Use and Health Substate Region Definitions" at http://www.samhsa.gov/data/.
Source: SAMHSA, Center for Behavioral Health Statistics and Quality, National Survey on Drug Use and Health, 2012, 2013, and 2014.
MO-38
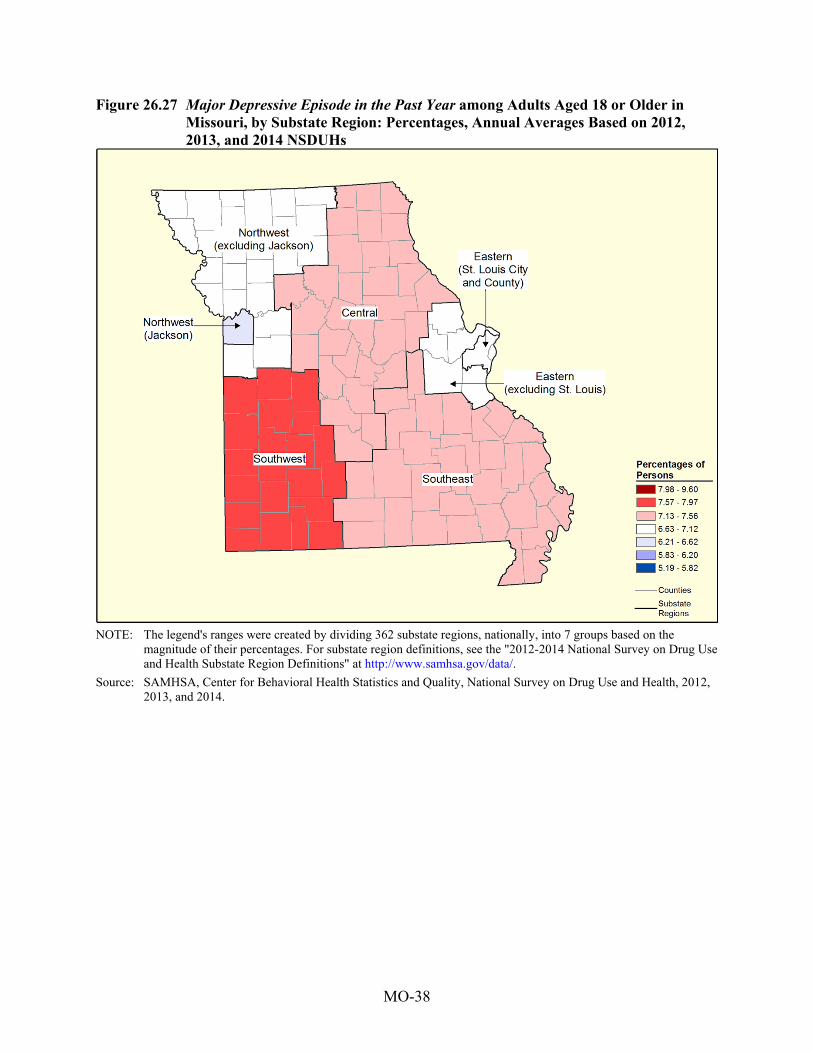
Figure 26.27 Major Depressive Episode in the Past Year among Adults Aged 18 or Older in Missouri, by Substate Region: Percentages, Annual Averages Based on 2012, 2013, and 2014 NSDUHs
NOTE: The legend's ranges were created by dividing 362 substate regions, nationally, into 7 groups based on the
magnitude of their percentages. For substate region definitions, see the "2012-2014 National Survey on Drug Use and Health Substate Region Definitions" at http://www.samhsa.gov/data/.
Source: SAMHSA, Center for Behavioral Health Statistics and Quality, National Survey on Drug Use and Health, 2012, 2013, and 2014.