table 41: walnut total and bearing trees in numbers
TRANSCRIPT

1

2
Foreword .................................................................................................................................................................... 1 Introduction ..................................................................................................................................................... 4 2 Objectives ....................................................................................................................................................... 4 3 Organization of the Survey .............................................................................................................................. 4 4 Survey Methodology........................................................................................................................................ 5
Sampling design ........................................................................................................................................... 5 Sampling Units and Sampling Frames ......................................................................................................... 5 Sampling Procedures.................................................................................................................................... 5
5 Field Operation ............................................................................................................................................... 5 6 Method of data collection ................................................................................................................................. 6 7 Time reference ................................................................................................................................................ 6 8 Data processing, entry, analysis and publication. ............................................................................................. 6 9 Survey coverage and response rates. .............................................................................................................. 6 10 Major constraints in Agriculture data ........................................................................................................... 7
Table 1: Percent of rural household normal walking distance from nearest motor – road ......................... 8 Table 2: Total household members’ age wise (Nos) living and working on the farm and stayed more than 6 months regardless of the relationship in 2009. ......................................................................................... 9 Table 3: Paddy harvested area (acres), Production in (MT) and Yield (Kg/acre) ....................................... 10 Table 3: Paddy harvested area (acres), Production in (MT) and Yield (Kg/acre) ....................................... 10 Table 4: Maize harvested area (acres), Production in (MT) and Yield (Kg/acre) ........................................ 11 Table 5: Wheat harvested area (acres), Production in (MT) and Yield (Kg/acre) ....................................... 12 Table 6: Barley harvested area (acres), Production in (MT) and Yield (Kg/acre) ....................................... 13 Table 7: Finger Millet harvested area (acres), Production in (MT) and Yield (Kg/acre)............................. 14 Table 9: Sweet buckwheat harvested area (acres), Production in (MT) and Yield (Kg/acre) ..................... 15 Table 10: Bitter Buckwheat harvested area (acres), Production in (MT) and Yield (Kg/acre) .................... 16 Table 11: Bean Harvested area (acres), Production (MT) and yield (Kg/acre) ........................................... 17 Table 12: Rajma Bean Harvested area (acres), Production (MT) and yield (Kg/acre) ................................ 18 Table 13: Mung Bean Harvested area (acres), Production (MT) and yield (Kg/acre) ................................. 19 Table 14: Other Pulses Harvested area (acres), Production (MT) and yield (Kg/acre)............................... 19 Table 15: Mustard Harvested area (acres), Production (MT) and yield (Kg/acre) ...................................... 20 Table 16: Soya bean Harvested area (acres), Production (MT) and yield (Kg/acre)................................... 21 Table 17: Peas Harvested area (acres), Production (MT) and yield (Kg/acre) ............................................ 22 Table 18: Garlic Harvested area (acres), Production (MT) and yield (Kg/acre) .......................................... 23 Table19: Ginger Harvested area (acres), Production (MT) and yield (Kg/acre) .......................................... 24 Table 20: Cardamom Harvested area (acres), Production (MT) and yield (Kg/acre) .................................. 24 Table 21: Asparagus Harvested area (acres), Production (MT) and yield (Kg/acre) .................................. 25 Table 22: Chili Harvested area (acres), Production (MT) and yield (Kg/acre) ............................................ 26 Table 23: Cabbage Harvested area (acres), Production (MT) and yield (Kg/acre) ..................................... 27 Table 24: Cauliflower Harvested area (acres), Production (MT) and yield (Kg/acre) ................................. 28 Table 25: Carrot Harvested area (acres), Production (MT) and yield (Kg/acre) ......................................... 29 Table 26: Radish Harvested area (acres), Production (MT) and yield (Kg/acre) ........................................ 30 Table 27: Turnip Harvested area (acres), Production (MT) and yield (Kg/acre) ......................................... 31 Table 28: Tomato Harvested area (acres), Production (MT) and yield (Kg/acre) ....................................... 32 Table 29: Potato Harvested area (acres), Production (MT) and yield (Kg/acre) ......................................... 33 Table 30: Green leaves Harvested area (acres), Production (MT) and yield (Kg/acre) .............................. 34 Table 31: Onion Bulb Harvested area (acres), Production (MT) and yield (Kg/acre) ................................. 35 Table 32: Egg Plant Harvested area (acres), Production (MT) and yield (Kg/acre) .................................... 35 Table 33: Broccoli Harvested area (acres), Production (MT) and yield (Kg/acre) ...................................... 36 Table 34: Other vegetables and crops Production (MT) ............................................................................. 36 Table 35: Apple total and bearing trees in numbers, production in MT and yield (kg/tree) ....................... 37 Table 36: Mandarin total and bearing trees in numbers, production in MT and yield (kg/tree) ................. 38 Table 37: Mango total and bearing trees in numbers, production in MT and yield (kg/tree) ..................... 39 Table 38: Pear total and bearing trees in numbers, production in MT and yield (kg/tree) ......................... 40 Table 39: Peach total and bearing trees in numbers, production in MT and yield (kg/tree) ...................... 41 Table 40: Plum total and bearing trees in numbers, production in MT and yield (kg/tree) ........................ 42
3
Table 41: Walnut total and bearing trees in numbers, production in MT and yield (kg/tree) ..................... 43 Table 42: Areca nut total and bearing trees in numbers, production in MT and yield (kg/tree) ................ 43 Table 43: Guava total and bearing trees in numbers, production in MT and yield (kg/tree) ...................... 44 Table 44: Persimmon total and bearing trees in numbers, production in MT and yield (kg/tree).............. 45 Table 45: Banana total and bearing trees in numbers, production in MT and yield (kg/tree) .................... 46 Table 46: Passion fruit total and bearing trees in numbers, production in MT and yield (kg/tree) ........... 47 Table 47: Percentage of food grain produced enough for household consumption in 2009 .................... 48 Table 47.1 The percent of food grain shortages month wise in 2009 ........................................................ 48 Table 47.2: The most important coping mechanisms in 2009 .................................................................... 49 Table 47.2 : The most important coping mechanisms in 2009 ................................................................... 50 Table 48: The Agriculture commodities exported year wise ...................................................................... 50 Table 49: Plant Protection chemicals supplied to Dzongkhags in Kg/Litres (2008-2009) ......................... 51 Table 49.1 : Plant Protection chemicals supplied to Dzongkhags in Kg/Litres (2008-2009) ...................... 52 Table 50: Quantity of chemical fertilizers distributed to the Dzongkhags during the year 2009 ............... 53 Table 51: RNR infrastructure inventories as of December 2009 ................................................................ 54
4
1 Introduction
The annual agriculture sample survey was initiated since 2004. Since then the annual publication endeavors to presents comprehensive information on area, production and yield of principle crops viz: food-grains, oil seeds, pulses and spices, and horticultural crops. The publication comprises of two Volumes, Volume I and Volume II. Volume I represents aggregated information at the Dzongkhag and Volume II at the geog level. Further, the publications also include administrative and secondary data from agencies. Unlike in the past this year we have included the food self sufficiency and coping mechanisms as reported by the respondents in 2009. During the survey period, the production of cereals Maize and others crops recorded low compared to past years. This is mainly attributed to crops destroyed by wind storm and others factors. 2 Objectives
The objectives of the survey are:
• To establish reliable information on crop production and land use for planning and monitoring of agriculture development programmes.
• The immediate objective is to generate data needed for preparation of the plans, programs and to assess the achievements.
• Prepare time series data of Land use and agriculture production trend. • Provide baseline data for monitoring of millennium development goals
(MDGs) particularly poverty and food security situations
3 Organization of the Survey
The survey focussed on the rural farming household. Information Management Section under Department of Agriculture took lead in the conceptualization, preparing of questionnaires and co-ordinating the sample survey. All attempts have been made to cover 205 geogs however, due to unavoidable circumstances the annual survey for Shaba geog in Paro Dzongkhag was missing or reported as non responses by extension agent. The extension staff collected the data by using the set of questionnaire from December 2009 to February 2010. The questionnaires contain information on Land use status, Area and production of Cereals, Oilseeds and spices, Pulses, Tree crops, Vegetables, Accessibility and Food self sufficiency and coping mechanisms.

5
4 Survey Methodology
Sampling design The survey adopted Linear Systematic Sampling to select the rural farming households. It consists of drawing the sample, unit by unit, giving equal probability of selection to every unit in the population at each draw. The 10 and 30 percent sample was applied to all the Geogs irrespective of the sizes and economic activities undertaken. Sampling Units and Sampling Frames All the 205 Geogs in the country served as the domain for the sample survey. All the Geogs were included in the sample survey in order to cover different ecological resources endowment, and development stages. A household is the lowest sampling unit. The household lists for each Geog served as the sample frame from which a 10 - 30 percent sample was chosen for interview. The survey adopted Linear Systematic Sampling to select the sample households. The 10 – 30 percent sample was applied depending on the total numbers of the rural households in the geogs. As per the recommendation of the National Statistics Bureau we have applied 10 percent sample that has more than 300 households and 30 percent for less than 300 households respectively. This is to get better estimates and minimize standard errors. Sampling Procedures The IMS, DoA in consultation with the DAOs and extension agents selected the sample households during the survey briefing. The household samples were drawn by applying Linear Systematic Sampling from household lists maintained and updated annually by the extension agents. This selected sample list was distributed to the enumerators for identification and interview. 5 Field Operation
The source of data actually begins from the enumeration; a mistake committed at the enumeration stage is a mistake that will have a greatest impact on the quality of the final data. In order to bring down the field enumeration errors to as minimum level as possible, day long briefing to Agriculture extension staff, Astt. DAO, DAO were conducted in their respective Dzongkhags to eradicate on the following topics to avoid data collection problems and discrepancies at the time of compilation.
• The purpose and objective of the annual survey • The structure of the questionnaire and the logic behind.
6
• Familiarize with the concepts and terms used in the questionnaire. • Questioning very clearly without changing its original meaning. • To have patience and tolerance with respondents. • To perform the duties with honesty, diligence and sincerity. • To carry out the interview as planned and instructed by the supervisors or the
coordinators. • To submit the completed questionnaires to the supervisors for necessary checking
6 Method of data collection
The geog Agriculture extension agent conducted enumeration by visiting individual households and interviewed by administering a set of structured questionnaire. Generally, the respondents shall be the head of the household or someone in the family who knows about the farming activities of the household. The monitoring was done by ADAO and DAO during the survey and the validation of questionnaires after submission of questionnaires to Dzongkhag office. The data inconsistencies observed were removed during the validation processes. 7 Time reference
The annual agriculture survey 2009 has captured all agricultural areas and productions between January 2009 and December 2009. The enumeration period was from December 2009 to February 2010. 8 Data processing, entry, analysis and publication.
All the 20 Dzongkhags ADAO/ Dzongkhag Extension Officer were called to Paro with survey questionnaires for data entry in March 2010. The data entry was done in CSPro database and analyze and tabulation in SPSS. However, due to time constraints they could not analysis the Meta data. This was done by IMS, DoA in consultation with National Statistics Bureau. All efforts were made to verify and validate the data and analysis before publication with dzongkhags Agriculture authorities, Departments and NSB.
9 Survey coverage and response rates.
The survey covered 10,434 rural agriculture farming households out of 10,689 sampled households. The non responses were 2.5 percent in 2009 excluding Shaba geog in Paro Dzongkhag. We have applied the appropriate weights as per the sample selection scheme. The estimated total rural agriculture households for 2009 were 67,177.
7
10 Major constraints in Agriculture data
One of the major problems related to agriculture statistics is that the information provided by the farmer is based on their memory, as there is no tradition of keeping farm records. Furthermore, some farmers may be reluctant to provide correct information on e.g. land holdings and cash crop production due to fear of taxation. Another key constraint is the fact that many farmers still use local measurement units that differ from place to place. Instead of reporting in Kg and Acre they may report in langdo, bags, baskets, etc. As a result, it not only poses difficulties in compilation but also affects the quality of data in terms of area and production. In order to frame the sample list it is necessary to know how many households are registered in the Geogs and farming households. But these data in some Dzongkhags have been very difficult to get access to and some are not updated. Further, information sharing on this is not timely.
8
Table 1: Percent of rural household normal walking distance from nearest motor – road
Dzongkhag Less than 1
hour 1 to < 3 hours
3 to < 6 hours
6 hours to Less than 1 day
One day and above
Bumthang 94.17 4.92 0.91 0.00 0.00 Chukha 34.58 25.55 10.19 11.29 18.39 Dagana 49.50 27.18 15.72 5.19 2.41 Gasa 22.56 16.05 0.00 0.00 61.40 Haa 69.81 4.14 0.00 0.00 26.05 Lhuntse 40.30 21.71 15.79 13.09 9.11 Monggar 36.59 22.01 18.59 9.54 13.27 Paro 91.69 6.99 0.39 0.70 0.23 Pemagatshel 35.92 10.80 24.49 10.86 17.93 Punakha 84.21 14.67 0.82 0.31 0.00 Samdrupjongkhar 19.09 35.02 12.94 15.42 17.53 Samtse 38.70 24.07 15.56 5.09 16.59 Sarpang 67.26 18.29 4.24 0.58 9.64 Thimphu 82.68 3.42 0.16 0.00 13.74 Trashigang 56.69 16.43 9.15 2.14 15.59 Trashiyangtse 35.76 37.60 20.93 3.14 2.57 Trongsa 63.84 15.05 10.90 10.21 0.00 Tsirang 46.47 32.35 15.73 5.37 0.08 Wangdue 54.95 27.69 12.69 2.78 1.89 Zhemgang 34.00 4.60 10.40 23.64 27.36 Average 52.94 18.43 9.98 5.97 12.69

9
Table 2: Total household members’ age wise (Nos) living and working on the farm and stayed more than 6 months regardless of the relationship in 2009.
Dzongkhag 0 - 6 yrs
male 0 - 6 yrs Female
7 - 14 yrs male
7 - 14 yrs Female
15 - 64 yrs male
15 - 64 Female
More than 64 Male
More than 64 Female
Bumthang 483 720 890 770 1,826 2,523 347 307
Chukha 1,121 993 1,857 1,611 6,343 6,538 858 777
Dagana 1,455 1,139 2,408 2,020 6,347 7,131 693 504
Gasa 144 130 241 311 637 701 47 60 Haa 246 296 551 507 1,881 2,163 398 312
Lhuntse 783 650 1,253 1,285 3,473 4,968 621 655
Monggar 2,254 2,427 3,274 3,031 9,450 11,396 1,645 1,446 Paro 1,216 1,140 2,419 2,010 6,709 8,062 1,095 1,255
Pemagatshel 792 645 1,027 1,320 4,938 6,676 793 855
Punakha 1,531 1,221 2,198 2,147 6,666 7,174 1,248 1,318 Samdrupjongkhar 1,304 1,624 2,123 2,024 7,102 7,730 697 681
Samtse 2,469 2,155 3,307 3,035 15,764 15,952 2,914 1,410
Sarpang 1,760 1,360 2,106 1,954 8,107 9,939 824 673
Thimphu 656 403 1,103 1,154 3,267 3,339 346 287 Trashigang 1,710 1,865 3,478 3,715 11,414 13,175 1,489 1,626
Trashiyangtse 766 833 1,653 1,857 4,377 4,964 571 455
Trongsa 925 854 1,884 1,687 4,203 3,822 701 666 Tsirang 909 862 2,515 2,517 6,523 7,196 786 793
Wangdue 1,759 1,751 1,994 1,977 6,840 9,601 1,358 1,254
Zhemgang 746 717 898 978 3,798 4,654 508 647
Total 23,027 21,785 37,179 35,911 119,668 137,704 17,940 15,983
10
Table 3: Paddy harvested area (acres), Production in (MT) and Yield (Kg/acre) Dzongkhag Acre Production Yield Bumthang 28 27 977 Chukha 1,752 1,581 902 Dagana 3,967 3,163 797 Gasa 166 197 1,185 Haa 97 92 945 Lhuntse 2,216 3,287 1,483 Monggar 1,420 1,649 1,161 Paro 4,686 9,027 1,926 Pemagatshel 125 96 768 Punakha 8,518 12,981 1,524 Samdrupjongkhar 4,173 4,024 964 Samtse 7,547 6,266 830 Sarpang 5,108 4,157 814 Thimphu 650 1,054 1,621 Trashigang 2,198 3,124 1,422 Trashiyangtse 1,477 1,656 1,121 Trongsa 2,135 2,176 1,019 Tsirang 5,640 4,255 754 Wangdue 5,437 5,837 1,074 Zhemgang 1,267 1,117 882 Total 58,609 65,763 1,122
11
Table 4: Maize harvested area (acres), Production in (MT) and Yield (Kg/acre) Dzongkhag Acre Production Yield Bumthang 17 12 738 Chukha 4,314 3,163 733 Dagana 7,515 4,738 630 Gasa 3 3 969 Haa 254 182 716 Lhuntse 2,563 2,873 1,121 Monggar 8,855 11,625 1,313 Paro 72 123 1,700 Pemagatshel 3,482 3,283 943 Punakha 492 441 895 Samdrupjongkhar 5,613 4,346 774 Samtse 10,854 8,624 795 Sarpang 5,527 3,403 616 Thimphu 5 4 876 Trashigang 6,630 7,065 1,066 Trashiyangtse 1,930 2,236 1,159 Trongsa 2,169 1,860 858 Tsirang 6,630 3,829 577 Wangdue 452 323 715 Zhemgang 3,226 3,028 939 Total 70,603 61,161 866
12
Table 5: Wheat harvested area (acres), Production in (MT) and Yield (Kg/acre) Dzongkhag Acre Production Yield Bumthang 760 338 445 Chukha 410 215 524 Dagana 90 40 448 Gasa 107 54 505 Haa 725 325 448 Lhuntse 19 9 454 Monggar 79 31 390 Paro 804 512 637 Pemagatshel 37 10 280 Punakha 1,309 577 441 Samdrupjongkhar 106 27 259 Samtse 354 167 473 Sarpang 22 4 203 Thimphu 176 112 636 Trashigang 79 76 959 Trashiyangtse 39 21 545 Trongsa 635 361 569 Tsirang 104 40 379 Wangdue 1,676 666 397 Zhemgang 177 93 526 Total 7,709 3,679 477
13
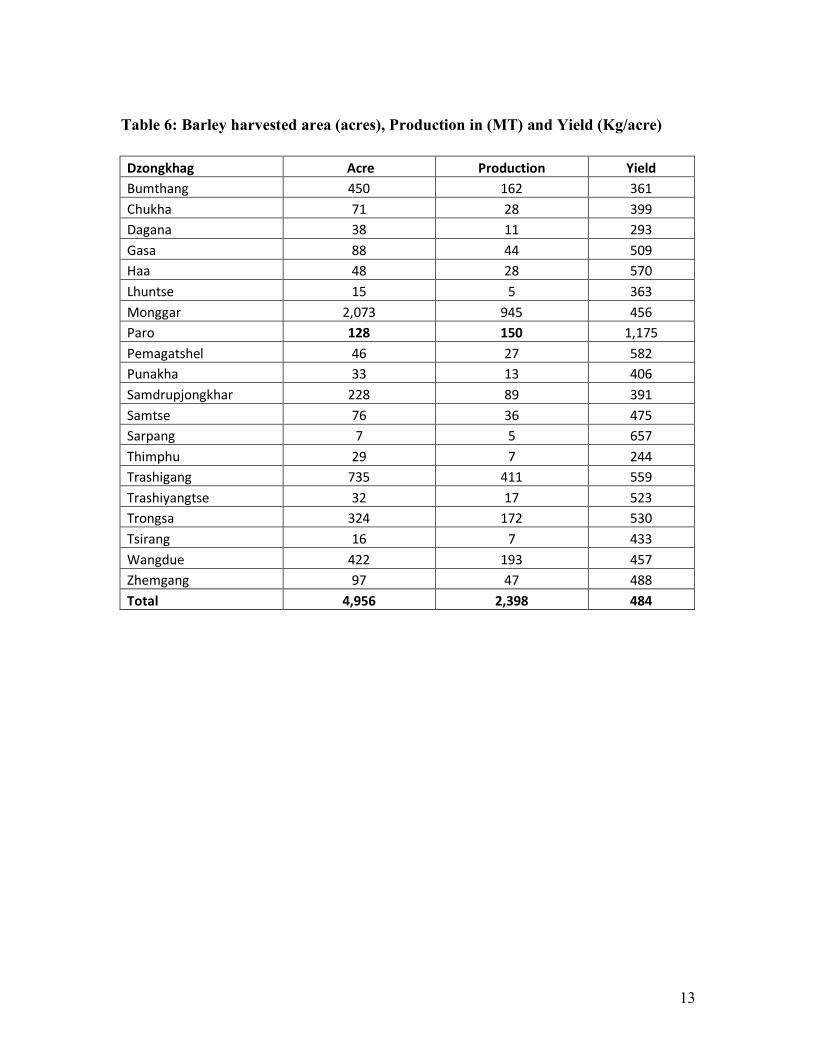
Table 6: Barley harvested area (acres), Production in (MT) and Yield (Kg/acre) Dzongkhag Acre Production Yield Bumthang 450 162 361 Chukha 71 28 399 Dagana 38 11 293 Gasa 88 44 509 Haa 48 28 570 Lhuntse 15 5 363 Monggar 2,073 945 456 Paro 128 150 1,175 Pemagatshel 46 27 582 Punakha 33 13 406 Samdrupjongkhar 228 89 391 Samtse 76 36 475 Sarpang 7 5 657 Thimphu 29 7 244 Trashigang 735 411 559 Trashiyangtse 32 17 523 Trongsa 324 172 530 Tsirang 16 7 433 Wangdue 422 193 457 Zhemgang 97 47 488 Total 4,956 2,398 484
14
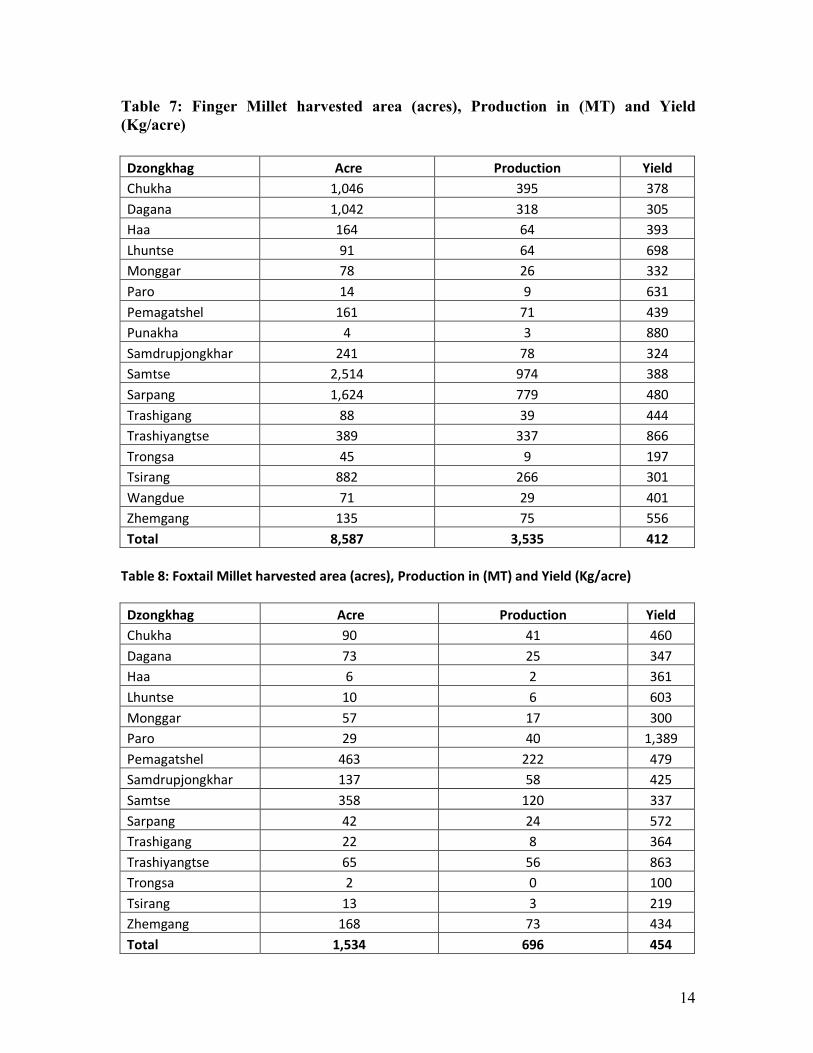
Table 7: Finger Millet harvested area (acres), Production in (MT) and Yield (Kg/acre) Dzongkhag Acre Production Yield Chukha 1,046 395 378 Dagana 1,042 318 305 Haa 164 64 393 Lhuntse 91 64 698 Monggar 78 26 332 Paro 14 9 631 Pemagatshel 161 71 439 Punakha 4 3 880 Samdrupjongkhar 241 78 324 Samtse 2,514 974 388 Sarpang 1,624 779 480 Trashigang 88 39 444 Trashiyangtse 389 337 866 Trongsa 45 9 197 Tsirang 882 266 301 Wangdue 71 29 401 Zhemgang 135 75 556 Total 8,587 3,535 412
Table 8: Foxtail Millet harvested area (acres), Production in (MT) and Yield (Kg/acre) Dzongkhag Acre Production Yield Chukha 90 41 460 Dagana 73 25 347 Haa 6 2 361 Lhuntse 10 6 603 Monggar 57 17 300 Paro 29 40 1,389 Pemagatshel 463 222 479 Samdrupjongkhar 137 58 425 Samtse 358 120 337 Sarpang 42 24 572 Trashigang 22 8 364 Trashiyangtse 65 56 863 Trongsa 2 0 100 Tsirang 13 3 219 Zhemgang 168 73 434 Total 1,534 696 454
15
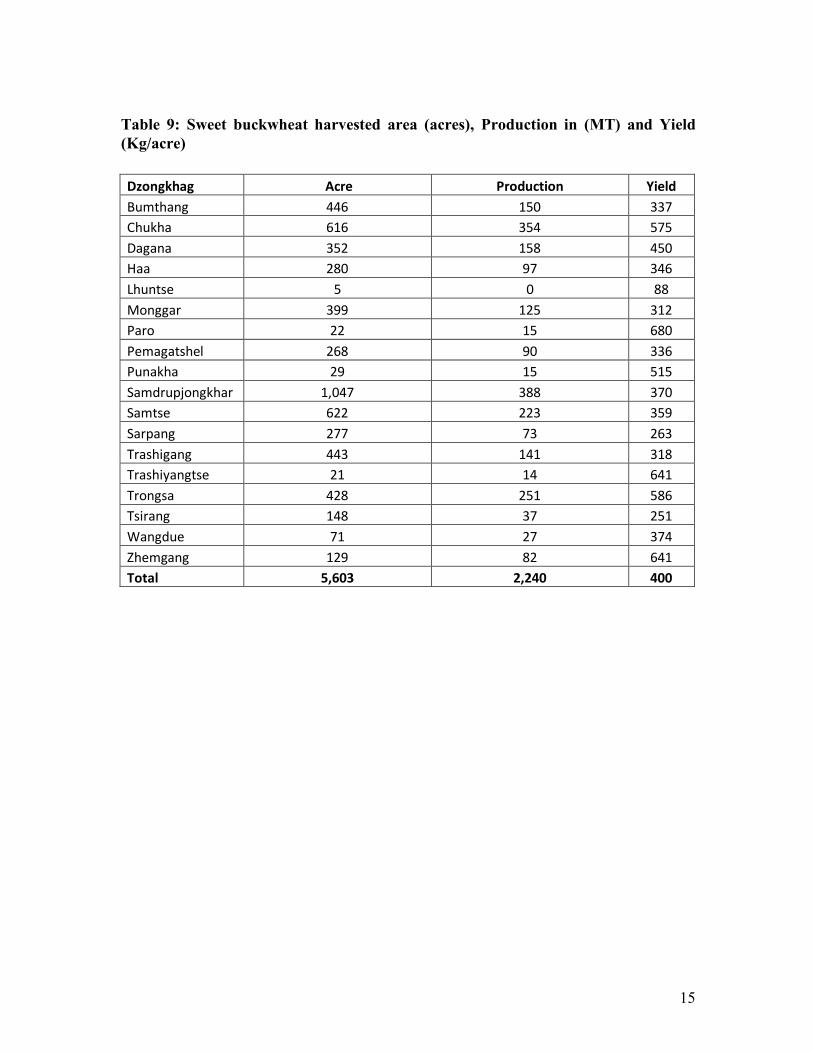
Table 9: Sweet buckwheat harvested area (acres), Production in (MT) and Yield (Kg/acre) Dzongkhag Acre Production Yield Bumthang 446 150 337 Chukha 616 354 575 Dagana 352 158 450 Haa 280 97 346 Lhuntse 5 0 88 Monggar 399 125 312 Paro 22 15 680 Pemagatshel 268 90 336 Punakha 29 15 515 Samdrupjongkhar 1,047 388 370 Samtse 622 223 359 Sarpang 277 73 263 Trashigang 443 141 318 Trashiyangtse 21 14 641 Trongsa 428 251 586 Tsirang 148 37 251 Wangdue 71 27 374 Zhemgang 129 82 641 Total 5,603 2,240 400
16
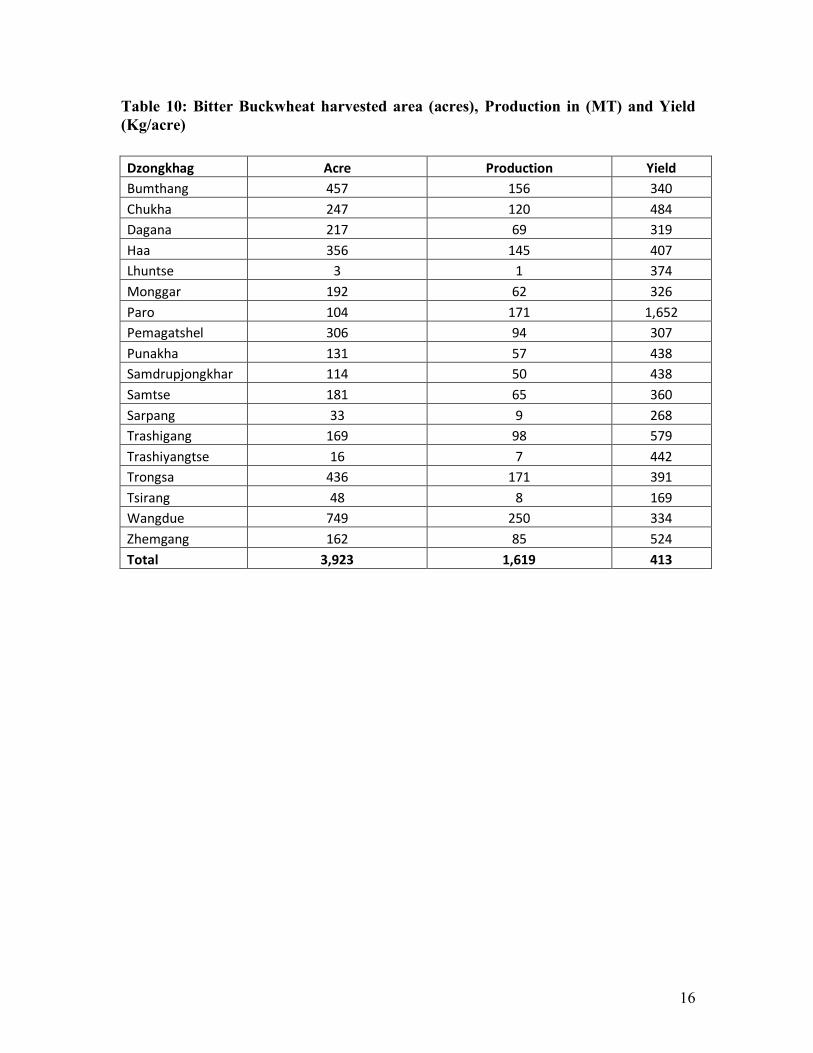
Table 10: Bitter Buckwheat harvested area (acres), Production in (MT) and Yield (Kg/acre) Dzongkhag Acre Production Yield Bumthang 457 156 340 Chukha 247 120 484 Dagana 217 69 319 Haa 356 145 407 Lhuntse 3 1 374 Monggar 192 62 326 Paro 104 171 1,652 Pemagatshel 306 94 307 Punakha 131 57 438 Samdrupjongkhar 114 50 438 Samtse 181 65 360 Sarpang 33 9 268 Trashigang 169 98 579 Trashiyangtse 16 7 442 Trongsa 436 171 391 Tsirang 48 8 169 Wangdue 749 250 334 Zhemgang 162 85 524 Total 3,923 1,619 413

17
Table 11: Bean Harvested area (acres), Production (MT) and yield (Kg/acre) Dzongkhag Acre Production Yield Bumthang 24 11 465 Chukha 130 142 1,087 Dagana 174 63 362 Gasa 4 2 534 Haa 21 21 1,001 Lhuntse 73 94 1,299 Monggar 386 417 1,081 Paro 99 85 860 Pemagatshel 115 58 507 Punakha 245 328 1,341 Samdrupjongkhar 119 90 759 Samtse 154 74 480 Sarpang 107 53 493 Thimphu 13 20 1,524 Trashigang 143 85 598 Trashiyangtse 136 50 370 Trongsa 49 32 649 Tsirang 123 50 402 Wangdue 94 90 956 Zhemgang 63 56 890 Total 2,272 1,823 802
18
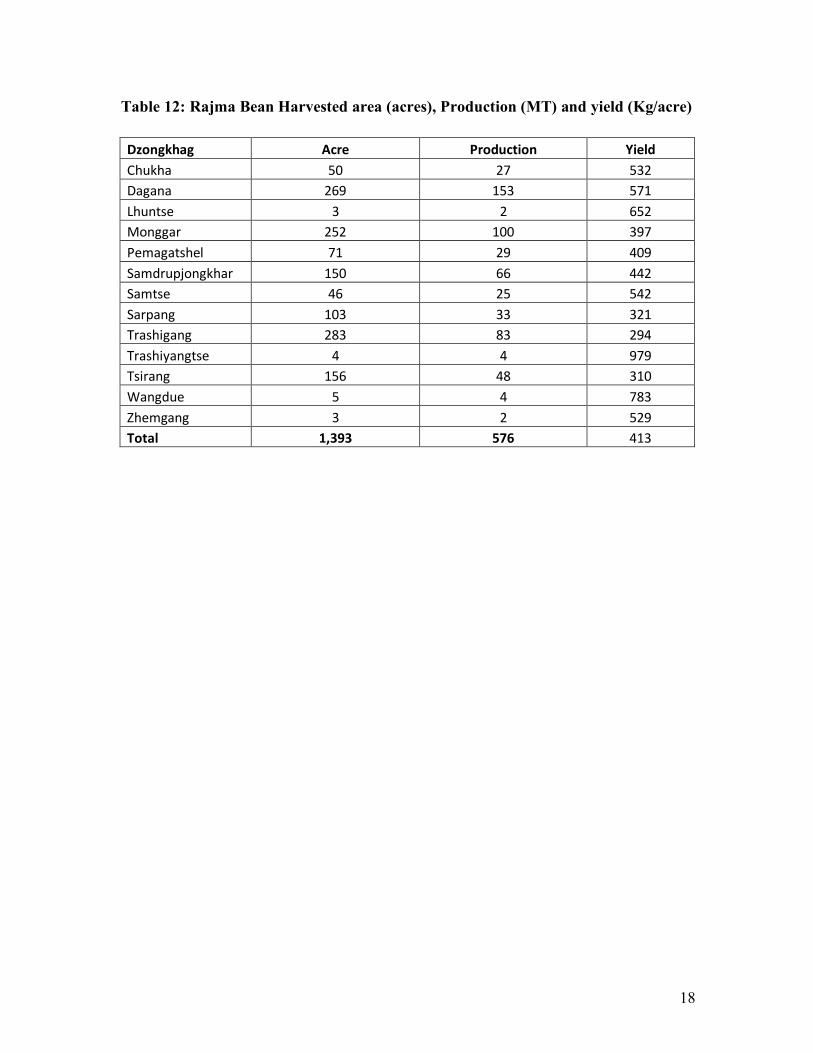
Table 12: Rajma Bean Harvested area (acres), Production (MT) and yield (Kg/acre) Dzongkhag Acre Production Yield Chukha 50 27 532 Dagana 269 153 571 Lhuntse 3 2 652 Monggar 252 100 397 Pemagatshel 71 29 409 Samdrupjongkhar 150 66 442 Samtse 46 25 542 Sarpang 103 33 321 Trashigang 283 83 294 Trashiyangtse 4 4 979 Tsirang 156 48 310 Wangdue 5 4 783 Zhemgang 3 2 529 Total 1,393 576 413
19
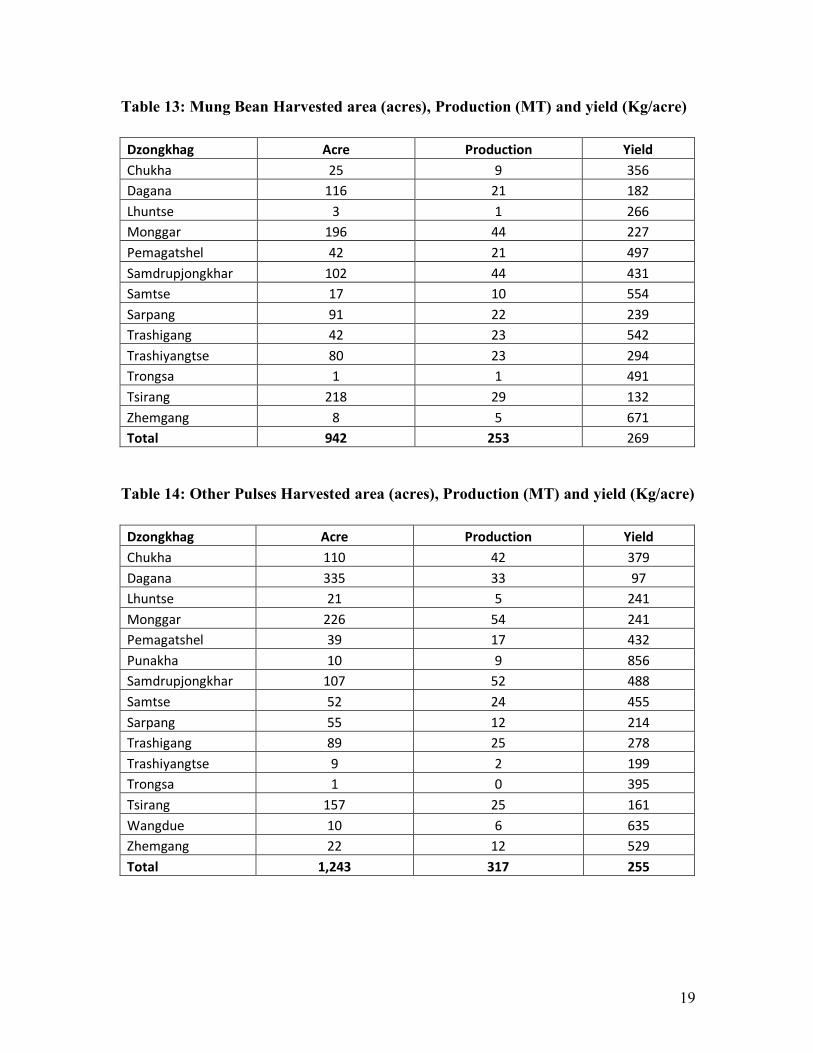
Table 13: Mung Bean Harvested area (acres), Production (MT) and yield (Kg/acre) Dzongkhag Acre Production Yield Chukha 25 9 356 Dagana 116 21 182 Lhuntse 3 1 266 Monggar 196 44 227 Pemagatshel 42 21 497 Samdrupjongkhar 102 44 431 Samtse 17 10 554 Sarpang 91 22 239 Trashigang 42 23 542 Trashiyangtse 80 23 294 Trongsa 1 1 491 Tsirang 218 29 132 Zhemgang 8 5 671 Total 942 253 269
Table 14: Other Pulses Harvested area (acres), Production (MT) and yield (Kg/acre) Dzongkhag Acre Production Yield Chukha 110 42 379 Dagana 335 33 97 Lhuntse 21 5 241 Monggar 226 54 241 Pemagatshel 39 17 432 Punakha 10 9 856 Samdrupjongkhar 107 52 488 Samtse 52 24 455 Sarpang 55 12 214 Trashigang 89 25 278 Trashiyangtse 9 2 199 Trongsa 1 0 395 Tsirang 157 25 161 Wangdue 10 6 635 Zhemgang 22 12 529 Total 1,243 317 255
20
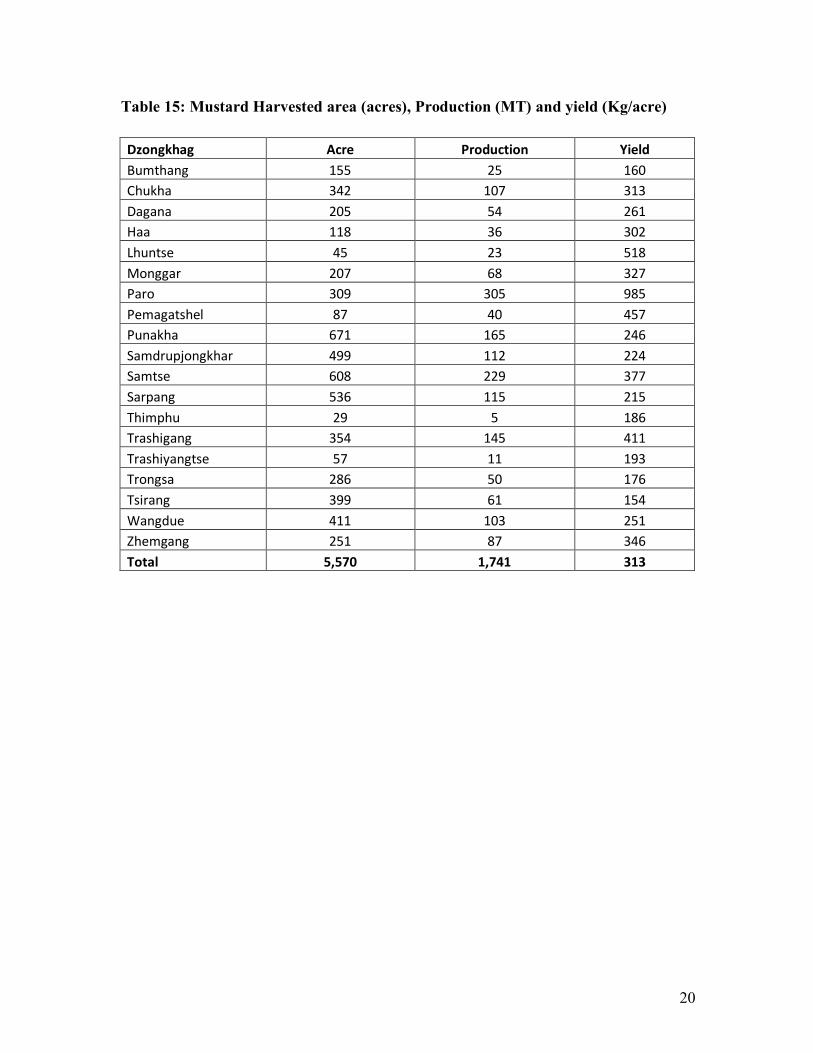
Table 15: Mustard Harvested area (acres), Production (MT) and yield (Kg/acre) Dzongkhag Acre Production Yield Bumthang 155 25 160 Chukha 342 107 313 Dagana 205 54 261 Haa 118 36 302 Lhuntse 45 23 518 Monggar 207 68 327 Paro 309 305 985 Pemagatshel 87 40 457 Punakha 671 165 246 Samdrupjongkhar 499 112 224 Samtse 608 229 377 Sarpang 536 115 215 Thimphu 29 5 186 Trashigang 354 145 411 Trashiyangtse 57 11 193 Trongsa 286 50 176 Tsirang 399 61 154 Wangdue 411 103 251 Zhemgang 251 87 346 Total 5,570 1,741 313

21
Table 16: Soya bean Harvested area (acres), Production (MT) and yield (Kg/acre) Dzongkhag Area Production Yield Chukha 18 7 396 Dagana 38 7 176 Lhuntse 138 37 270 Monggar 199 62 311 Paro 3 2 750 Pemagatshel 184 35 189 Punakha 5 4 880 Samdrupjongkhar 126 40 320 Samtse 38 14 377 Sarpang 13 4 330 Trashigang 414 87 210 Trashiyangtse 369 203 550 Tsirang 76 15 201 Wangdue 3 2 436 Zhemgang 42 26 629 Total 1,667 546 328
22
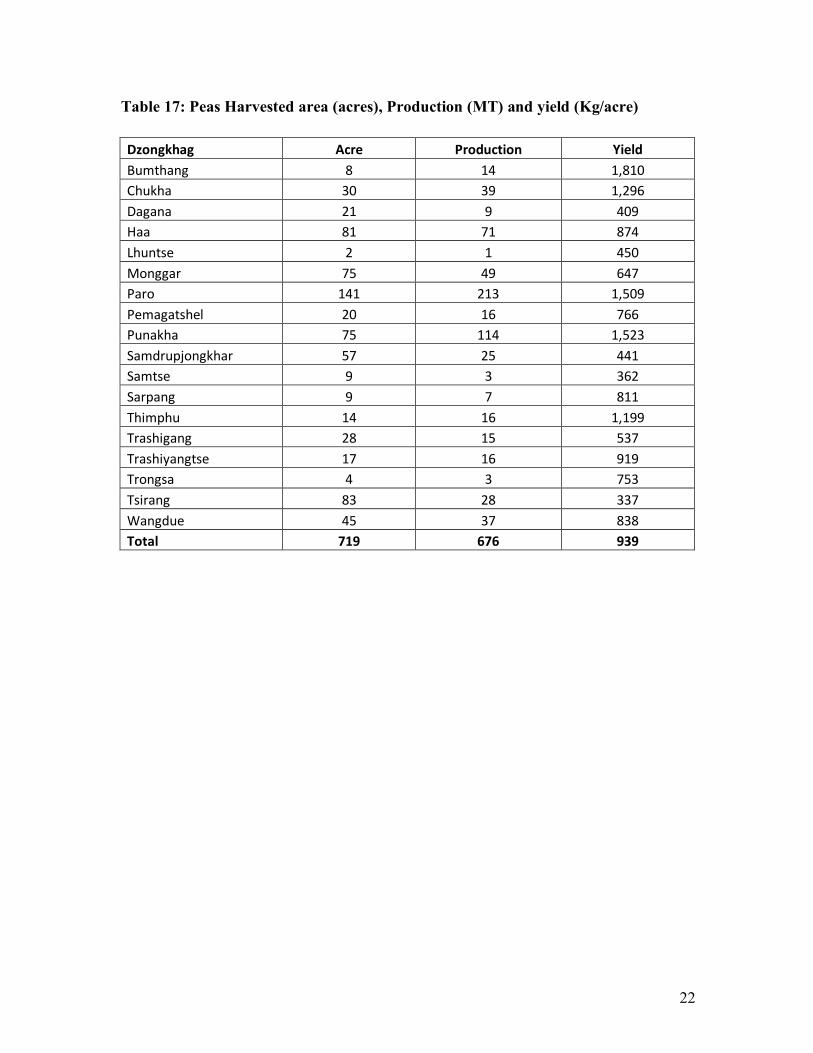
Table 17: Peas Harvested area (acres), Production (MT) and yield (Kg/acre) Dzongkhag Acre Production Yield Bumthang 8 14 1,810 Chukha 30 39 1,296 Dagana 21 9 409 Haa 81 71 874 Lhuntse 2 1 450 Monggar 75 49 647 Paro 141 213 1,509 Pemagatshel 20 16 766 Punakha 75 114 1,523 Samdrupjongkhar 57 25 441 Samtse 9 3 362 Sarpang 9 7 811 Thimphu 14 16 1,199 Trashigang 28 15 537 Trashiyangtse 17 16 919 Trongsa 4 3 753 Tsirang 83 28 337 Wangdue 45 37 838 Total 719 676 939
23
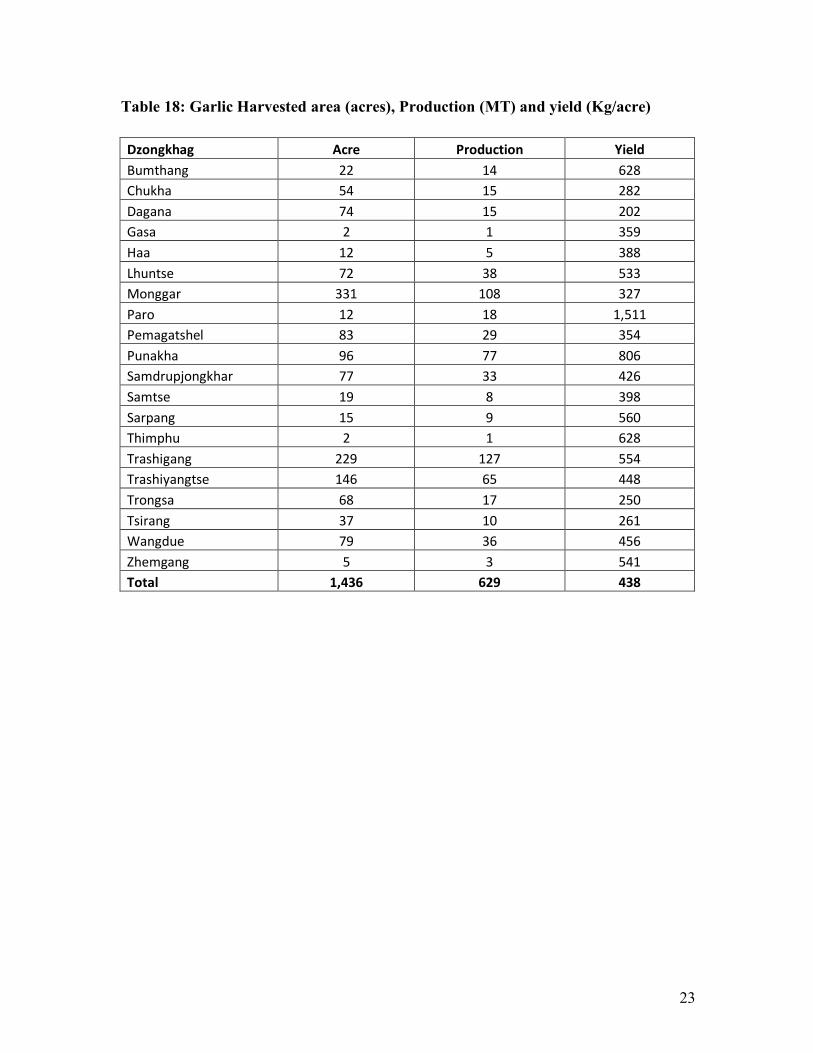
Table 18: Garlic Harvested area (acres), Production (MT) and yield (Kg/acre) Dzongkhag Acre Production Yield Bumthang 22 14 628 Chukha 54 15 282 Dagana 74 15 202 Gasa 2 1 359 Haa 12 5 388 Lhuntse 72 38 533 Monggar 331 108 327 Paro 12 18 1,511 Pemagatshel 83 29 354 Punakha 96 77 806 Samdrupjongkhar 77 33 426 Samtse 19 8 398 Sarpang 15 9 560 Thimphu 2 1 628 Trashigang 229 127 554 Trashiyangtse 146 65 448 Trongsa 68 17 250 Tsirang 37 10 261 Wangdue 79 36 456 Zhemgang 5 3 541 Total 1,436 629 438
24
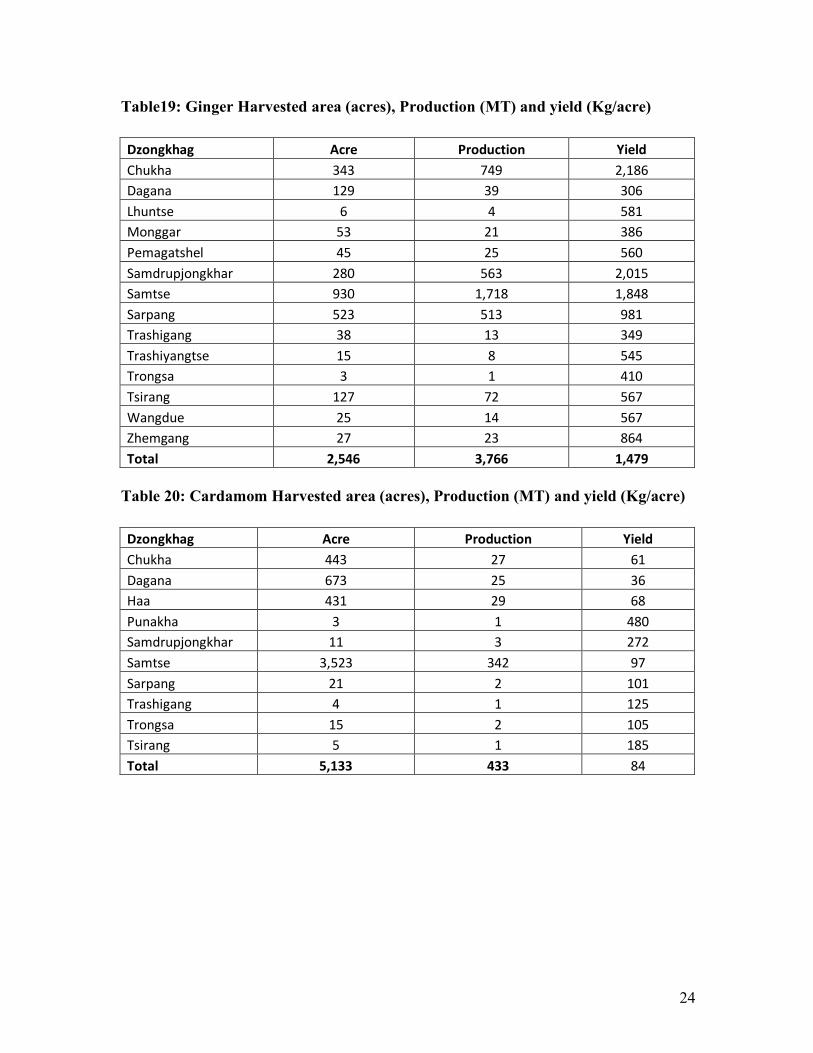
Table19: Ginger Harvested area (acres), Production (MT) and yield (Kg/acre) Dzongkhag Acre Production Yield Chukha 343 749 2,186 Dagana 129 39 306 Lhuntse 6 4 581 Monggar 53 21 386 Pemagatshel 45 25 560 Samdrupjongkhar 280 563 2,015 Samtse 930 1,718 1,848 Sarpang 523 513 981 Trashigang 38 13 349 Trashiyangtse 15 8 545 Trongsa 3 1 410 Tsirang 127 72 567 Wangdue 25 14 567 Zhemgang 27 23 864 Total 2,546 3,766 1,479
Table 20: Cardamom Harvested area (acres), Production (MT) and yield (Kg/acre) Dzongkhag Acre Production Yield Chukha 443 27 61 Dagana 673 25 36 Haa 431 29 68 Punakha 3 1 480 Samdrupjongkhar 11 3 272 Samtse 3,523 342 97 Sarpang 21 2 101 Trashigang 4 1 125 Trongsa 15 2 105 Tsirang 5 1 185 Total 5,133 433 84
25
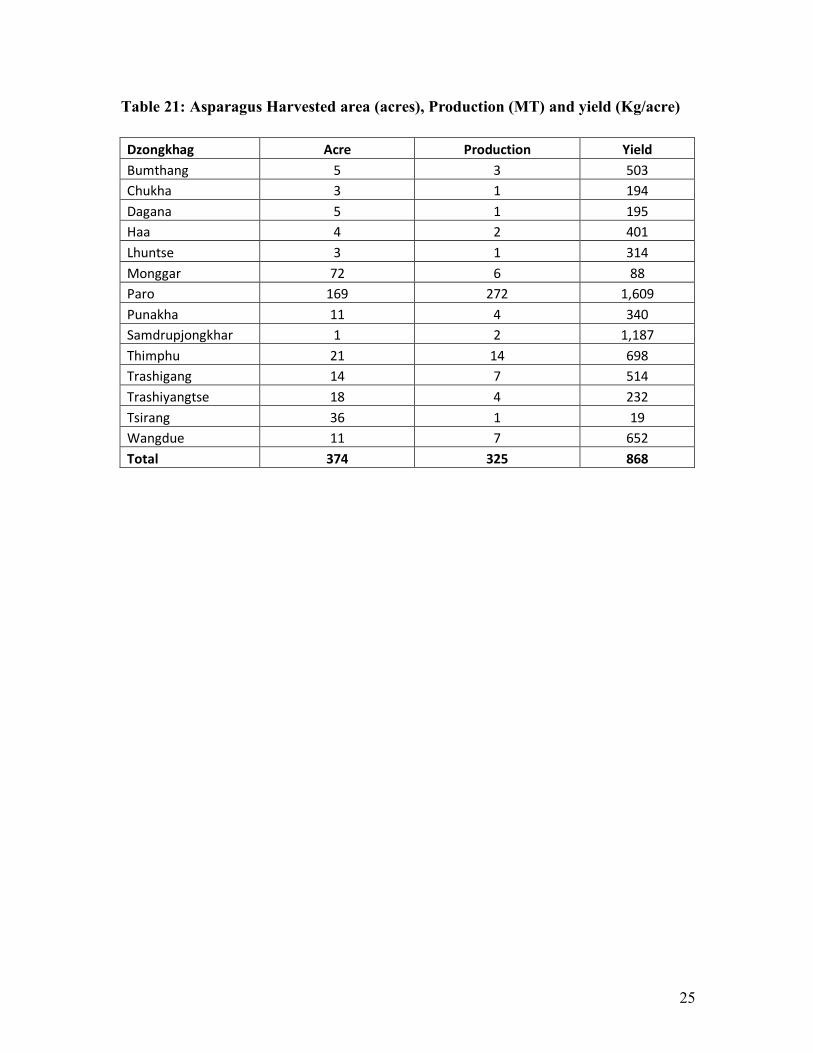
Table 21: Asparagus Harvested area (acres), Production (MT) and yield (Kg/acre) Dzongkhag Acre Production Yield Bumthang 5 3 503 Chukha 3 1 194 Dagana 5 1 195 Haa 4 2 401 Lhuntse 3 1 314 Monggar 72 6 88 Paro 169 272 1,609 Punakha 11 4 340 Samdrupjongkhar 1 2 1,187 Thimphu 21 14 698 Trashigang 14 7 514 Trashiyangtse 18 4 232 Tsirang 36 1 19 Wangdue 11 7 652 Total 374 325 868
26
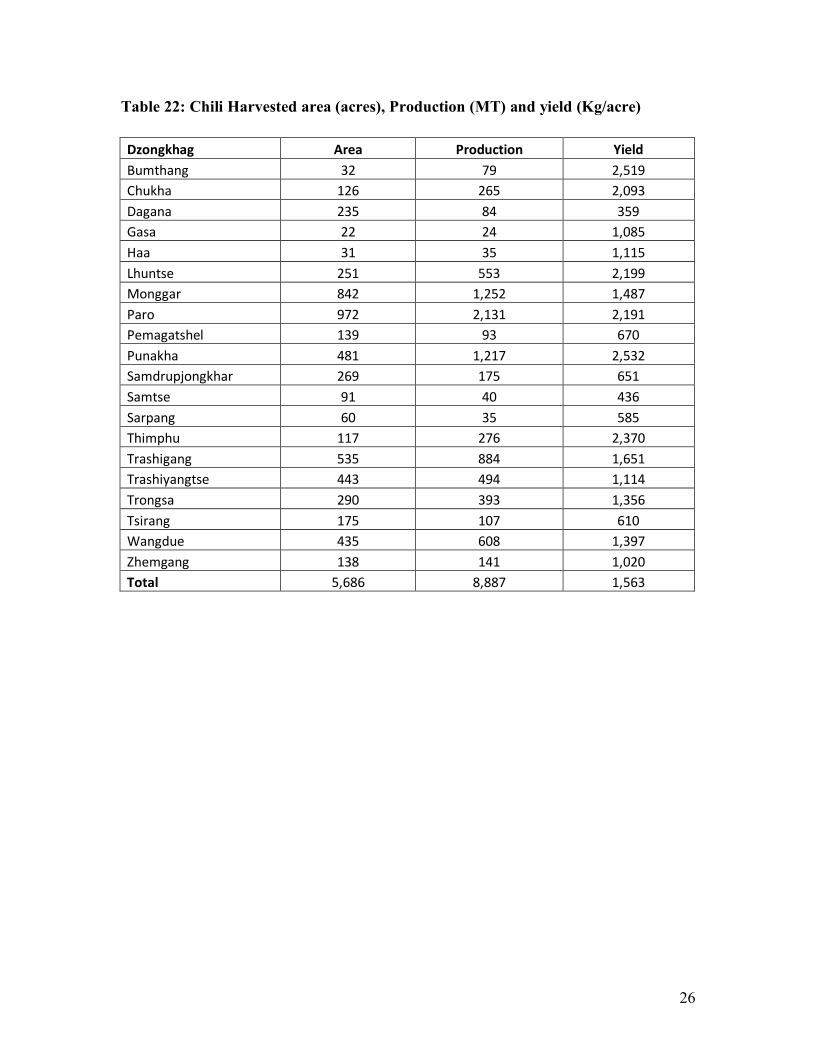
Table 22: Chili Harvested area (acres), Production (MT) and yield (Kg/acre) Dzongkhag Area Production Yield Bumthang 32 79 2,519 Chukha 126 265 2,093 Dagana 235 84 359 Gasa 22 24 1,085 Haa 31 35 1,115 Lhuntse 251 553 2,199 Monggar 842 1,252 1,487 Paro 972 2,131 2,191 Pemagatshel 139 93 670 Punakha 481 1,217 2,532 Samdrupjongkhar 269 175 651 Samtse 91 40 436 Sarpang 60 35 585 Thimphu 117 276 2,370 Trashigang 535 884 1,651 Trashiyangtse 443 494 1,114 Trongsa 290 393 1,356 Tsirang 175 107 610 Wangdue 435 608 1,397 Zhemgang 138 141 1,020 Total 5,686 8,887 1,563

27
Table 23: Cabbage Harvested area (acres), Production (MT) and yield (Kg/acre) Dzongkhag Acre Production Yield Bumthang 51 59 1,157 Chukha 42 124 2,976 Dagana 27 27 985 Gasa 14 8 604 Haa 18 46 2,565 Lhuntse 62 89 1,440 Monggar 187 316 1,689 Paro 146 352 2,417 Pemagatshel 38 29 768 Punakha 3 4 1,284 Samdrupjongkhar 47 44 944 Samtse 35 18 516 Sarpang 21 19 907 Thimphu 27 27 988 Trashigang 148 100 677 Trashiyangtse 59 104 1,761 Trongsa 80 90 1,133 Tsirang 58 52 894 Wangdue 86 231 2,703 Zhemgang 40 36 898 Total 1,187 1,776 1,496
28
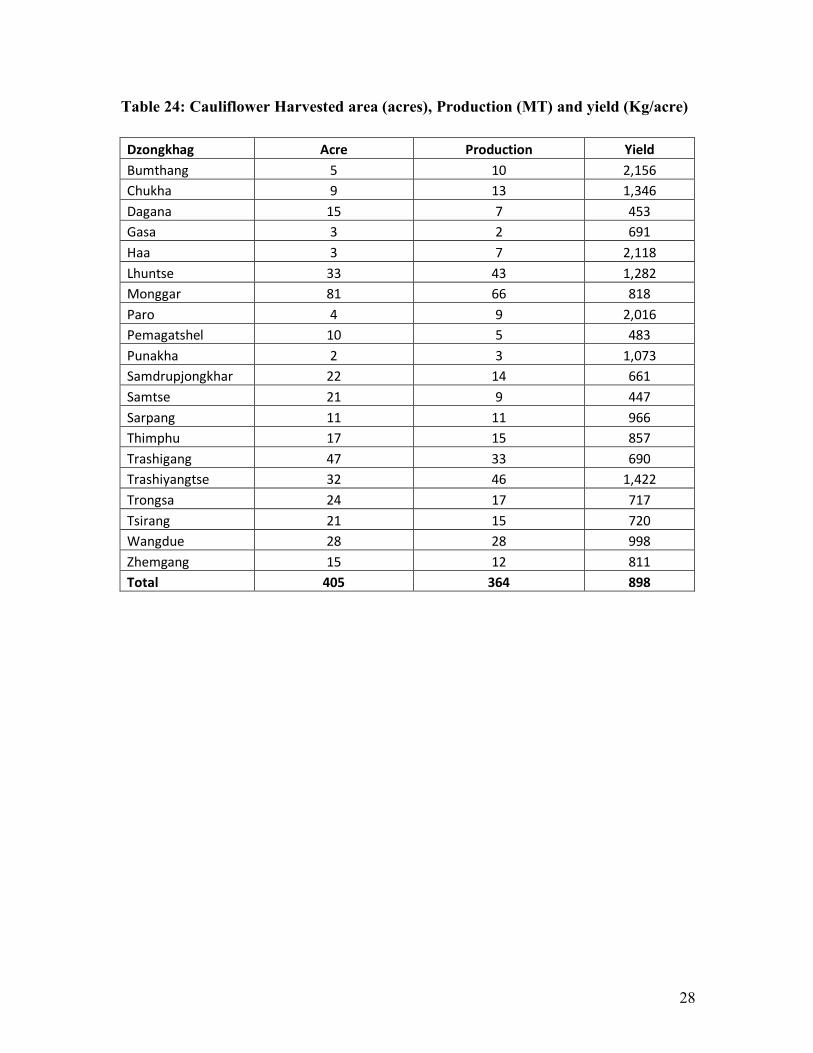
Table 24: Cauliflower Harvested area (acres), Production (MT) and yield (Kg/acre) Dzongkhag Acre Production Yield Bumthang 5 10 2,156 Chukha 9 13 1,346 Dagana 15 7 453 Gasa 3 2 691 Haa 3 7 2,118 Lhuntse 33 43 1,282 Monggar 81 66 818 Paro 4 9 2,016 Pemagatshel 10 5 483 Punakha 2 3 1,073 Samdrupjongkhar 22 14 661 Samtse 21 9 447 Sarpang 11 11 966 Thimphu 17 15 857 Trashigang 47 33 690 Trashiyangtse 32 46 1,422 Trongsa 24 17 717 Tsirang 21 15 720 Wangdue 28 28 998 Zhemgang 15 12 811 Total 405 364 898

29
Table 25: Carrot Harvested area (acres), Production (MT) and yield (Kg/acre) Dzongkhag Acre Production Yield Bumthang 8 11 1,276 Chukha 21 59 2,792 Dagana 4 3 686 Haa 6 8 1,431 Lhuntse 23 5 221 Monggar 44 25 559 Paro 24 49 2,005 Pemagatshel 5 23 4,774 Punakha 4 4 997 Samdrupjongkhar 3 2 797 Samtse 5 5 879 Sarpang 4 4 969 Thimphu 15 20 1,368 Trashigang 18 8 458 Trashiyangtse 7 5 667 Trongsa 13 11 845 Tsirang 3 2 586 Wangdue 27 31 1,125 Zhemgang 2 2 985 Total 238 277 1,162

30
Table 26: Radish Harvested area (acres), Production (MT) and yield (Kg/acre) Dzongkhag Acre Prodction Yield Bumthang 60 272 4,515 Chukha 107 167 1,560 Dagana 206 121 590 Gasa 22 27 1,261 Haa 76 181 2,376 Lhuntse 150 174 1,161 Monggar 391 561 1,435 Paro 101 253 2,496 Pemagatshel 189 296 1,565 Punakha 107 238 2,214 Samdrupjongkhar 196 266 1,353 Samtse 152 130 854 Sarpang 115 154 1,330 Thimphu 71 163 2,291 Trashigang 217 459 2,111 Trashiyangtse 80 163 2,036 Trongsa 125 255 2,047 Tsirang 251 222 886 Wangdue 432 1,405 3,252 Zhemgang 118 167 1,412 Total 3,167 5,672 1,791
31
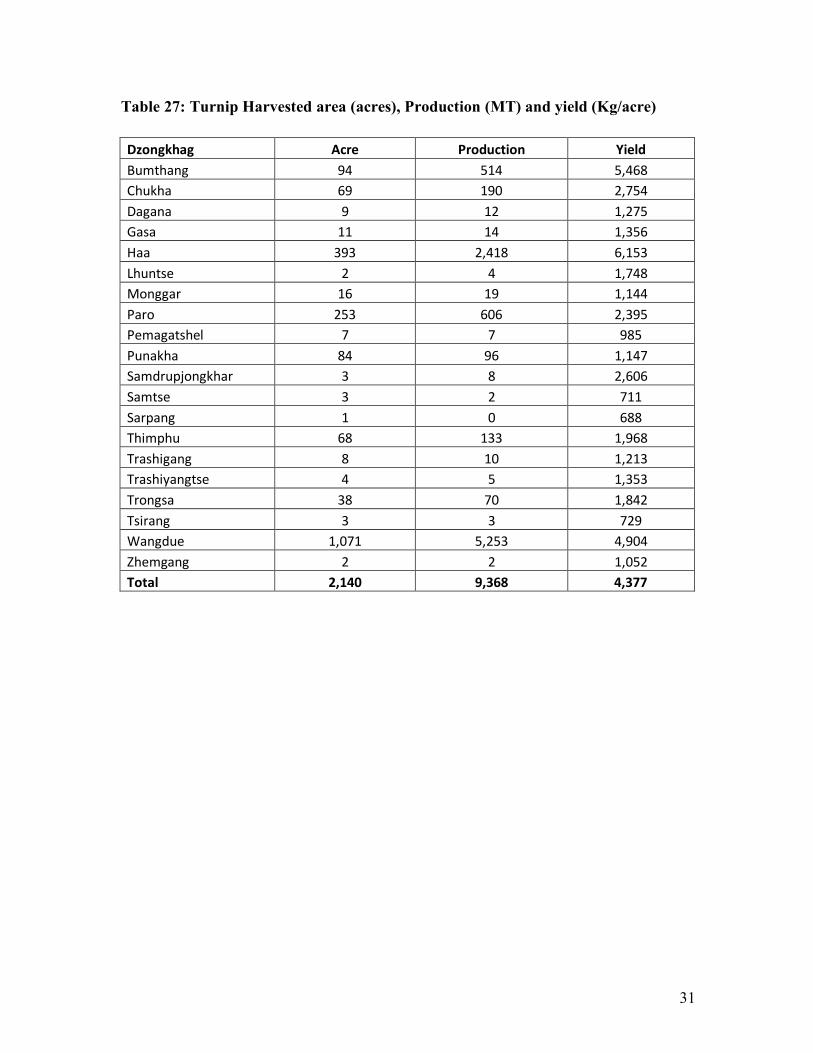
Table 27: Turnip Harvested area (acres), Production (MT) and yield (Kg/acre) Dzongkhag Acre Production Yield Bumthang 94 514 5,468 Chukha 69 190 2,754 Dagana 9 12 1,275 Gasa 11 14 1,356 Haa 393 2,418 6,153 Lhuntse 2 4 1,748 Monggar 16 19 1,144 Paro 253 606 2,395 Pemagatshel 7 7 985 Punakha 84 96 1,147 Samdrupjongkhar 3 8 2,606 Samtse 3 2 711 Sarpang 1 0 688 Thimphu 68 133 1,968 Trashigang 8 10 1,213 Trashiyangtse 4 5 1,353 Trongsa 38 70 1,842 Tsirang 3 3 729 Wangdue 1,071 5,253 4,904 Zhemgang 2 2 1,052 Total 2,140 9,368 4,377

32
Table 28: Tomato Harvested area (acres), Production (MT) and yield (Kg/acre) Dzongkhag Acre Production Yield Bumthang 24 89 3,653 Chukha 10 8 793 Dagana 8 5 690 Haa 8 39 4,651 Lhuntse 9 5 592 Monggar 17 19 1,104 Paro 40 111 2,782 Pemagatshel 4 2 539 Punakha 32 54 1,681 Samdrupjongkhar 21 11 514 Samtse 49 26 517 Sarpang 26 34 1,290 Thimphu 3 16 5,423 Trashigang 12 29 2,421 Trashiyangtse 33 34 1,015 Tsirang 12 7 594 Wangdue 30 58 1,932 Zhemgang 20 18 882 Total 359 564 1,569
33
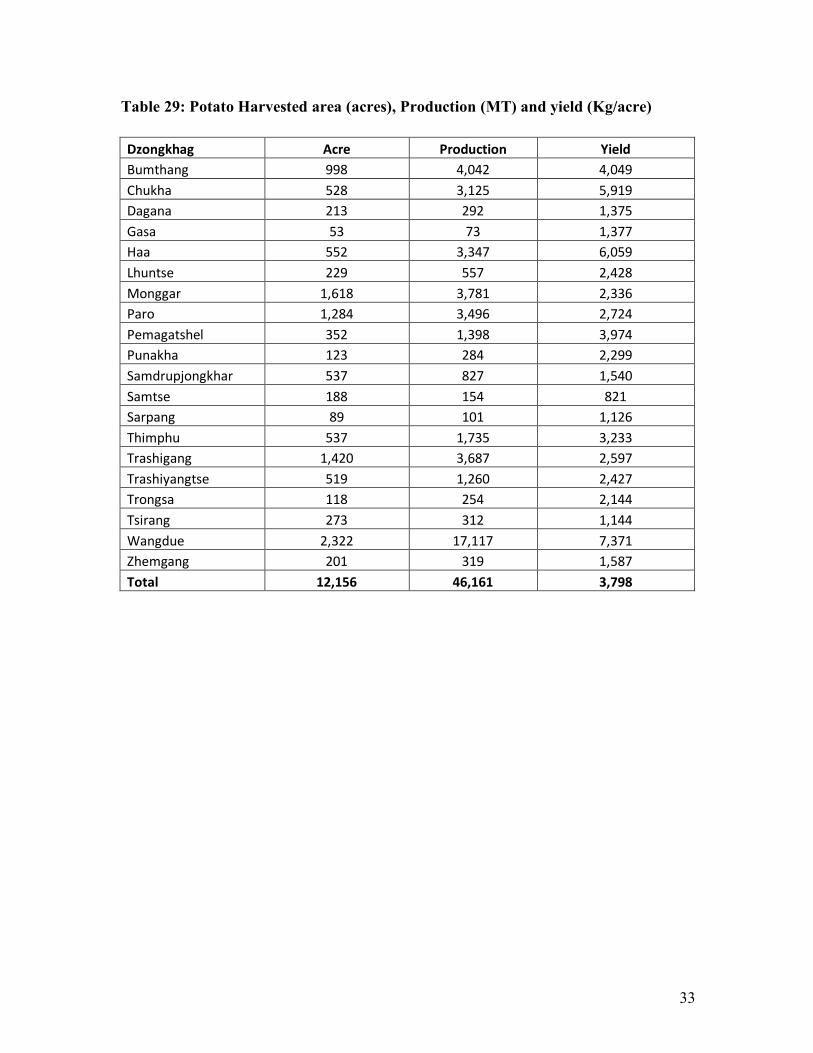
Table 29: Potato Harvested area (acres), Production (MT) and yield (Kg/acre) Dzongkhag Acre Production Yield Bumthang 998 4,042 4,049 Chukha 528 3,125 5,919 Dagana 213 292 1,375 Gasa 53 73 1,377 Haa 552 3,347 6,059 Lhuntse 229 557 2,428 Monggar 1,618 3,781 2,336 Paro 1,284 3,496 2,724 Pemagatshel 352 1,398 3,974 Punakha 123 284 2,299 Samdrupjongkhar 537 827 1,540 Samtse 188 154 821 Sarpang 89 101 1,126 Thimphu 537 1,735 3,233 Trashigang 1,420 3,687 2,597 Trashiyangtse 519 1,260 2,427 Trongsa 118 254 2,144 Tsirang 273 312 1,144 Wangdue 2,322 17,117 7,371 Zhemgang 201 319 1,587 Total 12,156 46,161 3,798

34
Table 30: Green leaves Harvested area (acres), Production (MT) and yield (Kg/acre) Dzongkhag Acre Production Yield Bumthang 22 30 1,374 Chukha 134 275 2,050 Dagana 149 129 869 Gasa 4 2 613 Haa 20 19 954 Lhuntse 67 63 940 Monggar 214 147 684 Paro 49 43 888 Pemagatshel 64 48 755 Punakha 71 108 1,532 Samdrupjongkhar 139 163 1,174 Samtse 228 319 1,394 Sarpang 152 163 1,074 Thimphu 28 57 2,036 Trashigang 110 93 843 Trashiyangtse 43 51 1,195 Trongsa 78 48 619 Tsirang 193 188 974 Wangdue 182 181 994 Zhemgang 87 95 1,089
Total 2,034 2,224 1,093

35
Table 31: Onion Bulb Harvested area (acres), Production (MT) and yield (Kg/acre) Dzongkhag Area Production Yield Bumthang 5 1 302 Chukha 189 37 199 Dagana 67 9 130 Gasa 1 1 562 Haa 0.3 0.1 463 Lhuntse 32 15 465 Monggar 133 55 411 Paro 4 8 1,842 Pemagatshel 26 6 217 Punakha 301 82 271 Samdrupjongkhar 61 29 471 Samtse 41 20 477 Sarpang 27 10 372 Thimphu 1 1 754 Trashigang 86 35 409 Trashiyangtse 63 19 299 Trongsa 8 3 323 Tsirang 29 5 156 Wangdue 57 39 685 Zhemgang 25 20 815 Total 1,155 392 339
Table 32: Egg Plant Harvested area (acres), Production (MT) and yield (Kg/acre) Dzongkhag Area Production Yield Chukha 15 11 739 Dagana 8 4 531 Gasa 3 2 769 Haa 1 3 3,471 Lhuntse 28 24 860 Monggar 52 50 952 Paro 21 40 1,897 Pemagatshel 22 18 820 Punakha 17 56 3,385 Samdrupjongkhar 470 17 37 Samtse 26 12 452 Sarpang 18 14 793 Thimphu 300 2 6 Trashigang 13 11 846 Trashiyangtse 118 37 309 Trongsa 52 44 845 Tsirang 4 3 707 Wangdue 33 36 1,107 Zhemgang 23 22 936 Total 1,225 406 331
36
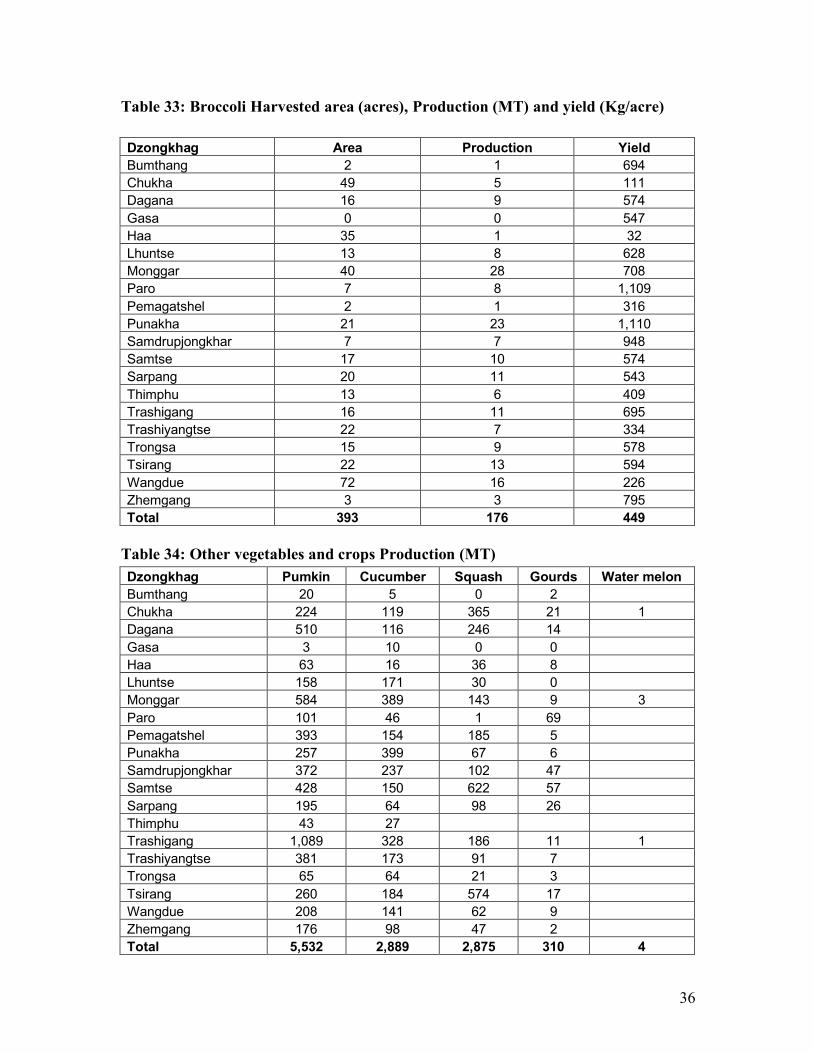
Table 33: Broccoli Harvested area (acres), Production (MT) and yield (Kg/acre) Dzongkhag Area Production Yield Bumthang 2 1 694 Chukha 49 5 111 Dagana 16 9 574 Gasa 0 0 547 Haa 35 1 32 Lhuntse 13 8 628 Monggar 40 28 708 Paro 7 8 1,109 Pemagatshel 2 1 316 Punakha 21 23 1,110 Samdrupjongkhar 7 7 948 Samtse 17 10 574 Sarpang 20 11 543 Thimphu 13 6 409 Trashigang 16 11 695 Trashiyangtse 22 7 334 Trongsa 15 9 578 Tsirang 22 13 594 Wangdue 72 16 226 Zhemgang 3 3 795 Total 393 176 449
Table 34: Other vegetables and crops Production (MT) Dzongkhag Pumkin Cucumber Squash Gourds Water melon Bumthang 20 5 0 2 Chukha 224 119 365 21 1 Dagana 510 116 246 14 Gasa 3 10 0 0 Haa 63 16 36 8 Lhuntse 158 171 30 0 Monggar 584 389 143 9 3 Paro 101 46 1 69 Pemagatshel 393 154 185 5 Punakha 257 399 67 6 Samdrupjongkhar 372 237 102 47 Samtse 428 150 622 57 Sarpang 195 64 98 26 Thimphu 43 27 Trashigang 1,089 328 186 11 1 Trashiyangtse 381 173 91 7 Trongsa 65 64 21 3 Tsirang 260 184 574 17 Wangdue 208 141 62 9 Zhemgang 176 98 47 2 Total 5,532 2,889 2,875 310 4
37
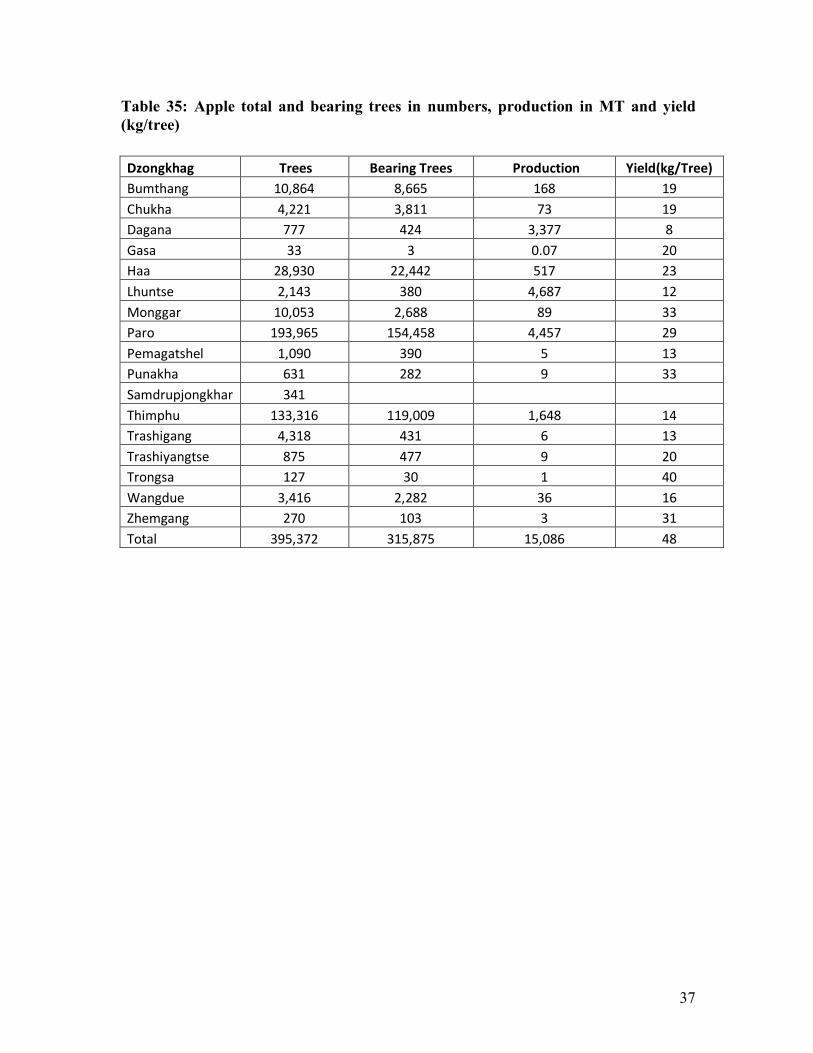
Table 35: Apple total and bearing trees in numbers, production in MT and yield (kg/tree) Dzongkhag Trees Bearing Trees Production Yield(kg/Tree) Bumthang 10,864 8,665 168 19 Chukha 4,221 3,811 73 19 Dagana 777 424 3,377 8 Gasa 33 3 0.07 20 Haa 28,930 22,442 517 23 Lhuntse 2,143 380 4,687 12 Monggar 10,053 2,688 89 33 Paro 193,965 154,458 4,457 29 Pemagatshel 1,090 390 5 13 Punakha 631 282 9 33 Samdrupjongkhar 341 Thimphu 133,316 119,009 1,648 14 Trashigang 4,318 431 6 13 Trashiyangtse 875 477 9 20 Trongsa 127 30 1 40 Wangdue 3,416 2,282 36 16 Zhemgang 270 103 3 31 Total 395,372 315,875 15,086 48

38
Table 36: Mandarin total and bearing trees in numbers, production in MT and yield (kg/tree) Dzongkhag Trees Bearing Trees Production Yield(kg/Tree) Chukha 254,231 131,312 1,628 12 Dagana 376,124 232,614 6,507 28 Haa 1,738 1,277 20 16 Lhuntse 23,456 6,692 233 35 Monggar 92,364 36,604 1,504 41 Pemagatshel 537,474 297,364 4,006 13 Punakha 43,190 26,696 446 17 Samdrupjongkhar 272,601 123,852 3,371 27 Samtse 166,453 109,731 2,679 24 Sarpang 326,431 193,100 8,430 44 Trashigang 47,890 15,244 450 30 Trashiyangtse 33,512 9,691 433 45 Trongsa 9,684 2,856 112 39 Tsirang 245,345 158,889 8,750 55 Wangdue 28,805 19,390 312 16 Zhemgang 344,990 205,068 5,296 26 Total 2,804,287 1,570,380 44,177 28

39
Table 37: Mango total and bearing trees in numbers, production in MT and yield (kg/tree) Dzongkhag Trees Bearing Trees Production Yield(kg/Tree) Chukha 544 53 1 21 Dagana 3,443 838 50 60 Lhuntse 1,277 1,203 30 25 Monggar 7,716 2,922 49 17 Pemagatshel 3,090 1,190 44 37 Punakha 4,547 2,284 24 11 Samdrupjongkhar 3,302 625 14 22 Samtse 2,173 557 25 45 Sarpang 8,002 1,105 31 28 Trashigang 2,971 755 5 7 Trashiyangtse 479 43 0 8 Trongsa 90 53 0 9 Tsirang 2,394 774 30 39 Wangdue 1,467 637 4 6 Zhemgang 2,606 238 7 29 Total 44,101 13,279 315 24

40
Table 38: Pear total and bearing trees in numbers, production in MT and yield (kg/tree) Dzongkhag Trees Bearing Trees Production Yield(kg/Tree) Bumthang 183 110 4 33 Chukha 636 468 19 40 Dagana 1,731 1,311 197 150 Gasa 164 80 2 30 Haa 95 54 1 15 Lhuntse 2,232 1,192 51 43 Monggar 4,749 1,864 89 48 Paro 1,450 784 21 27 Pemagatshel 419 245 11 47 Punakha 3,737 2,264 52 23 Samdrupjongkhar 2,567 1,245 50 40 Samtse 1,590 1,062 43 40 Sarpang 1,350 933 95 101 Thimphu 153 123 4 31 Trashigang 4,832 1,844 59 32 Trashiyangtse 519 329 15 45 Trongsa 267 156 11 69 Tsirang 3,662 2,131 348 163 Wangdue 2,023 1,095 37 34 Zhemgang 114 44 1 22 Total 32,472 17,334 1,109 64
41
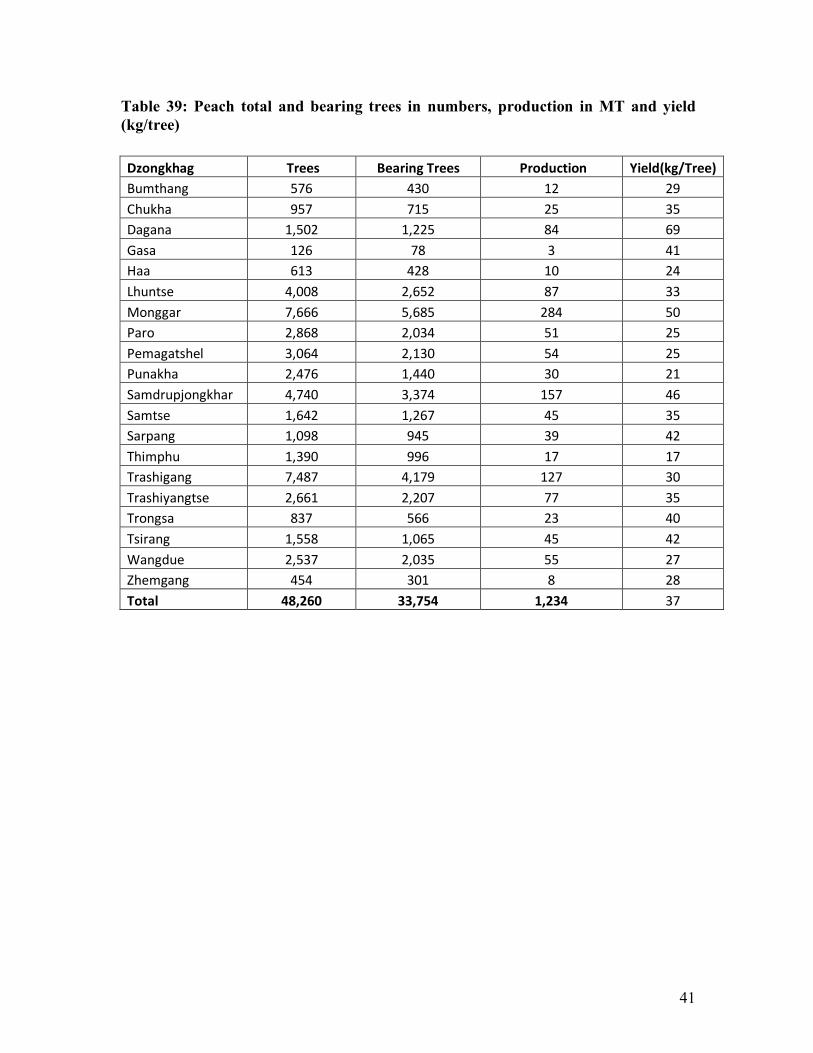
Table 39: Peach total and bearing trees in numbers, production in MT and yield (kg/tree) Dzongkhag Trees Bearing Trees Production Yield(kg/Tree) Bumthang 576 430 12 29 Chukha 957 715 25 35 Dagana 1,502 1,225 84 69 Gasa 126 78 3 41 Haa 613 428 10 24 Lhuntse 4,008 2,652 87 33 Monggar 7,666 5,685 284 50 Paro 2,868 2,034 51 25 Pemagatshel 3,064 2,130 54 25 Punakha 2,476 1,440 30 21 Samdrupjongkhar 4,740 3,374 157 46 Samtse 1,642 1,267 45 35 Sarpang 1,098 945 39 42 Thimphu 1,390 996 17 17 Trashigang 7,487 4,179 127 30 Trashiyangtse 2,661 2,207 77 35 Trongsa 837 566 23 40 Tsirang 1,558 1,065 45 42 Wangdue 2,537 2,035 55 27 Zhemgang 454 301 8 28 Total 48,260 33,754 1,234 37

42
Table 40: Plum total and bearing trees in numbers, production in MT and yield (kg/tree) Dzongkhag Trees Bearing Trees Production Yield(kg/Tree) Bumthang 283 170 7 44 Chukha 67 27 1 27 Dagana 734 535 27 50 Haa 74 67 2 28 Lhuntse 1,782 1,254 53 42 Monggar 2,983 1,871 93 50 Paro 304 227 6 27 Pemagatshel 1,248 958 31 33 Punakha 1,160 738 18 24 Samdrupjongkhar 886 513 20 39 Samtse 287 273 8 28 Sarpang 300 276 6 23 Thimphu 1,413 1,297 10 8 Trashigang 4,057 1,813 63 35 Trashiyangtse 422 294 20 69 Trongsa 379 265 12 46 Tsirang 1,381 948 29 31 Wangdue 651 533 21 40 Zhemgang 251 176 6 36 Total 18,663 12,236 434 36
43
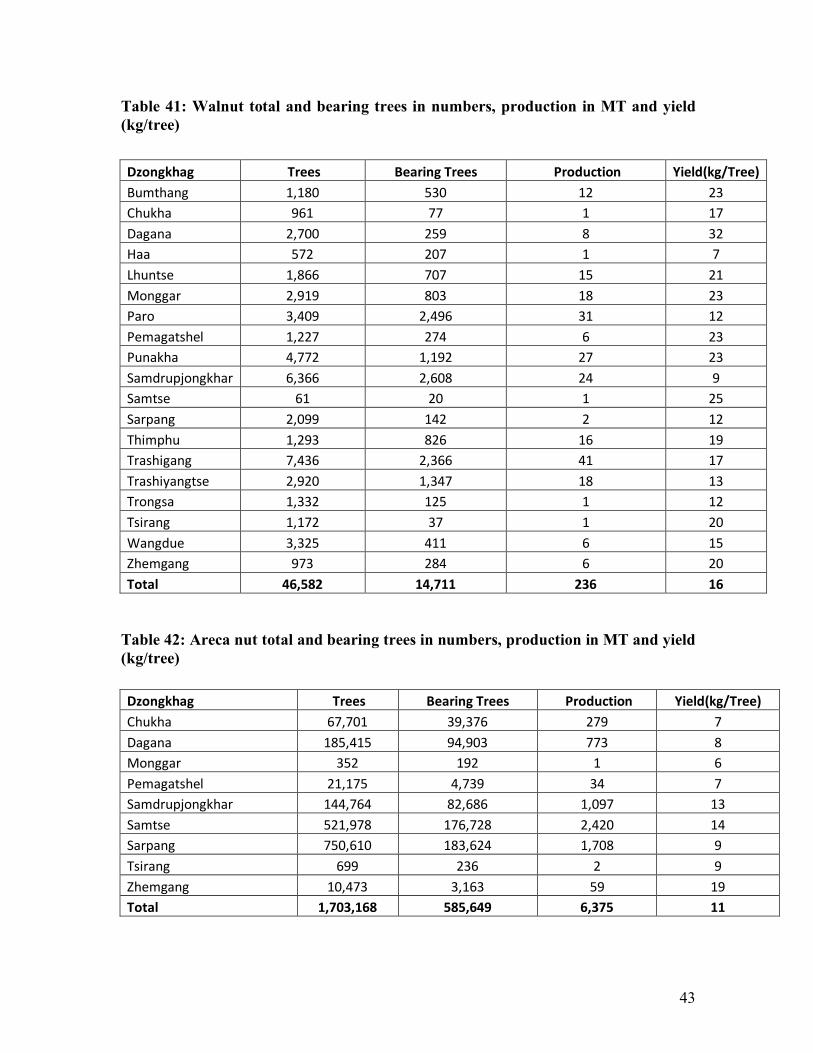
Table 41: Walnut total and bearing trees in numbers, production in MT and yield (kg/tree) Dzongkhag Trees Bearing Trees Production Yield(kg/Tree) Bumthang 1,180 530 12 23 Chukha 961 77 1 17 Dagana 2,700 259 8 32 Haa 572 207 1 7 Lhuntse 1,866 707 15 21 Monggar 2,919 803 18 23 Paro 3,409 2,496 31 12 Pemagatshel 1,227 274 6 23 Punakha 4,772 1,192 27 23 Samdrupjongkhar 6,366 2,608 24 9 Samtse 61 20 1 25 Sarpang 2,099 142 2 12 Thimphu 1,293 826 16 19 Trashigang 7,436 2,366 41 17 Trashiyangtse 2,920 1,347 18 13 Trongsa 1,332 125 1 12 Tsirang 1,172 37 1 20 Wangdue 3,325 411 6 15 Zhemgang 973 284 6 20 Total 46,582 14,711 236 16
Table 42: Areca nut total and bearing trees in numbers, production in MT and yield (kg/tree) Dzongkhag Trees Bearing Trees Production Yield(kg/Tree) Chukha 67,701 39,376 279 7 Dagana 185,415 94,903 773 8 Monggar 352 192 1 6 Pemagatshel 21,175 4,739 34 7 Samdrupjongkhar 144,764 82,686 1,097 13 Samtse 521,978 176,728 2,420 14 Sarpang 750,610 183,624 1,708 9 Tsirang 699 236 2 9 Zhemgang 10,473 3,163 59 19 Total 1,703,168 585,649 6,375 11
44
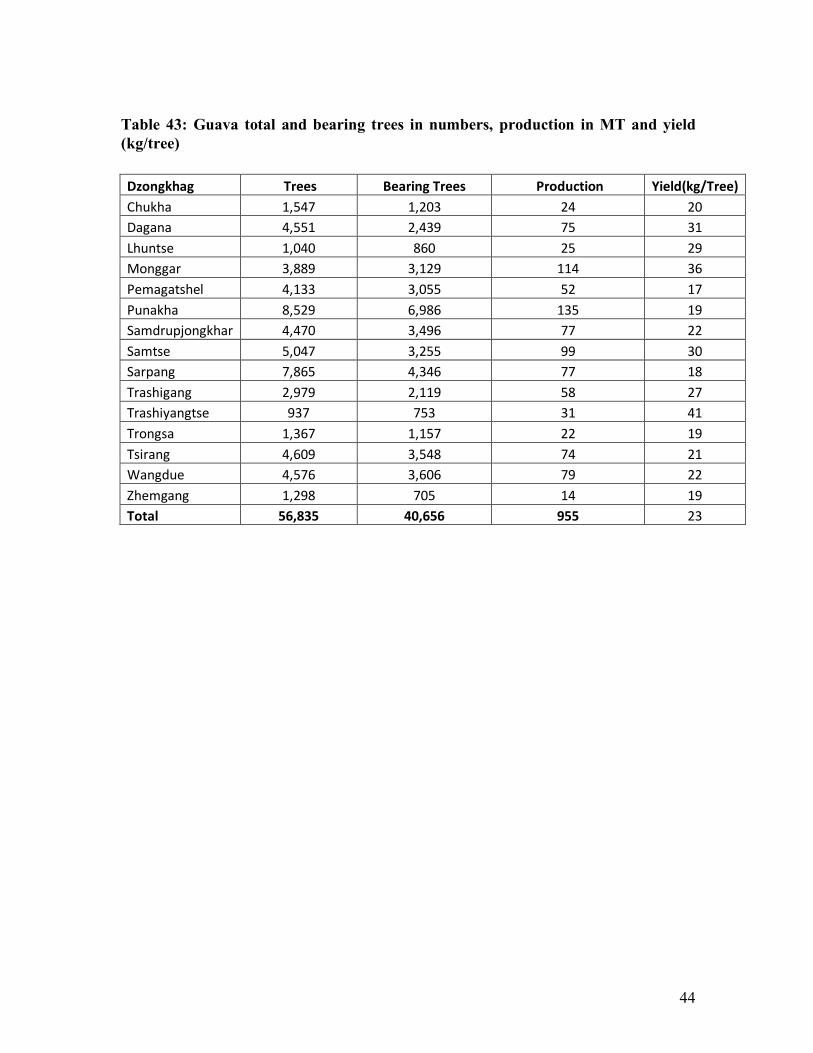
Table 43: Guava total and bearing trees in numbers, production in MT and yield (kg/tree) Dzongkhag Trees Bearing Trees Production Yield(kg/Tree) Chukha 1,547 1,203 24 20 Dagana 4,551 2,439 75 31 Lhuntse 1,040 860 25 29 Monggar 3,889 3,129 114 36 Pemagatshel 4,133 3,055 52 17 Punakha 8,529 6,986 135 19 Samdrupjongkhar 4,470 3,496 77 22 Samtse 5,047 3,255 99 30 Sarpang 7,865 4,346 77 18 Trashigang 2,979 2,119 58 27 Trashiyangtse 937 753 31 41 Trongsa 1,367 1,157 22 19 Tsirang 4,609 3,548 74 21 Wangdue 4,576 3,606 79 22 Zhemgang 1,298 705 14 19 Total 56,835 40,656 955 23

45
Table 44: Persimmon total and bearing trees in numbers, production in MT and yield (kg/tree) Dzongkhag Trees Bearing Trees Production Yield(kg/Tree) Dagana 92 40 1 29 Gasa 13 7 0 8 Haa 35 35 0 4 Lhuntse 100 7 0 43 Monggar 708 254 8 30 Paro 413 323 11 33 Pemagatshel 50 Punakha 2,026 1,602 45 28 Samdrupjongkhar 83 60 2 33 Samtse 60 60 3 55 Thimphu 7 3 0 30 Trashigang 541 308 14 45 Trashiyangtse 280 250 9 35 Trongsa 41 31 1 33 Tsirang 7 3 0 3 Wangdue 2,167 1,606 71 44 Zhemgang 30 20 1 30 Total 6,653 4,610 166 36

46
Table 45: Banana total and bearing trees in numbers, production in MT and yield (kg/tree) Dzongkhag Trees Bearing Trees Production Yield(kg/Tree) Chukha 23,253 8,130 69 8 Dagana 34,897 16,914 254 15 Haa 1,186 470 6 12 Lhuntse 9,473 1,864 24 13 Monggar 19,401 6,533 77 12 Pemagatshel 50,070 8,354 104 13 Punakha 9,310 2,994 35 12 Samdrupjongkhar 27,842 12,225 162 13 Samtse 135,678 36,399 460 13 Sarpang 130,038 38,761 588 15 Trashigang 52,028 4,266 36 8 Trashiyangtse 13,594 3,137 24 8 Trongsa 617 283 2 9 Tsirang 59,868 16,863 259 15 Wangdue 22,088 5,750 42 7 Zhemgang 5,434 2,812 39 14 Total 594,775 165,756 2,183 13
47
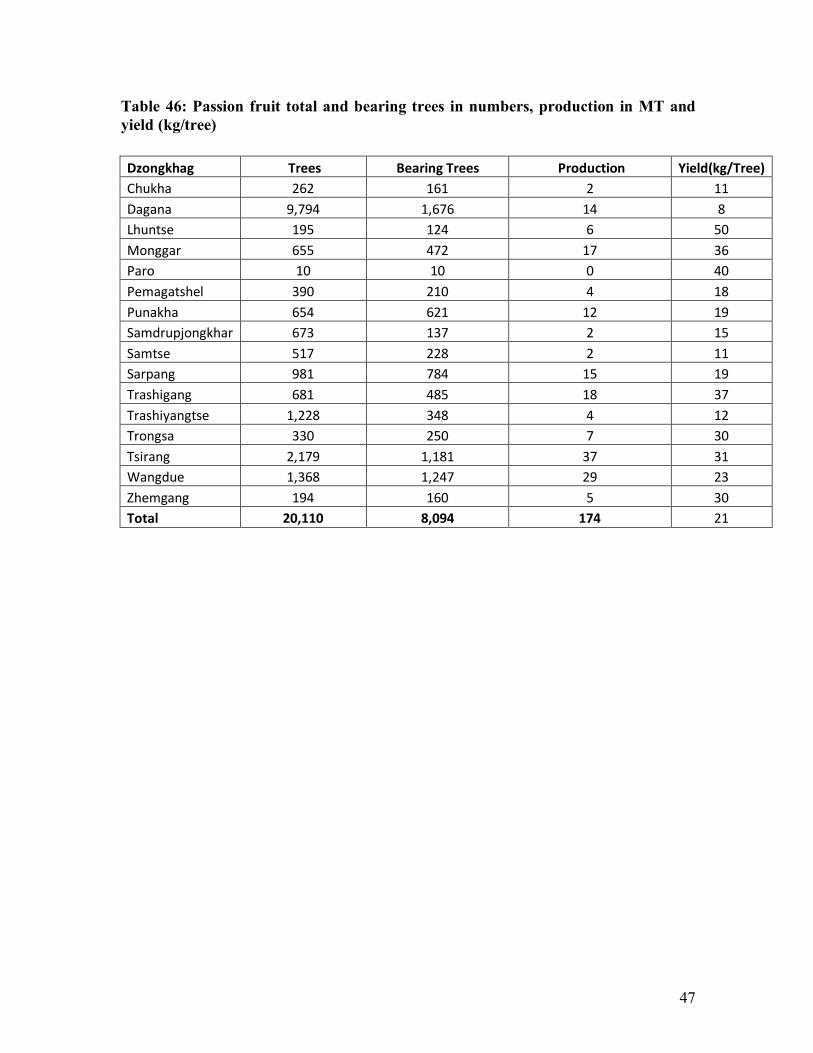
Table 46: Passion fruit total and bearing trees in numbers, production in MT and yield (kg/tree) Dzongkhag Trees Bearing Trees Production Yield(kg/Tree) Chukha 262 161 2 11 Dagana 9,794 1,676 14 8 Lhuntse 195 124 6 50 Monggar 655 472 17 36 Paro 10 10 0 40 Pemagatshel 390 210 4 18 Punakha 654 621 12 19 Samdrupjongkhar 673 137 2 15 Samtse 517 228 2 11 Sarpang 981 784 15 19 Trashigang 681 485 18 37 Trashiyangtse 1,228 348 4 12 Trongsa 330 250 7 30 Tsirang 2,179 1,181 37 31 Wangdue 1,368 1,247 29 23 Zhemgang 194 160 5 30 Total 20,110 8,094 174 21
48
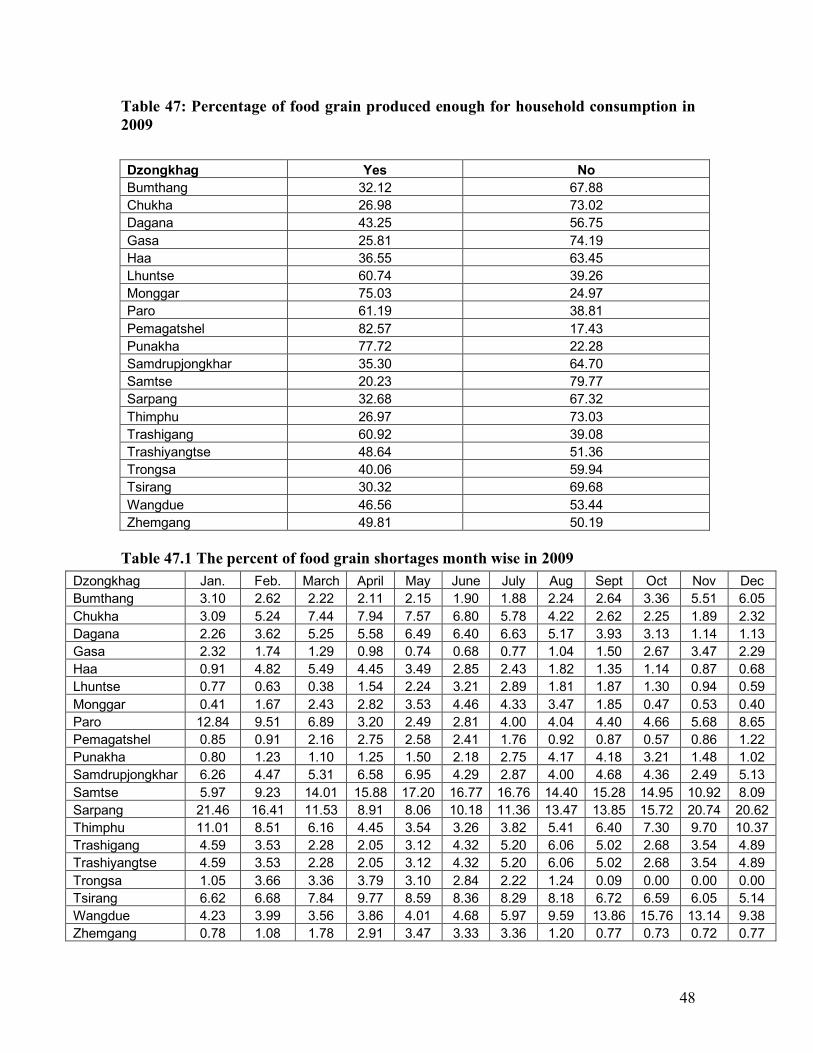
Table 47: Percentage of food grain produced enough for household consumption in 2009 Dzongkhag Yes No Bumthang 32.12 67.88 Chukha 26.98 73.02 Dagana 43.25 56.75 Gasa 25.81 74.19 Haa 36.55 63.45 Lhuntse 60.74 39.26 Monggar 75.03 24.97 Paro 61.19 38.81 Pemagatshel 82.57 17.43 Punakha 77.72 22.28 Samdrupjongkhar 35.30 64.70 Samtse 20.23 79.77 Sarpang 32.68 67.32 Thimphu 26.97 73.03 Trashigang 60.92 39.08 Trashiyangtse 48.64 51.36 Trongsa 40.06 59.94 Tsirang 30.32 69.68 Wangdue 46.56 53.44 Zhemgang 49.81 50.19
Table 47.1 The percent of food grain shortages month wise in 2009
Dzongkhag Jan. Feb. March April May June July Aug Sept Oct Nov Dec Bumthang 3.10 2.62 2.22 2.11 2.15 1.90 1.88 2.24 2.64 3.36 5.51 6.05 Chukha 3.09 5.24 7.44 7.94 7.57 6.80 5.78 4.22 2.62 2.25 1.89 2.32 Dagana 2.26 3.62 5.25 5.58 6.49 6.40 6.63 5.17 3.93 3.13 1.14 1.13 Gasa 2.32 1.74 1.29 0.98 0.74 0.68 0.77 1.04 1.50 2.67 3.47 2.29 Haa 0.91 4.82 5.49 4.45 3.49 2.85 2.43 1.82 1.35 1.14 0.87 0.68 Lhuntse 0.77 0.63 0.38 1.54 2.24 3.21 2.89 1.81 1.87 1.30 0.94 0.59 Monggar 0.41 1.67 2.43 2.82 3.53 4.46 4.33 3.47 1.85 0.47 0.53 0.40 Paro 12.84 9.51 6.89 3.20 2.49 2.81 4.00 4.04 4.40 4.66 5.68 8.65 Pemagatshel 0.85 0.91 2.16 2.75 2.58 2.41 1.76 0.92 0.87 0.57 0.86 1.22 Punakha 0.80 1.23 1.10 1.25 1.50 2.18 2.75 4.17 4.18 3.21 1.48 1.02 Samdrupjongkhar 6.26 4.47 5.31 6.58 6.95 4.29 2.87 4.00 4.68 4.36 2.49 5.13 Samtse 5.97 9.23 14.01 15.88 17.20 16.77 16.76 14.40 15.28 14.95 10.92 8.09 Sarpang 21.46 16.41 11.53 8.91 8.06 10.18 11.36 13.47 13.85 15.72 20.74 20.62 Thimphu 11.01 8.51 6.16 4.45 3.54 3.26 3.82 5.41 6.40 7.30 9.70 10.37 Trashigang 4.59 3.53 2.28 2.05 3.12 4.32 5.20 6.06 5.02 2.68 3.54 4.89 Trashiyangtse 4.59 3.53 2.28 2.05 3.12 4.32 5.20 6.06 5.02 2.68 3.54 4.89 Trongsa 1.05 3.66 3.36 3.79 3.10 2.84 2.22 1.24 0.09 0.00 0.00 0.00 Tsirang 6.62 6.68 7.84 9.77 8.59 8.36 8.29 8.18 6.72 6.59 6.05 5.14 Wangdue 4.23 3.99 3.56 3.86 4.01 4.68 5.97 9.59 13.86 15.76 13.14 9.38 Zhemgang 0.78 1.08 1.78 2.91 3.47 3.33 3.36 1.20 0.77 0.73 0.72 0.77
49
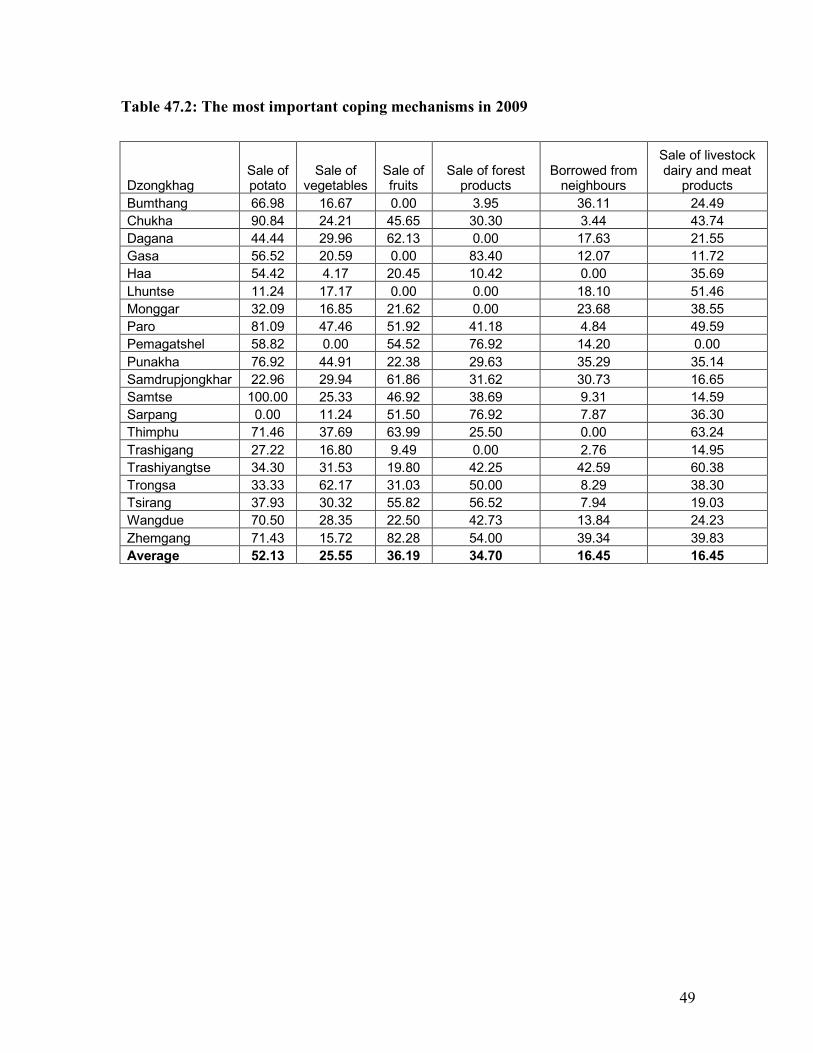
Table 47.2: The most important coping mechanisms in 2009
Dzongkhag Sale of potato
Sale of vegetables
Sale of fruits
Sale of forest products
Borrowed from neighbours
Sale of livestock dairy and meat
products Bumthang 66.98 16.67 0.00 3.95 36.11 24.49 Chukha 90.84 24.21 45.65 30.30 3.44 43.74 Dagana 44.44 29.96 62.13 0.00 17.63 21.55 Gasa 56.52 20.59 0.00 83.40 12.07 11.72 Haa 54.42 4.17 20.45 10.42 0.00 35.69 Lhuntse 11.24 17.17 0.00 0.00 18.10 51.46 Monggar 32.09 16.85 21.62 0.00 23.68 38.55 Paro 81.09 47.46 51.92 41.18 4.84 49.59 Pemagatshel 58.82 0.00 54.52 76.92 14.20 0.00 Punakha 76.92 44.91 22.38 29.63 35.29 35.14 Samdrupjongkhar 22.96 29.94 61.86 31.62 30.73 16.65 Samtse 100.00 25.33 46.92 38.69 9.31 14.59 Sarpang 0.00 11.24 51.50 76.92 7.87 36.30 Thimphu 71.46 37.69 63.99 25.50 0.00 63.24 Trashigang 27.22 16.80 9.49 0.00 2.76 14.95 Trashiyangtse 34.30 31.53 19.80 42.25 42.59 60.38 Trongsa 33.33 62.17 31.03 50.00 8.29 38.30 Tsirang 37.93 30.32 55.82 56.52 7.94 19.03 Wangdue 70.50 28.35 22.50 42.73 13.84 24.23 Zhemgang 71.43 15.72 82.28 54.00 39.34 39.83 Average 52.13 25.55 36.19 34.70 16.45 16.45
50
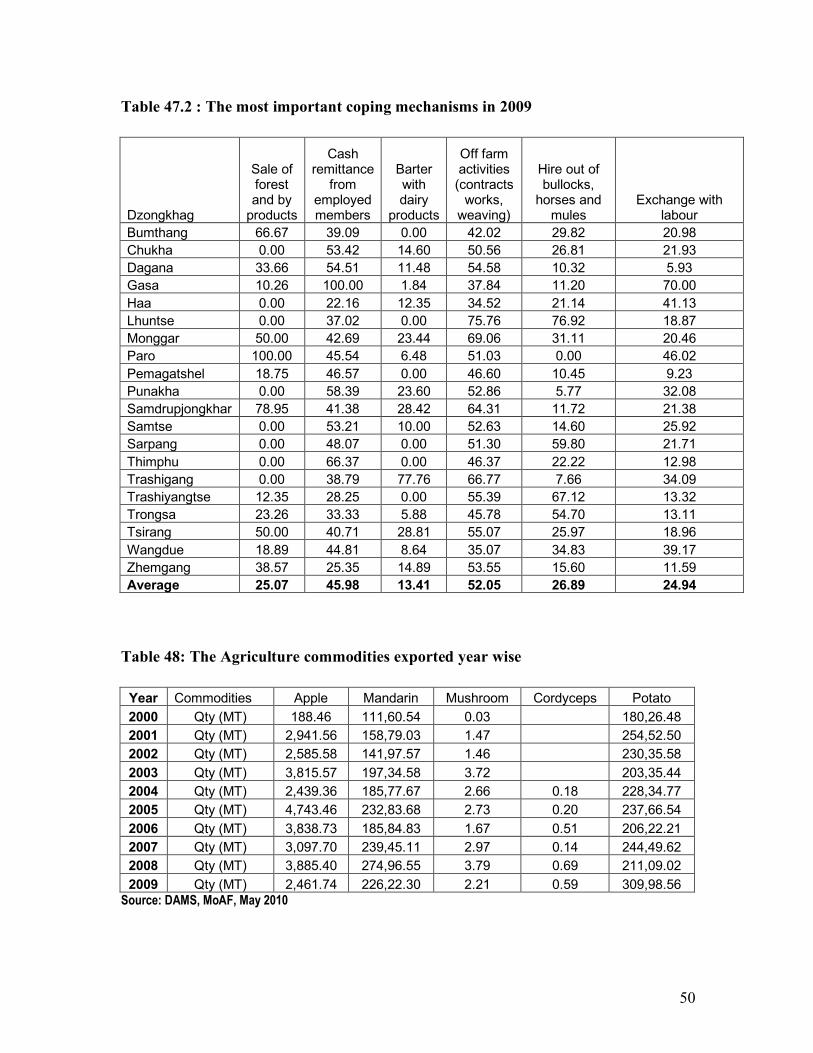
Table 47.2 : The most important coping mechanisms in 2009
Dzongkhag
Sale of forest and by
products
Cash remittance
from employed members
Barter with dairy
products
Off farm activities
(contracts works,
weaving)
Hire out of bullocks,
horses and mules
Exchange with labour
Bumthang 66.67 39.09 0.00 42.02 29.82 20.98 Chukha 0.00 53.42 14.60 50.56 26.81 21.93 Dagana 33.66 54.51 11.48 54.58 10.32 5.93 Gasa 10.26 100.00 1.84 37.84 11.20 70.00 Haa 0.00 22.16 12.35 34.52 21.14 41.13 Lhuntse 0.00 37.02 0.00 75.76 76.92 18.87 Monggar 50.00 42.69 23.44 69.06 31.11 20.46 Paro 100.00 45.54 6.48 51.03 0.00 46.02 Pemagatshel 18.75 46.57 0.00 46.60 10.45 9.23 Punakha 0.00 58.39 23.60 52.86 5.77 32.08 Samdrupjongkhar 78.95 41.38 28.42 64.31 11.72 21.38 Samtse 0.00 53.21 10.00 52.63 14.60 25.92 Sarpang 0.00 48.07 0.00 51.30 59.80 21.71 Thimphu 0.00 66.37 0.00 46.37 22.22 12.98 Trashigang 0.00 38.79 77.76 66.77 7.66 34.09 Trashiyangtse 12.35 28.25 0.00 55.39 67.12 13.32 Trongsa 23.26 33.33 5.88 45.78 54.70 13.11 Tsirang 50.00 40.71 28.81 55.07 25.97 18.96 Wangdue 18.89 44.81 8.64 35.07 34.83 39.17 Zhemgang 38.57 25.35 14.89 53.55 15.60 11.59 Average 25.07 45.98 13.41 52.05 26.89 24.94
Table 48: The Agriculture commodities exported year wise
Year Commodities Apple Mandarin Mushroom Cordyceps Potato 2000 Qty (MT) 188.46 111,60.54 0.03 180,26.48 2001 Qty (MT) 2,941.56 158,79.03 1.47 254,52.50 2002 Qty (MT) 2,585.58 141,97.57 1.46 230,35.58 2003 Qty (MT) 3,815.57 197,34.58 3.72 203,35.44 2004 Qty (MT) 2,439.36 185,77.67 2.66 0.18 228,34.77 2005 Qty (MT) 4,743.46 232,83.68 2.73 0.20 237,66.54 2006 Qty (MT) 3,838.73 185,84.83 1.67 0.51 206,22.21 2007 Qty (MT) 3,097.70 239,45.11 2.97 0.14 244,49.62 2008 Qty (MT) 3,885.40 274,96.55 3.79 0.69 211,09.02 2009 Qty (MT) 2,461.74 226,22.30 2.21 0.59 309,98.56
Source: DAMS, MoAF, May 2010
51
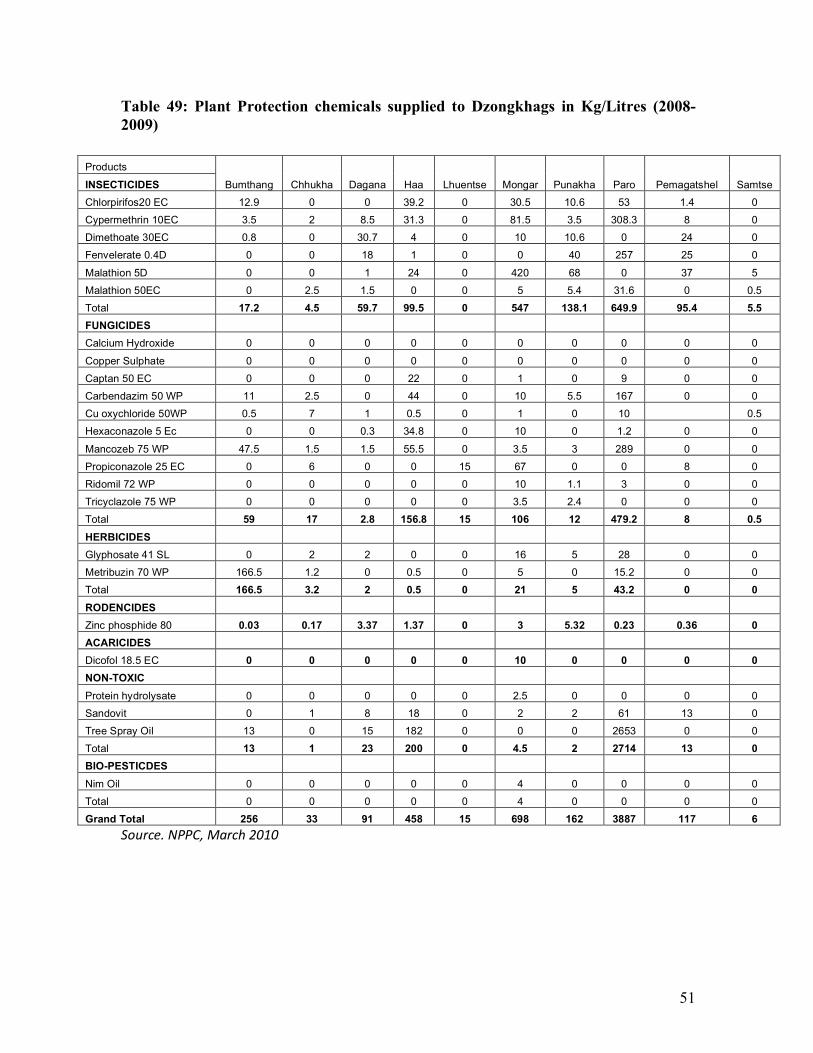
Table 49: Plant Protection chemicals supplied to Dzongkhags in Kg/Litres (2008-2009)
Products
Bumthang Chhukha Dagana Haa Lhuentse Mongar Punakha Paro Pemagatshel Samtse INSECTICIDES Chlorpirifos20 EC 12.9 0 0 39.2 0 30.5 10.6 53 1.4 0 Cypermethrin 10EC 3.5 2 8.5 31.3 0 81.5 3.5 308.3 8 0 Dimethoate 30EC 0.8 0 30.7 4 0 10 10.6 0 24 0 Fenvelerate 0.4D 0 0 18 1 0 0 40 257 25 0 Malathion 5D 0 0 1 24 0 420 68 0 37 5 Malathion 50EC 0 2.5 1.5 0 0 5 5.4 31.6 0 0.5 Total 17.2 4.5 59.7 99.5 0 547 138.1 649.9 95.4 5.5 FUNGICIDES Calcium Hydroxide 0 0 0 0 0 0 0 0 0 0 Copper Sulphate 0 0 0 0 0 0 0 0 0 0 Captan 50 EC 0 0 0 22 0 1 0 9 0 0 Carbendazim 50 WP 11 2.5 0 44 0 10 5.5 167 0 0 Cu oxychloride 50WP 0.5 7 1 0.5 0 1 0 10 0.5 Hexaconazole 5 Ec 0 0 0.3 34.8 0 10 0 1.2 0 0 Mancozeb 75 WP 47.5 1.5 1.5 55.5 0 3.5 3 289 0 0 Propiconazole 25 EC 0 6 0 0 15 67 0 0 8 0 Ridomil 72 WP 0 0 0 0 0 10 1.1 3 0 0 Tricyclazole 75 WP 0 0 0 0 0 3.5 2.4 0 0 0 Total 59 17 2.8 156.8 15 106 12 479.2 8 0.5 HERBICIDES Glyphosate 41 SL 0 2 2 0 0 16 5 28 0 0 Metribuzin 70 WP 166.5 1.2 0 0.5 0 5 0 15.2 0 0 Total 166.5 3.2 2 0.5 0 21 5 43.2 0 0 RODENCIDES Zinc phosphide 80 0.03 0.17 3.37 1.37 0 3 5.32 0.23 0.36 0 ACARICIDES Dicofol 18.5 EC 0 0 0 0 0 10 0 0 0 0 NON-TOXIC Protein hydrolysate 0 0 0 0 0 2.5 0 0 0 0 Sandovit 0 1 8 18 0 2 2 61 13 0 Tree Spray Oil 13 0 15 182 0 0 0 2653 0 0 Total 13 1 23 200 0 4.5 2 2714 13 0 BIO-PESTICDES Nim Oil 0 0 0 0 0 4 0 0 0 0 Total 0 0 0 0 0 4 0 0 0 0 Grand Total 256 33 91 458 15 698 162 3887 117 6
Source. NPPC, March 2010

52
Table 49.1 : Plant Protection chemicals supplied to Dzongkhags in Kg/Litres (2008-2009)
Products Samdrup jongkhar Sarpang Tsirang Trongsa Trashigang
Trashi Yangtse Thimphu Wangdue Zhemgang INSECTICIDES
Chlorpirifos20 EC 0 0 0 1.5 6 14 72.7 11.7 2 Cypermethrin 10EC 40 32 26.9 1.3 8 29.7 374 18.5 3.5 Dimethoate 30EC 0 44 33.3 0.1 5.1 12.6 125.2 27 2.5 Fenvelerate 0.4D 36 0 3 30 110 2 667 6 130 Malathion 5D 0 0 2 125 25 34 73 16 0 Malathion 50EC 1 5 7.8 0 5 0.3 70.5 9 1 Total 77 81 73 157.9 159.1 92.6 1382.4 88.2 139 FUNGICIDES Calcium Hydroxide 0 0 0 0 0 0 14 0 0 Copper Sulphate 0 0 0 0 0 0 14 0 0 Captan 50 EC 0 0 0.5 0 0 5 79 0 0 Carbendazim 50 WP 0 5 17 2.5 0 0 357 10 0 Cu oxychloride 50WP 7 0.5 3.5 2.5 6.5 1 76 16.5 5 Hexaconazole 5 Ec 0 0 0 0 0 0.3 31.3 0 0 Mancozeb 75 WP 0 5 29.5 2.5 100 18 570 148 0 Propiconazole 25 EC 0 0 0 0 28 12 0 2 0 Ridomil 72 WP 0 1 0.9 0.3 0 0.5 38.8 181 0 Tricyclazole 75 WP 0 2 7.6 0 0 0 1.3 2 1 Total 7 13.5 59 7.8 134.5 36.8 1181.4 359.5 6 HERBICIDES Glyphosate 41 SL 0 20 0 36 0 5 62 1629 2 Metribuzin 70 WP 0 0 0.2 21.5 0 0.4 49.3 623 Total 0 20 0.2 57.5 0 5.4 111.3 2252 2 RODENCIDES Zinc phosphide 80 1.7 0.68 2.67 3 10.15 3.45 5.87 8.02 2 ACARICIDES Dicofol 18.5 EC 0 0 0.4 0 0 0 0 0 0 NON-TOXIC Protein hydrolysate 4 0 0 0 0 0 3.5 1 0 Sandovit 5 11 9 0 15 0 163 32 Tree Spray Oil 0 0 0 0 0 0 4795 0 0 Total 9 11 9 0 15 0 4961.5 33 0 BIO-PESTICDES Nim Oil 0 0 0 0 0 6 11 Total 0 0 0 0 0 6 11 Grand Total 95 126 144 226 319 138 7642 2752 149
Source. NPPC, March 2010

53
Table 50: Quantity of chemical fertilizers distributed to the Dzongkhags during the year 2009
Sl. No Dzongkhag Urea (Kg)
Suphala(Kg) SSP(Kg)
B/Meal(Kg)
MOP(Kg)
Borax(Kg)
DAP(Kg)
R/Phosphate(Kg)
Butachlor(Kg)
1 Bumthang 179,850 52,450 315,500 2 Chukha 36,860 103,020 3,000 2,800 2,000 5 100 5,920 3 Dagana 7,750 3,050 150 2,940 4 Gasa 5 Haa 11,000 24,000 1,100 6 Lhuntse 43,000 13,200 7 Monggar 123,500 10,500 500 750 3,070 8 Paro 133,380 125,210 5,000 200 93,220 9 Pemagatshel 56,800 32,800
10 Punakha 96,500 68,100 5,500 400 39,100
11 Samdrup Jongkhar 5,400
12 Samtse 4,000 3,100 3,400 1,100 3,810 13 Sarpang 6,200 3,000 300 9,350 14 Thimphu 85,650 105,850 46,750 3,500 11,000 300 500 21,750 15 Trashigang 419,500 132,550 56,600 16,550 16 Trashiyangtse 108,550 3,850 33,720 17 Trongsa 4,600 6,100 13,300 18 Tsirang 8,700 7,000 500 500 5,350
19 Wangdue Phodrang 145,490 339,970 57,100 150 1,000 64,500
20 Zhemgang 2,250 3,400 1,900 2,300 TOTAL 1,478,980 1,023,950 495,750 8,550 15,100 505 100 500 329,180
Source: DSC, Paro, March 2010

54
Table 51: RNR infrastructure inventories as of December 2009
Dzongkhag Nos. of Geogs
RNR Centre (Nos.)
AEC (Nos)
Technology park (Nos.)
Bumthang 4 4 1 2 Chukha 11 6 5 6 Dagana 14 8 2 4 Gasa 4 2 1 Haa 6 3 2 3 Lhuntse 8 8 4 Mongar 17 16 1 5 Paro 10 7 2 1 Pemagatshel 11 10 2 0 Punakha 11 9 2 1 Samdrupjongkhar 11 6 3 0 Samtse 15 7 2 2 Sarpang 12 6 5 1 Thimphu 8 5 1 0 Trashigang 15 13 2 4 Trashiyangtse 8 8 1 3 Trongsa 5 5 3 Tsirang 12 7 7 2 Wangdue 15 8 3 8 Zhemgang 8 8 5 1 Total 205 146 47 50
Source: Dzongkhag Agriculture Sector, June 2010

55
Table 52: Total irrigation schemes and length (KM) as of June 2010 Dzongkhag Numbers of Irrigation schemes Total length (KM) Bumthang 13 16.13 Chhukha 58 140.53 Dagana 55 114.77 Gasa 15 28.69 Ha 13 31.18 Lhuentse 63 268.80 Mongar 63 125.33 Paro 38 90.13 Pemagatshel 11 18.05 Punakha 114 382.38 Samdrup Jongkhar 41 100.54 Samtse 20 56.85 Sarpang 259 385.06 Thimphu 35 110.30 Trashi Yangtse 32 96.80 Trashigang 61 145.55 Trongsa 83 240.90 Tsirang 178 359.53 Wangdue 114 493.77 Zhemgang 41 87.13 Total 1307 3292.42
Source: Dzongkhag Agriculture Sector, June 2010
56
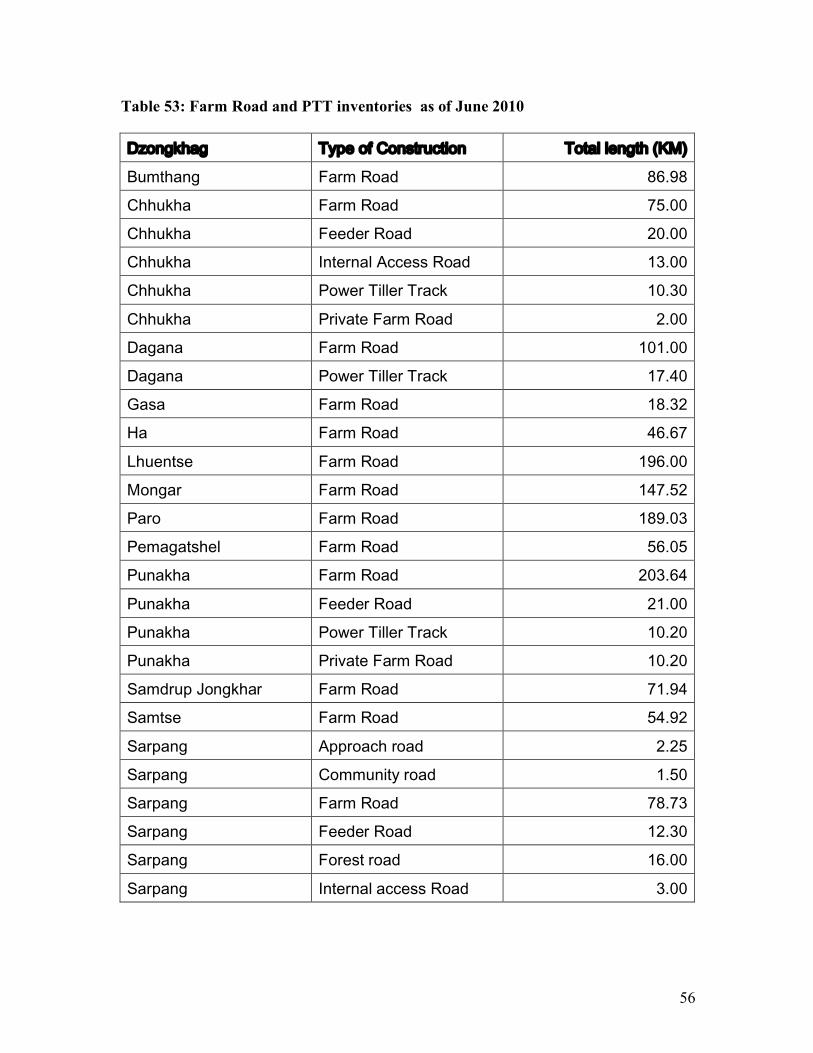
Table 53: Farm Road and PTT inventories as of June 2010
Dzongkhag Type of Construction Total length (KM)
Bumthang Farm Road 86.98
Chhukha Farm Road 75.00
Chhukha Feeder Road 20.00
Chhukha Internal Access Road 13.00
Chhukha Power Tiller Track 10.30
Chhukha Private Farm Road 2.00
Dagana Farm Road 101.00
Dagana Power Tiller Track 17.40
Gasa Farm Road 18.32
Ha Farm Road 46.67
Lhuentse Farm Road 196.00
Mongar Farm Road 147.52
Paro Farm Road 189.03
Pemagatshel Farm Road 56.05
Punakha Farm Road 203.64
Punakha Feeder Road 21.00
Punakha Power Tiller Track 10.20
Punakha Private Farm Road 10.20
Samdrup Jongkhar Farm Road 71.94
Samtse Farm Road 54.92
Sarpang Approach road 2.25
Sarpang Community road 1.50
Sarpang Farm Road 78.73
Sarpang Feeder Road 12.30
Sarpang Forest road 16.00
Sarpang Internal access Road 3.00

57
Dzongkhag Type of Construction Total length (KM)
Thimphu Farm Road 30.93
Thimphu Power Tiller Track 5.00
Trashigang Farm Road 159.10
Trashiyangtse Farm Road 41.73
Trashiyangtse Feeder Road 23.50
Trashiyangtse Power Tiller Track 14.00
Trongsa Farm Road 72.09
Trongsa Internal Access Road 30.00
Trongsa Power Tiller Track 24.00
Tsirang Farm Road 29.10
Tsirang Power Tiller Track 37.80
Wangdue Approach road 4.40
Wangdue Farm Road 83.75
Wangdue Feeder road 56.50
Wangdue Power Tiller Track 18.50
Zhemgang Farm Road 108.02
Zhemgang Power Tiller Track 14.00 Source: Dzongkhag Agriculture Sector, June 2010