table 4.1.1: stock and flow of liver transplantation, 1993-2005 year 93949596*979899000102**030405...
TRANSCRIPT

Table 4.1.1: Stock and Flow of Liver Transplantation, 1993-2005
Year 93 94 95 96 *97 98 99 00 01 02 **03 04 05
New transplant patients 1 1 8 13 3 2 8 3 5 10 5 16 5
Deaths 0 0 3 4 1 0 4 1 2 5 1 4 4
Re-transplant 0 0 0 0 0 0 0 0 0 0 0 0 0
Lost to follow up 0 0 0 0 0 0 0 1 0 1 0 1 1
Functioning graft at 31st December 1 2 7 16 17 19 23 24 27 31 34 45 45
* 1 patient who was alive until 05/12/1997 is recorded died with missing date of death** 1 patient who had transplanted in 2003 is recorded as death with missing date of death
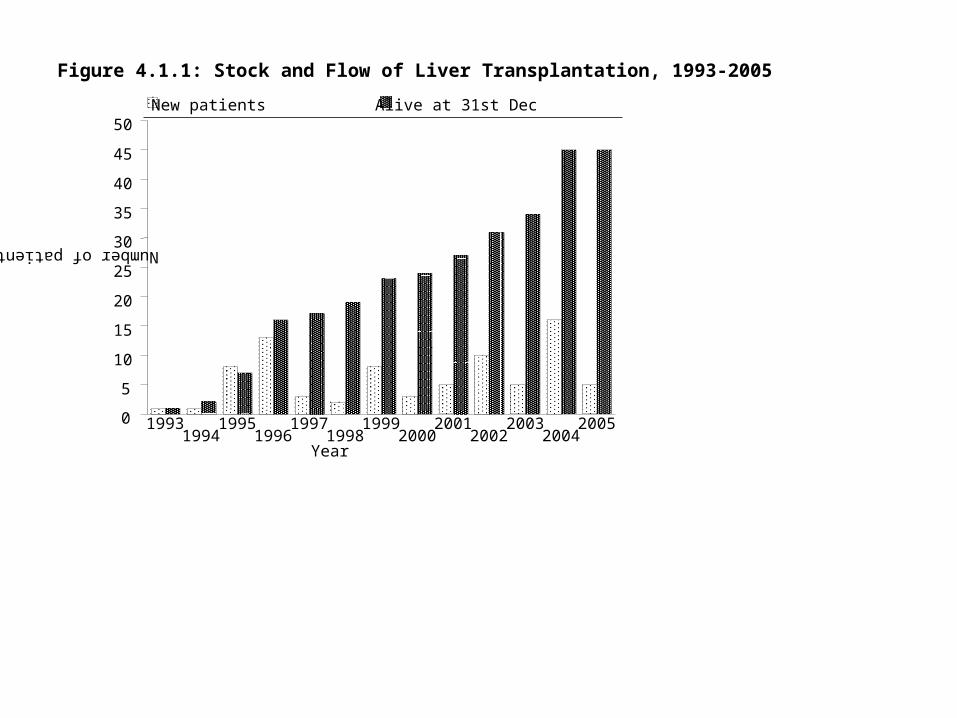
Figure 4.1.1: Stock and Flow of Liver Transplantation, 1993-2005
Number of patientsYear
0
5
10
15
20
25
30
35
40
45
50 New patients Alive at 31st Dec
19931994
19951996
19971998
19992000
20012002
20032004
2005

Table 4.1.2: Place of Transplant, 1993-2005
Year 93 94 95 96 97 98 99 00 01 02 03 04 05 TOTAL
No. No. No. No. No. No. No. No. No. No. No. No. No. No.
Local 0 0 8 10 1 1 8 3 5 9 2 14 5 66
Overseas 1 1 0 3 2 1 0 0 0 1 3 2 0 14
TOTAL 1 1 8 13 3 2 8 3 5 10 5 16 5 80

Table 4.1.3: Centres for Liver transplantation, 1993-2005
Year 93 94 95 96 97 98 99 00 01 02 03 04 05 TOTAL
Centre No. No. No. No. No. No. No. No. No. No. No. No. No. No.
Subang Jaya Medical Centre 0 0 8 10 1 1 8 3 5 6 2 7 0 51
Hospital Selayang 0 0 0 0 0 0 0 0 0 3 0 7 5 15
Australia 1 0 0 3 1 0 0 0 0 0 0 0 0 5
National University Hospital, Singapore
0 0 0 0 1 1 0 0 0 0 0 0 0 2
Kings College Hospital, UK 0 1 0 0 0 0 0 0 0 0 0 0 0 1
Tianjin, China 0 0 0 0 0 0 0 0 0 0 1 1 0 2
Asian Centre for Liver Disease & Transplantation, Singapore
0 0 0 0 0 0 0 0 0 1 2 1 0* 4
TOTAL 1 1 8 13 3 2 8 3 5 10 5 16 5 80
* Data was not reported.
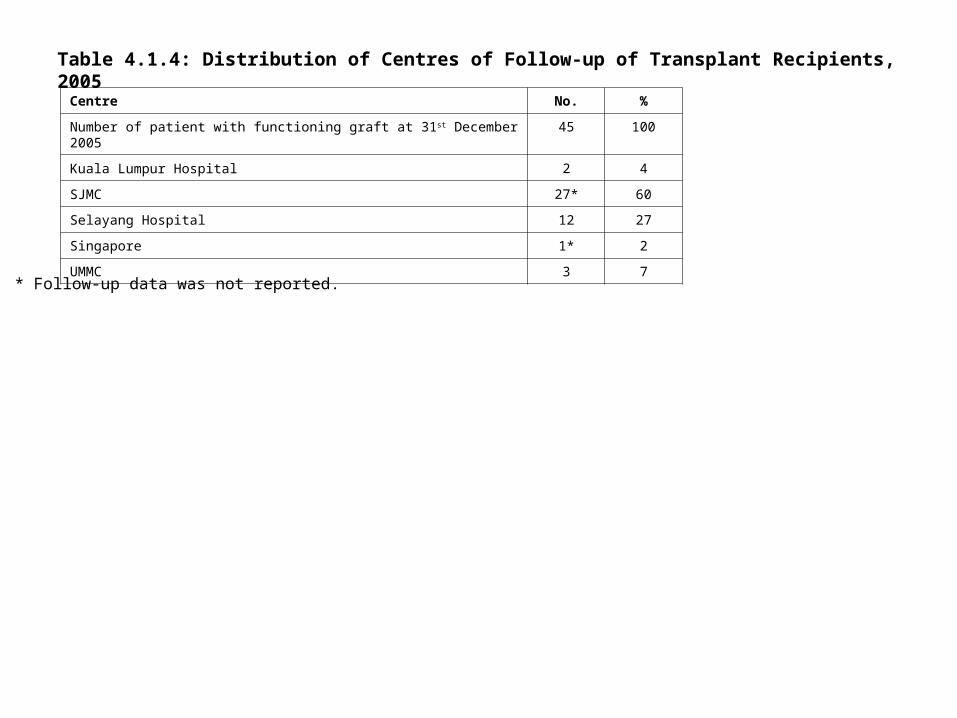
Table 4.1.4: Distribution of Centres of Follow-up of Transplant Recipients, 2005
Centre No. %
Number of patient with functioning graft at 31st December 2005 45 100
Kuala Lumpur Hospital 2 4
SJMC 27* 60
Selayang Hospital 12 27
Singapore 1* 2
UMMC 3 7
* Follow-up data was not reported.

Table 4.2.1: Gender distribution, 1993-2005
Year 93 94 95 96 97 98 99 00 01 02 03 04 05 TOTAL
Gender No. No. No. No. No. No. No. No. No. No. No. No. No. No.
Male 0 0 6 5 2 1 3 1 2 7 5 10 2 44
Female 1 1 2 8 1 1 5 2 3 3 0 6 3 33
TOTAL 1 1 8 13 3 2 8 3 5 10 5 16 5 80
Figure 4.2.1: Gender distribution, 1993-2005
Number of patients
Year
0
2
4
6
8
10 Male Female
19931994
19951996
19971998
19992000
20012002
20032004
2005

Table 4.2.2: Ethnic group distribution, 1993-2005
Year 93 94 95 96 97 98 99 00 01 02 03 04 05 TOTAL
Ethnic group No. No. No. No. No. No. No. No. No. No. No. No. No. No.
Malay 0 1 2 3 1 0 4 1 2 3 1 11 3 32
Chinese 1 0 6 8 2 1 2 2 3 6 4 5 1 41
Indian 0 0 0 2 0 1 1 0 0 0 0 0 1 5
Others 0 0 0 0 0 0 1 0 0 1 0 0 0 2
TOTAL 1 1 8 13 3 2 8 3 5 10 5 16 5 80
Figure 4.2.2: Ethnic group distribution, 1993-2005
Number of patients
Year
0
2
4
6
8
10
12
Malay Chinese Indian Others
19931994
19951996
19971998
19992000
20012002
20032004
2005

Table 4.2.3: Age distribution, 1993-2005
Year 1993 1994 1995 1996 1997 1998 1999 2000 2001 2002 2003 2004 2005 TOTAL
Age, years No. No. No. No. No. No. No. No. No. No. No. No. No. No.
<1 0 0 0 0 0 1 0 0 0 1 0 0 0 2
1-4 1 1 3 11 3 1 5 3 4 4 2 9 2 49
5-9 0 0 3 1 0 0 2 0 1 4 2 3 3 19
10-14 0 0 1 1 0 0 0 0 0 0 0 1 0 3
15-19 0 0 0 0 0 0 1 0 0 0 0 1 0 2
20-39 0 0 1 0 0 0 0 0 0 1 0 0 0 2
40-59 0 0 0 0 0 0 0 0 0 0 0 1 0 1
>=60 0 0 0 0 0 0 0 0 0 0 1 1 0 2
TOTAL 1 1 8 13 3 2 8 3 5 10 5 16 5 80
Mean 2 4 9 4 2 1 4 1 2 6 25 12 4 7
SD - - 9 4 1 1 5 1 2 7 42 22 3 13
Median 2 4 6 2 2 1 3 1 2 4 1 3 5 2
Minimum 2 4 2 2 1 3 months 1 1 1 4 months 1 1 1 3 months
Maximum 2 4 30 14 2 1 15 2 5 24 73 74 8 74
* Age=date of transplant – date of birth

Table 4.2.4: Primary diagnosis, 1993-2005 (N=80)
Year 1993 1994 1995 1996 1997 1998 1999 2000 2001 2002 2003 2004 2005 TOTAL
Primary Diagnosis No. No. No. No. No. No. No. No. No. No. No. No. No. No.
Biliary atresia 1 1 7 12 3 1 7 2 5 6 2 10 4 61
Metabolic liver disease 0 0 1 1 0 0 0 0 0 2 0 2 0 6
Cholestatic liver disease 0 0 0 0 0 1 0 1 0 0 0 0 1 3
Primary biliary cirrhosis 0 0 0 0 0 0 0 0 0 0 0 0 0 0
Primary sclerosing cholangitis
0 0 0 0 0 0 0 0 0 0 0 0 0 0
Autoimmune hepatitis 0 0 0 0 0 0 1 0 0 0 0 0 0 1
Chronic hepatitis B 0 0 0 0 0 0 0 0 0 0 3 2 0 5
Chronic hepatitis C 0 0 0 0 0 0 0 0 0 0 0 0 0 0
Alcoholic liver disease 0 0 0 0 0 0 0 0 0 0 0 0 0 0
Malignancies 0 0 0 0 0 0 0 0 0 1 2 1 0 4
Acute liver failure 0 0 0 0 0 0 0 0 0 0 0 1 0 1
Idiopathic / Cryptogenic 0 0 0 0 0 0 0 0 0 0 0 0 0 0
Others 0 0 0 0 0 0 0 0 0 2 0 1 1 4
*5 patients have more than one primary disease

Table 4.2.5: Indication for Transplantation, 1993-2005 (N=80)
Year 1993
1994
1995
1996
1997
1998
1999
2000
2001
2002
2003
2004
2005
TOTAL
Indication for Transplantation No. No. No. No. No. No. No. No. No. No. No. No. No. No.
Recurrent encephalopathy 0 0 1 0 0 0 1 0 0 1 0 0 0 3
Uncontrolled bleeding varices 0 0 0 7 1 0 4 1 1 0 0 2 0 16
Intractable ascites 0 0 0 0 0 0 0 0 0 0 0 0 0 0
Spontaneous bacterial peritonitis 0 0 0 0 0 0 0 0 0 0 0 0 0 0
Poor liver function 1 1 7 11 3 1 8 3 5 9 3 11 4 67
Malignancy 0 0 0 0 0 0 0 0 0 0 1 0 0 1
Unacceptable quality of life 0 0 0 0 0 0 0 0 0 1 0 0 1 2
Failure to thrive, growth retardation in paediatric patients
0 0 6 10 3 2 6 3 5 7 2 10 3 57
Others 0 0 0 0 0 0 0 0 0 0 0 1 2 3
No data 0 0 0 0 0 0 0 0 0 1 1 2 0 4
*15 patients had 1 indication for transplantation, 61 had more than 1 indication for transplantation

Table 4.2.6: Recipient blood group, 1993-2005 (N=80)
Year 1993 1994 1995 1996 1997 1998 1999 2000 2001 2002 2003 2004 2005 TOTAL
Blood group No. No. No. No. No. No. No. No. No. No. No. No. No. No.
A 0 1 2 0 0 0 3 0 1 3 1 4 1 16
B 0 0 1 2 0 1 2 0 1 1 0 1 1 10
AB 0 0 0 1 0 1 0 0 0 0 0 1 1 4
O 0 0 2 5 1 0 3 3 3 5 1 8 2 33
No data 1 0 3 5 2 0 0 0 0 1 3 2 0 17
TOTAL 1 1 8 13 3 2 8 3 5 10 5 16 5 80

Table 4.3.1: Type of transplant, 1993-2005 (N=80)
Year 1993 1994 1995 1996 1997 1998 1999 2000 2001 2002 2003 2004 2005 TOTAL
Type of Transplant No. No. No. No. No. No. No. No. No. No. No. No. No. No.
Cadaveric 1 0 0 3 1 0 0 0 0 1 1 4 2 13
Living related - Mother 0 1 5 2 1 2 5 2 2 2 2 7 1 32
Living related - Father 0 0 2 7 1 0 2 0 2 3 0 1 2 19
Living related - Son 0 0 0 0 0 0 0 0 0 0 1 1 0 2
Living related - Brother 0 0 0 0 0 0 0 0 0 1 0 0 0 1
Living related - emotionally
0 0 0 0 0 0 0 0 0 0 10 0 1
Living unrelated 0 0 1 1 0 0 1 1 1 3 0 3 0 11
TOTAL 1 1 8 13 3 2 8 3 5 10 5 16 5 79
* 1 patient is Living related - Other

Table 4.3.2: Immunosuppressive drug treatment at transplantation, 1993-2005 (N=80)
Year 1993 1994 1995 1996 1997 1998 1999 2000 2001 2002 2003 2004 2005 TOTAL
Immunosuppressive drugs
No. No. No. No. No. No. No. No. No. No. No. No. No. No.
Steroids 0 0 2 5 0 2 5 2 5 5 1 12 5 44
Azathioprine 0 0 0 0 0 0 0 0 0 0 0 4 5 9
Cyclosporin A 1 1 1 2 0 0 0 1 0 0 0 0 0 6
Tacrolimus (FK506) 0 0 3 7 2 2 8 2 5 9 5 13 5 61
Mycophenolate Mofetil (MMF)
0 0 0 0 0 0 0 0 0 0 00
0 0
Rapamycin 0 0 0 0 0 0 0 0 0 1 2 0 0 3
Monoclonal / Polyclonal antibody
0 0 0 0 0 0 0 0 0 0 00
0 0
Anti IL2R Antibodies 0 0 0 0 0 0 0 0 0 0 0 0 0 0
Others 0 0 0 0 0 0 0 0 0 0 0 0 0 0
No data 0 0 4 3 1 0 0 0 0 1 0 4 0 13
TOTAL patients 1 1 8 13 3 2 8 3 5 10 5 16 5 80
* 21 patients had 1 type of drug, 37 patients had 2 types, 9 patients had 3 types

Table 4.4.1: Patient survival by year of transplant, 1993-2005 (N=80)
Year of Transplant 1993 - 1998 1999 - 2005
Interval (months) % Survival SE % Survival SE
1 82 7 80 6
6 71 9 66 7
12 71 9 66 7
SE=standard error
Figure 4.4.1: Patient survival by year of transplant, 1993-2005
0.00
0.25
0.50
0.75
1.00
0 2 4 6 8 10 12Duration in months
Year 1993-1998 Year 1999-2005

Table 4.4.2: Patient survival by gender, 1993-2005 (N=80)Gender Male Female
Interval (months) % Survival SE % Survival SE
1 80 6 83 6
6 68 7 69 8
12 68 7 69 8
SE=standard error
Figure 4.4.2: Patient survival by gender, 1993-2005
0.00
0.25
0.50
0.75
1.00
Cumulative survival
0 2 4 6 8 10 12Duration in months
Male Female

Table 4.4.3: Patient survival by age group, 1993-2005 (N=80)
Age group 0-9 years >=10 years
Interval (months) % Survival SE % Survival SE
1 79 5 100 -
6 66 6 88 12
12 66 6 88 12
SE=standard error
Figure 4.4.3: Patient survival by age group, 1993-2005
0.00
0.25
0.50
0.75
1.00
Cumulative survival
0 2 4 6 8 10 12Duration in months
0-9 years >=10 years

Table 4.4.4: Causes of death, 1993-2005 (N=80)
Year 1995 1996 1997 1998 1999 2000 2001 2002 2003 2004 2005 TOTAL
Causes of death No. No. No. No. No. No. No. No. No. No. No. No.
Died due to graft failure. Cause unknown. Recurrent histocytosis ? 0 0 0 0 0 0 0 0 0 0 1 1
Portal vein thrombosis 0 0 0 0 0 0 0 0 0 1 0 1
Chronic graft rejection 0 0 0 0 0 0 1 0 0 0 0 1
Intra abdominal bleeding 0 0 0 0 0 0 0 0 1 0 0 1
Ischaemic liver necrosis 0 0 0 0 0 1 0 0 0 0 0 1
Peritonitis and Septicaemia 0 0 0 0 0 0 0 1 0 0 0 1
? Graft versus host reaction 0 0 0 0 0 0 0 0 0 0 1 1
CMV Pneumonia 0 0 0 0 1 0 0 0 0 0 0 1
Decompensated Liver cirrhosis post liver transplant with DIVC 0 0 0 0 0 0 0 1 0 0 0 1
Died at home 0 0 0 0 0 0 0 0 0 1 0 1
Intra-cerebral Haemorrhage 0 0 0 0 1 0 0 0 0 0 0 1
Intracranial Haemorrhage 0 1 0 0 0 0 0 0 0 0 0 1
Metastasis to scalp and chest. 0 0 0 0 0 0 0 0 0 0 1 1
NA 1 0 0 0 0 0 0 0 0 0 0 1
Not Available as notes disposed 1 0 0 0 0 0 0 0 0 0 0 1
Notes not available 1 0 0 0 0 0 0 0 0 0 0 1
Oesophageal Varices / Bleeding 0 0 0 0 1 0 0 0 0 0 0 1
Pneumonia and Respiratory Failure 0 1 0 0 0 0 0 0 0 0 0 1
Post Transplant Lymphoproliferative Disease and Septicaemia 0 0 0 0 0 0 1 0 0 0 0 1
Sepsis 0 0 0 0 0 0 0 1 0 0 0 1
Sepsis severe and multi-organ failure 0 1 0 0 0 0 0 0 0 0 0 1
Bleeding Oesophageal 0 0 1 0 1 0 0 0 0 0 0 2
Septicaemia 0 0 0 0 0 0 0 0 0 1 1 2
Septicaemia with DIVC 0 1 0 0 0 0 0 1 0 0 0 2
Unknown 0 0 0 0 0 0 0 1 0 1 0 2
TOTAL 3 4 1 0 4 1 2 5 1 4 4 29
* 2 patients with no date of death