table of contents - asiaentrepreneurshipjournal.com december journal-1.… · table of contents...
TRANSCRIPT
Vol VI, Issue 2, December 2010, Page 1 – Refereed Edition
© 2004-2010 [email protected] No Reprints Permitted
Table of Contents
Business Incubation and the Pursuit of Opportunity: Focus on Kobe ......................................... 3
Katsuyuki Kamei Kansai University, Japan Leo-Paul Dana GSCM and University of Canterbury, New Zealand
The Effect of Sustainability Reporting on Financial Performance: An Empirical Study Using Listed Companies ........................................................................................................ 19
Krishna Reddy, Lucus W. Gordon The University of Waikato, Hamilton, New Zealand
The Role of Corporate Ownership in Enhancing Corporate Entrepreneurship ................ 43
Johl K Satirenjit University Teknologi Petronas, Malaysia Bruce Alistair, Binks Martin The University of Nottingham, United Kingdom
Entrepreneurship in India and China .............................................................................................. 59
Hany H. Makhlouf University of the District of Columbia, USA
Cultural and Economic Determinants of Entrepreneurial Propensity: A Study of Multi-Ethnic Society in Malaysia ........................................................................................................ 67
Siri Roland Xavier, Ahmad Zaki Ismail University Tun Abdul Razak (UNITAR), Malaysia.
Syed Zamberi Ahmad Prince Sultan University (PSU). Riyadh, Kingdom of Saudi Arabia.
A Comparative Study on the Terminal and Instrumental Value Systems of Entrepreneurs and Students ........................................................................................................ 85
R.Murugesan Institute National Institute of Technology, Tamilnadu, India.
Entrepreneurial Orientation, Knowledge Process, and Marketing Performance: An investigation in small organizations in Sharjah Emirate ...................................................... 103
Rashad Al-Saed, Rajmohan P, Amitabah Upadhya Skyline University, Sharjah, U.A.E.
2010 December Journal.indd 1 12/01/2011 6:42:34 p.m.

Page 2– Refereed Edition Vol VI, Issue 2, December 2010,
© 2004-2010 [email protected] No Reprints Permitted
2010 December Journal.indd 2 12/01/2011 6:42:34 p.m.

Vol VI, Issue 2, December 2010, Page 3 – Refereed Edition
© 2004-2010 [email protected] No Reprints Permitted
Business Incubation and the Pursuit of Opportunity: Focus on Kobe
Katsuyuki KAMEI
Kansai University
&
Leo-Paul DANA
GSCM and University of Canterbury
Abstract
We try to clarify the relationship between the entrepreneurial process and the role of an accompanying
structure. Propositions are tested at the Kyoto Research Park (KRP), established in 1989 as the first private
incubation facility in Japan. The results show that the KRP plays an important role in the creation of a
network for entrepreneurs. We thus identify a particular ‘Kyoto way’ of entrepreneurship.
Keywords Japan, entrepreneurial process, opportunity, legitimacy, network, accompanying structure,
incubation, Kyoto way, Kyoto Research Park (KRP)
IntroductionEntrepreneurs are affected by the nation in which they operate and also by the region in which they are
situated. Aldrich (1979) noted that the environment could provide or withhold resources. Entrepreneurship
is also affected by institutions (Aldrich and Fiol, 1994). Suchman (1995) discussed strategic and institutional
approaches in management. Tsuyuki (2008) examined how research institutes can create a new venture
in Japan. Kazumi (2008) focused on Japanese-style business incubators. How do originators mobilise a
structure such as an incubation centre within their entrepreneurial project and how effective is this?
The objective of this research is to understand the relationship between the entrepreneurial process and
its accompanying structure. Inspired by Messeghem and Sammut (2007), we focus on the following points:
(i) the relationship between entrepreneurial opportunity-seeking and the role of the accompanying structure;
and (ii) the relationship between entrepreneurial legitimacy-seeking and the role of the structure.
In 1989, Kyoto Research Park (KRP) was established within the Kyoto High Tech Valley as the first
private incubation facility in Japan. Since then, the KRP has played an important role in providing start-up
entrepreneurs with opportunity and basis in areas such as IT, e-commerce, consulting, university-related
R&D and other high technology.
Our empirical study investigates entrepreneurship at the KRP in Japan. The city of Kyoto is internationally
2010 December Journal.indd 3 12/01/2011 6:42:34 p.m.

Page 4– Refereed Edition Vol VI, Issue 2, December 2010,
© 2004-2010 [email protected] No Reprints Permitted
known for its history and culture. This ancient capital is also a centre of entrepreneurial and technological
prowess. Suematsu (2002) wrote of Kyoto style management. Kyoto-way entrepreneurship has given birth to
world-class ventures such as Horiba, Omron, Kyocera and Nintendo.
Pursuit of Opportunity at an Accompanying Structure: Legitimacy and Isolation
The entrepreneurial process can be defined as the discovery, evaluation and exploitation of opportunity.
Dana (1995) showed that perception of opportunity is a function of cultural interpretation. How can an
accompanying structure support the pursuit of opportunity by entrepreneurs? On this point, Messeghem
and Sammut (2007) describe the role played by the accompanying structure on behalf of the entrepreneurs.
In particular, their study clarifies many dysfunctions observed through interviews. Their critical study has a
particularity, which is difficult to find among previous studies.
Messeghem and Sammut (2007) formulated the following propositions:
Proposition 1: The accompanying structure influences the research and development of opportunity by the
originator.
Proposition 2: Project bearers who enter the accompanying structure have already been integrated within
reticular logic; the accompanying processes reinforce this network approach.
Proposition 3: Originators – by developing their activities within the accompanying structures – seek to
improve the credibility of their project.
They tested these propositions in the south of France. They formulated a typology for the entrepreneurs
they interviewed using the concepts of competitive legitimacy and professional legitimacy. As a result of this
study, they concluded by mentioning the risk of isolation, an incubator does not influence the research and
development of opportunity by the originator. Project bearers who enter the accompanying structure have
already been integrated within reticular logic but they are particularly alone when constructing and reinforcing
this network. An incubator does not reinforce this already-woven network. Finally, they modified their initial
propositions to accommodate the reality of the accompanying structure that did not fulfil the expected role.
Proposition 1: The accompanying structure does not influence the R&D of opportunity by the originator if it
develops a weak relationship with the originator.
Proposition 2: Project bearers who enter the accompanying structure have already been integrated within
reticular logic; accompanying processes do not reinforce this network approach if the
structure develops a weak relationship with the originator.
Proposition 3: Originators (by developing their activities within the accompanying structures) do not
succeed in promoting the credibility of their project when the structure develops a weak
relationship with the originator.
Using their empirical study of entrepreneurs at an incubation facility in the south of France, Messeghem
and Sammut (2007) rejected all three propositions.
Small Business & Entrepreneurs in Japan
Tanaka (1999) was among the pioneers of small business research in Japan, a country that is reported to
have an entrepreneurship problem; it is near the bottom of Global Entrepreneurship Monitor surveys. A White
2010 December Journal.indd 4 12/01/2011 6:42:34 p.m.

Vol VI, Issue 2, December 2010, Page 5 – Refereed Edition
© 2004-2010 [email protected] No Reprints Permitted
Paper on SMEs in 2005 pointed out, “the decline in risk-takers not only creates the risk that risks may not be
taken at the enterprise level, but also creates the risk for society as a whole that the maintenance of growth
potential and improvement of the industrial structure may be imperilled by the decline in self-employment and
decrease in the entry rate.” In order to resolve this entrepreneurship problem, Japanese policy-makers have
introduced a series of reforms. One example is the drastic change in commercial law with the creation of the
new Corporation Law in 2006 aimed at facilitating the founding of an enterprise.
Based on Dana (1998), Japanese entrepreneurs can be described as follows: Japan is a country in
which a big size is desirable. An old proverb teaches, “When seeking a shelter, look for a big tree” (Yoraba
Taizyu no Kage). Rather than compete with large firms, entrepreneurs in Japan co-operate with them,
serving as suppliers and assemblers, in an intricate relationship revolving around cultural beliefs. Japan has
an ancient and intricate cultural tradition, founded on legends, myths and rituals. Central to the Japanese
belief system are the concepts of mutual obligation, indebtedness, hard work, self-sacrifice and loyalty, all
of which reinforce the very important notion of harmony for the common good. Additionally, in Japan, the
individual is always conscious of belonging to a group. Therefore, enterprises also tend to form associations.
The concepts of obligation, indebtedness and loyalty contribute to the unity and success within each
partnership, and to the harmony among groups.
Although entrepreneurship in Japan may have acquired Western knowledge, it has retained
Japanese spirit, including cultural and traditional values such as the sense of obligation, indebtedness and
loyalty within business alliances. Public policies help perpetuate this pattern, and across industries, small
businesses in Japan are usually linked to a network of one kind or another.
Since World War II, a few small-scale engineering firms in Japan grew into multinationals. These
include Honda and Sony. However, these very large firms were exceptions. The majority of Japanese
enterprises specialised in niche activities. For many, the niche was to serve as subcontractor for major
enterprises. This complementarity between small and large firms, coupled with a cultural system of harmony,
enhanced the efficiency of the Japanese economy. Small-scale entrepreneurs helped large corporations to
prosper, while the latter gave entrepreneurs a raison-d’être as well as a livelihood. Cultural values helped
propagate the inter-firm linkages. These include: the keiretsu (a diversified enterprise group) and the shita-
uke gyosha (subcontractors), explained by Dana (2007).
The Kyoto Way of Entrepreneurship
Kyoto, which was the capital about 1,200 years ago, is the cultural heart of Japan. The beautiful
surroundings and the cultural heritage attract people from all over the world. Kyoto is also a centre of
entrepreneurial and technological prowess. ‘Kyoto method’ entrepreneurship has given birth to world-class
ventures such as Horiba, Omron and Kyocera.
The first generation of Kyoto enterprises includes Shimazu (founded in 1875) and Omron (1933). The
second generation has Murata (1944), Horiba (1945), Wacool (1946), Rohm (1954), and Kyocera (1959).
The third generation is Nidec (1973) or Samco (1979). The enterprises at Kyoto Research Park described
below are expected to be the fourth generation. According to the Kyoto Shimbun (local newspaper in
Kyoto), high world share of the parts utilised in a cellular phone is occupied by enterprises of Kyoto (see
Table 1).
2010 December Journal.indd 5 12/01/2011 6:42:34 p.m.

Page 6– Refereed Edition Vol VI, Issue 2, December 2010,
© 2004-2010 [email protected] No Reprints Permitted
Table1: World Market Share of Cellular Phone Components Occupied by Enterprises in Kyoto
Component in Cellular Phone Enterprise in Kyoto World Share World Ranking
Crystal liquid back light Omron 20% 1
Small gauge coaxial connector Daiichi Seiko 60% 1
Heat transfer foil Nissha 85% 1
Multilayer ceramic capacitor MurataKyocera
35%10%
12
Source: Kyoto Shimbun, December 3, 2009
Much has been written, in Japanese, about the Kyoto model of entrepreneurship or management. From
previous studies, we can summarise the following characteristics of Kyoto as an entrepreneurial background
as well as those of entrepreneurs (Ohnishi, 2005).
1. The Coexistence of Tradition and High-Tech: In addition to most traditional Japanese
industries, Kyoto has a higher share of manufacturers than the national average. Within
manufacturing, high-tech and electronics-related industries have become prominent. This
coexistence of tradition and high-tech is a rare particularity of this city.
2. Traditional Industries as a Source of High-Tech: The existence of traditional industries in
this ancient capital of Japan has given birth to several technological revolutions. The Kimono
industry has been the source of numerous evolutions in technology. The traditional pottery
and porcelain industry, Kyo yaki or Kiyomizu yaki, has been the root of ceramic businesses
such as Kyocera or Murata. Technology in the production of sake has led to innovation in
biotechnology.
3. Respect for Honmamon (something with real value): Manufacturers at Kyoto are said
to be honmamon-oriented. They esteem the quality of their products. They scorn imitating
others in preferring differentiation to low pricing.
4. The Spirit of Shinise (traditional families of merchants and craftsmen): Within
traditional families of merchants and craftsmen — or Shinise, which literally means “old
shop” — we can note the following tendencies: survival rather than profit, quality rather
than quantity, respect for relationships with customers, sound business practices, anti-
conservatism, a spirit of entrepreneurship, management without debt, cash flow-based
management and horizontal networks with other firms. Kyoto does not have any big
capitalists. Thus, enterprises in Kyoto are independent of large-scale capitalists (zaibatsu),
and therefore, are unlikely to become subcontractors (shita-uke).
5. Small Market: Kyoto itself is a small market compared with Tokyo. New enterprises with
little legitimacy have difficulty in cultivating the domestic market outside Kyoto. They often
look to overseas markets. Thus, Kyoto ventures such as Horiba, Kyocera and Murata went to
the US market first and then returned to exploit the domestic market.
6. An academic town much like a Juku (private school) embracing the whole city: The
city of Kyoto has the highest percentage of academics per capita in Japan, with more than
40 universities and 50 research organisations. Seven out of 12 Japanese Nobel Prizes have
2010 December Journal.indd 6 12/01/2011 6:42:34 p.m.

Vol VI, Issue 2, December 2010, Page 7 – Refereed Edition
© 2004-2010 [email protected] No Reprints Permitted
been awarded to researchers from Kyoto University. The cooperative atmosphere between
industry and academia in this city can be considered as a big Juku embracing the entire city.
Many student entrepreneurs started their enterprises from this academic centre. The first
student venture was by Masao Horiba, who founded the enterprise named after him in 1945.
The Kyoto Research Park
During the mid-1980s, the word and the concept “incubator” were imported from Western countries
to Japan. The Technopolis Act of 1983 and the Private Participation Promotion Law of 1986 urged the
establishment of incubation facilities throughout Japan. The first of these were the System House Centre
Kobe (1982) and My Com Techno House Kyoto (1983). In 1986, Kanagawa Science Park (KSP) was
inaugurated as the first large-scale incubation facility under the Private Participation Promotion Law. Usually,
incubation facilities are constructed in the local area with the aim of territorial development. The inauguration
of the Kyoto Research Park (KRP) in 1989 in the centre of such a big city as Kyoto was exceptional.
The KRP was established by Osaka Gas Corporation in 1989 as the first private incubation facility in Japan.
The KRP is located in the middle of Kyoto’s High Tech Valley, not far from the Kyoto station, international
technology firms and major universities. This close proximity gives tenant companies quick access to markets,
next-generation research and people in various fields. With the motto, Shyu Kou Sou (meaning Gather/
Network/Create), the KRP plays a role in promoting exchange among academia, industry and government
agencies. Besides a convenient office location, the KRP offers state-of-the-art facilities such as communication
infrastructure, an Internet data centre, a conference room and hall, wet labs, dry labs, rental offices and booths.
The number of tenants at the KRP was about 240, with around 100 tenants (45% of the total) being start-ups in
2007. By 2010, the number of resident companies and organisations was 250 (35% of them in the ITC sector)
and the population working at the KRP, 2,600. The occupation rate for rented offices and booths was greater
than 90%. As a corporation employing 93 persons (full-time 66 and part-time 27), the KRP’s line of business
is venture incubation, rental of office and laboratory space, business matching (technology transfer and joint
ventures), data centre management and management of conference facilities
Following the Law for Facilitating the Creation of New Business in 1999, Japan saw the establishment of
incubators increase apace. A survey by the Japan Association of New Business-incubation Organisations
(JANBO) in 2004 counted 177 incubators in Japan. Among these, KSP and the KRP are the leading
examples in Japan and are rare incubation facilities that saw the expected development.
Onishi (2005) points out the unique business model of the KRP as being one of the few private incubators
in Japan. Most of the incubation facilities are operated by the public sector based on the national and local
government policy. In contrast, at the KRP, it is the private sector that directs, academia that instructs and
finally the public sector that supports. This cycle is specific to the KRP with the key factors of its success
shown in Table 2:
Table 2: Key Factors of Success at the KRP
2010 December Journal.indd 7 12/01/2011 6:42:34 p.m.
Page 8– Refereed Edition Vol VI, Issue 2, December 2010,
© 2004-2010 [email protected] No Reprints Permitted
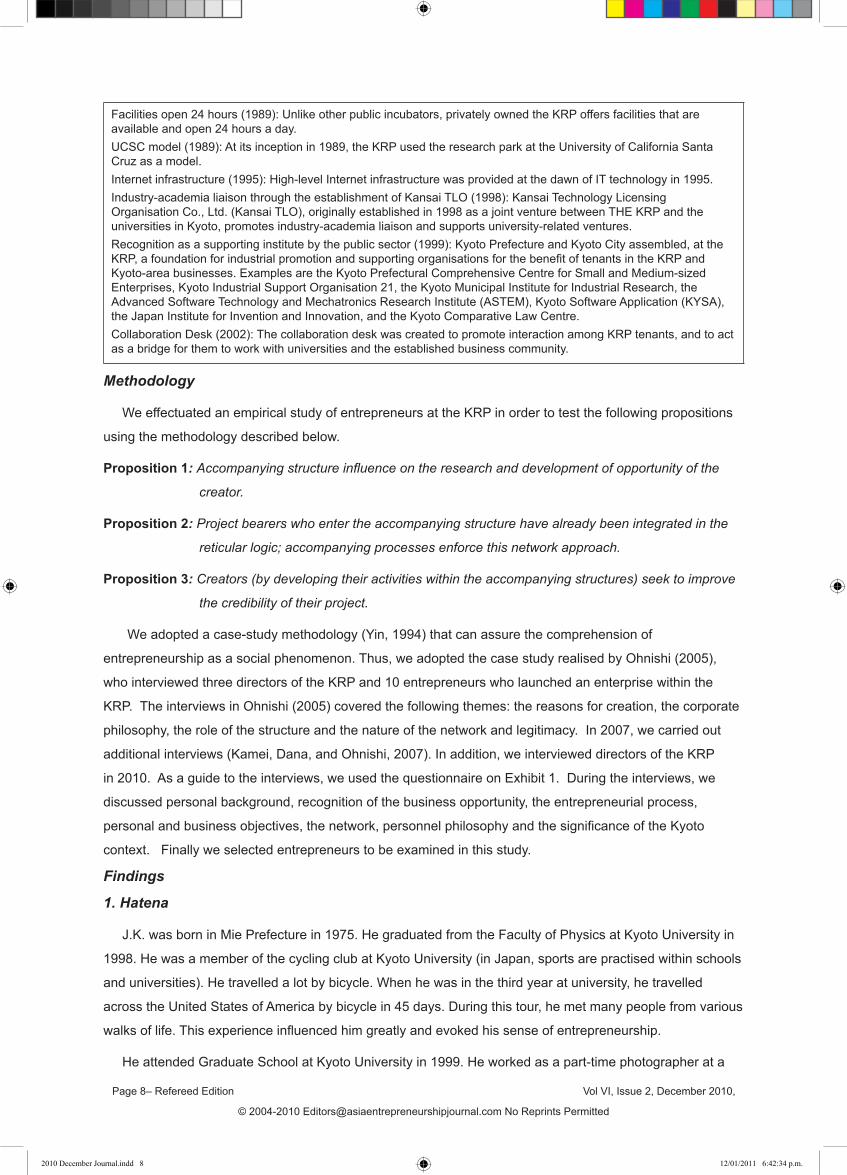
Facilities open 24 hours (1989): Unlike other public incubators, privately owned the KRP offers facilities that are available and open 24 hours a day.UCSC model (1989): At its inception in 1989, the KRP used the research park at the University of California Santa Cruz as a model.Internet infrastructure (1995): High-level Internet infrastructure was provided at the dawn of IT technology in 1995.Industry-academia liaison through the establishment of Kansai TLO (1998): Kansai Technology Licensing Organisation Co., Ltd. (Kansai TLO), originally established in 1998 as a joint venture between THE KRP and the universities in Kyoto, promotes industry-academia liaison and supports university-related ventures.Recognition as a supporting institute by the public sector (1999): Kyoto Prefecture and Kyoto City assembled, at the KRP, a foundation for industrial promotion and supporting organisations for the benefit of tenants in the KRP and Kyoto-area businesses. Examples are the Kyoto Prefectural Comprehensive Centre for Small and Medium-sized Enterprises, Kyoto Industrial Support Organisation 21, the Kyoto Municipal Institute for Industrial Research, the Advanced Software Technology and Mechatronics Research Institute (ASTEM), Kyoto Software Application (KYSA), the Japan Institute for Invention and Innovation, and the Kyoto Comparative Law Centre.Collaboration Desk (2002): The collaboration desk was created to promote interaction among KRP tenants, and to act as a bridge for them to work with universities and the established business community.
Methodology
We effectuated an empirical study of entrepreneurs at the KRP in order to test the following propositions
using the methodology described below.
Proposition 1: Accompanying structure influence on the research and development of opportunity of the
creator.
Proposition 2: Project bearers who enter the accompanying structure have already been integrated in the
reticular logic; accompanying processes enforce this network approach.
Proposition 3: Creators (by developing their activities within the accompanying structures) seek to improve
the credibility of their project.
We adopted a case-study methodology (Yin, 1994) that can assure the comprehension of
entrepreneurship as a social phenomenon. Thus, we adopted the case study realised by Ohnishi (2005),
who interviewed three directors of the KRP and 10 entrepreneurs who launched an enterprise within the
KRP. The interviews in Ohnishi (2005) covered the following themes: the reasons for creation, the corporate
philosophy, the role of the structure and the nature of the network and legitimacy. In 2007, we carried out
additional interviews (Kamei, Dana, and Ohnishi, 2007). In addition, we interviewed directors of the KRP
in 2010. As a guide to the interviews, we used the questionnaire on Exhibit 1. During the interviews, we
discussed personal background, recognition of the business opportunity, the entrepreneurial process,
personal and business objectives, the network, personnel philosophy and the significance of the Kyoto
context. Finally we selected entrepreneurs to be examined in this study.
Findings
1. Hatena
J.K. was born in Mie Prefecture in 1975. He graduated from the Faculty of Physics at Kyoto University in
1998. He was a member of the cycling club at Kyoto University (in Japan, sports are practised within schools
and universities). He travelled a lot by bicycle. When he was in the third year at university, he travelled
across the United States of America by bicycle in 45 days. During this tour, he met many people from various
walks of life. This experience influenced him greatly and evoked his sense of entrepreneurship.
He attended Graduate School at Kyoto University in 1999. He worked as a part-time photographer at a
2010 December Journal.indd 8 12/01/2011 6:42:34 p.m.

Vol VI, Issue 2, December 2010, Page 9 – Refereed Edition
© 2004-2010 [email protected] No Reprints Permitted
publishing company (in Japan, most students have a part-time job, even during the semester). At the same
time, he was looking for a chance to start a company.
He saw his parents struggle to find anything on the Internet using either a robot engine such as Google or
a directory-type engine such as Yahoo. One day, he hit upon an idea to offer a service for information search
on the Internet using manpower. He discussed this with a consultant from the KRP at the Kyoto University
Incubation Centre. He explained his plan enthusiastically. Finally, the KRP encouraged him to set up a
company.
In July 2001, the “Hatena manpowered search engine” was established as a limited liability company.
Hatena is one of the IT start-ups within the KRP. J.K. made full use of the Internet infrastructure offered by
the KRP. He met and engaged with K.W., founder of MagMag, one of the biggest magazine providers in
Japan. They both are IT start-ups created within the KRP.
The manpower search engine works as follows. When a person wants to know something, he or she asks
a question by writing ‘I would like to know about A’, and then, the others gather the information and answer
the question online. This is available for members of the service. This service is called Hatena, which means
“question mark” in Japanese. In place of money, Hatena members use Hatena points, a kind of virtual means
of exchange.
In 2003, Hatena started a blog service called the Hatena diary, which was very successful. This has
grown to be one of the five biggest blog services in Japan. In 2004, Hatena became a joint-stock corporation
and moved to Shibuya district in Tokyo. The number of Hatena members has risen to 180,000 and the users
of the Hatena diary number 100,000. The philosophy of J.K. is “never do as others do” or “do what others do
not do (Ohnishi, 2005).”
2. Kocha Senmonten ‘Select Shop’
M.N. was born in Shimonoseki City in Yamaguchi Prefecture in 1976. When he was an undergraduate
at Ritsumeikan University in Kyoto, he made a one-month trip to Nepal and India. He very much liked these
countries. He wanted to come again. During this trip, he hit upon an idea: “if I buy something cheap and sell
it in Japan, it will make enough money for the next trip.” So he bought hand-crafted pen cases. He decided
to sell these together with a pack of tea. He came back to Japan and launched a website to sell these via
the Internet. It took him one month to create this website, but there were few orders. One day, he received
an e-mail asking him to sell only the tea. He found that the tea he had bought was of a good quality. At that
time, he had no knowledge of tea. He sold all the tea he had bought in just one and a half months. He made
50,000 yen, which was enough for another trip to Nepal.
During this second trip, he decided to be much more serious about buying tea. He asked the tea
merchant about the know-how required for recognising good tea. After that began the following cycle: a trip,
sales via the Internet, another trip, more sales via the Internet, etc.
When he began selling tea via the Internet, he had a model to emulate. At that time, Eiji Kishimoto
operated one of the two websites selling goods via the Internet. His shop, Easy, sold t-shirts via the Internet.
M.N. studied the know-how by observing the website. Easy had been a start-up at the KRP. Finally, M.N.
planned to launch a company at the KRP.
2010 December Journal.indd 9 12/01/2011 6:42:34 p.m.

Page 10– Refereed Edition Vol VI, Issue 2, December 2010,
© 2004-2010 [email protected] No Reprints Permitted
In March 1998, during his study at Ritsumeikan University, Eiji Kishimoto created Kocha Senmonten
(which means a special shop for English tea in Japanese) Select Shop. One year later, it became the largest
sales site for English tea in Japan. The secret of the service lies in customer satisfaction via a diary page
of his trip and a mail magazine service. Now, his office is located next to that of his mentor, E.K. M.N.
still learns much from him, a master of selling via the Internet. M.N. loves to travel. He sells tea to finance
another trip. This is his philosophy (Ohnishi, 2005).
3. System Wave
K.A. was born in Kyoto in 1962. After graduating from Heian Senior High School in Kyoto, he joined
Osaka Gas Corporation. In 1985, he joined Omron, where he worked in production management and system
design. At the same time, he often participated in meetings or parties with people from other companies or of
other professions. He was much influenced by this kind of association. After having worked as an employee
for 14 years, in 1998, he became independent, although he did not have a precise business plan. He worked
on this together with about 10 people.
In 1999, he launched a portal site for women in order to conduct market research via the Internet.
The KRP introduced him to a partner who could provide Internet content design. In December 2001, he
created System Wave as a joint-stock corporation. This company provides a virtual department store-type
mall and various kinds of services for those who want to do everything via the Internet.
“I started a virtual mall in order to offer the possibility of creating one’s own brand. When one creates
one’s own brand, it is important to meet with others. Networking is precious. We are influenced by others and
we try to be better.” This is his philosophy (Ohnishi, 2005).
4. Multimedia Research Centre
S.S. was born in Kyoto in 1954 in a family in photography and printing business. His father worked for
a large local journal, Kyoto Shinbun, and later became independent in order to set up Kinki Photography.
After having worked as the director of his father’s corporation, S.S. created the Multimedia Research Centre
together with his elder brother. This was one of the first enterprises set up in the KRP.
Being in the field of photography, he understood the limitations of this business and foresaw the future
digital era. In 1994, he participated in a large-scale broadband experiment within the region, which helped
him and his elder brother to set up an enterprise. The atmosphere at the KRP helped them greatly in
developing their business plan. Now, S.S. is the president of this company, and in addition to this business,
he makes an effort to assist younger graphic designers through cooperation with universities of art in and
around Kyoto.
5. Secretariat
Y.H. was born in Kyoto in 1971. In 1994, she graduated from the Faculty of Literature at Doshisha
University in Kyoto. After graduation, she became the secretary to Professor Tamura of Kyoto Institute
of Technology. Professor Tamura was a founder of the Human Interface Society, which is an academic
association in this field. At his laboratory, she worked as the secretariat for this association. When Professor
Tamura retired, the association decided to set up a secretariat office for itself. In the summer of 2000, a
convention of the Human Interface Society was held at the KRP. The staff, including Y.H., were impressed
2010 December Journal.indd 10 12/01/2011 6:42:35 p.m.

Vol VI, Issue 2, December 2010, Page 11 – Refereed Edition
© 2004-2010 [email protected] No Reprints Permitted
with the facilities at the KRP. They each said, “I wish I could work in an atmosphere like this.”
The directors of the Human Interface Society proposed that Y.H. should become independent in order to
start and manage a secretariat office. She had to choose either to quit the Society or to create a secretariat
as an independent organisation. Finally, she accepted the offer to establish a limited liability company called
Secretariat.
Now, Secretariat works as a secretariat for five academic associations as well as a number of private
companies. The KRP’s support for business and academia networks, its conference facilities service, and
the atmosphere of Kyoto City as a centre for academia with many universities have helped greatly in the
development of Secretariat (Ohnishi, 2005).
Construction of a Typology for Entrepreneurs Based on Legitimacy
In order to further study the entrepreneurs at the KRP, we adopted a typology based on legitimacy.
This typology is delineated as a function of competitive legitimacy and professional legitimacy. Competitive
legitimacy reflects the capacity of an organisation to adapt to its competitive environment and to create value
to ensure its survival. This corresponds to the socio-political normative legitimacy described by Zimmerman
and Zeitz (2002), who defined this as being derived from the norms and values of society or from the level
of societal environment relevant to a new venture. Professional legitimacy corresponds to the capacity to be
recognised by one’s profession. This conformity to the norms and values of professional society depends
on the level of professional integration. In the terminology of Zimmerman and Zeitz (2002), this is placed
between cognitive legitimacy and socio-political normative legitimacy; they explain the latter as being
derived from addressing widely held beliefs and taken-for-granted assumptions that provide a framework
for everyday routines, as well as the more specialised, explicit and codified knowledge and belief systems
promulgated by various professional and scientific bodies. The cross-tabulation of these two dimensions of
legitimacy makes it possible to identify four types of entrepreneurs, as shown in Table 3.
Table 3 - Typology of Entrepreneurs Based on Competitive and Professional Legitimacy
Competitive LegitimacyWeak Strong
Professional Legitimacy Strong
ArtistsSystem Wave Multimedia Research CentreSecretariat
ReceptivesHatena Select Shop
Weak Marginals Surfers
Marginals are those originators who pursue an opportunity in a new domain. They must build
competitive and professional legitimacy at the same time. This study does not examine entrepreneurs within
this category. Artists are those originators who develop the knowledge that they want to exploit in pursuing
an entrepreneurial opportunity. They share a form of shutting-in with marginals. They have a tendency to
withdraw to a restricted society and depend essentially on the tied linkages of their network. This shutting-
in can be a constraint on the pursuit of new opportunity. Receptives are those originators who succeed
in benefiting from strong legitimacy, both competitive and professional. Surfers are those originators who
benefit from a strong competitive legitimacy that can be linked to sound managerial and/or entrepreneurial
2010 December Journal.indd 11 12/01/2011 6:42:35 p.m.
Page 12– Refereed Edition Vol VI, Issue 2, December 2010,
© 2004-2010 [email protected] No Reprints Permitted
experience. In contrast, their professional legitimacy is relatively weak, for they just start out within the sector.
Their principal challenge is to succeed in developing relationships with their professional society.
Next, we applied another typology to the interviewed entrepreneurs at the KRP. This typology was
developed by Marchesnay and Messeghem (2003) and is a function of competitive legitimacy and territorial
legitimacy; they explained territorial legitimacy as two methods of integrating entrepreneurs’ sense of
belonging within their territory. One method is the extent to which entrepreneurs are attached to the territory,
namely the degree of their affection for the land to which they belong. This includes the length of existence of
their enterprise within this territory. The other method is the degree of intensity they feel towards other actors
within the territory. Marchesnay and Messeghem (2003) called the resulting four categories as isolated,
notable, nomad and enterprising. Whatever their degree of competitive legitimacy, all the entrepreneurs
studied here show a strong territorial legitimacy at Kyoto.
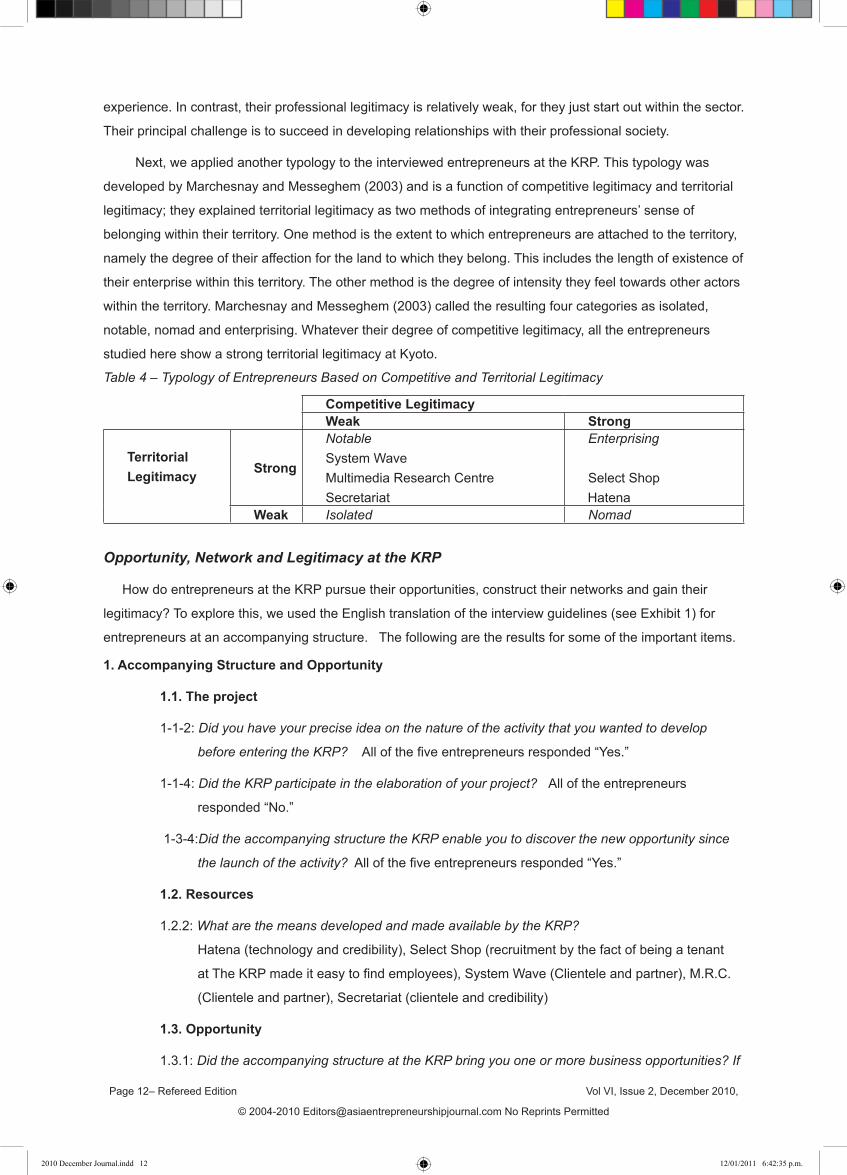
Table 4 – Typology of Entrepreneurs Based on Competitive and Territorial Legitimacy
Competitive LegitimacyWeak Strong
TerritorialLegitimacy Strong
NotableSystem Wave Multimedia Research CentreSecretariat
Enterprising
Select Shop Hatena
Weak Isolated Nomad
Opportunity, Network and Legitimacy at the KRP
How do entrepreneurs at the KRP pursue their opportunities, construct their networks and gain their
legitimacy? To explore this, we used the English translation of the interview guidelines (see Exhibit 1) for
entrepreneurs at an accompanying structure. The following are the results for some of the important items.
1. Accompanying Structure and Opportunity
1.1. The project
1-1-2: Did you have your precise idea on the nature of the activity that you wanted to develop
before entering the KRP? All of the five entrepreneurs responded “Yes.”
1-1-4: Did the KRP participate in the elaboration of your project? All of the entrepreneurs
responded “No.”
1-3-4:Did the accompanying structure the KRP enable you to discover the new opportunity since
the launch of the activity? All of the five entrepreneurs responded “Yes.”
1.2. Resources
1.2.2: What are the means developed and made available by the KRP?
Hatena (technology and credibility), Select Shop (recruitment by the fact of being a tenant
at The KRP made it easy to find employees), System Wave (Clientele and partner), M.R.C.
(Clientele and partner), Secretariat (clientele and credibility)
1.3. Opportunity
1.3.1: Did the accompanying structure at the KRP bring you one or more business opportunities? If
2010 December Journal.indd 12 12/01/2011 6:42:35 p.m.
Vol VI, Issue 2, December 2010, Page 13 – Refereed Edition
© 2004-2010 [email protected] No Reprints Permitted
so, what kind?
Hatena (publicity via PR, the KRP magazine), Select Shop (publicity via PR, the KRP
magazine), System Wave (introduction to new clientele), M.R.C. (Introduction to new
clientele, Mediation of joint order), Secretariat (introduction to new clientele and to university
professors)
2. Network
2.1: Outside the KRP, when and with whom did you have an occasion to discuss the idea of the
accompanying structure?
All of five entrepreneurs responded “with supporting institutes or other enterprises” and “at
public administrative sponsoring seminars or private seminars.”
2.3: Did the accompanying structure at the KRP allow you to enter into relationships with other
partners? If so, what kind, and at which period of the project?
Hatena (at the beginning), the others (all the time).
3. Legitimacy
3-1: Do you think that the fact to be incubated helped you in your access to the resources?
All of the entrepreneurs responded, “Yes.”
3-4: If you hadn’t been integrated in the accompanying structure the KRP, would you have had
the same legitimacy in front of your competitors and/or commercial and financial partners?
All of the entrepreneurs responded, “No.”
3-6: Are your customers or suppliers sensitive to your existence in the minds of the KRP?
All entrepreneurs responded, “Yes.”
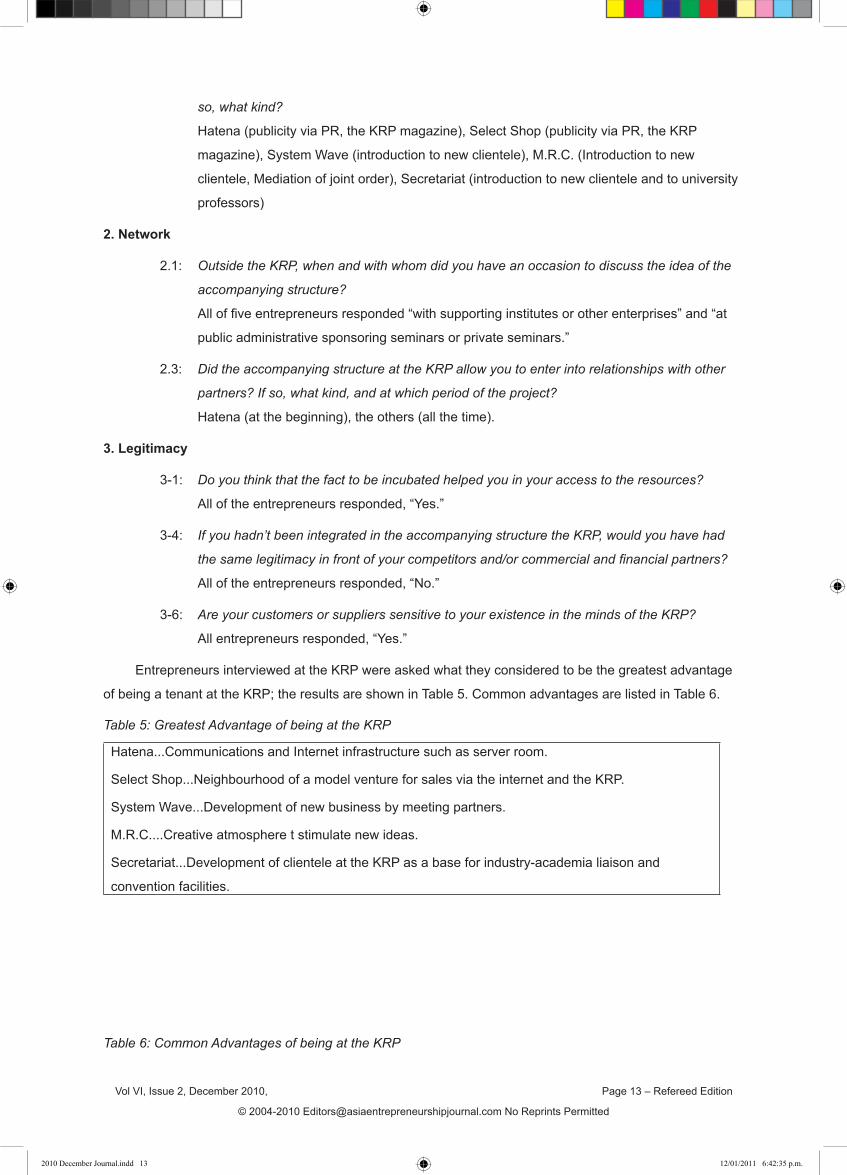
Entrepreneurs interviewed at the KRP were asked what they considered to be the greatest advantage
of being a tenant at the KRP; the results are shown in Table 5. Common advantages are listed in Table 6.
Table 5: Greatest Advantage of being at the KRP
Hatena...Communications and Internet infrastructure such as server room.
Select Shop...Neighbourhood of a model venture for sales via the internet and the KRP.
System Wave...Development of new business by meeting partners.
M.R.C....Creative atmosphere t stimulate new ideas.
Secretariat...Development of clientele at the KRP as a base for industry-academia liaison and
convention facilities.
Table 6: Common Advantages of being at the KRP
2010 December Journal.indd 13 12/01/2011 6:42:35 p.m.

Page 14– Refereed Edition Vol VI, Issue 2, December 2010,
© 2004-2010 [email protected] No Reprints Permitted
1. Information through collaboration and networking among tenants at the KRP.
2. Value of the KRP in facilitating recruitment and affording credibility
3. IT infrastructure (server room, security system)
4. Existence of public supporting institutions within the territory of the KRP
5. Seminars held at the facilities of the KRP (easy to participate in)
6. Information through seminars or conventions, networking via seminars
7. Introduction to related business at the KRP
8. Mediation of joint order for IT start-up by the KRP
9. Facilities and offices available 24 hours daily
The interviewed entrepreneurs were positive about the KRP’s role in introducing partners and related
businesses. According to them, constructing networks within or through the KRP helped them pursue their
opportunities. Thus, within the examples of the entrepreneurs at the KRP, our interviews did not find any risk
of isolation at the accompanying structure, which is an argument put forward by Messeghem and Sammut
(2007). It must be noted that the entrepreneurs interviewed developed strong relationships with the KRP so
that they could be introduced to partners and clientele. Furthermore, we have to recognise that the KRP is
one of the rare cases of success as an incubation facility in Japan, next to KSP. This might be an exceptional
case if we consider the reality of local public incubation facilities.
In any case, it is possible to observe the following three aspects from among the entrepreneurs at the
KRP: (i) Brand and credibility: the KRP as a source of cognitive legitimacy; (ii) Network: the KRP as a source
of networking; and (iii) Lifestyle-oriented: creation of enterprise as an opportunity for the realisation of an
expected lifestyle.
Conclusion
This study tested propositions using an empirical study of entrepreneurs at the KRP. Using their
empirical study of entrepreneurs at an incubation facility in the south of France, Messeghem and Sammut
(2007) rejected the propositions; moreover, they referred to the risk of isolation of originators within the
accompanying structure as a reality. In contrast, our study showed that, at least in the accompanying
environment realised at the KRP, Propositions 2 and 3 can be confirmed. That is, the entrepreneurs whom
we interviewed appreciate the KRP’s role in introducing partners, thereby supporting network creation, which
is effective in the improvement of the credibility of their project. No entrepreneur we interviewed mentioned
any risk of isolation. Our study confirms that propositions that are applicable in Kyoto: (i) opportunity-seeking
is a matter of networks; and (ii) opportunity-seeking is a matter of legitimacy.
2010 December Journal.indd 14 12/01/2011 6:42:35 p.m.
Vol VI, Issue 2, December 2010, Page 15 – Refereed Edition
© 2004-2010 [email protected] No Reprints Permitted
References Aldrich, Howard E. (1979), Organisations and Environments, Englewood Cliffs, New Jersey: Prentice Hall.
Aldrich, Howard E., and C. Marlene Fiol (1994), “Fools Rush In? The Institutional Context of Industry Creation,” Academy of Management Review 19 (4), pp. 645-670.
Dana, Leo Paul (1995), “Entrepreneurship in a Remote Sub-Arctic Community: Nome, Alaska,” Entrepreneurship: Theory and Practice 20 (1), Fall, pp. 55-72.
Dana, Leo Paul (1998), “Small But Not Independent: SMEs in Japan,” Journal of Small Business Management 36 (4), October, pp. 73-76.
Dana, Leo Paul (2007), Asian Models of Entrepreneurship – From the Indian Union and the Kingdom of Nepal to the Japanese Archipelago: Context, Policy and Practice, Singapore & London: World Scientific.
Kamei, Katsuyuki, Leo Paul Dana, and Tatsuhiko Ohnishi (2007), “Pursuit of Opportunity: ‘Kyoto way’ Entrepreneurship,” Paper presented at the 5th Interdisciplinary European Conference on Entrepreneurship Research (IECER) Entrepreneurship and the Region, Montpellier Management School. March, http://www.cerom.org/fileadmin/cerom/img/iecer/Kamei__et_al.pdf accessed 5 September, 2010.
Kazumi, Tomoyo (2008), “Desirable Model for Japanese-style Business Incubators Based on Progressive Practice,” in Urs Fueglistaller, Thierry Volery, and Walter Weber, eds., Innovation, Competitiveness, Growth and Transition in SMEs: Papers Presented to the Rencontres de St-Gall 2008/ Beiträge zu den Rencontres de St-Gall 2008, St. Gallen, Switzerland: KMU Verlag HSG..
Marchesnay, Michel, and Karim Messeghem (2003), Cas de stratégie de P.M.E., Cormelles-le-Royal, France: Les Editions Management et Société.
Messeghem, Karim, and Sylvie Sammut (2007), “Poursuite d’opportunité au sein d’une structure d’accompagnement: entre légitimité et isolement,” Gestion 2000, 3, pp. 65-82.
Ohnishi, Tatsuhiko (2006), Kyoto Way: Venture Spirit to Succeed (Kyoto Ryu to iu Hoho), Tokyo: Nozomi, in Japanese.
Suchman, Mark C. (1995), “Managing Legitimacy: Strategic and Institutional Approaches,” Academy of Management Review 20 (3), pp. 571-610.
Suematsu, Chihiro (2002), Kyoto Style Management – Strategy of Moduling (Kyoyoshiki Keiei Module ka Senryaku), Tokyo: Nihon Keizai Shinbun, in Japanese.
Tanaka, Mitsuru (1999), Small Business in the Japanese Economy, Osaka: Kansai University Press.
Tsuyuki, Emiko (2008), “How Public Research Institutes Can Create New Startup? A Case Study on Innovations Center for Startups; National Institute of Advanced Industrial Science and Technology in Japan,” in Urs Fueglistaller, Thierry Volery, and Walter Weber, eds., Innovation, Competitiveness, Growth and Transition in SMEs: Papers Presented to the Rencontres de St-Gall 2008/ Beiträge zu den Rencontres de St-Gall 2008, St. Gallen, Switzerland: KMU Verlag HSG.
Yin, Robert K. (1994), Case Study Research: Design and Methods (2nd ed.), Sage, Thousand Oaks.
Zimmerman, Monica A., and Gerald J. Zeitz (2002), “Beyond Survival: Achieving New Venture Growth by Building Legitimacy,” Academy of Management Review 27 (3), pp. 414-431.
2010 December Journal.indd 15 12/01/2011 6:42:35 p.m.

Page 16– Refereed Edition Vol VI, Issue 2, December 2010,
© 2004-2010 [email protected] No Reprints Permitted
Exhibit 1: English translation of Interview Guide
(Name of accompanying structure enters at the place of ***.)
1. Accompanying structure and Opportunity
1.1. The project
1-1-1: Could you tell us what brought you to create your enterprise?
1-1-2: Did you have your precise idea on the nature of the activity that you wanted to develop
before entering the accompanying structure ***?
1-1-3 Were you in relation with the accompanying structure *** before the montage of the project or
only since the creation of the business?
1-1-4: Did the accompanying structure *** participate in the elaboration of your project?
1-1-5: If so, in what manner? In what period? Did the advice of the accompanying structure ***
transform your project?
1.2. The resources
1-2-1: What kind of resources or ability did you have to in order to realise your project?
1-2-2: What is the means developed and made available by ***?
1-2-3: Did they become available before or after your request?
1.3. Opportunity
1-3-1: Did the accompanying structure at *** bring you one or more business opportunities? If so,
what kind?
1-3-2: How do you proceed to discover new business opportunities? Does the accompanying
structure *** help you in this process of detection?
1-3-3: In what way, do you proceed to know whether an opportunity is worth developing or not?
Are there tools? Are they yours or are you helped on this point by the accompanying
structure ***?
1-3-4: Did the accompanying structure *** enable you to discover the new opportunity since the
launch of the activity? Did you follow all these?
1-3-5: Did the accompanying structure *** sometimes dissuade you in your hope to develop new
opportunities? If so, what arguments were advanced? Would you have preferred that ***
play this role?
2010 December Journal.indd 16 12/01/2011 6:42:35 p.m.

Vol VI, Issue 2, December 2010, Page 17 – Refereed Edition
© 2004-2010 [email protected] No Reprints Permitted
2. Network
2-1: Outside the ***, when and with whom, did you have an occasion to discuss?
2-2: Did the structures help you to refine your project?
2-3: Did the accompanying structure at *** allow you to enter into relationship with the other
partners? If so, what kind, and at which period of the project? Did the members of the
accompanying structure *** attend the interviews?
2-4: In the midst of ***, did you develop relations with the other enterprises?
2-5: Do you take business opportunities by yourself or together with several persons?
2-6. How many people did you meet during the launch of your project (in *** and outside ***)?
3. Legitimacy
3-1: Do you think that the fact to be incubated helped you in your access to the resources?
3-2: Could you obtain new resources, thanks to the accompanying structure to work your project?
3-3: Did the accompanying structure *** allow you to gather the resources that you couldn’t gather
without its aid? If so, what and in which proportions?
3-4: If you hadn’t been integrated in the accompanying structure ***, would you have had the same legitimacy in front of your competitors and/or commercial and financial partners? 3-5: What made your enterprise look credible for your customers? 4. Performance
4-1: Today, do you consider that your enterprise is viable? What made an enterprise like yours
viable?
4-2: What are the perspectives of the development of your enterprise?
5. Evolution of ***
5-1: What kind of service do you want to see develop?
5-2: Do you think that it is important for *** to be certified?
5-3: Would you like an option to stay at the site of *** after 23 months?
5-4: How do you like to see *** develop?
2010 December Journal.indd 17 12/01/2011 6:42:35 p.m.

Page 18– Refereed Edition Vol VI, Issue 2, December 2010,
© 2004-2010 [email protected] No Reprints Permitted
2010 December Journal.indd 18 12/01/2011 6:42:35 p.m.

Vol VI, Issue 2, December 2010, Page 19 – Refereed Edition
© 2004-2010 [email protected] No Reprints Permitted
The Effect of Sustainability Reporting on Financial Performance:An Empirical Study Using Listed Companies
Krishna Reddya,1, Lucus W. Gordonb
a Department of Finance, Faculty of Management, The University of Waikato, Hamilton, New Zealand
b Department of Finance, Faculty of Management, The University of Waikato, Hamilton, New Zealand
Abstract
Purpose - This study investigates the effect sustainability reporting has on companies’ financial
performance. Sustainability reports are voluntarily released by companies that provide additional information
to the stakeholders regarding the impact their activities have on the environment and society.
Design/Methodology/Approach: This empirical paper analyses and identifies overlaps, gaps, limitations
and flaws in current constructs of sustainability reporting. Using event study method to estimate abnormal
returns for a 31 day event window for a sample of 68 listed companies, 17 listed in New Zealand Stock
Exchange (NZX) and 51 listed in the Australian Stock exchange (ASX).
Findings: Results of the empirical study indicate that sustainability reporting is statistically significant
in explaining abnormal returns for the Australian companies. The cross-sectional analysis results of
the combined dataset for the two countries support the view that the contextual factors of industry type
significantly impacts abnormal returns of the reporting companies. In this regard, this study identifies several
contextual factors, such as industry and type of sustainability report, that have the potential to impact the
relationship. Only the CSR type of sustainability report was significant in explaining the abnormal return of
New Zealand companies.
Practical implications: To underscore the practical implications of the theory, it shows, by reference to the
model, how sustainability reporting influences financial performance for companies engaged in industries
that have environmental implications. However, the simplistic model may also have many other applications
in management and the social sciences.
Originality value: The proposed model is highly original in providing a framework for studying the impact of
sustainability reporting in companies that have an environmental impact.
Keywords: Sustainability, Stakeholder, Event Window, Abnormal Return
Paper type Research paper
2010 December Journal.indd 19 12/01/2011 6:42:35 p.m.

Page 20– Refereed Edition Vol VI, Issue 2, December 2010,
© 2004-2010 [email protected] No Reprints Permitted
I Introduction
The impact humans have on Earth has more than doubled over the last 45 years and is still growing as
evidence shows that humans on an average are using 2.7 global hectares per capita, exceeding Earths
estimated average bio-capacity of 2.1 global hectares per capita (Peattie & Collins, 2009; World Wide Fund
for Nature (WWF), 2008). Excessive and imprudent use of Earth’s natural resources has been alleged to
have contributed to climate change, pollution, habitat loss, overexploitation of species, and the spread of
invasive species or genes. To control the impact humans are having on the Earth, the Living Planet Report
(WWF, 2008) in 2008 emphasised that immediate action need to be taken to formulate and implement
strategies that promote sustainable development. It is envisaged that a sustainable development initiatives
will minimise the use of natural resources and reduce emissions of waste and pollutants over the life cycle
so that it does not jeopardise the needs of future generations (Ofstad, 1994, p. 45). As corporations play
an integral part in both intermediate and final production and consumption, it is postulated that sustainable
production and consumption of resources by corporations would lead to an improvement in the environment
and also reduce its associated side effects (Global Reporting Initiative (GRIP), 2004). Requiring companies
to report on a regular basis regarding the impact their activities have had on the environment will allow: (i)
stakeholders to be informed of the nature of activities companies are engaged in; (ii) stakeholders to monitor
the effect such activities are having on their environment; and (iii) companies in consultation with the relevant
stakeholders will be able to implement strategies to minimise the effect of such activities. The companies
willingness to provide such reports provides support to the view that companies have learned to recognise
that providing stakeholders with relevant information regarding their approach to sustainable development
helps them maintain their implicit social licence to operate (for example Aras & Crowther, 2009; Committee
for Economic Development (CED), 1971; Finch, 2005; Overland, 2007; Waddock, 2004). However, the
nature of information disclosed remains debatable.
Both anecdotal and empirical evidence support the view that increased social and environmental
reporting leads to an improvement in the financial performance and value of the company (Cohen, Fenn,
& Konar, 1997; Feldman, Soyka, & Ameer, 1996; Jones, Frost, Loftus, & van der Laan, 2007; Klassen &
McLaughlin, 1996). This to some extent has provided motivation to companies for release social, ethical and
environmental reports to stakeholders.
Evidence shows that companies providing social, ethical and environmental reports have increased
from 24% (of the 100 largest companies in the top reporting countries) in 1999, to 33% in 2005, and 45%
in 2008 (KPMG, 2005, 2008; Milne & Gray, 2008). KPMG (2008) reported that around 80% of the largest
250 companies in the world issued social, ethical and environmental reports. However, in New Zealand
companies providing social and environmental reports remain low. According to Milne and Gray (2008),
during 2007 only 5% of the top 100 companies in New Zealand provided stand alone sustainability reports,
and 26% incorporated the relevant information pertaining to sustainability into their annual reports. In
comparison, 37% of the top 100 Australian companies provided stand alone social and environmental reports
during 2008, whilst 8% incorporated the information into their annual reports (KPMG, 2008).
However, a lack of regulation and/or consistent guidelines regarding the structure and quality of
sustainability reporting have led to the production of various types of reports that have a social, ethical and
2010 December Journal.indd 20 12/01/2011 6:42:35 p.m.

Vol VI, Issue 2, December 2010, Page 21 – Refereed Edition
© 2004-2010 [email protected] No Reprints Permitted
environmental focus. Traditionally companies have used annual reports as a medium to inform stakeholders
about accounting and economic performance as well as accountability and transparency (Finch, 2005; Gray,
Owen, & Adams, 1996). However, their focus has predominantly been on the shareholders (Jones, et al.,
2007), which meant that wider concerns of other stakeholders are left out (Criado-Jime´nez, Ferna´ndez-
Chulia´n, Husillos-Carque´s, & Larrinaga-Gonza´lez, 2008; Gentry, 2007). For these reasons the reporting
method that companies have used in the past has changed over the last decade or so to the triple bottom
line1 reporting method (Elkington, 1998a, 1998b, 1999, 2000; Wheeler & Elkington, 2001). However, a rapidly
growing approach to social, ethical and environmental reporting is that outlined by the Global Reporting
Initiative (GRI)2. According to GRI, sustainability reports should contain information on “an organisations
vision and strategy, profile, governance structure and management systems, GRI content index, and
performance indicators” (GRI, 2002, p. 7). The GRI is aiming to elevate sustainability reporting to the same
level of rigour, comparability, credibility and verifiability expected of financial reporting (GRI, 2002). Other
organisations that also offer guidance on social, ethical and environmental reporting include: SustainAbility,
a corporate sustainability think-tank and consulting organisation3; the UN Global Compact, a United Nations
initiative encouraging corporations to adopt 10 established sustainability principles and report on them4;
AccountAbility, a not-for-profit network comprised of businesses and civil and private organisations working
to promote stakeholder engagement, responsible competitiveness, collaborative governance, and setting
sustainability standards such as the AA1000 set of standards5; and the International Organization for
Standardization (ISO), standard (ISO 14000) which addresses environmental management performance of a
company and also provides a framework for organisations to base reports upon6.
The wide range of regimes used by companies to report their social, ethical and environmental activities
has resulted not only is a lack of consistency but also in a wide variation in the structure and content
between those reports (Finch, 2005). Also, companies using the same reporting regime often fail to produce
structurally homogeneous sustainability reports due to ‘pick and choose’ type practices. This to some extent
has contributed to inconsistencies in definitions, the rise of different terminologies and meanings for the term
‘sustainability’. Another plausible reason for inconsistencies in that the term ‘sustainable’ or ‘sustainability’
holds different meaning in different context and it also means different things to different people. Political and
financial consequences of such reporting are also contributory factors as well. For these reasons reaching
a common definition as well as developing a uniform strategy to tackle the Planet’s problems has been an
ongoing challenge. Some common phrases that have been used to refer to sustainability include: corporate
social responsibility (CSR), corporate sustainability, corporate citizenship, business ethics, and sustainable
entrepreneurship. In many instances these terms have been used interchangeably to refer to the same
overriding concept of social, ethical and environmental responsibility (Marrewijk, 2003).
Therefore, examining one specific type of report or comparing the same elements of different types of
1 The triple bottom line reporting was developed by Elkington over the last decade and has become a base for both practitioners and academics for stakeholder communication. It emphasises reporting on social, economic, and environmental areas of company performance.2 The GRI was launched in 1997 by UNEP and CERES and aims to develop a globally applicable framework and set of guidelines for sustainability reporting.3 SustainAbility - http://www.sustainability.com/aboutsustainability/keyfacts.asp?id=10384 UN Global Compact - http://www.unglobalcompact.org/5 AccountAbility - http://www.accountability21.net/default.aspx?id=546 International Organization for Standardization - http://www.iso.org/iso/iso_14000_essentials
2010 December Journal.indd 21 12/01/2011 6:42:35 p.m.

Page 22– Refereed Edition Vol VI, Issue 2, December 2010,
© 2004-2010 [email protected] No Reprints Permitted
reports has been difficult and confusing and can also lead to conflicting results. The wide variation in reports
makes it difficult to undertake any in-depth analysis as the number of similar reports available to conduct
such studies is limited as well. To overcome such problems, this study takes a broad view of sustainability
that encompasses the magnitude of reporting regimes such as GRI, triple bottom line, and CSR , similar to
that used by Jones et al. (2007), Aerts, Cormier and Magnan (2008), and Finch (2005).
Providing sustainability can be costly and those costs are primarily incurred by the companies’
shareholders. Unless there are tangible benefits associated with such reporting, in the absence of regulation,
the motivation for the shareholders to continue allow companies to provide sustainability reports remain
questionable. Therefore, this study first aims to investigate whether sustainability reporting by listed
companies has an effect on their financial performance and value. Second, whether sustainability reporting
has a similar effect on the listed companies in smaller economies compared to listed companies in larger
economies.
II Literature Review
Most of the studies that have investigated the effect sustainability reporting has on the financial
performance of companies have focused on only one specific environmental event disclosure. For example,
Blacconiere and Patten (1994) examined the market impact of the 1984 Union Carbide chemical leak
in Bhopal. They reported that 47 companies other than Union Carbide experienced significant negative
reactions in the period following the catastrophe. Blacconiere and Northcut (1997) investigated the market
reaction of 72 chemical companies to the Superfund Amendments and Reauthorization Act 1986, and
Freedman and Patten (2004) examined the financial report environmental disclosures of 112 US firms
in terms of their disclosures under the 1986 Toxic Release Inventory regulations. The findings of these
studies indicate that companies that exposed those environmental events experienced negative market
reactions, those companies with higher levels of environmental reporting prior to the event suffered less
negative reactions than those companies with less environmental reporting. By focusing on only one aspect
of sustainability reporting (environment) these studies have not been able to capture the full effect of the
companies’ overall sustainability reporting practices. This view is supported by Deegan (2004), who state
that Freedman and Patten (2004) have used 1989 data which may not have been relevant and therefore,
concluding that voluntary environmental disclosures are ‘bad’ may in fact have given a conflicting signal to
the market.
A number of studies have also looked at the effect of the broader aspects of environmental reporting on
share market performance. Cohen, et al. (1997) studied environmental performance in terms of 10 actual
events, ranging from the number of environmental litigation proceedings, to the number and volume of oil
and chemical spills for US companies. Klassen and McLaughlin (1996) measure environmental management
performance in US companies using environmental awards to indicate strong environmental performance,
and environmental crisis to indicate weak environmental performance. Lorraine, Collison & Power (2004)
also look at strong and weak environmental performance information in terms of environmental awards and
crises in an approach very similar to that of Klassen and McLaughlin (1996), but in a UK context. These
studies have used relatively objective measures of sustainability performance such as externally generated
performance measures and therefore, have signalled issues of impartiality concerning sustainability
2010 December Journal.indd 22 12/01/2011 6:42:35 p.m.

Vol VI, Issue 2, December 2010, Page 23 – Refereed Edition
© 2004-2010 [email protected] No Reprints Permitted
reports generated internally by companies. Cohen et al. (1997) employed a longitudinal study to find
that environmentally conscious investors either incur no penalty for investing in portfolio‘s with higher
environmental performance (green portfolios), or perform better than other non-green portfolios. Klassen
and McLaughlin (1996) and Lorraine et al. (2004) both used the event study method to examine the market
impact of the sustainability related information and have obtained significantly different results. Whereas
Klassen and McLaughlin (1996) find that in the US, a strong environmental performance is associated with
significant positive returns, and weak environmental performance is associated with significantly negative
market returns. In the UK, Lorraine et al. (2004) reported that only weak environmental performance is
associated with a significant stock market response, and generally only to the extent that fines are imposed
on the company. Furthermore, Lorraine et al. report that market reactions are lagged by a week after the
publication of the sustainability related information. The results reported by studies stated above indicate that
there are other significant factors involved in assessing the market impact of sustainability information that
were not taken into account yet. For example, the causal relationship between environmental performance
and market returns is not clear, as companies with better environmental performance are those that can
afford to implement better environmental management systems or more efficient production and operation
methods (Cohen, et al., 1997). In addition, there is evidence that country specific contextual factors have
an impact on the relationship between sustainability performance reporting and measures of financial
performance, including capital market performance for companies. The studies addressing contextual issues
in the market impacts of sustainability reporting is reported below.
Contextual differences between the US and UK are reported in the studies of Feldman, et al. (1996) and
Murray, Sinclair, Power and Gray (2006). Feldman et al. (1996) looked at the qualitative and quantitative
environmental performance of US companies. The qualitative environmental performance was a subjective
score ranging from 1 to 36 based on the company’s environmental reporting, and quantitative environmental
performance was based on the annual change in the company’s Toxic Release Inventory releases per
unit of company’s capital. The company’s environmental performance score is then measured against
the change in beta to determine the effect of environmental performance on the stock price by way of
change in systematic risk. Feldman et al. (1996)studied 300 US companies and reported that improved
environmental performance leads to a statistically significant reduction in the systematic environmental risk
of the company, which is valued by the sharemarket in the form of a higher stock price. Murray et al. (2006)
looked at the relationship between UK companies’ social and environmental performance disclosure and
their financial market performance. Social and environmental disclosure is measured by the total number of
pages of voluntary and mandatory social and environmental disclosures by the company in annual reports
over a 10 year period. Using cross-sectional analysis of 100 of the UK‘s largest companies they find no
direct relationship between the market reactions and the reporting. Murray et al. concluded that the result
was expected given the inconclusive nature of previous literature on the relationship between social and
environmental performance and market performance. However, using longitudinal analysis Murray et al.
(2006) reported a convincing relationship between consistently high (low) returns and high (low) levels of
social and environmental disclosure. This result is similar to that reported by Cohen et al. (1997). Murray et
al. similarly concluded that there is no clear reason why this might be, and that the conceptual basis for the
causal nature of the relationship between environmental and market performance is underdeveloped.
2010 December Journal.indd 23 12/01/2011 6:42:36 p.m.

Page 24– Refereed Edition Vol VI, Issue 2, December 2010,
© 2004-2010 [email protected] No Reprints Permitted
Country specific factors may have a role in explaining the contrasting conclusions of Feldman et al.
(1996), who find a significant relationship between environmental reporting and market performance based
on US data, and that of Murray et al. (2006) who, using UK data, find no significant relationship between
environmental reporting and market performance. The results reported by Feldman et al. and Murray et al.
are similar to the results reported by Klassen and McLaughlin (1996) and Lorraine et al (2004), apart from
the fact that former authors data was derived from the internally generated environmental performance
disclosures. The inconsistencies in results suggest that there may be fundamental contextual differences
between the US and the UK that may have a moderating effect on the relationship between sustainability
reporting and market performance.
Studies in other international contexts have also been examined. Aerts, Cormier and Magnan (2008)
looked at companies from continental Europe (Belgium, France, Netherlands and Germany), and North
America (Canada and US), while Cormier and Magnan (2007) studied French, Canadian and German
companies. Both Aerts et al. (2008) and Cormier and Magnan (2007) examined a comprehensive range of
environmental disclosures by grouping them into 6 categories: expenditures and risk; laws and regulation;
pollution abatement; sustainable development; land remediation; and environmental management. Aerts
et al. reported that enhanced environmental reporting is related to more accurate earnings forecasts by
analysts, but that the relationship is stronger in Europe than North America. Cormier and Magnan provided
support for contextual differences in the effects of environmental reporting, with environmental reporting
having a significant moderating effect on the market valuation of German companies’ earnings, but not for
Canadian or French companies. It is interesting to note that the differences in the results are attributable to
the differences in the contextual factors arising from the differences in the reporting regulatory environment.
In North America there is a strong regulatory environment in terms of environmental disclosures related
to risk and exposure, whereas in Europe, there is a strong focus on sustainable development and
environmental management reporting. Further, the ecological or Green movement is stronger in Germany
and Green parties are represented in the parliaments in both Germany and France, but not Canada. Both
Aerts et al. and Cormier and Magnan have contradicted the findings reported in earlier literature (Feldman, et
al., 1996; Klassen & McLaughlin, 1996; Lorraine, et al., 2004; Murray, et al., 2006) that European countries
value information regarding sustainability reports more highly than North American countries. Reviews of the
contextual factors relating to sustainability reporting by other authors have also noted inconsistencies in the
literature. In discussing country and industry-specific differences in corporate social responsibility reports,
Chen and Bouvain (2009, p. 20) state, “… findings are inconclusive or contradictory and it is often difficult to
compare previous studies owing to the idiosyncratic methods used in each stud.” Chen and Bouvain go on
to examine the contextual differences in reporting between the UK, US, Germany and Australia. Overall they
find that Germany has substantially different CSR reporting practices than the US, UK or Australia. They note
that US, UK and Australia are defined as having liberal market economies, with reporting systems based
on serving the interests of shareholders, while Germany is deemed to have a coordinated market economy,
with a reporting system that is primarily designed to serve the interests of holders of debt and tax authorities.
One way of addressing the inconsistencies in international sustainability reporting is to have mandatory
sustainability reporting, and associated quality assurance services, however a full discussion of this is
beyond the scope of this study (for details refer to Criado-Jime´nez, et al., 2008; Manetti & Becatti, 2008;
2010 December Journal.indd 24 12/01/2011 6:42:36 p.m.

Vol VI, Issue 2, December 2010, Page 25 – Refereed Edition
© 2004-2010 [email protected] No Reprints Permitted
Mobus, 2005; Overland, 2007).
Jones, et al. (2007) examined the sustainability reporting of Australian companies. In terms of defining
sustainability Jones et al. took a broader view of social and environmental reporting practices that fall under
the more general concept of “sustainability reporting. Jones et al. examined annual reports, sustainability
reports, and sustainability disclosure on the companies’ websites. Sustainability information was then scored
against the GRI‘s set of social and environmental indicators, with a maximum score of 40 based on the
qualitative level of information reported. Jones et al. compared the sustainability reporting score to both the
market performance, as measured by abnormal returns using a market index, and financial performance,
as measured by a range of variables including financial ratios, measures of cash positions, operating and
free cash flows, profitability, financial structure, debt servicing capacity, and a number of valuation multiples.
Jones et al. reported that there is a negative relationship between sustainability reporting and abnormal
returns of a company, but that the coefficients were generally not statistically significant. However, there
is a significant relationship between sustainability reporting and many measures of company financial
performance. Measures that were found to be particularly significant included ratios involving cash position,
working capital, retained earnings, capital structure, and operating cash flows. In the context of New
Zealand, there is a paucity of literature regarding the market impact of sustainability reporting. New Zealand
has mixed results in terms of the quality and quantity of sustainability reporting being produced. Contributors
to the movement towards sustainability reporting include organisations such as the New Zealand Business
Council for Sustainable Development (NZBCSD)7, who require their 70 plus members to produce a triple
bottom line report within three years of becoming a member, the New Zealand Institute of Chartered
Accountants (NZICA), who each year review company reports and judge the Sustainable Development
Reporting Section in the Institute‘s Annual Report Awards (Casey, 2008), and the Sustainable Business
Network, who have worked with over 200 New Zealand organisations to promote sustainable business
practices, including reporting (Sustainable Business Network, 2009). Membership to these organisations
continue to grow, as does the number and level of sustainability disclosures by New Zealand companies
(Chapman & Milne, 2004). However there is a lack of studies concerning the financial or market impacts of
sustainability disclosures by New Zealand companies, which this study intends to fulfil.
In summary, the findings of the studies involving sustainability reporting and financial performance provide
support to the view that there is evidence of improved financial performance arising from sustainability
reporting. Lack of theories supporting such relationship means that the evidence of any causal relationship
remains unclear and inconclusive (Cohen, et al., 1997; Feldman, et al., 1996; Klassen & McLaughlin, 1996;
Lorraine, et al., 2004; Murray, et al., 2006). Also a lack of consistencies in sustainability reporting means
that quality data is not available to undertake studies that could address the right questions that need to
be answered. However, the conceptual model developed by Feldman, et al. (1996) (see Figure 2 in the
Appendix) and the theoretical model of Richardson et al. (1999) (see Figure 3 in the Appendix) provide
support for the existence of a causal relationship between sustainability reporting and financial performance.
Taking cognisance of this view, this study uses a more current data and investigates whether sustainability
reporting leads to financial performance. In doing so, this study contributes to the extant literature in two
7 New Zealand Business Council for Sustainable Development - http://www.nzbcsd.org.nz/directory.asp
2010 December Journal.indd 25 12/01/2011 6:42:36 p.m.

Page 26– Refereed Edition Vol VI, Issue 2, December 2010,
© 2004-2010 [email protected] No Reprints Permitted
ways: first, by addressing the identified gap in the research literature; and second, by adding to a growing
area of research regarding the effect of context on the market impact of sustainability reporting by examining
New Zealand and Australian listed companies.
III. Research Method And Procedure Of Data Analysis
The event study method is used to investigate the impact sustainability reporting has on the value of the
companies in New Zealand and Australia. Using the market announcement of the sustainability report as the
event day 0, the event window for this study is defined as the period beginning 10 trading days prior to day
0, and extending to 20 days past day 0, excluding market holidays, giving 31 days in total. The estimation
window used for estimating normal returns was the 250 trading days, excluding market holidays, prior to the
event window, that is, from 260 days to 11 days prior to event day 0. This estimation window is similar to that
used MacKinlay (1997) and Corrado & Zivney (1992). This gives the event time as T0 = -260, t0 = 0, T1 = -10,
and T2 = 20 as depicted by Figure 1 below.
Figure 1:
Event Window and Estimation Period
(Adapted from MacKinlay, 1997, p.20 and Peterson, 1999, p.38)
Estimations Window
Event Window
T0 T1 t0 T2
(Adapted from MacKinlay, 1997, p.20 and Peterson, 1999, p.38)
Where, T0 is the first period of estimation window; T1 is the first period used in the estimation of abnormal
returns; to is the event period; and T2 is the last period used in the estimation of abnormal returns.
Using the corresponding T0 and T2 dates in calendar time, the daily returns for each company and for the
corresponding market index (either NZX50 or ASX200) are retrieved from the DataStream database. The
abnormal returns were determined as follows:
First, the daily returns for each company over the estimation window was regressed against the daily
market index return over the same period using equation 1 to determine the value for αi and βi (regression
parameters) for each company.
itmtiiit RR εβα ++= ........................... 1
Where
Rit = period t return on security i
Rmt = period t return on market portfolio
εit = disturbance term with expected value 0
α, β = parameters from the regression
2010 December Journal.indd 26 12/01/2011 6:42:36 p.m.

Vol VI, Issue 2, December 2010, Page 27 – Refereed Edition
© 2004-2010 [email protected] No Reprints Permitted
Second, the regression parameters determined in step 1 above for each company are used in Equation 2
to estimate the abnormal return for each day in the event window.
mtiiitit RRAR βα ˆˆ −−= ........................... 2
Where
ARit = abnormal return for security i in period t
Third, the individual abnormal returns were aggregated across securities using a simple average, as
given by Equation 3.
∑=
=N
itt AR
NCAR
12
1 ............................. 3
Where
CARt = aggregate cumulative abnormal returns
This process was performed for data from large listed companies in New Zealand and Australia as well as
the combined dataset. Significance testing of aggregate abnormal returns (CAR) was performed for the three
sets of companies for days -1 to 1.
Cross-sectional dummy regression analysis was then performed on the day -1 to 1 aggregate abnormal
return. The regression equation and dummy variables used are as follows:
CARit = αit+ β1itD1 + β2itD2 + β3itD3 ........................... 4
Where:
D1 = Environmental Report Type
D2 = Sustainable Report Type
D3 = Corporate Responsibility Report Type
αit = Intercept Term (Annual Report Type)
The dummies variables D1, D2 and D3 equal 1 if the sustainability report is of the corresponding type,
otherwise 0.
A second cross-sectional dummy regression was performed using a combined dataset of all New Zealand
and Australian companies’. A dummy variable for dirty industry membership was included to examine the
industry effect. The regression equation is as follows:
CARit = αit + β1itD1 + β2itD2 + β3itD3 + β4itD4 + β5itD5 .......................... 5
Where:
D4 = Country
D5 = Dirty Industry Membership
The dummy variable D4 equals 1 if the company is from New Zealand, otherwise 0. The dummy variable
D5 equals 1 if the company operates in a dirty industry, otherwise 0. The industries were split into dirty or
other industries based on the 10 most environmentally intensive industries using a similar method to Cole,
Elliot & Shimamoto (2005) and Mani and Wheeler (1997).
2010 December Journal.indd 27 12/01/2011 6:42:36 p.m.

Page 28– Refereed Edition Vol VI, Issue 2, December 2010,
© 2004-2010 [email protected] No Reprints Permitted
III.1 Data and Data Sources
The sustainability reporting and stock return data was gathered from numerous sources. The
sustainability reports varied significantly in their size and content and came from a broad range of industries.
The sample included 68 listed companies, 17 listed in New Zealand Stock Exchange (NZX) and 51 listed in
the Australian Stock Exchange (ASX).
For New Zealand companies, the sustainability reports ranged in length from 2 to 82 pages, with a mean
of 24.9 pages and a median of 21 pages. The sustainability reports of Australian companies ranged in length
from 6 to 194 pages, with a mean of 42.4 pages and a median of 38 pages. On average, the annual report
type was the shortest type of sustainability report, while the sustainable type was the longest. The number of
each type of sustainability report for New Zealand and Australia is reported in Table 1 below.
Table 1: Distribution of Sustainability Report from New Zealand and Australia
Type of ReportNew Zealand Australia
Number % Number %
Annual Report (with Corporate Responsibility Section) 11 65% 7 14%
Environment, Health & Safety 2 12% 8 16%
Sustainability (Environment/Social/Economics) 2 12% 22 43%
Corporate Responsibility (EHS/Community/Social) 2 12% 14 27%
Total 17 100% 51 100%
The results in Table 1 indicate that 65% of the New Zealand companies investigated tended to disclose
sustainability information in the annual report, while only 43% of the Australian companies prefer to use the
specific sustainable report type. A plausible reason for the differences in reporting methods could be due
to the fact that high costs are associated with producing standalone sustainability reports; therefore small
companies in New Zealand have used annual reports to disclose such information.
Table 2 reports the data for companies in different industries that have disclosed sustainability reports.
Results show that Australian companies are represented in a wider range of sectors than New Zealand
companies. This may be due to the fact that there are more Australian companies than New Zealand
companies. The key difference however, is that many of the Australian companies come from sectors
regarded as having a greater impact on the environment, in particular, the mining, chemicals, oil and
gas, and steel & metals industries (hereafter dirty industries). It can be concluded that companies that
undertake sustainability reporting mostly tends to belong to the dirty industries. The reporting dates for New
Zealand companies ranged from September 30, 2003, to August 21, 2009. The reporting dates for Australia
companies range from April 30, 2002, to July 10, 2009. It is to be noted that a high number of both the New
Zealand and Australian event dates were between the months of September 2008 through to December
2008.
2010 December Journal.indd 28 12/01/2011 6:42:36 p.m.

Vol VI, Issue 2, December 2010, Page 29 – Refereed Edition
© 2004-2010 [email protected] No Reprints Permitted
Table 2: Distribution of Companies across Industries for New Zealand and Australia
Industry New Zealand AustraliaNumber % Number %
Banks 1 6% 2 4%
Beverages 0 3 6%
Chemicals 0 2 4%
Construction & Building Materials 1 6% 2 4%
Diversified Industrials 1 6% 2 4%
Electricity 2 12% 1 2%
Food Producers & Processors 1 6% 1 2%
Forestry & Paper 2 12% 1 2%
General Retailers 1 6% 1 2%
Insurance 0 1 2%Leisure, Entertainment & Hotels 1 6% 0Mining 0 13 25%Multi-Utilities 0 2 4%
Oil & Gas 1 6% 4 8%
Packaging 0 1 2%
Pharmaceuticals & Biotechnology 0 1 2%
Real Estate 1 6% 6 12%
Speciality & Other Finance 0 1 2%
Steel & Other Metals 0 3 6%
Support Services 1 6% 1 2%
Telecommunication Services 1 6% 1 2%
Transport 3 18% 2 4%
Total 17 100% 51 100%
IV. Results
Table 3 and Table 4 report the aggregate abnormal returns over the event window for New Zealand and
Australian companies and Table 5 report the results for the combined dataset. It can be seen that New
Zealand has a positive aggregate cumulative abnormal return over the event window, while Australia has a
negative aggregate cumulative abnormal return over the event window.
Table 3: Aggregate Abnormal Returns and Aggregate Cumulative Abnormal Returns for New Zealand and Australian Companies over the Event Window
New Zealand Companies
Event Day Aggregate Abnormal Returns Aggregate Cumulative Abnor-mal Returns
-10 0.227 0.227-9 0.785 1.011
-8 0.561 1.573
-7 -0.053 1.520
-6 -0.256 1.264
-5 -0.015 1.249
2010 December Journal.indd 29 12/01/2011 6:42:36 p.m.

Page 30– Refereed Edition Vol VI, Issue 2, December 2010,
© 2004-2010 [email protected] No Reprints Permitted
-4 -0.489 0.760
-3 0.630 1.390
-2 1.742 3.132
-1 -0.223 2.909
0 0.321 3.230
1 -0.477 2.753
2 -0.169 2.585
3 0.491 3.076
4 -0.012 3.064
5 -0.558 2.506
6 -0.013 2.492
7 0.407 2.899
8 0.542 3.442
9 -0.020 3.422
10 0.203 3.625
11 0.100 3.724
12 0.075 3.799
13 0.021 3.820
14 0.257 4.077
15 -0.153 3.924
16 -0.076 3.849
17 0.471 4.319
18 -0.227 4.092
19 -0.140 3.952
20 -0.026 3.926
Table 4:Aggregate Abnormal Returns and Aggregate Cumulative Abnormal Returns for New Zealand and Australian Companies over the Event Window
Australian Companies
Event Day Aggregate Abnormal Returns Aggregate Cumulative Abnor-mal Returns
-10 -0.160 -0.160
-9 -0.425 -0.586
-8 0.272 -0.314
-7 -0.808 -1.123
-6 0.041 -1.081
-5 0.562 -0.519
-4 -0.728 -1.247
-3 -0.298 -1.545
-2 0.571 -0.975
2010 December Journal.indd 30 12/01/2011 6:42:37 p.m.

Vol VI, Issue 2, December 2010, Page 31 – Refereed Edition
© 2004-2010 [email protected] No Reprints Permitted
-1 0.796 -0.179
0 0.189 0.010
1 -1.238 -1.228
2 -1.167 -2.395
3 -0.358 -2.753
4 0.147 -2.606
5 0.406 -2.200
6 0.559 -1.641
7 -0.207 -1.848
8 -0.588 -2.437
9 0.481 -1.956
10 -0.233 -2.189
11 0.566 -1.622
12 0.375 -1.248
13 -0.030 -1.278
14 -0.009 -1.287
15 -0.143 -1.430
16 -0.039 -1.469
17 -1.590 -3.059
18 -0.340 -3.399
19 -0.022 -3.421
20 -0.328 -3.749
Table 4:Aggregate Abnormal Returns and Aggregate Cumulative Abnormal Returns for New Zealand and Australian Companies over the Event Window
Australian Companies
Event Day Aggregate Abnormal Returns Aggregate Cumulative Abnor-mal Returns
-10 -0.160 -0.160
-9 -0.425 -0.586
-8 0.272 -0.314
-7 -0.808 -1.123
-6 0.041 -1.081
-5 0.562 -0.519
-4 -0.728 -1.247
-3 -0.298 -1.545
2010 December Journal.indd 31 12/01/2011 6:42:37 p.m.

Page 32– Refereed Edition Vol VI, Issue 2, December 2010,
© 2004-2010 [email protected] No Reprints Permitted
-2 0.571 -0.975
-1 0.796 -0.179
0 0.189 0.010
1 -1.238 -1.228
2 -1.167 -2.395
3 -0.358 -2.753
4 0.147 -2.606
5 0.406 -2.200
6 0.559 -1.641
7 -0.207 -1.848
8 -0.588 -2.437
9 0.481 -1.956
10 -0.233 -2.189
11 0.566 -1.622
12 0.375 -1.248
13 -0.030 -1.278
14 -0.009 -1.287
15 -0.143 -1.430
16 -0.039 -1.469
17 -1.590 -3.059
18 -0.340 -3.399
19 -0.022 -3.421
20 -0.328 -3.749
Figure 2
Conceptual Model Linking Corporate Environmental Management and Performance with Firm Value
Source: Feldman, Soyka, and Ameer, 1996, p. 3
2010 December Journal.indd 32 12/01/2011 6:42:37 p.m.

Vol VI, Issue 2, December 2010, Page 33 – Refereed Edition
© 2004-2010 [email protected] No Reprints Permitted
Table 6 reports the results of the statistical significance testing of the New Zealand day -1, day 0, and
day 1 aggregate abnormal returns. The abnormal returns of day -1, 0, and 1 are -0.22%, 0.32%, and -0.48%
respectively. However, the results are not statistically significant indicating that returns are not significantly
different from 0. Table 7 reports the significance test for the Australian companies. The results for days -1,
day 0, and day 1 show that the aggregate abnormal returns are 0.80%, 0.19%, and -1.24% respectively.
These results are not statistically significant indicating abnormal returns are not statistically different from 0.
However, the results for day 1 are statistically significant at 99% level.
Table 6:Significance Testing of Aggregate Abnormal Returns for New Zealand Companies for Event Days -1 to 1
Test Value = 0
New Zealand Companies
t df Sig. (2-tailed)
Mean Differ-ence
95% Confidence Interval of the Difference
Lower UpperCAR Day -1 -0.318 16 0.754 -0.223 -1.709 1.263CAR Day 0 1.138 16 0.272 0.321 -0.277 0.918CAR Day 1 -1.227 16 0.238 -0.477 -1.300 0.347
Table 7: Significance Testing of Aggregate Abnormal Returns for Australian Companies for Event Days -1 to 1
Test Value = 0
Australian Companies
t df Sig. (2-tailed)
Mean Differ-ence
95% Confidence Interval of the Difference
Lower Upper
CAR Day -1 1.204 50 0.234 0.796 -0.532 2.124
CAR Day 0 0.395 50 0.694 0.189 -0.772 1.150
CAR Day 1 -3.068 50 0.003 -1.238 -2.048 -0.428
The results for the combined dataset of all New Zealand and Australian companies are reported in Table
8. The overall abnormal returns for day -1, day 0, and day 1 is 0.54%, 0.22%, and -1.05% respectively. Only
the result for day 1 is statistically significant at the 99% confidence level.
Table 8: Significance Testing of Aggregate Abnormal Returns for Combined New Zealand Companies for Event Days -1 to 1
Test Value = 0
Combined New Zealand Companies and Australian Companies
t df Sig. (2-tailed)
Mean Differ-ence
95% Confidence Interval of the Difference
Lower UpperCAR Day -1 1.029 67 0.307 0.541 -0.509 1.591
CAR Day 0 0.609 67 0.545 0.222 -0.506 0.950
CAR Day 1 -3.284 67 0.002 -1.-48 -1.684 -0.411
Table 9 report the results for the cross-sectional dummy regression of abnormal returns against the sustainability report type using Equation 4. The results indicate that none of the four sustainability report
2010 December Journal.indd 33 12/01/2011 6:42:37 p.m.
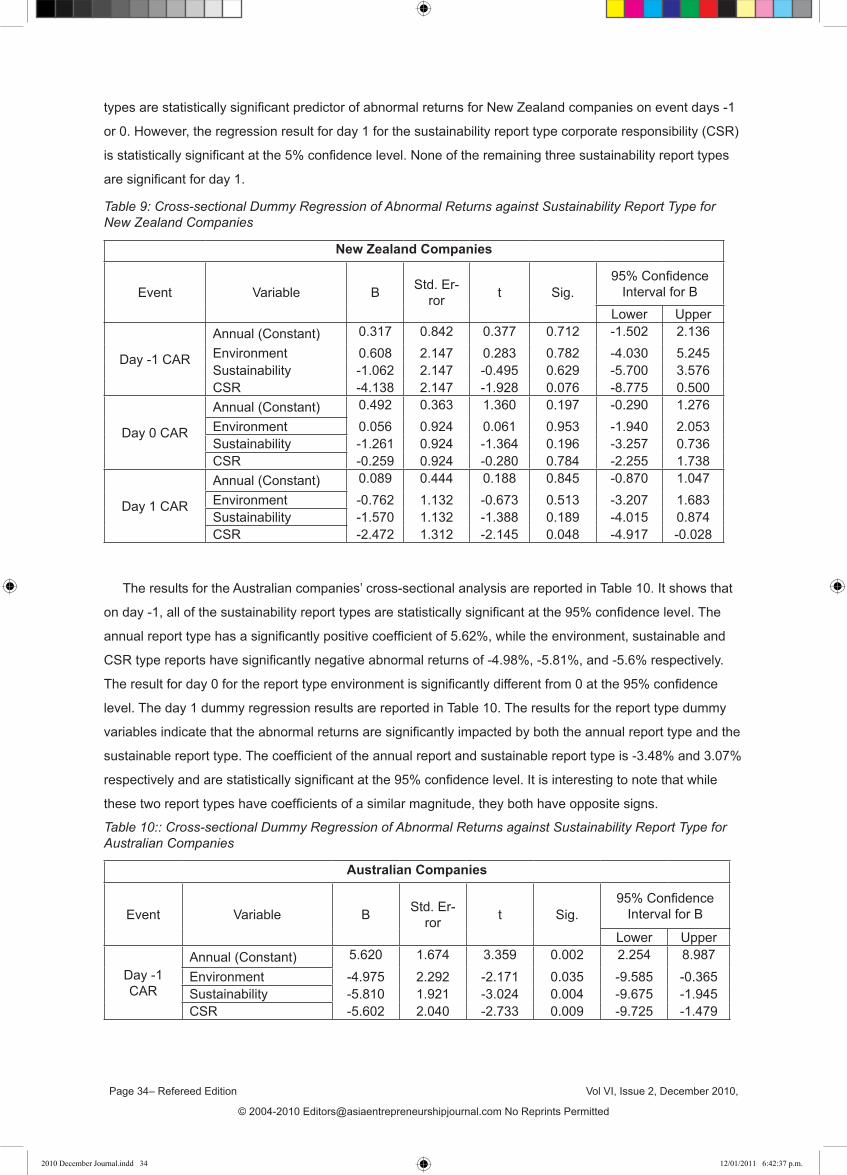
Page 34– Refereed Edition Vol VI, Issue 2, December 2010,
© 2004-2010 [email protected] No Reprints Permitted
types are statistically significant predictor of abnormal returns for New Zealand companies on event days -1
or 0. However, the regression result for day 1 for the sustainability report type corporate responsibility (CSR)
is statistically significant at the 5% confidence level. None of the remaining three sustainability report types
are significant for day 1.
Table 9: Cross-sectional Dummy Regression of Abnormal Returns against Sustainability Report Type for New Zealand Companies
New Zealand Companies
Event Variable B Std. Er-ror t Sig.
95% Confidence Interval for B
Lower Upper
Day -1 CAR
Annual (Constant) 0.317 0.842 0.377 0.712 -1.502 2.136Environment 0.608 2.147 0.283 0.782 -4.030 5.245Sustainability -1.062 2.147 -0.495 0.629 -5.700 3.576CSR -4.138 2.147 -1.928 0.076 -8.775 0.500
Day 0 CAR
Annual (Constant) 0.492 0.363 1.360 0.197 -0.290 1.276Environment 0.056 0.924 0.061 0.953 -1.940 2.053Sustainability -1.261 0.924 -1.364 0.196 -3.257 0.736CSR -0.259 0.924 -0.280 0.784 -2.255 1.738
Day 1 CAR
Annual (Constant) 0.089 0.444 0.188 0.845 -0.870 1.047Environment -0.762 1.132 -0.673 0.513 -3.207 1.683Sustainability -1.570 1.132 -1.388 0.189 -4.015 0.874CSR -2.472 1.312 -2.145 0.048 -4.917 -0.028
The results for the Australian companies’ cross-sectional analysis are reported in Table 10. It shows that
on day -1, all of the sustainability report types are statistically significant at the 95% confidence level. The
annual report type has a significantly positive coefficient of 5.62%, while the environment, sustainable and
CSR type reports have significantly negative abnormal returns of -4.98%, -5.81%, and -5.6% respectively.
The result for day 0 for the report type environment is significantly different from 0 at the 95% confidence
level. The day 1 dummy regression results are reported in Table 10. The results for the report type dummy
variables indicate that the abnormal returns are significantly impacted by both the annual report type and the
sustainable report type. The coefficient of the annual report and sustainable report type is -3.48% and 3.07%
respectively and are statistically significant at the 95% confidence level. It is interesting to note that while
these two report types have coefficients of a similar magnitude, they both have opposite signs.
Table 10:: Cross-sectional Dummy Regression of Abnormal Returns against Sustainability Report Type for Australian Companies
Australian Companies
Event Variable B Std. Er-ror t Sig.
95% Confidence Interval for B
Lower Upper
Day -1 CAR
Annual (Constant) 5.620 1.674 3.359 0.002 2.254 8.987
Environment -4.975 2.292 -2.171 0.035 -9.585 -0.365Sustainability -5.810 1.921 -3.024 0.004 -9.675 -1.945CSR -5.602 2.040 -2.733 0.009 -9.725 -1.479
2010 December Journal.indd 34 12/01/2011 6:42:37 p.m.

Vol VI, Issue 2, December 2010, Page 35 – Refereed Edition
© 2004-2010 [email protected] No Reprints Permitted
Day 0 CAR
Annual (Constant) -1.882 1.224 -1.538 0.131 -4.344 0.580
Environment 3.983 1.676 2.377 0.022 0.612 7.354Sustainability 2.797 1.405 1.991 0.052 -0.029 5.624CSR 0.871 1.499 0.581 0.564 -2.144 3.886
Day 1 CAR
Annual (Constant) -3.482 1.043 -3.337 0.002 -5.581 -1.382
Environment 1.418 1.429 0.993 0.326 -1.456 4.292Sustainability 3.071 1.198 2.564 0.014 0.662 5.481CSR 2.537 1.278 1.986 0.053 -0.033 5.108
Table 11 reports the results for Equation 5 utilising the combined datasets. The results generally support
those results reported in Tables 9 and 10. The differences for the combined sample are the following: on
day -1, the environment report type report is not statistically significant, and on the day 1, the sustainability
type report is not statistically significant. One plausible reason for the differences in results could be due
to the offsetting effects of the combination of the New Zealand and Australian abnormal returns. Table 11
reveals that dirty industry membership have a negative impact on abnormal returns for event days -1, 0 and
1. However, of these days, only the coefficient of day 0 is -1.52% which is statistically significant at the 95%
confidence level. Table 11: Cross-sectional Dummy Regression of Abnormal Returns against Sustainability Report Type, Country and Dirty Industry Membership for all Companies
New Zealand Companies
Event Variable B Std. Er-ror t Sig.
95% Confidence Interval for B
Lower Upper
Day -1 CAR
Annual (Constant) 5.218 1.417 3.683 0.001 2.386 8.051Environment -2.722 1.717 -1.586 0.118 -6.153 0.709Sustainability -4.643 1.480 -3.137 0.003 -7.666 -1.684CSR -4.558 1.555 -2.931 0.005 -6.445 -1.449Country -3.683 1.382 -2.666 0.010 -3.660 -0.921Dirty Industry -1.513 1.074 -1.408 0.164 -1.939 0.635
Day 0 CAR
Annual (Constant) 0.041 0.990 0.041 0.960 -1.939 2.021Environment 2.776 1.200 2.314 0.240 -0.378 5.175Sustainability 1.226 1.035 1.184 0.241 0.843 3.294CSR -0.255 1.087 -0.234 0.816 -2.427 1.918Country 0.197 0.966 0.204 0.839 -1.734 2.128Dirty Industry -1.522 0.751 -2.027 0.047 -3.023 -0.021
Day 1 CAR
Annual (Constant) -1.945 0.911 -2.136 0.037 -3.765 -0.125Environment 0.136 1.103 0.123 0.902 -2.069 2.341Sustainability 1.449 0.951 1.523 0.133 -0.453 3.351CSR 0.806 1.000 0.807 0.423 -1.192 2.804Country 1.264 0.888 1.424 0.160 -0.511 3.039Dirty Industry -0.328 0.691 -0.475 0.637 -1.708 1.053
V Discussion
The day 0 abnormal returns of both New Zealand and Australian companies were not statistically
significant may be due to a time lag between the release of the report and the ability of the market to
incorporate that information into the share price. This is consistent with the observed significant abnormal
return of Australian companies on day 1, and supports the results reported by Lorraine et al. (2004) in regard
to the lagged effect of environmental performance reporting.
2010 December Journal.indd 35 12/01/2011 6:42:37 p.m.

Page 36– Refereed Edition Vol VI, Issue 2, December 2010,
© 2004-2010 [email protected] No Reprints Permitted
A negative trend in abnormal returns over the event window for Australian companies is statistically
significant and also supports the tentative findings reported Jones et al. (2007). For Australia, this study also
found that companies in the resources sector, such as mining and the steel & metals industries, have higher
rates of sustainability reporting than other sectors. The result for the Equation 5 cross-sectional analysis
indicate that dirty industry membership is related to significantly negative abnormal returns suggesting that
market participants are sceptical about the information contained in the reports of companies operating in
dirty industries. Alternatively, it may be that the sustainability reports of those companies operating in high
environmental impact industries are not able to convince investors that the company is sufficiently managing
its environmental risks.
The results for New Zealand companies show a general positive trend in abnormal returns over the event
window. However, these results are not statistically significant. These results are in line with those reported
in the UK by Murray, et al. (2006) in that companies with high levels of sustainability reporting also tended
to have high market returns as well. All companies included in this study for New Zealand have high levels
of sustainability reporting, hence the result reported by Murray et al. indicate that one could expect higher
accompanying share market returns as well. While this result is also noted by Cohen et al. (1997), there
is no clear explanation as to why this may be, especially in light of contrasting results between this study
and Jones et al. (2007) regarding the negative cumulative abnormal returns of Australian companies. One
plausible explanation is that contextual factors may have impacted the relationship between sustainability
reporting and market returns. The results for Australian companies are in line with the literature (see Jones et
al., adding corroborative evidence to the Australian context. However, there are no previous results to directly
compare the findings for New Zealand. However, the similarity in the results reported by Murray et al. (2006)
suggests that New Zealand may have contextual factors similar to the UK as well.
There are a number of contextual factors that different between New Zealand and Australia. One
contextual factor is the difference in reporting type, that is, 65% of New Zealand reports were of annual
report type whilst 43% of Australian reports were of the sustainability report type. Another contextual factor
is the difference in industry type. For example, the mining industry comprised 25% of Australian reporting
companies, but there were no mining company reports in New Zealand. In addition, evidence shows
that companies operating in dirty industries suffered negative abnormal returns, and Australia had more
companies in such industries than New Zealand. Different sample size used and differences in perception
towards sustainability reporting between the countries may also be the contributory factors as well. Australia
has a higher rate of sustainability reporting compared to New Zealand and a longer history in Australia
means that investors have had more opportunity to develop methods to assess the information content of
sustainability reports, while in New Zealand this practice remains relatively new among listed companies and
is not widespread. Hence this provides support to the view that there are differences in the manner in which
sustainability reports are perceived and interpreted in different countries.
The literature review identified a model by Feldman, et al. (1996) that links environmental management
and performance with company value through a reduction in a companies’ exposure to systematic
environmental risk (see Figure 2). According to the Feldman et al. model, a decrease in share price of
Australian companies is due to an increase in the cost of capital caused by an increase in the systematic
environmental risk of the company. If this is the case, then Australian companies issuing sustainability
2010 December Journal.indd 36 12/01/2011 6:42:37 p.m.

Vol VI, Issue 2, December 2010, Page 37 – Refereed Edition
© 2004-2010 [email protected] No Reprints Permitted
Figure 3 A Model of the Capital Market Impacts of Corporate Social Responsibility
Source: Richardson, Welker & Hutchinson, 1999, p. 19
2010 December Journal.indd 37 12/01/2011 6:42:37 p.m.

Page 38– Refereed Edition Vol VI, Issue 2, December 2010,
© 2004-2010 [email protected] No Reprints Permitted
reports may be signalling to the market that they are unable to manage their environmental risks.
The differences in cumulative abnormal returns for New Zealand and Australian companies indicate that
there are differences in the expectations of the market participants for the information contained within the
sustainability reports in these countries (see Figure 4). For New Zealand, the pre-event rise in cumulative
abnormal returns suggest that the market is anticipating that the reports will confirm that the firms have had
strong sustainability performance and that this is good for the earning prospects of the company. The post
event period seems to suggest that the expectations were confirmed as the cumulative abnormal return
plot levels with no further notable rises or falls. The Australian cumulative abnormal return plot also shows
an increase in abnormal returns several days prior to the release of the report. However the sharp, and
statistically significant, drop in the abnormal returns following event day 0 suggests that market expectations
regarding the information in the sustainability reports are not confirmed, and in fact the companies may have
performed worse than expected in terms of sustainability management.
The statistically significant result for the CSR report type for New Zealand companies is difficult to
interpret given that the event day’s overall abnormal return was not statistically significant. However, this may
have been due to clustering of returns and a small sample size.
The mixed findings from the Australian cross-sectional dummy regression (see Table 10) suggest
that prior to the release of the sustainability report it was perceived that all the report types could contain
information relevant to pricing the security. However, on event day 0, only the environmental report type
was actually deemed relevant for pricing the security. Still, day -1 and day 0 did not have overall significant
abnormal returns, while day 1 had a significantly negative abnormal return. On day 1, the annual report type
had a significantly negative coefficient, and the sustainability type had a significantly positive coefficient. This
suggests that the annual and sustainable report types are the form of disclosure that the market ultimately
based the security pricing decision on. The difference in the signs of the coefficients suggests that the annual
report type of sustainability disclosure tends to convey information implying that the company has increased
risk, while the sustainable report type leads the market to believe that prospects for the company are better
than previously expected, or that the company has decreased in risk.
VI Conclusion
The results of this study provide support to the view that there is a statistically significant relationship
between sustainability reporting and market returns for Australian companies but not for New Zealand
companies. However, there is evidence of a systematic positive relationship between sustainability reporting
and market returns over the event window in New Zealand.
This study adds support to the view that context influences the relationship between sustainability
reporting and market returns. In this regard, this study identified several contextual factors, such as industry
and type of sustainability report, that have the potential to impact the relationship. Only the CSR type of
sustainability report was significant in explaining the abnormal return of New Zealand companies.
The findings indicate that the annual and sustainable report types were only significant on day 1 for
Australian Companies. The fact that day 1 results are statistically significant for these two report types
indicate that these two types of sustainability reports have the most impact on market returns. However,
2010 December Journal.indd 38 12/01/2011 6:42:37 p.m.

Vol VI, Issue 2, December 2010, Page 39 – Refereed Edition
© 2004-2010 [email protected] No Reprints Permitted
Figure 4: Aggregate Cumulative Abnormal Return Plot over the 31 Day Event Window for New Zealand and Australian Companies
these findings are inconsistent in terms of significance levels and signs for the sustainability reports across
event days. Therefore, caution need to be exercised when interpreting the results of this study because of
the limitations regarding the number and as well as the nature of companies’ reports that were available.
Further studies need to be undertaken that focus on the contextual factors and their effect on the
relationship between sustainability reporting and market performance. As pointed out by Jones et al. (2007)
“… there is a need for corroborating evidence from other international jurisdictions”. Hence more studies
which investigate the relationship between sustainability reporting and market returns are needed using
wider datasets, and ideally these studies will recognise the global nature of sustainability issues and will seek
to establish a solid foundation for researching the market impact of sustainability reporting in the future. A
global study that applies the same measurement and analytical framework will further add and build upon the
impact of sustainability reporting on market.
2010 December Journal.indd 39 12/01/2011 6:42:37 p.m.

Page 40– Refereed Edition Vol VI, Issue 2, December 2010,
© 2004-2010 [email protected] No Reprints Permitted
VII Bibliography
Aerts, W., Cormier, D., & Magnan, M. (2008). Corporate environmental disclosure, financial markets and the media: An international perspective Ecological Economics, 64, 643-659.
Aras, G., & Crowther, D. (2009). Corporate sustainability reporting: A study in disingenuity? Journal of Business Ethics, 87, 279-288.
Blacconiere, W. G., & Northcut, W. D. (1997). Environmental information and market reactions to environmental legislation. Journal of Accounting, Auditing & Finance, 12, 149-178.
Blacconiere, W. G., & Patten, D. M. (1994). Environmental disclosures, regulatory costs, and changes in firm value. Journal of Accounting and Economics, 18, 357-377.
Casey, P. (2008). Sustainable development reporting awards showcase ‘improved quality’. Chartered Accountants Journal, 26-27.
Chapman, R., & Milne, M. J. (2004). The triple bottom line: how New Zealand companies measure up. Corporate Environmental Strategy. International Journal for Sustainable Business, 11(2), 37-50.
Chen, S., & Bouvain, P. (2009). Is corporate responsibility converging? A comparison of corporate responsibility reporting in the USA, UK, Australia, and Germany. Journal of Business Ethics, 87, 299-317.
Cohen, M. A., Fenn, S. A., & Konar, S. (1997). Environmental and financial performance: Are they related? . Working paper. Owen Graduate School of Management, Vanderbilt University. Nashville, TN.
Cole, M. A., Elliot, R. J. R., & Shimamoto, K. (2005). Why the grass is not always greener: The competing effects of environmental regulations and factor intensities on US specialization. Ecological Economics, 54, 95-109.
Committee for Economic Development (CED). (1971). Social Responsibilities of Business Corporations. Washington DC: US Government Printing Office.
Cormier, D., & Magnan, M. (2007). The revisited contribution of environmental reporting to investors‘ valuation of a firm‘s earnings: An international perspective. Ecological Economics, 62, 613-626.
Corrado, C. J., & Zivney, T. L. (1992). The specification and power of the sign test in event study hypothesis tests using daily stock returns. The Journal of Financial and Quantitative Analysis, 27(3), 465-478.
Criado-Jime´nez, I., Ferna´ndez-Chulia´n, M., Husillos-Carque´s, F. J., & Larrinaga-Gonza´lez, C. (2008). Compliance with mandatory environmental reporting in financial statements: The case of Spain . Journal of Business Ethics, 79, 316-262.
Deegan, C. (2004). Environmental costing in capital investment decisions: Electricity distributors and the choice of power poles. Australian Accounting Review, 18(1), 2-15.
Elkington, J. (1998a). Cannibals with forks: The triple bottom line of 21st century business. Vancouver: New Society.
Elkington, J. (1998b). Triple bottom line revolution - Reporting for the third millennium Australian CPA, 69(10), 75-77.
Elkington, J. (1999). Triple bottom line revolution - Reporting for the third millennium. Australian CPA, 69(11), 75-76.
Elkington, J. (2000). Sustainable profits: Triple bottom line strategies for business and markets. Accounting & Tax Periodicals, 71(3), 36-37.
Feldman, S. J., Soyka, P. A., & Ameer, P. (1996). Does improving a firm‘s environmental management system and environmental performance result in a higher stock price? . Journal of Investing, 6(4), 87-97.
Finch, N. (2005). The motivations for adopting sustainability disclosure. Working paper of the Macquarie Graduate School of Management, Macquarie University. Sydney, NSW.
Freedman, M., & Patten, D. M. (2004). Evidence on the pernicious effect of financial report environmental disclosure. Accounting Forum, 28, 27-41.
2010 December Journal.indd 40 12/01/2011 6:42:38 p.m.

Vol VI, Issue 2, December 2010, Page 41 – Refereed Edition
© 2004-2010 [email protected] No Reprints Permitted
Gentry, C. R. (2007). Full disclosure: Shareholders urge companies to reveal sustainability practices. Chain Store Age, 83(10), 177-178.
Global Reporting Initiative (GRI). (2002). Introducing: The 2002 Sustainability Reporting Guidelines. Retrieved 2 April, 2009 www.globalreporting.org
Global Reporting Initiative (GRIP). (2004). Sustainable consumption and production – Practical, profitable and proactive innovation. Retrieved 5 April, 2009, from GRIP, Norwegian Centre for Sustainable Consumption and Production. Norway: Nordic Council of Ministers www.grip.no.
Gray, R., Owen, D., & Adams, C. A. (1996). Accounting and Accountability: Changes and Challenges in Corporate Social and Environmental Reporting. London: Prentice Hall
Jones, S., Frost, G., Loftus, J., & van der Laan, S. (2007). An empirical examination of the market returns and financial performance of entities engaged in sustainability reporting . Australian Accounting Review, 17(1), 78-87.
Klassen, R. K., & McLaughlin, C. P. (1996). The impact of environmental management on firm performance. Management Science, 42, 1199-1214.
KPMG. (2005). KPMG international survey of corporate responsibility reporting. Retrieved from http://www.kpmg.com/SiteCollectionDocuments/International-corporate-responsibility-survey-2005.pdf
KPMG. (2008). KPMG international survey of corporate responsibility reporting 2008. Retrieved from http://www.kpmg.com/SiteCollectionDocuments/International-corporate-responsibility-survey-2008_v2.pdf.
Lorraine, N. H., Collison, D. J., & Power, D. M. (2004). An analysis of the stock market impact of environmental performance information. Accounting Forum 28(1), 7-26.
MacKinlay, A. C. (1997). Event studies in economics and finance. Journal of Economic Literature, 35, 13-39.
Manetti, G., & Becatti, L. (2008). Assurance services for sustainability reports: Standards and empirical evidence. Journal of Business Ethics, 87, 289-298.
Mani, M., & Wheeler, D. (1997). In search of pollution havens? Dirty industry in the world economy, 1960-1995. Working paper. World Bank, Environment, Infrastructure and Agriculture Division, Policy Research Department.
Marrewijk, M. V. (2003). Concepts and definitions of CSR and corporate sustainability: Between agency and communion. Journal of Business Ethics, 44, 95-105.
Milne, M., & Gray, R. (2008). International trends in corporate ‘sustainability‘ reporting. Chartered Accountants Journal of New Zealand, 87(11), 60-63.
Mobus, J. L. (2005). Mandatory Environmental Disclosures in a Legitimacy Theory Context. Accounting, Auditing and Accountability Journal 18(4), 492-517.
Murray, A., Sinclair, D., Power, D., & Gray, R. (2006). Do financial markets care about social and environmental disclosure? Further evidence and exploration from the UK. Accounting, Auditing & Accountability Journal, 19(2), 228-255.
Ofstad, S. (Ed.). (1994). Symposium: Sustainable Consumption. London: Sustainable Development Commission
Overland, J. (2007). Corporate social responsibility in context: The case for compulsory sustainability disclosure for listed public companies in Australia? Working Paper. Macquarie University. Sydney.
Peattie, K., & Collins, A. (2009). Guest editorial: Perspectives on sustainable consumption. International Journal of Consumer Studies, 33, 107-112.
Richardson, A. J., Welker, M., & Hutchinson, I. R. (1999). Managing capital market reactions to corporate social responsibility. International Journal of Management Reviews, 28(3), 36-66.
Sustainable Business Network. (2009). 2008 Sustainable business review. New Zealand.
2010 December Journal.indd 41 12/01/2011 6:42:38 p.m.

Page 42– Refereed Edition Vol VI, Issue 2, December 2010,
© 2004-2010 [email protected] No Reprints Permitted
Waddock, S. (2004). Creating corporate accountability: Foundational principles to make corporate citizenship real. Journal of Business Ethics 50(4), 313-327.
Wheeler, D., & Elkington, J. (2001). The end of the corporate environmental report? Or the advent of cybernetic sustainability reporting and communication. Business Strategy and the Environment, 10, 1-14.
World Wide Fund for Nature (WWF). (2008). Living planet report 2008. Retrieved from http://www.assets.panda.org/downloads/living_planet_report_2008.pdf
2010 December Journal.indd 42 12/01/2011 6:42:38 p.m.

Vol VI, Issue 2, December 2010, Page 43 – Refereed Edition
© 2004-2010 [email protected] No Reprints Permitted
The Role of Corporate Ownership in Enhancing Corporate Entrepreneurship
Johl K Satirenjit University Teknologi PETRONAS, Malaysia
Bruce Alistair The University of Nottingham, United Kingdom
Binks MartinThe University of Nottingham, United Kingdom
Abstract
Introduction We report on a study conducted to examine the association between ownership structure
and corporate entrepreneurship activities among the FTSE100 companies in the U.K. Prior
research examines aspects of corporate entrepreneurship and ownership structure without any
consideration of the links that may exist between these two drivers. This study seeks to address
this gap. Two propositions were developed to test the relationship of ownership structure and
corporate entrepreneurship: relationship between executive ownership and level of corporate
entrepreneurship; relationship between institutional block holders and corporate entrepreneurship.
Method A mixed method approach (pragmatic) using quantitative and qualitative approach (interviews) was
employed for testing these two propositions. We used standard SPSS statistical measures for the
quantitative portion and a classification system was created to categorize qualitative information.
Results The interview findings indicated that most companies found that a high level of executive ownership
did not diminish the spirit of building an entrepreneurial organisation. Similar results were revealed
using the quantitative approach. As for the dominance of institutional block holders, the analysis,
using both the qualitative and quantitative approach, revealed no clear consensus as to the nature
of the influence of block holders on entrepreneurial activities.
Conclusion Providing high levels of ownership to executives would tend to align executives’ interests
with shareholders that act as a motivating device to encourage executives to be more interested in
activities of the business and to respond entrepreneurially. The role of institutional block holders
and the level of corporate entrepreneurship would depend on the type of institutional block holders,
i.e. whether they were short-term and long-term holders.
Keywords Corporate entrepreneurship, ownership structure, institutional block holder, executive
ownership, triangulation
2010 December Journal.indd 43 12/01/2011 6:42:38 p.m.

Page 44– Refereed Edition Vol VI, Issue 2, December 2010,
© 2004-2010 [email protected] No Reprints Permitted
Introduction
Corporate ownership of an organisation plays the role as an internal governance mechanism as it
affects the manager’s willingness to take on board risk (Jones & Butler, 1992). There are two aspects of
ownership that could affect the manager’s pursuit of corporate entrepreneurship: ownership held by the
firm’s executives and ownership by a powerful and vigilant institutional block holder. Several studies have
investigated the role of executive’s ownership to create long-term value (Jones & Butler, 1992; Fama
& Jensen, 1983 Zahra et al., 2000) and the role of institutional shareholders i.e. banks, pension funds,
charitable organisations, universities, insurance and investment companies to be powerful players within
the corporate governance system (Baysinger et al., 1991;Solomon & Solomon, 2004). More recently,
researchers are beginning to question the effects of corporate ownership towards entrepreneurial activities
within a firm. In this study we focus on the relationship between corporate ownership and corporate
entrepreneurship.
Executive ownership has generated debate about the influence of ownership to encourage executives
to have greater commitment and to support activities that create long-term value such as corporate
entrepreneurship (Jones & Butler, 1992). Lack of ownership is considered to discourage executives from
supporting corporate entrepreneurship as they have to put their salaried position in jeopardy (Fama &
Jensen, 1983) and tend to avoid risk (Zahra et al., 2000) through focusing on an acceptable level of short-
term performance. On the other hand, there are conflicting arguments suggesting that a large amount of
ownership ties a large amount of the executive’s job performance in with the performance of the company.
This creates uncertainty in terms of income and thus makes it more likely that the executive will be risk
averse, adopting short-term horizons when appraising decisions and leading to a diminished effort (Lewellen
et al., 1987; Bruce and Buck, 1997), all of which in turn has a negative impact on enterprise activities. There
is a lack of consensus as to whether providing executives with ownership will enhance entrepreneurial
activities within a firm.
The presence of block holders could encourage CEO to pursue risky long-term ventures (Meckling, 1976)
such as corporate entrepreneurship. Block holders are well informed about the places in which they hold
stock and monitor CEO decision and commitment on entrepreneurial activities (Baysinger et al., 1991). Also,
there has been an increase in shareholder activism by institutional shareholders (Solomon & Solomon, 2004)
and this has the effect of stimulating enterprise activities to take place within an organisation. On the other
hand, some researchers have indicated that there is a negative association between institutional investors
and R&D spending (Graves, 1998) since more attention is paid to the short-term and bottom line rather
than to enterprise activities. Institutional block holders are seen to have self-interest involvement which is
not in line with the interests of other shareholders. There is no clear consensus as to whether institutional
block holders are seen to stimulate enterprise activities. The objective of this paper is to examine both
on executive ownership and the presence of institutional shareholders and its impact towards corporate
entrepreneurship.
The paper makes a number of contributions to the literature. First, it adds to the scare of empirical
evidence on the role of corporate ownership in terms of executive ownership and institutional shareholders
towards entrepreneurial activities. It provides evidence from U.K which practices the Anglo-Saxon corporate
governance system.
2010 December Journal.indd 44 12/01/2011 6:42:38 p.m.

Vol VI, Issue 2, December 2010, Page 45 – Refereed Edition
© 2004-2010 [email protected] No Reprints Permitted
Corporate Governance and Corporate Entrepreneurship
In recent years, the practice of corporate entrepreneurship has gained increasing attention among
managers and academics, as it possesses the ability to foster innovation; a factor considered crucial for
businesses in today’s competitive environment. Entrepreneurship within an existing organisation has
become an important element in organisations and in economic development. This phenomenon is evident
via the activities of large companies when seeking ways to reinvent and revitalize the entrepreneurial roots
they once had but which have now become eroded due to size, bureaucracy, complex processes and
hierarchical factors (Cooper and Dunkelberg, 1986; Wright et al., 1992; Guth & Ginsberg, 1990; Zahra,
1995). However, there is also the potentially negative side to corporate entrepreneurship whereby a
potentially destructive element resides within the energetic drive of successful entrepreneurs (Morris &
Kuratko, 2002). In most new ventures, the individual or corporation puts a significant amount of financial
resources at stake. The money or resources that have been invested will, in all likelihood, be lost if the
venture fails. The financial risk is greater when non-retrievable assets are invested in an innovative concept.
In a corporate context, a highly visible failure can affect stock value and bond ratings (Morris & Kuratko,
2002).
With the internationalization of business and in consideration of recent financial crises, companies are
expected to stay competitive (and possess entrepreneurial skills) whilst at the same time practicing good
governance; the latter, it is argued, contributes towards enhanced transparency and accountability. In the
U.K, the Combined Code provides guidance for good governance practice and companies listed on the
London Stock Exchange are required to comply within those rules. Prior studies (Baysinger & Butler, 1985;
Weisbasch, 1988; Brickley et al., 1988; Rosentein & Whyatt, 1990; Coughlan & Schmidt, 1985; Warner
et al., 1988) in the area of corporate governance argue and provide evidence that those companies with
good governance practice tend to perform better than those without good practice. However, there is a
growing body of literature, albeit providing limited evidence (e.g. Short et al., 1998; 2000; O’ Sullivan, 2000;
Young, 1995; Tricker, 1984; Keasey & Wright, 1993) voicing concerns on the potential negative impact of
excessive controls via governance rules on entrepreneurial activities. It is against this backdrop that this
study investigates the issue of whether there is relationship between good corporate ownership structures /
practices and corporate entrepreneurship.
Taylor (2001) argues that the governance rules excessively focus on control and ways to curb executive
decision-making and that this ultimately leads to a negative impact on corporate performance. In addition,
Taylor stresses that the focus ought to be on corporate entrepreneurship rather than governance rules since
entrepreneurship involves the creation of the conditions necessary for corporate renewal by eliminating
outdated business approaches. Similar, concerns (but with slight variations) were raised by Short et al.,
(1998, 2000), Young (1995), Tricker (1984), and Keasey and Wright (1993). Short et al., (2000) point out
that there is a need to ensure the twin goals of accountability and enterprise are viewed as equally important.
Young (1995) argues that organisations are usually faced with trade-offs between accountability and
enterprise. He also states that excessive accountability is likely to stifle an organisation’s entrepreneurial
activity. Some authors (e.g. Tricker, 1984 and Keasey and Wright, 1993) argue that in order to strike a
balance between accountability and enterprise, the corporate governance system should have two broad
dimensions covering both aspects of an organisation. The first dimension needs to focus on monitoring
2010 December Journal.indd 45 12/01/2011 6:42:38 p.m.

Page 46– Refereed Edition Vol VI, Issue 2, December 2010,
© 2004-2010 [email protected] No Reprints Permitted
management performance and ensuring accountability of management to shareholders. This means that
there should be an emphasis on the stewardship and accountability dimension of corporate governance.
On the other hand, the second dimension focuses on the need for governance structures and processes
that encompass a mechanism, which motivates managerial behaviour towards increasing the wealth of
the business via enhanced enterprise. Thus, good corporate governance is seen as possessing a mix of
devices, mechanisms and structures, which provide control and accountability whilst promoting economic
enterprise and corporate performance (Short et al., 2000).
Financial scandals of the 1980’s, such as Polly Peck and Maxwell and Mirror Group paved the way for a
series of explicit governance improvements from the very first formal attempt in the Cadbury Code of 1992,
followed by the Greenbury Report 1995, Hampel Report 1998, Turnbull Report 1999, Higgs Report 2003,
and the Smith Report 2003. Although all these attempts were made to help companies and institutional
investors improve corporate governance, various criticisms were made regarding the corporate governance
code of best practice especially with regard to highlighting the need to ensure that the twin goals of
accountability and enterprise are achieved with equal importance (Short et al., 2000).
Theoretical background and propositions development
Central to the agency theory and the issue of corporate governance in large organisations is the
perception of a separation of ownership and control where shareholdings in large organisations tend to be
so diffuse and small to the extent that shareholders possess neither the incentives nor ability to effectively
monitor managerial behaviour. Bearle and Means (1932) argued that because of the diffused ownership
structure, shareholders were unable to exercise control over managers, providing them with the opportunity
to pursue their own interests at the expense of the shareholders. In recent times, however the once
characterised ownership structure as dispersed has become more concentrated via the emergence of a
relatively small number of institutional investors.
Agency theory suggests that corporate ownership and governance systems can affect managers’
willingness to take risks (Jones & Butler, 1992). The type of ownership determines a company’s relationship
with shareholders and its investment horizons. Having major shareholders is one way to monitor executive
decision and ensure attention is given towards corporate entrepreneurship. Agency theory suggests that
there are two major aspects that can influence managers to pursue corporate entrepreneurship: ownership
by firms’ executives and ownership by powerful and vigilant shareholders (Jones & Butler, 1992).
Executive Ownership
In today’s competitive business it is important for a company to inculcate a sense of belonging in order
to create a long-term commitment towards the organisation. Bryant (1997) made a criticism that senior
executives have over emphasized short-term performance and there was a lack of support towards long-
term value creating activities such as corporate entrepreneurship. One of the reasons was due to a lack
of ownership being practised in the companies they managed (Wright et al., 1996). This would encourage
executives to behave opportunistically by supporting projects that would increase their own wealth and
further ensure their job security. Also, as executive compensation was usually based on short-term financial
performance, executives may have had little incentive to promote corporate entrepreneurship when they had
low ownership stakes in the organisation (Malatesta & Walling, 1988).
2010 December Journal.indd 46 12/01/2011 6:42:38 p.m.

Vol VI, Issue 2, December 2010, Page 47 – Refereed Edition
© 2004-2010 [email protected] No Reprints Permitted
In addition, Fama and Jensen (1983) noted that a lack of ownership would discourage executives from
supporting corporate entrepreneurship, as they would have to put their salaried position in jeopardy. Also,
executives would have to increase their personal cost, as they would have to master new skills and manage
new uncertainties, which may raise executives’ anxieties about corporate entrepreneurship. There was a
possibility that executives might lose their job when their firm performed badly. Poorly performing firms
increased the power of the market for corporate control, which would raise executives’ employment risk
(Zahra, 2000). In avoiding risk, executives may have focused on maintaining an acceptable level of short-
term performance. By having short-term perspectives, executives would withhold investment towards new
entrepreneurial activities and overlook new business opportunities, which would enhance the performance
of the organisation on a long-term basis. Therefore, the provision of executive ownership may encourage
them to be more long-term focused which would help to build corporate entrepreneurship activities in the
organisation (Jones & Butler, 1992).
On the other hand, there are negative implications of providing large amounts of ownership to executives
when it would tie large parts of their job performance to the performance of the company and this would
create uncertainty in terms of their income and encourage them to be risk averse. Also, Lewellen et al.,
(1987) argued that there existed the potential for differential propensities for exposure to risk, different time
horizons and different attitudes to work. They argued that the behaviour of executives whose remuneration
was predominantly independent of corporate performance (and shareholder wealth) may be characterised by
greater risk-aversion, shorter time horizons in appraising decisions and diminished effort.
In addition, increasing ownership stakes in the company was believed to encourage managers to
be more short-term focused in terms of increasing an organisation’s performance rather than focusing
on the long-term aspect, which is building an entrepreneurial organisation. This was caused by tying a
large amount of the executive remuneration to the performance of an organisation, causing executives to
become more focused in improving the financial performance of the company rather than towards corporate
entrepreneurship, which would be a long-term effort. Furthermore, the annual appraisal system, which
emphasised performance, would provide greater pressure on the executives to improve the bottom line of
the company rather than focusing on entrepreneurial activities where the result of these efforts could only be
seen after several years.
Drawing on the above, it is suggested that providing ownership to executives may increase their sense
of belonging towards the organisation and encourages them to be more focused on the long-term in order
to increase corporate entrepreneurship levels in the organisation. However, this effect of ownership will be
reduced if too high an equity is provided to them. This is because executives will have a tendency to become
more risk averse and short-term focused in order to increase the profits of the organisation rather than being
focused on the long-term. Thus, what is expected there maybe a relationship between entrepreneurial
activities and providing too high an executive ownership. This paper addresses and investigates this
conflicting issue as to whether providing large amounts of executive ownership might have an impact in
building an entrepreneurial organisation. Therefore, the following proposition is stated as:
P1a: There is a relationship between executive ownership and the level of corporate entrepreneurship.
P1b: There is no relationship between executive ownership and the level of corporate entrepreneurship.
2010 December Journal.indd 47 12/01/2011 6:42:38 p.m.
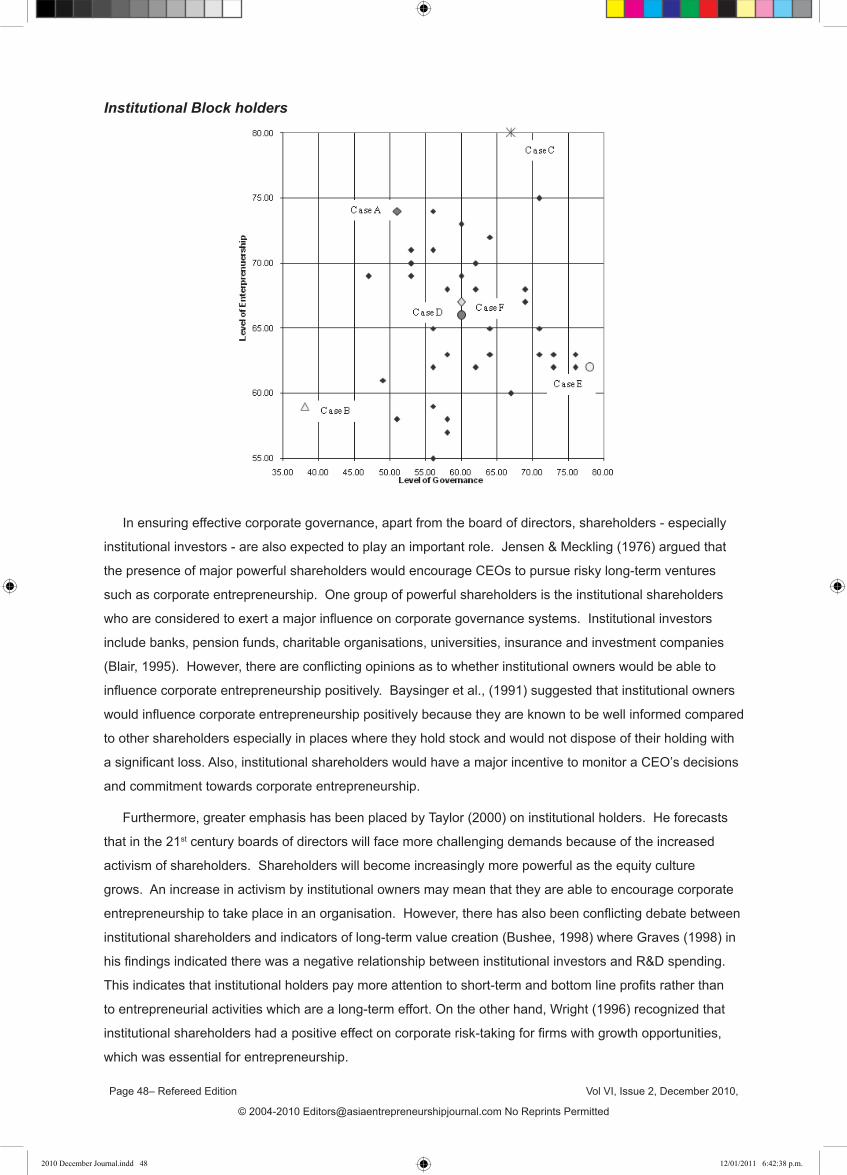
Page 48– Refereed Edition Vol VI, Issue 2, December 2010,
© 2004-2010 [email protected] No Reprints Permitted
Institutional Block holders
In ensuring effective corporate governance, apart from the board of directors, shareholders - especially
institutional investors - are also expected to play an important role. Jensen & Meckling (1976) argued that
the presence of major powerful shareholders would encourage CEOs to pursue risky long-term ventures
such as corporate entrepreneurship. One group of powerful shareholders is the institutional shareholders
who are considered to exert a major influence on corporate governance systems. Institutional investors
include banks, pension funds, charitable organisations, universities, insurance and investment companies
(Blair, 1995). However, there are conflicting opinions as to whether institutional owners would be able to
influence corporate entrepreneurship positively. Baysinger et al., (1991) suggested that institutional owners
would influence corporate entrepreneurship positively because they are known to be well informed compared
to other shareholders especially in places where they hold stock and would not dispose of their holding with
a significant loss. Also, institutional shareholders would have a major incentive to monitor a CEO’s decisions
and commitment towards corporate entrepreneurship.
Furthermore, greater emphasis has been placed by Taylor (2000) on institutional holders. He forecasts
that in the 21st century boards of directors will face more challenging demands because of the increased
activism of shareholders. Shareholders will become increasingly more powerful as the equity culture
grows. An increase in activism by institutional owners may mean that they are able to encourage corporate
entrepreneurship to take place in an organisation. However, there has also been conflicting debate between
institutional shareholders and indicators of long-term value creation (Bushee, 1998) where Graves (1998) in
his findings indicated there was a negative relationship between institutional investors and R&D spending.
This indicates that institutional holders pay more attention to short-term and bottom line profits rather than
to entrepreneurial activities which are a long-term effort. On the other hand, Wright (1996) recognized that
institutional shareholders had a positive effect on corporate risk-taking for firms with growth opportunities,
which was essential for entrepreneurship.
2010 December Journal.indd 48 12/01/2011 6:42:38 p.m.

Vol VI, Issue 2, December 2010, Page 49 – Refereed Edition
© 2004-2010 [email protected] No Reprints Permitted
Institutional block holders were seen to play a significant role in increasing the corporate entrepreneurship
level in the organisation where they would take great interest in increasing the performance of the company,
as they own a large amount of shares in the company, which would allow them to exercise their influence on
the company. Some researchers believe that large stock holdings empower, if not compel, them to promote
long-term value creation activities (Lowenstein, 1988, Hansen & Hill, 1991, Roe, 1994, Smith, 1996). On the
other hand, institutional block holders are also seen to have a negative impact in terms of too much self-
interest involvement, which may not be in the interests of other shareholders or to the long-term benefit of
the organisation. Thus, this paper addresses and investigates this conflicting but interesting issue of whether
a high dominance of institutional block holders would have an impact on corporate entrepreneurship. The
following proposition is stated as:
P2a: There is a relationship between a predominance of institutional block holders and the level of
corporate entrepreneurship.
P2b: There is no relationship between a predominance of institutional block holders and the level of
corporate entrepreneurship.
Method
This paper is based on a research project that explored the relationship between ownership structure and
corporate entrepreneurship activities in firms. Using the U.K FTSE 100 companies, this study addresses
the impact of corporate governance internal control mechanisms i.e. ownership structure on entrepreneurial
activities within these companies and seeks to determine whether they have been affected (adversely or
otherwise) by the mandatory requirements of corporate governance. The research used data from surveys,
interviews and secondary data to investigate the relationship between ownership structure and corporate
entrepreneurship. Questionnaires were distributed to the top 100 companies which consist of service and
non service companies. The study had a response rate of 42 companies (26 service companies and 26 non
service companies).
Two indexes were developed to measure the corporate entrepreneurship and corporate governance
levels of the FTSE 100 companies. The corporate entrepreneurship index was adapted from the previous
measurements developed by Morris (1996) and Kuratko et al. (1990, 1997) to measure the level of
entrepreneurial activities in the organisations. Also, reference was made to the research of Moerloose
(2000) to include additional questions in the area of new product and service innovation with the intention of
ensuring that there would be a comprehensive coverage in this aspect. After designing the questions for the
Corporate Entrepreneurship Index, opinions from experts in the industry were obtained to validate the index.
As for the Corporate Governance Index the secondary data collection using annual reports was used to
measure the governance level of the companies. Outside perspectives were obtained to view the Corporate
Governance Index in terms of the reliability and validity of the instrument. Three main groups of experts
were selected to represent the areas of remuneration, board and institutional shareholders: Remuneration –
New New Bridge Street Consultant (NBSC); Board of Directors - Egon Zehnder International (PRO: NED),
Institutional Shareholders - Association of British Insurers (ABI) & Universities Superannuation Scheme
(USS). The Score Graph was developed to plot the score of the 42 companies on the corporate governance
and corporate entrepreneurship level and to select 6 companies for the case studies based on their total
2010 December Journal.indd 49 12/01/2011 6:42:38 p.m.

Page 50– Refereed Edition Vol VI, Issue 2, December 2010,
© 2004-2010 [email protected] No Reprints Permitted
score. This graph selected 4 companies that are situated at the far end and 2 at the centre of the graph.
The main objective of developing the score graph was to select companies for the interview session. This
can be seen in Diagram 1.0 where there are 6 symbols that show the selection of the companies for the case
studies.
Diagram 1.0: Score Graph
Analysis & Findings
Executive Ownership: Quantitative & Qualitative Findings
A prior study conducted by Fama & Jensen (1983) found that a lack of ownership discouraged executives
from supporting corporate entrepreneurship as in so doing they might be putting their salaried positions in
jeopardy. Also, arguments provided by other researchers found that providing executives with ownership
could encourage them to be more long-term focused which could help to foster corporate entrepreneurship
activities in the organisation (Jones & Butler, 1992) but the effects would reduce if too high a level of
ownership was provided to them as this could cause executives to become more risk averse. The findings
of the bivariate correlation analysis indicated that there was an insignificant relationship between executive
ownership and corporate entrepreneurship (table 1). Therefore, proposition 1a was rejected. However, to
verify the above statements interviews were conducted to obtain further details on providing large amount of
executive ownership would have an impact on enterprise activities.
Table 1: Bivariate Correlation Analysis Result
Shares Held by Director % Shares Held by Non-Exec Entrepreneurship Level Pearson CorrelationSig. (2-tailed) N
.111
.485 42
-.0.90.572 42
** Correlation is significant at the 0.01 level (2-tailed).* Correlation is significant at the 0.05 level (2- tailed)
Six companies were selected for the interview using the scatter graph. The interview findings indicated
that the respondent from Company A confirmed that it did impact, but Companies B, C, D, E and F indicated
otherwise (Table 2).
Table 2: The Relationship between Executive Ownership and Corporate Entrepreneurship
In your opinion can large executive ownership diminish the spirit of building an entrepreneurial organisation? If yes or no why?
Case
Significant AInsignificant B, C, D, E & F
Company A, classified as highly entrepreneurial but with low governance, recognized that providing a
high level of executive ownership would diminish the spirit of building an entrepreneurial organisation as it
would create risk averse employees. Furthermore, this company observed that most of the executives were
towards the end of their career, meaning that their time horizons would not be too forward looking. They
would rather protect their investment than taking unnecessary risks, which would be good for the business.
Therefore, it would be crucial to create the right balance. Company A realized the implications of having a
large amount of ownership, when a remuneration review was conducted in 2004 where the CEO was only
2010 December Journal.indd 50 12/01/2011 6:42:38 p.m.

Vol VI, Issue 2, December 2010, Page 51 – Refereed Edition
© 2004-2010 [email protected] No Reprints Permitted
allowed to own shares of not more than 3 times their salary; whereas executive directors were offered less
than twice. The following quote illustrates these points:
Case A: “… I think it has to be a significant proportion of the individuals’ wealth, then I think it will then make
them be more risk averse. Generally most of the executives’ directors are towards the end of
their career, so perhaps their time horizon isn’t that great, so they might be looking to protect their
investment rather than taking the risk that will be good for the business. You do need to have a
balance of it. I think that is one of the reasons why we had a remuneration review last year and we
actually set the target for executive directors and CEO. The guideline is 3 times less of the salary in
terms of shares for the CEO and for the directors it is twice”.
On the other hand, Companies B, C, D, E & F revealed that a large amount of executive ownership
does not diminish the spirit of stimulating entrepreneurial activities in an organisation. Instead, Company B
perceived that it would align the executives’ interest with shareholders and would act as a motivating device.
Company C stressed that most crucial, executives need to have a sense of responsibility regarding
their key role. This company perceived that it was important that the executives were being controlled
and checked in terms of their decision-making. It was crucial to have the right sort of controls, checks and
balances towards the CEO and executives because a large number of people relied upon the business and if
wrong decisions were made, the repercussions could affect the rest of the employees who were left working
in the organisation.
In addition, Company D indicated that providing large ownership created a greater sense of belonging
towards the organisation. Furthermore, it depended on the underlying culture of the organisation whether
the nature of the business was based on a short or long-term focus. If it was geared more towards the
short-term then it would create a more risk averse culture within the organisation. Likewise, Company E
felt it would depend on the short or long-term view that the executives had undertaken. The provision of a
large amount of ownership would mean that the executives’ shares would be worth more money and this
would focus their interest in the share price of the company instead of monitoring the company activities
and actions; this would induce them to be more short-term focused and therefore be risk averse. On the
other hand, if the executives had taken a long-term view, then they would focus more on the benefits to the
company in the long run. However, it was argued that the amount of shares owned by the executives in
comparison to the proportion of the company would be a very small percentage due to the large size of the
business. Similarly, Company F revealed that their executives held a relatively small amount of shares but
it would certainly contribute to their executives having a significant interest in the financial success of the
business. This would then drive towards building an entrepreneurial culture within the firm.
In summary, the interview results indicated that most companies found that a high level of executive
ownership did not diminish the spirit of building an entrepreneurial organisation. Similar results were also
revealed using the quantitative findings. This seemed to indicate that providing high levels of ownership
to executives would tend to align executives’ interests with shareholders, act as a motivating device,
encourage executives to be more interested in activities of the business and the share price, increase the
financial success of the business and motivate them to respond entrepreneurially. This conformed with the
arguments made in previous research studies cited that a lack of ownership would discourage executives
2010 December Journal.indd 51 12/01/2011 6:42:39 p.m.

Page 52– Refereed Edition Vol VI, Issue 2, December 2010,
© 2004-2010 [email protected] No Reprints Permitted
from corporate entrepreneurship activities as they might have had to put their salaried position in jeopardy,
increased personal costs to master new skills and so to avoid risk, executives would focus on maintaining
an acceptable level of short-term performance (Fama & Jensen, 1983; Zahra, 2000). Therefore, providing
executives with ownership tended to encourage executives to be more long-term focused and helped to build
corporate entrepreneurship activities (Jones & Butler, 1992) within the firm.
Institutional Block holders: Quantitative & Qualitative Findings
Research conducted by Jensen & Meckling (1976) found that the presence of major powerful
shareholders would encourage the CEO to pursue risky long-term ventures such as corporate
entrepreneurship. Also, Baysinger et al (1991) findings indicated similar results; that institutional owners
could influence corporate entrepreneurship positively because they were known to be better informed
compared to other shareholders. This would be due to the huge amount of shares held by block holders
in a company and this would create a major incentive for them to monitor the CEO’s decision and
commitment towards corporate entrepreneurship. The bivariate correlation analysis indicated a positive
significant relationship at the 5% level between dominance of block holders and corporate entrepreneurship
which supported the findings of prior studies (table 3). The above proposition was explored further using
interviews in order to verify this statement and to examine the underlying issues about whether dominance of
institutional block holders has an impact on corporate entrepreneurship.
Table 3: Bivariate Correlation Analysis Result
% Shares Held by Block Holders
Entrepreneurship Level Pearson CorrelationSig. (2-tailed) N
.387*
.011 42
** Correlation is significant at the 0.01 level (2-tailed).* Correlation is significant at the 0.05 level (2- tailed)
The interview findings indicated that Companies C and E believed that it would create a positive effect
whereas A, D and F indicated otherwise and Company D held a neutral perspective (Table 4).
Table 4: The Relationship between Institutional Blockholders and Corporate Entrepreneurship
Does the dominance of institutional block holders in an organisation have a positive impact on corporate entrepreneurship? If yes or no why?
Case
Significant C & E
Neutral D
Insignificant A, B & F
Companies C and E, classified as being highly governed, argued that a dominance of institutional
shareholders would have a positive impact on corporate entrepreneurship. Company E revealed that most
institutional shareholders tended to take a short-term view and were more interested in the quarterly or yearly
earnings of the company. Hence, this would place pressure on a company to perform better and become a
driving force for change. Company C also held similar views that institutional shareholders may prevent the
company from taking a particular route. This was not seen as a bad thing, as they would want the company
2010 December Journal.indd 52 12/01/2011 6:42:39 p.m.

Vol VI, Issue 2, December 2010, Page 53 – Refereed Edition
© 2004-2010 [email protected] No Reprints Permitted
to be successful and it was not in their interest to have the company fail in its business. Furthermore,
Company C believed that corporate entrepreneurship did not come from institutional shareholders but from
those people working within the company and therefore encouragement would be given to them to generate
ideas and become entrepreneurial. The following quotes illustrate these points:
Case C: “… I don’t think the institutional block holders have an impact. It might stop an institutional holder
to believe that it is taking the route that the company shouldn’t be taking but I don’t think that is
necessarily a bad thing. … if they own shares they do want the company to be successful and it is
not to their interest for the company to fail”.
Case E: “… they are interested in whatever our earnings may be bi-quarterly or bi-yearly. They are
interested obviously in the value of the company and they come and talk to the finance director of
the company. I think they do probably have a positive impact because they are a force of pressure
on the company. I think that is one of the things that cause the executive directors to face pressure
on how we can do it better. So, I would say no, I don’t think they diminish the spirit of building an
entrepreneurial organisation. They are there as a force of change”.
On the other hand, Company A (classified as highly entrepreneurial and with low governance) argued
that the dominance of block holders would create a negative impact on corporate entrepreneurship as
block holders would tend to pull the organisation in one particular direction which would be for their own
benefit and this could create a negative impact on the business. Without block holders, the company
would be free to develop its own strategy and internal corporate entrepreneurship. This was based on their
previous experience, where another company held part of their shares and that limited their expansion into
the overseas market. But today, without having the block holder, their company had become much more
entrepreneurial and the company’s profit had increased tremendously as a result of running on their own.
Similarly, Company B revealed that it would have a negative impact because large block holders would want
to take a keen involvement in the decisions of the company, which would create negative implications on the
decision-making process and progress of the business. Also, it tended to cause the block holders to be risk
averse and to go into the detail of the business more than was deemed necessary.
In addition, Company F observed that most institutional investors would prefer to invest in businesses that
are regarded as low-risk and high-return and which are deemed able to provide returns quickly. This aspect
would then inhibit companies from venturing into long-term investments and this could constrain enterprising
activities from taking place within the firm, as these would require a long-term commitment. The following
quotes illustrate these points:
Case A: “… It very much depends on how they operate because I know a number of companies that have
that kind of shareholder structure, where the individual and the shareholder itself are probably
working at its own end. I think it will then be inhibiting. I think there is a danger in all cases”.
Case A: “… I would imagine any shareholding of dominance could possibly be quite negative for the
business. The large voice could pull the organisation to a particular direction. Without it the
organisation will then be free to develop its own strategy and to develop its own internal
entrepreneurship”.
2010 December Journal.indd 53 12/01/2011 6:42:39 p.m.

Page 54– Refereed Edition Vol VI, Issue 2, December 2010,
© 2004-2010 [email protected] No Reprints Permitted
Case A: “… I think if you look back at 1996, where we were held by another company where they told us
what to do, limited our expansion overseas and if you look at our business today it is very different
now. The business is much more entrepreneurial and the profit has increased hugely and the
reason is because we are now running on our own”.
Case B: “… I could imagine if you have a major shareholder who owns 40% of the company that could
either have a positive impact but I think it is more likely for a negative impact on corporate
entrepreneurship because when they have large block holding they would want to have a
keen involvement in the decisions of the company, which might have a negative impact on the
decision-making”.
Case F: “…They are not investing in a business which they regard as high risk and low return. But they are
investing in a business that has low risk and high-return”.
Company D, positioned at the centre of the Score Graph, held a neutral view in terms of the dominance of
block holders and its implications towards corporate entrepreneurship. According to this company, there were
different types of institutional shareholders and some would take a short-term view in terms of their strategy
and some tended to take, by nature, a long-term view. This would very much depend on the strategy of the
fund managers. If they tended to be short-term focused then they would have a short-term attitude and this
would serve to diminish the spirit of building long-term goals for the company. Based on this company’s
observations, most institutional shareholders tended to take a short-term view and therefore, this would
have a negative repercussion on corporate entrepreneurship. However, this company equally admitted that
there were situations where institutional shareholders would press the company into taking more risks. The
following quotes illustrate these points:
Case D: “… I think in general, institutional shareholders tend to be more short term in their strategies
but then there are some that are long-term in nature. I think we have some very short-term attitude
institutional shareholders. I think it all depends on how the fund manager is set up to and not the
liability of the institution is all about.
Case D: “… If you have short-term shareholder then you will have short-term attitude and it will then diminish
the spirit of long-term goals. Most of the institutional shareholders have a short-term view and therefore
it would have a negative impact on corporate entrepreneurship. But then there are occasions where
they will press for the company to take more risk”.
In summary the analysis, using qualitative and quantitative approach, revealed no clear consensus as to
the nature of the influence of block holders on entrepreneurial activities. The conflicting results might have
arisen from the tendency to view this type of investor as a ‘monolithic group’. This result indicated that the
impact depended on the type of institutional block holders, i.e. whether they were short-term and long-term
holders. Different groups of institutional investors might pursue different goals and emphasise different
objectives and investment horizons (Kochhar & David, 1996; Roe, 1994). The short-term institutional holders
would be more interested in making a quick profit and would tend to be more risk averse should the company
wish to invest and, furthermore, they were inclined to go into great detail about the business which could
slow down the decision-making process of the company (Chaganti & Damanpour, 1991). Fund managers
would usually focus on maximizing their portfolio’s annual performance (Jacob, 1991). If the value of stock
2010 December Journal.indd 54 12/01/2011 6:42:39 p.m.

Vol VI, Issue 2, December 2010, Page 55 – Refereed Edition
© 2004-2010 [email protected] No Reprints Permitted
declined, they might discontinue their investment in the company and this would pressure executives to
overlook those corporate entrepreneurship projects with long pay-back periods (Graves, 1988; Porter, 1992;
Hill et al., 1988). On the other hand, long-term institutional holders would tend to encourage corporate
entrepreneurship, as this would make them inclined to invest for a longer period with that company.
Conclusion
This study analysed two aspects of ownership structure i.e. executive ownership and dominance of
institutional block holders, and the consequences towards stimulating entrepreneurial activities within the
organisation. The results revealed that a high level of executive ownership did not diminish the spirit of
building an entrepreneurial organisation. The interview results indicated that most companies found that
a high level of executive ownership did not diminish the spirit of building an entrepreneurial organisation.
Similar results were revealed using the quantitative approach. This seemed to indicate that providing
high levels of ownership to executives would tend to align executives’ interests with shareholders, act as a
motivating device, encourage executives to be more interested in activities of the business and the share
price, increase the financial success of the business and motivate them to respond entrepreneurially. This
conformed with the arguments made in previous research studies cited that a lack of ownership would
discourage executives from corporate entrepreneurship activities as they might have had to put their salaried
position in jeopardy, increased personal costs to master new skills and so to avoid risk, executives would
focus on maintaining an acceptable level of short-term performance (Fama & Jensen, 1983; Zahra, 2000).
Therefore, providing executives with ownership tend to encourage executives to be more long-term focused
and help to build corporate entrepreneurship activities (Jones & Butler, 1992) within the firm.
As for dominance of institutional block holders, the analysis using both the qualitative and quantitative
approach, revealed no clear consensus as to the nature of the influence of block holders on entrepreneurial
activities. The conflicting results might have arisen from the tendency to view this type of investor as a
‘monolithic group’. This result indicated that the impact depended on the type of institutional block holders,
i.e. whether they were short-term and long-term holders. Different groups of institutional investors might
pursue different goals and emphasise different objectives and investment horizons (Kochhar & David, 1996;
Roe, 1994).
2010 December Journal.indd 55 12/01/2011 6:42:39 p.m.

Page 56– Refereed Edition Vol VI, Issue 2, December 2010,
© 2004-2010 [email protected] No Reprints Permitted
References Baysinger, B.D., Kosnik, R.D. & Turk, T.A. (1991) “Effects of Board & Ownership Structure on Corporate R&D
Strategy”, Academy of Management Journal, 34, pp. 205-214. Berle, A. & Means, G. (1932) “The Modern Corporation and Private Property”, New York.Blair, M.M. (1995) Ownership and Control Rethinking Corporate Governance for the Twenty First Century,
Washington, DC: Brookings Institution.Bryant, A. (1997) Some Secound Thoughts on Opinion, New York Times, September 21, Section 3, pp.1.Bushee, B.J. (1998) “The Influence of Institutional Investors on Myopic R&D Investment Behaviour”, The
Accounting Review, 73, pp. 305-333.Core, J.E., Holthausen, R.W. & Larcker, D.F. (1999) “Corporate Governance, Chief Executive Officer
Compensation and Firm Performance”, Journal of Financial Economics, 51, pp. 371-406.Eisenhardt, K.M. (1989) “Building Better Theories from Case Study Research”, Academy of Management
Review, 14, pp. 532-550.Fama, E.F. & Jensen, M.C. (1983) “Separation of Ownership & Control”, Journal of Law & Economics, 26,
pp. 301-325.Graves, S.B. (1998) “Intuitional Ownership and Corporate R&D in the Computer Industry”, Academy of
Management Journal, 31, pp. 417-428.Graves, S.B. (1998) “Intuitional Ownership and Corporate R&D in the Computer Industry”, Academy of
Management Journal, 31, pp. 417-428.Hansen, G.S. & Hill, C.W.C. (1991) “Are Intuitional Investors Myopic? A Time Series Study of Four
Technology Driven Industries”, Strategic Management Journal, 12, pp. 1-16.Hill, C.W., & Snell, S.A. (1988) “External Control, Corporate Strategy and Firm Performance in Research
Intensive Industries”, Strategic Management Journal, 9, pp. 577-590.Jacob, M.T. (1991) Short-term America: The Causes and Cures of Our Business Myopia, Cambrige, MA:
Harvard Business School Press.Jensen, M. & Meckling, W. (1976) “Theory of the Firm: Managerial Behaviour, Agency Cost & Ownership
Structure”, Journal of Financial Economics, 3, Oct, pp. 306.Johl, S.K. (2006). Corporate Entrepreneurship and Corporate Governance: An Empirical Analysis,
Unpublished Doctoral Thesis, University if Nottingham, UK.Jones, G.R. & Butler, J.E. (1992) “Managing Internal Corporate Entrepreneurship: An Agency Theory
Perspective”, Journal of Management, 18(4), pp. 733-749.Kochhar, R. & David, P. (1996) “Institutional Investor and Firm Innovation: A Test of Competing Hypotheses”,
Strategy Management Journal, 17(1), pp. 73-84.Kuratko, D.F. Hurley, K.M. & Hornsby, J.S. (1997) Developing a Corporate Entrepreneurship Training
Program, In: Proceedings of the Internationalising Entrepreneurship Education and Training Conference, Monterey Bay, California, USA.
Kuratko, D.F., Montagno, R. & Hornsby, J. (1990) “Developing an Intrapreneurial Assessment Instrument for Effective Corporate Entrepreneurial Environment”, Strategic Management Journal, Summer, 11, pp. 49-58.
Lewellen, W.G., Loderer, C. & Martin, K. (1987) “Executive Compensation Contracts and Executive Inventive Problems: An Empirical Analysis “, Journal of Accounting and Economics, 9(3), pp. 287-310.
Lowenstein, L. (1988) What’s Wrong with Wall Street: Short-term Gain and The Absentee Shareholder, Reading, MA: Addision Wesley.
Malatesta, P.H & Walling, R.A (1988) “Poison Pill Securities: Stockholder Wealth, Profitability and Ownership Structure”, Journal of Financial Economics, 20, pp. 347-376.
Moerloose, C. (2000) “ New Product Success Factors, New Product Typology and Moderating Impact and Success Factors According to the Type of Newness, 7th International Product Development Management Conference, Leuven, Belgium, May 29-30, 2000.
Monks, R.A.G. & Minow, N. (2001) Corporate Governance: 2nd Edition, Oxford, Blackwell Publishers Ltd. Morris, M.H. & Kuratko, D.F. (2002) Corporate Entrepreneurship: Entrepreneurial Development within
Organisations, Orlando, Harcourt College Publishers. Morris, M.H. & Sexton, D.L. (1996) “The Concept of Entrepreneurial Intensity”, Journal of Business
Research, 36(1), pp. 5-14.Porter. M.E. (1992) “Capital Disadvantage: America’s Failing Capital Investment System”, Harvard Business
2010 December Journal.indd 56 12/01/2011 6:42:39 p.m.

Vol VI, Issue 2, December 2010, Page 57 – Refereed Edition
© 2004-2010 [email protected] No Reprints Permitted
Review, 70, pp 65-82.Roe, M.J (1994) Strong Managers, Weak Owners, Princeton NJ: Princeton University Press.Short, H., Keasey, K. & Wright, M. (2000) “Corporate Governance: Accountability versus Enterprises”,
Corporate Governance and the Reform of Company Law, 8(1), pp. 70-91.Smith, M.P. (1996) “Shareholder Activism by Institutional Investors: Evidence from CalPERS”, Journal of
Finance, 51(1), March, pp. 227-252.Taylor, B. (2001) “From Corporate Governance to Corporate Entrepreneurship”, Journal of Change
Management, 2(2), pp 128-147.Taylor, B. (2001) “From Corporate Governance to Corporate Entrepreneurship”, Journal of Change
Management, 2(2), pp 128-147.Wright, P., Ferris, S.P., Sarin, A. & Awasthi, V. (1996) “Impact of Corporate Insider, Block holder and
Institutional Equity Ownership on Firm Risk Taking”, Academy of Management, 39(2), pp. 441-463.Young, Lord, of Graffham (1995) “The Spirit of Enterprise”, In Enterprise and Governance, the Proceedings of
Conference held at Institute of Directors’, London, Institute of Directors, London. Zahra, S.A. & Gravis, D.M. (2000) “International Corporate Entrepreneurship and Firm Performance: The
Moderating Effect of International Environmental Hostility”, Journal of Business Venturing, 15, pp. 469-492.
Zahra, S.A., Neubaum, D.O. & Huse, M. (2000) “Entrepreneurship in Medium Size Companies: Exploring the Effects of Ownership and Governance System”, Journal of Management, 26(5), pp. 947-976.
2010 December Journal.indd 57 12/01/2011 6:42:39 p.m.

Page 58– Refereed Edition Vol VI, Issue 2, December 2010,
© 2004-2010 [email protected] No Reprints Permitted
Call for Papers(blind-refereed 12-15 page journal contributions)
Publisher:ISSN 1177-4541www.rossismith.com
We are looking for paper submissions and for Special EditionGuest Editors for special editions on:
Entrepeneurship in the Public Sector andEntrepreneurship in Health Enterprises
Paper submission deadline for our April 2011 issue: 18 December 2010Paper submission deadline for our July 2011 issue: 16 February 2010
All papers are submitted electronically, check submission guidelines at:http://www.asiaentrepreneurshipjournal.com/instructions.html
15-page maximum length
Paper submission deadline for the SPECIAL EDITION on Public SectorEntrepreneurship: 21 March 2011
Paper submission deadline for the SPECIAL EDITION on Health EnterprisesEntrepreneurship: 21 March 2011
Send your full paper to: [email protected]
To apply for a Special Edition Guest Editorposition, contact: [email protected]
Smith
Rossi
Refereed EditionPrint ISSN: 1177-4541 On-Line ISSN: 1176-8592
2010 December Journal.indd 58 12/01/2011 6:42:39 p.m.

Vol VI, Issue 2, December 2010, Page 59 – Refereed Edition
© 2004-2010 [email protected] No Reprints Permitted
Entrepreneurship in India and China
Hany H. Makhlouf, Ph.D.Professor and Chair
Department of Management, Hospitality and Graduate StudiesSchool of Business and Public Administration
University of the District of ColumbiaWashington, D.C.
E-mail Address: [email protected]
.
Introduction
After China undertook its first measures toward economic liberalization in 1978, it has followed a path
that separates its economic policy from its communist ideology and political system. It has adopted a
series of policies that have made it possible for Chinese entrepreneurs and foreign investors to participate
in its economic revival and export-oriented growth programs. The success of this major economic shift in
transforming it into an economic powerhouse and in lifting a major segment of its population out of poverty
has amazed skeptics who believed that political reforms should have preceded or, at least, accompanied
such liberalization measures. Although the government and state-owned enterprises continue until today
to play a major role in the economy, China’s official policies have gradually opened the door to private
initiative, and have made possible the emergence of a new class of business owners that has been allowed
to generate personal wealth and enjoy the rewards of entrepreneurial risk-taking. Even some Communist
Party officials have become a part of the new wealthy business class by participating in new ventures and
using their influence to promote others. This economic liberalization policy has also allowed many women to
start their own businesses. According to China’s Association of Women Entrepreneurs, one in five Chinese
entrepreneurs were women in 2002, and 80 percent of those enterprises were established after 1995.
Moreover, those women-owned and run firms were active in manufacturing, wholesaling, retailing, and social
services (Qingqi, 2006, p. 2).
The circumstances in India were different at the time its economic reforms were introduced in 1991.
Although India had a system, in which the state played a major role in the economy, it has had a democratic
system of government since independence, and the private sector continued to operate along side the
public sector. Like China, however, India suffered for decades from economic mismanagement, lack of
capital, under-investment, skeptical and fearful attitude toward foreign investment, and an inclination among
its citizens to avert the risk involved in business start-ups. In addition, it lagged, even behind China, in its
physical infrastructure. As also happened in China, it had to allocate substantial resources to the basic needs
of its large population. Although India started in the 1990s to welcome more foreign investment than it did
in the previous three decades, it did not go out of its way to encourage the flow of such investment, the way
2010 December Journal.indd 59 12/01/2011 6:42:39 p.m.
Page 60– Refereed Edition Vol VI, Issue 2, December 2010,
© 2004-2010 [email protected] No Reprints Permitted
China did soon after the institution of its reforms. It has also lagged behind China in “embracing its diaspora”.
According to one estimate, there are more than 50 million Chinese and over 20 million Indians living outside
their home countries (Lagace, 2008, p.3).
To operate within the Chinese system, in which the government itself acts as an entrepreneur that owns
and operates a large number of industrial and business enterprises (SOEs), Chinese entrepreneurs found it
necessary to establish alliances with local governments and other businesses as well as informal networks
(guanxi). Many of them have also adopted what Michael Porter calls an “overall cost leadership strategy”,
emphasizing lower operating costs and lower prices in order to maintain a competitive advantage both at
home and abroad. This has often resulted in entrepreneurial ventures becoming imitators who would take
advantage of lax enforcement of intellectual property rights and anti-piracy codes; thus, de-emphasizing
product innovations that require substantial investment in R&D. By ignoring violations of intellectual property
rights, the Chinese government reduced the urgency to adopt risky product innovation strategies.
Background
It wasn’t long ago when one wouldn’t associate entrepreneurship with either India or China.
The Indians have traditionally been known as risk averters, and “entrepreneurship and China used to
be oxymoron” (Liao and Sohmen, 2001, p. 27). The Communists who rose to power in China in 1948
suppressed private businesses and eliminated private property. China’s private sector officially came to an
end in 1956, except for street peddler, smugglers, and some micro-businesses that were too small to attract
attention, while the public sector rose and established a monopoly over manufacturing and distribution. Out
of an estimated 9 million business establishments that existed in 1949, only 150,000 managed to survive
until 1978 (Liu, 2001, p.1).
After going through decades of economic stagnation, during which China was described as a sleeping
giant, the Chinese government began a series of reforms aiming at the modernization of its economy.
These reforms eventually opened the door for the re-emergence of private/entrepreneurial and for-profit
enterprises. These reforms also ended the antagonistic view toward foreign investment and the involvement
of multinational firms in the Chinese economy. By 1990, township and village enterprises (TVEs) and other
privately-owned businesses began to play a significant role in China’s economic revival (Liao and Sohmen,
2001, p. 27).
Some of the newly established small entrepreneurial firms found their niche in the shadow of state-owned
enterprises (SOEs), filling in gaps in manufacturing, services and distribution. These businesses, called
individual businesses or getibu, have been limited to hiring a maximum of five workers. In the event that they
needed to hire more workers, they would be re-classified and called Private Enterprises or “saying qiye”. By
1988, about 500,000 businesses qualified to be classified as Private Enterprises (Liu, 2008, p.3).
As those Private Enterprises (saying qiye) continued to grow in size and importance, the Government
started to classify them into four groups:
“Red hat firms” that operate as township or village enterprises (TVEs) or Urban Collective
Enterprises (UCEs)
Rented collective firms that can be operated by entrepreneurs or some other private operators
2010 December Journal.indd 60 12/01/2011 6:42:39 p.m.

Vol VI, Issue 2, December 2010, Page 61 – Refereed Edition
© 2004-2010 [email protected] No Reprints Permitted
Shareholding firms that distributed shares or profits to employees
Foreign investment joint ventures that may partner with local collectives or state-owned enterprises
(SOEs)
Since India never outlawed private businesses, as China did for decades, the 1991 reforms didn’t seem
as drastic, though still significant in boosting entrepreneurship. As those reforms changed the political, legal,
and regulatory environment in favor of privately owned businesses, entrepreneurship flourished in new
industries like Information Technology (IT) and pharmaceuticals, and traditional industries like apparel and
textiles.
Barriers to Entrepreneurship and Survival Strategies in China
Despite a sequence of steps taken by the Chinese government toward economic liberalization,
entrepreneurs continued to face barriers that complicated, and sometimes threatened, their firms’ growth and
survival. The problems they faced have included political and legal uncertainty, a banking system that was
not geared to serve private enterprises, social stigma about leaving regular jobs in order to sell things, lack of
venture capital, and governmental institutions that favored state-owned enterprises (SOEs). In many cases,
private businesses have found the central government, which sets the rules of the game, itself playing the
role of a competitor. As Jing Yu Yang and Jiatan Li (2008) observed, “in the initial stage of reform, the non-
state sector has only been assigned a supplementary role to the dominant public economy. This status has
led to discrimination against the small entrepreneurial firms in obtaining factor inputs” (p. 347). Lamenting
this reality, one Chinese entrepreneur once stated: “As entrepreneurs we are condemned either to being the
concubines of state enterprises or the mistresses of multinationals” (McGregor, 2006, p.11).
Yasheng Huang of MIT’s Sloan School of Management also commented on the difficulties faced by small
entrepreneurs stating: “While China (has) made genuine progress toward establishing elements of a market
economy, it is far from establishing a level playing field for those capitalists who actually matter -- the market-
driven humble entrepreneurs unattached to the government” (Financial Times, February 2, 2007). In another
article, he observed: “The root cause of China’s corporate woes is the inefficient economic system that
allocates vast financial resources, market opportunities and legal protection to the SOEs…at the expense of
private enterprises. Some economists may be impressed by the high number of new non-state companies
entering the economy, but they miss a fundamental fact: while bad economic institutions do not deter the
entry of new businesses, they do stunt their growth” (Financial Times, April 23, 2004).
In reaction to such challenges, Chinese entrepreneurs have successfully adopted defensive strategies,
based on the Chinese concept of “guanxi” (pronounced gwan shee), which provides a rationale for the use
of personal contacts to get things done outside normal channels and legal procedures. Yang and Li (2008)
described those strategies, stating that “in order to thrive and grow, entrepreneurial firms were often forced to
collide with local governments or other major constituents holding valuable resources” (p.347). Irene Hau-
Siu Chow of the University of Hong Kong (2009) sees guanxi as a kind of social capital that is “based on the
principle that who you know is more important than what you know” (p.45).
Entrepreneurs have also established hybrid businesses by virtue of which arrangements are made
with other entities for sharing and/or exchanging resources and governance structures, thus reducing the
2010 December Journal.indd 61 12/01/2011 6:42:40 p.m.

Page 62– Refereed Edition Vol VI, Issue 2, December 2010,
© 2004-2010 [email protected] No Reprints Permitted
uncertainties caused by discriminatory and confusing regulations, and a weak legal system. In addition,
alliances have been created to attain horizontal and vertical integration for the benefit of all participants.
Explaining the nature and benefits of these inter-organizational alliances, Yang and Li (2008) pointed out that
they “can reduce institutional uncertainty and enhance firms’ competitiveness in domestic and international
markets by providing subsidies, access to credit capital, and supporting infrastructure and related resources.
In addition, they offer greater capacities for generating and transmitting information. Such trust-based
relationships act as a cushion against failure” (p. 349).
To remedy the systemic problems that continued to constrain private enterprises, new measures have
been taken in recent years in order to expand the granting of loans to private medium and small-size
businesses, eliminate discriminatory practices by SOEs, and encourage entrepreneurial firms to get involved
in infra-structural projects. Furthermore, listing of private enterprises in the stock market has been made
easier and less costly. A survey by the People’s Bank of China indicated that by the end of the year 2000, the
loans granted to the private sector had reached 4.8 trillion RMB Yuan. That amounted to 48 per cent of all
banking loans. This represented a major progress for entrepreneurship in China (liu, 2008, p. 19).
Ease of Doing Business in India and China
Although the Chinese and Indian governments have greatly improved the political, legal and regulatory
environments of doing business in their respective countries, both nations still fall behind others, according to
a 2008 study conducted by the Organization of Economic Cooperation and Development (OECD). As Table
I indicates, both countries still don’t rank highly in the ease of starting a business and the ease of employing
workers. China does better than India in the ease of exporting, enforcing contracts, and closing a business,
while India surpasses China in the ease of getting credit.
Table I. East of Doing Business (Rank out of 181 Economies)
Measure China IndiaEase of Starting a Business 151 121Ease of Employing Workers 111 089Ease of Getting Credit 059 028Ease of Exporting 048 081East of Enforcing Contracts 018 180Ease of Closing a business 062 140
Based on the World Bank Group’s Doing Business, 2009
Modernizing the Infrastructure for Sustained GrowthAt the time China began its modernization and reform program, it had only four state-owned banks whose
mission was not to serve privately owned enterprises. In 2008, it had at least 14 major banks in addition to many regional, and over 100 city commerce banks. Of the reforms and adjustments that are still needed to improve the environment and business practice in China, the following are worth mentioning:
1. Full restoration of private property rights to make possible the passing of businesses from on generation to the next
2. Improving accounting and auditing standards
3. Developing codes of ethics in accounting and other professions
4. Developing quality assurance review processes (Chipman)
5. Strengthening consumer and environmental protection laws
6. Better enforcement of anti-piracy and intellectual property rights codes
7. Improving the accuracy of financial reports
2010 December Journal.indd 62 12/01/2011 6:42:40 p.m.

Vol VI, Issue 2, December 2010, Page 63 – Refereed Edition
© 2004-2010 [email protected] No Reprints Permitted
For India, sustaining its high rate of economic growth, which raised its population’s per capita income by
230% in one generation, would be difficult unless additional reform steps are taken. Eliminating infrastructure
bottlenecks, promoting competition and innovation, increasing social harmony, and streamlining
governmental decision making processes are crucial for continued growth at the rates experienced over the
last two decades. (Wolf). In addition, the government needs to give greater support for start-ups by providing
training for potential entrepreneurs, particularly in rural areas; and by sponsoring programs that would assist
entrepreneurs in obtaining the initial capital required for their new ventures.
Attracting Foreign Investment:
One of the main differences between India and China since the adoption of their reform programs is the
extent of interest shown in foreign investment. Post-1978 China has courted multinational firms, and has
offered them tax and other incentives that domestic entrepreneurs did not enjoy. It has, therefore, surpassed
India in the number of ventures established by foreign-based investors and multinational enterprises. While
allowing the entry of multinationals, India has subordinated their role to domestic businesses, many of which
continued to lobby for the continuation of the old protectionist policies.
Meanwhile, India has emerged as a haven for outsourcing both by domestic IT firms and multinational
corporations. In the first half of 2009, outsourcers in India have earned $19 billion despite a 22% reduction in
global demand for IT services (Stivastava and Hamm, 2009). Outsourcing has also been recently spread to
the pharmaceutical industry after five major western firms signed agreements with Indian companies to “take
promising compounds discovered by the multinationals, run tests to weed out the weakest candidates, and
develop some of the others into marketable drugs” (Engardio and Weintraub, 2008, p.49).
Thanks to their production efficiency, many Chinese private/entrepreneurial firms have become attractive
as contract manufacturers by foreign-based enterprises. One such firm is the American- owned R&H
Designs, which is a women’s apparel company that operated for decades in California. R&H Designs
decided to consider moving its manufacturing operations to China to take advantage of lower production
costs. After considering several Chinese firms as potential contract manufacturers, the search was narrowed
down to two firms. However, as a final test before making a final decision, R&H asked each of the two firms
to “copy five of its garments without any specifications, patterns or instructions. To everyone’s surprise, all
the versions produced in China came back nearly perfect. There was more detail, and the clothes were
of equal craftsmanship to the ones made in California. However, the dress that costs $18 to make in the
United States…would cost just $10, including the freight and customs charges to ship it…The difference
becomes more pronounced if the dress has any kind of detail work, such as embroidery or beading. In the
United States, the extra labor involved will push the cost up to $25, while in China it adds only… to around
$12.00” (Adler,2001, p.61). Such a cost differential has been a primary factor in moving a large portion of
manufacturing operations from the United States and Europe to China over the last two decades. India has
benefited from similar cost differentials, at least in its IT industry.
Indian and Chinese Multinationals:
With such success in their home markets, some Indian and Chinese entrepreneurs have become global
players, creating a modern version of the historic Silk Road. An example of such organizations is the
Tata Group of India, which is an old family-dominated company, but is run like an entrepreneurship by its
2010 December Journal.indd 63 12/01/2011 6:42:40 p.m.

Page 64– Refereed Edition Vol VI, Issue 2, December 2010,
© 2004-2010 [email protected] No Reprints Permitted
Chairman, Ratan Tata. In recent years, Tata has acquired firms in the United States and Europe, the most
recent of which is the Jaguar and Land Rover brands and steelmaker Corus in the United Kingdom. Another
impressive example of even smaller Indian enterprises that have broadened the scope of their company’s
operations beyond the Indian market is a company owned by Man Mohan Sinha and his son, who is a
close designer. This entrepreneurship has expanded its activities to the Egyptian market. Over a short
period of time the Sinhas opened three plants in the Suez Canal area to produce women’s jeans, and have
been considering constructing a fourth near Cairo. In 2007, this venture earned $40 million and had 2,700
Egyptian workers. (Reed, 2008, p. 52)
The success of women-owned businesses is clearly demonstrated in the Nine Dragons Paper Company,
founded by Zhang Yin to recycle wastepaper. This company was initially started in Hong Kong in 1986
with a small capital of 30,000 Yuan. Dissatisfied with the pace of the company’s growth, Ms. Yin moved it
to Los Angeles in 1990. However, she soon learned about China’s need to recycle packaging paper; thus,
began to ship containers of wastepaper from Los Angeles to China, and ended up becoming one of the
largest exporters of raw materials for papermaking. Ms. Yin eventually expanded her company’s collection
of wastepaper to Europe; and returned to China to establish a packaging papermaking plant in Dongguan,
which is a major industrial center in the Pearl River Delta. This factory was followed by another in Taicang
in the Jiangsu Provnice. The mission of the firm was then revised to be “the importation of waste paper
collected from the United States and Europe, and recycling it into corrugated cardboard to be sold to
Chinese electronic and toy manufacturers/exporters”. It is interesting that those Chinese manufacturers end
up using Ms. Yin’s packaging materials to pack the electronic equipment and toys they ship to the United
States and Europe; and those same packaging materials are eventually re-collected by Ms. Yin’s company
and shipped back to China for further recycling; thus, the waste paper makes a full circle along three
continents, flowing back and forth between the consumers, a recycling firm, and Chinese manufacturers.
Conclusion
Both India and China continue to amaze the world with their economic progress and the achievements
of their entrepreneurial ventures since they introduced a series of major reform measures over the last three
decades. Present day China is not the China of the 1965 Proletarian Cultural Revolution, and India is not
the country that Winston Churchill dismissed as a “mere geographical expression, a land that was no more
a united nation than the equator”. In opposition to India’s demand for independence in the late 1940s, he
warned that independent India could “fall back …through the centuries into the barbarianism and privations
of the middle ages” (Johnson, 2007, p.1A). Obviously, he was wrong. Both India and China are now more
confident about their future than at any time in their long history.
The economic progress achieved by those neighboring countries has boosted their aspirations for big
power status on a global scale. In both of these countries, entrepreneurs have emerged as s source of
positive energy and change as they helped in accelerating the pace of economic development. Despite
this progress, however, both nations continue to depend to a significant extent on imported technologies
and innovations. “Last year, 70 per cent of (China’s) machinery and electrical exports…were produced at
foreign-funded factories” (Areddy, 2101, p.B6). Both countries also lag behind the advanced economies in
the development of globally-recognized brands. Speaking to John Pomfret of the Washington Post (2010,
2010 December Journal.indd 64 12/01/2011 6:42:40 p.m.

Vol VI, Issue 2, December 2010, Page 65 – Refereed Edition
© 2004-2010 [email protected] No Reprints Permitted
May 25), Fan Chunfong, the Secretary General of China’s Industrial Overseas Development and Planning
Association, lamented the industrial giant’s dependence of foreign technologies and brands stating “we
have lost a bucketload of money to foreigners because they have brands and we don’t. .. We need to create
brands, and fast” (p. A1). Such dependence on foreign designs and innovations has also caused China
to pay significant amounts of money to foreign corporations as royalties and licensing fees. The same
applies to India. Meeting this challenge would require the commitment of more resources to R&D; and the
elimination of more of the bureaucratic, political, financial, and legal barriers that continue to stand in the way
of entrepreneurial ventures attaining more of their growth objectives.
2010 December Journal.indd 65 12/01/2011 6:42:40 p.m.

Page 66– Refereed Edition Vol VI, Issue 2, December 2010,
© 2004-2010 [email protected] No Reprints Permitted
References Adler, Carlyle (2001, March). China. FSB, 58-61.Areddy, James T. (2010, May 8-9). China Pushes Foreign Firms to Invest. The Wall Street Journal,.B6.Chipman, Stephen (2007, July 19). China’s Reforms Need Foundation. Financial Times, p.11.Chow, Irene Hau.Siu (2009, Summer). The Relationship between Social Capital, Organizational Citizenship
Behavior, and Performance Outcomes: An Empirical Study from China. SAM’s Advanced Management Journal, 44-53.
Engardio, Pete and Weintraub, Arlene (2008, September 15). Outsourcing the Drug Industry. Business Week, 49-53.
Huang, Yasheng (2004, April 23). China’s Growth Masks Weaknesses. and (2007, February 2). China is no Haven for Entrepreneurs. Financial Times, p. 13.
Johnson, Jo (2007, August 15). A Confident New Country. Financial Times, p.1B.Lagace, Martha (2008, January 28). Billions of Entrepreneurs in China and India. Harvard Business School
Working Knowledge. From http://hbswk.hbs.edu/item/5766.htmlLiao, Debbie, and Philip Sohmen (2001, Spring). The Development of Modern Entrepreneurship in China.
Stanford Journal of East Asian Affairs, 1:27-33.Liu, Yingqiu (2008). Development of Private Entrepreneurship in China: Process, Problems and
Countermeasures. From: www.mansfieldfdn,org’program_pdfs/entMcGregor, Richard (2006, February 28). Challenging Change: Why an ever Fiercer Battle Hinders China’s
March to the Market. Financial Times, p. 11.Pomfret, John (2010, May 25). Pushing Beyond ‘Made in China’: Lack of brand Names Has Beijing Striving
Harder for Innovation. The Washington Post. pp.A1, 14.Qingqi, Shi (2006). Overview of Chinese Women Owned Businesses, 1-9.Reed, Stanley (2008, November 17). The New Silk Road. Business Week, 46-52.Roberts, Dexter (2009, June 22). Where the Action is in China. Business Week, 58.Srivastan, Mehul and Steve Hamm (2009, August 3). Using the Slump to Get Bigger in Bangalore. Business
Week, 50.Wolf, Martin (2009, July 8). How India Must Change. Financial Times, p.9.Yank, Jing Yu and Jiatao Li (2008). The Development of Entrepreneurship in China. Asia Pacific Journal of
Management. 25:335-359.
2010 December Journal.indd 66 12/01/2011 6:42:40 p.m.

Vol VI, Issue 2, December 2010, Page 67 – Refereed Edition
© 2004-2010 [email protected] No Reprints Permitted
Cultural and Economic Determinants of Entrepreneurial Propensity: A Study of Multi-Ethnic Society in Malaysia
Dr. Siri Roland Xavier* Deputy Dean of the Bank Rakyat School of Entrepreneurship, University Tun Abdul Razak (UNITAR). He is also the Malaysian National Team leader for the Global Entrepreneurship Monitor (GEM) research project 2009 and the Chief Editor of the Successful Tran-Generational Entrepreneurship Practices (STEP) program.
E-mail address: [email protected]
Dr. Ahmad Zaki Ismail Associate Professor and Dean in Bank Rakyat School of Entrepreneurship, University Tun Abdul Razak (UNITAR), Malaysia. E-mail address: [email protected]
Dr. Syed Zamberi Ahmad (Corresponding author) Assistant Professor of International Business and Entrepreneurship Management at Prince Sultan University (PSU). College of Business Administration, Prince Sultan
University (PSU), Riyadh, Kingdom of Saudi Arabia. E-mail address: [email protected]; [email protected]
Abstract: This study examined the extent to which cultural and economic factors determine the
entrepreneurial propensity of multi-ethnic and developing society namely, Malaysia. Findings from the study
disclosed that, for the Malays ethnic, there was a correlation in entrepreneurial propensity for economic
factors, but no significant correlation for cultural factors. The outcome for the Chinese ethnic showed that there
are no correlation between economic factors and entrepreneurial propensity. However, there are significant
correlations to cultural factors. The result for the Indians ethnic was insignificant for both economic and cultural
factors. The finding also revealed that an analysis of levels of entrepreneurial propensity by race demonstrate
the Malays ethnic had the highest entrepreneurial propensity than the Chinese and the Indians. This study
indicates that inherent ethnicity does impact propensity for entrepreneurship. Cultural and economic factors
are determinants of entrepreneurial propensity in so far as ‘econ-political’ considerations allow and suggest
that as much as entrepreneurial propensity may be nurtured, it can also be suppressed. This study helps to
reaffirm Malaysia’s direction for national policies for entrepreneurship.
Keywords: Multi-ethnicity, Entrepreneurial propensity, Developing country, Malaysia
Type of Paper: Research paper
Introduction: Entrepreneurs have been described as individuals who innovate make decision regarding
changes that affect the resource allocation pattern, and bear risks (Hayton, et al., 2002; Holcombe, 2003;
Schumpeter, 1934; Ginsberg, 1988). Entrepreneurs are also said to possess ultimate formal authority within
an organization (Weber, 1947). Additionally, entrepreneurs are found to bear uncertainty and profit from it.
The process of entrepreneurship has even been defined as managerial behavior that consistently exploits
opportunities to deliver results beyond ones own capabilities (Scarborough et al., 2010; Audretsch and
Thurik, 2000). Fundamentally, entrepreneurs are individuals that have the talent for business, take risks,
identify business opportunities, correct errors effectively, and grab profitable opportunities. In a nutshell,
the term ‘entrepreneur’ implies a configuration of psychological traits, attributes, attitudes, and values of an
individual motivated to commence a business venture. Entrepreneurs show a unique pattern of psychological
2010 December Journal.indd 67 12/01/2011 6:42:40 p.m.

Page 68– Refereed Edition Vol VI, Issue 2, December 2010,
© 2004-2010 [email protected] No Reprints Permitted
traits. They are driven by a high need for achievement toward accomplishing tasks that challenge their
competencies. They are inordinately energetic. They assess the situation and assume responsibility for
success when they perceive a reasonable chance of achieving it through their own skill (ibid).
“Many are called but few are chosen,” suggest Aldrich and Martinez (2001) applying a biblical analogy
to successful entrepreneurs. This research in turn raises the questions: how they are called, and why they
choose to become entrepreneur. In posing these questions in the context of Southeast Asian multi-ethnic
developing society, the respond is not easily available. Many questions remain unanswered and unexplored.
Researchers acknowledge that the propensity of societies for entrepreneurship differs from one nation to
another (Delft et al., 2000; Aldrich and Martinez, 2001). A consideration of these questions requires some
thought to be place into the people who respond to this ‘calling’ and the factors that may have provided
the nudge, or even the edge, into entrepreneurship. Therefore, this research focuses on entrepreneurial
propensity in Malaysia, as a multi-ethnic and developing society, though the implications drawn may well be
applicable contextually throughout Southeast Asia. The issue of multi-ethnicity is addressed in relation to
the unique situation of the country, where the majority of the populations are Malay (65%), Chinese (26%),
Indians (8%) and other unlisted ethnic groups (1%) (Malaysia Department of Statistics, 2009). According
to Silverstein (1994), Malaysia is a multiparty system of ‘unequals’ and every change and development
in Malaysian history since independence has been influenced by communalism1 and thus, any attempt at
understanding Malaysian entrepreneurship ought to begin with this factor. This study has sought to examine
the role of cultural and economic factors in determining entrepreneurial propensity in Malaysia.
Research Questions
This study aims to investigate in details the cultural and economic determinants of entrepreneurial
propensity among multi-ethnic society in the country and attempts to answer the following research
questions:
1. is there any relationship between cultural and economic determinants for entrepreneurial
propensity in a multi-ethnic, developing society such as in Malaysia?
2. to what extent do cultural factors, determine entrepreneurial propensity in a multi-ethnic,
developing society?
3. to what extent do economic factors determine entrepreneurial propensity in a multi-ethnic,
developing society? and,
4. do the influences of cultural and economic factors on entrepreneurial propensity differ by
ethnicity?
The research questions sought to explore several issues such as why some individuals are
entrepreneurial in nature while others are not. This study looks at external factors, specifically on how
entrepreneurial propensity is affected by the key characteristics of economic and cultural conditioning for
third generational citizens in an urban multiethnic developing society. Transitional economies have different
fundamental problems and setbacks to economies with long histories of capitalism and entrepreneurship.
It is hoped that this study will allow a multi-ethnic, developing nation have a better understanding of its
1 In Malaysia, the different communities with their own religions and ethnic origins.
2010 December Journal.indd 68 12/01/2011 6:42:40 p.m.

Vol VI, Issue 2, December 2010, Page 69 – Refereed Edition
© 2004-2010 [email protected] No Reprints Permitted
entrepreneurial challenges and potential, which could lead to the creation of more conducive conditions to
promote entrepreneurship culture. To support the research findings, Global Entrepreneurship Monitor (GEM)
information is used to further strengthening the arguments and provide a contrast to local results.
Research Methodology
The Theoretical Framework
The theoretical foundations that underlie this research are the Role Model Theory (Pfeffer, 1982) and the
Marginality Theory (Light, 1979). In developing the Role Model Theory, Pfeffer (1982, pp.98-99) examines
the exposure of an individual to entrepreneurship or to entrepreneurs from a cultural perspective. He, and
others, argues that the more the entrepreneur fulfils role expectations, the more likely he/she will succeed
in a venture (see Carsrud and Johnson, 1989). Exposure to entrepreneurship may include prior work
experience in a particular line of business which is correlated positively with success (Vesper, 1982). Family
and friends also seem to serve as role models for aspiring entrepreneurs. This in turn lends support to the
idea that seeing someone else succeed encourages prospective entrepreneurs to take the risk to venture
into entrepreneurship (Roberts and Wainer, 1971; Shapero, 1971; Susbauer, 1969; Collins and Moore,
1970).
The Marginality Theory (Light, 1979) takes an economic perspective, claiming that disadvantages such
as poverty, unemployment, underemployment, and discrimination in the labour force lead members of an
economic or social minority to turn to self-employment. This theory suggests that those minority members
with economic and cultural resources will successfully enter small businesses, while others without such
resources will find self-employment in petty trade (peddling), illegal enterprises, and predatory crimes.
Sample Size and Selection
The respondents were 450 college / university students at both undergraduate and post graduate levels.
The sampling process used in this study was stratified sampling to ensure that the key target group was
sufficiently represented. The population choice within the group was randomly made. The age criterion was
between 18-40 years. The reason for this age group was that they would have felt the full effects of the
New Economic Policy after 1967 and all other economic imperatives thereafter. Because entrepreneurial
propensity involves the study of strategic intentions rather than strategic behaviours, the use of a self-
administered questionnaire and an entrepreneurial quotient test was an efficient means to collect such
intangible data. The questionnaire results were analysed using Structured Equation Modeling (SEM)
with the aid of the Statistical Package for the Social Sciences (SPSS) and Analysis of Moments (AMOS)
software. Results to the Entrepreneurial Quotient (EQ) test examined the differences in responses between
the two groups: those with entrepreneurial propensity and those without. The EQ discriminated between
entrepreneurs, and non-entrepreneurs (Huefner et al., 1996). This was then mapped against the historical
and current cultural and economic factors.
Constructs and Measured Variables
There are five (5) separate constructs were researched for each factor (cultural and economic). Each
2010 December Journal.indd 69 12/01/2011 6:42:40 p.m.

Page 70– Refereed Edition Vol VI, Issue 2, December 2010,
© 2004-2010 [email protected] No Reprints Permitted
construct was supported by two suitable questions as listed below:
a Cultural factors – the underlying basis for the cultural factor questions were the studies by Wennekers
et al. (2001), Mahmood (1994), Tan Chee-Beng (1995), Talib (1995), Hofstede (2001) and Huq (1997)
which indicated the key cultural indicators for entrepreneurial propensity (see Table 1).
Table 1: Summary of the Survey on the Cultural Indicators for Entrepreneurial Propensity
The Presence of Role ModelsQ1: Entrepreneurs are easily identifiable due to their achievementsQ3: Entrepreneurs stand out in the communityThe Family Background and BeliefsQ4: Many people know how to manage a small business.
Q6: My immediate family and /or relatives are involved in business.Community PerceptionQ7: Most people consider becoming an entrepreneur as a desirable career choice.
Q9: Most people think that new firms are started only as a last resort.Personal ValuesQ11: Being self-employed is more financially rewarding than earning a salary.
Q15: The setting up of a business is the faster way to becoming successful.Level of Uncertainty AvoidanceQ13: It is often costly for new firms to enter the market.
Q17: New and growing firms can afford the cost of overheads (rent, water, electricity).
b Economic factors – the economic factors questionnaire was based on studies by Holcombe (2003),
Evans and Leighton (1990), Chandler (1990) and Audretsch and Thurik (2000), which indicated the
key economic indicators for entrepreneurial propensity (see Table 2).
Table 2: Summary of the Survey on the Economic Indicators for Entrepreneurial Propensity
Entrepreneurial opportunity Question 2: People see lots of good opportunities for the creation of new firms.
Question 5: Good opportunities for new firms have considerably increased in the past five years.Education and TrainingQuestion 8: Teaching in primary and secondary education encourages creativity, self-sufficiency, and personal initiative.
Question 10: Colleges and universities have enough courses and programs on entrepreneurship.Government ProgrammesQuestion 19: Most people will face unemployment when they complete their studies and look for jobs.
Question 20: The support for new and growing firms is a high priority for the government.Entrepreneurial CapacityQuestion 16: Most people believe that the creation of new businesses is very difficult.
Question 18: Many people can react quickly to good opportunities for a new business.Access to CapitalQuestion 12: Almost anyone who needs help from government programs for a new business can get such help.
Question 14: There is not enough funding available for new and growing firms.
Results and DiscussionThe Correlation between Cultural and Economic Factors upon Entrepreneurial Propensity
As illustrated in Table 3, the correlation between cultural and economic factors upon entrepreneurial
2010 December Journal.indd 70 12/01/2011 6:42:40 p.m.

Vol VI, Issue 2, December 2010, Page 71 – Refereed Edition
© 2004-2010 [email protected] No Reprints Permitted
propensity was found to be significant. The relatively high correlation index indicates that where there was
the influencing presence of both factors i.e. cultural and economic, it would correlate positively with a higher
entrepreneurial propensity. Both factors afford a mutually supportive axis that would promote a propensity
for entrepreneurship, all things being equal. It highlights the importance of a cultural and economic backdrop
where entrepreneurial propensity needs to be promoted, especially in developing countries. In this respect,
Huq (1997) had suggested that entrepreneurship is dependent upon past behaviour and current cultural
characteristics, which may be a major part of their environment.
Table 3: The Correlation between Cultural and Economic Factors upon Entrepreneurial Propensity
Covariance S.E. C.R. P Correlation
Cultural Factors <--> Economic
Factors .106 .024 4.444 *** .947
The Impact between Cultural Factors and Entrepreneurial Propensity
As shown in Table 4, the extent to which cultural factors determine entrepreneurial propensity in a
multi-ethnic developing society was found to be not significant. This seems to be consistent with the
eroding impact of culture upon third generational youth in Malaysia. Based on the literature review, the
cultural backdrop of personal values, community perception and family background do not seem to have
much impact on entrepreneurial propensity. Cultural factors do not appear to significantly contribute to
entrepreneurial propensity in this case. This is in line with the entrepreneurial propensity mean of 3.66 where
the overall entrepreneurial propensity of the study participants was found to be marginal.
Table 4: The Impact of Cultural Factors upon Entrepreneurial Propensity
Covariance S.E. C.R. P CorrelationCultural Factors <--> Entrepreneurial
Propensity -.218 .209 -1.041 .298 -.072
The Correlation between Economic Factors and Entrepreneurial Propensity
The extent to which economic factors determine entrepreneurial propensity in a multi-ethnic, developing
society was found to be not significant (see Table 5). Based on some previous studies, this outcome is
unexpected. It was projected that economic factors would play a significant role in entrepreneurial propensity
in Malaysia. The NEP of the Malaysian government has had a significant impact on Malaysian firms and firm
formation. However in general, and despite other economic reforms, it is usually considered to have stifled
entrepreneurship. This combination of political and economic patronage has also naturally created numerous
conflict of interest situations. This is in line and is likely cause of the entrepreneurial propensity mean of 3.66,
where the overall entrepreneurial propensity of the study participants was found to be marginal.
Table 5: The Impact of Economic Factors upon Entrepreneurial Propensity
Covariance S.E. C.R. P CorrelationEconomic Factors <--> Entrepreneurial
Propensity -.693 .282 -2.458 .014 -.153
Influences of Cultural and Economic Factors on Entrepreneurial Propensity by Ethnicity
The ethnic differences in entrepreneurial propensity as influenced by cultural and economic factors are as
2010 December Journal.indd 71 12/01/2011 6:42:40 p.m.

Page 72– Refereed Edition Vol VI, Issue 2, December 2010,
© 2004-2010 [email protected] No Reprints Permitted
discussed:
For the Malays ethic - the correlation between economic factors and entrepreneurial propensity was
significant. The correlation between cultural factors and entrepreneurial propensity was not significant. This
is illustrated in Figure 1 and Table 6 below.
Figure 1: The Output Path Diagram for Malays Ethnic
CF
.00
A1 e1
.04
.07
A3 e2
.27
.00
A4 e3
.03.06
A6 e4.24 .14
A7 e5.37.00
A9 e6.03
.16
A11 e7
.39
.05
A13 e8
.23
.35
A15 e9
.59
.18
A17 e10
.42
EF
.07
A20e20
.03
A19e19
.01
A18e18
.06
A14e16
.13
A12e15
.04
A10e14
.13
A8e13
.01
A5e12
.09
A2e11
.27
.18
.11
.25
.36
.19
.37
.12.30
.71
Chi-square=222.041df=165, p-value=.002Chi-square/df=1.346AGFI=0.920PCFI=.504RMSEA=.056AIC=312.041
EP
.83 .33
From Figure 1, the Chi-square value of discrepancy of 222.041 is still high and the p-value is 0.002. The
chi-square/df ratio is 1.346, less than two. The AGFI value of 0.920 is still close to one and the RMSEA value
is 0.056. The PCFI value is 0.504 with an AIC value of 312. Thus, generally, the model fit is good.
Table 6: The Correlation between Economic and Cultural Factors and Entrepreneurial Propensity for the Malays Ethnic
Covariance S.E. C.R. P CorrelationCultural Factors <--> Economic Factors .0329 .014 2.351 .021 .708
Economic Factors <--> Entrepreneurial
Propensity 2.046 .846 2.417 .016 .829
Cultural Factors <--> Entrepreneurial
Propensity .097 .275 .352 .724 .326
As shows in Table 6, the Malays have scored high on economic factors (0.829). Cultural factors for
the Malays appear to have less of an influence upon entrepreneurial propensity (0.326). It could be that
the cultural factors appear to be less significant as this generation become more exposed to Information
Communication Technology (ICT) and a wider spectrum of views and, as a result, are less beholden to
communal perceptions. Also, the participants come from urban areas, which may account for their lack of
dependence on factors like community perception and also have lower levels of uncertainty avoidance.
The Malays seem to consider economic factors as key to potential new business formation. This is
reflected in question A2 - ‘people see lots of good opportunities for the creation of new firms’ which has a
2010 December Journal.indd 72 12/01/2011 6:42:41 p.m.

Vol VI, Issue 2, December 2010, Page 73 – Refereed Edition
© 2004-2010 [email protected] No Reprints Permitted
relatively higher standard estimate. They seem to require some outside force to regulate their behaviour,
and they invariably have turned to external economic factors, in this case, likely, the government. This is
borne out in questions A.12 (almost anyone who needs help from government programs for a new business
can get such help) and A.20 (the support for new and growing firms is a high priority for the government).
This outcome is likely due to the New Economic Policy (NEP), which provided key incentives to the Malays
to encourage business formation. As Searle (1999) observed, considerable controversy and debate surrounded
that element of restructuring which involved the creation of Malay capitalists. Scholars expressed skepticism as
to whether government action could create new sources of entrepreneurship. This now does appear to be the
case, as the entrepreneurial propensity of the Malays appears to be the highest of the three races in this study. In
a later study, Searle (1999) had suggested that more bumiputera groups are developing greater independence of
patronage and such changes suggest a need to keep our views concerning the nature of Malay capitalism open
to revision. Searle’s (1999) observation is both predictive and appears justified and this study further supports
that economic factors can effectively play a key role in determining entrepreneurial propensity. It is probable that
the younger generation of Malays today feels very secure and thus, is confident and ambitious enough to be
entrepreneurial, unlike the Chinese or Indians (as will be explained below). This may also account for the relatively
higher economic factor and entrepreneurial propensity correlation in this study.
Cultural factors, in this study, do not appear to be a factor in affecting entrepreneurial propensity for
the Malays. In fact, the cultural component within the Malay environment seems to afford an insignificant
correlation to entrepreneurial propensity. Mueller and Thomas (2000) were able to demonstrate that internal
locus of control and innovativeness promoted entrepreneurship. It may appears that with economic progress,
education access and the impact of information and communication technology (ICT), there is a shift towards
individualism and lower uncertainty avoidance amongst the younger generation of Malays. This could give
support for the insignificant correlation between cultural factors and entrepreneurial propensity for the Malays
ethnic.
For the Chinese ethnic – where the Chinese were concerned, the correlation between economic factors
and entrepreneurial propensity was not significant. However, the correlation between cultural factors and
entrepreneurial propensity was significant. This is apparent in Figure 2 and Table 7 below. From Figure 2,
the Chi-square value of discrepancy of 281.502 is high and the p-value is less than 0.001. The chi-square/df
ratio is 1.706, less than two. The AGFI value of 0.906 is still close to one and the RMSEA value is 0.052. The
PCFI value is 0.64 with an AIC value of 371. Thus, generally the model fit is good.
2010 December Journal.indd 73 12/01/2011 6:42:41 p.m.

Page 74– Refereed Edition Vol VI, Issue 2, December 2010,
© 2004-2010 [email protected] No Reprints Permitted
Figure 2: The Output Path Diagram for Chinese
CF
.14
A1 e1
.37
.07
A3 e2
.26
.10
A4 e3
.32.08
A6 e4.28 .05
A7 e5.23.02
A9 e6.15
.18
A11 e7
.42
.04
A13 e8
.20
.16
A15 e9
.40
.05
A17 e10
.22
EF
.17
A20e20
.12
A19e19
.31
A18e18
.00
A14e16
.18
A12e15
.08
A10e14
.10
A8e13
.08
A5e12
.23
A2e11
.41
.35
.56
.04
.43
.28
.31
.28.48
.98
Chi-square=281.502df=165, p-value=.000Chi-square/df=1.706AGFI=0.906PCFI= .640RMSEA=.052AIC=371.502
EP
.32 .52
The result from Table 7 shows that economic factors do not contribute to the Chinese propensity
for entrepreneurship. This is unexpected and may be due to perceived constraints of access to capital,
entrepreneurial opportunity and that the overall environment may likely not be conducive for them.
Research has found that although there are non-traditional ways to raise capital, the great majority of ethnic
entrepreneurs also use personal savings and money from family members (Min, 1988). In weakening the
Chinese control of the economy, the NEP also weakened their political leverage. The state’s commitment to the
Malay community, and its close relationship with UMNO, also made the state more dependent on communal
divisions (Mahmood, 1994) which exacerbated the situation to the detriment of the Chinese. This may account
for a more conservative propensity in the Chinese for entrepreneurship from an economic standpoint.
Table 7: The Correlation between Economic and Cultural Factors and Entrepreneurial Propensity for the Chinese Ethnic
Covariance S.E. C.R. P CorrelationCultural Factors <--> Economic Factors .138 .036 3.823 *** .976
Economic Factors <--> Entrepreneurial
Propensity .525 .819 0.641 .438 .322
Cultural Factors <--> Entrepreneurial
Propensity 1.948 .478 4.075 *** .520
It would appear “that the overarching culture does play a significant role” for entrepreneurial propensity
(Morris et al., 2002, p.43). The Chinese culture, shaped in part by Confucian values and worldview, and
in part by the pragmatics of survival in a new land, was conducive to entrepreneurship. The Chinese had
a highly developed sense of racial superiority, which underlay their strong desire to preserve their cultural
heritage through the promotion of their own language and core values (Norma Mahmood, 1994). This in turn
may account for the influence of cultural factors upon entrepreneurial propensity in this study. In this regard,
it could also add that the relative influence of ‘communities of practice’ where knowledge and experience
2010 December Journal.indd 74 12/01/2011 6:42:41 p.m.

Vol VI, Issue 2, December 2010, Page 75 – Refereed Edition
© 2004-2010 [email protected] No Reprints Permitted
are shared can be a font of both high learning and motivation. It becomes a place where entrepreneurial
seed is not only planted but also nurtured by experienced elders. The Chinese community in this regard
has ascended a steep learning curve whereas the Malays and Indians merely acknowledge the need to
ascend this curve. This is in line with the Role Model Theory perspective (Pfeffer, 1982), which explains the
importance of exposure of an individual to entrepreneurship or to entrepreneurs. The more the entrepreneur
fulfils role expectations, the more likely the individual will be to succeed in that venture (Carsrud and
Johnson, 1989). Family and friends also seem to serve as role models for aspiring entrepreneurs. This in
turn lends support to the idea that seeing someone else succeed encourages prospective entrepreneurs to
take the risk (Roberts and Wainer, 1971; Shapero, 1971; Susbauer, 1969; Collins and Moore, 1970).
For the Indians ethnic – the correlation between economic factors and entrepreneurial propensity for
Indian ethnic was not significant. The correlation between cultural factors and entrepreneurial propensity was
also not significant. This is apparent in Figure 3 and Table 8 as illustrated below. From Figure 3, the Chi-
square value of discrepancy of 231.320 is still high and the p-value is 0.001. The chi-square/df ratio is 1.4,
less than two. The AGFI value of 0.794 is still close to one and the RMSEA value is 0.06. The PCFI value is
0.385 with an AIC value of 321. Thus, generally, the model fit is good.
Figure 3: The Output Path Diagram for Indians
.06
CF
A1.75
e1
1.00
1
A3.89
e2
.67
1
A4.90
e3
1.82
1
A61.13
e4.93
1
A7.89
e5.68 1
A9.84
e6.69 1
A111.07
e7
1.561
A13.82
e8
.56
1
A15.99
e9
1.80
1
A17.91
e10
1.10
1
.17
EF
A20.87
e20
A19.93
e19
A18.77
e18
A14.81
e16
A121.05
e15
A101.08
e14
A81.15
e13
A5.77
e12
A2.58
e11
1.00
1
.84
1
1.57
1
.131
1.151.70
1 .90
1.68
1
.92
1
.11
Chi-square=284.868df=165, p-value=.000Chi-square/df=1.726AGFI=.871PCFI=.618RMSEA=.053AIC=374.868
.2
121.05
EP
-.61 -.11
Table 8: The Correlation between Economic and Cultural Factors and Entrepreneurial Propensity for the Indians Ethnic
Covariance S.E. C.R. P CorrelationCultural Factors <--> Economic Factors .108 .034 3.197 .001 1.000
Economic Factors <--> Entrepreneurial
Propensity -.607 .372 -1.632 .103 -.135
Cultural Factors <--> Entrepreneurial
Propensity -.114 .251 -.455 .649 -.042
2010 December Journal.indd 75 12/01/2011 6:42:41 p.m.

Page 76– Refereed Edition Vol VI, Issue 2, December 2010,
© 2004-2010 [email protected] No Reprints Permitted
Historically, the indentured Indians were provided jobs and were essentially cloistered in the rubber
estates. The Indians are less than ten (10) percent of the population and they mainly occupy the lower
rungs of the economic ladder. In this regard, access to capital, education and training and entrepreneurial
opportunity becomes much less available. Thus, economic factors may not be conducive for entrepreneurial
propensity in the Indians. On the other hand, Marginality Theory (Light, 1979) does suggest that
disadvantages such as poverty, unemployment, underemployment, and discrimination in the labour force
lead minority members to turn to self-employment. This theory suggests that those minority members
with economic and cultural resources will successfully enter small businesses, while others without such
resources will find self-employment in petty trade (peddling), illegal enterprises, and predatory crimes. From
this study, it appears that entrepreneurial propensity is not supported. It is likely that the Indians would prefer
the less risky alternatives of stable employment.
The results of the 2002 Global Entrepreneurship Monitor (GEM) showed that, generally, South
African culture was still a negative factor towards black entrepreneurship. In the GEM 2002 Report, the
values inherent in groups living traditionally were not necessarily conducive to individual initiatives and
entrepreneurship (Co, 2003). This appeared to mirror the conditions for the Malay farmers and fishermen,
and Indian estate workers in Malaysia. The GEM 2002 Report indicates that the preference for a job
over self-employment is still strong in all sectors; for example, most black South Africans would prefer
the security of a full-time job than the uncertainty of generating income from running one’s own business.
Also, in general, black South Africans view professionals with more respect and admiration than they
do entrepreneurs (Co, 2003, p.41). This used to be the case generally in Malaysia where Indians are
concerned. This study appears to support this continued preference for salaried jobs over self-employment,
thus accounting for a negative or low propensity for entrepreneurship. This used to be the case generally in
Malaysia but whether or not it remains is uncertain. Each community may display varying attitudes.
A study by Wennekers et al., (2001) examines culture and economic determinants of business
ownership across countries. It emphasizes that high-uncertainty avoidance negatives relationship with
entrepreneurship. This does appear to be the case here. Cultural values are key not only in the way the
entrepreneur approaches the venture, but in his decision to consider entrepreneurship in the first place
(Gasse, 1977; Bird, 1989; Bryan, 1999). This is consistent with the outcome here as the Indian community’s
overall perception of business formation and personal value perception of reward and success. Based on the
literature review, this may have been ingrained historically and, being politically disadvantaged, it is a cultural
trait that has remained so as a matter of an immediate survival instinct. In an entrepreneurial context, where
a value associated with individual success or economic innovation is not consistent with the norms of a
culture, the cultural group will likely show some form of resentment towards the entrepreneur (Lipset, 2000).
This may also be a contributory factor for the lack of entrepreneurial propensity for the Indians.
Overall Entrepreneurial Propensity by Race
Following to the above analysis, Figure 4 shows that the ethnic with the highest entrepreneurial
propensity is the Malay, followed by the Chinese and the Indians.
The Malays have a mean entrepreneurial propensity of 6.01 with the confidence interval for mean ranging
between 3.96 and 8.05. The Chinese have a mean entrepreneurial propensity of 3.24 with the confidence
2010 December Journal.indd 76 12/01/2011 6:42:41 p.m.

Vol VI, Issue 2, December 2010, Page 77 – Refereed Edition
© 2004-2010 [email protected] No Reprints Permitted
interval for mean ranging between 1.86 and 4.59. The Indians, have a mean entrepreneurial propensity of
1.23 with the confidence interval for mean ranging between –1.51 and 3.97.
Figure 4: Levels of Entrepreneurial Propensity by Ethnic
Results from Analysis of Variance (ANOVA)
SPSS analysis is applied to further illustrate the entrepreneurial propensity outcomes by race (see Tables
9, 10, 11 and 12).
Table 9: Descriptive Statistics
Ethnicity
N
Mean
Std. Deviation
95% Confidence Interval for Mean
Lower Bound Upper BoundMalay 111 6.01 10.875 3.96 8.05Chinese 259 3.24 11.024 1.89 4.59Indian 62 1.23 10.788 -1.51 3.97Total 432 3.66 11.035 2.62 4.71
Table 10: Levene’s Test of Homogeneity of Variances
Levene Statistic df1 df2 Sig..007 2 429 .993
Table 11: The ANOVA
Sum of Squares dfMean
Square F Sig.Between Groups 1025.669 2 512.835 4.275 .015Within Groups 51460.988 429 119.956Total 52486.657 431
Table 12: Duncan’s Post Hoc Multiple Comparison
Ethnicity
N
Subset for alpha = .05
1 2Indian 62 1.23Chinese 259 3.24 3.24Malay 111 6.01Sig. .187 .070
2010 December Journal.indd 77 12/01/2011 6:42:41 p.m.

Page 78– Refereed Edition Vol VI, Issue 2, December 2010,
© 2004-2010 [email protected] No Reprints Permitted
Table 9 provides the data summaries for entrepreneurial propensity by race. The 95% confidence interval
for Malays is above the interval for Indians. Based on Table 10, the p-value for the Levene’s test of equality
of variances is more than 0.05. Thus, there is no significant departure from homogeneity. From Table 11,
the p-value for test of equality of means is 0.015, which is less than 0.05. Thus, at least one pair of means
differ significantly. Based on the Duncan’s Post Hoc Multiple Comparison results, as shown in Table 12, the
entrepreneurial propensity score for the Malays is significantly higher compared to that of the Indians.
Research Findings
A part of the research problem ‘how, and to what extent, do cultural and economic factors determine
entrepreneurial propensity’ in a multi-ethnic and developing society like Malaysia, receives a mixed answer.
Cultural and economic factors do matter to the extent of econ-political considerations, keeping in mind the
inherent ethno-historical proclivities. ‘Econ-political’ here refers to economic policies that are applied to meet
political ends. The aim was that this study should provide some well researched evidence and hopefully
dispel anecdotal evidence that is especially apparent where matters of ethnicity are concerned. Figure 5
below is designed to illustrate this via an adaptation of Moore’s model upon the outcome of the research
study findings. The arrows pointing out from each ethnic race show the level of entrepreneurial propensity of
the race towards the triggering event.
In Malaysia, primordial identifications do not seem to have yielded to modernization. Far from being
overwhelmed, communal identification has become entrenched in the value system of the society. As
pointed by Mahmood (1994), “very little goes on in the country that is not influenced by this factor”. This is
a key factor that runs through the existing literature in Malaysia and its multiethnic society; but the major
race is now showing signs that it will not be shackled by communal identification. Can this ‘econ-political’
will transform entrepreneurial propensity into an age of entrepreneurs for Malaysia? This research has
been a platform for the study of strategic intentions which now allows for further research into the strategic
entrepreneurial behaviours that may or may not follow in a developing multiethnic country, like Malaysia.
GEM Data Contrasted
Besides the earlier comparisons with GEM research countries, the latest GEM Global 2008 Executive
Report suggests that there needs to be ‘space for’ entrepreneurship (Bosma et al., 2008). The data for
Malaysia appears to indicate strongly that this is indeed valid. Where in the past the Malays were not
provided with such opportunity their propensity for entrepreneurship was at most lackadaisical. This study
today indicates that, as opportunities abound via government facilitation, their perception for business
opportunities also increases. It may be inferred that for different countries the facilitating factor may be
different but the perception outcome may be the same.
The same report further avers that this perception of entrepreneurial opportunity is tied to a countries
“economic growth, population growth, culture and national entrepreneurship policy” (Bosma et al., 2008).
This is likely made out as Malaysia has had a relatively good economic and fair population growth too.
Where culture is concerned this study indicates that culture can be a critical deciding factor for ethnic
2010 December Journal.indd 78 12/01/2011 6:42:41 p.m.
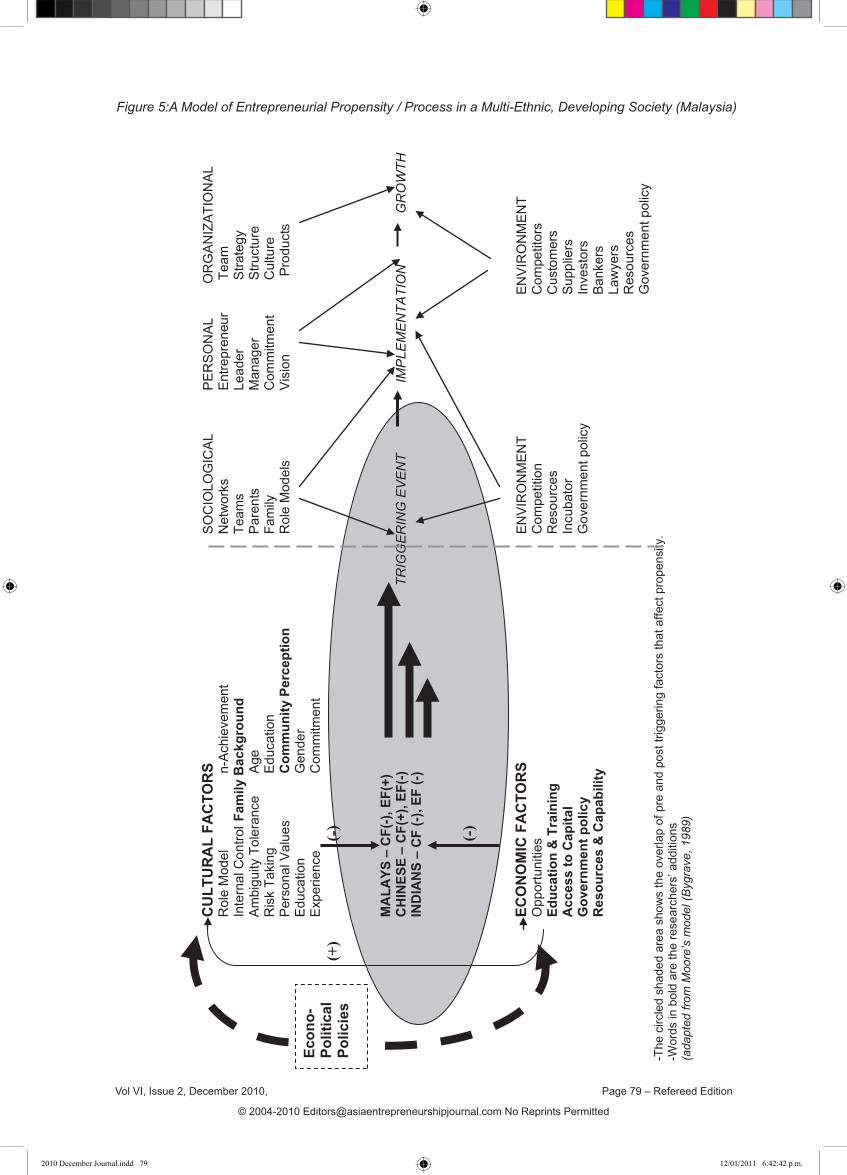
Vol VI, Issue 2, December 2010, Page 79 – Refereed Edition
© 2004-2010 [email protected] No Reprints Permitted
1
CU
LTU
RA
L FA
CTO
RS
SOC
IOLO
GIC
ALPE
RSO
NAL
O
RG
ANIZ
ATIO
NAL
Rol
e M
odel
n-
Achi
evem
ent
Net
wor
ksEn
trepr
eneu
r
Team
Inte
rnal
Con
trol F
amily
Bac
kgro
und
Team
sLe
ader
S
trate
gyAm
bigu
ity T
oler
ance
Age
Pare
nts
Man
ager
S
truct
ure
Ris
k Ta
king
Educ
atio
n
Fam
ilyC
omm
itmen
t
Cul
ture
Pers
onal
Val
ues
Com
mun
ity P
erce
ptio
nR
ole
Mod
els
Visi
on
Pro
duct
sEd
ucat
ion
Gen
der
Expe
rienc
eC
omm
itmen
t(+
)
(+)
(-)
MA
LAYS
–C
F(-),
EF(
+)C
HIN
ESE
–C
F(+)
, EF(
-)TR
IGG
ERIN
G E
VE
NT
IM
PLE
ME
NTA
TIO
N
GR
OW
THIN
DIA
NS
–C
F (-)
, EF
(-)
(-)
ECO
NO
MIC
FA
CTO
RS
ENVI
RO
NM
ENT
ENVI
RO
NM
ENT
Opp
ortu
nitie
s
Com
petit
ion
Com
petit
ors
Educ
atio
n &
Tra
inin
g
Res
ourc
esC
usto
mer
sA
cces
s to
Cap
ital
Incu
bato
rSu
pplie
rsG
over
nmen
t pol
icy
Gov
ernm
ent p
olic
yIn
vest
ors
Res
ourc
es &
Cap
abili
tyBa
nker
sLa
wye
rsR
esou
rces
Gov
ernm
ent p
olic
y-T
he c
ircle
d sh
aded
are
a sh
ows
the
over
lap
of p
re a
nd p
ost t
rigge
ring
fact
ors
that
affe
ct p
rope
nsity
.-W
ords
in b
old
are
the
rese
arch
ers’
add
ition
s (a
dapt
ed fr
om M
oore
’s m
odel
(Byg
rave
, 198
9)
Econ
o-Po
litic
alPo
licie
s
Figure 5:A Model of Entrepreneurial Propensity / Process in a Multi-Ethnic, Developing Society (Malaysia)
2010 December Journal.indd 79 12/01/2011 6:42:42 p.m.
Page 80– Refereed Edition Vol VI, Issue 2, December 2010,
© 2004-2010 [email protected] No Reprints Permitted
entrepreneurship looking at the early positive outcomes for the Chinese and negative outcomes for the
Indians. The national economic policy that stressed upon providing business opportunities for the Malays
resulted in a new generation whose perception of entrepreneurial opportunity is much higher than before.
Of course entrepreneurial propensity does not guarantee that the formation of a new venture will be formed
or if formed will be successfully sustained beyond the early stages. There is also the consideration of
‘assessment of opportunity costs’ and ‘risk-reward assessment’ that is discussed in the GEM Global 2008
Report. This is true for Malaysia before the current financial crisis. But this global financial crisis may likely
see a convergence of competing factors. On the one hand, it is that of employees losing their jobs, thus
forcing on a necessity type entrepreneurship. And on the other hand a shrinking market that dampens
opportunistic entrepreneurship.
Though the entrepreneurial propensity for Malays appears to be high the GEM Global Report 2008
indicates that positive perceptions do not correlate with intentional entrepreneurship. This was evident
in innovation-driven economies in Europe. Currently there is no data in Malaysia to support or disprove
this. Shane (2003) supports that opportunities abound but have to be discovered. As such the Malaysian
government will need to create a conducive and acceptable atmosphere and habitat for entrepreneurs
to flourish. An example currently employed is the emphasis on creating entrepreneurs within the
biotech industry. Biotech graduates are provided entrepreneurial training and internship to speed up the
entrepreneurial process. In many ways Malaysia is pioneering ‘steroidal entrepreneurship’ to hasten the
formation of new ventures in cutting edge industries. The GEM Global Report touches on an acute aspect
for entrepreneurs by considering the fear of failure. The consequences of trying a new venture and failing
are much worse when employment opportunities and other sources of income are getting scarcer by the
month. Based on GEM 2008 data, one could argue that that innovation driven economies will have the upper
hand. This is because they may be driven more by intrinsic as opposed to extrinsic factors. Yet, efficiency
and factor driven economies will likely be driven by positive external perception and sentiments. This is
evidenced by the comparatively less erratic perception of opportunities and fear of failure graph curves
of the innovation driven countries. Malaysia, for the present, will likely encounter an equally erratic graph
curve. As such it may be incumbent upon government and policy makers to imbue a keen and long lasting
fervor for entrepreneurship based on skills, knowledge and internship upon the new generation of school
and university students. And in doing so to overcome the cultural, economic and political factors discussed
earlier.
Concluding Comments
This study should add to a more complete understanding of entrepreneurship as it takes into
consideration the underlying, historically-induced and ethnically-biased make up of a people and their
propensity for entrepreneurship. And, it is all the more interesting in the wake of econ-political policies
conjured to tweak political efficacy. This study also indicates that inherent ethnicity does, due mainly to
historical circumstances, foster a lower or greater propensity for entrepreneurship. Also, those cultural and
economic factors are determinants of entrepreneurial propensity in so far as ‘econ-political’ considerations
allow in this developing multi-ethnic society. It also suggests that as much as entrepreneurial propensity may
be nurtured, it can also be suppressed. The results of this research study are significant for the business
investment community and government policy makers as they investigate the effect of econ-political policy
2010 December Journal.indd 80 12/01/2011 6:42:42 p.m.
Vol VI, Issue 2, December 2010, Page 81 – Refereed Edition
© 2004-2010 [email protected] No Reprints Permitted
on socio-cultural variables that encourage or hinder entrepreneurial propensity. The expedient use of
politically-motivated socio-economic policies does seem to help in entrepreneurial propensity. Whether or
not this results in creating actual entrepreneurs (and their success rate) will be an area that requires more
study. Although GEM data from efficiency-driven and innovation-driven countries does suggest that this may
be so. The initial suggestion was that where entrepreneurship is concerned, “Many are called but few are
chosen.” The question we posed was ‘how’ they are called if at all, and ‘why’. The theories evaluated and
the key factors discussed do provide indications of the ‘how’ and ‘why’ in this multi-ethnic developing society.
In the final analysis, the environmental forces are apparent though their impact is subtle and, in a developing
country, this outcome in the years ahead will define either its economic progress or may be the makings for
economic stagnation.
2010 December Journal.indd 81 12/01/2011 6:42:42 p.m.

Page 82– Refereed Edition Vol VI, Issue 2, December 2010,
© 2004-2010 [email protected] No Reprints Permitted
References
Aldrich, H. E., and Martinez M.A., (2001). Many are the called, but few are chosen: an evolutionary perspective for the study of entrepreneurship. Entrepreneurship Theory & Practice, Vol. 25 (4), pp. 41-56.
Audretsch, D. B., and Thurik A. R., (2000). Capitalism and democracy in the 21st century: From the managed to the entrepreneurial economy, Journal of Evolutionary Economics, Vol. 10 (1), pp.17-34.
Bird, D., (1989). Entrepreneurial behavior. In Morris, M., Schindehutte, M., and Lesser, J., Ethnic entrepreneurship: Do values matter? New England Journal of Entrepreneurship, Vol. 5 (2), pp.35-46.
Bonacich, E., and Modell, J., (1980). The economic basis of ethnic solidarity: small business in the Japanese American community. In Sexton, D.L., and Smilor, R.W., (eds). Entrepreneurship 2000, Upstart Publishing Company, Chicago, Illinois.
Bosma, N., Acs Z. J, Autio E., Coduras A., and Levie J., (2008). Global Entrepreneurship Monitor, 2008 Executive Report.
Bryan, L., (1999). American Indian entrepreneurs: rosebud and pine ridge reservations, case studies. In Morris, M., Schindehutte, M., and Lesser, J., Ethnic entrepreneurship: Do values matter? New England Journal of Entrepreneurship, Vol. 5 (2), pp.35-46.
Butler, J. S., and Greene P. G., (1997). Ethnic entrepreneurship: the continuous rebirth of American enterprise. In Sexton, D.L., and Smilor, R.W., (eds.) Entrepreneurship 2000, Upstart Publishing Company, Chicago, Illinois.
Bygrave, W. D., (1989). The entrepreneurship paradigm (I): a philosophical look at its research methodologies, Entrepreneurship Theory and Practice, Vol. 14 (1), pp. 7-26.
Carsrud, A., and Johnson W., (1989). Entrepreneurship: a social psychological perspective, Entrepreneurship and Regional Development, Vol. 1 (1), pp.21-32.
Chandler, A. D. Jr., (1990). Scale and Scope: the dynamics of industrial capitalism. Cambridge: Harvard University.
Clammer, J., (2000), Values and development in Southeast Asia. Pelanduk Publications, Malaysia.Collins, O. F., and Moore D. G., (1970). The organizational makers: a behavioural study of independent
entrepreneurship. In Co, M.J., A socio-cultural explanation of black entrepreneurship in South Africa, South African Journal of Management, Vol. 34 (4), pp. 35-43.
Co, M.J., (2003). A socio-cultural explanation of black entrepreneurship in South Africa, South African Journal of Management, Vol. 34 (4), pp. 35-43.
Davidsson, P., and Wiklund J., (1997). Values, beliefs and regional variations in new firm formation rates, Journal of Economic Psychology, Vol. 18 (2/3), pp. 179-199.
Evans, D. S., and Leighton, L. S., (1990). Small business formation by unemployed workers, Small Business Economics, Vol. 2 (4), pp.319-330.
Gasse, Y., (1977). Entrepreneurial characteristics and practices: a study of the dynamics of small business organizations and their effectiveness in different environments. In Morris, M., Schindehutte, M., and Lesser, J., Ethnic entrepreneurship: Do values matter? New England Journal of Entrepreneurship, Vol. 5 (2), pp.35-46.
Ginsberg, A., (1988). Measuring and modeling changes in strategy: theoretical foundations and empirical directions. Strategic Management Journal, Vol. 9 (6), 559-575.
Harding, R., (2002). Global Entrepreneurship Monitor (GEM): United Kingdom, London UK: London Business School, In Tang, L., and Koveos, P.E., Venture entrepreneurship, innovation entrepreneurship and economic growth, Journal of Developmental Entrepreneurship, Vol. 9 (2), pp. 161-171.
Hayton, C. J., George G., and Zahra S. A., (2002). National culture and entrepreneurship: a review of behavioral research, Entrepreneurship Theory and Practice, Vol. 26 (4), pp. 33-52.
Hofstede, G., (2001). Culture’s consequences: comparing values, behaviours, institutions, and organizations across nations, Sage Publishing.
Holcombe, R. G., (2003). Progress and entrepreneurship, The Quarterly Journal of Austrian Economics, Vol. 6 (3), pp.3-26.
Huefner, J. C., Hunt H. K., and Robinson P.B., (1996). A comparison of four scales predicting entrepreneurship, Academy of Entrepreneurship Journal, Vol. 1(2), 56-80.
2010 December Journal.indd 82 12/01/2011 6:42:42 p.m.

Vol VI, Issue 2, December 2010, Page 83 – Refereed Edition
© 2004-2010 [email protected] No Reprints Permitted
Huq, A., (1997), Malaysia’s economic success, Pelanduk publications, MalaysiaLight, I., (1979). Disadvantaged minorities in self-employment, International Journal of Comparative
Sociology, Vol. 20 (1/2), pp.31-45.Lipset, S. M., (2000). Values and entrepreneurship in the Americas. In Morris, M., Schindehutte, M., and
Lesser, J., Ethnic entrepreneurship: Do values matter? New England Journal of Entrepreneurship, Vol. 5 (2), pp.35-46.
Mahmood, N., (ed.) (1994). Rethinking political development in Southeast Asia, University of Malaya Press. Malaysia.
Masurel, E., Nijkamp P., and Vindigni G., (2004). Breeding places for ethnic entrepreneurs: a comparative marketing approach, Entrepreneurship & Regional Development, Vol. 16 (1), pp.77-86.
Min, P. G., (1988). Ethnic business enterprise: Korean small business in Atlanta, In Sexton, D.L., and Smilor, R.W., (eds.) (1997). Entrepreneurship 2000, Upstart Publishing Company, Chicago, Illinois.
Mueller, S., and Thomas A., (2000). Culture and entrepreneurial potential: A nine-country study of locus of control and innovativeness, Journal of Business Venturing Vol. 16 (1), pp.51-75.
Pfeffer, J., (1982). Organisations and organization theory. In Co, M.J., A socio-cultural explanation of black entrepreneurship in South Africa, South African Journal of Management, Vol. 34 (4), pp. 35-43.
Roberts, E. B., and Wainer W. A., (1971). Some characteristics of technical entrepreneurs. In Co, M.J., A socio-cultural explanation of black entrepreneurship in South Africa, South African Journal of Management, Vol. 34 (4), pp. 35-43.
Scarborough, N. M., Wilson D., and Zimmerer T. W., (2010). Effective small business management. An entrepreneurial approach. 9th Edition, Pearson Prentice Hall.
Schumpeter, J., (1934). The Theory of Economic Development. Cambridge, MA: Harvard University Press.Silverstein, J., (1994). Some concluding thoughts. In Mahmood, N., Rethinking political development in
Southeast Asia, University of Malaya Press, MalaysiaShane, S., (2003). A General Theory of Entrepreneurship: The Individual-Opportunity Nexus, Aldershot, UK:
Edward Elgar.Shapero, A., (1971). An action program of entrepreneurship. In Co, M.J., A socio-cultural explanation of black
entrepreneurship in South Africa, South African Journal of Management, Vol. 34 (4), pp. 35-43.Susbauer, J. C., (1969). The technical company formation process: a particular aspect of entrepreneurship.
In Co, M.J., A socio-cultural explanation of black entrepreneurship in South Africa, South African Journal of Management, Vol. 34 (4), pp. 35-43.
Talib, R., (1995). Credit and consumer culture in Malaysia, In Rokiah Talib, and Tan, C-B., eds., Dimensions of tradition and development in Malaysia, Department of Anthropology and Sociology – University of Malaya, Pelanduk publications.
Tan, Chee-Beng, (1995). The people of Chinese descent and ethnic relations with special reference to some economic explanations, In Rokiah Talib, and Tan Chee-Beng, eds. Dimensions of tradition and development in Malaysia, Department of Anthropology and Sociology – University of Malaya, Pelanduk publications.
Tang, L., and Koveos P. E., (2004). Venture entrepreneurship, innovation entrepreneurship and economic growth, Journal of Developmental Entrepreneurship, Vol. 9 (2), pp. 161-171.
Van, Delft H., Gorter, C. and Nijkamp P., (2000). In search of ethnic entrepreneurship in the city. In Masurel, E., Nijkamp, P. and Vindigni. Breeding places for ethnic entrepreneurs: a comparative marketing approach, Entrepreneurship & Regional Development, Vol. 16 (1), pp.77-86.
Vesper, K. H., (1982). Research on education for entrepreneurship, In Kent, C.A.; Sexton, D.L. and Vesper, K.H., Encyclopedia of Entrepreneurship, (1982), 321-351, Englewood Cliffs, NJ: Prentice-Hall, Inc.
Weber, M., (1947). The Theory of Social and Economic Organization. New York: Free Press.Wennekers, S., Noorderhaven N., Hofstede G., and Thurik R., (2001). Cultural and Economic determinants
of business ownership across countries [online]. Available at: <http://www.babson.edu/entrep/fer/Babson2001/V/VA/VA.htm> [Accessed 13 September 2004].
2010 December Journal.indd 83 12/01/2011 6:42:42 p.m.

Page 84– Refereed Edition Vol VI, Issue 2, December 2010,
© 2004-2010 [email protected] No Reprints Permitted
Call for GovernanceBook Chapters
(peer-refereed 400+ page book, prints in mid 2011 with global distribution)
Publisher:ISBN 978-0-9864597-9-5www.rossismith.com
Be among the 6-8 listed chapter authors to this book, by contributinga 8-20 page chapter with a focus on: Governance in SMEs,
Governance in Non-Profit entities, Governance in public/state businesses,Family Business Governance, Director Recruitment
This authoritative summary ofcontemporary governance materialsexplores the effective implementation of goodgovernance principles in SMEs,with a special emphasis on:
- Theoretical Foundations- Family Firms- Succession Planning- Diversity- Director Obligations- Commitment of Directors- Director Recruitment- Governance in Public Entities- Governance in Non-Profit Firms- Director Training/Upskilling
Send a 200-400 word abstract by 22 February 2011, to:Jens Mueller, Lead-Editor at [email protected]
Smith
Rossi
CorporateÊGovernanceinÊSMEs
fromÊTheoryÊtoÊPracticeMueller - Ingley - Rennie
2010 December Journal.indd 84 12/01/2011 6:42:42 p.m.

Vol VI, Issue 2, December 2010, Page 85 – Refereed Edition
© 2004-2010 [email protected] No Reprints Permitted
A Comparative Study on the Terminal and Instrumental Value Systems of Entrepreneurs and Students
R.Murugesan,Assistant ProfessorDepartment of Humanities
Institute National Institute of Technology
Trichy, Tamilnadu, India.
Abstract: Knowing more about the value systems could benefit future entrepreneurs from universities and
colleges since the role of human values is a topic of growing interest in several social sciences, particularly
in marketing, and the values of students are important to study as they represent the future leaders of
businesses and other organizations in society (Miemie Struwig and Nelson Mandela, 2008). Hence this
paper presents a study that compares the personal value systems of men and women entrepreneurs
and men and women students. Research that compares the personal value priorities of men and women
entrepreneurs and students has not yet been conducted despite a great deal of speculation as to how
these groups differ in this regard. This information about comparison should prove useful to a variety of
audience such as students, college and university administrators and policy makers. Rokeach’s PVS is
used to measure the values and a total sample of 265 (140 students and 125 entrepreneurs) were used for
the study. The study reveals that ten out of 15 instrumental values were found to vary exclusively according
to respondents’ role of entrepreneurs and only three out of 15 were found to vary exclusively according
to the role of students. The terminal values that were found to vary exclusively according to the role of
entrepreneurs were: self-respect, freedom, a sense of accomplishment, an exciting life, wisdom, and social
recognition. The list of terminal values that were found to vary exclusively according to the role of students
were: pleasure, salvation, true friendship and happiness. The result of the study revealing a significant effect
for gender was evidenced both on the instrumental values and terminal values.
Keywords: Values, Instrumental values, Terminal values, personal value survey, and value rankings.
Introduction:
Research has suggested that the individuals/students can be distinguished as entrepreneurially inclined
or not by comparing the psychological characteristics of entrepreneurs- propensity to take risk, tolerance for
ambiguity, innovativeness, locus of control, need for achievement, and self-confidence (Koh, 1996; Mohar
Yusof et al. 2007). Similarly can students be distinguished from entrepreneurs on the basis of personal value
system. Does the present generation of college students hold personal values that are, in fact, different
from the present generation of businessmen? Or similar? If different, in what way do they differ? In an
empirical study, Desalvia and Gemmill (1971) compared the differences in the values of businessmen and
2010 December Journal.indd 85 12/01/2011 6:42:42 p.m.

Page 86– Refereed Edition Vol VI, Issue 2, December 2010,
© 2004-2010 [email protected] No Reprints Permitted
college students and found that the two groups share some types of values and differ markedly on others
and student perceptions of managerial values are found to be rather inaccurate. A study (Djula Borozan,
2007) conducted among undergraduate students reveals that the value system has started to change.
For students themselves, the most important values are fairness, continuous improvement, responsibility,
competence and hard work. They assume that these values are also appreciated by other people in the
business setting. However, the study also reveals that there is a gap between the values that students find to
be the most important to them and the values that they perceive to drive the behavior of other people in the
business world. Under these circumstances, knowing more about the value systems could benefit the future
entrepreneurs from universities and colleges since the role of human values is a topic of growing interest
in several social sciences and particularly in marketing (Jean-Marc Ferrandi et al. 2000), and the values of
students are important to study as they represent the future leaders of businesses and other organizations
in society (Miemie Struwig and Nelson Mandela, 2008). Hence this paper presents a study that compares
the personal values systems of men and women entrepreneurs and men and women students. Research
that compares the personal value priorities of men and women entrepreneurs and students has not yet been
conducted despite a great deal of speculation as to how these groups differ in this regard. This information
about comparison should prove useful to a variety of audience such as students, college and university
administrators and policy makers. For example, with knowledge of the factors associated with personal value
system of entrepreneurs, programmes can be initiated by governments to enhance these factors in order to
encourage entrepreneurship. Further, the findings can be used as guidance for students or as a device for
screening entrants into an entrepreneurship programme. In addition, the findings can serve as inputs into
entrepreneurship education. Finally, students exploring career alternatives can evaluate the appropriateness
of entrepreneurial career for themselves by determining whether or not their own value systems match those
of individuals already in that role.
In order to determine whether not basic, differences exist between men and women entrepreneurs
and men and women students, their personal values systems were compared. Values were selected to
distinguish them for several reasons. First, values are considered to be the dominating force in life, (Rokeach
1973). Or as noted by Rokeach (1973, p.3) “the consequences of human values will be manifested in
virtually all phenomena,” and as contended by Brockhaus and Horwitz (1986, p.32), “values are an organized
conception of nature. Additionally, values have been shown to be static and to carry over from one situation
to another (Sexton and Bowman-Upton, 1991). Values have been found to exert a strong influence on
individuals’ occupational choice and vocational behaviour (Brief et al. 1979; Walker et al. 1982). Individuals’
values have been found to be predictive of career fit, and individuals seek careers that are congruent with
their value systems (Beutell and Brenner 1986; Brenner and Greenhaus 1988). Moreover, it has been argued
that the type and behaviour of the enterprises created by entrepreneurs reflect their personal values (Schein
1983).
The values of entrepreneurs are critical in the formation of an organization’s strategy, and, like other
psychological dispositions, have an impact on venture capitalists’ decision to fund a particular enterprise
(MacMillan, Seigel, and Subba Narashima 1985; Stuart and Albetti 1990). Research has also shown
that personal values, business strategy and enterprise performance are influenced by the demographic
characteristics of the owner-managers, in particular, their gender (Carter et al., 1997; Verheul et al., 2002).
2010 December Journal.indd 86 12/01/2011 6:42:42 p.m.

Vol VI, Issue 2, December 2010, Page 87 – Refereed Edition
© 2004-2010 [email protected] No Reprints Permitted
Fagenson (1993) argued that values exert a strong influence on an individual’s vocational behaviour.
In addition owner-managers’ values determine the goals pursued by the business and influence their
management style, problem solving and decision-making behaviour as well as the structure of the business
and strategies employed (Olson and Currie, 1992; Verheul et al., 2002).
Conceptual discussion and hypotheses formation
According to Spranger (1928), an early and influential writer, values are defined as the constellation
of likes, dislikes, viewpoints, shoulds, inner inclinations, rational and irrational judgments, prejudices, and
association patterns that determine a person’s view of the world. The importance of a value system is that
once internalized it becomes, consciously or subconsciously, a standard or criterion for guiding one’s action.
Agle and Caldwell (1999) state that there are common threads in all the definitions of values. They quote
Schwartz and Bilsky (1987): “Values are (a) concepts or beliefs, (b) about desirable end states or behaviors,
(c) that transcend specific situations,(d) guide selection or evaluation of behavior or events, and (e) are
ordered by relative importance” (Cited in Agle and Caldwell, 1999, p. 359). This view of a value as a principle
or norm that guides behavior is supported by Jacob et al. (1962) who refer to values as “. . . the normative
standards by which human beings are influenced in their choice among the alternative courses of action they
perceive” (Cited in Harrison, 1975, p. 117). A Value is also defined as “an enduring belief that a specific mode
of conduct or end-state of existence is personally or socially preferable to an opposite mode of conduct or
end-state of existence” (Rokeach 1973,p.5).
According to Schwartz (1992), five features are common to most of the definition of values. Values
are described as concepts or beliefs, about desirable behaviors and/or end states that go beyond specific
situations to guide selection or evaluation of behaviors and events, and are ordered by a certain hierarchical
importance. In the approach of social adaptation theory (Kahle, 1983), values are inferred constructs
held collectively by societies and individually by persons that represent the point of intersection between
individuals and society. One can regard them as the most abstract type of social cognition that helps people
guiding themselves in the interpersonal world (Grunert and Scherhorn, 1990).
Hemingway and Maclagan,(2004) claim that individual managers’ organizational decisions are driven
by a variety of personal values and interests, in addition to the official corporate objectives. Managers
exhibit their personal values through the exercise of managerial discretion (Hemingway and Maclagan,
2004).The concept of discretion, however, requires further consideration. Discretion has been defined as:
“. . . the freedom to decide what should be done in a particular situation” (Pearsall, 1999, p. 409). But in
an organizational context, we may identify at least three types of discretion: formal discretion, unintended
discretion and what we shall call entrepreneurial discretion. Firstly, formal discretion is where one is explicitly
given the authority to use judgment or initiative within broadly defined guidelines. Secondly, unintended
discretion may occur in all sorts of ways, but we would highlight situations where there is ambiguity in the
language of guidelines and directives (Selznick, 1949) or, where the individual faces conflicting demands in
their role (Frank, 1963; Drumwright, 1994). Thirdly, entrepreneurial discretion is manifest where the individual
consciously decides to ignore organizational constraints and goes ahead anyway.
Hofstede (2001) defined value as a broad tendency to prefer certain states of affairs to others. Rokeach
(1972) explained that “to have a value” is to maintain an enduring belief that a specific mode of conduct or
2010 December Journal.indd 87 12/01/2011 6:42:42 p.m.

Page 88– Refereed Edition Vol VI, Issue 2, December 2010,
© 2004-2010 [email protected] No Reprints Permitted
end-state of existence is preferable to the alternatives. Schwatz (1992) characterized values as concepts
or beliefs that pertain to desirable end states or behaviours and transcend specific situations in guiding
selection or evaluation of behaviour and events and are ordered by relative importance. Values are learned
predispositions: they represent learned mechanisms for bringing about positive consequences or avoiding
negative ones with respect to the surrounding environment (Hofstede, 2001). Moreover, values are held by
individuals as well as by collectives (Kilby, 1993; Kluckhohn, 1951).
Kahle et al. link personal values and social values very closely, claiming that “Values are . . . integrally
connected to social change” and that “. . . values are individual representations of societal goals. As elusive
societal goals change, individuals’ values will sometimes lead and sometimes reflect this change” (Kahle et
al., 1988, p. 35). Giacomino et al. refer to studies conducted in the 1970s and 1980s that showed significant
differences between the values of managers in an Eastern and Western work context, thereby supporting the
famous research on cultural values conducted by Hofstede (1980).
Values will affect not only the perceptions of appropriate ends, but also the perceptions of the appropriate
means to those ends. Fiedler (1967) came up with a leadership theory based upon the argument that
managers cannot be expected to adopt a particular leadership style if it is contrary to their value orientations.
An influential theory of leadership (COVEY, 1990) is based upon four dimensions: personal, interpersonal,
managerial, and organizational. Not by accident the personal dimension is considered the core dimension.
Incidentally it encompasses the value profile of the individual. Tannenbaum and Schmidt suggested that
there are at least four internal forces that influence a manager’s leadership style: value system, confidence in
employees, personal inclinations, and feelings of security in an uncertain situation. Again value system plays
an important role. In short, people decide according to the value system they espouse, in other words values
and attitudes are important because they may shape behavior, and behavior will influence people.
Values exist at different levels (Morris and Schindehutte, 2005). Kilby (1993) noted that values are
instrumental in advancing the constructive understanding of human behaviour and consequent change.
Thus, it would seem that personal values should have important implications not only for the decision to
pursue entrepreneurship but also in the way in which the entrepreneur approaches a venture (Bryan 1999;
Bird 1989; Gasse 1977). Values reflect the entrepreneur’s conscious view of him or herself ( Feather 1990).
Moreover, the conscious view (or belief) that a person has about him or her directly shapes movement
toward action, or one’s motives (McClelland 1965).
Researchers have produced a number of value inventories over the years. Bales and Couch (1969)
considered close to 900 values used in different questionnaires and reduced the set to four clusters:
authority, self-restraint, equality, and individuality. Musek (1993) conducted similar work with 54 values,
identifying four underlying categories: hedonistic, moral, achievement and fulfillment. With 56 commonly
cited values and over 25,000 respondents, the Schwartz Value Survey provided a set of 10 universal
subdimensions – power, achievement, hedonism, stimulation, self-direction, universalism, benevolence,
tradition, conformity, security, openness to change/conservation, and self-enhancement/self-transcendence
( Schwartz 1992; Schwartz and Bilsky 1990). Table 1 summarizes a number of findings regarding the value
orientations sighted in the literature and table 2 summarizes values associated with entrepreneurship and its
impact on business activity sighted in the literature.
2010 December Journal.indd 88 12/01/2011 6:42:42 p.m.

Vol VI, Issue 2, December 2010, Page 89 – Refereed Edition
© 2004-2010 [email protected] No Reprints Permitted
Much of the contemporary cross-cultural research builds on the work of Rokeach (1973) and his personal
values system (PVS) consisting of 18 “instrumental “(for example, honesty) and 18 “terminal” (for example,
self-fulfillment) values (Morris and Schindehutte, 2005). Although more than 25 measures of values are
available (Robinson, Shaver and Wrightsman, 1991), the Rokeach’s Value Survey (RVS) and the Kahle’s
List of Values (LOV) remain the most preferred instruments (Jean-Marc Ferrandi et al. 2000). In the present
study, individuals’ personal values systems were measured using Rokeach’s (1973) Personal Value Survey
(PVS). This universal measure has been found to be valid and reliable and has been used in sociology,
psychology, economics, political science, and in the management field ( Fagenson and Coleman 1987;
Feather 1984; Inglehart 1985; Muellar 1984; Parker and Chusmir 1990).
Table 1: Values and beliefsValues and beliefs Source
Liberty, egalitarianism, individualism, populism laissez-faire,
Freedom,/independence/self-direction, self-sufficiency, individualism,achievement, materialism,
Novelty/challenge/excitement, power/status/prestige,Machiavellianism, locus of control, tolerance for ambiguity, dogmatism
Mutual obligation, indebtedness, hard work/diligence, self-sacrifice,Loyalty, harmony for the common good
Avoidance of shame/failure, achievement of team over individual, mutual obligation, education, consensus, risk aversion, hard work, obedience to parents, harmony.
Harmony, cooperation, status quo, decision consensus
Hard work, frugality, future orientation
Respect for elders, education, team over individual, risk aversion, public harmony, reflection of material wealth in success, responsibility
Primary importance of family, cohesiveness of clan, duty and obligation ( Catholic belief system), reciprocity of benevolence, harmony, role of gossip
Social acceptance, group identity, smooth interpersonal relationships, close and extended family ties, reciprocal obligations
Extreme feminism, heightened level of suspicion, patron-client relations, lack of common purpose.
Human heartedness (compassion), social integration (tolerance, trust), moral discipline (prudence, moderation), high propensity to save and reinvest high achievement motivation, loyalty and mutual obligation.
Conformist behaviour, referent group loyalty, deference to authority
Sense of order, obligation to group, preference for harmony, cooperation, family.
Obedience, industriousness, helping others, normative integration of families, behaviours conformity, reinforcement of community goals, hard work, respect.
Respect for others, education, achieving party, calculated risk taking, hierarchy/paternalism, protection of independence.
Fun- loving, generosity, hospitality, spituality, cooperativeness, graciousness, patience, helpfulness, extended family
Lipset (1996)
Holt, Ralston and Terpstra (1994)
Ralston et al. (1993)
Dana (1997)
Dunung (1997)
Lee and Peterson (2000)
Min and Jaret (1985)
Dunung (1998)
Alcantara (1975): Dunung (1995)
Grimm et al. (1999)
Billig (1994)
Ralson et al.(1993); Ralson(1992); Chinese Culture Connection (1987); Wu (1983)
Holt (1997)
Lee and Peterson (2000)
Zhou and Bankston (1994).
Dunung (1998); Dana (1997).
Paxman (1993); Barringer and Liu (1990).
2010 December Journal.indd 89 12/01/2011 6:42:43 p.m.

Page 90– Refereed Edition Vol VI, Issue 2, December 2010,
© 2004-2010 [email protected] No Reprints Permitted
Table 2: Role of Values in EntrepreneurshipValues Associated with Entrepreneuship Impact of value on Business Activity Source
Duty, rationality, novelty, materialism, power
Higher power distance, higher individualism, lower uncertainty avoidance, higher masculinity.
Individualism and attitudes toward role of work.
Power distance.
Individualism, power distance, uncertainty avoidance.
Individualism and collectivism
Individualism, lower uncertainty avoidance, higher power distance, masculinity, longer time orientation
Individualism, high power distance
Feminity, collectivist, high uncertainty avoidance
High uncertainty avoidance, feminity, collectivist
Society’s admiration for entrepreneurs, belief in innovative thinking, belief that entrepreneurship is a respected career path
Low power distance, weak uncertainty avoidance, masculine, individualistic, achievement oriented, universalistic
Social status of entrepreneurship and shame from business failure
Strong work ethic, social relatedness, positive sense of well-being, collective needs and rights
Individual identity, right to private life, emotional independence, self-interest
Value orientations of small business owners
Values and beliefs differentiate those who start businesses
Certain values are more enduring.
Limiting factor for entrepreneurial activity.
Preferences for approaches to championing
Fostering entrepreneurial behaviour of firms
Entrepreneurial cognition ( intention to start a business )
Venture-creation decision
Appreciation for the strategic importance of cooperative strategies
Probability of technology alliance formation
Levels and types of entrepreneurship
Entrepreneurial orientation
Predictors of interest in entrepreneurship
Entrepreneur’s approach to creating and managing the business
Motivation for entrepreneurship
Dollinger and Daily (1990)
McGrath, MacMillan and Scheinberg (1992)
McGrath et al. (1992)
Takyi-Asiedu (1993).
Shane (1994)
Morris, Davis and Allen (1994)
Busenitz and Lau (1996)
Mitchell et al. (2000).
Steensma et al. (2000)
Steensma et al. (2000)
Busenitz, Gomez, and Spencer (2000)
Lee and Peterson (2000)
Begley and Tan(2001)
Morris, Schindehutte and Lesser (2002)
Minoti (2001).
The PVS asks individuals to rank order over two dozen personal values that include terminal values, i.e.,
desired end-states, and instrumental values, i.e., methods used by individuals to achieve desired end-
states. The instrumental values include being imaginative, capable, cheerful, clean, courageous, forgiving,
helpful, honest, imaginative, independent, logical loving, responsible, and self-controlled. The terminal
values include, a comfortable life, an exciting life, a sense of accomplishment, a world at peace, equality,
family security, freedom, happiness, inner harmony, pleasure, salvation, self-respect, social recognition,
true friendship, and wisdom. The instrumental value, power is additionally included as some scholars have
suggested that entrepreneurs value power more (Carland et al. 1984).
Using this measure, the following hypothesis, derived from theoretical perspectives that have been
influential in the entrepreneurial literature, was proposed for testing.
2010 December Journal.indd 90 12/01/2011 6:42:43 p.m.

Vol VI, Issue 2, December 2010, Page 91 – Refereed Edition
© 2004-2010 [email protected] No Reprints Permitted
Hypothesis1. The personal value system of entrepreneurs is different from the personal value system of
students.
Both the entrepreneurship and management literatures suggest that, due to differential sex-role
socialization patterns, women and men have different value systems (Fernald 1988). Downing (1990)
suggested that personal values and objectives of women differ from those of men. This is because men
and women undergo different socialization processes, where each sex acquires specific sex-linked
personal values and learns sex appropriate behaviours (Bird and Brush, 2002). According to this theoretical
perspective, i.e., person-centered approach, women have been socialized to value, for example, being
loving, helpful, forgiving, cheerful,and clean, and to value equality and harmony more than men do (Spence
and Helmreich 1978). Ref. Fagenson. Men have been traditionally socialized to be more material and
achievement-oriented and pleasure seeking than women. This is demonstrated in their value for innovation,
risk taking, independence, capability, courage, ambition, logic, a comfortable life, a sense of accomplishment,
freedom and family security (Fagenson, 1993; Rokeach, 1973; Verheul et al., 2002). The majority of these
values are consistent with those presented in the literature as entrepreneurial. On the other hand, women
have been socialized to be care givers, oriented towards religious values with less emphasizes on the things
valued by men (Boohene et al., 2005). As such, the following hypothesis for testing is proposed:
Hypothesis 2. The personal value system of male and female entrepreneurs will exhibit different values
compared to male and female students.
Method
Sample and Procedure
Efforts were taken to recruit a random sample of men and women entrepreneurs from a diverse set of
industries. This was done to insure that the values of entrepreneurs in general rather than the values of
a particular type of entrepreneur was being sampled and that general rather than industry-specific values
was being examined. Entrepreneurs, who were included in the study, operated businesses in 15 different
industries. These included manufacturing, food, engineering, clothing, personal services, paper bags,
printing, ancillaries to large scale industry, beauty, furniture, construction, water purifiers, and decorating
industries among others. No single industry dominated the sample nor were there significant differences
evidenced for the type of industries individuals operated for in gender (χ2’s = N.S.). Moreover, male and
female entrepreneurs were equally distributed across in a balanced way (table 3). An industry with more
than 60% of one sex was categorized as being dominated by that sex. Only individuals who confirmed to
the definition (table 3) of DIT- District Industries,Trichy1, a Government Body ,owned and run by Tamilnadu
State2 in India. From the list of DIT, a sample of 125 entrepreneurs was selected randomly and was
interviewed personally after getting appointments through telephone. Few entrepreneurs, those who did not
entertain in giving appointments over the phone, were approached in person and data were obtained. Before
questionnaire were handed over to the hands of the entrepreneurs, they were assured that anonymity orally
as well as in writing (in the front page of the questionnaire, statements of guarantee to the anonymity were
printed and all the entrepreneurs were made to see that statement first) to obtain most candid evaluations of
individuals’ personal values.
2010 December Journal.indd 91 12/01/2011 6:42:43 p.m.

Page 92– Refereed Edition Vol VI, Issue 2, December 2010,
© 2004-2010 [email protected] No Reprints Permitted
Table 3: Definition of small industries
Investment in plant and machinery/equipment (excluding land and building)
Category Manufacturing enterprises Service enterprises
Small More than Rs.25 lakh and up to Rs.5 crore
More than Rs.10 lakh and up to Rs.2 crore
Source: Ministry of small scale industries, Govt. of India.
1. Trichy is one of the districts in the country of India.2. Tamilnadu is one of the states in the country in India
Table 4. Chi-square test for male-dominated, female-dominated, and equally balanced industries
Industry N df χ2 pMale-dominated 68 1 2.71 .10Female-dominated 27 1 .02 .94Gender-balanced 30 1 .04 .83
In the case of students sample, survey included 140 students from final year B.Tech class. They were
those who were undergoing entrepreneurship development course as elective in one of the engineering
institutions in India.
Analyses
The Rokeach Value Survey asks individuals to rank order their personal values. Therefore, it is an
ipsative measure (i.e., all rankings are not independent of one another). For example, once a person has
ranked 14 values, the 15th value is completely determined. Rokeach and Ball-Rokeach (1989) argue that
normative statistical tests can be used on ipsative measures if the ipsativity is relatively low. This is the case
in the original and modified Rokeach (1973) Value Survey (Mueller 1984; Rokeach and Ball-Rokeach 1989).
It should be noted that data based on ipsative value rankings are less prone to social desirability effects and
have more predictive validity than data based on ratings ( Rokeach and Ball-Rokeach 1989).
The raw data were transformed to z scores before being statistically analyzed (Feather 1975, 1984).
That is, the value rankings (from l-15) were converted to standardized scores (z scores) corresponding to
15 equal areas under the normal curve (Feather 1984). It has commonly been argued that “differences
in rankings at the ends of the scale may be more distinguishable than differences in rankings made in the
middle” (Feather 1975, p. 24). Conversion of the rank order data to z scores has been recommended and
used in studies of value rankings to control for this problem (Feather 1975, 1984; Rokeach 1 973). Having
made a normal curve transformation of the raw value rankings, parametric statistical procedures were
then applied (Feather 1984). Two 2 X 2 (sex by role of entrepreneurs and students) multivariate analyses
of variance tests (MANOVAs) were conducted, one for the Terminal Values scale and the other for the
Instrumental Values measure. MANOVA was selected as it exercises control over the experiment wise error
rate (i.e., the number of tests/comparisons conducted).
2010 December Journal.indd 92 12/01/2011 6:42:43 p.m.

Vol VI, Issue 2, December 2010, Page 93 – Refereed Edition
© 2004-2010 [email protected] No Reprints Permitted
Results and Findings
The means, standard deviations and ANOVA test results for significant effects for the role of
entrepreneurs as well as students on the values of terminal and instrumental stand for the complete support
of hypothesis 1.
The result reveals that the instrumental values that were found to be given greater weight by the
entrepreneurs than the students were: Independent, honest, ambitious, courageous, capable, self-controlled,
loving/compassionate, power, helpful, courageous, responsible, logical, imaginative, and helpful. These
instrumental values are listed from most to least important. Similarly the instrumental values that were found
to be given greater weight by the students than the entrepreneurs were: loving/compassionate, helpful,
ambitious, honest, forgiving, capable, independent, self-controlled, power, responsible, logical, courageous,
and imaginative.
The means, standard deviations and ANOVA results for significant entrepreneurs and students role for
each of the instrumental values and terminal values are shown in tables 5 and 6.
Table 5. Mean, Standard Deviations and ANOVA Test Results for Significant Effects on the Instrumental Values.
Value
Role of entrepreneur and student
ANOVA
Entrepreneur Studentdf MS F P
M SD M SDInstrumental ValueIndependent 5.54* 3.66 7.83 3.14 (1223) 11.44 11.49 .001Courageous 8.56* 4.01 11.48 3.85 (1223) 17.15 21.32 .001Imaginative 9.96* 4.04 13.54 3.91 (1223) 41.41 54.06 .001Ambitious 4.97* 3.98 6.39 3.08 (1223) 7.81 8.28 .008Honest 4.69* 3.39 6.44 3.98 (1223) 3.00 4.01 .05Logical 9.10* 3.61 10.57 3.15 (1223) 8.40 8.41 .003Self-controlled 7.01* 3.04 9.01 3.06 (1223) 4.82 5.01 .025Capable 6.66* 3.69 7.38 3.87 (1223) 5.19 5.19 .04Power 7.86* 3.06 9.27 3.09 (1223) 5.20 5.21 .001Responsible 8.83* 3.78 9.72 3.89 (1223) 4.81 5.03 .001Forgiving 10.02 4.09 6.54* 3.96 (1223) 27.51 32.03 .001Helpful 8.51 3.03 5.01* 3.46 (1223) 26.71 32.66 .001Loving/Compassionate 7.02 4.01 3.22* 3.01 (1223) 4.82 5.01 .025
*Indicates greater preference. Lower number indicate greater preference
The instrumental values that were found to vary exclusively according to respondents’ role of
entrepreneurs were: independent, courageous, imaginative, ambitious, honest, logical, self-controlled,
capable, power, and responsible and the instrumental values that were found to vary exclusively according
to the role of students were only three. They were forgiving, helpful, and loving and compassionate. The
terminal values that were found to vary exclusively according to the role of entrepreneurs were: self-respect,
freedom, a sense of accomplishment, an exciting life, wisdom, and social recognition. The list of terminal
values that were found to vary exclusively according to the role of students were: pleasure, salvation, true
friendship and happiness.
2010 December Journal.indd 93 12/01/2011 6:42:43 p.m.
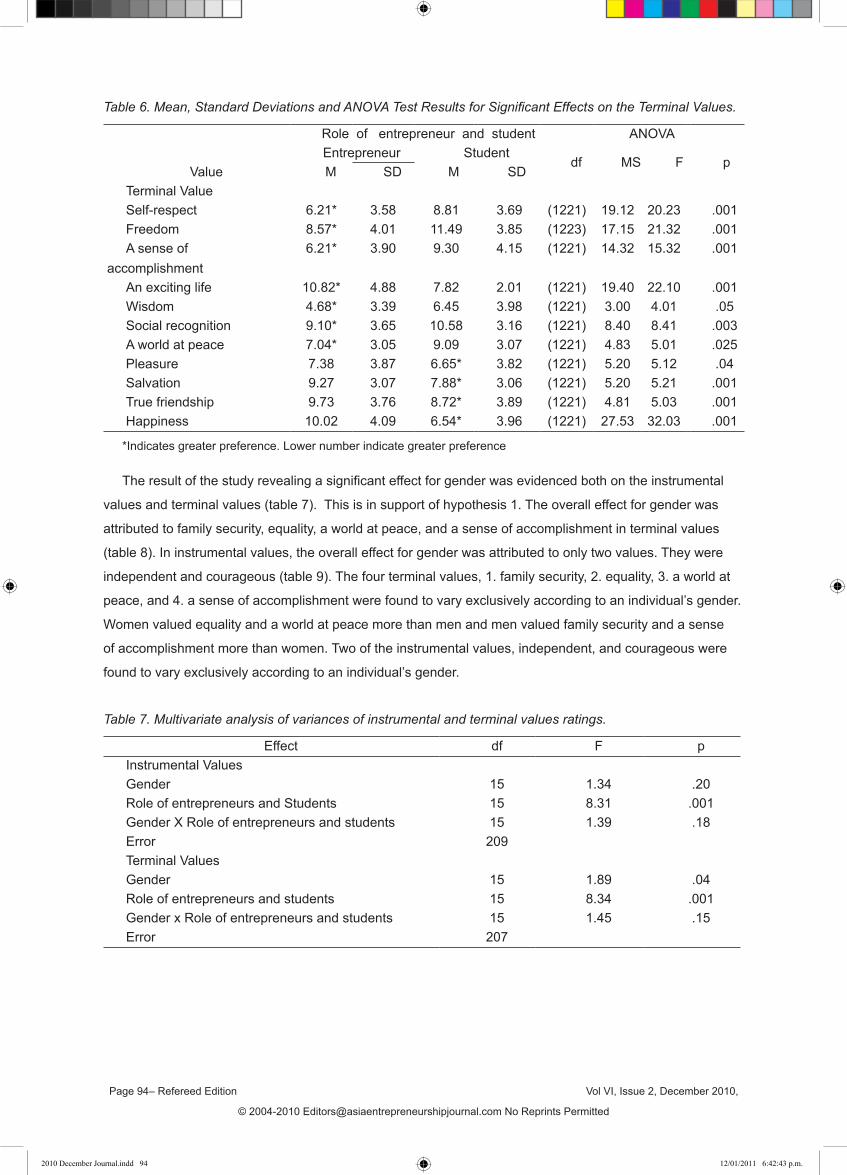
Page 94– Refereed Edition Vol VI, Issue 2, December 2010,
© 2004-2010 [email protected] No Reprints Permitted
Table 6. Mean, Standard Deviations and ANOVA Test Results for Significant Effects on the Terminal Values.
Value
Role of entrepreneur and student ANOVAEntrepreneur Student
df MS F pM SD M SD
Terminal ValueSelf-respect 6.21* 3.58 8.81 3.69 (1221) 19.12 20.23 .001Freedom 8.57* 4.01 11.49 3.85 (1223) 17.15 21.32 .001A sense of
accomplishment6.21* 3.90 9.30 4.15 (1221) 14.32 15.32 .001
An exciting life 10.82* 4.88 7.82 2.01 (1221) 19.40 22.10 .001Wisdom 4.68* 3.39 6.45 3.98 (1221) 3.00 4.01 .05Social recognition 9.10* 3.65 10.58 3.16 (1221) 8.40 8.41 .003A world at peace 7.04* 3.05 9.09 3.07 (1221) 4.83 5.01 .025Pleasure 7.38 3.87 6.65* 3.82 (1221) 5.20 5.12 .04Salvation 9.27 3.07 7.88* 3.06 (1221) 5.20 5.21 .001True friendship 9.73 3.76 8.72* 3.89 (1221) 4.81 5.03 .001Happiness 10.02 4.09 6.54* 3.96 (1221) 27.53 32.03 .001
*Indicates greater preference. Lower number indicate greater preference
The result of the study revealing a significant effect for gender was evidenced both on the instrumental
values and terminal values (table 7). This is in support of hypothesis 1. The overall effect for gender was
attributed to family security, equality, a world at peace, and a sense of accomplishment in terminal values
(table 8). In instrumental values, the overall effect for gender was attributed to only two values. They were
independent and courageous (table 9). The four terminal values, 1. family security, 2. equality, 3. a world at
peace, and 4. a sense of accomplishment were found to vary exclusively according to an individual’s gender.
Women valued equality and a world at peace more than men and men valued family security and a sense
of accomplishment more than women. Two of the instrumental values, independent, and courageous were
found to vary exclusively according to an individual’s gender.
Table 7. Multivariate analysis of variances of instrumental and terminal values ratings.
Effect df F pInstrumental ValuesGender 15 1.34 .20Role of entrepreneurs and Students 15 8.31 .001Gender X Role of entrepreneurs and students 15 1.39 .18Error 209Terminal ValuesGender 15 1.89 .04Role of entrepreneurs and students 15 8.34 .001Gender x Role of entrepreneurs and students 15 1.45 .15Error 207
2010 December Journal.indd 94 12/01/2011 6:42:43 p.m.

Vol VI, Issue 2, December 2010, Page 95 – Refereed Edition
© 2004-2010 [email protected] No Reprints Permitted
Table 8. Mean, Standard Deviations and ANOVA Test Results for Significant Effects on the Terminal Values for Gender.
ValueMale Female ANOVA
M SD M SD df MS F pTerminal ValueFamily Security 3.02* 3.06 4.98 3.32 (1221) 10.09 10.81 .001Equality 12.04 3.82 9.10* 4.04 (1221) 10.23 11.10 .001A world at peace 9.91 3.39 8.04* 4.03 (1221) 5.52 6.19 .01Sense of accomplishment 8.24* 4.57 10.90 3.93 (1221) 16.48 18.32 .001
*Indicates greater preference. Lower number indicate greater preference
Table 9. Mean, Standard Deviations and ANOVA Test Results for Significant Effects on the Instrumental Values for Gender
ValueMale Female ANOVA
M SD M SD df MS F PInstrumental ValueIndependent 5.56* 3.94 7.38 3.08 (1221) 10.46 10.94 .001Courageous 7.04* 4.78 6.41 3.21 (1221) 7.83 8.72 .001
*Indicates greater preference. Lower number indicate greater preference
Men valued independent and courageous more than women. The gender wise means and standard
deviations for male and female entrepreneurs and students are presented in tables 10 and11.
Table 10 Mean Ranks and Standard Deviations of the Instrumental Values for Male and Female Entrepreneurs and Students
Value
Entrepreneurs StudentsMale Female Male Female
M SD M SD M SD M SDInstrumental ValueIndependent 4.01 3.02 5.02 3.50 8.76 3.92 8.25 3.78Responsible 4.25 2.00 5.01 3.50 6.01 3.01 6.53 3.02Ambitious 4.27 3.65 6.48 4.62 4.30 2.15 4.25 2.19Capable 4.70 2.76 6.46 3.18 5.47 3.02 7.02 3.37Honest 5.32 3.88 5.27 3.01 5.81 3.00 7.01 3.98Courageous 6.21 3.06 6.13 3.08 9.41 2.80 9.45 2.88Self-controlled 6.69 2.78 7.64 3.62 8.02 3.18 6.58 3.78Logical 8.61 3.91 9.30 3.48 10.70 3.26 10.82 3.81Clean 8.51 2.78 8.19 2.99 9.24 2.08 9.01 2.52Forgiving 9.68 3.54 7.65 3.72 5.78 3.60 5.08 4.01Loving, compassionate 9.31 4.23 7.07 4.23 3.20 3.14 3.19 3.20Imaginative 9.01 3.98 8.02 3.90 11.44 2.99 11.76 2.82Helpful 11.42 3.88 10.05 3.75 7.08 2.60 5.08 4.01Power 8.84 2.04 9.02 2.39 11.80 3.89 11.43 4.18Cheerful 9.84 4.01 11.20 4.82 7.02 2.52 9.54 2.18
*Indicates greater preference. Lower number indicate greater preference
Discussion
The present research comes out with several differences between the values rankings of entrepreneurs
and students. Entrepreneurs valued self-respect, freedom, a sense of accomplishment, an exciting life
and wisdom more than students in the goals or desired end-states or terminal values. The methods or
2010 December Journal.indd 95 12/01/2011 6:42:43 p.m.

Page 96– Refereed Edition Vol VI, Issue 2, December 2010,
© 2004-2010 [email protected] No Reprints Permitted
instrumental values that entrepreneurs valued using more than students to help them achieve these terminal
values or desired end-states were independent, courageous, imaginative, ambitious, honest, logical, self-
controlled, capable, power, and responsible. Similarly students value more than entrepreneurs in the desired
end-states or terminal values were pleasure, salvation, true friendship, and happiness. The methods or
instrumental values students valued using more than entrepreneurs to help them achieve these end-states
were forgiving, helpful, and loving/compassionate. These value comparisons reveal that entrepreneurs want
something different out of life than students. Whereas the students prefer to enjoy the pleasures that life
has to offer. Entrepreneurs want to be free to achieve and actualize their potential. Four in terminal values
and two in instrumental values out of total thirty values differed according to respondents’ gender. Two of
the four values that were differentially ranked by male entrepreneurs were family security and sense of
accomplishment. This may be due to men’s sex role socialization to be the ‘breadwinners’ of their families.
Although many women have a similar responsibility today, their sex-role socialization training did not
emphasize this value to the same degree as it was emphasized for men (Powell 1988). The conclusion of
Richard De Martino and Robert Barbato (2003) in their study is that differences between female and male
entrepreneurs become larger if the entrepreneurs are married with dependent children. Here, one may raise
a question whether family security is related to whether or not one (from entrepreneurs’ side as well as
students’ side) has a family. On the assumption that students getting married during the time of graduation
is very meager, the present study attempts to find the value priorities of these two groups and thus did not
ask the respondents from both the sides (entrepreneurs and students) to rank their values by postulating
themselves in a hypothetical situation of family with children. However this could be considered as one of
the limitations of the study. The reason for high ranking of a sense of accomplishment by males, though not
clear, might be attributed to need for achievement characteristic of the entrepreneur for the entrepreneurs’
side. The belief that entrepreneurs might have a distinctly higher need for achievement is widely held
(McClelland, 1965; Cromie, 2000). 20 out of 23 major studies in the entrepreneurship literature found a fairly
consistent relationship between need for achievement and entrepreneurship despite the variability among
the studies regarding samples and the operationalization of the need for achievement (Johnson, 1990;
Shaver and Scott, 1991). Women were found to value equality more than men. This may be a reaction to the
discriminatory treatment women have historically received. Indeed, a great deal of research has documented
the non-equal treatment of women and men although it should be acknowledged that some research has
found no discrimination against women (Powell 1988). A world at peace was also valued more by women
than men. Why it was valued more is not immediately clear. Future research should be undertaken to help
explain this finding. The gender difference that emerged for “a world at peace” may be related to what
some have attributed to socialization and others to biological differences between the sexes (Fagenson
1993). The majority of studies in this area have found that men are more aggressive than women (Powell
1988). The results evidenced for this value reflect this difference. Overall, knowing the difference between
an entrepreneur and a student appears to be a better indicator of his/her values than knowing whether the
individual is male or female. These findings provide strong support for the situation-centered or occupational
role perspective and little support for the person-centered view.
2010 December Journal.indd 96 12/01/2011 6:42:43 p.m.

Vol VI, Issue 2, December 2010, Page 97 – Refereed Edition
© 2004-2010 [email protected] No Reprints Permitted
Table 11. Mean Ranks and Standard Deviations of the Terminal Values for Male and Female Entrepreneurs and Students
Value
Entrepreneurs StudentsMale Female Male Female
M SD M SD M SD M SDTerminal ValueA sense of accomplishment 5.42 3.82 5.05 3.87 9.72 3.90 9.45 4.58Equality 11.14 2.86 8.76 4.05 11.44 3.62 9.02 4.42Family security 4.74 2.92 7.11 3.89 7.86 4.42 6.10 3.02Comfortable life 824 4.51 9.15 4.81 7.01 2.96 6.04 2.91An exciting life 11.64 3.45 12.01 2.98 8.32 3.02 12.92 3.38Freedom 5.21 3.15 5.91 3.54 8.10 3.69 7.90 4.03Self-respect 5.43 3.26 5.04 2.58 7.66 3.78 8.35 3.81Wisdom 6.67 2.96 7.22 2.77 5.31 2.06 5.63 2.95True friendship 7.04 3.25 8.35 2.59 5.52 2.61 4.62 3.19Salvation 10.11 5.06 9.08 4.92 4.87 3.18 6.39 3.88Social recognition 10.02 4.09 9.86 3.96 9.49 3.23 8.32 3.02Pleasure 10.09 2.42 10.52 2.58 7.86 3.06 9.46 3.75Inner harmony 7.77 3.58 6.28 3.32 5.29 3.51 5.45 3.17Happiness 6.53 3.52 7.23 3.61 5.28 3.83 5.40 4.25A world at peace 9.84 4.01 7.89 4.82 7.02 2.52 9.54 2.18
Lower scores indicate more important values.
The data analyses and subsequent discussion on the findings tends to lead this research study to draw
the following specific conclusions. Based on the value rankings of both the entrepreneurs and the students,
the entrepreneurs prefer to be independent, courageous, imaginative, ambitious, honest, self-controlled
and are capable and responsible whereas the students prefer to be forgiving, helpful, and loving and
compassionate.
Limitations of the study
The limitations of this study should be noted. Future research should be conducted in other areas of
the country and with a different set of entrepreneurs and students to determine the generalizability of these
findings. Furthermore, students sample may be included from other disciplines such as arts, science,
management etc. In evaluating the results of this the reader should also be reminded that factors other than
individuals’ gender, the role of entrepreneur and the role of student contribute to the weighting of their values.
Implications for future research
First the study revealed that the role of entrepreneur or student, and not gender, is a better indicator of
individuals’ value systems. This is an important finding, because many individuals and organization often, at
best, perceive women as being a ‘breed’ different and apart from men and, at worst, discriminates against
them because of this perception(Schneer and Reitman 1990). Only four of 15 terminal values and two of 15
instrumental values were varying according to gender. Out of 30 values only six, which is 20 percent, were
distinguishable on the basis of gender. Overall, this research suggests that such an attitude is unwarranted
and offers us some encouragement for managing gender diversity in “Workforce 2000” which will witness
even more women students entering this career (Nelton 1989). Becoming an entrepreneur requires a great
deal more than having normative personal values, but it may be one place to start.
2010 December Journal.indd 97 12/01/2011 6:42:43 p.m.

Page 98– Refereed Edition Vol VI, Issue 2, December 2010,
© 2004-2010 [email protected] No Reprints Permitted
ReferencesAgle, B. R. and C. B. Caldwell, 1999.Understanding Research on Values in Business. Business and Society
38(3), 326–387.Alacantara, R.R., 1975. American subcultures: Filipino Americans. Honolulu: University of Hawaii.Bales, R.F., and A.S. Couch, 1969. The value profile: A factor analytic study of value statement. Sociological
inquiry. 39(1), pp.3-17.Barringer,H., and N.Liu,1990. The demographic , social, and economic status of Native Hawaiians,
Honolulu,HI: University of Hawaii.Begley,T.M., and W.L.Tan,2001. The socio-cultural environment for entrepreneurship: A comparison between
Asian and Anglo-Saxon countries. Journal of international business studies 32(3),pp.537-553.Beutell, N.J., and Brenner, O.C. 1986. Sex differences in work values. Journal of Vocational Behavior 28:
29-41.Billig,M.S., 1994. The death and rebirth of entrepreneurism on Negros Island, Philippines: A Critique of
cultural theories of enterprise. Journal of Economic Issues. 38(3), pp.659-678. Bird, B. and Brush, C.,2002. A gendered perspective on organisational creation. Entrepreneurship Theory
and Practice, 26 (3), pp. 41-66.Bird,D.,1989. Entrepreneurial behaviour.London:Scott, Foresman and Co.Boohene, R., Kotey, B. and Folker, C.A., 2005. Explaining gender differences in performance among small
and medium enterprise owners in Ghana. Proceedings of the International Council of Small Business 50th Annual Conference, Washington, DC, June.
Brenner, O.C., Blazini, A.P., and Greenhaus, J.H. 1988. An examination of race and sex differences in managerial work values. Journal of Vocational Behavior 32:336344.
Brief, A.P., Van Sell, M., Aldag, R.J. 1979. Vocational decision making among women: Implications for organizational behavior. Academy of Management Review, 4, X2-530.
Brockhaus, R.H. and Horwitz, P.S. 1986. The psychology of the entrepreneur. In D. Sexton and R. Smilor, eds., the Art and Science of Entrepreneurship. Cambridge, MA: Ballinger, pp. 25-48.
Bryan, L., 1999. American Indian entrepreneurs: Rosebud and Pind Ridge reservation, case studies, Pablo, MT: Salish Kootenai College Press.
Busenitz., L.W., and C.M. Lau,1996. A cross-cultural cognitive model of venture creation. Entrepreneurship theory and practice, 20(4),pp.25-39.
Busenitz,L.W., C.Gomez, and J.W. Spencer,2000. Country institutional profiles:Unlocking entrepreneurial phenomena. Academy of management journal 43(5),pp.994-1004.
Carland, J.W, Hoy, F., Boulton, W.R., and Carland, J. 1984. Differentiating entrepreneurs from small business owners: A conceptualization. Academy of Management Review 9:3X-359.
Carter, N.M., Williams, M. and Reynolds, P.D. (1997), ‘‘Discontinuance among new firms in retail: the influence of initial resources, strategy and gender’’, Journal of Business Venturing, Vol. 12, pp. 125-45.
Chinese culture connection, 1987. Chinese values and the search for culture-free dimensions of Culture. Journal of cross-cultural psychology. 18(2), pp.147-148.
Covey, S.R. 1990. Principle Centered Leadership. New York: Simon & Schuster.Cromie, S.2000.Assessing entrepreneurial inclination: Some approaches and empirical evidence. European
Journal of Work and Organizational Psychology, Vol. 9 No. 1, pp. 7-30.Dana, L.P., 1997. The origins of self-employment in ethnocultural communities: Distinguishing between
orthodox entrepreneurship and reactionary enterprise. Canadian journal of administrative sciences. 14(1), pp.52-68.
Desalvia and Gemmill, 1971. An exploratory study on the personal value systems of college students and managers. Academy of Management Journal, 14.
Djula Borozan, 2007. Review of business research.Dollinger, and C. Daily,1990. The value orientation of minority and non-minority small business owners.
Entrepreneurship theory and practices 15 (1), pp.23-35.Downing, J.,1990.Gender and the growth dynamics of micro enterprises. unpublished manuscript,
Washington, DC.Drumwright, M. E., 1994.Socially Responsible Organisational Buying: Environmental Concern as a
Noneconomic Buying Criterion. Journal of Marketing 58 ( July), 1–19.
2010 December Journal.indd 98 12/01/2011 6:42:43 p.m.

Vol VI, Issue 2, December 2010, Page 99 – Refereed Edition
© 2004-2010 [email protected] No Reprints Permitted
Dunung, S.P., 1998. Doing business in Asia. San Francisco : Jossey-Bass Publishers.Fagenson, E.,1993. Personal value systems of men and women entrepreneurs versus managers. Journal of
Business Venturing, 8, pp. 409-30.Feather, N.T. 1984. Masculinity, femininity, psychological androgyny and the structure of values. Journal of
Personality and Social Psychology 47:604-620.Feather, N., 1990. Bridging the gap between values and actions: Recent applications of the expectancy-
value model, in Handbook of motivation and cognition: Foundations of social behaviour, Ed. E.T.Higgins, New York: The Guilford Press. pp. 123-159.
Fiedler, F. E.1967. A Theory of Leadership Effectiveness. New York: McGraw-Hill Book Co.Frank, A. G.: 1963, ‘Administrative Role Definition and Social Change’, Human Organization 22, 238–242.Gasse, Y., 1977. Entrepreneurial characteristics and practices. A study of the dynamics of small business
organizations and their effectiveneness in different environments. Sherbrooke, Quebec:Rene Prince Publishers.
Giacomino, D., A. Fujita and T. M. Johnson, 2000. Are the Effects of Age and Gender Changing thePersonal Values of Japanese Executives?’, Business Forum 24(1/2), 15–20.
Grunert S.C. and Scherhorn G., 1990. Consumer Values in West Germany: Underlying Dimensions and Cross-Cultural Comparison with North America, Journal of Business Research, 20 (2), 97-107.
Harrison, E. F, 1975. The Managerial Decision-Making Process (Houghton Mifflin, Boston, U.S.A.).Hemingway,C.A., and Maclagan, P.W., 2004. Managers’ Personal Values as Drivers of Corporate Social
Responsibility. Journal of Business Ethics 50: 33–44, 2004.Hofstede, G. 1980. Culture’s Consequences: International Differences in Work-Related Values (Sage,
Beverley Hills, CA).Holt,D.G.,1997. A comparative study of values among Chinese and U.S. entrepreneurs: Pragmatic
convergence between contrasting cultures. Journal of business venturing 12(6), pp. 483-505.Holt, D.G., D.A. Ralston, and R.H. Terpstra, 1996. Constraints on capitalism in Russia: The managerial
psyche, social infrastructure and ideology. California Management Review. 36 (3), pp. 124-141. Jacob, P. E., J. J. Flink and H. L. Schuchman, 1962.Values and their Function in Decision-Making. American
Behavioral Scientist 5 (suppl.), 1–34.Jean-Marc Ferrandi et al. 2000. Linking personal values and time orientations: the case of the attitude
towards Cellular phone in France and Germany. Università Ca’ Foscari Venezia 24 Novembre .Johnson, B.R. 1990. Toward a multidimensional model of entrepreneurship: the case of achievement
motivation and the entrepreneur. Entrepreneurship: Theory and Practice, Vol. 14, pp. 39-54.Kahle, Lynn R., B. Poulos and A. Sukhdial, 1988. Changes in Social Values in the United States During the
Past Decade. Journal of Advertising Research (February/March), 35–41.Kilby,R.W., 1993. The study of human values. Lanham, MD:University Press of Amercia.Kluckhohn,C., 1951. Values and value orientation in the theory of action. Ed. T.Parsons, and E.S. Shields,
Cambridge,MA: Harvard University Press.Koh, H.C., 1996.Testing hypotheses of entrepreneurial characteristics: A study of Hong Kong MBA students.
Journal of Managerial Psychology, Vol. 11 No. 3, pp. 12-25.Lee, S.M., and S.J. Peterson., 2000. Culture, entrepreneurial orientation and global competitiveness. Journal
of World Business. 35(4), pp.401-415.Lipset,S.M., 1996. American Exceptionalism: A double-edged sword. New York:WW NortonLuck, E. J. and Oliver, Bruce L. 1074. American Managers’ Personal Value System – Revisited. Academy of
Management Journal, September, pp. 549 – 554.MacMillan, I.C., Siegel, R., and Subba Narashima, P.N. 1985. Criteria used by venture capitalists to evaluate
new venture proposals. Journal of Business Venturing 1: 119-128.McClelland, D.C., 1965. Toward a theory of Motive acquisition . American psychologist, 20(2),321-333.McClelland, D.C., 1965. Achievement Motivation Can Be Developed., Harvard Business Review, Vol. 43, pp.
6-25.McGrath,R.G.., I.C MacMillan, and S.Scheinberg,1992. Elitists, risk-takers, and rugged individualists? An
exploratory analysis of cultural differences between entrepreneurs and nonentrepreneurs. Journal of business venturing,7(2),pp.115-135.
McGrath,R.G., I.C. MacMillan, E.A. Yang, and W.Tsai,1992. Does culture endure, or is it malleable? Issues for entrepreneurial economic development. Journal of business venturing,7(6),pp.441-459.
2010 December Journal.indd 99 12/01/2011 6:42:44 p.m.

Page 100– Refereed Edition Vol VI, Issue 2, December 2010,
© 2004-2010 [email protected] No Reprints Permitted
Miemie Struwig and Nelson Mandela, 2008. Exploring the Value Profiles of Business Students in South Africa. The Business Review, Cambridge , 9 ( 2 ).
Minoti,M. 2001. The cultural foundations of economic development: Urban female entrepreneurship in Ghana. American journal of economics and sociology 60(3),pp.703-706.
Mitchell, R.K., B.Smith, K.W. Seawright, and E.A.Morse,2000. Cross-cultural cognitions and the venture creation decision. Academy of management journal,43(5),pp.974-994.
Mohar Yusof ,Manjit Singh Sandhu, Prof. Dr. Kamal Kishore Jain,2007. Relationship between psychological Characteristics and entrepreneurial Inclination. Journal of Asia Entrepreneurship and Sustainability,3(2).
Morris,M.H., D.Davis, and J.Allen, 1994. Fostering corporate entrepreneurship: Cross-cultural Comparisons of the importance of individualism versus collectivism. Journal of International Business Studies 25(1),pp.65-89.
Morris and Schindehutte, 2005. Entrepreneurial values and the ethnic enterprise: An examination of six subcultures. Journal of small business management. 43(4), pp. 453-479.
Morris, M.H., M.Schindehutte, and J.Lesser, 2002. Ethnic entrepreneurship: Do values matter? New England Journal of entrepreneurship 5(2), pp.35-46.
Mueller, D.J. 1984. Rokeach value survey. In D.J. Keyser and R.C. Sweetland, eds., test critiques, vol. 1. Test Corporation of America: Kansas City, MO, pp. 549-554.
Musek,J., 1993. The universe of Human values: A structural and developmental hierarchy. Studia psychological 35(4), pp.321-326.
Nelton, S. May 1989. The age of the woman entrepreneur. Nation’s Business pp 22-26.
Olson, S.F. and Currie, H.M. 1992.Female entrepreneurs: personal value systems and business strategies in a male-dominated industry. Journal of Small Business Management, Vol. 30 No. 1, pp. 49-57.
Pearsall, J. (ed.), 1999. Concise Oxford Dictionary, 10th edition. Oxford University Press, Oxford, U.K.Paxman,D.,1993. A newcomer’s guide to Hawaii. Honolulu, HI: Mutual publishing.Powell, G. 1988. Women and Men in Management. Beverly Hills: Sage Publications.
Ralston,D.A., D.J. Gustafson, P.M. Elsass, F.Cheung, and R.H. Terpstra, 1992. Eastern values. A comparison of managers in the United States, Hong Kong and the people’s Republic of China. Journal of Applied Psychology. 77(5), 664-671.
Ralston, D.A., D.J. Gustafson, F.M. Cheung, and R.H. Terpstra, 1993. Differences in managerial values: A study of US, Hong Kong and PRC manager. Journal of international business studies, 24(2), pp.249-275.
Ray,D., and D.Turpin,1990. Factors influencing entrepreneurial events in Japanese high technology venture business. Journal of business venturing 5(2), pp.91-103.
Rokeach,M., 1973. The nature of human values. New York: The free press.Rokeach, M., and Ball-Rokeach, S.J. 1989. Stability and change in American value priorities, 1968-1981.
American Psychologist 44:775-784.Schein, E.H. 1983. The role of the founder in creating organizational culture. Urgunizutional Dynamics
12: 13-28.Schneer, J. and Reitman, F., 1990. Effects on employment gaps on the careers of MBA’s: More damaging for
men than women? Academy of Management Journal, 33,391406.Schwartz.,S.H., 1992. Uniersals in content and structure of values: Theoretical advances and empirical
tests in 20 countries, in Advances in experimental social psychology, Ed.M.P.Zanna, San Diego, CA:Academic Press, 1-65.
Schwartz, S. H. and W. Bilsky, 1987.‘Toward a Universal Psychological Structure of Human Values. Journal of Personality and Social Psychology 53, 550–562.
Schwartz, S.H., and W. Bilsky., 1990. Towards a theory of the universal content and structure of values: Extensions and cross-cultural replications. Journal of personality and social psychology. 58(5), pp.878-891.
Selznick, P., 1949. TVA and the Grass Roots. University of California Press, Berkeley.Shane, S., 1994. The effect of national culture on the choice between licensing and direct foreign investment
. Strategic management journal, 15(8), pp.627-643.Shaver, K.G. and Scott, L.R. (1991). Person, process, choice: the psychology of new venture creation.
Entrepreneurship Theory and Practice, Vol. 16, pp. 23-45.
2010 December Journal.indd 100 12/01/2011 6:42:44 p.m.

Vol VI, Issue 2, December 2010, Page 101 – Refereed Edition
© 2004-2010 [email protected] No Reprints Permitted
Spranger, E.,1928. Types of Men. Halle: Germany: Max Niemeyer Verlag.Steensma,H.K., L.Marino, K.M. Weaver, and P.H. Dickson,2000. The influence of national culture on
the formation of Technology alliances by entrepreneurial firms. Academy of management journal,43(5),pp.951-974.
Stuart, R.W., and Abetti, P.A. 1990. Impact of entrepreneurial and management experience on early performance. Journal of Business Venturing 5: 15 l-l 62.
Takyi-Asiedu,S.,1993. Some socio-cultural factors retarding entrepreneurial activity in sub-Saharan Africa. Journal of Business venturing, 8(2), pp.91-98.
Tannenbaun, R. and Schmidt, Warren, 1958. How to Choose a Leadership Pattern. Harvard Business Review, March – April, pp. 95 – 102.Verheul, I., Risseeuw, P. and Bartelse, G. ,2002. Gender differences in strategy and human resource management. International Small Business Journal, 20 (4), pp. 443-76.
Verheul, I., Uhlaner, L. and Thurik, A.R.2002. What is an entrepreneur? Self-image, activities and gender, Proceedings of the International Council for Small Business, 47th World Conference, San Juan, 16-19 June.
Zhou,M., and C.L. Bankston, 1994. Social capital and the adaptation of the second generation: The case of Vietnamese youth in New Orleans. International migration review 28(4), pp.821-845.
2010 December Journal.indd 101 12/01/2011 6:42:44 p.m.

Page 102– Refereed Edition Vol VI, Issue 2, December 2010,
© 2004-2010 [email protected] No Reprints Permitted
2010 December Journal.indd 102 12/01/2011 6:42:44 p.m.

Vol VI, Issue 2, December 2010, Page 103 – Refereed Edition
© 2004-2010 [email protected] No Reprints Permitted
Entrepreneurial Orientation, Knowledge Process, and Marketing Performance
An investigation in small organizations in Sharjah Emirate
Dr.Rashad Al-Saed, Associate Professor, Skyline University
Dr.Rajmohan P, Associate Professor, Skyline University
Dr.Amitabah Upadhya, Associate Professor, Skyline University
Abstract
This study examines the relationships among entrepreneurial orientation, knowledge creation process,
and firm’s marketing performance using survey data from 40 entrepreneurs in Sharjah ,UAE . We used
regression and correlation analysis to test the direct and indirect effects of the entrepreneurial orientation
on firm is marketing performance. Knowledge creation process – operationalized to reflect the dimensions
of socialization, externalization, combination, and internalization – is used as the mediating variable for
explaining the relationship between entrepreneurial orientation and firm’s marketing performance. The
results indicate that the significance of the direct effect of entrepreneurial orientation on firm’s marketing
performance is reduced when the indirect effect of entrepreneurial orientation through knowledge creation
process is included in a total effect model. Consequently, entrepreneurial orientation is positively related to
firm’s marketing performance, and knowledge creation process plays a mediating role in this relationship.
Keywords: Entrepreneurial orientation; Knowledge creation; and Firm performance Introduction:
In entrepreneurship research, entrepreneurial orientation has been found to have a positive impact
on firm performance (e.g., Covin and Slevin, 1991, Smart and Conant, 1994 and Wiklund, 1999) Many
start-up firms implement new venture strategy in order to constantly seek better performance. They would
apply diverse strategies to deal with market activities (Jain, 2001 and Li, 2001) . Entrepreneurship was
considered the means by which market orientation was translated into business performance (e.g., through
development of new products, services, production process technology, organizational structure and/or
administrative process). More recently, drawing on the resource-based view of the firm, Hult and Ketchen
(2001) have suggested that market orientation and entrepreneurship are organizational capabilities that
contribute to the creation of a unique resource, ‘positional advantage’, which positively affects performance.
Finally, Atuahene-Gima and Ko (2001) In entrepreneurship research, entrepreneurial orientation has been
found to have a positive impact on firm performance (e.g., Covin and Slevin, 1991, Smart and Conant,
1994 and Wiklund, 1999). Firms with high levels of entrepreneurial orientation tend to constantly scan and
monitor their operating environment in order to find new opportunities and strengthen their competitive
positions (Covin and Miles, 1999). Accordingly, the development of new venture strategy involves intensive
2010 December Journal.indd 103 12/01/2011 6:42:44 p.m.
Page 104– Refereed Edition Vol VI, Issue 2, December 2010,
© 2004-2010 [email protected] No Reprints Permitted
knowledge activities, and knowledge creation process plays a critical role in the strategy making of new
ventures. Knowledge creation process may facilitate new venture strategy to transform into knowledge
assets shared by organizational members and result in enhanced firm performance. However, most studies
have not examined how new venture strategy could administer knowledge creation process for the improved
performance. This paper focuses on how knowledge creation process might mediate the new venture
strategy-performance relationship.
This study adds to previous work examining the effect of new venture strategy on firm performance.
The primary objective of this paper is to examine how strategies adopted by new ventures affect firm
performance through knowledge creation process. Using Nonaka’s theory of knowledge creation as a
theoretical basis (Nonaka, 1994), As part of their environment scanning and monitoring activities, firms
look for information that can help them better meet the needs of their customers, manage their risk
taking, as well as challenge their competitors. While large firms typically have the resources to conduct
extensive market research to gather such information, it is not clear to what extent small and medium-sized
enterprises (SMEs) engage in information acquisition and utilization, and whether such activities influence
firm performance. In both streams of entrepreneurship and marketing literature, it has been noted that
information on customers and competitors has significant effect on marketing decision-making (Smeltzer
et al., 1988, Brush, 1992, Menon and Varadarajan, 1992 and Deshpandé and Zaltman, 1982). There is a
need to continuously gather information on customer needs and competitor capabilities in order to deliver
consistently high-quality products and services as well as to create superior customer value (Slater and
Narver, 1998). However, previous research efforts examining the effect of marketing information were
limited by the lack of in-depth marketing variables studied (Perkins and Rao, 1990 and Schafer, 1990). After
acquiring information, it is crucial that SMEs use the information to their advantage. Unless the collected
information is used, it does not provide any tangible benefit. Unfortunately, with few exceptions (Johnson
and Kuehn, 1987, Brush, 1992, Cooper et al., 1995 and Butler et al., 2000 J.E. Butler, H.T. Keh and W.
Chamornmarn, Information acquisition, entrepreneurial performance and the evolution of modern Thai
retailing, Journal of Asian Business 16 (2000), pp. 1–23.Butler et al., 2000), most researchers on SMEs
do not consider information utilization. As such, the literature has not addressed how SMEs use marketing
information to enhance firm performance. We also do not know how entrepreneurial orientation shapes the
extent of information acquisition and utilization. Some studies found that entrepreneurial orientation enables
small firms or new ventures, which are defined as firms newly built or less than ten years old (Lussier, 1995),
to perform better than competitors and enhance firm performance ([Ireland et al., 2003], [Lumpkin and
Dess, 2001], [Wiklund and Shepherd, 2005] and [Zahra and Garvis, 2000]). most studies investigating the
independent effect of entrepreneurial orientation on firm performance ignore the factors that may mediate
the strength of the entrepreneurial orientation — firm performance relationship (Wiklund & Shepherd,
2005).As newly built firms, new ventures tend to have relatively limited financial and managerial resources
(Eisenhardt & Schoonhoven, 1990), so they may be especially careful in pursuing strategic orientation. Given
the importance of entrepreneurship to firm performance, entrepreneurial orientation can be an important
measure of how a firm is organized to discover and exploit market opportunities ([Barringer and Bluedorn,
1999], [Ireland et al., 2003], [Wiklund and Shepherd, 2003] and [Zahra and Garvis, 2000]). Based on the
theory of knowledge creation, knowledge is created through a spiral process of socialization, externalization,
2010 December Journal.indd 104 12/01/2011 6:42:44 p.m.

Vol VI, Issue 2, December 2010, Page 105 – Refereed Edition
© 2004-2010 [email protected] No Reprints Permitted
combination, and internalization (SECI) ([Nonaka, 1994] and [Nonaka and Konno, 1998]). The SECI process
of knowledge creation describes dynamic interaction between tacit and explicit knowledge ([Nonaka, 1994]
and [Nonaka and Takeuchi, 1995]). When new ventures develop and formulate entrepreneurial orientation,
they can utilize the SECI spiral of knowledge creation to connect and arrange new and existing knowledge
from many different individuals ([Gold et al., 2001], [Nonaka and Takeuchi, 1995] and [Nonaka et al.,
2000b]). Employees can learn and exchange knowledge collectively, and better understand entrepreneurial
style and vision articulated by explicit concepts and notions. Entrepreneurial practices and activities are
then integrated and disseminated throughout the firm to generate more knowledge applications. A firm can
actualize entrepreneurial orientation into practical action and embody knowledge into valuable assets to
advance new products development or marketing activities ([Nonaka, 1994], [Nonaka and Konno, 1998],
[Nonaka and Toyama, 2005] and [Nonaka et al., 2000a]). Such dynamic knowledge conversion of SECI can
enhance the firm’s capability to fulfill the strategic objective and achieve firm performance such as product
innovation or process improvement, this study attempt to contribute previous studies that have examined the
effects of entrepreneurial orientation on firm performance. The primary objective of this article is to examine
how entrepreneurial orientation adopted by new ventures affects firm performance through knowledge
creation process. Using Nonaka’s theory of knowledge creation as a theoretical angle (Nonaka, 1994), we
develop and test hypotheses on such mediating effect using a sample of new ventures in UAE. We focus on
the importance of knowledge creation process in the relationship between entrepreneurial orientation and
firm performance by examining the direct effect of entrepreneurial orientation upon firm performance and
the indirect effect of entrepreneurial orientation upon firm performance through knowledge creation process.
The rest of the paper is set out as follows. The next section considers the previous literature and sets out the
hypotheses of this study. Following is the methodology for the study. Then, the paper presents the results of
the empirical study in achieving the goals as those set out above. Discussion and conclusions are provided
in the last section.
2. Model and hypotheses development
As shown in Fig. 1, our model explains the relationship among the entrepreneurial orientation ,knowledge
process creation and the performance of SEs (Small Enterprise size)
Figure .1; Entrepreneurial Orientation, Knowledge creation Process, Marketing Performance
Entrepreneurial Orientations:
A-Innovation
B. Search for risk
C. Proactive
D. Competitive aggression
E. Autonomy
Marketing Performance:
1. Non Financial
A. market share
B. sales volume
C. customer satisfaction& Loyalty
2. Financial Performance: Profit, Revenue &RIO
Knowledge Creation Process: (SECI)
A. Socialization B. External C. Combination D. Internal
2010 December Journal.indd 105 12/01/2011 6:42:44 p.m.

Page 106– Refereed Edition Vol VI, Issue 2, December 2010,
© 2004-2010 [email protected] No Reprints Permitted
2.1 Entrepreneurial orientation and Marketing performance
Since Miller and Friesen (1982) first proposed the construct of entrepreneurial orientation (EO) over
twenty years ago, it has become a widely accepted means of explaining firm performance. EO refers to the
“processes, practices, and decision-making activities that lead to new entry” (Lumpkin and Dess, 1996, p.
136), and has five core dimensions: innovativeness , autonomy , risk-taking, proactiveness, competitive
aggressiveness, and uncertain,(Keh et al., 2002). The innovativeness dimension of entrepreneurial
orientation reflects the tendency to engage in and support novelty to create and introduce new products,
services, or technology (Lumpkin & Dess, 1996). Innovative companies may have a broader base of skills
and knowledge which they can exploit in building distinctive competences (Zahra & Garvis, 2000). Autonomy
is described as the ability and willingness to take self-directed actions in the pursuit of market opportunities.
Autonomous orientation allows firms to make quick and self-reliant decisions to provide new markets with
novel products or services ([Frese et al., 2002] and [Lumpkin and Dess, 1996]). Risk-taking orientation
indicates a willingness to engage resources in strategies or projects where the outcome may be highly
uncertain ([Wiklund and Shepherd, 2003] and [Zahra and Covin, 1995]). If new ventures have risk-taking
orientation, they may seize market opportunities to obtain higher returns and make lucrative deals. Hence,
risk-taking tendency may be positively related to success ([Frese et al., 2002] and [Lumpkin and Dess,
1996]). Proactiveness refers to a firm’s response to promising market opportunities (Lumpkin & Dess, 1996).
Competitive aggressiveness involves the propensity to directly and intensely challenge its competitors
(Lumpkin & Dess, 1996). In addition, firms with competitively aggressive orientation will have the capabilities
to revise the rules of competition, redefine industry boundaries, achieve entry advantage, and improve
marketplace position. These actions enable firms to acquire market share and outperform competitors
([Lumpkin and Dess, 2001] and [Zahra and Covin, 1995]). Proactiveness reflects entrepreneurial willingness
to dominate competitors through a combination of proactive and aggressive moves, e.g., introducing new
products or services ahead of competition and acting in anticipation of future demand to create change and
shape the environment. Finally, innovativeness refers to a firm’s tendency to engage in creative processes,
experimentation of new ideas, which may result in the institution of new methods of production and/or
bringing new products or services to current or new markets.
High EO is closely related to first-mover advantages and the tendency to take advantage of emerging
opportunities, which ultimately has a positive influence on performance (Wiklund, 1999). In this article, we
use both financial and non-financial measures of SME performance (Murphy and Callaway, 2004, Murphy et
al., 1996 and Gupta and Govindarajan, 1984). Lumpkin and Dess (1996) caution that when using a multi-
dimensional construct of firm performance (FP), EO may have positive effect on one dimension (e.g., new
product development), and a negative effect on another dimension (e.g., short-run profitability). However,
the predominant evidence indicates positive correlations between EO and FP (e.g., Covin and Slevin, 1991,
Smart and Conant, 1994 and Wiklund, 1999). In particular, Smart and Conant (1994) contend that higher EO,
together with a wide variety of distinctive marketing competencies, leads to higher performance.
Hypothesis 1 Marketing performance of the firm depends on entrepreneurial orientation.
2.2. Entrepreneurial orientation and knowledge creation process
New ventures must have dynamic strategic visions of their future and develop strategies to change and
renew themselves (Li, 2001). The development of new venture strategy involves extensive and intensive
2010 December Journal.indd 106 12/01/2011 6:42:44 p.m.

Vol VI, Issue 2, December 2010, Page 107 – Refereed Edition
© 2004-2010 [email protected] No Reprints Permitted
knowledge activities. Because knowledge is highly specific and personal, created knowledge is difficult
to transform into collective organizational memory and practical use (Grant, 1996 and Szulanski, 1996).
Knowledge creation processes such as socialization, externalization, combination, and internalization
describe a spiral of interactions between explicit and tacit knowledge (Nonaka, 1994 and Nonaka and
Konno, 1998). The SECI model of knowledge creation allows firms to exchange and transform knowledge
continuously and dynamically through a series of self-transcendental processes (Nonaka and Konno, 1998
and Nonaka et al., 2000a). When developing and implementing new venture strategy, the dynamic spiral of
knowledge creation plays a critical role in facilitating the conceptualization and actualization of strategy.
This study argues that five dimensions of new venture strategy should relate to knowledge creation
process. Product innovation strategy brings changes to original work with great risks and uncertainties.
Under product innovation strategy, firms should motivate employees to take risks to do challenging and
creative activities. Employees learn from experiences to avoid mistakes through observation, imitation,
and practice (Quinn, 1992 and Nonaka et al., 1996). Socialization activities such as direct interaction,
brainstorming, and informal meetings help individuals share knowledge and mental modes (Zhang et al.,
2004). To translate highly personal or professional knowledge into understandable forms, the firm engages
in externalization activities to specify new knowledge required in product development. Product innovation
has to transform the knowledge into embodied products and actions. The combination activities, which edit
and integrate knowledge by using documents or databases, can make knowledge more usable, thereby
crystallizing knowledge into new products or services. Through internalization activities, employees learn by
doing to accumulate valuable know-how; they are provided with training programs to enrich their experiences
(Nonaka et al., 1996). The process of internalization promotes the actualization of new product innovation
or improvement within the organization. Accordingly, the SECI spiral facilitates individuals and organizations
to transform knowledge assets into practical actions for successful product innovation. Thus, knowledge
creation processes are essential when developing and implementing product innovation strategy.
Marketing differentiation is a strategy based on unique marketing efforts, and market breadth involves the
variety of customers, geographic range, and the number of products (Li, 2001). Both strategies require the
conversion and application of new and existing knowledge among organizational members. Employees need
the socialization process to build more interactions to exchange tacit knowledge and solve problems in their
work. Such tacit knowledge is articulated into explicit forms through the externalization process. Dialogues,
metaphors, or analogies are effective methods to express one’s tacit knowledge to share with others. Sveiby
(1996) argues that newly created knowledge is used as a basis to discover even more applications. The
combination process allows firms to document and utilize the created knowledge in marketing activities to
produce more knowledge applications (Sharkie, 2003). Firms can convert explicit knowledge and enrich
the tacit knowledge base through the internalization process. Some approaches, such as learning-by-
doing, training, and exercise, are used to actualize the knowledge of marketing concepts or procedures into
practical operations. Accordingly, new ventures have to incorporate knowledge creation process into their
strategies of marketing differentiation and market breadth. Through marketing alliance, alliance partners
cooperate collectively to exchange market, manufacturing, and product knowledge that can provide a unique
platform for building up new knowledge, products, and services (Von Krogh et al., 2001). Partners act to fulfill
their goals through joint goal setting, action coordination, and outcome sharing. These interactions and social
2010 December Journal.indd 107 12/01/2011 6:42:45 p.m.

Page 108– Refereed Edition Vol VI, Issue 2, December 2010,
© 2004-2010 [email protected] No Reprints Permitted
exchanges between partners facilitate socialization activities to share knowledge and experience (Khanna et
al., 1998 and Inkpen and Dinur, 1998). To learn and transfer skills from alliance partners, the firm is involved
in externalization activities such as action, experimentation, and observation. The newly created knowledge
and existing knowledge are then combined, edited, or processed to form more complex and explicit
knowledge through the combination process (Nonaka and Konno, 1998). The use of documents, meetings,
and computerized communication networks with different partners facilitates this process of knowledge
conversion. Internalization activities accumulate and systemize the experiences and concepts of partners to
the organizational tacit knowledge. Thus, when new ventures develop the marketing alliance strategy, they
can transfer new knowledge from partners to reduce risks through the SECI spiral of knowledge creation.
According to the above, the SECI model, which transforms and exchanges explicit and tacit knowledge
in individual and organizational levels, facilitates the actualization of new venture strategy. When new
ventures make strategic decisions and implement different strategies, they need to take knowledge creation
process into consideration. This study can expect a positive relationship between new venture strategy and
knowledge creation processes. Hence, this study hypothesizes:
Hypothesis 2 Knowledge creation process within the firm depends on entrepreneurial orientation
2.3. Knowledge creation process and Marketing performance
Knowledge is widely recognized as a strategic source (Grant, 1996 and Teece, 1998). The capability
to create and utilize knowledge allows a firm to develop a sustainable competitive advantage because of
the ambiguity, uniqueness, and difficulty to imitate (Grant, 1996, Matusik and Hill, 1998 and Zack, 1999).
Previous studies have suggested the critical role of knowledge creation in the success of organizations
(Kogut and Zander, 2003, Nonaka and Takeuchi, 1995, Gold et al., 2001 and Chia, 2003). Organizations
with better knowledge creation process can connect knowledge in new and distinctive ways and provide
value to customers (Nonaka and Konno, 1998 and Lee and Choi, 2003).From the perspective of knowledge
creation theory, knowledge is created through dynamic interaction between tacit and explicit knowledge in
SECI process (Nonaka, 1994). Socialization process seeks to collectivize knowledge embedded in individual
members. Frequently social interaction and perception help organizational members to share mental modes
and experiences (Nonaka et al., 2000b). Employees empathize with colleagues to exchange a variety of
knowledge for their work and problem-solving (Becerra-Fernandez & Sabherwal, 2001), and thus diminish
communication barriers between individuals (Nonaka et al., 2000a). In socialization, companies can
converge and amplify tacit knowledge to increase collective learning, and improve the stock of knowledge
([Nonaka and Takeuchi, 1995] and [Nonaka et al., 2000a]). When tacit knowledge is converted to explicit
knowledge, it is easier understood by employees. Externalization facilitates employees to express images or
ideas as substantial concepts and notions that are needed for new product innovation and development. The
newly explicit knowledge is then integrated and disseminated at the group as well as the organizational level
([Nonaka and Takeuchi, 1995] and [Nonaka et al., 2000b]). Firms can use combination process to create new
knowledge from existing knowledge and generate new knowledge application (Nonaka et al., 2000a). New
knowledge and skill will enhance the firm’s ability to innovate new products and services, or improve existing
ones more efficiently, thereby reducing redundancies and costs ([Grant, 1996, Winter], [Gold et al., 2001] and
[Lee and Choi, 2003]). Through internalization, knowledge is transformed into organizational memory and is
actualized in practical operations such as new product development or manufacturing procedure (Nonaka et
2010 December Journal.indd 108 12/01/2011 6:42:45 p.m.

Vol VI, Issue 2, December 2010, Page 109 – Refereed Edition
© 2004-2010 [email protected] No Reprints Permitted
al., 2000b). The firm utilizes its human capital to transfer tacit knowledge, which becomes the base for further
innovation and new routine ([Kogut and Zander, 2003], [Lee and Choi, 2003] and [Nonaka et al., 2000a]).
Thus, the SECI model of knowledge creation transforms knowledge into business value and results in
product innovation or process improvement ([Lee and Choi, 2003] and [Nonaka et al., 2000b]). It is important
to note that knowledge created through the SECI model triggers a new spiral of knowledge creation. The
communities of social interaction can transcend organizational boundaries to transfer and utilize knowledge
embedded in suppliers, customers, distributor, and competitors ([Nonaka, 1994] and [Nonaka et al., 2000b]).
Such knowledge conversion enables firms to integrate emerging knowledge into its strategic development
(Nonaka, 1994), and they can create new knowledge and develop new product at a lower cost and more
speedily than competitors do (Droge et al., 2003). Thus, knowledge creation provides an opportunity for
firms to enhance efficiency and sustain competitive advantages ([Chia, 2003] and [Nonaka et al., 2000a]).
Knowledge created through the SECI model triggers a new spiral of knowledge creation. Firms transcend
organizational boundaries to transfer and utilize knowledge embedded in customers or suppliers (Nonaka et
al., 2000b). Such knowledge conversion allows firms to create new knowledge and develop new products at
a lower cost and more speedily than competitors do (Droge et al., 2003). Thus, knowledge creation provides
an opportunity for firms to enhance efficiency and sustain competitive advantages (Chia, 2003 and Nonaka
et al., 2000a). According to the above, when firms are better at knowledge creation through SECI process,
they are more inclined to achieve efficiency, growth, and profit. It is believed that knowledge creation process
is critical because of its positive relationship with performance. Thus, we propose the following hypothesis.
Hypothesis 3 Knowledge creation process is positively related to Marketing performance.
3. Sample and data collection3.1. Sample Collection:
The sampling frame was taken from the CD-ROM database, which, includes all incorporated
UAEcompanies in Sharjah Emirate. We randomly sampled independent firms from four sectors—knowledge-
intensive manufacturing, labor-intensive manufacturing, professional services, and retail. A total 80 small
business managers from the sampling frame were contacted of which 40 first responded to a telephone
interview and then to a mail questionnaire. Hence the sample size for the present study has to be treated as
40. The final sample, therefore, consists of Small business managers (overall response rate of 50 percent.
3.2. Measures
3.2.1. Entrepreneurial orientation
Drawing upon previous studies (e.g. [Lumpkin and Dess, 1996], [Lumpkin and Dess, 2001] and [Miller,
1983]), entrepreneurial orientation was measured with five dimensions: innovativeness, risk-taking,
proactiveness, competitive aggressiveness, and autonomy. Innovativeness refers to a willingness to
support creativity and experimentation in introducing new products/services, and novelty, technological
leadership and R&D in developing new processes. Risk-taking means a tendency to take bold actions such
as venturing into unknown new markets, committing a large portion of resources to ventures with uncertain
outcomes, and/or borrowing heavily. Proactiveness refers to how firms relate to market opportunities by
seizing initiative in the marketplace. Competitive aggressiveness refers to how firms react to competitive
trends and demands that already exist in the marketplace. Autonomy is defined as independent action by an
individual or team aimed at bringing forth a business concept or vision and carrying it through to completion.
2010 December Journal.indd 109 12/01/2011 6:42:45 p.m.

Page 110– Refereed Edition Vol VI, Issue 2, December 2010,
© 2004-2010 [email protected] No Reprints Permitted
3.2.2. Knowledge creation process
This study used a five-point scale to measure knowledge creation process variable with four dimensions:
socialization, externalization, combination, and internalization (Sabherwal and Becerra-Fernandez, 2003).
Four items measured socialization: cooperative projects across directorates, the use of apprentices and
mentors to transfer knowledge, brainstorming retreats or camps, and employee rotation across areas. Five
items measured externalization: a problem-solving system based on a technology like case-based reasoning,
groupware and other collaboration learning tools, pointers to expertise, modeling based on analogies and
metaphors, and capture and transfer of experts’ knowledge. Four items measured combination: web-based
access to data, web pages, databases, and repositories of information, best practices, and lessons learned.
Three items measured internalization: on-the-job training, learning by doing, and learning by observation.
3.2.3.Marketing performance
This study was based on the work of Murphy et al. (1996) to measured firm performance variable with
three dimensions: efficiency, growth, and profit. The respondents rated the firm performance on a five-point
scale in relation to competitors. Three items measured efficiency: return on investment, return on equity,
and return on assets in the past three years. Similarly, three items measured growth: sale growth, employee
growth, and market share growth. Three items measured profit: return on sales, net profit margin, and gross
profit margin (Murphy et al., 1996).
3.3. Reliability and validity
Reliability of the multi-item scale for each dimension was measured using Cronbach alphas and
composite reliabilities measures. Both measures of reliability were above the recommended minimum
standard of …… ([Bagozzi and Yi, 1988], [Baker et al., 2002] and [Nunnally, 1978]). For all twelve
dimensions, both measures of reliability are above ……. Table 2 summarizes all measurement items,
Cronbach alphas, composite reliability, and their scales for all the items.
Table 1: Measurement items and reliabilitiesConstruct Dimension Item Cronbach
alphaComposite reliability
Entrepreneurial orientation
Innovativeness The top managers favor a strong emphasis on R&D, technological leadership, and innovations
0.76 0.77
My firm has very many new lines of products/services marketed in the past 5 yearsChanges in product or service lines have usually been quite dramatic
Risk-taking My firm usually has a strong proclivity for high risk projects (with chances of very high returns)
0.85 0.85
Owing to the nature of the environment, bold, wide-ranging acts are necessary to achieve the firm’s objectives
2010 December Journal.indd 110 12/01/2011 6:42:45 p.m.

Vol VI, Issue 2, December 2010, Page 111 – Refereed Edition
© 2004-2010 [email protected] No Reprints Permitted
Table 1: Measurement items and reliabilitiesConstruct Dimension Item Cronbach
alphaComposite reliability
Proactiveness In dealing with competitors, my firm usually initiates actions which competitors then respond to
0.78 0.79
In dealing with competitors, my firm is very often the first business to introduce new products/services, administrative techniques, operating technologies, etcIn general, the top managers of my firm have a strong tendency to be ahead of others in introducing novel ideas or products
Competitive aggressiveness
My firm usually adopts a very competitive “undo-the-competitors” posture
0.77 0.77
My firm is very aggressive and intensely competitive
Autonomy My firm has the independent action of an individual or a team in bringing forth an idea or a vision and carrying it through to completion
0.83 0.83
My firm has the ability and will to be self-directed in the pursuit of opportunitiesMy firm takes action free of stifling organizational constraints
Knowledge creation process
Socialization My firm usually adopts cooperative projects across directorates
0.89 0.90
My firm usually uses apprentices and mentors to transfer knowledgeMy firm usually adopts brainstorming retreats or campsMy firm usually adopts employee rotation across areas
Externalization My firm usually adopts a problem-solving system based on a technology like case-based reasoning
0.88 0.89
My firm usually adopts groupware and other learn collaboration tools
2010 December Journal.indd 111 12/01/2011 6:42:45 p.m.
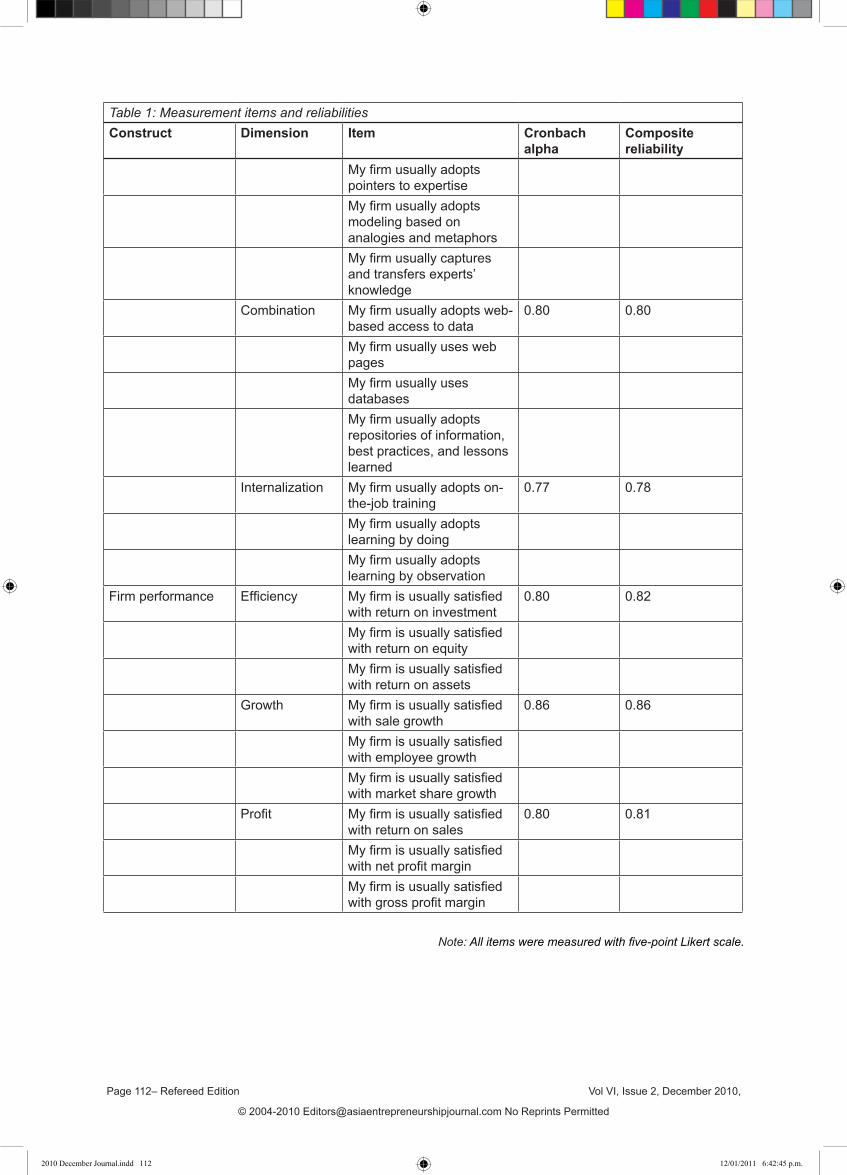
Page 112– Refereed Edition Vol VI, Issue 2, December 2010,
© 2004-2010 [email protected] No Reprints Permitted
Table 1: Measurement items and reliabilitiesConstruct Dimension Item Cronbach
alphaComposite reliability
My firm usually adopts pointers to expertiseMy firm usually adopts modeling based on analogies and metaphorsMy firm usually captures and transfers experts’ knowledge
Combination My firm usually adopts web-based access to data
0.80 0.80
My firm usually uses web pagesMy firm usually uses databasesMy firm usually adopts repositories of information, best practices, and lessons learned
Internalization My firm usually adopts on-the-job training
0.77 0.78
My firm usually adopts learning by doingMy firm usually adopts learning by observation
Firm performance Efficiency My firm is usually satisfied with return on investment
0.80 0.82
My firm is usually satisfied with return on equityMy firm is usually satisfied with return on assets
Growth My firm is usually satisfied with sale growth
0.86 0.86
My firm is usually satisfied with employee growthMy firm is usually satisfied with market share growth
Profit My firm is usually satisfied with return on sales
0.80 0.81
My firm is usually satisfied with net profit marginMy firm is usually satisfied with gross profit margin
Note: All items were measured with five-point Likert scale.
2010 December Journal.indd 112 12/01/2011 6:42:45 p.m.

Vol VI, Issue 2, December 2010, Page 113 – Refereed Edition
© 2004-2010 [email protected] No Reprints Permitted
4. Analysis and results
Table2:Results of the Hypotheses taken for the studyHypothesis Variables Test employed Result
H1 Marketing performance of the firm depends on entrepreneurial orientation.
Regression Supported
H2 Knowledge creation process within the firm depends on entrepreneurial orientation
Regression Supported
H3 Knowledge creation process is positively related to Marketing performance.
Correlation Supported
*p < 0.05, **p < 0.01. a n = 40
Table 3: Results of regression for the test of hypothesis –1
Model
1
Un standardized Coefficients Std.
Error
Standardized Coefficients t Adjusted R
Square F
B Beta
(Constant) 22.734 11.591 1.961
0.756 25.15*
Innovativeness 4.409 .894 0.700 4.933*Pro-activeness 2.803 1.696 0.279 1.652Risk Taking 1.477 .656 0.204 2.251*Competitive Aggressiveness 0.187 1.124 0.033 0.166
Autonomy 0.391 0.882 0.086 0.443*Significant at 5 percent level.Dependent Variable: Marketing performance
From table-3, it can be inferred that the F value of 25.15 is found to be significant at 5 percent level.
This confirms that the Marketing performance of the firm depends on entrepreneurial orientation. Out of the
above all influencing factors the t value of 4.933 for entrepreneurial Innovation strategy and the t value of
2.251 for entrepreneurial risk taking mentality were found to be significant at 5 percent level. Also from the
adjusted R square value of 0.756, it can be confirmed that 76 percent of the firm’s performance are defined
by seven major factors of entrepreneurial orientation such as Innovativeness, Pro-activeness Risk Taking,
Competitive Aggressiveness and Autonomy. Based on these results the hypothesis-I which is an alternate
hypothesis is accepted and hence, it’s established that the Marketing Performance of the firm depends on
Entrepreneurial orientation.
Table 4: Results of regression for the test of hypothesis –2
Model
1
Un standardized Coefficients Std.
Error
Standardized Coefficients t Adjusted
R Square F
B Beta
Constant 25.000 9.206 2.716*
0.4367.023*
Innovativeness 0.461 0.710 0.140 0.649Pro-activeness 0.816 1.347 0.155 0.606Risk Taking 1.120 .521 0.296 2.150*Competitive Aggressiveness 1.568 .893 0.523 1.756*
Autonomy 0.706 .700 0.297 1.008*Significant at 5 percent level.Dependent Variable: Knowledge Creation
2010 December Journal.indd 113 12/01/2011 6:42:45 p.m.

Page 114– Refereed Edition Vol VI, Issue 2, December 2010,
© 2004-2010 [email protected] No Reprints Permitted
From table-4, it can be inferred that the F value of 7.023 is found to be significant at 5 percent level. This
confirms that the Internal Knowledge creation Process of the firm depends on entrepreneurial orientation
of the firm. Out of the above all influencing factors the t value of 2.15 and t value of 1.756 corresponding
to the factors risk taking and competitive aggressiveness were found to be significant at 5 percent level.
Also from the adjusted R square value of 0.435, it can be confirmed that 44 percent of the firms knowledge
creation process are defined by six major factors such as Innovativeness, Pro-activeness Risk Taking,
Competitive Aggressiveness and Autonomy. Based on these results the hypothesis-2 which is an alternate
hypothesis is accepted and hence, it’s established that firm’s internal knowledge creation process depends
on Entrepreneurial orientation.
Marketing Performance Classification related to Knowledge Creation Process Classification
Table 5: Results of cross tabulation for the test of hypothesis 3
Knowledge Creation Process
Classification Total
Good Very Good Marketing Performance Classification
Good 8 6 14
Very Good 5 21 26
Total 13 27 40
Table 6: Symmetric Measures for the test of hypothesis 3
ValueAsymptotic Std.
Error(a) Approximate T(b)Pearson’s R 0.681* 0.101 6.406Spearman Correlation 0.681* 0.101 6.406N of Valid Cases 40
*Significant at 5 percent level
From table-6, it can be inferred that the spearmen correlation value of 0.681 is found to be significant at
5 percent level. Further it can be noted from the cross tabulation on table 5 that 55 percent of the 55 percent
of the enterprises have very good performance levels with very good knowledge creation possibilities within
the firms. Based on these results the hypothesis-3 is accepted and hence it’s established that there exists a
positive relationship between the firm’s marketing performance and its intensity levels of internal knowledge
creation processes
Discussion and conclusions
This study develops a conceptual model to examine the mediating role of knowledge creation process
in the relationship between entrepreneurial orientation and firm’s marketing performance. The results
show that entrepreneurial orientation can positively enhance firm’s marketing performance; however, if we
add knowledge creation process as a mediator, the directly positive relationship between entrepreneurial
orientation and firm’s marketing performance will attenuate. It specifically implies that entrepreneurial
orientation indirectly influences firm performance by influencing knowledge creation process. Thus,
2010 December Journal.indd 114 12/01/2011 6:42:45 p.m.

Vol VI, Issue 2, December 2010, Page 115 – Refereed Edition
© 2004-2010 [email protected] No Reprints Permitted
knowledge creation process plays a mediating role through which entrepreneurial orientation benefits firm
performance.
Our findings contribute to theoretical development in several ways. First, while the importance of
entrepreneurial orientation in firm performance has been recognized, the link between entrepreneurial
orientation and firm’s marketing performance has remained inconsistent (Lumpkin & Dess, 1996). This
study reveals that entrepreneurial orientation is critical to business ventures and has positive impact on firm
performance, which gives additional grounding for statements about the positive effect of entrepreneurial
orientation on firm performance (e.g. [Barringer and Bluedorn, 1999], [Lumpkin and Dess, 2001], [Wiklund
and Shepherd, 2003] and [Zahra and Covin, 1995]). The inclusion of knowledge creation process as a
mediating variable may help to enhance our understanding of how entrepreneurial orientation affects firm
performance. Our findings support recent arguments for a contingency perspective on the entrepreneurial
orientation — firm performance link (Lumpkin & Dess, 2001) and make a contribution to the entrepreneurship
literature by clarifying the role that knowledge creation process plays. Second, the emergent model provides
empirical support of Nonaka’s (1994) theory of knowledge creation. The findings demonstrate the mediating
effect of knowledge creation process when new ventures want to execute entrepreneurial orientation to
achieve firms marketing performance. We place primary emphasis on the dynamic processes rather than the
outcomes of knowledge creation ([Nonaka, 1994], [Nonaka and Konno, 1998] and [Nonaka et al., 2000a]).
Tacit and explicit knowledge is connected and converted by the interactive spiral process of socialization,
externalization, combination, and internalization. The dynamic SECI model enables the firm to create new
knowledge or combine existing knowledge to form new insights and become valuable knowledge assets
for the use of firms. New ventures can amplify the mobilization of knowledge and trigger new spirals of
knowledge creation continuously to transform entrepreneurial orientation into better business value and
performance. Furthermore, the consideration of knowledge creation process makes a related support of
the resource- advantage theory. According to the resource- advantage theory, knowledge embedded
internally is a valuable resource because it is unique to create and difficult to imitate ([Barney, 1991], [Grant,
1996, Winter], [Hunt and Morgan, 1996] and [Zack, 1999]). The findings reveal that SECI spiral enhances the
capabilities of new ventures to transform tacit knowledge into the organizational memory and thereby leads
to improved efficiency, growth, and profit. This result joins other studies to highlight the strategic value of
knowledge creation for firms to sustain competitive advantages ([Chia, 2003], [Grant, 1996, Winter], [Lee
and Choi, 2003], [Matusik and Hill, 1998] and [Nonaka and Takeuchi, 1995]). Finally, this study contributes to
integrate the domains of entrepreneurial orientation and knowledge management research. Entrepreneurship
literature (e.g. [Lee et al., 2001], [Lumpkin and Dess, 1996] and [Shane and Venkataraman, 2000]) suggests
that entrepreneurial orientation of new ventures is critical for their success because entrepreneurial
orientation represents an important means to discover and exploit profitable business opportunities.
Knowledge management literature (e.g. [Grant, 1996, Winter], [Nonaka et al., 2000a], [Nonaka et al.,
2000b] and [Zack, 1999]) emphasizes the value of leveraging knowledge and creating new combinations.
We show here that the conversion process of knowledge creation appears to be a key mechanism through
which entrepreneurial orientation is developed and implemented to accomplish favorable firms marketing
performance.
From a practical point of view, our study suggests that managers should be aware of the importance
2010 December Journal.indd 115 12/01/2011 6:42:45 p.m.

Page 116– Refereed Edition Vol VI, Issue 2, December 2010,
© 2004-2010 [email protected] No Reprints Permitted
of knowledge creation process in the link of entrepreneurial orientation and firm’s marketing performance.
Managers have to facilitate dynamics and spiral of knowledge creation by taking a leading role in managing
the SECI process. Firms can amplify and enlarge knowledge through the dynamic conversion between tacit
and explicit knowledge. Managers need to nurture an enabling environment that allows employees to share
and exchange tacit knowledge to create new knowledge. Each mode of knowledge conversion requires
different approaches for knowledge to be created and shared effectively ([Nonaka and Konno, 1998] and
[Nonaka et al., 2000b]). Thus, managers should carefully choose and design appropriate methods according
to the SECI process to facilitate knowledge creation. Furthermore, firms need to enhance employees’
involvement and participation in SECI activities. Managers should provide incentive and support to reinforce
the desired behaviors of knowledge creation. Employees will be motivated to exchange, learn, and create
knowledge and further transform knowledge to fulfill strategic objectives and execution.
This study has some inherent limitations. First, our cross-sectional design prevents us from studying
causal relationships among our variables. A longitudinal investigation would provide further insights into
the dynamic nature of knowledge creation and different organizational levels. Future researches might
use longitudinal design to draw causal inferences of our model. Second, this study goes further than other
studies in examining a potential mediator in the relationship between entrepreneurial orientation and firms
marketing performance. However, we do not consider the roles played by organizational routines, cultures,
and other possible knowledge management processes such as knowledge accumulation and knowledge
integration. In addition, we also know that often the firm’s orientation looks like its manager. If the manager
is changed or changes, entrepreneurial orientation and firm’s marketing performance may be influenced.
Future studies might gain additional insights by exploring other potential mediators such as organizational
factors, other knowledge management processes, or the change of manager. Third, the firm age of this study
is restricted within ten years and the majority of our response samples are small and medium enterprises.
Larger firms tend to have sufficient resources or money to invest in knowledge management process. Future
research could overcome this limitation by expanding the scope of studies to include larger and elder firms.
Fourth, the study is based on self-report data incurring the possibility of common method bias..
In summary, entrepreneurial orientation is critical for enhancing firm marketing performance. Our study
highlights the crucial importance of the mediating role of knowledge creation process when examining the
relationship between entrepreneurial orientation and firm performance. The viewpoints proposed in this study
have important implication for new ventures in today’s dynamic and competitive environment.
2010 December Journal.indd 116 12/01/2011 6:42:45 p.m.

Vol VI, Issue 2, December 2010, Page 117 – Refereed Edition
© 2004-2010 [email protected] No Reprints Permitted
References:
Atuahene-Gima K, Ko A. An empirical investigation of the effect of market
orientation and entrepreneurship orientation alignment on product innovation. Organ Sci 2001;12(1):54– 74.
Barringer and Bluedorn, 1999 B.R. Barringer and A.C. Bluedorn, The relationship between corporate entrepreneurship and strategic | View Record in Scopus | Cited management, Strategic Management Journal 20 (5) (1999), pp. 421–444.
Becerra-Fernandez and Sabherwal, 2001 I. Becerra-Fernandez and R. Sabherwal, Organizational knowledge management: A contingency perspective, Journal of Management Information Systems 18 (1) (2001), pp. 23–55.
Brush, 1992 C.G. Brush, Marketplace information scanning activities of new manufacturing ventures, Journal of Small Business Management 30 (1992), pp. 41–53.
Butler et al., 2000 J.E. Butler, H.T. Keh and W. Chamornmarn, Information acquisition, entrepreneurial performance and the evolution of modern Thai retailing, Journal of Asian Business 16 (2000), pp. 1–23.
Covin and Slevin, 1989 J.G. Covin and D.P. Slevin, Strategic management of small firms in hostile and benign environments, Strategic Management Journal 10 (1989), pp. 75–87.
Chia, 2003 R. Chia, From knowledge-creation to the perfecting of action: Tao, Basho and pure experience as the ultimate ground of knowing, Hum Relat 56 (2003) (8), pp. 953–981.
Deshpande´ R. The organizational context of market research use. J Mark
1982;46(4):91 – 101.
Droge et al., 2003 C. Droge, C. Claycomb and R. Germain, Does knowledge mediate the effect of context on performance? Some initial evidence, Decis Sci 34 (2003) (3), pp. 541–568.
Deshpandé and Zaltman, 1982 R. Deshpandé and G. Zaltman, Factors affecting the use of market research information: a path analysis, Journal of Marketing Research 19 (1982), pp. 14–31.
Eisenhardt and Schoonhoven, 1990 K.M. Eisenhardt and C.B. Schoonhoven, Organizational growth: linking founding team, strategy, environment, and growth among US semiconductor ventures, Adm Sci Q 35 (1990) (3), pp. 504–52
Frese et al., 2002 M. Frese, A. Brantjes and R. Hoorn, Psychological success factors of small scale businesses in Namibia: The roles of strategy process, entrepreneurial orientation and the environment, Journal of Developmental Entrepreneurship 7 (3) (2002), pp. 259–283.
Gupta and Govindarajan, 1984 A.K. Gupta and V. Govindarajan, Business unit strategy, managerial characteristics, and business unit effectiveness at strategy implementation, Academy of Management Journal 27 (1984), pp. 25–41.
Gold et al., 2001 A.H. Gold, A. Malhotra and A.H. Segars, Knowledge management: an organizational capabilities perspective, J Manage Inf Syst 18 (2001) (1), pp. 185–214.
Grant, 1996 R. Grant, Toward a knowledge-based theory of the firm, Strateg Manage J 17 (1996), pp. 109–122
Gold et al., 2001 A.H. Gold, A. Malhotra and A.H. Segars, Knowledge management: An organizational capabilities perspective, Journal of Management Information Systems 18 (1) (2001), pp. 185–214.
Grant, 1996, Winter R. Grant, Toward a knowledge based theory of the firm, Strategic Management Journal 17 (1996, Winter), pp. 109–122.
Hult GT, Ketchen Jr DJ. Does market orientation matter?: a test of the relationship between positional advantage and performance. Strateg Manage J 2001;22(9):899 –906.
Ireland et al., 2003 R.D. Ireland, M.A. Hitt and D.G. Sirmon, A model of strategic entrepreneurship: The construct and its dimensions, Journal of
Inkpen and Dinur, 1998 A.C. Inkpen and A. Dinur, Knowledge management processes and international joint ventures, Organ Sci 9 (1998) (2), pp. 454–468. View Record in Scopus | Cited By in Scopus (159)
2010 December Journal.indd 117 12/01/2011 6:42:45 p.m.

Page 118– Refereed Edition Vol VI, Issue 2, December 2010,
© 2004-2010 [email protected] No Reprints Permitted
Johnson and Kuehn, 1987 L. Johnson and R. Kuehn, The small business owner/manager’s search for external information, Journal of Small Business Management 25 (1987), pp. 53–60.
Jain, 2001 B.A. Jain, Predictors of performance of venture capitalist-backed organizations, J Bus Res 52 (2001) (3), pp. 223–233
Khanna et al., 1998 T. Khanna, R. Gulati and N. Nohria, The dynamics of learning alliances: competition, cooperation, and relative scope, Strateg Manage J 19 (1998) (3), pp. 193–210. |
Kogut and Zander, 2003 B. Kogut and U. Zander, Knowledge of the firm and the evolutionary theory of the multinational corporation, J Int Bus Stud 34 (2003) (6), pp. 516–529. Keh et al., 2002 H.T. Keh, M.D. Foo and B.C. Lim, Opportunity evaluation under risky conditions: the cognitive processes of entrepreneurs, Entrepreneurship Theory and Practice 27 (2002), pp. 125–148.
Lumpkin and Dess, 1996 G.T. Lumpkin and G.G. Dess, Clarifying the entrepreneurial orientation construct and linking it to performance, Academy of Management Review 21 (1996), pp. 135–172.
Li, 2001 H. Li, How does new venture strategy matter in the environment-performance relationship?, J High Technol Managem Res 12 (2001) (2), pp. 183–204.
Lussier, 1995 R.N. Lussier, A nonfinancial business success versus failure prediction model for young firms, J Small Bus Manage 33 (1995) (1), pp. 8–20.
Lee and Choi, 2003 H. Lee and B. Choi, Knowledge management enablers, processes, and organizational performance: An integrative view and empirical examination, Journal of Management Information Systems 20 (1) (2003), pp. 179–228.
Lumpkin and Dess, 2001 G.T. Lumpkin and G.G. Dess, Linking two dimensions of entrepreneurial orientation to firm performance: The moderating role of environment and industry life cycle, Journal of Business Venturing 16 (5) (2001), pp. 429–451.
Matusik and Hill, 1998 S.F. Matusik and C.W.L. Hill, The utilization of contingent work, knowledge creation, and competitive advantage, Acad Manage Rev 23 (1998) (4), pp. 680–697
Menon and Varadarajan, 1992 A. Menon and P.R. Varadarajan, A model of marketing knowledge use within firms, Journal of Marketing 56 (1992), pp. 53–71.
Miller, D. and Friesen, P.H., 1982. Innovation in conservative and entrepreneurial firms: two models of strategic momentum. Strategic Manage. J. 3, pp. 1–25.
Murphy and Callaway, 2004 G.B. Murphy and S.K. Callaway, Doing well and happy about it? Explaining variance in entrepreneurs’ stated satisfaction with performance, New England Journal of Entrepreneurship 7 (2004), pp. 15–26.
Murphy et al., 1996 G.B. Murphy, J.W. Trailer and R.C. Hill, Measuring performance in entrepreneurship research, Journal of Business Research 36 (1996), pp. 15–23.
Nonaka and Konno, 1998 I. Nonaka and N. Konno, The concept of “ba”: building a foundation for knowledge creation, Calif Manage Rev 40 (1998) (3), pp. 40–54.
Nonaka and Takeuchi, 1995 I. Nonaka and H. Takeuchi, The knowledge-creating company: how Japanese companies create the dynamic of innovation, Oxford University Press, New York (1995).
Nonaka et al., 1996 I. Nonaka, H. Takeuchi and K. Umemoto, A theory of organizational knowledge creation, Int J Technol Manag 11 (1996) (7), pp. 833–845.
Nonaka et al., 2000a I. Nonaka, R. Toyama and A. Nagata, A firm as a knowledge-creating entity: a new perspective on the theory of the firm, Ind Corp Change 9 (2000) (1), pp. 1–20. |
Nonaka et al., 2000b I. Nonaka, R. Toyama and N. Konno, SECI, Ba and leadership: a unified model of dynamic knowledge creation, Long Range Plan 33 (2000) (1), pp. 5–34
Nunnally, 1978 J.C. Nunnally, Psychometric theory, McGraw-Hill, New York (1978).
Nonaka, 1994 I. Nonaka, A dynamic theory of organizational knowledge creation, Organization Science 5 (1) (1994), pp. 14–37.
Nonaka and Toyama, 2005 I. Nonaka and R. Toyama, The theory of the knowledge creation firm: Subjectivity, objectivity, and synthesis, Industrial and Corporate Change 14 (3) (2005), pp. 419–436.
Perkins and Rao, 1990 W.S. Perkins and R.C. Rao, The role of experience in information use and decision making by marketing managers, Journal of Marketing Research 27 (1990), pp. 1–10.
2010 December Journal.indd 118 12/01/2011 6:42:45 p.m.

Vol VI, Issue 2, December 2010, Page 119 – Refereed Edition
© 2004-2010 [email protected] No Reprints Permitted
Schafer, 1990 D.S. Schafer, Level of entrepreneurship and scanning source usage in very small businesses, Entrepreneurship Theory and Practice 15 (1990), pp. 19–31.
Smart and Conant, 1994 D.T. Smart and J.S. Conant, Entrepreneurial orientation, distinctive marketing competencies and organization performance, Journal of Applied Business Research 10 (1994), pp. 28–38.
Smeltzer et al., 1988 L.R. Smeltzer, G.L. Fann and V.N. Nikolaisen, Environmental scanning practices in small business, Journal of Small Business Management 26 (1988), pp. 55–62.
Sharkie, 2003 R. Sharkie, Knowledge creation and its place in the development of sustainable competitive advantage, J Knowl Manag 7 (2003) (1), pp. 20–31.
Sveiby, 1996 K. Sveiby, The new organizational wealth: managing and measuring knowledge-based assets, Berret Koehler, San Francisco, CA (1996).
Szulanski, 1996 G. Szulanski, Exploring internal stickness: Impediments to the transfer of best practice within the firm, Strateg Manage J 17 (1996), pp. 27–43
Slater SF, Narver JC. Market orientation and the learning organization. J Mark 1995;59(3):63 – 74.
Teece, 1998 D.J. Teece, Capturing value from knowledge assets: the new economy, markets for know-how, and intangible assets, Calif Manage Rev 40 (1998) (3), pp. 55–79.
Wiklund and Shepherd, 2003 J. Wiklund and D. Shepherd, Knowledge-based resources, entrepreneurial orientation, and the performance of small and medium-sized businesses, Strategic Management Journal 24 (13) (2003), pp. 1307–1314.
Wiklund and Shepherd, 2005 J. Wiklund and D. Shepherd, Entrepreneurial orientation and small business performance: A configurational approach, Journal of Business Venturing 20 (1) (2005), pp. 71–91.
Wiklund, 1999 J. Wiklund, The sustainability of the entrepreneurial orientation–performance relationship, Entrepreneurship Theory and Practice 24 (1999), pp. 37–48.
Zahra and Covin, 1995 S.A. Zahra and J.G. Covin, Contextual influences on the corporate entrepreneurship–performance relationship: A longitudinal analysis, Journal of Business Venturing 10 (1) (1995), pp. 43–58.
Zahra and Garvis, 2000 S.A. Zahra and D.M. Garvis, Entrepreneurship and firm performance: The moderating effect of international environmental hostility, Journal of Business Venturing 15 (5) (2000), pp. 469–492.
Zhang et al., 2004 Q. Zhang, J. Lim and M. Cao, Innovation-driven learning in new product development: A conceptual model, Industrial Management and Data Systems 104 (3) (2004), pp. 252–261.
Zack, 1999 M. Zack, Developing a knowledge strategy, Calif Manage Rev 41 (1999) (3), pp. 125–146.
Zhang et al., 2003 C. Zhang, S.T. Cavusgil and A.S. Roath, Manufacturer governance of foreign distributor relationships: do relational norms enhance competitiveness in the export market?, Journal of International Business Studies 34 (2003), pp. 550–566.
2010 December Journal.indd 119 12/01/2011 6:42:45 p.m.

Page 120– Refereed Edition Vol VI, Issue 2, December 2010,
© 2004-2010 [email protected] No Reprints Permitted
2010 December Journal.indd 120 12/01/2011 6:42:46 p.m.