table of contents - baozun inc
TRANSCRIPT

Investor Presentation
May 2021
Disclaimer
1
This presentation does not constitute an offer to sell or issue or solicitation of an offer to buy or acquire securities of Baozun Inc. (the “Company”) in any jurisdiction or aninducement to enter into investment activity, nor may it or any part of it form the basis of or be relied on in connection with any contract or commitment whatsoever. Thispresentation does not contain all relevant information relating to the Company or its securities, particularly with respect to the risks and special considerations involved with aninvestment in the securities of the Company. This presentation does not constitute legal, regulatory, accounting or tax advice to you. We recommend that you seekindependent third party legal, regulatory, accounting and tax advice regarding the contents of this presentation. This presentation does not constitute and should not beconsidered as any form of financial opinion or recommendation by the Company or any other party.
This presentation contains forward-looking statements, including statements about the intent, belief or current expectations of the Company or its officers, the Company’sbusiness and financial outlook, strategy and market opportunity, and statements about the Company’s historical results that may suggest trends for its business. Thesestatements are forward-looking statements within the meaning of Section 27A of the Securities Act of 1933, as amended, and Section 21E of the Securities Exchange Act of1934, as amended. These statements can be recognized by the use of words such as “expects,” “plans,” “will,” “estimates,” “projects,” “intends,” “anticipates,” “believes,”“confident” or words of similar meaning. These forward-looking statements are made only, and are based on estimates and information available to the Company, as of thedate of this presentation, and are not guarantees of future performance. These forward-looking statements are based on a number of assumptions which are subject to knownand unknown risks, uncertainties and other factors that are beyond the Company’s control, such as the political, social, legal and economic environment in which the Companywill operate in the future. Accordingly, actual results, performance or achievements may differ materially from those expressed or implied by these forward-looking statementsand future results could materially differ from historical performance. Nothing contained in this presentation shall be relied upon as a promise or representation as to the pastor future performance of the Company. The Company, its officers, advisors, or representatives undertake no obligation to update or revise these forward-looking statements forevents or circumstances that occur subsequent to the date of this presentation, except as required under law. By viewing the information contained in this presentation, therecipient hereby acknowledges and agrees that neither the Company nor any of the representatives of the Company accepts any responsibility for or makes any representationor warranty, express or implied, with respect to the truth, accuracy, fairness, completeness or reasonableness of the information contained in, and omissions from, thesematerials and that neither the Company nor any of its affiliates, advisers or representatives accepts any liability whatsoever for any loss howsoever arising from any informationpresented or contained in these materials. You should conduct your own due diligence of the Company in order to judge the comprehensiveness, fairness, accuracy,completeness or correctness of the information or opinions contained herein.
The Company uses certain financial measures that are not recognized under generally accepted accounting principles in the United States (“GAAP”) in evaluating its business.These non-GAAP financial measures have limitations as analytical tools. One of the key limitations of using non-GAAP financial measures is that they do not reflect all items ofincome and expense that affect the Company’s operations. Share-based compensation expenses, amortization of intangible assets resulting from business acquisition, andunrealized investment loss have been and may continue to be incurred in the Company’s business and is not reflected in the use of non-GAAP financial measures. Further, thenon-GAAP measures may differ from the non-GAAP measures used by other companies, including peer companies, and therefore their comparability may be limited. The useof such non-GAAP financial measures is not intended to be considered in isolation or as a substitute for the financial information prepared and presented in accordance withGAAP. For a reconciliation of these non-GAAP financial measures to the most directly comparable GAAP measures, see Reconciliations of GAAP and non-GAAP FinancialMeasures.
1

Company Snapshot
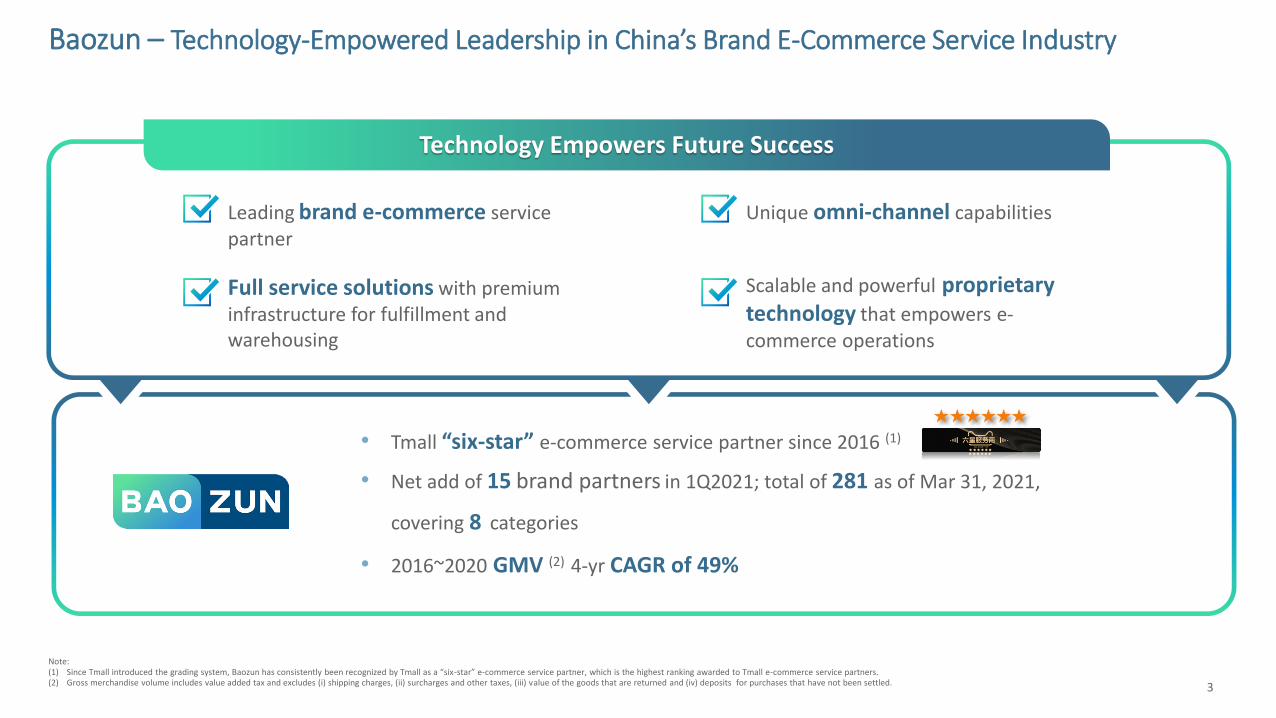
Baozun – Technology-Empowered Leadership in China’s Brand E-Commerce Service Industry
Note: (1) Since Tmall introduced the grading system, Baozun has consistently been recognized by Tmall as a “six-star” e-commerce service partner, which is the highest ranking awarded to Tmall e-commerce service partners. (2) Gross merchandise volume includes value added tax and excludes (i) shipping charges, (ii) surcharges and other taxes, (iii) value of the goods that are returned and (iv) deposits for purchases that have not been settled.
• Tmall “six-star” e-commerce service partner since 2016 (1)
• Net add of 15 brand partners in 1Q2021; total of 281 as of Mar 31, 2021,
covering 8 categories
• 2016~2020 GMV (2) 4-yr CAGR of 49%
Leading brand e-commerce service partner
Full service solutions with premium infrastructure for fulfillment and warehousing
Unique omni-channel capabilities
Scalable and powerful proprietary technology that empowers e-commerce operations
Technology Empowers Future Success
3
1,978 5,370 6,037
14,892
1,826
4,535 4,899
11,940
3,804
9,904 10,936
26,832
2015 2019 2020E 2025E
B2C E-Commerce Market Size C2C E-Commerce Market Size
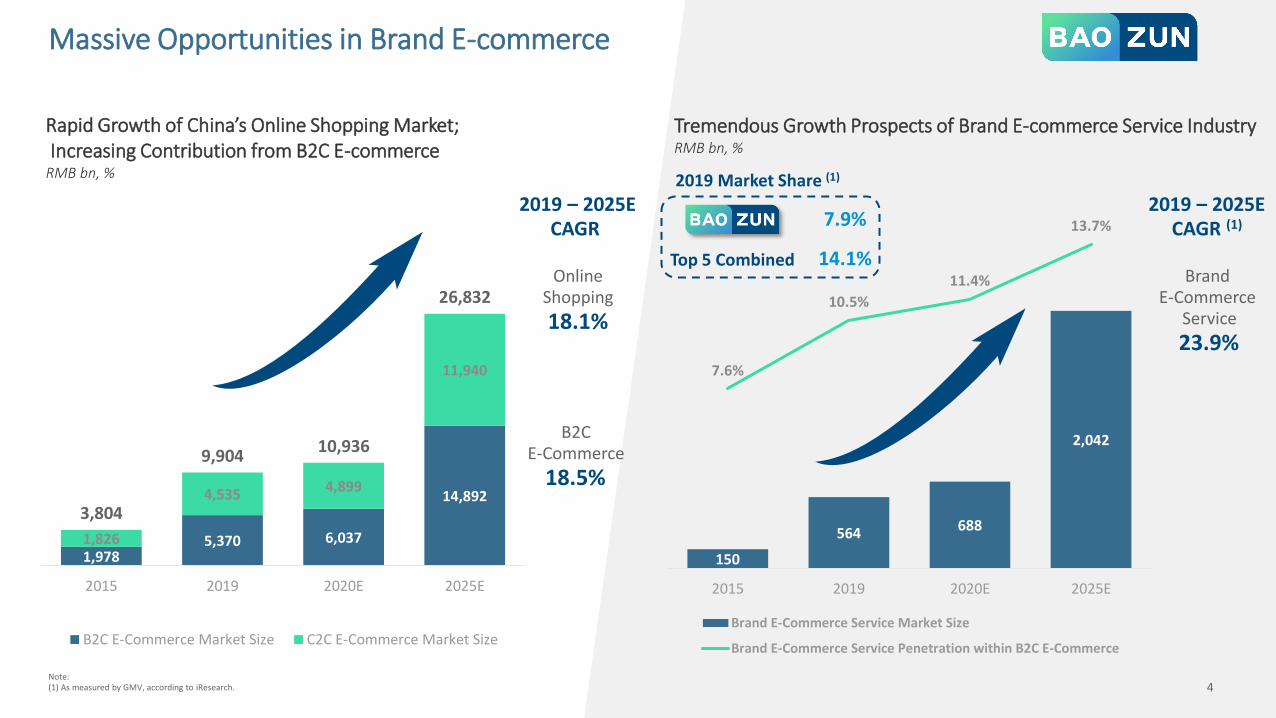
Massive Opportunities in Brand E-commerce
Tremendous Growth Prospects of Brand E-commerce Service IndustryRMB bn, %
Note: (1) As measured by GMV, according to iResearch.
Rapid Growth of China’s Online Shopping Market; Increasing Contribution from B2C E-commerce
RMB bn, %
4
Online Shopping
18.1%
150
564 688
2,042
7.6%
10.5%
11.4%
13.7%
2015 2019 2020E 2025E
Brand E-Commerce Service Market Size
Brand E-Commerce Service Penetration within B2C E-Commerce
Brand E-Commerce
Service
23.9%
2019 – 2025ECAGR
B2C E-Commerce
18.5%
2019 – 2025E CAGR (1)
2019 Market Share (1)
7.9%
14.1% Top 5 Combined
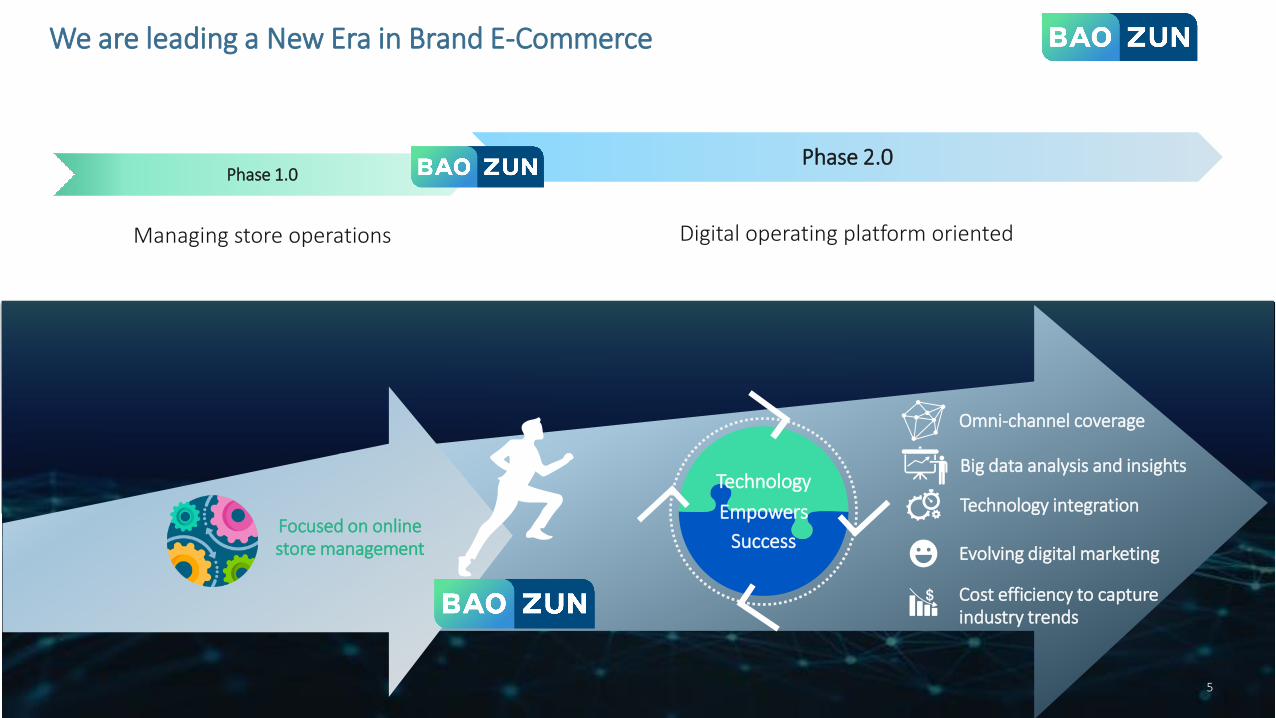
Digital operating platform oriented
We are at the forefront of a new era in brand e-commerce
Phase 1.0Phase 2.0
Focused on online store management
Technology
Success
Empowers
Managing store operations
Omni-channel coverage
Cost efficiency to capture industry trends
Evolving digital marketing
Technology integration
5
Big data analysis and insights
We are leading a New Era in Brand E-Commerce
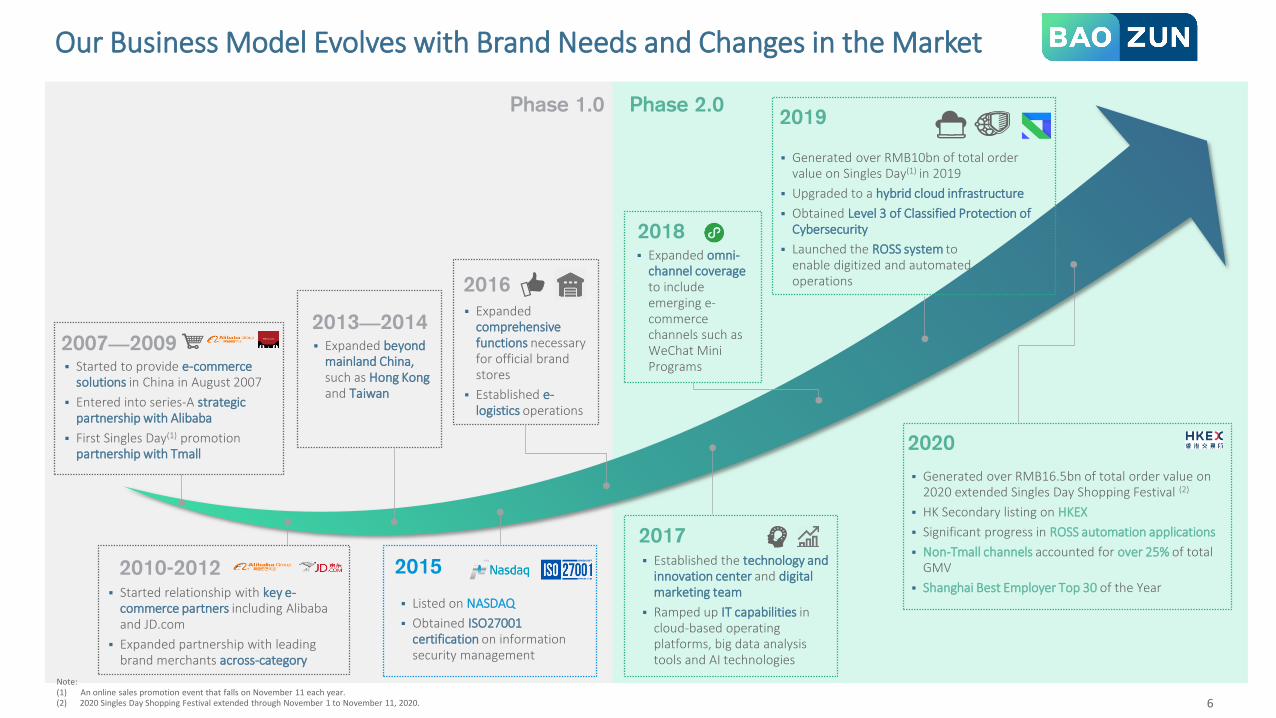
Our Business Model Evolves with Brand Needs and Changes in the Market
6
▪ Started to provide e-commerce solutions in China in August 2007
▪ Entered into series-A strategic partnership with Alibaba
▪ First Singles Day(1) promotion partnership with Tmall
2007—2009
▪ Started relationship with key e-commerce partners including Alibaba and JD.com
▪ Expanded partnership with leading brand merchants across-category
2010-2012
▪ Expanded beyond mainland China, such as Hong Kong and Taiwan
2013—2014
2015
▪ Listed on NASDAQ
▪ Obtained ISO27001 certification on information security management
2016
▪ Expanded comprehensive functions necessary for official brand stores
▪ Established e-logistics operations
2017▪ Established the technology and
innovation center and digital marketing team
▪ Ramped up IT capabilities in cloud-based operating platforms, big data analysis tools and AI technologies
2018▪ Expanded omni-
channel coverageto include emerging e-commerce channels such as WeChat Mini Programs
2019
▪ Generated over RMB10bn of total order value on Singles Day(1) in 2019
▪ Upgraded to a hybrid cloud infrastructure
▪ Obtained Level 3 of Classified Protection of Cybersecurity
▪ Launched the ROSS system to enable digitized and automated operations
2020
▪ Generated over RMB16.5bn of total order value on 2020 extended Singles Day Shopping Festival (2)
▪ HK Secondary listing on HKEX
▪ Significant progress in ROSS automation applications
▪ Non-Tmall channels accounted for over 25% of total GMV
▪ Shanghai Best Employer Top 30 of the Year
Phase 1.0 Phase 2.0
Note: (1) An online sales promotion event that falls on November 11 each year.(2) 2020 Singles Day Shopping Festival extended through November 1 to November 11, 2020.

Business Highlights
8
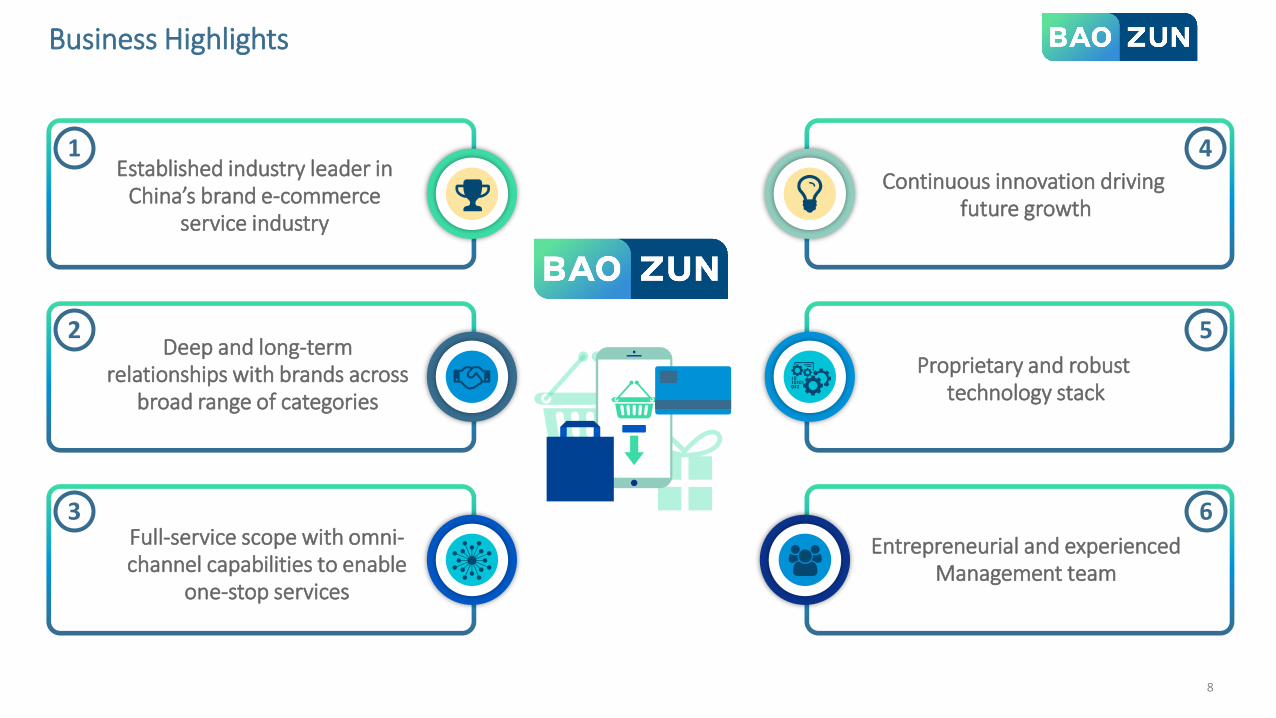
Business Highlights
Established industry leader in China’s brand e-commerce
service industry
Deep and long-term relationships with brands across
broad range of categories
Full-service scope with omni-channel capabilities to enable
one-stop services
1
2
3
4
5
6
Proprietary and robust technology stack
Continuous innovation driving future growth
Entrepreneurial and experiencedManagement team
Narrow scope of services
Limited aspects of brands’ e-commerce strategies addressed
Limited capability
9
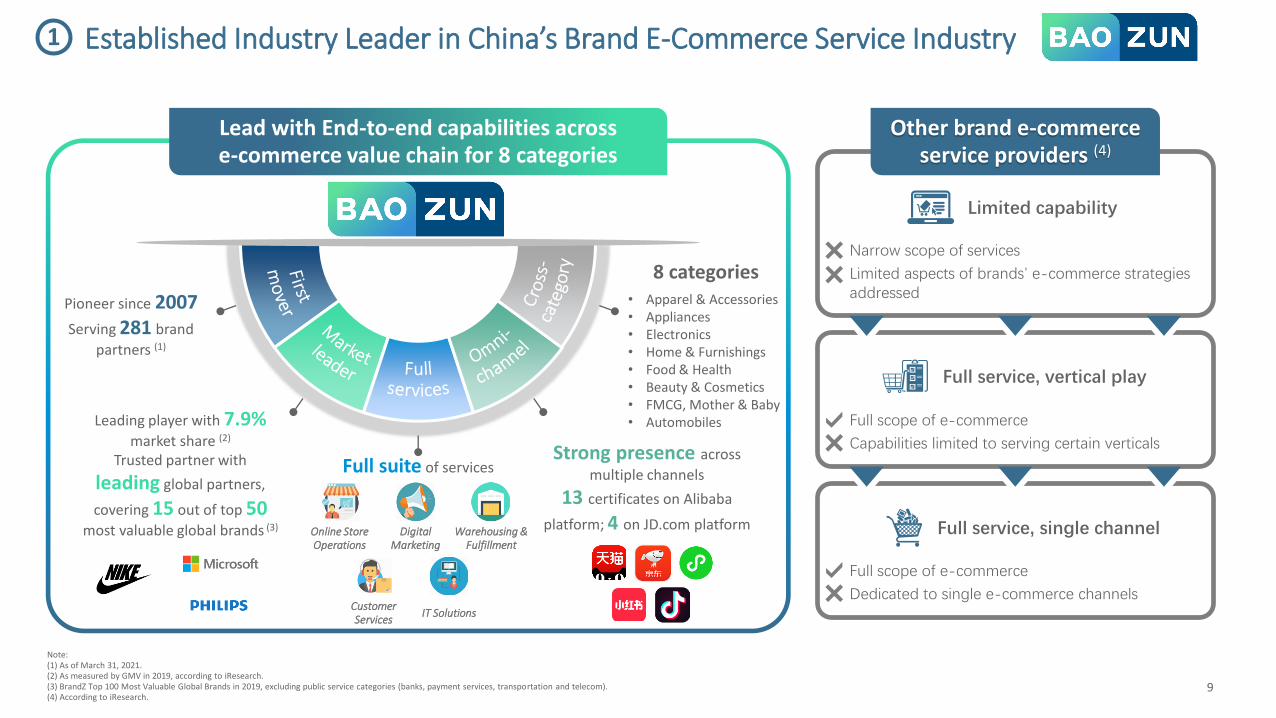
Established Industry Leader in China’s Brand E-Commerce Service Industry
Note:(1) As of March 31, 2021. (2) As measured by GMV in 2019, according to iResearch.(3) BrandZ Top 100 Most Valuable Global Brands in 2019, excluding public service categories (banks, payment services, transportation and telecom).(4) According to iResearch.
Pioneer since 2007 Serving 281 brand
partners (1)
Leading player with 7.9% market share (2)
Trusted partner with
leading global partners,
covering 15 out of top 50most valuable global brands (3)
Full suite of servicesStrong presence across
multiple channels
13 certificates on Alibaba
platform; 4 on JD.com platform
8 categories
Lead with End-to-end capabilities across e-commerce value chain for 8 categories
Other brand e-commerce service providers (4)
Full scope of e-commerce
Capabilities limited to serving certain verticals
Full scope of e-commerce
Dedicated to single e-commerce channels
Full service, vertical play
Full service, single channelOnline Store Operations
DigitalMarketing
Warehousing & Fulfillment
CustomerServices
• Apparel & Accessories• Appliances • Electronics• Home & Furnishings• Food & Health • Beauty & Cosmetics • FMCG, Mother & Baby• Automobiles
IT Solutions
1
10
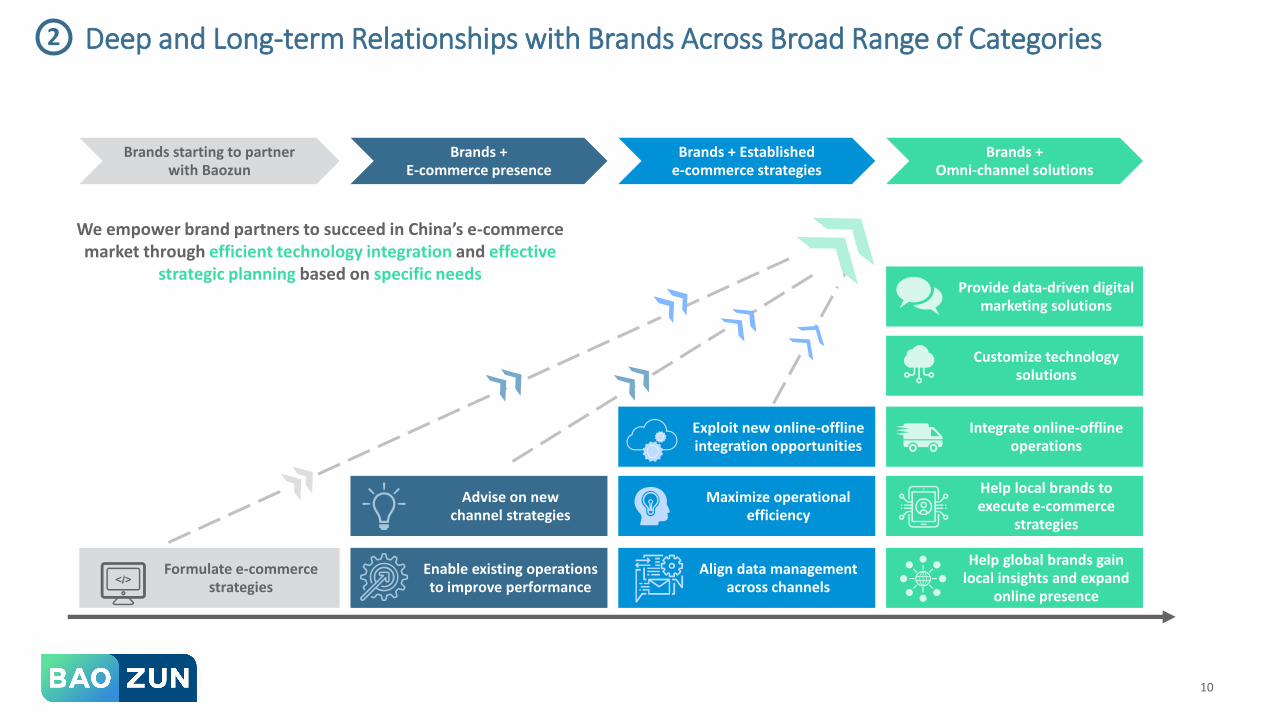
Deep and Long-term Relationships with Brands Across Broad Range of Categories
Brands + Omni-channel solutions
Brands +E-commerce presence
Brands starting to partner with Baozun
Formulate e-commerce strategies
Enable existing operations to improve performance
Brands + Establishede-commerce strategies
Align data management across channels
Help global brands gain local insights and expand
online presence
Advise on new channel strategies
Maximize operational efficiency
Exploit new online-offline integration opportunities
Help local brands to execute e-commerce
strategies
Integrate online-offline operations
Customize technology solutions
Provide data-driven digital marketing solutions
We empower brand partners to succeed in China’s e-commerce market through efficient technology integration and effective
strategic planning based on specific needs
2
11
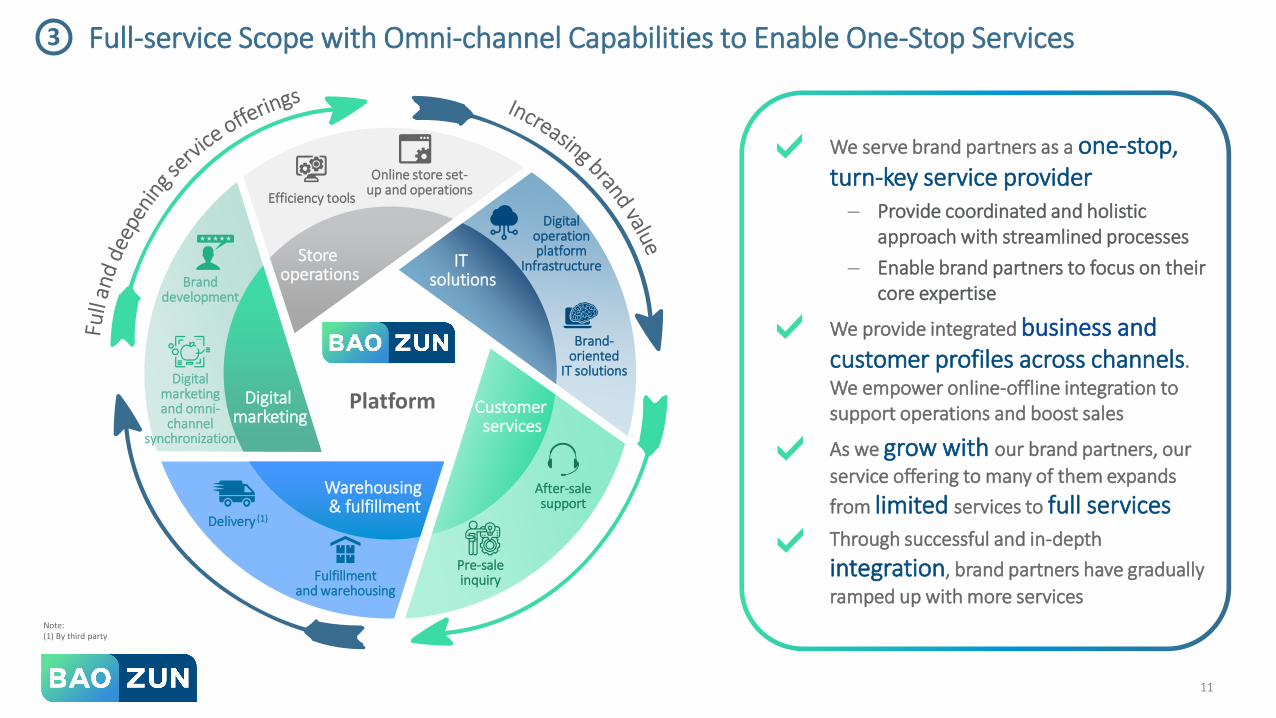
We serve brand partners as a one-stop,turn-key service provider – Provide coordinated and holistic
approach with streamlined processes
– Enable brand partners to focus on their core expertise
We provide integrated business and customer profiles across channels.
We empower online-offline integration to support operations and boost sales
As we grow with our brand partners, our
service offering to many of them expands
from limited services to full servicesThrough successful and in-depth
integration, brand partners have gradually
ramped up with more servicesNote:(1) By third party
Customer services
IT solutions
Store operations
Warehousing & fulfillment
Digital marketing
Digital operation platform
Infrastructure
Online store set-up and operations
Brand-oriented
IT solutions
Efficiency tools
Fulfillment and warehousing
Delivery (1)
Digital marketing and omni-channel
synchronization
Brand development
Pre-saleinquiry
After-salesupport
Platform
3 Full-service Scope with Omni-channel Capabilities to Enable One-Stop Services
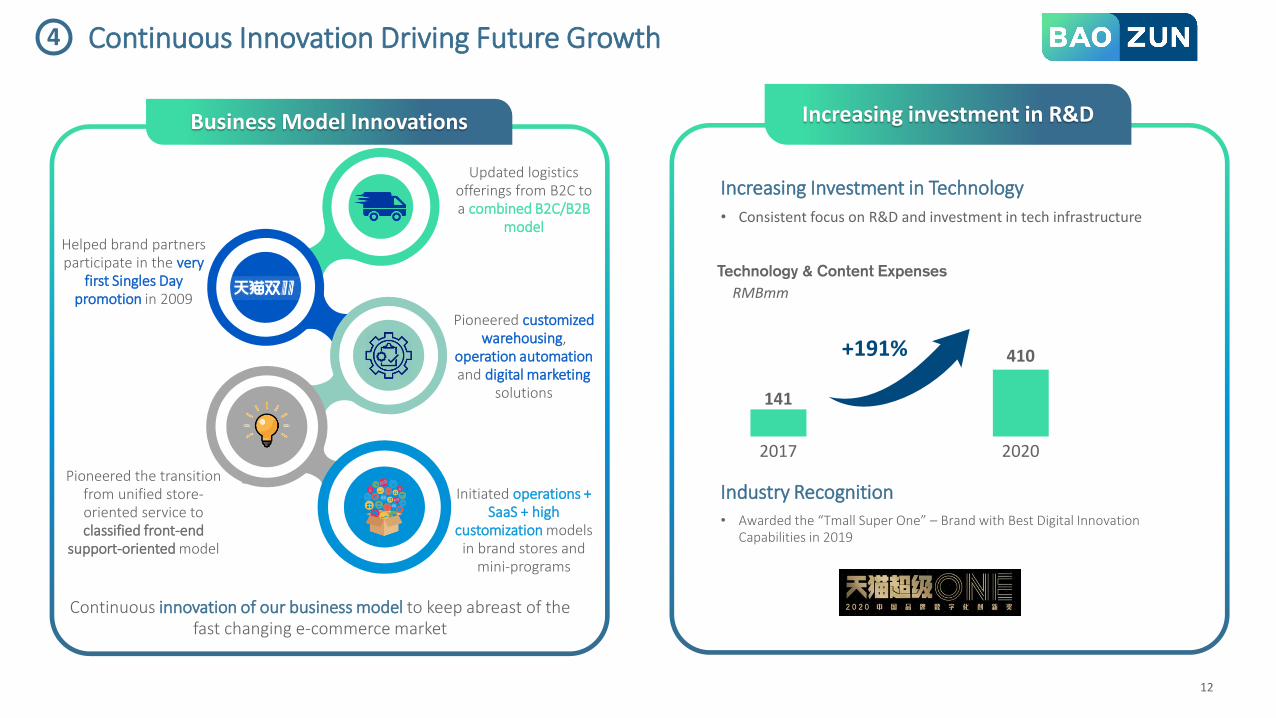
Continuous Innovation Driving Future Growth
Cross-Channel Sales Solutions
Industry Recognition• Awarded the “Tmall Super One” – Brand with Best Digital Innovation
Capabilities in 2019
Increasing Investment in Technology
• Consistent focus on R&D and investment in tech infrastructure
12
Business Model Innovations Increasing investment in R&D
Initiated operations + SaaS + high
customization models in brand stores and
mini-programs
Helped brand partners participate in the very
first Singles Day promotion in 2009
Updated logistics offerings from B2C to a combined B2C/B2B
model
Continuous innovation of our business model to keep abreast of the fast changing e-commerce market
Pioneered customized warehousing,
operation automation and digital marketing
solutions 141
410
RMBmm
2017 2020
+191%
Technology & Content Expenses
4
Pioneered the transition from unified store-oriented service to classified front-end
support-oriented model
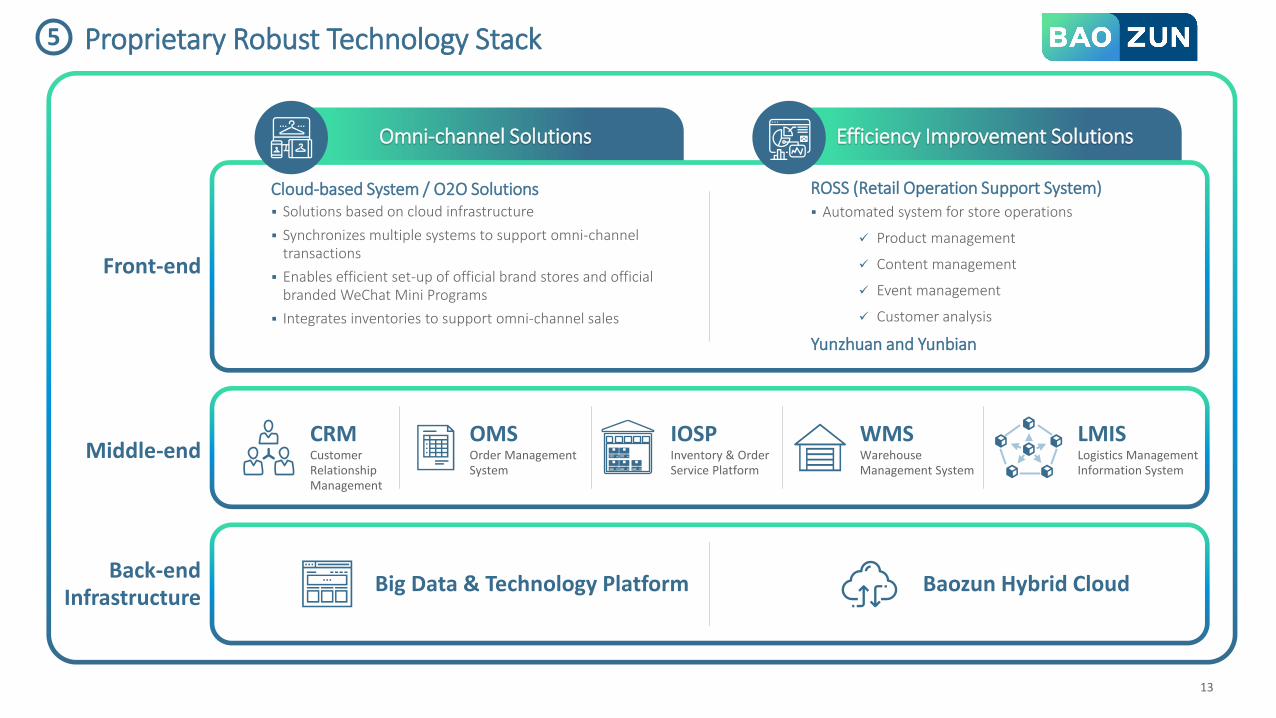
Efficiency Improvement SolutionsOmni-channel Solutions
Front-end
Cloud-based System / O2O Solutions▪ Solutions based on cloud infrastructure
▪ Synchronizes multiple systems to support omni-channeltransactions
▪ Enables efficient set-up of official brand stores and official branded WeChat Mini Programs
▪ Integrates inventories to support omni-channel sales
ROSS (Retail Operation Support System)▪ Automated system for store operations
✓ Product management
✓ Content management
✓ Event management
✓ Customer analysis
Yunzhuan and Yunbian
Back-endInfrastructure
Big Data & Technology Platform Baozun Hybrid Cloud
Middle-endOMSOrder Management System
WMSWarehouse Management System
CRMCustomer Relationship Management
LMISLogistics Management Information System
IOSPInventory & Order Service Platform
Proprietary Robust Technology Stack
13
5
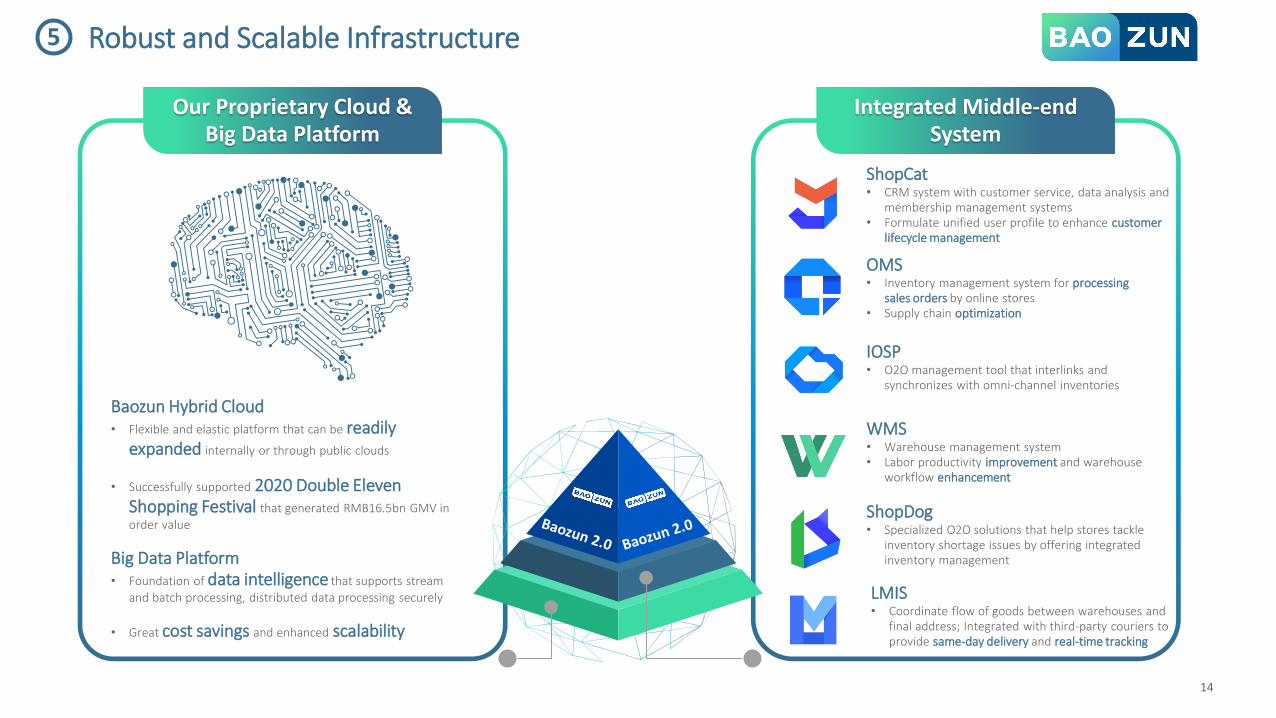
Robust and Scalable Infrastructure
Baozun Hybrid Cloud • Flexible and elastic platform that can be readily
expanded internally or through public clouds
• Successfully supported 2020 Double Eleven Shopping Festival that generated RMB16.5bn GMV in
order value
Big Data Platform • Foundation of data intelligence that supports stream
and batch processing, distributed data processing securely
• Great cost savings and enhanced scalability
14
OMS• Inventory management system for processing
sales orders by online stores• Supply chain optimization
WMS• Warehouse management system• Labor productivity improvement and warehouse
workflow enhancement
Our Proprietary Cloud & Big Data Platform
Integrated Middle-end System
ShopCat• CRM system with customer service, data analysis and
membership management systems• Formulate unified user profile to enhance customer
lifecycle management
LMIS• Coordinate flow of goods between warehouses and
final address; Integrated with third-party couriers to provide same-day delivery and real-time tracking
5
ShopDog• Specialized O2O solutions that help stores tackle
inventory shortage issues by offering integrated inventory management
IOSP • O2O management tool that interlinks and
synchronizes with omni-channel inventories
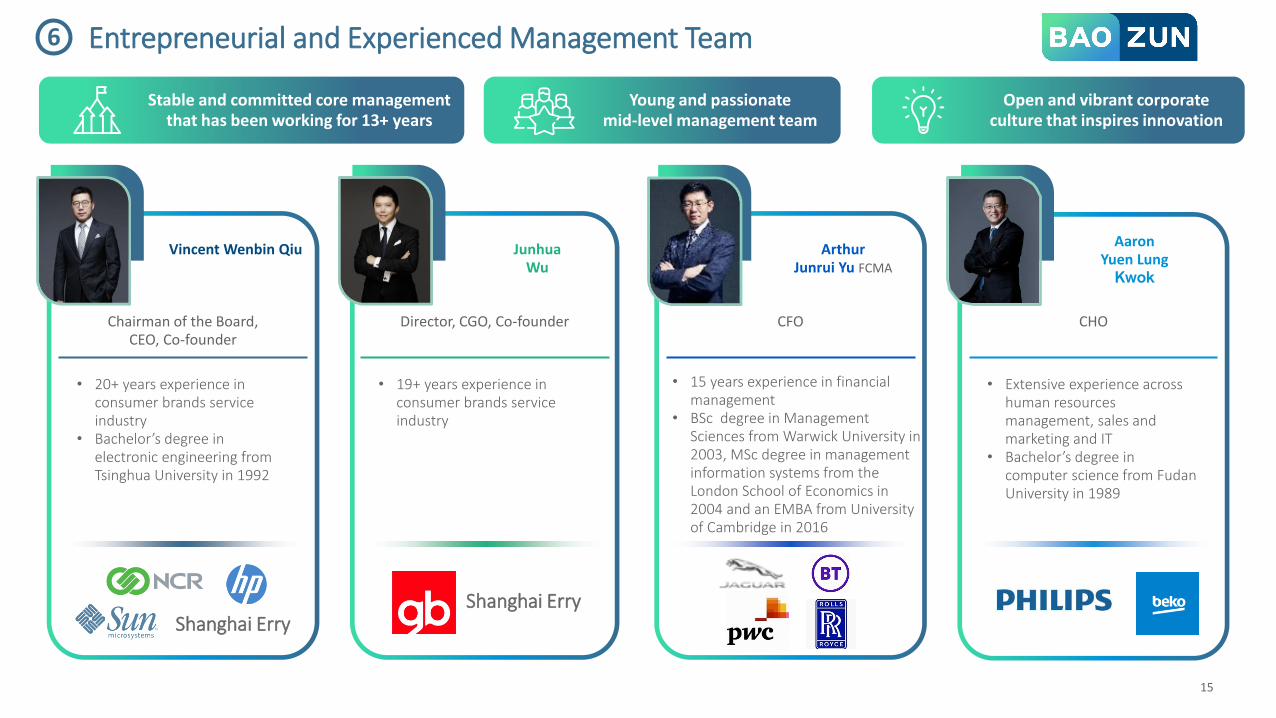
• 20+ years experience in consumer brands service industry
• Bachelor’s degree in electronic engineering from Tsinghua University in 1992
• 19+ years experience in consumer brands service industry
• 15 years experience in financial management
• BSc degree in Management Sciences from Warwick University in 2003, MSc degree in management information systems from the London School of Economics in 2004 and an EMBA from University of Cambridge in 2016
Shanghai ErryShanghai Erry
• Extensive experience across human resources management, sales and marketing and IT
• Bachelor’s degree in computer science from FudanUniversity in 1989
15
Aaron Yuen Lung
Kwok
ArthurJunrui Yu FCMA
JunhuaWu
Vincent Wenbin Qiu
CHOCFODirector, CGO, Co-founderChairman of the Board, CEO, Co-founder
Stable and committed core management that has been working for 13+ years
Young and passionate mid-level management team
Open and vibrant corporate culture that inspires innovation
6 Entrepreneurial and Experienced Management Team
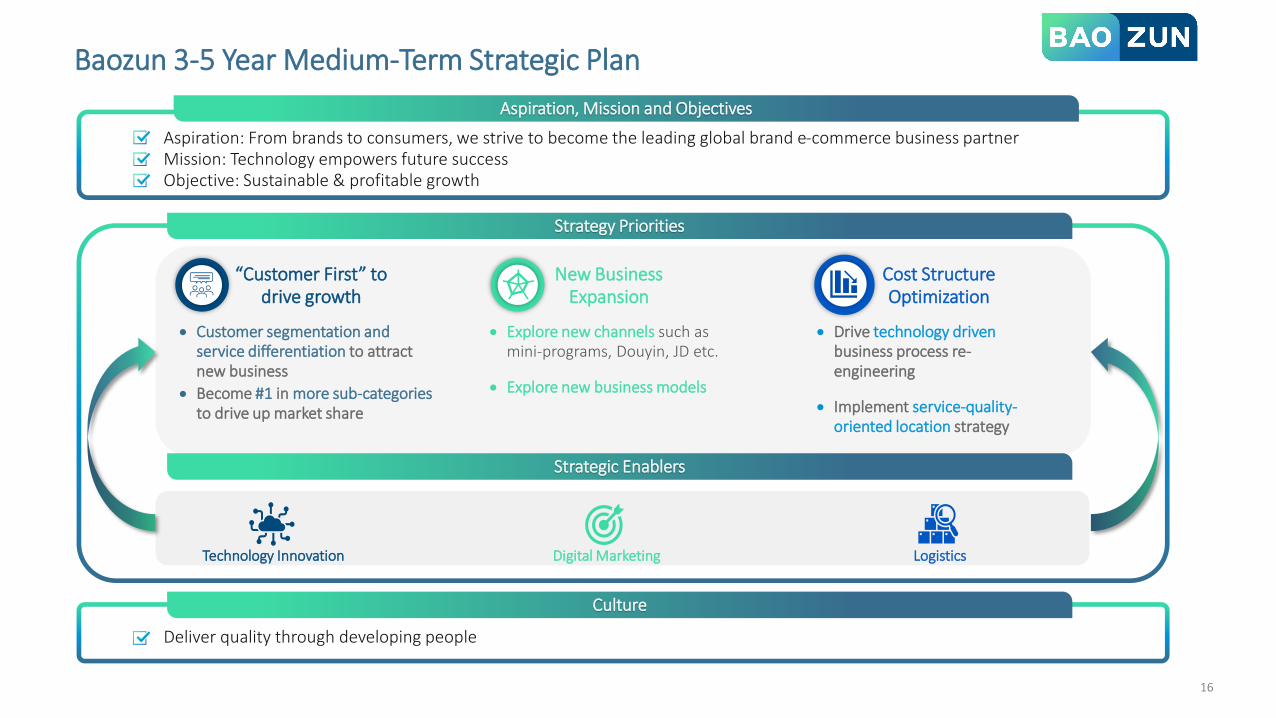
Strategy Priorities
16
“Customer First” to drive growth
Cost Structure Optimization
New Business Expansion
Technology Innovation Digital Marketing Logistics
Aspiration, Mission and Objectives
Aspiration: From brands to consumers, we strive to become the leading global brand e-commerce business partnerMission: Technology empowers future successObjective: Sustainable & profitable growth
Culture
Deliver quality through developing people
• Customer segmentation and service differentiation to attract new business
• Become #1 in more sub-categories to drive up market share
• Explore new channels such as mini-programs, Douyin, JD etc.
• Explore new business models
• Drive technology driven business process re-engineering
• Implement service-quality-oriented location strategy
Baozun 3-5 Year Medium-Term Strategic Plan
Strategic Enablers
17
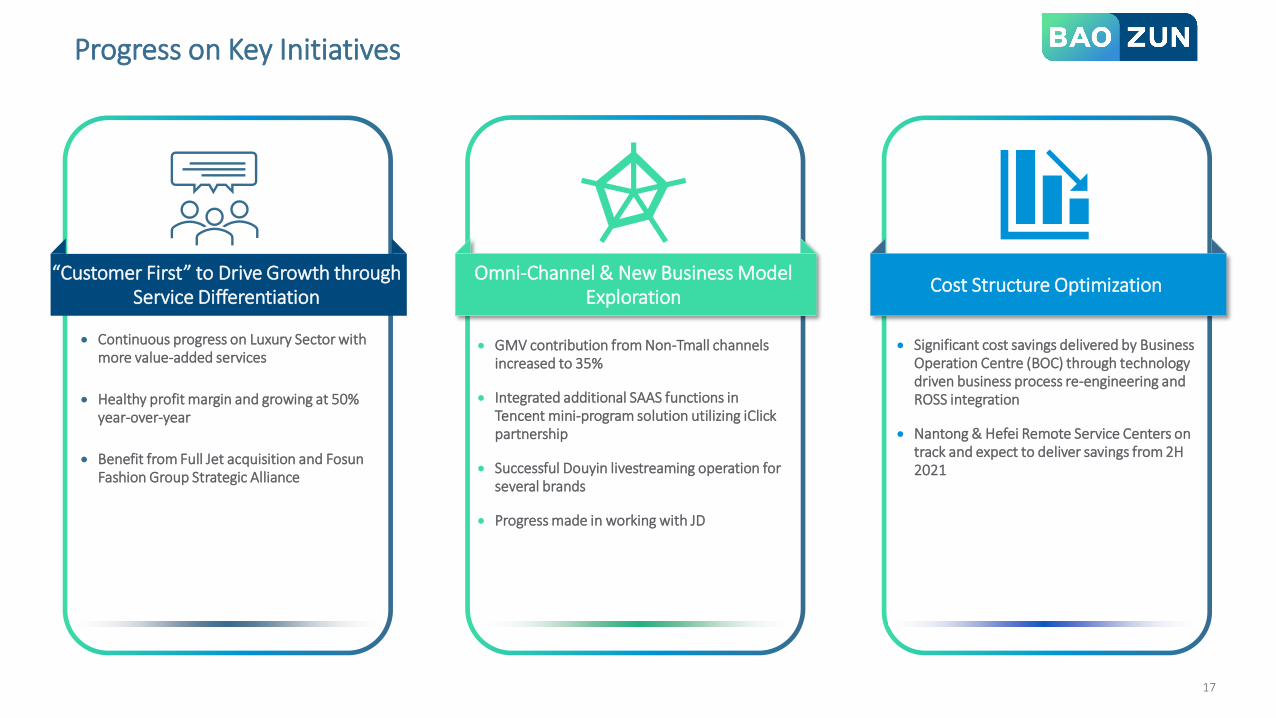
Omni-Channel & New Business Model Exploration
“Customer First” to Drive Growth through Service Differentiation
Cost Structure Optimization
Progress on Key Initiatives
• Continuous progress on Luxury Sector with more value-added services
• Healthy profit margin and growing at 50% year-over-year
• Benefit from Full Jet acquisition and FosunFashion Group Strategic Alliance
• GMV contribution from Non-Tmall channels increased to 35%
• Integrated additional SAAS functions in Tencent mini-program solution utilizing iClickpartnership
• Successful Douyin livestreaming operation for several brands
• Progress made in working with JD
• Significant cost savings delivered by Business Operation Centre (BOC) through technology driven business process re-engineering and ROSS integration
• Nantong & Hefei Remote Service Centers on track and expect to deliver savings from 2H 2021
18
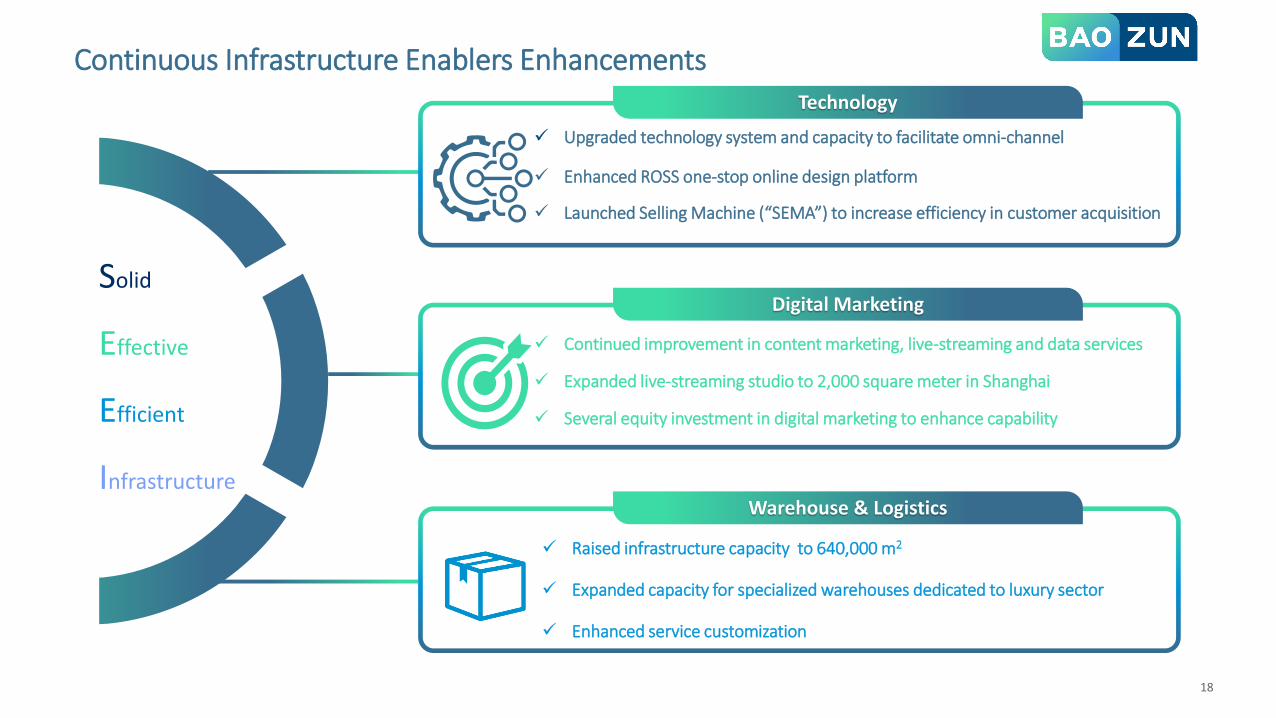
✓ Upgraded technology system and capacity to facilitate omni-channel
✓ Enhanced ROSS one-stop online design platform
✓ Launched Selling Machine (“SEMA”) to increase efficiency in customer acquisition
Technology
Digital Marketing
✓ Continued improvement in content marketing, live-streaming and data services
✓ Expanded live-streaming studio to 2,000 square meter in Shanghai
✓ Several equity investment in digital marketing to enhance capability
Warehouse & Logistics
✓ Raised infrastructure capacity to 640,000 m2
✓ Expanded capacity for specialized warehouses dedicated to luxury sector
✓ Enhanced service customization
Continuous Infrastructure Enablers Enhancements
Solid
Effective
Efficient
Infrastructure
19
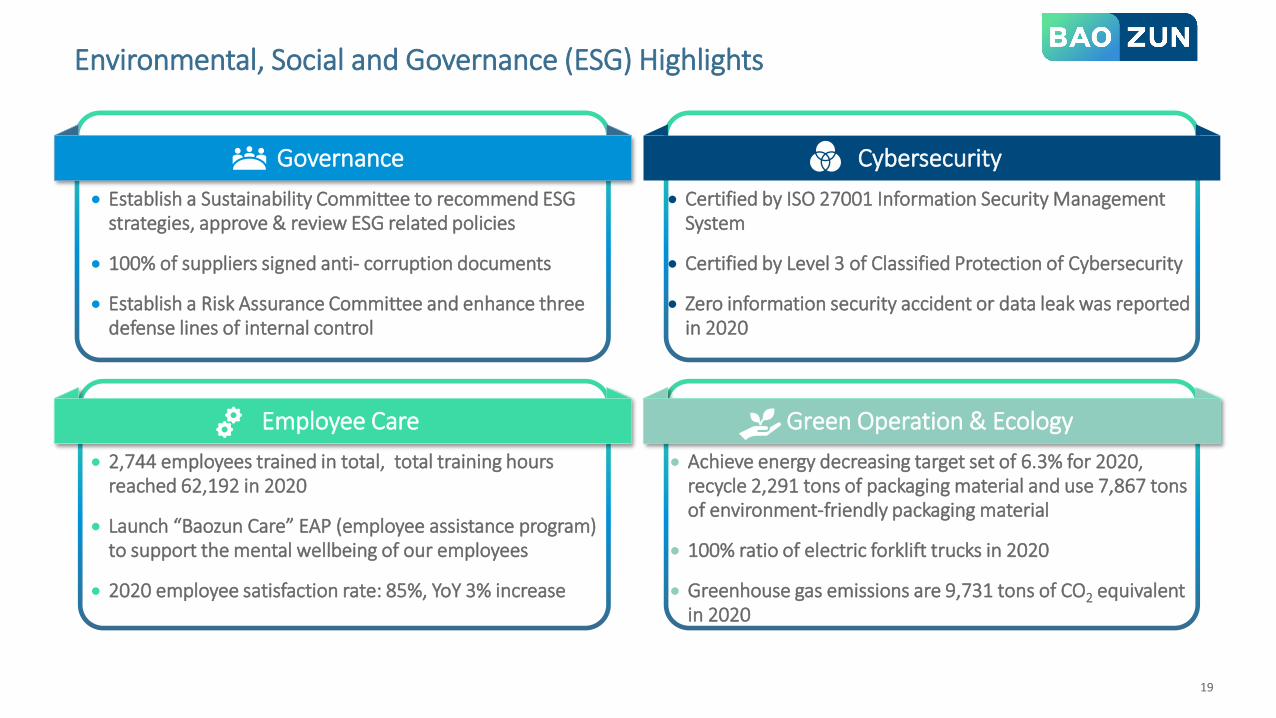
Environmental, Social and Governance (ESG) Highlights
CybersecurityGovernance
• Establish a Sustainability Committee to recommend ESG strategies, approve & review ESG related policies
• 100% of suppliers signed anti- corruption documents
• Establish a Risk Assurance Committee and enhance three defense lines of internal control
• Certified by ISO 27001 Information Security Management System
• Certified by Level 3 of Classified Protection of Cybersecurity
• Zero information security accident or data leak was reported in 2020
• 2,744 employees trained in total, total training hours reached 62,192 in 2020
• Launch “Baozun Care” EAP (employee assistance program) to support the mental wellbeing of our employees
• 2020 employee satisfaction rate: 85%, YoY 3% increase
Employee Care Green Operation & Ecology
• Achieve energy decreasing target set of 6.3% for 2020, recycle 2,291 tons of packaging material and use 7,867 tons of environment-friendly packaging material
• 100% ratio of electric forklift trucks in 2020
• Greenhouse gas emissions are 9,731 tons of CO2 equivalent in 2020

Financial Highlights
21
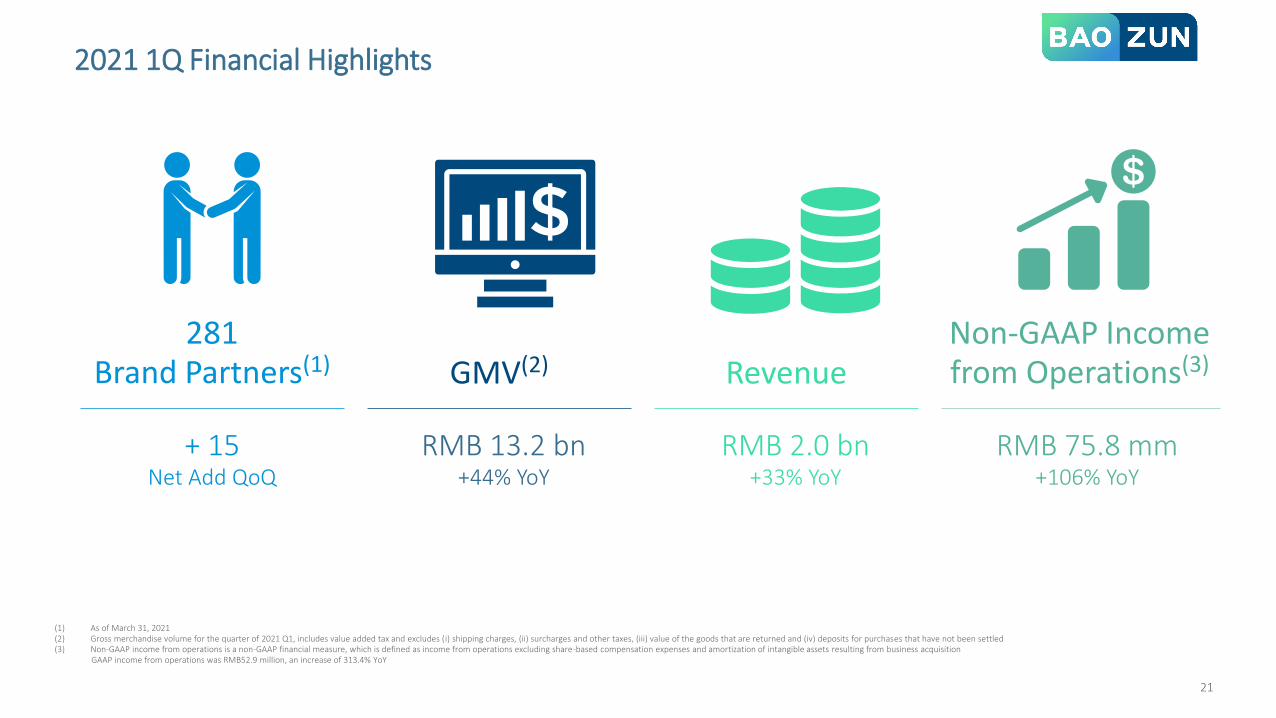
(1) As of March 31, 2021(2) Gross merchandise volume for the quarter of 2021 Q1, includes value added tax and excludes (i) shipping charges, (ii) surcharges and other taxes, (iii) value of the goods that are returned and (iv) deposits for purchases that have not been settled(3) Non-GAAP income from operations is a non-GAAP financial measure, which is defined as income from operations excluding share-based compensation expenses and amortization of intangible assets resulting from business acquisition
GAAP income from operations was RMB52.9 million, an increase of 313.4% YoY
GMV(2) RevenueNon-GAAP Income from Operations(3)
RMB 13.2 bn+44% YoY
RMB 2.0 bn+33% YoY
RMB 75.8 mm+106% YoY
281 Brand Partners(1)
+ 15Net Add QoQ
2021 1Q Financial Highlights
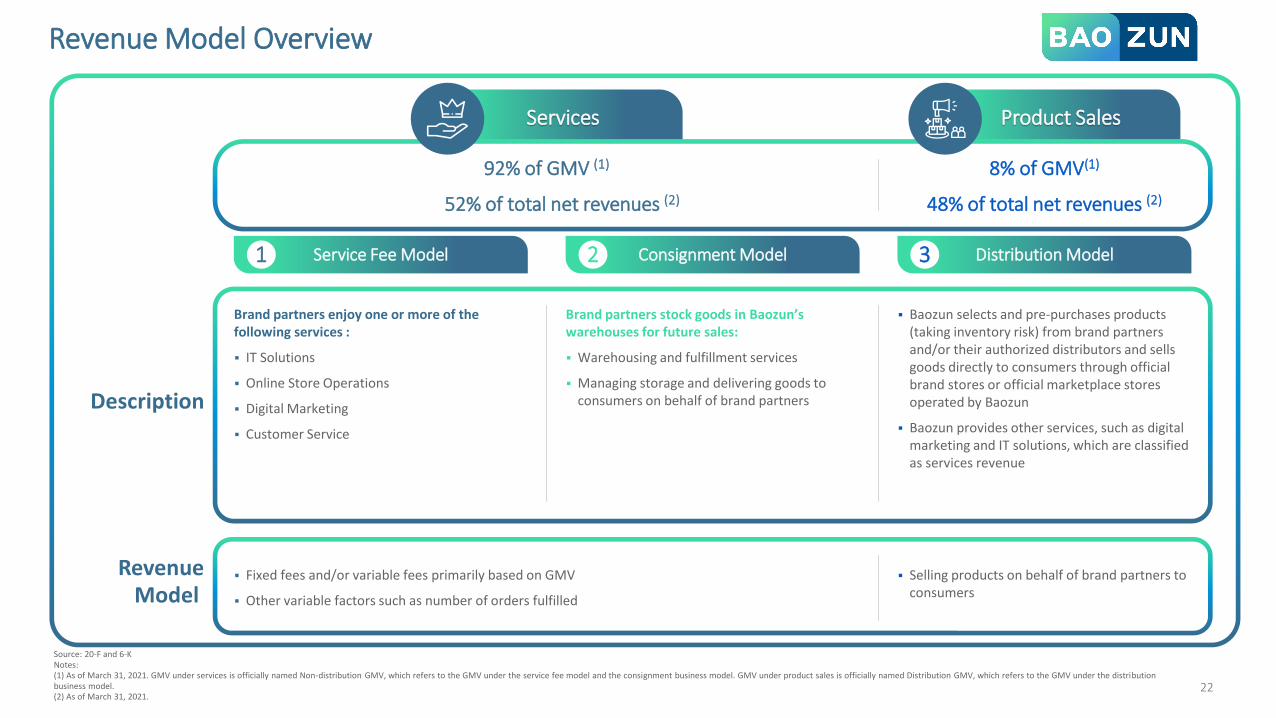
Revenue Model Overview
Source: 20-F and 6-KNotes: (1) As of March 31, 2021. GMV under services is officially named Non-distribution GMV, which refers to the GMV under the service fee model and the consignment business model. GMV under product sales is officially named Distribution GMV, which refers to the GMV under the distribution business model. (2) As of March 31, 2021.
22
Service Fee Model Consignment Model Distribution Model
Services Product Sales
31 2
48% of total net revenues (2)52% of total net revenues (2)
Description
Products pre-purchased by company(take inventory risks)
Brand partners enjoy one or more of the following services :
▪ IT Solutions
▪ Online Store Operations
▪ Digital Marketing
▪ Customer Service
Brand partners stock goods in Baozun’swarehouses for future sales:
▪ Warehousing and fulfillment services
▪ Managing storage and delivering goods to consumers on behalf of brand partners
▪ Baozun selects and pre-purchases products (taking inventory risk) from brand partners and/or their authorized distributors and sells goods directly to consumers through official brand stores or official marketplace stores operated by Baozun
▪ Baozun provides other services, such as digital marketing and IT solutions, which are classified as services revenue
RevenueModel
▪ Fixed fees and/or variable fees primarily based on GMV
▪ Other variable factors such as number of orders fulfilled
▪ Selling products on behalf of brand partners to consumers
8% of GMV(1)92% of GMV (1)
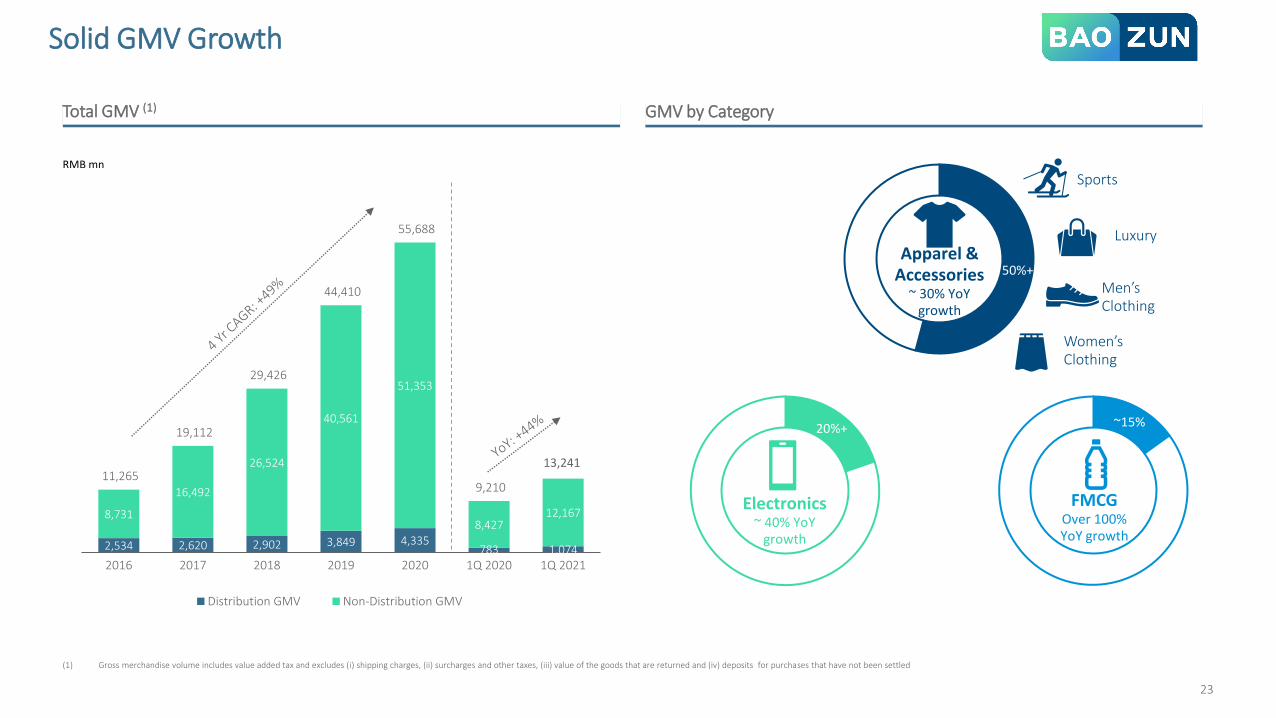
GMV by CategoryTotal GMV (1)
Solid GMV Growth
23
2,534 2,620 2,902 3,849 4,335783 1,074
8,731
16,492
26,524
40,561
51,353
8,42712,167
11,265
19,112
29,426
44,410
55,688
9,210
2016 2017 2018 2019 2020 1Q 2020 1Q 2021
Distribution GMV Non-Distribution GMV
RMB mn
13,241
(1) Gross merchandise volume includes value added tax and excludes (i) shipping charges, (ii) surcharges and other taxes, (iii) value of the goods that are returned and (iv) deposits for purchases that have not been settled
20%+
Electronics~ 40% YoY
growth
~15%
FMCGOver 100%YoY growth
50%+Apparel &
Accessories ~ 30% YoY
growth
Sports
Luxury
Women’s Clothing
Men’s Clothing
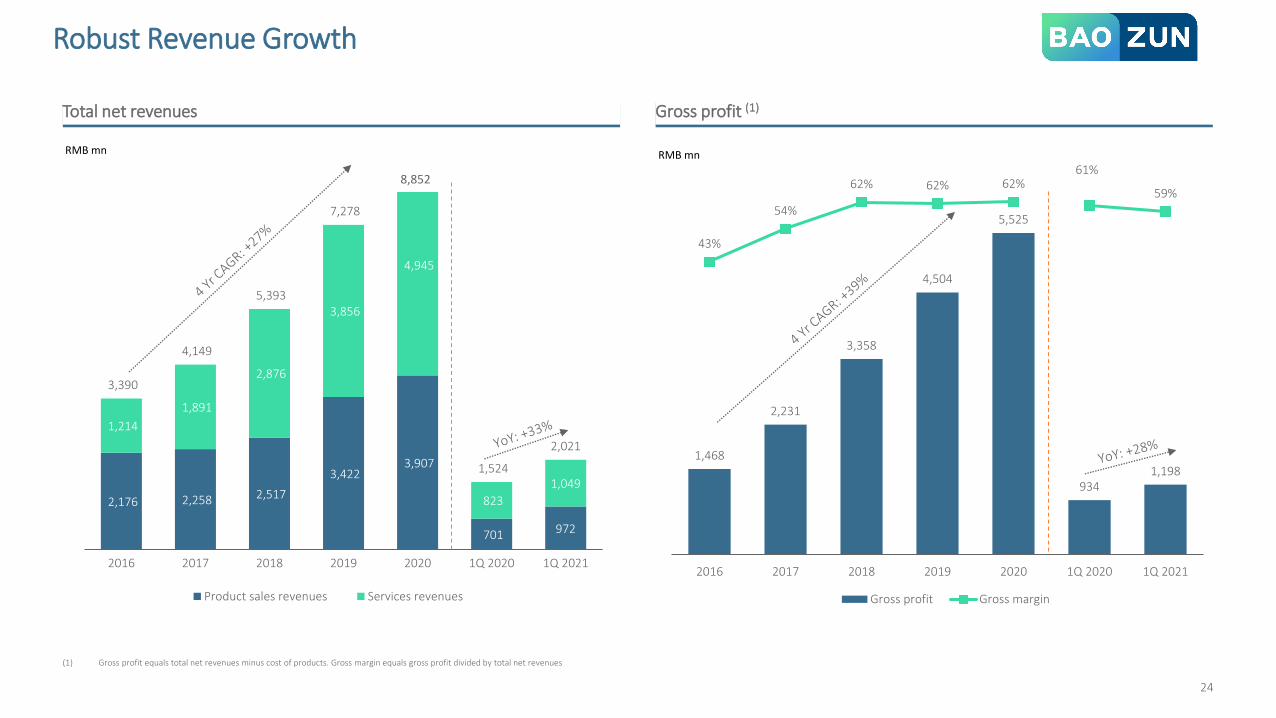
Robust Revenue Growth
24
Gross profit (1)Total net revenues
2,176 2,258 2,517
3,422 3,907
701 972
1,214
1,891
2,876
3,856
4,945
823
1,049
3,390
4,149
5,393
7,278
1,524
2,021
2016 2017 2018 2019 2020 1Q 2020 1Q 2021
Product sales revenues Services revenues
RMB mn
1,468
2,231
3,358
4,504
5,525
9341,198
43%
54%
62% 62% 62%61%
59%
-50.0%
-30.0%
-10.0%
10.0%
30.0%
50.0%
2016 2017 2018 2019 2020 1Q 2020 1Q 2021
Gross profit Gross margin
RMB mn
(1) Gross profit equals total net revenues minus cost of products. Gross margin equals gross profit divided by total net revenues
8,852
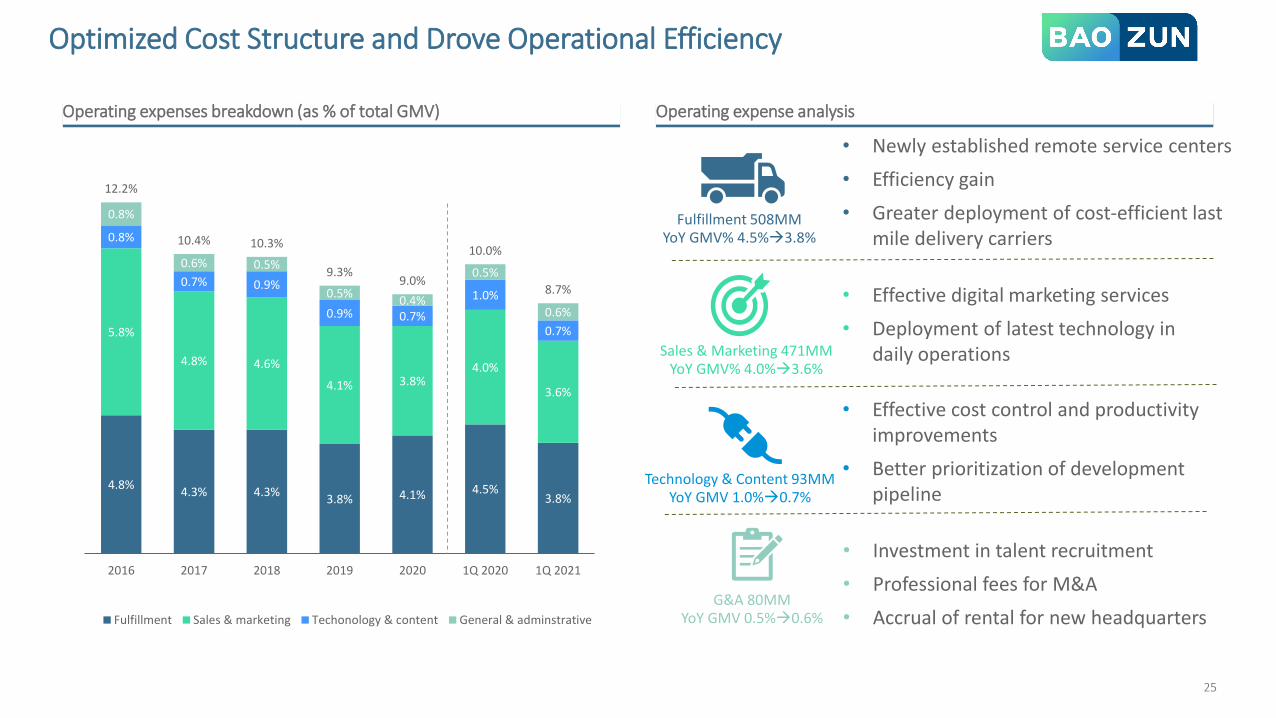
4.8%4.3% 4.3%
3.8% 4.1% 4.5%3.8%
5.8%
4.8% 4.6%
4.1% 3.8%4.0%
3.6%
0.8%
0.7% 0.9%
0.9% 0.7%
1.0%
0.7%
0.8%
0.6% 0.5%
0.5%0.4%
0.5%
0.6%
12.2%
10.4% 10.3%
9.3%9.0%
10.0%
8.7%
2016 2017 2018 2019 2020 1Q 2020 1Q 2021
Fulfillment Sales & marketing Techonology & content General & adminstrative
Optimized Cost Structure and Drove Operational Efficiency
25
Operating expenses breakdown (as % of total GMV) Operating expense analysis
Fulfillment 508MMYoY GMV% 4.5%→3.8%
• Newly established remote service centers
• Efficiency gain
• Greater deployment of cost-efficient last mile delivery carriers
• Effective digital marketing services
• Deployment of latest technology in daily operationsSales & Marketing 471MM
YoY GMV% 4.0%→3.6%
• Effective cost control and productivity improvements
• Better prioritization of development pipeline
• Investment in talent recruitment
• Professional fees for M&A
• Accrual of rental for new headquarters
Technology & Content 93MMYoY GMV 1.0%→0.7%
G&A 80MMYoY GMV 0.5%→0.6%
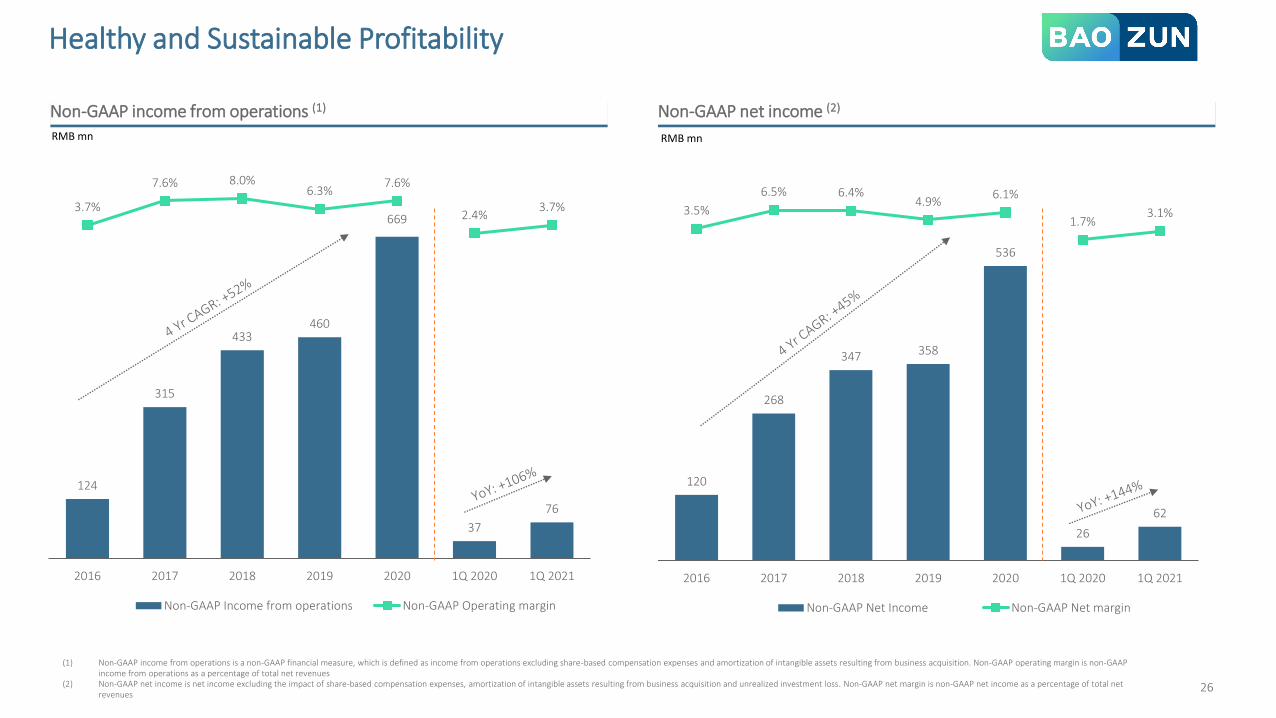
Non-GAAP income from operations (1)
124
315
433460
669
37
76
3.7%
7.6% 8.0%6.3%
7.6%
2.4%3.7%
-50.0%
-40.0%
-30.0%
-20.0%
-10.0%
0.0%
10.0%
2016 2017 2018 2019 2020 1Q 2020 1Q 2021
Non-GAAP Income from operations Non-GAAP Operating margin
RMB mn
Non-GAAP net income (2)
26
Healthy and Sustainable Profitability
(1) Non-GAAP income from operations is a non-GAAP financial measure, which is defined as income from operations excluding share-based compensation expenses and amortization of intangible assets resulting from business acquisition. Non-GAAP operating margin is non-GAAP income from operations as a percentage of total net revenues
(2) Non-GAAP net income is net income excluding the impact of share-based compensation expenses, amortization of intangible assets resulting from business acquisition and unrealized investment loss. Non-GAAP net margin is non-GAAP net income as a percentage of total net revenues
120
268
347 358
536
26
62
3.5%
6.5% 6.4%4.9%
6.1%
1.7%3.1%
-50.0%
-40.0%
-30.0%
-20.0%
-10.0%
0.0%
10.0%
2016 2017 2018 2019 2020 1Q 2020 1Q 2021
Non-GAAP Net Income Non-GAAP Net margin
RMB mn
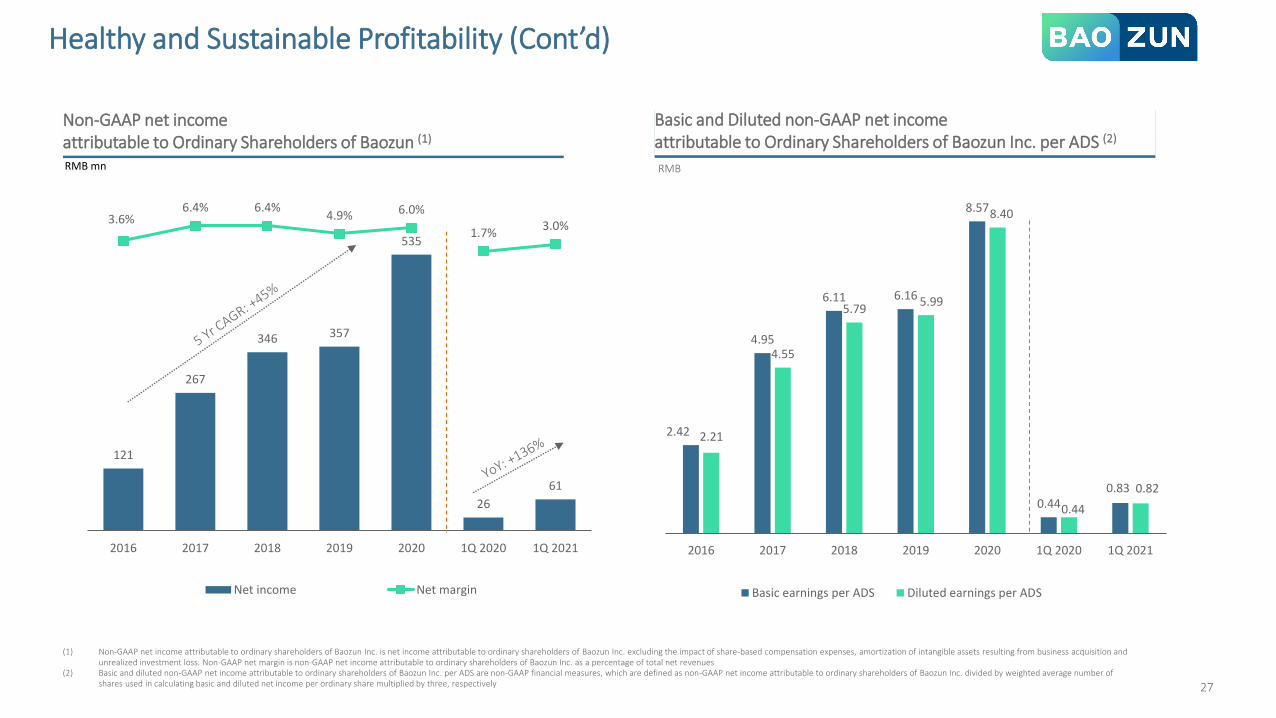
Healthy and Sustainable Profitability (Cont’d)
Non-GAAP net income attributable to Ordinary Shareholders of Baozun (1)
121
267
346 357
535
26
61
3.6%6.4% 6.4%
4.9% 6.0%
1.7%3.0%
2016 2017 2018 2019 2020 1Q 2020 1Q 2021
Net income Net margin
RMB mn
Basic and Diluted non-GAAP net income attributable to Ordinary Shareholders of Baozun Inc. per ADS (2)
RMB
2.42
4.95
6.11 6.16
8.57
0.440.83
2.21
4.55
5.79 5.99
8.40
0.44
0.82
0
1
2
3
4
5
6
7
8
9
2016 2017 2018 2019 2020 1Q 2020 1Q 2021
Basic earnings per ADS Diluted earnings per ADS
(1) Non-GAAP net income attributable to ordinary shareholders of Baozun Inc. is net income attributable to ordinary shareholders of Baozun Inc. excluding the impact of share-based compensation expenses, amortization of intangible assets resulting from business acquisition and unrealized investment loss. Non-GAAP net margin is non-GAAP net income attributable to ordinary shareholders of Baozun Inc. as a percentage of total net revenues
(2) Basic and diluted non-GAAP net income attributable to ordinary shareholders of Baozun Inc. per ADS are non-GAAP financial measures, which are defined as non-GAAP net income attributable to ordinary shareholders of Baozun Inc. divided by weighted average number of shares used in calculating basic and diluted net income per ordinary share multiplied by three, respectively 27

Appendix
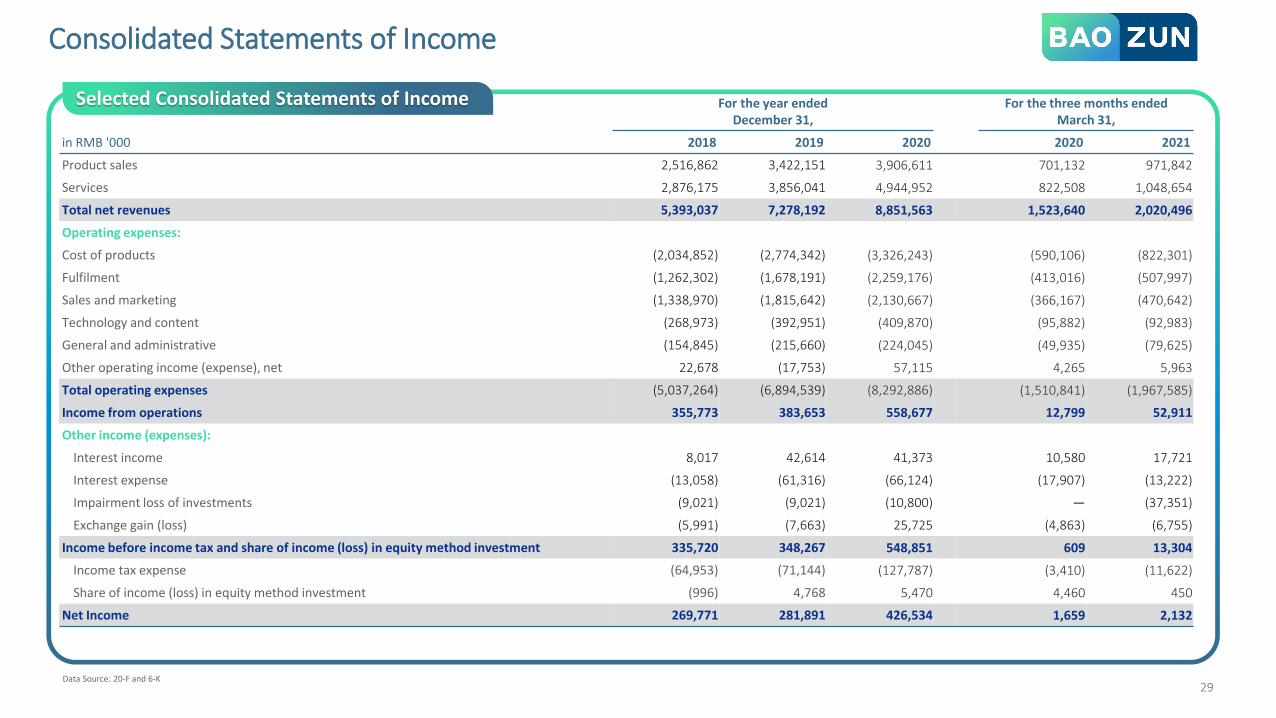
Consolidated Statements of Income
29
For the year ended December 31,
For the three months endedMarch 31,
in RMB '000 2018 2019 2020 2020 2021
Product sales 2,516,862 3,422,151 3,906,611 701,132 971,842
Services 2,876,175 3,856,041 4,944,952 822,508 1,048,654
Total net revenues 5,393,037 7,278,192 8,851,563 1,523,640 2,020,496
Operating expenses:
Cost of products (2,034,852) (2,774,342) (3,326,243) (590,106) (822,301)
Fulfilment (1,262,302) (1,678,191) (2,259,176) (413,016) (507,997)
Sales and marketing (1,338,970) (1,815,642) (2,130,667) (366,167) (470,642)
Technology and content (268,973) (392,951) (409,870) (95,882) (92,983)
General and administrative (154,845) (215,660) (224,045) (49,935) (79,625)
Other operating income (expense), net 22,678 (17,753) 57,115 4,265 5,963
Total operating expenses (5,037,264) (6,894,539) (8,292,886) (1,510,841) (1,967,585)
Income from operations 355,773 383,653 558,677 12,799 52,911
Other income (expenses):
Interest income 8,017 42,614 41,373 10,580 17,721
Interest expense (13,058) (61,316) (66,124) (17,907) (13,222)
Impairment loss of investments (9,021) (9,021) (10,800) — (37,351)
Exchange gain (loss) (5,991) (7,663) 25,725 (4,863) (6,755)
Income before income tax and share of income (loss) in equity method investment 335,720 348,267 548,851 609 13,304
Income tax expense (64,953) (71,144) (127,787) (3,410) (11,622)
Share of income (loss) in equity method investment (996) 4,768 5,470 4,460 450
Net Income 269,771 281,891 426,534 1,659 2,132
Data Source: 20-F and 6-K
Selected Consolidated Statements of Income
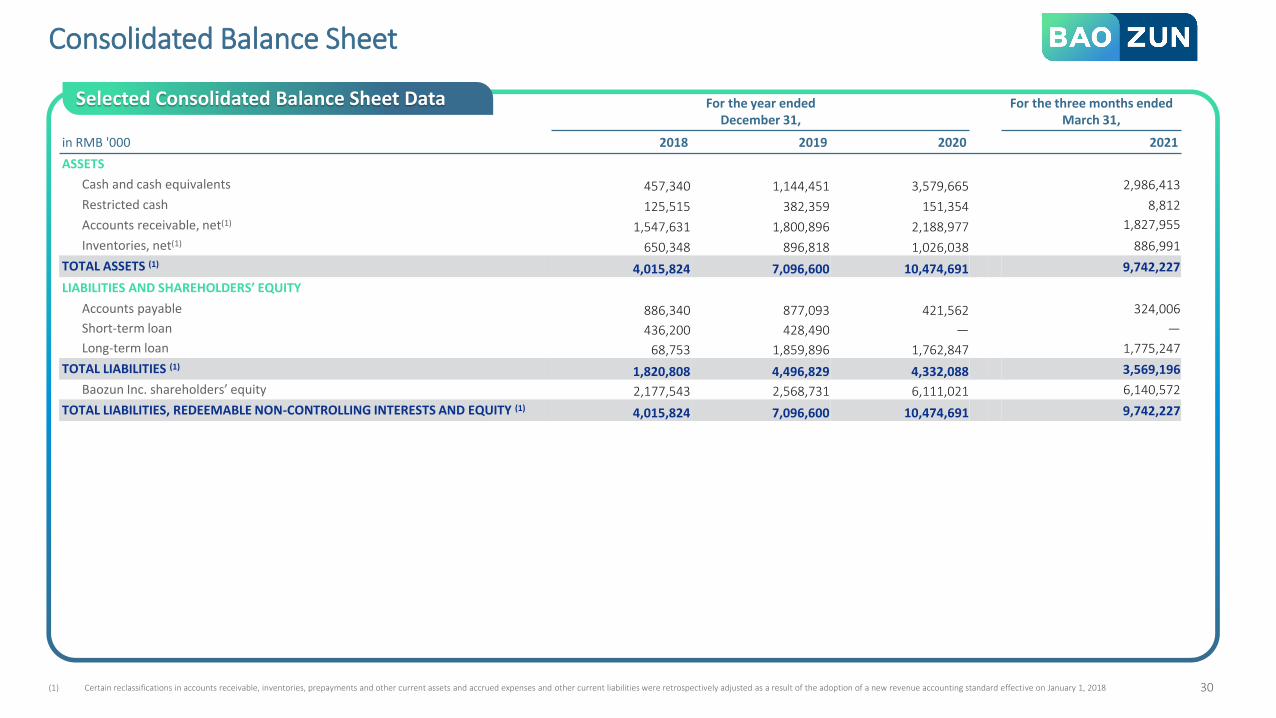
Consolidated Balance Sheet
30
For the year ended December 31,
For the three months endedMarch 31,
in RMB '000 2018 2019 2020 2021
ASSETS
Cash and cash equivalents 457,340 1,144,451 3,579,665 2,986,413
Restricted cash 125,515 382,359 151,354 8,812
Accounts receivable, net(1) 1,547,631 1,800,896 2,188,977 1,827,955
Inventories, net(1) 650,348 896,818 1,026,038 886,991
TOTAL ASSETS (1) 4,015,824 7,096,600 10,474,691 9,742,227
LIABILITIES AND SHAREHOLDERS’ EQUITY
Accounts payable 886,340 877,093 421,562 324,006
Short-term loan 436,200 428,490 — —
Long-term loan 68,753 1,859,896 1,762,847 1,775,247
TOTAL LIABILITIES (1) 1,820,808 4,496,829 4,332,088 3,569,196
Baozun Inc. shareholders’ equity 2,177,543 2,568,731 6,111,021 6,140,572
TOTAL LIABILITIES, REDEEMABLE NON-CONTROLLING INTERESTS AND EQUITY (1) 4,015,824 7,096,600 10,474,691 9,742,227
Selected Consolidated Balance Sheet Data
(1) Certain reclassifications in accounts receivable, inventories, prepayments and other current assets and accrued expenses and other current liabilities were retrospectively adjusted as a result of the adoption of a new revenue accounting standard effective on January 1, 2018
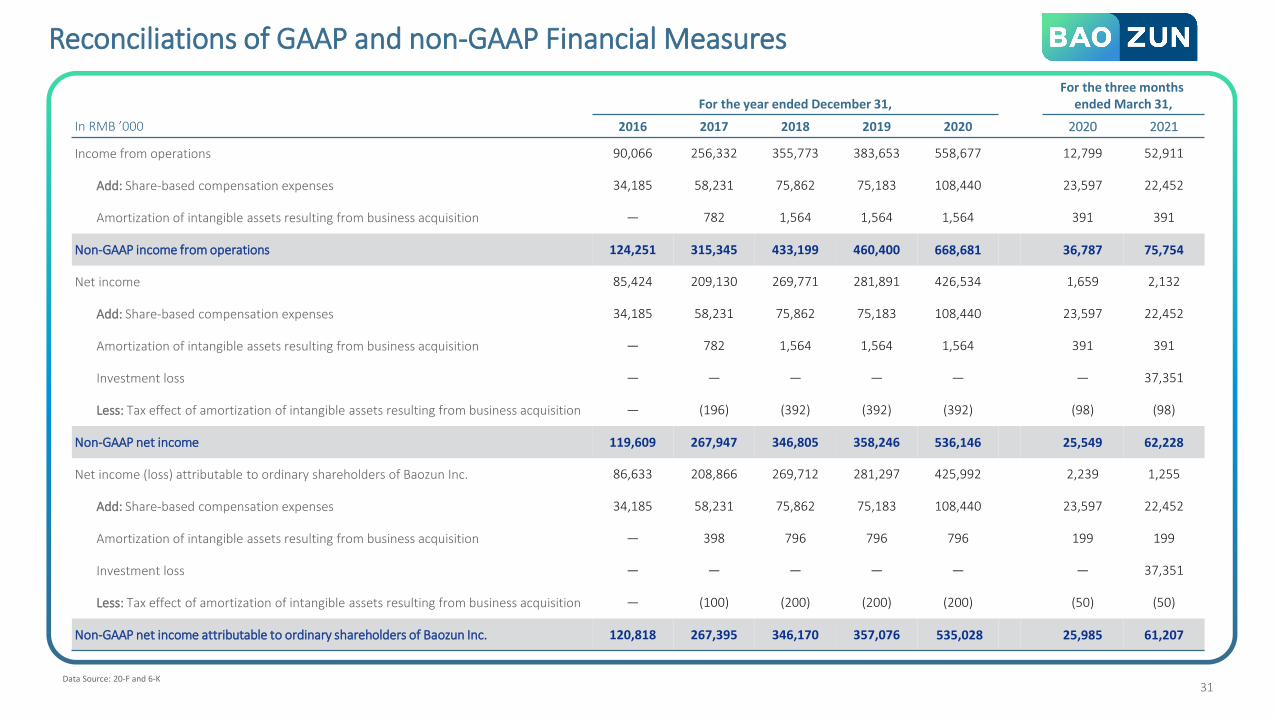
Reconciliations of GAAP and non-GAAP Financial Measures
For the year ended December 31,For the three months
ended March 31,
In RMB ’000 2016 2017 2018 2019 2020 2020 2021
Income from operations 90,066 256,332 355,773 383,653 558,677 12,799 52,911
Add: Share-based compensation expenses 34,185 58,231 75,862 75,183 108,440 23,597 22,452
Amortization of intangible assets resulting from business acquisition — 782 1,564 1,564 1,564 391 391
Non-GAAP income from operations 124,251 315,345 433,199 460,400 668,681 36,787 75,754
Net income 85,424 209,130 269,771 281,891 426,534 1,659 2,132
Add: Share-based compensation expenses 34,185 58,231 75,862 75,183 108,440 23,597 22,452
Amortization of intangible assets resulting from business acquisition — 782 1,564 1,564 1,564 391 391
Investment loss — — — — — — 37,351
Less: Tax effect of amortization of intangible assets resulting from business acquisition — (196) (392) (392) (392) (98) (98)
Non-GAAP net income 119,609 267,947 346,805 358,246 536,146 25,549 62,228
Net income (loss) attributable to ordinary shareholders of Baozun Inc. 86,633 208,866 269,712 281,297 425,992 2,239 1,255
Add: Share-based compensation expenses 34,185 58,231 75,862 75,183 108,440 23,597 22,452
Amortization of intangible assets resulting from business acquisition — 398 796 796 796 199 199
Investment loss — — — — — — 37,351
Less: Tax effect of amortization of intangible assets resulting from business acquisition — (100) (200) (200) (200) (50) (50)
Non-GAAP net income attributable to ordinary shareholders of Baozun Inc. 120,818 267,395 346,170 357,076 535,028 25,985 61,207
31Data Source: 20-F and 6-K

Thank You!