table of contents care market rate...4 new york state child care market rate survey 2015 data...
TRANSCRIPT


TABLE OF CONTENTS
INTRODUCTION ............................................................................................................................................ 3
DATA COLLECTION ........................................................................................................................................ 4
Overview of the Survey Process................................................................................................................ 4
Survey Questionnaire and Interview Script .............................................................................................. 4
Provider Letter .......................................................................................................................................... 4
Stratified Sampling .................................................................................................................................... 4
Provider Types .......................................................................................................................................... 5
County Cluster Groups .............................................................................................................................. 5
DATA ANALYSIS ............................................................................................................................................ 7
Quality Assurance Follow-Up Survey ........................................................................................................ 7
Data Checking and Cleaning...................................................................................................................... 7
Reasonable numerical ranges ....................................................................................................... 7
Internal consistency checks .......................................................................................................... 7
Treatment of flagged values ......................................................................................................... 7
Data Conversions ...................................................................................................................................... 7
NYS weekly payment rates............................................................................................................ 7
NYS daily payment rates ............................................................................................................... 8
NYS part-day payment rates ......................................................................................................... 8
NYS hourly payment rates ............................................................................................................ 8
Legally-exempt child care provider payment rates .................................................................................. 9
2016 NYS Child Care Subsidy Payment Rate Calculations ........................................................................ 9
Summary of Changes in the 2015 NYS Child Care Market Rate Survey .................................................. 10
County cluster groups ................................................................................................................. 10
Age group definitions .................................................................................................................. 10
FDC and GFDC provider types combined .................................................................................... 10
LEGC rates ................................................................................................................................... 10
RESULTS ...................................................................................................................................................... 11
Response Rates ....................................................................................................................................... 11
Child Care Subsidy Payment Rates .......................................................................................................... 11
Rate Changes........................................................................................................................................... 11
RESOURCES ................................................................................................................................................. 12
TABLES ........................................................................................................................................................ 13
APPENDICES ................................................................................................................................................ 21

3 NEW YORK STATE CHILD CARE MARKET RATE SURVEY 2015
INTRODUCTION
The 2015 New York State Child Care Market Rate Survey was conducted on behalf of the New
York State Office of Children and Family Services (OCFS). The survey was administered by
telephone between January 26, 2015 and April 17, 2015 by the Association for the Blind and
Visually Impaired (ABVI), a subcontractor of the New York State Preferred Source Program for
People Who Are Blind (NYSPSP).
Federal statute, 42 USC 9858c(c)(4)(A), and federal regulation, 45 CFR 98.43(a), require that
the state establish payment rates for child care subsidies that are sufficient to ensure equal
access to child care services for eligible children that are comparable to those provided to
families that do not receive child care subsidies. Further, federal regulation 45 CFR 98.43(b)(2)
requires that the state summarize how payment rates are adequate based on a local market
rate survey conducted no earlier than two years prior to the effective date of the currently
approved New York State Child Care and Development Fund Plan. Additionally, section 410-
x(4) of the Social Services Law requires that payment rates must take into account the
variations in the costs of providing child care in different settings, to children in different age
groups, and any additional costs of providing child care for children with special needs.
The 2015 Child Care Market Rate Survey was undertaken to determine the prices that
licensed/registered child care providers charge parents for child care throughout New York
State, and to use that data as the basis for establishing payment rates for the New York State
Child Care Block Grant (NYSCCBG) subsidy program for low-income families. The payment
rates are a ceiling for state and federal reimbursement for payments for child care services
(Section 410-x(4) of the Social Services Law). Payments for child care services under the
NYSCCBG must be only for the actual cost of care up to the applicable payment rate, also
called “the market rates.” It should be noted that the rates reported by child care providers are
the prices that parents are charged for care.

4 NEW YORK STATE CHILD CARE MARKET RATE SURVEY 2015
DATA COLLECTION
Overview of the Survey Process
The 2015 Child Care Market Rate Survey was conducted as a telephone survey with a stratified
random sample of licensed/registered child care providers selected from across New York
State. Participation in the survey was voluntary and anonymous. No incentive was offered to
child care providers for their participation in the survey. Prior to the initiation of telephone calls, a
letter was sent to all licensed/registered child care providers to inform them about the upcoming
survey and to provide them with a one-page, hard-copy questionnaire that was a shortened
version of what they would be asked in the telephone survey. The hard-copy questionnaire was
sent in advance of the telephone survey so that providers could be prepared if they were called
and chose to participate in the survey. Upon completion of data collection by ABVI, all survey
data were sent to OCFS for review and analysis.
Survey Questionnaire and Interview Script
The questionnaire and telephone interview script used in the 2015 Child Care Market Rate
Survey were prepared by OCFS with input from ABVI, as well as the unions that represent
home-based child care providers (registered family day care, licensed group family day care,
enrolled legally-exempt in-home, and enrolled legally-exempt family child care) in New York
State—the Civil Service Employees Association (CSEA), Local 1000, AFSCME, AFL-CIO,
which represents home-based child care providers outside of New York City and United
Federation of Teachers (UFT), which represents home-based child care providers who care for
subsidized children in New York City. The content of the New York State Child Care Market
Rate Survey has remained relatively stable over the past four surveys, particularly the questions
pertaining to the rates charged, which form the bulk of the survey. The survey asked providers
to report on their full-time and part-time rates for four age groups of children. For school-age
children, the survey also asked providers for their rates when school is not in session, such as
holidays and school vacations. The questionnaire differed for center-based providers compared
to home-based providers only in the definition of “Infant” and “Toddler” age groups, in order to
align those categories with the licensing and registration age categories used in determining the
provider’s maximum capacity. A copy of the center-based (Appendix 1) and home-based
(Appendix 2) questionnaires are attached to this report.
Provider Letter
One week prior to the start of the telephone survey, OCFS mailed a letter (Appendix 3) along
with a shortened survey questionnaire to all licensed and registered child care providers to
notify them about the possibility that they could be called over the next three months to be
invited to participate in the Child Care Market Rate Survey. The mailing included a Spanish
translation of both the letter and questionnaire.
Stratified Sampling
The purpose of the Child Care Market Rate Survey was to collect child care rate data that would
be used to establish payment rates for the NYSCCBG subsidy program for low-income families,
such that those payment rates ensure subsidy recipients from across the state are able to
access the full range of provider types. Therefore, a stratified sampling approach was taken,
where statistically valid sample sizes were calculated for each of 20 combinations of provider
type and county cluster group (see below for detailed information on the provider types and five
county clusters).

5 NEW YORK STATE CHILD CARE MARKET RATE SURVEY 2015
Sample size was calculated for each provider type and county cluster stratum using a 95
percent confidence level and five percent margin of error based upon the anticipated provider
universe size. Additionally, the calculated completed survey sample size for each stratum was
increased by two in order to account for fluctuations in the provider universe size and data
error/loss that could occur prior to completion of data collection.
Provider Types
Licensed or registered child care providers in New York State are non-residential/center-based
or home-based. The specific provider types are:
Center-based providers:
o Day Care Centers (DCC). The survey included all DCCs in NYS, including those
located in NYC, which are regulated by NYC Department of Health and Mental
Hygiene.
o School-Age Child Care programs (SACC).
o Small Day Care Centers (SDCC). It should be noted that because there were only
two SDCC providers in the state at the time of the survey, SDCCs were grouped with
DCCs for the survey.
Home-based providers:
o Family Day Care providers (FDC).
o Group Family Day Care providers (GFDC).
In addition to these child care providers, New York State also recognizes three types of legally-
exempt child care, meaning that the providers are not required to be licensed or registered by
New York State. The three legally-exempt provider types are in-home (meaning in the child’s
own home), family child care (in a home that is not the child’s), and group (non-residential
programs that are not required to be licensed or registered, such as summer day camps and
child care programs operated by, and on the grounds of, a school). Legally-exempt child care
providers are required to become enrolled with OCFS if they want to provide care to any
children receiving child care subsidies under the NYSCCBG. There are an unknown number of
additional legally-exempt child care providers who could not be identified by OCFS because
they do not care for any children receiving child care subsidies. As such, legally-exempt
providers could not be included in a representative and valid survey because only a subset of
the entire universe of legally-exempt providers were known to OCFS and reachable. Therefore,
the universe of child care providers for the 2015 Child Care Market Rate Survey was composed
of licensed/registered child care providers only.
County Cluster Groups
There are 58 local social services districts (referred to as “districts” in this report) in New York
State that administer the child care subsidy program within the district. Each district consists of
a single county, except for the district of New York City, which comprises the five boroughs,
each of which is a county. The number of licensed/registered child care providers varies
considerably across New York State (Table 1). Many districts have too few licensed/registered
child care providers to reliably conduct a survey and establish maximum payment rates that are
representative of the population of child care providers in that provider type and county.
Therefore, districts are clustered in order to attain statistically valid and reliable samples for
each provider type (DCC, SACC, FDC, and GFDC) and age group (infant, toddler, preschool,
school-age). These are called county clusters.

6 NEW YORK STATE CHILD CARE MARKET RATE SURVEY 2015
The composition of the five county clusters was first established over ten years ago based on
cost of care data from a mail-in child care provider rate survey. Prior to conducting the 2015
Child Care Market Rate Survey, a cluster analysis was performed using the 2013 Child Care
Market Rate Survey data (the most recent previous survey) in order to assess the composition
of county cluster groupings and whether those county groupings should be changed. Cluster
analysis is a statistical technique that sorts data into groups in such a way that the members
within a group are more similar to each other than to the members of other groups. Cluster
analysis of the 2013 rate data indicated that the rates for Saratoga County were more similar to
cluster 4 than cluster 2. Based on that, the 2015 Child Care Market Rate Survey was conducted
with Saratoga in cluster 4 instead of cluster 2, including sample size calculations and data
collection. The county clusters for the 2015 survey are as follows.
Cluster 1: Nassau, Putnam, Rockland, Suffolk, Westchester
Cluster 2: Columbia, Erie, Monroe, Onondaga, Ontario, Rensselaer, Schenectady,
Tompkins, Warren
Cluster 3: Allegany, Broome, Cattaraugus, Cayuga, Chautauqua, Chemung, Chenango,
Clinton, Cortland, Delaware, Essex, Franklin, Fulton, Genesee, Greene, Hamilton,
Herkimer, Jefferson, Lewis, Livingston, Madison, Montgomery, Niagara, Oneida,
Orleans, Oswego, Otsego, Schoharie, Schuyler, Seneca, St. Lawrence, Steuben,
Sullivan, Tioga, Washington, Wayne, Wyoming, Yates
Cluster 4: Albany, Dutchess, Orange, Saratoga, Ulster
Cluster 5: Bronx, Brooklyn, New York, Queens, Staten Island

7 NEW YORK STATE CHILD CARE MARKET RATE SURVEY 2015
DATA ANALYSIS
Upon completion of data collection by ABVI, all survey data were sent to OCFS for review and
analysis.
Quality Assurance Follow-Up Survey
OCFS conducted a random follow-up survey with a small number of providers to confirm the
accuracy of the data collected by ABVI.
Data Checking and Cleaning
Reasonable numerical ranges
OCFS checked the data by flagging values outside of reasonable numerical ranges
separately for part-time, full-time, school-age child care, hourly, daily, weekly,
monthly, and yearly rates.
Internal consistency checks
OCFS flagged inconsistencies in rates for individual providers. For a given provider,
part-time weekly, monthly, and yearly rates should be no more than full-time weekly,
monthly, and yearly rates. For a given provider, the rates for older children are
expected to be no more than the rates for younger children.
Treatment of flagged values
Each flagged value was compared to an individual provider’s other rates as well as
to the rates of other providers of the same provider type and county cluster in order
to identify correctable errors. An example of a correctable data entry error would be
a flagged rate of $300 per day for infants. The same provider reported rates of $275
per week for toddlers and $250 per week for preschoolers. The rate of $300 per day
for infants was flagged because it was beyond the reasonable numerical range and
was well beyond the highest rate reported by all other providers per day for infants.
Because a rate of $300 per week was consistent with the provider’s other rates and
the rates reported by other providers of the same provider type and county cluster,
the value was changed to $300 per week. If a correction could not be determined for
a flagged value, then the recorded values were kept in the dataset unchanged.
Data Conversions
The 2015 Child Care Market Rate Survey collected price data from child care providers as the
price charged on a per-hour, -day, -week, -month, or -year basis. However, the NYS child care
subsidy payment rate structure includes the following rate types: hourly, part-day, daily, and
weekly. Whenever possible, the price data that was reported by providers was used as
reported. When a provider’s price structure could not be directly mapped to a NYS child care
subsidy payment rate, then the original price data were converted as follows.
NYS weekly payment rates
Used full-time price data.
Per-week prices had no conversion.
Per-day prices were multiplied by 5.
Per-month prices were divided by 4.33.

8 NEW YORK STATE CHILD CARE MARKET RATE SURVEY 2015
Per-year prices were divided by 52 for infants, toddlers, preschool-age children,
and for school-age children if prices were greater than or equal to $5,000. Per-
year prices were divided by 16 for school-age children if prices were less than
$5,000. Fifty-two was chosen for converting the per-year rates for infants,
toddlers, and preschool-age children because there are 52 weeks in a year and
those children are likely to be in full-time care on a year-round basis. However,
16 was used for converting the per-year rates for school age children because
the school year is 180 days, or about 36 weeks. The remaining 16 weeks per
year when school is not in session is the time when school-age children are more
likely to be in full-time care.
NYS daily payment rates
Used a combination of full-time and part-time price data.
For infant, toddler, and preschool-age children:
Per day prices (either full-time or part-time) had no conversion and
were used as the daily rate whenever reported regardless of whether
additional rates were also reported for the same age group. If both
full-time and part-time rates were reported for the same age group,
then the higher rate was used.
If there was no per-day rate reported for a particular age group, then
the maximum converted rate (per-week, per-month, or per-year) was
used.
Per-week part-time prices were divided by 5.
Per-month part-time prices were divided by 21.65.
Per-year part-time prices were divided by 260.
When hours per week were reported, conversions took this into
account. Rates were converted as above if they covered 20 hours per
week or more. If rates covered fewer than 20 hours per week, then
the converted rate was pro-rated to a 25-hour week.
For school-age children:
Full-time per-day or “School Not In Session” per-day prices had no
conversion.
Full-time per-week or “School Not In Session” per-week prices were
divided by 5.
Full-time per-month or “School Not In Session” per-month prices were
divided by 21.65.
NYS part-day payment rates
Calculated as two-thirds of the NYS daily payment rates. The Child Care Market
Rate survey did not include questions on the cost of part-day care, but the NYS
payment rates include a part-day category which covers half the amount of time
as the daily payment rates (3-6 hours compared to 6-12 hours). To calculate a
part-day payment rate, two-thirds (instead of one half) of the daily rate was
chosen to reflect economies of scale, i.e., higher per-hour cost for a lower
number of hours in care.
NYS hourly payment rates
No conversions were applied for this rate. The highest per-hour prices reported
by each provider for each age group were used without conversion.

9 NEW YORK STATE CHILD CARE MARKET RATE SURVEY 2015
Legally-exempt child care provider payment rates
Legally-exempt child care providers are not required to be licensed or registered by NYS.
Therefore, legally-exempt child care providers were not included in the survey because OCFS
could not identify the entirety of the universe of legally-exempt child care providers in NYS, and
as such could not select a representative sample with which to conduct the survey.
NYS legally-exempt child care family and in-home provider standard rates were
calculated as 65 percent of the corresponding registered family day care rates for
each county group, age group, and rate type.
NYS legally-exempt family and in-home child care provider enhanced rates were
calculated as 70 percent of the corresponding registered family day care rates for
each county group, age group, and rate type. The enhanced rate is available to
legally-exempt child care family and in-home providers who have demonstrated
to the enrollment agency that they have completed ten or more hours of training
annually in the areas set forth in section 390-a(3)(b) of the Social Services Law.
Districts have the option to increase the enhanced rate for eligible legally-exempt
family and in-home child providers up to a maximum of 75 percent of the
corresponding registered family day care rates for each county group, age group,
and rate type.
NYS legally-exempt group child care provider rates were calculated as 75
percent of the corresponding licensed day care center rates for each county
group, age group, and rate type.
2016 NYS Child Care Subsidy Payment Rate Calculations
2016 child care subsidy payment rates were established at the 69th percentile of the 2015 NYS
Child Care Market rate survey provider rates per county cluster, provider type, age group, and
rate type.
County Clusters: 1 (Long Island and metro north), 2 (upstate-urban), 3 (upstate-
rural), 4 (upstate-metro north & capital), 5 (NYC).
Provider Types: Day Care Centers (DCC), School-Age Child Care (SACC),
Family Day Care (FDC) and Group Family Day (GFDC) combined, Legally-
Exempt Group Care (LEGC), and Legally-Exempt Family Child Care (LEFC) and
Legally-Exempt In-Home Child Care (LEIH) combined.
Age Groups: Infant (defined as less than 18 months for DCCs, less than 2 years
for FDCs and GFDCs), Toddler (defined as 18 months through 2 years for DCCs,
2 years old for FDCs and GFDCs), Preschool (defined as 3 through 5 years),
School-Age (defined as 6 through 12 years).
Rate Types: Weekly, Daily, Part-Day, Hourly.
A percentile is a statistical measure which indicates the value below which a given percentage
of observations fall. For example, the 69th percentile rate was the rate below which 69 percent of
all rates could be found. Or, in other words, roughly seven out of ten providers charged a rate
that was at or below the 69th percentile rate. And conversely, roughly three out of ten providers
charged a rate that was at or above the 69th percentile rate. Percentiles are particularly useful
here because outliers and skewed data distributions will have a much smaller impact on a
percentile than they would on measures of central tendency, such as an average.

10 NEW YORK STATE CHILD CARE MARKET RATE SURVEY 2015
Summary of Changes in the 2015 NYS Child Care Market Rate Survey
County cluster groups
The composition of county cluster groups was reassessed in advance of the 2015
survey using the 2013 survey data. Cluster analysis indicated that Saratoga County’s
rates were most similar to those counties in county cluster 4. Therefore, Saratoga
County was moved from county cluster 2 to county cluster 4.
Age group definitions
The “infant” and “toddler” definitions were changed for FDC and GFDC providers’
rates in order to align with capacity definitions for home-based providers. Prior to the
2015 NYS Child Care Market Rate Survey, “infant” was defined as less than 18
months and “toddler” was defined as 18 months through 2 years for all provider
types, including FDC and GFDC providers. FDC and GFDC providers must have one
caregiver present for every two children under the age of two years. In addition, the
“infant” and “toddler” definitions were changed for LEFC and LEIH providers’ rates
because legally-exempt home-based provider’s rates are based on a percentage of
the applicable market rate for FDC providers.
FDC and GFDC provider types combined
Prior to the 2015 survey, FDC and GFDC providers’ data were analyzed separately
and resulted in different sets of child care subsidy payment rates for the two provider
types. FDC and GFDC providers’ data were combined for analysis of the 2015
survey data and a single set of child care subsidy payment rates will apply to both
provider types. These two provider types were combined because the health and
safety regulations, including staff/child ratios, governing the two provider types have
become much the same over the years, with the primary regulatory distinction
between the two provider types being capacity.
LEGC rates
In NYS, families receiving child care subsidies may choose child care providers who
are legally-exempt from licensing or registration with OCFS. The total universe of
such providers is unknown because there is no licensing/registration requirement
and, therefore, they cannot be included in the Child Care Market Rate Survey in a
representative manner. LEGC providers’ child care subsidy payment rates are
calculated as a percentage of DCC rates, which are derived from the prices reported
by DCC providers in the survey. Prior to the 2015 survey, LEGC child care subsidy
payment rates were set at 100 percent of DCC rates. Beginning with the 2015 survey
(2016 child care subsidy payment rates), LEGC child care subsidy payment rates
were set at 75 percent of licensed DCC rates. LEGC providers are not subject to the
same rigorous health and safety requirements or high staff/child ratios as are
licensed and registered child care providers. Using a percentage of the equivalent
licensed/registered provider type is the same methodology that is used to establish
payment rates for LEFC and LEIH, which are a percentage of FDC rates. The
percentage 75 percent was selected because it is the maximum percentage that
districts may elect to use to set enhanced rates for LEFC and LEIH providers.

11 NEW YORK STATE CHILD CARE MARKET RATE SURVEY 2015
RESULTS
Response Rates
Out of a total of 20,535 licensed and registered child care providers as of January 2015, 13,990
providers were randomly selected to be contacted and invited to participate in the child care
market rate survey. Of those 13,990 providers, 2,366 were not eligible to participate in the
survey because they had closed, were not able to be contacted, or were exclusively Head Start
programs (i.e., parents were never charged a fee). Of the remaining 11,624 providers with
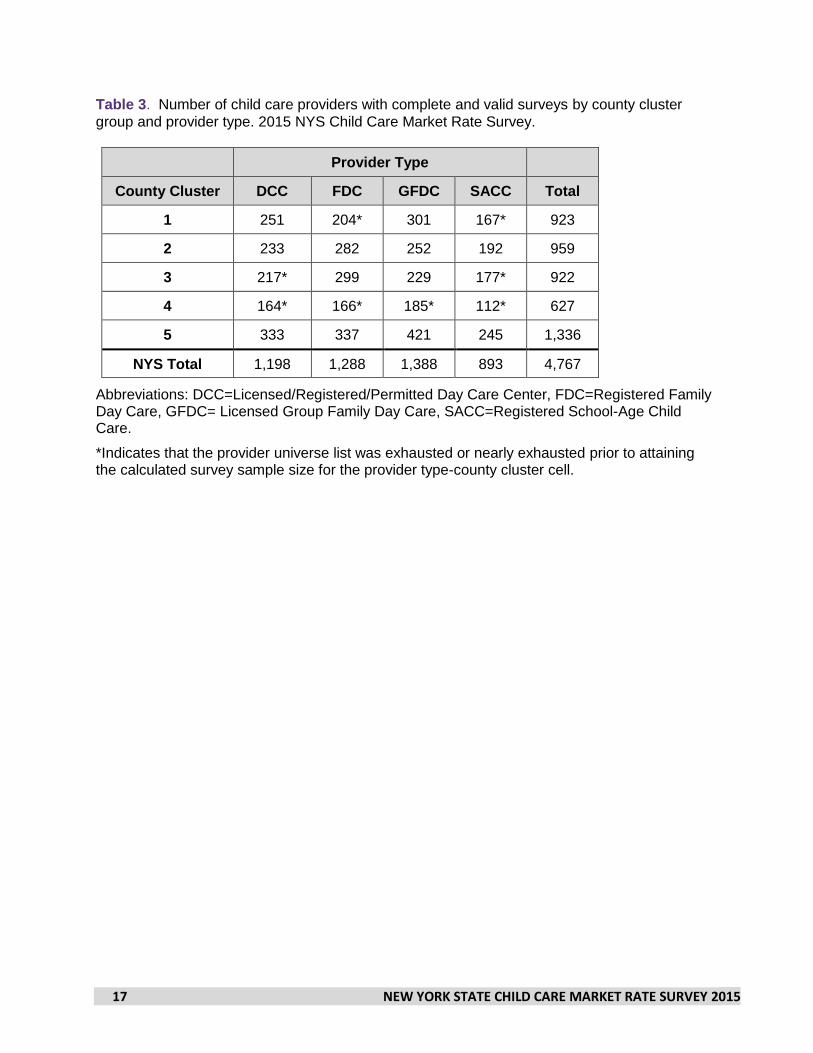
survey attempts (Table 2), 4,767 providers completed the market rate survey (Table 3), for an
overall response rate of 41 percent (Table 4).
Child Care Subsidy Payment Rates
The 2016 NYS child care subsidy payment rates (Table 5) were established at the 69th
percentile of the rates reported in the 2015 NYS child care market rate survey for each county
cluster, provider type, age group, and rate type. Likewise, the 2014 NYS child care subsidy
payment rates were established at the 69th percentile of the rates reported in the 2013 survey.
In 2014 and 2016, NYS chose to set payment rates at the 69th percentile of the most recent
child care market rate survey as a means of balancing the need to establish payment rates that
provide parents receiving child care subsidies with broad access to available child care
providers while simultaneously limiting the reduction in the number of families who could be
served by funds available under the NYSCCBG.
The payment rates for a child with special needs were set at the highest child care subsidy
payment rates in the state, irrespective of age, county group, or provider type for each type of
rate, weekly $371, daily $60, part-day $40, and hourly $17.00.
Rate Changes
Additionally, providers were asked whether their rates had changed in the past year, and if so,
what the reasons for the changes were. The majority of providers (67 percent) reported that
their rates had not changed in the past year, 29 percent of providers reported that their rates
had increased, and four percent of providers reported decreased rates. Over half of providers
who reported rate increases attributed the increases to food and supply costs, salary increases,
and/or utility costs (Table 6). Over one-third of those providers indicated that building costs,
insurance, and/or training were reasons for price increases. The most common reason given by
providers who reported rate decreases was “to be more competitive.”

12 NEW YORK STATE CHILD CARE MARKET RATE SURVEY 2015
RESOURCES
OCFS issues external policy statements on a regular basis on the topic of child care subsidy
market rates, which are available on the website at http://ocfs.ny.gov/main/policies/external/.
These policy statements include the payment rates for child care subsidy, as well as policy
pertaining to calculating payments for child care subsidies.
16-OCFS-LCM-18 14-OCFS-LCM-03 11-OCFS-LCM-12 10-OCFS-LCM-01 08-OCFS-LCM-10 05-OCFS-LCM-17 04-OCFS-LCM-07 02-OCFS-LCM-16 00-OCFS-ADM-01

13 NEW YORK STATE CHILD CARE MARKET RATE SURVEY 2015
TABLES
Table 1. Distribution of licensed/registered child care provider universe in NYS by county and
provider type, January 2015.
Table 2. Number of child care providers with attempted surveys by county cluster group and
provider type (survey attempts includes providers with complete surveys, incomplete surveys,
refusals, and unanswered call attempts).
Table 3. Number of child care providers with complete and valid surveys by county cluster
group and provider type.
Table 4. Response rates (child care providers with complete and valid surveys divided by
providers with survey attempts) by county cluster group and provider type.
Table 5. 2016 NYS child care subsidy payment rates per county cluster group, provider type,
age group, and rate type. Based on the 69th percentile of the 2015 NYS Child Care Market Rate
Survey.
Table 6. Reasons reported for increases and decreases in the rates that providers charge and
the reasons for those changes.

14 NEW YORK STATE CHILD CARE MARKET RATE SURVEY 2015
Table 1. Distribution of licensed/registered child care provider universe in NYS by county and
provider type, January 2015.
County
Cluster
Provider Type Total
County DCC FDC GFDC SACC
1
Nassau 200 116 540 118 974
Putnam 28 12 22 11 73
Rockland 64 63 122 33 282
Suffolk 196 167 319 104 786
Westchester 190 146 283 122 741
678 504 1,286 388 2,856
2
Columbia 13 14 17 8 52
Erie 201 93 171 122 587
Monroe 136 387 278 76 877
Onondaga 77 211 126 62 476
Ontario 17 49 15 14 95
Rensselaer 29 51 23 33 136
Schenectady 34 72 49 22 177
Tompkins 22 30 29 18 99
Warren 14 29 10 9 62
543 936 718 364 2,561
3
Allegany 10 13 10 11 44
Broome 32 53 17 27 129
Cattaraugus 13 22 11 7 53
Cayuga 14 36 13 13 76
Chautauqua 21 46 26 16 109
Chemung 18 51 20 18 107
Chenango 6 29 14 4 53
Clinton 19 58 40 12 129
Cortland 19 22 9 13 63
Delaware 12 37 6 2 57
Essex 12 33 5 5 55
Franklin 14 37 16 4 71
Fulton 9 14 11 6 40
Genesee 11 16 11 10 48
Greene 6 17 6 3 32
Hamilton 0 2 1 0 3
Herkimer 8 27 20 7 62
Jefferson 13 63 27 21 124
Lewis 4 11 0 3 18
Livingston 8 23 18 7 56

15 NEW YORK STATE CHILD CARE MARKET RATE SURVEY 2015
County
Cluster
Provider Type Total
County DCC FDC GFDC SACC
Madison 11 23 11 5 50
Montgomery 9 15 11 5 40
Niagara 39 46 25 32 142
Oneida 38 95 41 28 202
Orleans 9 7 8 3 27
Oswego 12 50 20 13 95
Otsego 15 29 9 1 54
Schoharie 8 9 9 2 28
Schuyler 2 12 4 2 20
Seneca 3 22 4 1 30
St. Lawrence 12 59 21 1 93
Steuben 29 62 24 14 129
Sullivan 12 29 19 7 67
Tioga 5 17 9 5 36
Washington 7 23 29 2 61
Wayne 20 33 16 5 74
Wyoming 5 14 8 4 31
Yates 4 18 3 0 25
489 1,173 552 319 2,533
4
Albany 70 73 71 64 278
Dutchess 65 68 74 28 235
Orange 59 61 99 44 263
Saratoga 43 72 64 36 215
Ulster 40 78 42 10 170
277 352 350 182 1,161
5
Bronx 315 1,026 1,881 322 3,544
Brooklyn 844 440 1,608 492 3,384
Manhattan 508 468 495 287 1,758
Queens 499 275 1,215 332 2,321
Staten Island 117 31 207 62 417
2,283 2,240 5,406 1,495 11,424
NYS Total 4,270 5,205 8,312 2,748 20,535
Abbreviations: DCC=Licensed/Registered/Permitted Day Care Center, FDC=Registered Family Day Care, GFDC= Licensed Group Family Day Care, SACC=Registered School-Age Child Care.

16 NEW YORK STATE CHILD CARE MARKET RATE SURVEY 2015
Table 2. Number of child care providers with attempted surveys by county cluster group and
provider type (survey attempts includes providers with complete surveys, incomplete surveys,
refusals, and unanswered call attempts). Excludes providers who were not eligible to participate
in the survey because they had closed, were not able to be contacted, or were exclusively Head
Start programs (i.e., parents were never charged a fee). 2015 NYS Child Care Market Rate
Survey.
Provider Type
County Cluster DCC FDC GFDC SACC Total
1 474 416 831 334 2,055
2 377 675 612 303 1,967
3 293 763 481 273 1,810
4 223 309 331 150 1,013
5 1,022 1,497 1,478 782 4,779
NYS Total 2,389 3,660 3,733 1,842 11,624
Abbreviations: DCC=Licensed/Registered/Permitted Day Care Center, FDC=Registered Family Day Care, GFDC= Licensed Group Family Day Care, SACC=Registered School-Age Child Care.
17 NEW YORK STATE CHILD CARE MARKET RATE SURVEY 2015
Table 3. Number of child care providers with complete and valid surveys by county cluster
group and provider type. 2015 NYS Child Care Market Rate Survey.
Provider Type
County Cluster DCC FDC GFDC SACC Total
1 251 204* 301 167* 923
2 233 282 252 192 959
3 217* 299 229 177* 922
4 164* 166* 185* 112* 627
5 333 337 421 245 1,336
NYS Total 1,198 1,288 1,388 893 4,767
Abbreviations: DCC=Licensed/Registered/Permitted Day Care Center, FDC=Registered Family Day Care, GFDC= Licensed Group Family Day Care, SACC=Registered School-Age Child Care.
*Indicates that the provider universe list was exhausted or nearly exhausted prior to attaining the calculated survey sample size for the provider type-county cluster cell.

18 NEW YORK STATE CHILD CARE MARKET RATE SURVEY 2015
Table 4. Response rates (child care providers with complete and valid surveys divided by
providers with survey attempts) by county cluster group and provider type. 2015 NYS Child
Care Market Rate Survey.
Provider Type
County Cluster DCC FDC GFDC SACC Total
1 53% 49%* 36% 50%* 45%
2 62% 42% 41% 63% 49%
3 74%* 39% 48% 65%* 51%
4 74%* 54%* 56%* 75%* 62%
5 33% 23% 28% 31% 28%
NYS Total 50% 35% 37% 48% 41%
Abbreviations: DCC=Licensed/Registered/Permitted Day Care Center, FDC=Registered Family Day Care, GFDC= Licensed Group Family Day Care, SACC=Registered School-Age Child Care.
* Indicates that the provider universe list was exhausted or nearly exhausted prior to attaining the calculated survey sample size for the provider type-county cluster cell.

19 NEW YORK STATE CHILD CARE MARKET RATE SURVEY 2015
Table 5. 2016 NYS child care subsidy payment rates per county cluster group, provider type, age group, and rate type. Based on
the 69th percentile of the 2015 NYS Child Care Market Rate Survey.
Weekly Daily Part-Day Hourly
County Cluster
Provider Type I T PS SA I T PS SA I T PS SA I T PS SA
1
DCC/SACC $350 $312 $289 $290 $60 $57 $50 $57 $40 $38 $33 $38 $9.50 $10.00 $10.00 $10.00
FDC/GFDC $295 $275 $275 $265 $60 $55 $53 $51 $40 $37 $35 $34 $10.00 $10.00 $10.00 $10.00
LEGC $217 $218 $38 $43 $25 $29 $7.50 $7.50
LE-Std $192 $179 $179 $172 $39 $36 $34 $33 $26 $24 $23 $22 $6.50 $6.50 $6.50 $6.50
LE-Enh $207 $193 $193 $186 $42 $39 $37 $36 $28 $26 $25 $24 $7.00 $7.00 $7.00 $7.00
2
DCC/SACC $259 $242 $225 $200 $53 $49 $45 $42 $35 $33 $30 $28 $9.00 $8.50 $8.25 $8.00
FDC/GFDC $185 $175 $175 $165 $40 $36 $35 $34 $27 $24 $23 $23 $6.00 $6.00 $6.00 $6.00
LEGC $169 $150 $34 $32 $23 $21 $6.19 $6.00
LE-Std $120 $114 $114 $107 $26 $23 $23 $22 $18 $16 $15 $15 $3.90 $3.90 $3.90 $3.90
LE-Enh $130 $123 $123 $116 $28 $25 $25 $24 $19 $17 $16 $16 $4.20 $4.20 $4.20 $4.20
3
DCC/SACC $200 $190 $180 $170 $43 $41 $38 $37 $29 $27 $25 $25 $7.00 $7.50 $7.50 $7.00
FDC/GFDC $150 $150 $150 $143 $33 $30 $30 $30 $22 $20 $20 $20 $5.00 $5.00 $5.00 $5.00
LEGC $135 $128 $29 $28 $19 $19 $5.63 $5.25
LE-Std $98 $98 $98 $93 $21 $20 $20 $20 $14 $13 $13 $13 $3.25 $3.25 $3.25 $3.25
LE-Enh $105 $105 $105 $100 $23 $21 $21 $21 $15 $14 $14 $14 $3.50 $3.50 $3.50 $3.50
4
DCC/SACC $262 $247 $225 $220 $56 $51 $46 $46 $37 $34 $31 $31 $8.50 $8.25 $8.50 $9.00
FDC/GFDC $225 $200 $200 $200 $45 $45 $42 $40 $30 $30 $28 $27 $8.75 $8.00 $8.00 $8.00
LEGC $169 $165 $35 $35 $23 $23 $6.38 $6.75
LE-Std $146 $130 $130 $130 $29 $29 $27 $26 $20 $20 $18 $18 $5.69 $5.20 $5.20 $5.20
LE-Enh $158 $140 $140 $140 $32 $32 $29 $28 $21 $21 $20 $19 $6.13 $5.60 $5.60 $5.60
5
DCC/SACC $371 $268 $242 $210 $59 $51 $46 $42 $39 $34 $31 $28 $15.75 $17.00 $15.75 $9.00
FDC/GFDC $200 $185 $175 $160 $37 $35 $33 $32 $25 $23 $22 $21 $12.00 $12.00 $10.00 $12.00
LEGC $182 $158 $35 $32 $23 $21 $11.81 $6.75
LE-Std $130 $120 $114 $104 $24 $23 $21 $21 $16 $15 $14 $14 $7.80 $7.80 $6.50 $7.80
LE-Enh $140 $130 $123 $112 $26 $25 $23 $22 $18 $16 $15 $15 $8.40 $8.40 $7.00 $8.40
Abbreviations: I=infant, T=toddler, PS=preschooler, SA=school-age, DCC=licensed/registered/permitted day care center, FDC=registered family day care, GFDC=licensed group family day care, LE-Std=legally-exempt family and in-home child care standard rate, LE-Enh=legally-exempt family and in-home child care enhanced rate, LEGC=legally-exempt group child care, SACC=registered school-age child care.

20 NEW YORK STATE CHILD CARE MARKET RATE SURVEY 2015
Table 6. Reasons reported for increases and decreases in the rates that providers charge and
the reasons for those changes. 2015 NYS Child Care Market Rate Survey.
Rate Increases (n=1,368)
Reason* # % of Providers
with Rate Increases
% of Providers with Completed Surveys (4,767)
Food and supplies 982 71.8% 20.6%
Salary 951 69.5% 19.9%
Utilities 765 55.9% 16.0%
Building costs 596 43.6% 12.5%
Insurance 577 42.2% 12.1%
Training 474 34.6% 9.9%
Health insurance 388 28.4% 8.1%
Other 404 29.5% 8.5%
Rate Decreases (n=177)
Reason* # % of Providers
with Rate Decreases
% of Providers with Completed Surveys (4,767)
To be more competitive 70 39.5% 1.5%
Fewer children in care 42 23.7% 0.9%
Decreased costs 19 10.7% 0.4%
More children in care 10 5.6% 0.2%
Other 109 61.6% 2.3%
*Reasons are not mutually exclusive. Providers could select any and all reasons for their rate increase or decrease.

21 NEW YORK STATE CHILD CARE MARKET RATE SURVEY 2015
APPENDICES
Appendix 1. New York State Child Care Rate Survey for center-based licensed and registered
child care providers (provider types DCC and SACC).
Appendix 2. New York State Child Care Rate Survey for home-based licensed and registered
child care providers (provider types FDC and GFDC).
Appendix 3. Letter to child care providers introducing the 2015 Child Care Market Rate
Survey.

Appendix 1
NEW YORK STATE CHILD CARE RATE SURVEY – 2015 – DCC/SACC
1) How many children are currently enrolled in your child care program by age group?
__________ Infants (Up to 18 months)
__________ Toddlers (18 months to 36 months)
__________ Preschool children (3 years thru 5 years)
__________ School age children (6 years thru 12 years) __________ Children over 12 years with special needs
2) Of the children currently enrolled, how is their care paid for? Check ONE of the following:
ONLY private pay.
BOTH private pay AND the County Department of Social Services (or in NYC by ACS or HRA).
ONLY the County DSS (or in New York City by ACS or HRA).
3 and 4) If you have had any PRIVATE PAY clients during the past 6 months, please answer the questions below using the rates you
charge PRIVATE PAY clients, not the rates you charge for children paid for by the County DSS (or in NYC by ACS or HRA). If you
have only served children paid for by the County DSS (or in NYC by ACS or HRA) during the past 6 months, please give your rates for
those children. If you have more than one rate for an age group, you can give more than one rate.
3a) What is the rate you charge for FULL-TIME care for children in each age
group?
AND 3b) How many hours per week
do FT rates normally cover?
INFANT
(Up to 18 months) $_____per hour $_____per day $_____per week $_____per month $_____per year
____hours/week
TODDLER
(18 to 36 months) $_____per hour $_____per day $_____per week $_____per month $_____per year
____hours/week
PRESCHOOL
(3 thru 5 years) $_____per hour $_____per day $_____per week $_____per month $_____per year
____hours/week
SCHOOL AGE (6 years thru 12 years) - SCHOOL NOT IN SESSION, e.g. summer, holidays
$_____per hour $_____per day $_____per week $_____per month $_____per year
____hours/week
4a) What is the rate you charge for PART-TIME care for children in each age group? If
you have hourly rates and rates for any other period (for example, hourly and daily rates),
please give both rates. For school age children, please give all applicable rates. AND
4b) How many hours
per week do PT rates
normally cover?
INFANT
(Up to 18 months) $_____per hour $_____per day $_____per week $_____per month $_____per year
____hours/week
TODDLER
(18 to 36 months) $_____per hour $_____per day $_____per week $_____per month $_____per year
____hours/week
PRESCHOOL
(3 thru 5 years) $_____per hour $_____per day $_____per week $_____per month $_____per year
____hours/week
SCHOOL AGE (6 years thru 12 years) - SCHOOL IN SESSION
Before School $_____per hour $_____per day $_____per week $_____per month $_____per year
After School $_____per hour $_____per day $_____per week $_____per month $_____per year
Before & After
School $_____per hour $_____per day $_____per week $_____per month $_____per year
____hours/week
____hours/week
____hours/week
SCHOOL AGE (6 years thru 12 years) - SCHOOL NOT IN SESSION, e.g. summer, holidays
$_____per hour $_____per day $_____per week $_____per month $_____per year
____hours/week
5a) Have any of your rates increased in the past year? 6a) Have any of your rates decreased in the past year? 5b) If yes, why? (check all that apply) 6b) If yes, why? (check all that apply)
___ Salary ___ Utilities ___ To be more competitive
___ Health Insurance ___ Building Costs ___ Fewer children in care
___ Insurance ___ Fewer children in care ___ More children in care
___ Training ___ More Children in care ___ Decreased costs
___ Food and Supplies ___ Other ___ Other

APPENDIX 2
NEW YORK STATE CHILD CARE RATE SURVEY – 2015 – FDC/GFDC
1) How many children are currently enrolled in your child care program by age group?
__________ Infants (Under 2 years)
__________ Toddlers (2 years)
__________ Preschool children (3 years thru 5 years)
__________ School age children (6 years thru 12 years) __________ Children over 12 years with special needs
2) Of the children currently enrolled, how is their care paid for? Check ONE of the following:
ONLY private pay.
BOTH private pay AND the County Department of Social Services (or in NYC by ACS or HRA).
ONLY the County DSS (or in New York City by ACS or HRA).
3 and 4) If you have had any PRIVATE PAY clients during the past 6 months, please answer the questions below using the rates you
charge PRIVATE PAY clients, not the rates you charge for children paid for by the County DSS (or in NYC by ACS or HRA). If you
have only served children paid for by the County DSS (or in NYC by ACS or HRA) during the past 6 months, please give your rates for
those children. If you have more than one rate for an age group, you can give more than one rate.
3a) What is the rate you charge for FULL-TIME care for children in each age
group?
AND 3b) How many hours per week
do FT rates normally cover?
INFANT
(Under 2 years) $_____per hour $_____per day $_____per week $_____per month $_____per year
____hours/week
TODDLER
(2 years) $_____per hour $_____per day $_____per week $_____per month $_____per year
____hours/week
PRESCHOOL
(3 thru 5 years) $_____per hour $_____per day $_____per week $_____per month $_____per year
____hours/week
SCHOOL AGE (6 years thru 12 years) - SCHOOL NOT IN SESSION, e.g. summer, holidays
$_____per hour $_____per day $_____per week $_____per month $_____per year
____hours/week
4a) What is the rate you charge for PART-TIME care for children in each age group? If
you have hourly rates and rates for any other period (for example, hourly and daily rates),
please give both rates. For school age children, please give all applicable rates. AND
4b) How many hours
per week do PT rates
normally cover?
INFANT
(Under 2 years) $_____per hour $_____per day $_____per week $_____per month $_____per year
____hours/week
TODDLER
(2 years) $_____per hour $_____per day $_____per week $_____per month $_____per year
____hours/week
PRESCHOOL
(3 thru 5 years) $_____per hour $_____per day $_____per week $_____per month $_____per year
____hours/week
SCHOOL AGE (6 years thru 12 years) - SCHOOL IN SESSION
Before School $_____per hour $_____per day $_____per week $_____per month $_____per year
After School $_____per hour $_____per day $_____per week $_____per month $_____per year
Before & After
School $_____per hour $_____per day $_____per week $_____per month $_____per year
____hours/week
____hours/week
____hours/week
SCHOOL AGE (6 years thru 12 years) - SCHOOL NOT IN SESSION, e.g. summer, holidays
$_____per hour $_____per day $_____per week $_____per month $_____per year
____hours/week
5a) Have any of your rates increased in the past year? 6a) Have any of your rates decreased in the past year? 5b) If yes, why? (check all that apply) 6b) If yes, why? (check all that apply)
___ Salary ___ Utilities ___ To be more competitive
___ Health Insurance ___ Building Costs ___ Fewer children in care
___ Insurance ___ Fewer children in care ___ More children in care
___ Training ___ More Children in care ___ Decreased costs
___ Food and Supplies ___ Other ___ Other
7) Family Day Care providers in New York City: Are you paid by a Network? Check one: No. Yes. _____________

Appendix 3 Dear Child Care Provider:
Every two years, the Office of Children and Family Services conducts a survey of
the price of child care across the state of New York. This information is used to
make sure that the rates that the county department of social services pays for child
care on behalf of low-income families are consistent with the child care market in
that county. You may be called and asked to participate in this year’s Child Care
Market Rate Survey.
The Market Rate Survey Team will be conducting the survey over the next 12
weeks. The Market Rate Survey phone number is xxx-xxx-xxxx, and if you are
called, it will appear as “Mrkt Rate Srvy” on your caller ID. If you choose to
participate, you will be asked what you charge for child care and how many
children are in your care. Please base your answers using the rates you charge your
“private pay clients,” not the rates you charge for children paid for by the county
department of social services (or in New York City by the Administration of
Children’s Services or Human Resource Administration). The phone survey should
take approximately 15 minutes.
Please do not send in the form. Wait for the Market Rate Survey Team to call you.
We are providing you with the survey form so that you will be familiar with the
questions and be able to answer them more easily during the phone interview, if
you are called. If your telephone number has changed, please be sure that your
licensor or registrar has your current telephone number so that we are able to reach
you. Please tell people who may answer your telephone (staff, volunteers,
household members in family day care) about this survey.
The information you give us will be used to make any necessary changes to the
child care subsidy rates for your county. Please be assured that the information in
this survey will ONLY be used for that purpose. Your individual responses will
not be shared with anyone other than the staff who will be data entering and
processing the survey results. To meet federal requirements, we may call a few
randomly selected providers to verify the information included in the survey.
If you have any questions, please call us at xxx-xxx-xxxx.
Thank you for your assistance. As a small businessperson, I know you appreciate
how important it is for the payment rates for child care to be current. Therefore, I
know I can count on your cooperation.
Sincerely,
Janice Molnar
Deputy Commissioner
Division of Child Care Services
New York State
Office of
Children &
Family
Services
http://ocfs. ny.gov
Andrew M. Cuomo
Governor
Roberto Velez
Acting Commissioner
Capital View Office Park
52 Washington Street
Rensselaer, NY
12144-2834
An Equal Opportunity Employer