table of contents - dna tribes™ genetic ancestry · pdf filetable of contents: ancient...
TRANSCRIPT

DNA Tribes® Digest April 2, 2014
All contents © 2006-2014 DNA Tribes. DNA Tribes®. DNA Tribes patented analysis is available exclusively from DNA Tribes. U.S. PAT. NO. 8,285,486. All rights reserved.
DNA Tribes® Digest April 2, 2014 Page 1 of 14
Web: www.dnatribes.com; Email: [email protected]; Facebook: facebook.com/DNAtribes
Mail: DNA Tribes, P.O. Box 735, Arlington, VA 22216
DNA Tribes® Digest April 2, 2014 Copyright © 2014 DNA Tribes®. All rights reserved. To request an email subscription to DNA Tribes® Digest, email [email protected] with the subject heading “Subscribe.” To unsubscribe from DNA Tribes® Digest, email [email protected] with the subject heading “Unsubscribe.” Previous issues of DNA Tribes® Digest are available online at http://dnatribes.com/library.html.
Table of Contents: Ancient Eurasian and African Ancestry in Europe ...................................................................... 2
Background: New Genomes from Ancient Europe ............................................................. 2 Iterative Mixture Analysis of Europe (STR) ....................................................................... 3 Iterative Mixture Analysis of Europe (SNP) ....................................................................... 8 Conclusion ......................................................................................................................... 12
DNA Tribes® Announcements for April 2014 .......................................................................... 13 Spring Sale for 22 Marker and 26 Marker Kit STR Tests ................................................. 13 About DNA Tribes® SNP (genome data required) ............................................................. 14
Introduction
Hello, and welcome to the April 2014 issue of DNA Tribes® Digest. This month’s article continues the exploration of ancestral populations described in the recent Lazaridis paper, “Ancient Human Genomes Suggest Three Ancestral Populations for Present-Day Europeans"1 with a focus on the ancient Middle Eastern and Eurasian migrations that shaped the genetic structure of Europe.
In particular, this Digest article features iterative analyses of non-local genetic components in Europe, including ancestral links with Middle Eastern, South Asian (Indian Subcontinent), and Native American populations.
Best regards, Lucas Martin DNA Tribes
DNA Tribes® is on Facebook. Find us at http://facebook.com/DNAtribes
1 “Ancient Human Genomes Suggest Three Ancestral Populations for Present-Day Europeans" by Lazaridis et. al. (preprinted December 2013)., available at http://biorxiv.org/content/early/2013/12/23/001552.
DNA Tribes® Digest April 2, 2014
All contents © 2006-2014 DNA Tribes. DNA Tribes®. DNA Tribes patented analysis is available exclusively from DNA Tribes. U.S. PAT. NO. 8,285,486. All rights reserved.
DNA Tribes® Digest April 2, 2014 Page 2 of 14
Web: www.dnatribes.com; Email: [email protected]; Facebook: facebook.com/DNAtribes
Mail: DNA Tribes, P.O. Box 735, Arlington, VA 22216
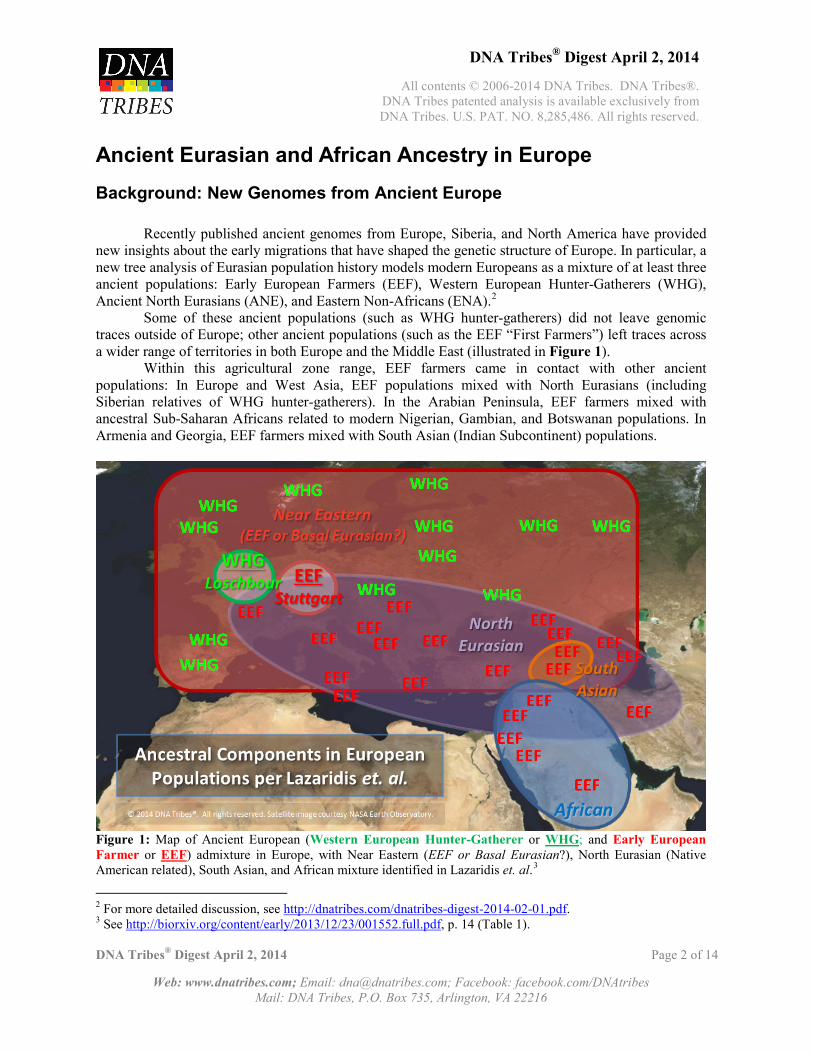
Ancient Eurasian and African Ancestry in Europe Background: New Genomes from Ancient Europe Recently published ancient genomes from Europe, Siberia, and North America have provided new insights about the early migrations that have shaped the genetic structure of Europe. In particular, a new tree analysis of Eurasian population history models modern Europeans as a mixture of at least three ancient populations: Early European Farmers (EEF), Western European Hunter-Gatherers (WHG), Ancient North Eurasians (ANE), and Eastern Non-Africans (ENA).2 Some of these ancient populations (such as WHG hunter-gatherers) did not leave genomic traces outside of Europe; other ancient populations (such as the EEF “First Farmers”) left traces across a wider range of territories in both Europe and the Middle East (illustrated in Figure 1).
Within this agricultural zone range, EEF farmers came in contact with other ancient populations: In Europe and West Asia, EEF populations mixed with North Eurasians (including Siberian relatives of WHG hunter-gatherers). In the Arabian Peninsula, EEF farmers mixed with ancestral Sub-Saharan Africans related to modern Nigerian, Gambian, and Botswanan populations. In Armenia and Georgia, EEF farmers mixed with South Asian (Indian Subcontinent) populations.
Figure 1: Map of Ancient European (Western European Hunter-Gatherer or WHG; and Early European Farmer or EEF) admixture in Europe, with Near Eastern (EEF or Basal Eurasian?), North Eurasian (Native American related), South Asian, and African mixture identified in Lazaridis et. al.3
2 For more detailed discussion, see http://dnatribes.com/dnatribes-digest-2014-02-01.pdf. 3 See http://biorxiv.org/content/early/2013/12/23/001552.full.pdf, p. 14 (Table 1).

DNA Tribes® Digest April 2, 2014
All contents © 2006-2014 DNA Tribes. DNA Tribes®. DNA Tribes patented analysis is available exclusively from DNA Tribes. U.S. PAT. NO. 8,285,486. All rights reserved.
DNA Tribes® Digest April 2, 2014 Page 3 of 14
Web: www.dnatribes.com; Email: [email protected]; Facebook: facebook.com/DNAtribes
Mail: DNA Tribes, P.O. Box 735, Arlington, VA 22216
Similarly, another paper, "Towards a New History and Geography of Human Genes Informed by Ancient DNA" by Reich et. al. identifies Mediterranean (Sardinian-like) ancestry in several parts of the Middle East, Central Asia, the Indian Subcontinent and reaching as far as Southeast Asia.4 Although further analysis is needed, one possibility is that these widely shared ancestral components in part reflect the expansions of Early European Farmers (EEF) or related populations (such as Basal Eurasians) from the African Nile Valley and West Asian Fertile Crescent.5
Furthermore, Ancient North Eurasian (ANE) ancestral components shared between present day Europeans (in particular Northeast Europeans),6 Siberians, and Native Americans might reflect the expansions of hunting-fishing populations in Eurasia and North America during the Paleolithic and Neolithic periods.7
To explore the genetic traces of these ancient southern agricultural and northern hunter-gatherer expansions across Eurasia in present day Europeans, this month’s Digest article examines the Europe’s links with world population structure using autosomal STR and SNP data.
Iterative Mixture Analysis of Europe (STR) To explore the genetic traces of Eurasian farmer (EEF) and hunter-gatherer (WHG and ANE)
expansions in Europe, non-local genetic components of Europe were identified based on autosomal STR data.8
For each non-local component expressed in Europe, a sequential analysis was performed by excluding that component (for instance, Mesopotamian in Table 2) and the next largest related component (for instance, Levantine in Table 3). This was repeated until no new components were identified that were related to that group (for instance, Middle Eastern and Indian Subcontinent regions in Table 2, possibly related to EEF or Basal Eurasian ancestry). Results are listed in Tables 1-5 and illustrated in Figure 2. Discussion: Results in Tables 1-5 express a variety of Eurasian and African genetic components at each stage of the sequential analysis using autosomal STR data. Step 1 (Remove Europe): The initial admixture analysis of Europe excludes the local European component, expressing instead North Africa (10.1%), Levantine (19.8%), Mesopotamian (68.4%), and Arctic (1.7%) STR components (see Table 1): The largest percentage expressed is from the Mesopotamian region (68.4%), which is located near the crossroads of Europe, Asia, and Africa and where recent papers have identified Mediterranean related EEF ancestry along with North Eurasian and South Asian (Indian Subcontinent) admixture. For this reason, the Mesopotamian component initially expressed in Europe might reflect ancestry from more than one ancient Eurasian population.
4 See preprint (March 2014) at http://biorxiv.org/content/early/2014/03/21/003517 and supplementary materials at http://biorxiv.org/content/biorxiv/suppl/2014/03/21/003517.DC1/003517-1.pdf. 5 For more discussion, see http://dnatribes.com/dnatribes-digest-2014-03-01.pdf and http://dnatribes.com/dnatribes-digest-2013-08-01.pdf. 6 See http://dnatribes.com/dnatribes-digest-2013-11-01.pdf. 7 See http://dnatribes.com/dnatribes-digest-2014-02-01.pdf; http://dnatribes.com/dnatribes-digest-2014-01-03.pdf. 8 For information about the 32 world genetic regions distinguished in DNA Tribes® 22 and 26 Marker Kit autosomal STR tests, see http://dnatribes.com/populations.html.

DNA Tribes® Digest April 2, 2014
All contents © 2006-2014 DNA Tribes. DNA Tribes®. DNA Tribes patented analysis is available exclusively from DNA Tribes. U.S. PAT. NO. 8,285,486. All rights reserved.
DNA Tribes® Digest April 2, 2014 Page 4 of 14
Web: www.dnatribes.com; Email: [email protected]; Facebook: facebook.com/DNAtribes
Mail: DNA Tribes, P.O. Box 735, Arlington, VA 22216
Iteration
Removed this
Iteration
Most Increased
New
Regions Expressed >1.0%
North A
frican
Levantine
Mesopotam
ian
Arctic
1 First Iteration First Iteration First Iteration 10.1% 19.8% 68.4% 1.7% Table 1: Non-local STR components of Europe (Step 1): excluding European percentages.
The more exclusively Middle Eastern and African components (North African, 10.1%; and
Levantine, 19.8%) might also reflect multiple prehistoric migrations to Europe, but probably primarily reflect EEF and/or Basal Eurasian expansions (due to generally lower levels of North Eurasian ancestry in these North African and Levantine populations than in northern parts of West Asia).9
Finally, the small Arctic percentage (1.7%) might express Ancient North Eurasian (ANE) ancestry shared by European, Siberian, and Native American populations. This might reflect traces of the links between northern hunting-gathering populations migrating through the mammoth steppe of Eurasia during the Paleolithic and Mesolithic periods.
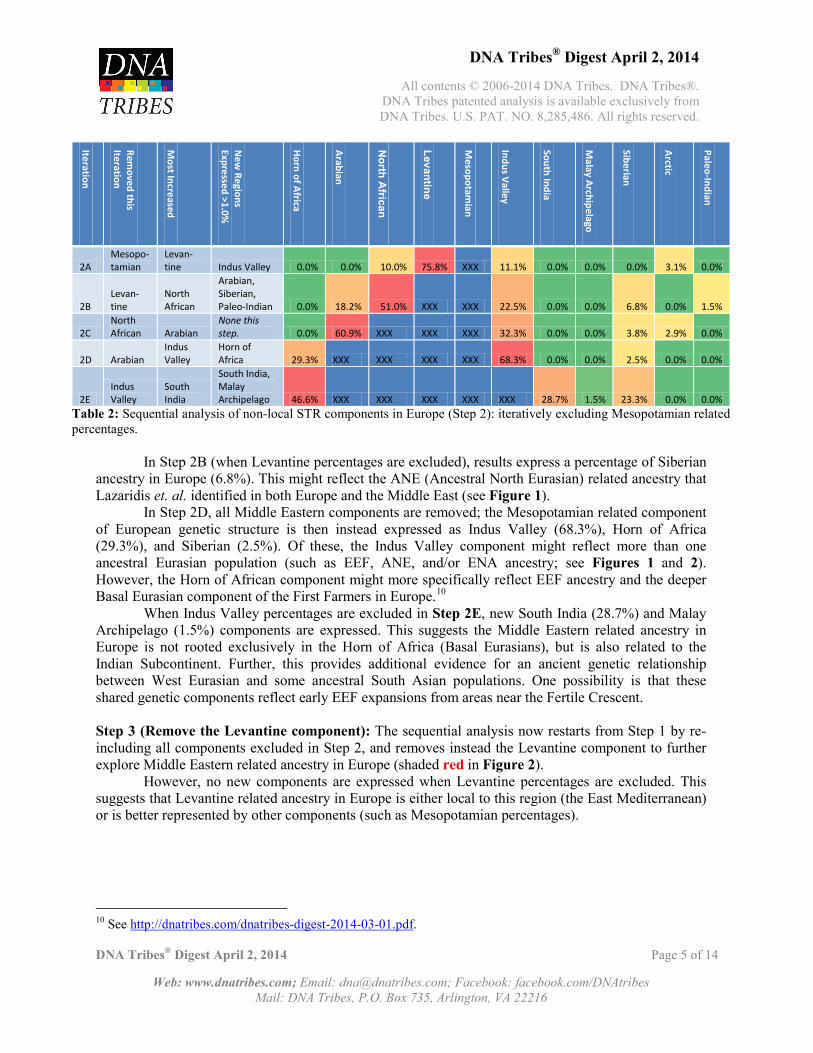
Step 2 (Remove Mesopotamian related components): The next part in the series additionally excludes the Mesopotamian component (Step 2A in Table 2) and sequentially removes the largest related component expressed in each subsequent step (Steps 2B-2E in Table 2; West and Central Asian components are shaded green, and Saharan-Arabian components red in Figure 2). These steps express a series of Mesopotamian related components across iterations in the following sequence:
1 (Begin Iteration): North African (10.1%), Levantine (19.8%), Mesopotamian (68.4%); Total 98.3%.
2A (Remove Mesopotamian): North African (10.0%), Levantine (75.8%), Indus Valley (11.1%); Total 96.9%.
2B (Remove Levantine): Arabian (18.2%), North African (51.0%), Indus Valley (22.5%), Siberian (6.8%); Total 98.5%.
2C (Remove North African): Arabian (60.9%), Indus Valley (32.3%), Siberian (3.8%); Total 38.3%.
2D (Remove Arabian): Horn of Africa (29.3%), Indus Valley (68.3%), Siberian (2.5%); Total 100.0%.
2E (Remove Indus Valley): Horn of Africa (46.6%), South India (28.7%), Siberian (23.3%); Total 98.5%.
Beginning at Step 2A (in which Mesopotamian percentages are excluded), mixture analysis for Europe expresses both Saharan-Arabian (North African and Levantine) and South Asian (Indus Valley) ancestry. This provides further evidence that the Mesopotamian component initially expressed in Step 1 actually reflects more than one source population of ancient Eurasia.
9 For more discussion, see http://dnatribes.com/dnatribes-digest-2014-03-01.pdf.
DNA Tribes® Digest April 2, 2014
All contents © 2006-2014 DNA Tribes. DNA Tribes®. DNA Tribes patented analysis is available exclusively from DNA Tribes. U.S. PAT. NO. 8,285,486. All rights reserved.
DNA Tribes® Digest April 2, 2014 Page 5 of 14
Web: www.dnatribes.com; Email: [email protected]; Facebook: facebook.com/DNAtribes
Mail: DNA Tribes, P.O. Box 735, Arlington, VA 22216
Iteration
Removed this
Iteration
Most Increased
New
Regions Expressed >1.0%
Horn of Africa
Arabian
North A
frican
Levantine
Mesopotam
ian
Indus Valley
South India
Malay Archipelago
Siberian
Arctic
Paleo-Indian
2A Mesopo-tamian
Levan-tine Indus Valley 0.0% 0.0% 10.0% 75.8% XXX 11.1% 0.0% 0.0% 0.0% 3.1% 0.0%
2B Levan-tine
North African
Arabian, Siberian, Paleo-Indian 0.0% 18.2% 51.0% XXX XXX 22.5% 0.0% 0.0% 6.8% 0.0% 1.5%
2C North African Arabian
None this step. 0.0% 60.9% XXX XXX XXX 32.3% 0.0% 0.0% 3.8% 2.9% 0.0%
2D Arabian Indus Valley
Horn of Africa 29.3% XXX XXX XXX XXX 68.3% 0.0% 0.0% 2.5% 0.0% 0.0%
2E Indus Valley
South India
South India, Malay Archipelago 46.6% XXX XXX XXX XXX XXX 28.7% 1.5% 23.3% 0.0% 0.0%
Table 2: Sequential analysis of non-local STR components in Europe (Step 2): iteratively excluding Mesopotamian related percentages.
In Step 2B (when Levantine percentages are excluded), results express a percentage of Siberian ancestry in Europe (6.8%). This might reflect the ANE (Ancestral North Eurasian) related ancestry that Lazaridis et. al. identified in both Europe and the Middle East (see Figure 1). In Step 2D, all Middle Eastern components are removed; the Mesopotamian related component of European genetic structure is then instead expressed as Indus Valley (68.3%), Horn of Africa (29.3%), and Siberian (2.5%). Of these, the Indus Valley component might reflect more than one ancestral Eurasian population (such as EEF, ANE, and/or ENA ancestry; see Figures 1 and 2). However, the Horn of African component might more specifically reflect EEF ancestry and the deeper Basal Eurasian component of the First Farmers in Europe.10 When Indus Valley percentages are excluded in Step 2E, new South India (28.7%) and Malay Archipelago (1.5%) components are expressed. This suggests the Middle Eastern related ancestry in Europe is not rooted exclusively in the Horn of Africa (Basal Eurasians), but is also related to the Indian Subcontinent. Further, this provides additional evidence for an ancient genetic relationship between West Eurasian and some ancestral South Asian populations. One possibility is that these shared genetic components reflect early EEF expansions from areas near the Fertile Crescent. Step 3 (Remove the Levantine component): The sequential analysis now restarts from Step 1 by re-including all components excluded in Step 2, and removes instead the Levantine component to further explore Middle Eastern related ancestry in Europe (shaded red in Figure 2). However, no new components are expressed when Levantine percentages are excluded. This suggests that Levantine related ancestry in Europe is either local to this region (the East Mediterranean) or is better represented by other components (such as Mesopotamian percentages).
10 See http://dnatribes.com/dnatribes-digest-2014-03-01.pdf.

DNA Tribes® Digest April 2, 2014
All contents © 2006-2014 DNA Tribes. DNA Tribes®. DNA Tribes patented analysis is available exclusively from DNA Tribes. U.S. PAT. NO. 8,285,486. All rights reserved.
DNA Tribes® Digest April 2, 2014 Page 6 of 14
Web: www.dnatribes.com; Email: [email protected]; Facebook: facebook.com/DNAtribes
Mail: DNA Tribes, P.O. Box 735, Arlington, VA 22216
Iteration
Removed this
Iteration
Most
Increased
New
Regions Expressed >1.0%
North
African
Levantine
Mesopotam
ian
Arctic
3A Levantine Mesopotamian None this step. 15.9% XXX 82.7% 1.4% Table 3: Sequential analysis of non-local STR components in Europe (Step 3): iteratively excluding West Eurasian related percentages.
Step 4 (Remove the North African component): The sequential analysis now restarts from Step 1 and removes the North African component to further explore Middle Eastern related ancestry in Europe (shaded red in Figure 2). As in Step 3, no new components are expressed when North African percentages are excluded. This suggests that North African related ancestry in Europe is either local to this region or is better represented by other components (such as Levantine and/or Mesopotamian percentages).
Iteration
Removed this
Iteration
Most Increased
New
Regions Expressed >1.0%
North A
frican
Levantine
Mesopotam
ian
Arctic
4A North African Levantine None this step. XXX 30.3% 68.0% 1.7% Table 4: Sequential analysis of non-local STR components in Europe (Step 4): iteratively excluding North African related percentages.
Step 5 (Remove the Arctic component): The sequential analysis now restarts from Step 1 and removes the Arctic component to further explore North Eurasian related ancestry in Europe (shaded purple in Figure 2). When Arctic percentages are excluded, a new Siberian component (1.1%) is expressed, consistent with an early relationship between Northeast European, Siberian, and Northern Native American populations.11
However, the most increased percentage in this step is Mesopotamian, which suggests that North Eurasian ancestry in Europe is also related to populations involved in West Asian expansions (such as Ancestral North Eurasians in the Lazaridis tree model).
Iteration
Removed this
Iteration
Most Increased
New
Regions Expressed >1.0%
North A
frican
Levantine
Mesopotam
ian
Siberian
Arctic
5A Arctic Mesopotamian Siberian 10.5% 18.6% 69.8% 1.1% XXX Table 5: Sequential analysis of non-local STR components in Europe (Step 5): iteratively excluding Arctic related percentages.
11 For more discussion, see http://dnatribes.com/dnatribes-digest-2009-11-30.pdf.
DNA Tribes® Digest April 2, 2014
All contents © 2006-2014 DNA Tribes. DNA Tribes®. DNA Tribes patented analysis is available exclusively from DNA Tribes. U.S. PAT. NO. 8,285,486. All rights reserved.
DNA Tribes® Digest April 2, 2014 Page 7 of 14
Web: www.dnatribes.com; Email: [email protected]; Facebook: facebook.com/DNAtribes
Mail: DNA Tribes, P.O. Box 735, Arlington, VA 22216
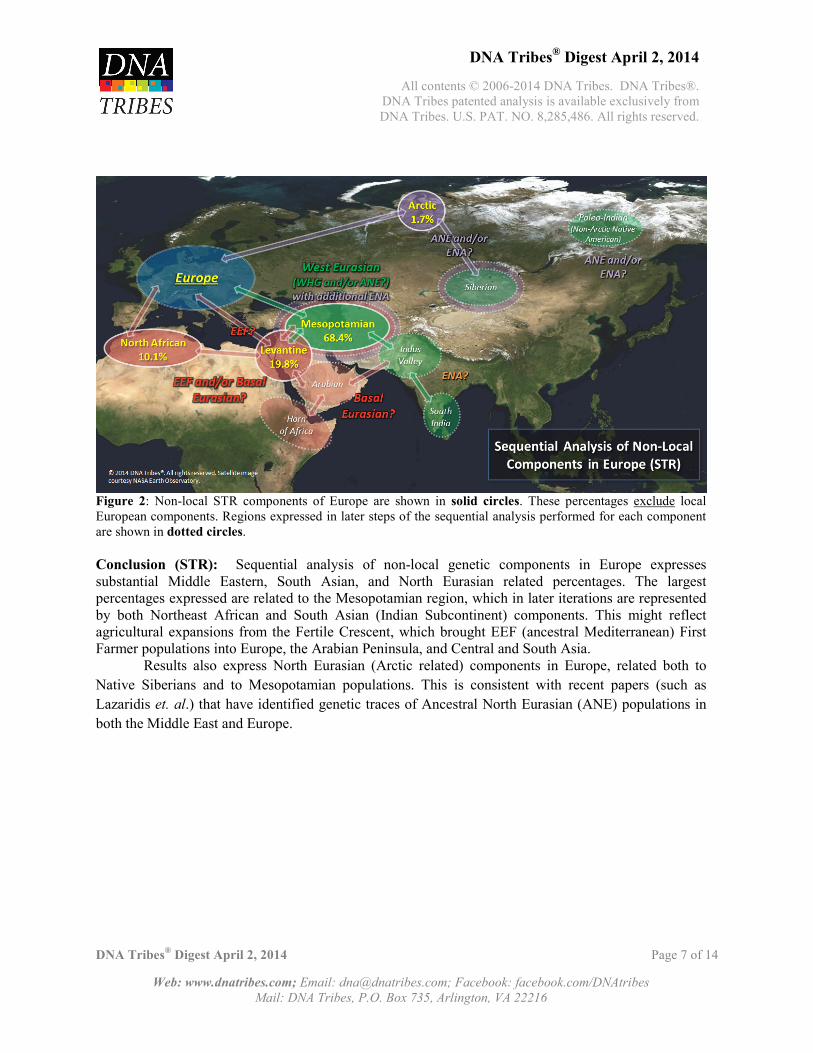
Figure 2: Non-local STR components of Europe are shown in solid circles. These percentages exclude local European components. Regions expressed in later steps of the sequential analysis performed for each component are shown in dotted circles. Conclusion (STR): Sequential analysis of non-local genetic components in Europe expresses substantial Middle Eastern, South Asian, and North Eurasian related percentages. The largest percentages expressed are related to the Mesopotamian region, which in later iterations are represented by both Northeast African and South Asian (Indian Subcontinent) components. This might reflect agricultural expansions from the Fertile Crescent, which brought EEF (ancestral Mediterranean) First Farmer populations into Europe, the Arabian Peninsula, and Central and South Asia. Results also express North Eurasian (Arctic related) components in Europe, related both to Native Siberians and to Mesopotamian populations. This is consistent with recent papers (such as Lazaridis et. al.) that have identified genetic traces of Ancestral North Eurasian (ANE) populations in both the Middle East and Europe.

DNA Tribes® Digest April 2, 2014
All contents © 2006-2014 DNA Tribes. DNA Tribes®. DNA Tribes patented analysis is available exclusively from DNA Tribes. U.S. PAT. NO. 8,285,486. All rights reserved.
DNA Tribes® Digest April 2, 2014 Page 8 of 14
Web: www.dnatribes.com; Email: [email protected]; Facebook: facebook.com/DNAtribes
Mail: DNA Tribes, P.O. Box 735, Arlington, VA 22216
Iterative Mixture Analysis of Europe (SNP) To further explore the genetic traces of Eurasian farmer (EEF) and hunter-gatherer (WHG and
ANE) expansions in Europe, non-local genetic components of Europe were identified based on autosomal SNP data.12
For each component, a sequential analysis was performed by excluding that component and the next largest related component. This was repeated until no new components from that part of the world were expressed. Results are listed in Tables 6-10 and illustrated in Figure 3. Discussion: Results in Tables 6-10 express a variety of Eurasian and African genetic components in Europe at each stage of the sequential analysis using autosomal SNP data. Step 1 (Table 6; Remove European component): The initial admixture analysis excludes the local European component, expressing instead North African (10.7%), Arabian (14.7%), Mesopotamian (25.6%), Caucasus Mountains (47.1%), and Mesoamerican (1.9%) components. The following steps (Steps 2-6) will explore each of these genetic relationships in more detail.
Step
Removed this
Iteration
Most Increased
New
Regions Expressed >1.0%
North African
Arabian
Mesopotam
ian
Caucasus Mnts.
Mesoam
erican
1 Europe (Joint) First Iteration First Iteration 10.7% 14.7% 25.6% 47.1% 1.9% Table 6: Non-local SNP components of Europe (Step 1): excluding Horn of Africa percentages.
Step 2 (Remove Caucasus Mountains components): The next part in the series additionally excludes the Caucasus Mountains component (Step 2A in Table 5) and sequentially removes the largest component expressed in each subsequent step (listed in Table 5 and shaded green in Figure 3). These steps express a series of West Asian and Saharan-Arabian related components across iterations in the following sequence:
1 (Begin Iteration): North African (10.7%), Arabian (14.7%), Mesopotamian (25.6%), Caucasus Mountains (47.1%); Total 98.1%.
2A (Remove Caucasus Mountains): North African (7.5%), Arabian (23.2%), Mesopotamian (55.9%), and Indus Valley (11.0); Total 97.6%.
2B (Remove Mesopotamian): North African (3.6%), Arabian (66.8%), Indus Valley (27.9%); Total 98.2%.
2C (Remove Arabian): North African (40.5%), Indus Valley (59.5%); Total 100.0%. 2D (Remove North African): Horn of Africa (8.3%), Indus Valley (91.7%); Total 100.0%.
12 For information about DNA Tribes® SNP analysis (raw genome data from a SNP microarray test required), see http://dnatribes.com/snp.html.
DNA Tribes® Digest April 2, 2014
All contents © 2006-2014 DNA Tribes. DNA Tribes®. DNA Tribes patented analysis is available exclusively from DNA Tribes. U.S. PAT. NO. 8,285,486. All rights reserved.
DNA Tribes® Digest April 2, 2014 Page 9 of 14
Web: www.dnatribes.com; Email: [email protected]; Facebook: facebook.com/DNAtribes
Mail: DNA Tribes, P.O. Box 735, Arlington, VA 22216
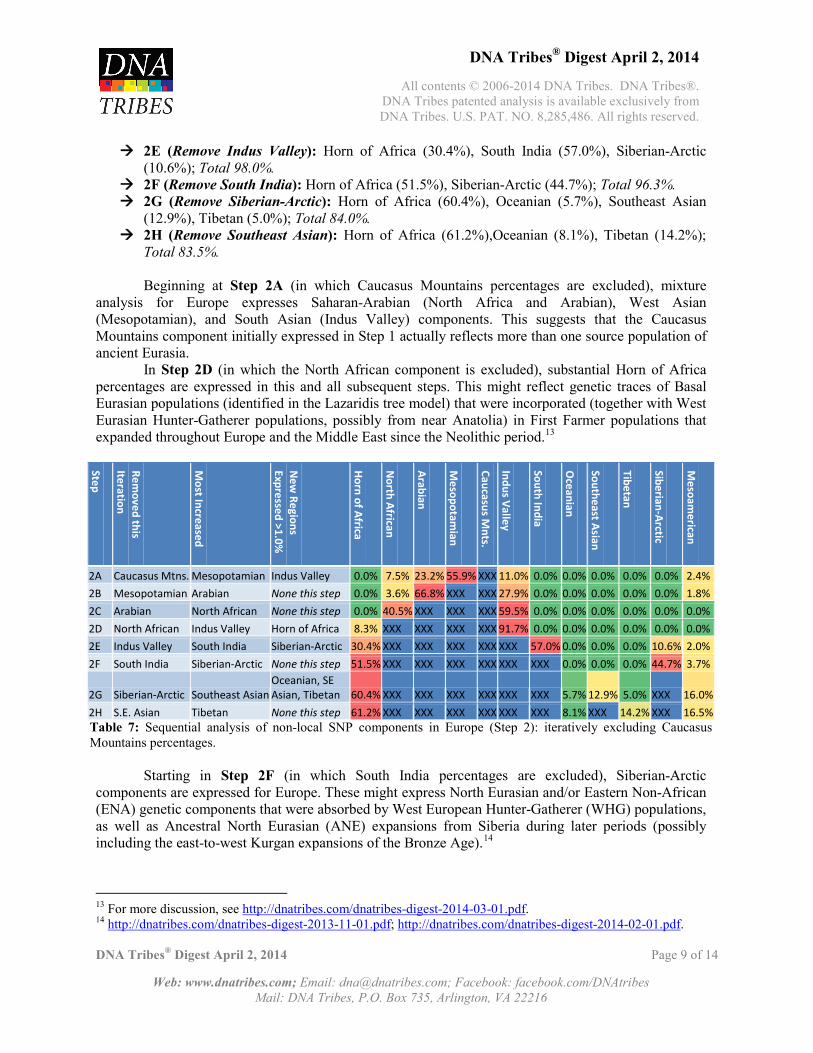
2E (Remove Indus Valley): Horn of Africa (30.4%), South India (57.0%), Siberian-Arctic (10.6%); Total 98.0%.
2F (Remove South India): Horn of Africa (51.5%), Siberian-Arctic (44.7%); Total 96.3%. 2G (Remove Siberian-Arctic): Horn of Africa (60.4%), Oceanian (5.7%), Southeast Asian
(12.9%), Tibetan (5.0%); Total 84.0%. 2H (Remove Southeast Asian): Horn of Africa (61.2%),Oceanian (8.1%), Tibetan (14.2%);
Total 83.5%.
Beginning at Step 2A (in which Caucasus Mountains percentages are excluded), mixture analysis for Europe expresses Saharan-Arabian (North Africa and Arabian), West Asian (Mesopotamian), and South Asian (Indus Valley) components. This suggests that the Caucasus Mountains component initially expressed in Step 1 actually reflects more than one source population of ancient Eurasia.
In Step 2D (in which the North African component is excluded), substantial Horn of Africa percentages are expressed in this and all subsequent steps. This might reflect genetic traces of Basal Eurasian populations (identified in the Lazaridis tree model) that were incorporated (together with West Eurasian Hunter-Gatherer populations, possibly from near Anatolia) in First Farmer populations that expanded throughout Europe and the Middle East since the Neolithic period.13
Step
Removed this
Iteration
Most Increased
New
Regions Expressed >1.0%
Horn of Africa
North African
Arabian
Mesopotam
ian
Caucasus Mnts.
Indus Valley
South India
Oceanian
Southeast Asian
Tibetan
Siberian-Arctic
Mesoam
erican
2A Caucasus Mtns. Mesopotamian Indus Valley 0.0% 7.5% 23.2% 55.9% XXX 11.0% 0.0% 0.0% 0.0% 0.0% 0.0% 2.4% 2B Mesopotamian Arabian None this step 0.0% 3.6% 66.8% XXX XXX 27.9% 0.0% 0.0% 0.0% 0.0% 0.0% 1.8% 2C Arabian North African None this step 0.0% 40.5% XXX XXX XXX 59.5% 0.0% 0.0% 0.0% 0.0% 0.0% 0.0% 2D North African Indus Valley Horn of Africa 8.3% XXX XXX XXX XXX 91.7% 0.0% 0.0% 0.0% 0.0% 0.0% 0.0% 2E Indus Valley South India Siberian-Arctic 30.4% XXX XXX XXX XXX XXX 57.0% 0.0% 0.0% 0.0% 10.6% 2.0% 2F South India Siberian-Arctic None this step 51.5% XXX XXX XXX XXX XXX XXX 0.0% 0.0% 0.0% 44.7% 3.7%
2G Siberian-Arctic Southeast Asian Oceanian, SE Asian, Tibetan 60.4% XXX XXX XXX XXX XXX XXX 5.7% 12.9% 5.0% XXX 16.0%
2H S.E. Asian Tibetan None this step 61.2% XXX XXX XXX XXX XXX XXX 8.1% XXX 14.2% XXX 16.5% Table 7: Sequential analysis of non-local SNP components in Europe (Step 2): iteratively excluding Caucasus Mountains percentages.
Starting in Step 2F (in which South India percentages are excluded), Siberian-Arctic components are expressed for Europe. These might express North Eurasian and/or Eastern Non-African (ENA) genetic components that were absorbed by West European Hunter-Gatherer (WHG) populations, as well as Ancestral North Eurasian (ANE) expansions from Siberia during later periods (possibly including the east-to-west Kurgan expansions of the Bronze Age).14
13 For more discussion, see http://dnatribes.com/dnatribes-digest-2014-03-01.pdf. 14 http://dnatribes.com/dnatribes-digest-2013-11-01.pdf; http://dnatribes.com/dnatribes-digest-2014-02-01.pdf.
DNA Tribes® Digest April 2, 2014
All contents © 2006-2014 DNA Tribes. DNA Tribes®. DNA Tribes patented analysis is available exclusively from DNA Tribes. U.S. PAT. NO. 8,285,486. All rights reserved.
DNA Tribes® Digest April 2, 2014 Page 10 of 14
Web: www.dnatribes.com; Email: [email protected]; Facebook: facebook.com/DNAtribes
Mail: DNA Tribes, P.O. Box 735, Arlington, VA 22216
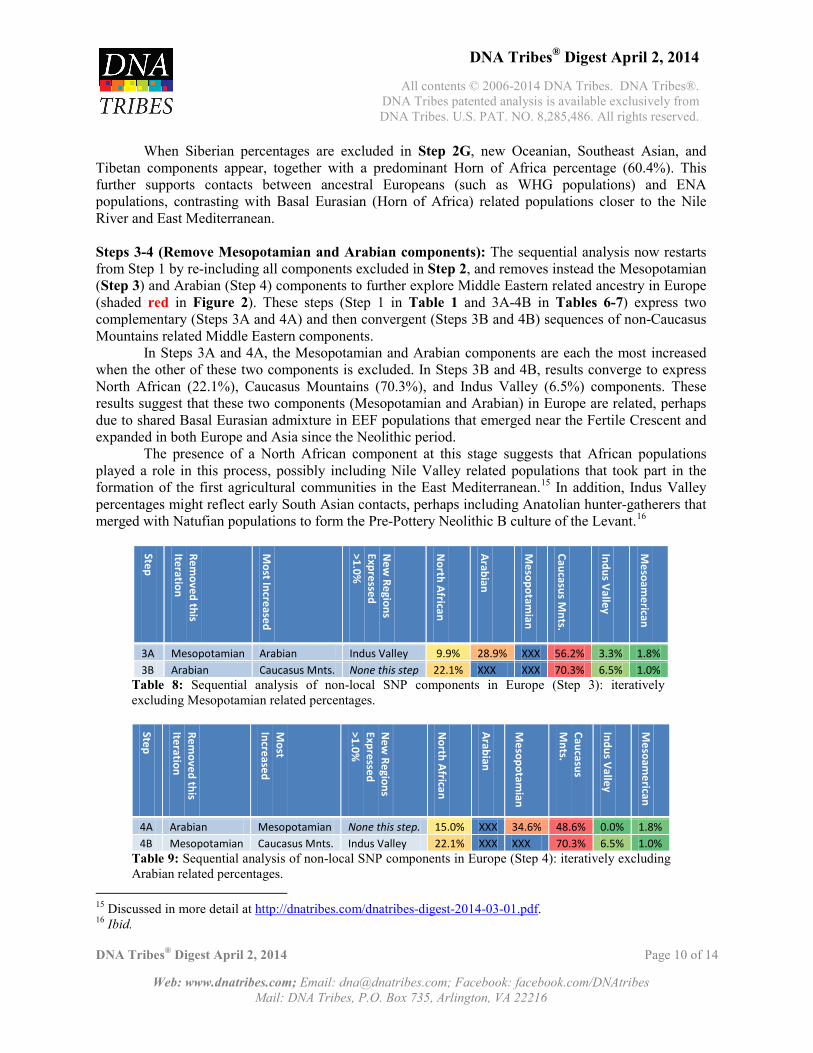
When Siberian percentages are excluded in Step 2G, new Oceanian, Southeast Asian, and Tibetan components appear, together with a predominant Horn of Africa percentage (60.4%). This further supports contacts between ancestral Europeans (such as WHG populations) and ENA populations, contrasting with Basal Eurasian (Horn of Africa) related populations closer to the Nile River and East Mediterranean. Steps 3-4 (Remove Mesopotamian and Arabian components): The sequential analysis now restarts from Step 1 by re-including all components excluded in Step 2, and removes instead the Mesopotamian (Step 3) and Arabian (Step 4) components to further explore Middle Eastern related ancestry in Europe (shaded red in Figure 2). These steps (Step 1 in Table 1 and 3A-4B in Tables 6-7) express two complementary (Steps 3A and 4A) and then convergent (Steps 3B and 4B) sequences of non-Caucasus Mountains related Middle Eastern components. In Steps 3A and 4A, the Mesopotamian and Arabian components are each the most increased when the other of these two components is excluded. In Steps 3B and 4B, results converge to express North African (22.1%), Caucasus Mountains (70.3%), and Indus Valley (6.5%) components. These results suggest that these two components (Mesopotamian and Arabian) in Europe are related, perhaps due to shared Basal Eurasian admixture in EEF populations that emerged near the Fertile Crescent and expanded in both Europe and Asia since the Neolithic period. The presence of a North African component at this stage suggests that African populations played a role in this process, possibly including Nile Valley related populations that took part in the formation of the first agricultural communities in the East Mediterranean.15 In addition, Indus Valley percentages might reflect early South Asian contacts, perhaps including Anatolian hunter-gatherers that merged with Natufian populations to form the Pre-Pottery Neolithic B culture of the Levant.16
Step
Removed this
Iteration
Most Increased
New
Regions Expressed >1.0%
North African
Arabian
Mesopotam
ian
Caucasus Mnts.
Indus Valley
Mesoam
erican
3A Mesopotamian Arabian Indus Valley 9.9% 28.9% XXX 56.2% 3.3% 1.8% 3B Arabian Caucasus Mnts. None this step 22.1% XXX XXX 70.3% 6.5% 1.0%
Table 8: Sequential analysis of non-local SNP components in Europe (Step 3): iteratively excluding Mesopotamian related percentages.
Step
Removed this
Iteration
Most
Increased
New
Regions Expressed >1.0%
North African
Arabian
Mesopotam
ian
Caucasus M
nts.
Indus Valley
Mesoam
erican
4A Arabian Mesopotamian None this step. 15.0% XXX 34.6% 48.6% 0.0% 1.8% 4B Mesopotamian Caucasus Mnts. Indus Valley 22.1% XXX XXX 70.3% 6.5% 1.0%
Table 9: Sequential analysis of non-local SNP components in Europe (Step 4): iteratively excluding Arabian related percentages.
15 Discussed in more detail at http://dnatribes.com/dnatribes-digest-2014-03-01.pdf. 16 Ibid.
DNA Tribes® Digest April 2, 2014
All contents © 2006-2014 DNA Tribes. DNA Tribes®. DNA Tribes patented analysis is available exclusively from DNA Tribes. U.S. PAT. NO. 8,285,486. All rights reserved.
DNA Tribes® Digest April 2, 2014 Page 11 of 14
Web: www.dnatribes.com; Email: [email protected]; Facebook: facebook.com/DNAtribes
Mail: DNA Tribes, P.O. Box 735, Arlington, VA 22216
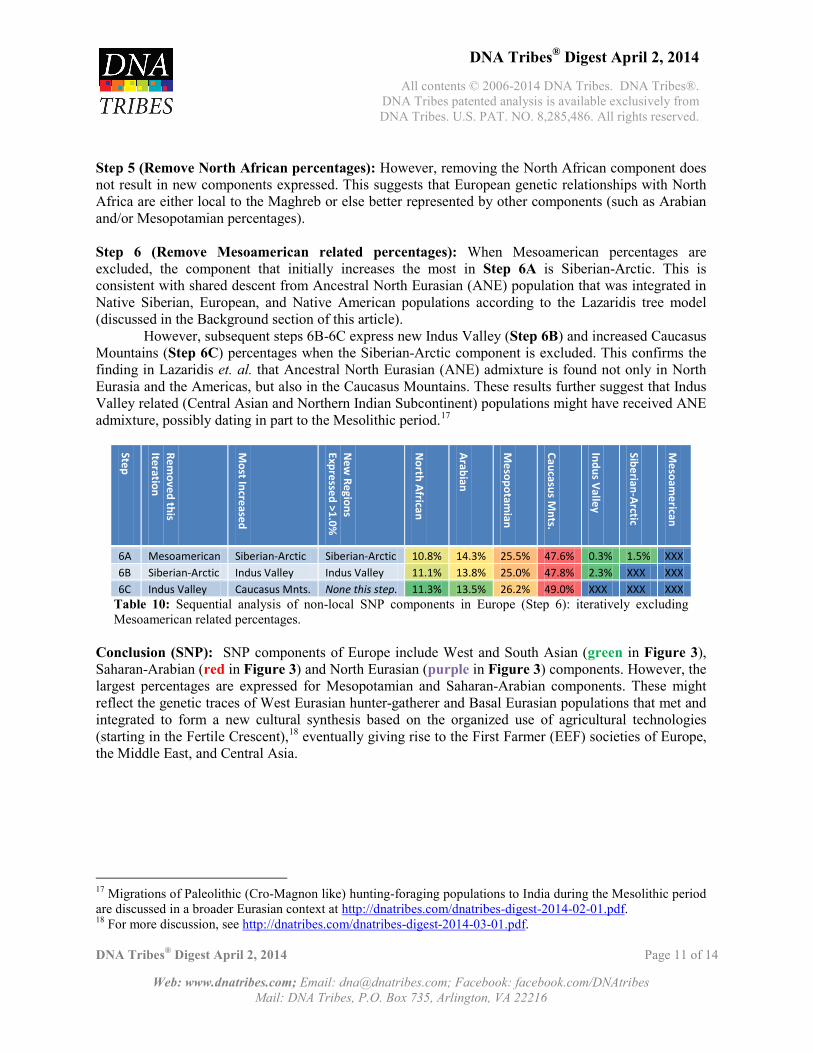
Step 5 (Remove North African percentages): However, removing the North African component does not result in new components expressed. This suggests that European genetic relationships with North Africa are either local to the Maghreb or else better represented by other components (such as Arabian and/or Mesopotamian percentages). Step 6 (Remove Mesoamerican related percentages): When Mesoamerican percentages are excluded, the component that initially increases the most in Step 6A is Siberian-Arctic. This is consistent with shared descent from Ancestral North Eurasian (ANE) population that was integrated in Native Siberian, European, and Native American populations according to the Lazaridis tree model (discussed in the Background section of this article). However, subsequent steps 6B-6C express new Indus Valley (Step 6B) and increased Caucasus Mountains (Step 6C) percentages when the Siberian-Arctic component is excluded. This confirms the finding in Lazaridis et. al. that Ancestral North Eurasian (ANE) admixture is found not only in North Eurasia and the Americas, but also in the Caucasus Mountains. These results further suggest that Indus Valley related (Central Asian and Northern Indian Subcontinent) populations might have received ANE admixture, possibly dating in part to the Mesolithic period.17
Step
Removed this
Iteration
Most Increased
New
Regions Expressed >1.0%
North African
Arabian
Mesopotam
ian
Caucasus Mnts.
Indus Valley
Siberian-Arctic
Mesoam
erican
6A Mesoamerican Siberian-Arctic Siberian-Arctic 10.8% 14.3% 25.5% 47.6% 0.3% 1.5% XXX 6B Siberian-Arctic Indus Valley Indus Valley 11.1% 13.8% 25.0% 47.8% 2.3% XXX XXX 6C Indus Valley Caucasus Mnts. None this step. 11.3% 13.5% 26.2% 49.0% XXX XXX XXX
Table 10: Sequential analysis of non-local SNP components in Europe (Step 6): iteratively excluding Mesoamerican related percentages.
Conclusion (SNP): SNP components of Europe include West and South Asian (green in Figure 3), Saharan-Arabian (red in Figure 3) and North Eurasian (purple in Figure 3) components. However, the largest percentages are expressed for Mesopotamian and Saharan-Arabian components. These might reflect the genetic traces of West Eurasian hunter-gatherer and Basal Eurasian populations that met and integrated to form a new cultural synthesis based on the organized use of agricultural technologies (starting in the Fertile Crescent),18 eventually giving rise to the First Farmer (EEF) societies of Europe, the Middle East, and Central Asia.
17 Migrations of Paleolithic (Cro-Magnon like) hunting-foraging populations to India during the Mesolithic period are discussed in a broader Eurasian context at http://dnatribes.com/dnatribes-digest-2014-02-01.pdf. 18 For more discussion, see http://dnatribes.com/dnatribes-digest-2014-03-01.pdf.

DNA Tribes® Digest April 2, 2014
All contents © 2006-2014 DNA Tribes. DNA Tribes®. DNA Tribes patented analysis is available exclusively from DNA Tribes. U.S. PAT. NO. 8,285,486. All rights reserved.
DNA Tribes® Digest April 2, 2014 Page 12 of 14
Web: www.dnatribes.com; Email: [email protected]; Facebook: facebook.com/DNAtribes
Mail: DNA Tribes, P.O. Box 735, Arlington, VA 22216
Figure 3: Non-local SNP components of Europe are shown in solid circles. These percentages exclude local European components. Regions expressed in later steps of the sequential analysis performed for each component are shown in dotted circles.
Conclusion Sequential analyses of non-local genetic components in Europe using both autosomal STR and
SNP data express ancestral components related to Middle Eastern and North Eurasian populations. Subsequent steps in each iterative analysis reveal deeper genetic relationships to populations of the Indian Subcontinent and Horn of Africa, possibly related to Early European Farmer (EEF) populations that first emerged near the Fertile Crescent as a synthesis integrating migratory hunter-gatherer and sedentary cultures from West Eurasia (possibly Anatolia) withi Basal Eurasian populations (possibly the Nile Valle).
Results are also consistent with a third element that helped shape European genetic structure: North Eurasian ancestry, related to not only West Asian (Mesopotamian and Caucasus Mountains) populations, but also to Siberian, Native American, and (in later iterations that show deeper relationships) to Asian-Pacific populations. This might reflect contacts between European (WHG) and Siberian (ANE) hunter-gather populations and Eastern Non-African (ENA) populations during the Paleolithic and Mesolithic period, in which Basal Eurasians were geographically separated from Eurasia (possibly near the Nile Valley). As new data become available, including new ancient genomes, it might become possible to further clarify these models of early population history and reveal new insights about the ancestral populations that shaped world genetic structure in Africa, Eurasia, Oceania, and the Americas.

DNA Tribes® Digest April 2, 2014
All contents © 2006-2014 DNA Tribes. DNA Tribes®. DNA Tribes patented analysis is available exclusively from DNA Tribes. U.S. PAT. NO. 8,285,486. All rights reserved.
DNA Tribes® Digest April 2, 2014 Page 13 of 14
Web: www.dnatribes.com; Email: [email protected]; Facebook: facebook.com/DNAtribes
Mail: DNA Tribes, P.O. Box 735, Arlington, VA 22216
DNA Tribes® Announcements for April 2014
Spring Sale for 22 Marker and 26 Marker Kit STR Tests DNA Tribes® is pleased to offer 22 Marker Kit and 26 Marker Kit tests at great prices. Each 22 and 26 Marker Kit tests includes your Autosomal STR Profile for industry standard markers used in DNA fingerprinting around the world. Both kits options feature the most detailed and comprehensive comparison of your autosomal DNA to world populations available anywhere. Your genetic ancestry report will include DNA Tribes® Native Population Match, Global Population Match, and World Region Match analysis. DNA Tribes® 22 Marker Kits (Sale Price: $119.99) test the following autosomal STR markers:
Amelogenin, CSF1PO, D13S317, D16S539, D18S51, D21S11, D3S1358, D5S818, D7S820, D8S1179, FGA, Penta D, Penta E, TH01, TPOX, vWA, D19S433, D2S1338, D10S1248, D12S391, D1S1656, D22S1045, and D2S441.
DNA Tribes® 26 Marker Kits (Sale Price: $139.99) test the following autosomal STR markers:
Amelogenin, CSF1PO, D13S317, D16S539, D18S51, D21S11, D3S1358, D5S818, D7S820, D8S1179, FGA, Penta D, Penta E, TH01, TPOX, vWA, D19S433, D2S1338, D10S1248, D12S391, D1S1656, D22S1045, D2S441, F13A1, F13B, FES/FPS, and LPL.
More information and new 22 and 26 Marker Kit test orders are available through our secure online checkout system at http://www.dnatribes.com/order.html. Upgrade testing for customers who have previously tested using DNA Tribes® 15 or 21 Marker Kit tests are available at http://dnatribes.com/order_upgrades.html. Updates incorporating new populations and world region definitions for previous 15, 21, or 27 Marker Kit tests (including all previously ordered add-on reports) are available using the $24.99 “Update Your STR Analysis” option at http://dnatribes.com/order_addons.html.
DNA Tribes® Digest April 2, 2014
All contents © 2006-2014 DNA Tribes. DNA Tribes®. DNA Tribes patented analysis is available exclusively from DNA Tribes. U.S. PAT. NO. 8,285,486. All rights reserved.
DNA Tribes® Digest April 2, 2014 Page 14 of 14
Web: www.dnatribes.com; Email: [email protected]; Facebook: facebook.com/DNAtribes
Mail: DNA Tribes, P.O. Box 735, Arlington, VA 22216
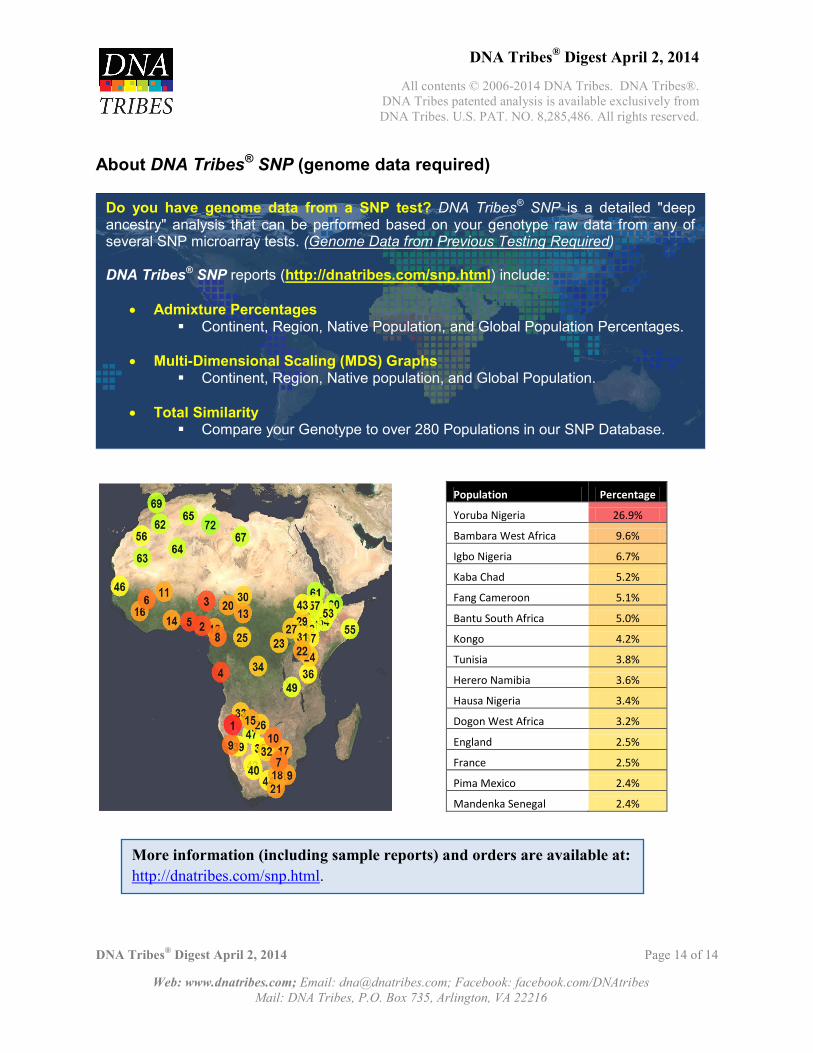
About DNA Tribes® SNP (genome data required)
Population Percentage
Yoruba Nigeria 26.9%
Bambara West Africa 9.6%
Igbo Nigeria 6.7%
Kaba Chad 5.2%
Fang Cameroon 5.1%
Bantu South Africa 5.0%
Kongo 4.2%
Tunisia 3.8%
Herero Namibia 3.6%
Hausa Nigeria 3.4%
Dogon West Africa 3.2%
England 2.5%
France 2.5%
Pima Mexico 2.4%
Mandenka Senegal 2.4%
More information (including sample reports) and orders are available at: http://dnatribes.com/snp.html.
Do you have genome data from a SNP test? DNA Tribes® SNP is a detailed "deep ancestry" analysis that can be performed based on your genotype raw data from any of several SNP microarray tests. (Genome Data from Previous Testing Required) DNA Tribes® SNP reports (http://dnatribes.com/snp.html) include:
• Admixture Percentages Continent, Region, Native Population, and Global Population Percentages.
• Multi-Dimensional Scaling (MDS) Graphs
Continent, Region, Native population, and Global Population.
• Total Similarity Compare your Genotype to over 280 Populations in our SNP Database.