table of contents - eur
TRANSCRIPT
Understanding Consumer Preference towards Wristwatch Buying Decision through its
Product Attributes: A Study of Indonesian Consumers
Bachelor Thesis
ERASMUS UNIVERSITY ROTTERDAM
Erasmus School of Economics
Marketing Program
Name : Nelsa Yuspita Dewi
Student Number : 481006
Supervisor : Havranek, G.W.
Second Assessor : Donkers, A.C.D.
International Bachelor of Economics and Business Economics
The Netherlands
July 2, 2018

Table of Contents
Table of Contents………………………………………………………………………….…….. 1
Abstract…………………………………....……………………………………………………...3
Chapter 1: Introduction…………………………….…………………………………………... 4 1.1 Background…………………………………………….………………………………….4 1.2 Scientific and Social Relevance……………………………………………….…………..6 1.3 Problem Statement and Research Question………………………………………………. 6 1.4 Research Objective……………………………………………………………………….. 7 1.5 Research Structure…………………...………………………………………………….... 7 1.6 Research Process and Methodology……..……………………………………………….. 8
Chapter 2: Theoretical Framework…………………………………………………..………... 9 2.1 Consumer Decision Making Model…………………………………………....………….9
2.1.1 High Effort Cognitive Decision Making………………………………...…………10 2.1.2 Product Attribute……..…………………………………………………………….11 2.1.3 Consumer Preference….…………………………………………………………...12
2.2 Indonesian Creative Industry……………………………………………………………. 12 2.3 Hypothesis Formulation……...…………………………………………………………..14
2.3.1 Formulation of Hypothesis 1……………...………………………………………. 14 2.3.2 Formulation of Hypothesis 2…………………………………………...…………. 14 2.3.3 Formulation of Hypothesis 3………………………………………...……………. 15
Chapter 3: Research Methodology……………….…………………………………………....16 3.1 Research Design…………………………....…………………………………………….16
3.1.1 Discrete Choice Experiment………....……………………………………………. 16 3.1.2 Random Utility Theory……………………………………..……………………...17
3.2 Undertaking Discrete Choice Experiment………….…………………………………... 18 3.2.1 Conceptualizing the Choice Design……………..………………………………...18 3.2.2 Measures…………………………………………..…………………………….... 19
3.3 Data Collection……………………………………….……………………………….... 20
Chapter 4: Result Analysis…………………………....………………………………………..21 4.1 Survey Results………………………………………………..…………………………. 21 4.2 Utility Analysis………………………………………………………………………….. 22
4.2.1 Likelihood Ratio Test……………………………………….…………………….. 22 4.2.2 Marginal Analysis………………………………..………………………………...22
1

4.2.3 Utility Profiler……………………………………………………………………...23 4.3 Hypothesis Testing…………………………………...………………………………….24
4.3.1 Hypothesis 1…………………………………………………...…………………..24 4.3.2 Hypothesis 2…………………………………………………...…………………..25 4.3.3 Hypothesis 3……………………………………………………...………………..27
4.4 Results Summary…………………………………..…………………………………… 29
Chapter 5: Conclusion………………………………………...………………………………..30 5.1 Conclusion……………………………………….…………………………………….... 30 5.2 Implication for Managers……………………………………………...………………....31 5.3 Limitations and Future Research Directions………...…………………………………...31
References…………………………………………………..…………………………………...33
Appendix 1: Questionnaire………………………………………...………………………….. 36
Appendix 2: Indonesian Creative Industry……………….………………………………….. 40
Appendix 3: Research Methodology - JMP Formulation………...…………………………. 41
Appendix 4: Result Analysis………………………………………………....………………... 42
2

Abstract
The purpose of this study is to analyze consumers’ preference towards a wristwatch by assessing
consumers’ valuation on each attribute of the product. Consumers choose an option that gives
them the highest utility, and thus it is believed that consumers’ preference can be observed
through their choices. This study uses a discrete choice experiment to reveal true preferences. It
is found that attribute price, strap materials, and movements have significant influence in the
process of determining preferences. On the other hand, brands and additional features have no
significant influence. Price is found to be the most important among all attributes. This study
indicates demographic variable of gender plays a significant role in determining preferences. The
most significant interaction is found between gender and strap materials. Another demographic
variable, age, is divided into two sub-generations, Y and Z. However, this variable doesn’t yield
big influence in determining consumers’ preference. This study aims to help wristwatch
manufacturers to understand the true preferences of Indonesian consumers, thus a discussion on
several managerial implications are also included. This study also suggests several directions for
future research related to consumer preference.
3
Chapter 1
Introduction
1.1 Background
In recent years, the Indonesian government has intensely encouraged the growth of
creative industry in the country. This is evidenced by Indonesia Creative programme from
Indonesian Ministry for Tourism and Creative Economy, which was designed to implement the
economic development blueprint launched by President (Susilo Bambang Yudhoyono) in 2008
(Setiadi et al., 2012). The attempt is still maintained until the era of Joko Widodo presidential,
with the establishment of an independent agency called Badan Ekonomi Kreatif (Bekraf) in
2015, which responsible for promoting and developing the creative economy in Indonesia.
Acceleration of economic growth, reduction of the unemployment rate, and the creation of 10
million new work fields within five years are the underlying motivation of this effort (Srimulyati
et al., 2017). Moreover, it has driven many Indonesian youths to build their own company and
create local brands. The awareness towards this trend gradually increasing over the past few
years. According to Bekraf, Indonesian government classifies creative industry into 16
sub-sectors as the main focus to be developed, including Design and Fashion sector. The former
consists of graphic design, interior design, product design, industrial design, and so forth, while
the latter consists of activities associated the creation, production and distribution of clothing,
footwear, and other fashion accessories (Nazamuddin, 2016). Hence, it is believed that local
wristwatch manufacturers fell into these two categories.
Currently, there are many local wristwatch manufacturers within the industry, which mainly
offer a product with a price range below those international brands that have been playing in
Indonesian market before them. In the study of differences between local and international
brands (Schuiling and Kapferer, 2004), it defined the local brand as a brand that exists in one
country and may belong to the local, international, or global firm, and defined the global brand
as international brand that uses globalized elements on their marketing strategy. However, in this
study, the author refers local brand as a brand that originally comes from Indonesia, typically
small start-up company, and have not competed on the international market. Indonesian creative
4

industry product offerings are still lacking in variety of design (Nazamuddin, 2016), which can
be associated to the reason of the slow sales growth and the inability of competing with
international brands. Moreover, consumer notice that these local brands have similar offerings
with each other, or even with the global brands. Differentiation of the product offering is
believed to be the key to successfully target consumers. Indonesian start-up wristwatch
manufacturers should make a unique offering to be able to compete in the market. In order to
successfully differentiate its product offering, companies should understand the consumer
preference.
Consumer preference is a positive motivation which expressed through affective compatibility of
a product or service (Voicu, 2013). Understanding consumer preferences is a pivotal aspect for
companies to determine and differentiate its product offering. Unfortunately, preferences cannot
be directly observed as people’s feeling of pleasure and pain are unobservable (Angner, 2016).
Moreover, most people are not aware of the underlying intention of their decisions, they simply
make choices. What is possibly done is observing people’s choices. In recent studies, many
researchers have proved that it is possible to measure consumer preferences effectively through
their choices. People will choose a product or service which give them the highest utility. When
defining utility, people will evaluate certain features or attributes of the product (Lancaster,
1971). Hence, it is believed observing consumers’ valuation of product attributes might be an
effective way to find their true preferences. The level of consumer preference is one of the
crucial aspects that need to be taken into consideration when specifying strengths and
weaknesses of competitors within the market (Voicu, 2013). Studying true consumers’
preference is believed can accommodate local watch manufacturers in Indonesia to be able to
compete in the Indonesian market, and in the future, in International market.
5

1.2 Scientific and Social Relevance
The aims of this study are to contribute several objectives and purposes to the society. In the
industry scope, there are five main constraints often faced by Indonesian creative industry: 1)
lack of skilled and trained labor; 2) lack of R&D and innovation; 3) lack of technology; 4)
limited market; and 5) lack of supporting policies (Nazamuddin, 2016). The purpose of this study
is to provide information as well as contribute to the growth of Indonesian creative industry,
primarily regarding the problems of lack R&D and innovation. For corporate purposes, this study
aims to deliver deeper insight for corporations, especially Indonesian local start-up watch
manufacturers to be able to compete in the global market by knowing the true consumer
preferences, and thus able to differentiate its products offering.
For academic purposes, this study also intended to offer more information to further research in
the same field of study, specifically for consumer behavior in depth scope of decision-making
process and understanding of consumer preferences. Lastly, for consumers, this study is hoped to
give more knowledge especially in the scope of the creative industry, how people make
purchasing decisions, and increasing the awareness towards local brands.
1.3 Problem Statement and Research Question
In forming preferences, consumers give different value in each product attribute. The assumption
that consumers base evaluation on several attributes that are in line with their goal of using the
product, increase the importance of understanding consumers’ true preferences by finding
attributes that significantly affect their buying decision. Problems arise when companies,
especially in this study, local watch manufacturers in Indonesia have no information regarding
the important key attributes that are in line with their target consumers’ goal. Regarding the
problem explained, the main research question for this study is as follows:
What are the key attributes that influence Indonesian consumer preference
towards the decision of buying a wristwatch?
6

In order to answer the main research questions above, it is further divided into sub-questions that
will guide this thesis:
1) What is the most important attribute for Indonesian consumer in the selection of
wristwatch?
2) Does gender play a role in determining preferences for a wristwatch?
3) Does age play a role in determining preferences for a wristwatch?
1.4 Research Objective
Considering the problem statement and research questions above, the objectives of this study is
to analyze the key attributes of wristwatch which influence Indonesian consumer preference on
their buying decision and find the most significant attribute to them as well. Additionally, this
study aims to find any demographic variables, such as gender and age, that possibly affect
consumer preferences towards a wristwatch buying decision. As the underlying motive of this
study is to deliver deeper understandings of consumer preferences in Indonesia, this study will
focus on Indonesian consumer. The result of this study is expected to help Indonesian local
watch manufacturers to understand their target consumers’ preferences, and hence able to
differentiate their product as well as capturing the bigger market.
1.5 Research Structure
Chapter 1 serves as an introduction to this thesis, as it explains the underlying aims of
conducting the study. It consists of background information on why this study is interesting and
relevant to the current problem in society, a brief description of the method that is used and how
data are collected. Moreover, it consists of problem statements and research questions that guide
this study, as well as the research objectives. Chapter 2 contains several relevant theory to
conduct this study. Consumer Decision Making Process on consumer behavior is the basic
theory, which leads the explanation to the intended variables studied, product attribute and
consumer preferences. Hypotheses are also formulated in this part. Chapter 3 gives detail
explanation of the methodology used in this study as well as the data collection procedure. This
study uses a discrete choice experiment to reveal consumer preferences towards purchasing
7

decision on wristwatch product. Chapter 4 describes the analysis and the result of data collected.
JMP software is used to generate choice sets as well as analyzing the data to specify the true
preferences of consumers. Lastly, chapter 5 provides a discussion about how the result analyzed
could be implemented in real society, implications for managers, and some limitations for future
research.
1.6 Research Process and Methodology
Methodology Used
This thesis uses Discrete Choice Experiment to determine consumer preference towards
wristwatch through its product attributes. Desk research and exploratory research with an
in-depth interview are conducted to determine numbers of attributes and levels regarding
wristwatch purchase decision to properly examine consumer preferences. The combination of
both product attributes and levels are used to create choice designs. JMP, a statistical software is
used to generate the choice design as well as generating and analyzing the data collected.
Likelihood Ratio Test, Effect Marginals, Utility Profiler, are tools within JMP that are used in
the study to get deeper understandings of consumer preference through their assessment of each
product attributes. Besides the choice sets generated by JMP software, simple demographic
questions are also included in the survey to identify other relevant variables, such as age and
gender.
Data Collection
On the exploratory research, 10 people are interviewed to determine relevant product attributes.
Afterward, specified attributes are used to create choice designs using JMP for questionnaire
purposes. Data collection is conducted in the form of an online survey. As explained before,
numbers of choice sets and demographic questions are included in the survey. The sample of the
survey consists of Indonesian society, as this study focuses on Indonesian consumer preference.
People aged 18 - 35 are the main target sample, as it is believed to be the main target segment of
most start-up local watch manufacturers in Indonesia. Both men and women are targeted to
prevent gender bias.
8

Chapter 2
Theoretical Framework
2.1 Consumer Decision Making Model
People encounter decision making in everyday life. Nearly all activities involve decision making,
some are made consciously, some are not. In a study of consumer decision making models
(Erasmus, A. C. et al., 2001), it is mentioned that decision making is a multi-staged and complex
process involving several factors that elicit problem recognition, initiating actions to reach
satisfaction or dissatisfaction (Harrel, 1990:740; Cox, Granbois & Summers, 1983:394).
There are several models that can be used to break down consumers’ mindset while selecting a
product. This study takes The Five-Step Model conceived by Cox et al (1983), as the underlying
theory of decision making. It explains the process in five steps classification from problem
recognition to post-purchase evaluation. Problem recognition where consumers’ decision process
begins, refers to the perceived difference between an ideal state, the way consumers want a
situation to be, and an actual state, the real situation (Hoyer et al., 2013:185). In this stage,
consumers will recognize needs that are necessary to be fulfilled, which leads them to look for
information. Information search might be internal using own memory, or external, from family,
peers, and market. Alternatives comparison is the stage where consumers compare alternatives
based on their attributes and seek the best deal which will satisfy their wants and needs. The
process followed by Purchase and Post-purchase evaluation stage.
9
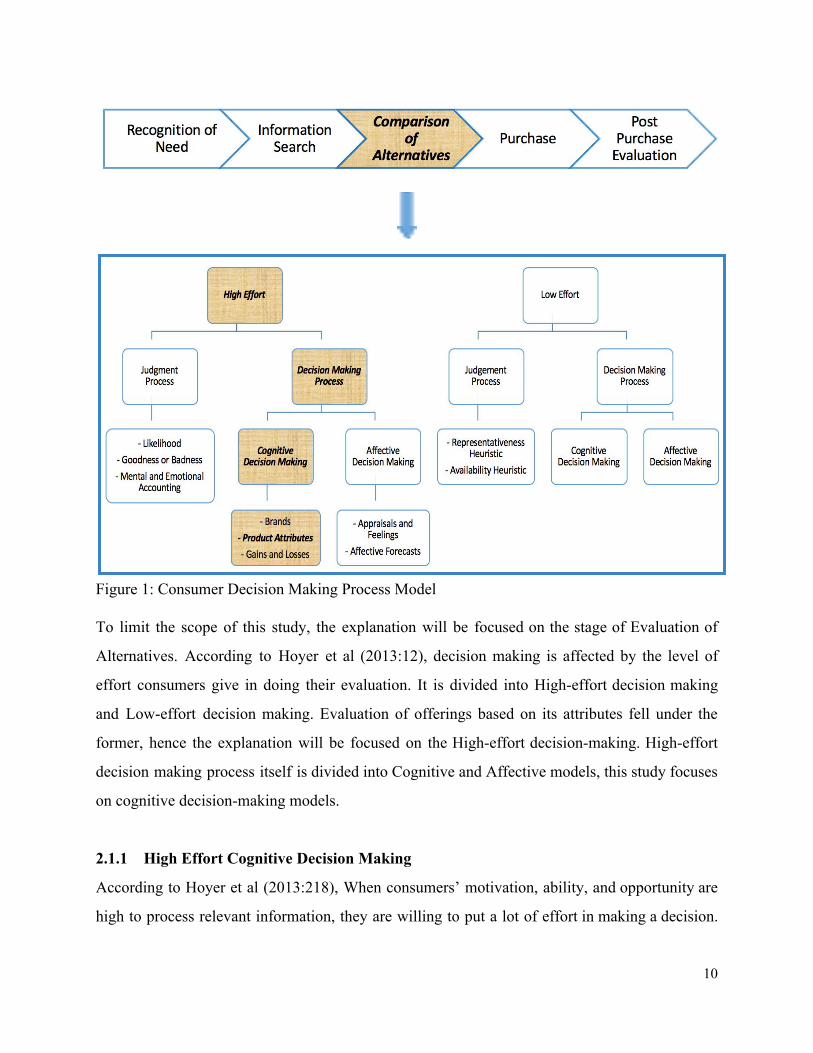
Figure 1: Consumer Decision Making Process Model To limit the scope of this study, the explanation will be focused on the stage of Evaluation of
Alternatives. According to Hoyer et al (2013:12), decision making is affected by the level of
effort consumers give in doing their evaluation. It is divided into High-effort decision making
and Low-effort decision making. Evaluation of offerings based on its attributes fell under the
former, hence the explanation will be focused on the High-effort decision-making. High-effort
decision making process itself is divided into Cognitive and Affective models, this study focuses
on cognitive decision-making models.
2.1.1 High Effort Cognitive Decision Making
According to Hoyer et al (2013:218), When consumers’ motivation, ability, and opportunity are
high to process relevant information, they are willing to put a lot of effort in making a decision.
10

When deciding what offerings to choose, consumers are confronted with both thought-based and
feeling-based decisions. A thought-based decision, also known as cognitive decisions, explains
how consumers’ use attributes information when forming their decision.
The cognitive model itself is divided further into compensatory and non-compensatory strategies.
The Compensatory strategy allows a higher value of one attribute compensate another attribute
that has lesser value (Richarme, 2005). This strategy explains how consumers weight attributes
of an offering in terms of how relevant and important the attributes are to their decision.
Non-compensatory is a strategy in which negative evaluation leads to rejection of the option,
where consumers immediately eliminate an alternative when it has a negative rating on the key
attribute (Hoyer et al., 2013:222).
2.1.2 Product Attribute
Product attributes are certain features that are attached to a particular product. Regarding the
product perception, it is assumed when the consumer perceives the product, it is a perception
through its attributes (Veres et al., 2014). A product is a bundle of attributes (Gwin et al., 2003).
In a study of product attribute preferences (Veres et al., 2014), there are eight factors identified
to describe the perceptions towards product attributes: attribute strengths, preference interval,
stability, product complexity, consumer task, life-likeness, environment, and experience. This
study also mentions several possible attribute dimension such as shape, brand, color, style, usage,
and so forth.
Attribute processing occurs when consumers compare alternatives by evaluating one attribute at
a time, and then combine them into overall preference (Hoyer et al., 2013:224). While forming
evaluation, consumers consider neutral attributes less than strongly important or strongly
unimportant attributes (Veres et al., 2014). It is believed that consumers start with the most
important and relevant attributes to their goal. Consumers gain utility based on the level of
existing attributes within the chosen brand along with their budget constraint (Gwin et al., 2003).
11

2.1.3 Consumer Preference
In marketing, consumer preference is defined as the subjective tastes, as measured by utility, of
various bundles of goods (Veres et al., 2014). Brand’s label or name, and features related to the
product such as shape, size, print, taste, color, consistency, and package might trigger a
preference of consumers (Voicu, 2013). Taking a model of consumer demand in Lancaster
(1966) into consideration, a study of product attributes by Gwin et al (2003), refers the model as
product attribute model and it assumes that consumer preference is based on characteristics of a
brand.
Consumer preference is a positive motivation towards a product and it is assumed that consumers
make choices based on their preferences. As stated earlier, preference is unobservable, while
understanding consumers’ choices will inform us of the true preferences. According to utility
theory, when deciding their choices, a rational consumer will choose a product or service that are
attractive to them, and certainly gives them the highest utility. Nonetheless, product per se will
not give consumers utility, they have characteristics, in this study we call it attributes that gives
consumers utility (Lancaster, 1966). Customers are guided by a subjective evaluation, in the
sense that they rely on own senses, experience, knowledge, and fashion (Mokrysz, 2016). It is
believed that consumers base evaluations on several of the most important attributes that highly
correlated with their goal, rather than all of them (Hoyer et al., 2013). Understanding consumer
choices through their valuation of each attribute help to understand why consumer have a
preference on an offering, moreover on specific brands, which allows brand competition (Gwin
et al., 2003).
2.2 Indonesian Creative Industry
As the motive underlying this study is to provide a deeper understanding of consumer preference
to local watch manufacturers in Indonesia, and thus able to compete in the Indonesian market
and international market in the future as well, below is a brief discussion regarding Indonesian
creative industry.
12

Indonesian Ministry of Trade defines creative economy as “Creative industry that comes from
creativity, competency, and individual skill utilization for achieving wealthy and jobs availability
through creating and utilizing the creation and creativity of individual” (Affif, 2012). Above
definition takes UK Department of Culture, Media, and Sport (DCMS) as a reference (Srimulyati
et al., 2017). DCMS defined creative economy as “Creative Industries as those industries which
have their origin in individual creativity, skill & talent, and which have a potential for wealth and
job creation through the generation and exploitation of intellectual property and content.”
Previously, Indonesia Creative has three main programmes, Creativepreneur, Creative City, and
Creative Network (3C). Creativepreneur itself is a programme of the creation and entrepreneurial
capacity building of creative industries (Setiadi et al., 2012). It combines creativity and
entrepreneurship as the main elements. As stated earlier, Badan Ekonomi Kreatif (Bekraf)
Indonesia is a government agency that is responsible to develop Indonesia’s creative industry,
and it was part of the Ministry of Tourism and Creative Economy.
In recent years, creative industry is the fastest growing sector in Indonesia, and a key area for
expansion of developing economies (Setiadi et al., 2012). The industry has been playing a
significant role in the Indonesian economy. According to a survey held by Bekraf and Badan
Pusat Statistik (BPS), Indonesian central agency on statistics, in 2015, creative industry
contributed Rp852 trillion to the national GDP (7.38%), employed 15.9 million workers
(13.90%), and had an export value of US $ 19.4 billion (12.88%). Additionally, data shows
during 2010 to 2015, there was a significant growth on its contribution towards national
economy at 10.14% per year. Currently, Indonesian government classifies creative industry into
16 sub-sectors, with culinary, fashion, and crafts dominating the industry. Watch manufacturers
are believed to fall under fashion and product design sub-sector, hence indeed has a lot of
potentials to grow. These sub-sectors will be further divided into 18 sub-sectors as stated in their
2015 to 2019 growth plan (Suparmin et al., 2017). In 2015 alone, visual communication design,
music, video animation, and architecture, are four sub-sectors that were having the most
significant growth. Detailed information on each sub-sectors can be seen in Appendix 2.1,
Appendix 2.2, and Appendix 2.3.
13

2.3 Hypothesis Formulation
2.3.1 Formulation of Hypothesis 1
Understanding consumer preference is a critical key for watch manufacturers to be able to offer a
right product that consumer wants. As explained before, consumer preference can be observed
through their choices. It is believed that consumers choose a product that gives them the highest
utility. Nonetheless, consumers don’t value a product per se, yet they give a different value for
the attributes within. In order to find the most important attribute for Indonesian consumers when
buying a wristwatch, the first hypothesis is proposed as follows:
Hypothesis 1: All below attributes play an important role in determining preferences for a
wristwatch
Hypothesis 1A: Price plays an important role in determining preferences
Hypothesis 1B: Brands plays an important role in determining preferences
Hypothesis 1C: Additional features play an important role in determining preferences
Hypothesis 1D: Strap material plays an important role in determining preferences
Hypothesis 1E: Movements plays an important role in determining preferences
2.3.2 Formulation of Hypothesis 2
In the study of gender differences in preferences (Croson et al., 2009), it is found that there are
robust differences in risk preferences, social preferences, and competitive preferences across
genders. Moreover, the study also states that women and men are equally socially oriented, but
women have preferences that are more easily influenced. As preferences may differ across
genders, the second hypothesis is proposed as follows:
Hypothesis 2: Male and female value attributes differently, and thus have different most
preferred attribute levels.
14

2.3.3 Formulation of Hypothesis 3
Previously, demographers believed all those born between 1978 and 2000 belong to the same
one enormous “Millennial Generation” (Tulgan, 2013). Nevertheless, the time frame is
considered too broad and technological advancement lead to distinct differences within the
generation (Postolov et al., 2017). With that in mind, this one gigantic generation is divided
further into two generations, Y and Z. Generation Y, or currently known as Millennials, are those
born between 1980 and 1996. As a generation who lives with technology in everyday life, they
are assumed to be attributed to various characteristics pertaining to specific values, behavioral
patterns, and personal features (Mendryk, 2016). Moreover, this generation is independent,
techno-savvy but still thrives on flexibility (Tulgan, Martin, 2001). While generation Z, are those
born after 1996. Unlike the previous one, this generation has been raised in the digital world,
more connected to electronics, more technologically dependent, and up to date (Postolov et al.,
2017). Additionally, this generation seeks choices and demand customization in all they do
(Howe, Strauss, 2000). As it is believed that these generations reveal different behavior, and
assume age plays an important role in determining preferences, the third hypothesis is proposed
as follows:
Hypothesis 3: Generation Y and Generation Z value attributes differently, and thus have
different most preferred attribute levels.
15
Chapter 3
Research Methodology
3.1 Research Design
This study is an artefactual field experiment as it uses artificial task and context, yet the
respondents are the real target market of Indonesian watch manufacturers. Artefactual
experiment imitates lab experiment, yet the participants are from the market of interest (List,
2011). There are two ways of finding consumer preferences, which are revealed preferences and
stated preferences. Revealed preferences use observed choices of product purchase or service
use. As stated in behaviorist axioms by Samuelson (1938), revealed preferences can be observed
from consumer choices which reveal their market behavior (Veres et al., 2014).
Stated preferences, also called self-stated preferences for companies’ offering, has been used in
many studies in the field of marketing, separately or in combination with revealed preferences
(Yang et al., 2009). Stated preferences is a technique commonly used in a survey by asking
respondents to directly express their preference. Unfortunately, in many cases, consumers don’t
really know their true preferences. Researchers should apply a better technique to reveal
consumers’ stated preferences. Revealing consumers’ stated preferences can be accomplished by
using one of the research methods called Discrete Choice Experiment.
3.1.1 Discrete Choice Experiment
In recent years, the interest of Discrete Choice Experiment (DCE) application in some research
has been growing rapidly. DCE is a technique to elicit preferences based on Random Utility
Theory (RUT) (Louviere et al., 2010). DCE allows valuation of multiple options rather than a
single treatment (Lancsar et al., 2008). DCE is commonly used in a survey consists of several
choice sets, with each set involves hypothetical options formed by a set of attributes and levels.
DCE contributes in eliciting preferences and quantifying trade-off, in a way that it requires
respondents to make a trade-off between attributes, and it can be used to measure the
contribution of each attributes to overall utility (Lancsar et al., 2008).
16

3.1.2 Random Utility Theory
Random Utility Theory (RUT) which was proposed by Thurstone (1927), explains the choice
behavior of humans in the sense that people base their evaluation of alternatives on a comparison
on the utility of a product and eventually choose an option that gives them the highest utility. It
suggests that there is a latent factor in a person’s mind which cannot be observed, called utility
(Louviere et al., 2010). RUT is strongly associated with error components as individual choices
can only be observed with error. Consequently, the utility is modeled using a stochastic model
where error term needs to be included in the utility function (McFadden, 1986). By including
respondent-specific stochastic component, it allows preference heterogeneity by allowing
parameters to vary across individuals (Lancsar et al., 2008).
According to Probabilistic choice rule, the possibility of an alternative will be chosen depends on
the probability that its utility is higher than the utility of other alternatives. There are two
alternatives per choice set in this study, hence JMP generates binary logit model assuming the
error terms are independently and identically (IID) Gumbel distributed. McFadden (1986),
explain random utility model equation as follows:
The random utility model formula for this study below is based on above equation and adjusted
version from Putrityas (2016):
17

3.2 Undertaking Discrete Choice Experiment
3.2.1 Conceptualizing the Choice Design
Asking respondent to choose a discrete choice is how DCE works. To encourage respondents
revealing their true preferences, the choice options should be incentive compatible (Lancsar et
al., 2008). This study uses fractional factorial experimental design to construct attribute
combination and choice sets, where a sample from a full factorial design, all possible
combinations from attribute levels, are taken to construct choice alternatives. Full factorial
design allows an examination of all main effects and interaction effects between attributes
independently of one another, however it often too large in practice (Lancsar et al., 2008).
Fractional factorial design selects an orthogonal subset so that all effect of interest can still be
estimated.
In order to create efficient experimental choice design, Huber and Zwerina (1996) suggest four
properties that characterize efficient choice design: (i) Level Balance, i.e. where the levels of
each attribute appears in equal frequencies; (ii) Orthogonality, i.e. attribute levels appear in
choice sets in equal frequencies with each level of other attribute; (iii) Minimum overlap, i.e. the
probability of an attribute level repeats itself in a choice set is as small as possible; (iv) Utility
Balance, i.e. alternatives in choice set have more similar probabilities to be chosen. If all above
factors are satisfied, the design is considered as utility-balanced design. In addition, these factors
should be based on realistic simulation of the market of interest (Lancsar et al., 2008).
18

The choice design in this study is based on utility-balanced design, hence prior specification will
be used to generate better information for JMP to create the choice design. A value of negative
one (-1), is assigned in the prior mean to give information that the most preferred attribute level
appear last, and a value of zero (0), if there is no previous information or all levels of attribute
tend to have the same level of attractiveness. A value of one (1) is assigned in the prior variance
matrix to allow for uncertainty. There are ten choice sets in the survey. In an attempt to avoid the
possibility of respondents fatigue and drop-outs, each set consists of only two choice
alternatives. Hence, the JMP software uses binary logit random utility model. Detail procedures
can be seen in Appendix 3.1 and Appendix 3.2.
3.2.2 Measures
Defining Product Attributes and Levels
Based on the study of DCE (Lancsar et al., 2008), quantitative or qualitative attributes can be
identified from literature and qualitative research, such as interviews with samples of relevant
respondents. The study also proposes that attributes and levels should be salient and plausible to
targeted respondents. The level ranges should also have sufficient wide range to avoid
respondent ignoring the attributes.
Table 3.1 Attributes and Levels of wristwatch
All above attributes are used to create all possible combination of choice design. To answer the
first hypothesis, Likelihood Ratio Test on JMP is used to run the assessment.
19

Demographic Questions
To answer the second and third hypothesis, respondents are asked to state their gender, age, as
well as the year of born in the questionnaire. These variable are used to assess whether they have
a significant role in determining preferences. Likelihood Ratio Test and Utility Profiler on JMP
are used to run the assessment.
3.3 Data Collection
Exploratory research with an in-depth interview is conducted to properly determine product
attributes and levels. In this sections, respondents are interviewed and asked several questions
regarding preferences towards a wristwatch. They are asked whether they have a loyalty to
particular brands, the last time they bought a wristwatch, factors or attributes that they consider
when buying a wristwatch, and asked to mention several local brands to observe whether there is
some awareness towards Indonesian local brands. In addition, desk research is conducted as well
by observing several official websites and previous studies. Afterward, descriptive research is
conducted in the form of an online survey. The questionnaire consists of choice sets, which
respondents are asked to choose between alternatives. Each choice set consists of two
alternatives formed by attribute levels chosen from the result of the exploratory research, and the
combination is generated by JMP software. Moreover, demographic questions are also added to
identify other relevant variables.
The sample for both exploratory and descriptive research are Indonesian consumers, as this study
aims to understand the preference of Indonesian consumer towards the decision of buying a
wristwatch. People aged between 18 and 35 are targeted, as it is believed to be the main target
segment of most start-up local watch manufacturers in Indonesia, and thus have the best interest
towards Indonesian local brands.
20
Chapter 4
Result Analysis
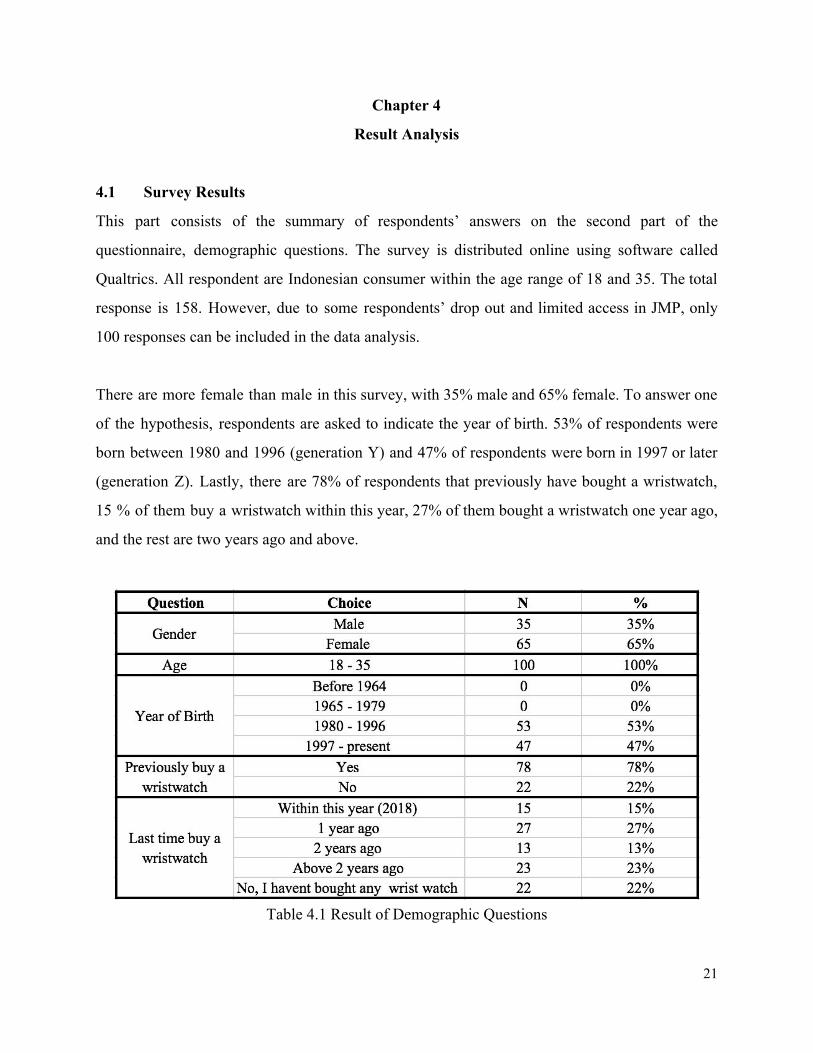
4.1 Survey Results
This part consists of the summary of respondents’ answers on the second part of the
questionnaire, demographic questions. The survey is distributed online using software called
Qualtrics. All respondent are Indonesian consumer within the age range of 18 and 35. The total
response is 158. However, due to some respondents’ drop out and limited access in JMP, only
100 responses can be included in the data analysis.
There are more female than male in this survey, with 35% male and 65% female. To answer one
of the hypothesis, respondents are asked to indicate the year of birth. 53% of respondents were
born between 1980 and 1996 (generation Y) and 47% of respondents were born in 1997 or later
(generation Z). Lastly, there are 78% of respondents that previously have bought a wristwatch,
15 % of them buy a wristwatch within this year, 27% of them bought a wristwatch one year ago,
and the rest are two years ago and above.
Table 4.1 Result of Demographic Questions
21

4.2 Utility Analysis
JMP software is used to help revealing true consumer preference by measuring the utility that
each attribute gives to consumers. Likelihood Ratio Test, Effect Marginals, and Utility profiler
are used to analyze the main effect of each attribute to better understand consumer preference.
4.2.1 Likelihood Ratio Test
Likelihood ratio test determines whether each attribute is significant to consumers. On the base
model, all chosen attributes are included in the base construct profile effect to test the main
effects. Apparently, not all attributes are statistically significant. JMP identifies price, strap
materials, and movements have significant effects with a p-value < .0001. Brands (p-value
0.2352) and additional features (p-value 0.2677) are not significant (Appendix 4.1).
When adding gender to the model through construct subject effect on JMP, likelihood ratio test
reveals there is a significant interaction between gender and strap materials with a p-value of
0.01. With male gets the highest utility by choosing steel and female gets the highest utility by
choosing leather for strap materials. Male gets the lowest utility from a wood strap, while female
gets the lowest utility from a plastic strap (Appendix 4.2).
Next, age is included in the model. It is found that age doesn’t yield any significance to the
model. There is no significant interaction between age and product attributes. It would appear
that the age of consumer has no effect towards the perceptions on the relevant product attribute
(Appendix 4.3). Similarly, after dividing respondents’ age into two generations, Y and Z,
likelihood ratio test still exhibits the same result which there is no significant interaction between
generation and the attributes (Appendix 4.4).
4.2.2 Marginal Analysis
Marginal analysis is done to measure which attribute is the most important as well as their
relative importance towards another. The largest marginal effect belongs to price with a total
range of marginal utility roughly ~1.59, meaning price is the most significant attribute for
22

consumers. In line with the prior expectation, the lower price is indeed preferred by respondents.
A wristwatch with price < Rp1,000,000 gives respondents the highest marginal utility of 0.95,
followed by a wristwatch with price Rp1,000,000 - Rp2,000,000 with marginal utility -0.3, and a
wristwatch with price Rp2,000,000 - Rp3,000,000 gives the lowest marginal utility of -0.64. It is
followed by the type of movements as the second most significant attribute, by having the second
largest marginal utility with a total range of ~1.19. On the base model, a mechanical watch is the
most preferred type of movements with marginal utility of 0.47, while digital watch gives the
lowest marginal utility of -0.73, and quartz movements having less, but still positive marginal
utility (0.26). The third most significant attribute is strap materials with the total range of ~1.06.
Leather (0.47) provides the highest marginal utility and wood (-0.59) by far the lowest, while
steel (0.37) and plastic (-0.25) fall in the middle.
According to the likelihood ratio test, additional features and brands are not significant in the
model. However, their relative importance might still be measured using effect marginals. The
additional feature has a total range of ~0.24, with alarm (0.13) gives the highest marginal utility
compared to day/date display(-0.009) and stopwatch (-0.12). Brand appears to be the most
insignificant attribute in the model with only a total range of ~0.17. Surprisingly, Indonesian
local brand (0.085) is preferred to international brands (-0.085) (Appendix 4.5).
Table 4.2 Effect Marginals
4.2.3 Utility Profiler
Utility profiler function in JMP determines the most attractive profile of a wristwatch. This
function informs the best combination from each attribute which gives consumers the highest
utility. On the base model, the most preferred profile is a wristwatch with a price < Rp1,000,000,
23

from Indonesian local brand, has an alarm as its additional feature, with a leather strap and
mechanical movements. This combination gives consumers the highest utility up to 2.10
(Appendix 4.6). On the other hand, the lowest utility of -2.18 is given by the combination of a
profile with a price Rp2,000,000 - Rp3,000,000, from an international brand, has a stopwatch,
with wood strap and digital movements (Appendix 4.7).
4.3 Hypothesis Testing
4.3.1 Hypothesis 1
Hypothesis 1:
All below attributes play an important role in determining preferences for a wristwatch.
Hypothesis 1A: Price plays an important role in determining preferences
Hypothesis 1B: Brands plays an important role in determining preferences
Hypothesis 1C: Additional features plays an important role in determining preferences
Hypothesis 1D: Strap material plays an important role in determining preferences
Hypothesis 1E: Movements plays an important role in determining preferences
Table 4.3 Significance Effect of Attribute
The first proposed hypothesis is answered using likelihood ratio test function in JMP. As
explained before, the function generates the measurement showing which attributes play an
important role in determining preferences for wristwatch purchases. Price, strap materials, and
movements are statistically significant to the model with a p-value <.0001, meaning these
attributes indeed play an important role in consumer preferences. However, it appears that brands
24

and additional features are not statistically significant with a p-value of 0.2352 and 0.2677.
Indicating that Indonesian consumers turn out are careless to these two attribute (refer back to
Appendix 4.1).
These findings inform that Indonesian consumers put a higher value on price, strap materials,
and type of movements when selecting a wristwatch. In line with the likelihood ratio test, effect
marginals function also shows that price is the most important of all attribute, followed by the
type of movements and strap materials as the next most important attribute being considered
when making a purchase decision on a wristwatch. It appears that additional feature is not very
important for them in determining preferences, and brand appears to be the least important of
them all. Based on the analysis, hypothesis one has to be partly rejected. H1A, H1D, and H1E
are all accepted, as these three attributes appear to have significant value, while H1B and H1C
are rejected.
4.3.2 Hypothesis 2
Hypothesis 2:
Male and female value attributes differently, and thus have different most preferred
attribute levels.
To answer the second hypothesis, utility profiler is again used. Dissimilar with the base model,
demographic variable, gender, is added in the model through construct subject effect to examine
whether gender roles have a significant effect in consumer preference. Below is the summary of
utility profiler measurement on the highest possible utility a consumer able to get from the
relevant product profile and the rank of level chosen by each gender from each attribute.
25

Table 4.4 Utility Profiler measurement with gender included.
For male consumers, a price of < Rp1,000,000 is the most preferred level, followed by 1,000,000
- 2,000,000 and 2,000,000 - 3,000,000. They prefer Indonesian local brand to international
brand. Stopwatch is the most preferred additional features, followed by alarm and then day/date
display. For the strap materials, male consumers choose leather above all provided level. With
steel as their second option, followed by plastic and wood. For the movements, a mechanical
watch is most preferred compared to quartz and digital (Appendix 4.8).
In line with the other gender, female consumers have identical preferences towards price, brands,
and type of movements (marked with a yellow highlight). However, it is found that there is a
different preference towards additional features and strap materials between male and female
consumers (marked with a blue highlight). For females, alarm becomes the most preferred level,
followed by day/date display and stopwatch. This is an interesting finding as of the least
preferred level by females was the most preferred level by males. Moreover, steel is the most
preferred level of strap materials for females, followed by leather and plastic. Wood strap
became the least preferred level for both genders (Appendix 4.9).
26

The highest utility is obtained by choosing all the most preferred level in each attribute. For
males, an Indonesian local brand wristwatch with a price under Rp1,000,000, has a stopwatch as
its additional feature, with leather strap and mechanical movement is the most preferred profile.
This combination gives them the highest utility of 2.130918. For females, an Indonesian local
brand wristwatch with a price under Rp1,000,000 with steel strap and mechanical movement,
and has an additional feature of alarm gives them utility of 2.279205, and thus become the most
preferred profile. All the most preferred levels are highlighted in the table.
These findings give more insights about Indonesian consumers by looking at the possible
different preferences between genders. To differentiate offerings, watch manufacturers might
observe which levels of an attribute are the most attractive and combine the attributes into a real
profile. On the condition where the target consumers are male, results from male respondents can
be observed, and vice versa for female. In addition, from likelihood ratio test with the variable of
gender included in the model (refer back to Appendix 4.2), significant interaction is found only
between gender and strap materials. Meaning that strap materials might be the most important
differentiation for male and female consumers. Thus, deciding the strap materials for an offering
might be one of the crucial aspects when watch manufacturers want to differentiate their product
offerings between gender. Based on the above analysis, the second hypothesis is partly rejected.
As it is found that male and female have different preferences in two attributes, additional
features and strap materials. However, both genders appear to have identical preferences towards
three other features, price, brands, and type of movements.
4.3.3 Hypothesis 3
Hypothesis 3:
Generation Y and Generation Z value attributes differently, and thus have different most
preferred attribute levels.
27

Another demographic variable is included in the model using construct subject effect to answer
the third hypothesis. Respondents’ age is divided into two categories of generation. As it is
explained, the millennial generation is further divided into two smaller sub-generation called
generation Y(1980-1996) and generation Z (1997-present). The last hypothesis is interested in
analyzing whether there is a different preference between those generations. Below is the table
containing the summary of utility profiler measurement comparing both generations.
Table 4.5 Utility Profiler measurement with generation included.
The table shows there is no large significant difference in the preference towards a wristwatch
between generation Y and generation Z. For price, both generations choose the lowest price as
the most preferred level and the highest price as the least preferred. Both generation also
preferred Indonesian local brands to International brands. They have identical preferences
towards additional features and movements as well. Alarm become the most preferred features,
followed by day/date display and stopwatch. For the type of movements, mechanical watches
still become the most preferred for both generation and digital become the least preferred.
However, these generations have a different preference towards one attribute, strap materials.
28

Generation Y prefers leather to other levels, while generation Z prefer steel above all other levels
(marked with a blue highlight).
The highest utility for generation Y is 2.138436, obtained by choosing an under Rp1,000,000
Indonesian local brand wristwatch with a feature of alarm, have a leather strap and mechanical
movements. For generation Z, the highest utility of 2.059736 is obtained also by choosing a
wristwatch with a price under Rp1,000,000, has an alarm as its additional feature and mechanical
movements. However, the watch should have steel as its strap materials, and it should be
Indonesian local brand as well (Appendix 4.10 & Appendix 4.11).
These findings notice that there are no large differences between generation Y and generation Z
in determining preferences for a wristwatch. The only attribute that appears to have a different
result is only the strap materials. Nevertheless, from the likelihood ratio test with generation
included (refer back to Appendix 4.4), there is no significant interaction between generation and
attributes. Meaning that both generations give each attribute the same value, similar to the base
model. It appears that watch manufacturers don’t need a lot of differentiation on their offerings
to reach both generation Y and generation Z as the target consumers. Although both generations
seemingly have identical preferences towards almost all attribute, there is still a difference in
strap materials. Hence, the third hypothesis is partly rejected.
4.4 Results Summary
Table 4.6 Results
R = Rejected; A = Accepted
29

Chapter 5
Conclusion
5.1 Conclusion
Not only to perform its basic function, a wristwatch has become an essential fashion accessory
for some people. This study analyzes consumers’ preference towards a wristwatch product by
assessing consumers’ valuation on each attribute. With the research method of discrete choice
experiment which has been explained in chapter 3, it became feasible to know the key attributes
that influence Indonesian consumers’ preference towards the decision of buying a wristwatch. It
is found that attribute price, strap materials, and movements play an important role in consumers’
decision. Apparently, brands and additional features don’t play a big role when consumers make
a decision. Price is considered to be the most important attribute for consumers, while brands
become the least important.
The demographic variable of gender indeed plays a role in determining preferences. The most
significant interaction is found between gender and strap materials and followed by the attribute
additional features. However, both male and female have identical preferences on price, brands,
and type of movements. An interesting finding is found, where the most preferred level by males
in additional feature becomes the least preferred by females. Another demographic variable, age,
is divided into two sub-generations, Y and Z. This variable doesn’t yield any significant
interaction with the attribute. The small difference in preferences between generation is found
only in strap materials. However, from the likelihood ratio test, it is known that there is no
significant effect from age to any attribute. Thus, it is believed that age doesn’t really play a role
in determining preferences.
Another interesting finding is found. Most respondents prefer Indonesian local brand to
international brand. Alongside with government’s attempt to raise awareness on Indonesian
creative industry, this is an opportunity for Indonesian startup company to target Indonesian
30
market. A possible explanation to this circumstances is the awareness towards Indonesian local
brands is indeed growing rapidly within the society.
5.2 Implication for Managers
Creative industry in Indonesia has been growing rapidly in the last decades. Regardless of
numerous program to accelerate the growth as well as to raise the awareness in the society,
several constraints still occur such as lack of R&D and innovation. Society will not be able to
utilize the market maximally if corporations don’t undertake a proper market research. These
findings contribute to reduce the particular problem.
This study provides better insight on how consumers making preferences. A deeper
understanding for many corporations regarding the consumer preference towards a wristwatch
might help watch manufacturers to differentiate its product offering. During the process,
consumers give a different value on each attribute. By knowing which attribute is the most
important to the targeted consumers, watch manufacturers might use it as a differentiation from
their competitors. Furthermore, corporations might increase the effectiveness and efficiency on
marketing activity by highlighting particular attribute to give the most efficient message to
consumers. Doing market research also reduces the possibility of product failure, and thus able to
allocate the resources more efficiently.
5.3 Limitations and Future Research Directions
Several limitations should be considered in the creation of this thesis. Time is the most visible
limitation, creating this thesis in the longer period of time might improve the analysis and
provide better results. There are also some limitations regarding the respondent. In the
exploratory research, only 10 people are able to be interviewed to determine the key attributes.
Most of the interviewee are considered as generation Z, thus generation bias might have an effect
on the result of the interview. In the process of data collection, only 100 people can be analyzed
due to respondents’ drop out and limited access to the software. Moreover, in the survey result it
31

is mentioned that 65% of the respondents are female, hence there is also the possibility of gender
bias affecting the result.
These limitations suggest potential improvements to future research. Assuming that the
researcher has a longer period of time to do this study, a pilot test can be carried out to determine
the attribute in a better way, it can also be used to test the reliability of the choice sets in the
survey. More respondent should be gathered in both interview and survey. Future research
should try to balance the percentage of gender and generation to prevent bias in the result.
Indonesia is an island country with 34 provinces located in more than 16.000 islands. Each
province has its own culture and economic background, thus future research should cover all the
geographical area of Indonesia to properly capture all the preference of Indonesian consumers.
Future research might also include other demographic variables such as the level of awareness
towards Indonesian local brands, consumers’ lifestyle, cultural background, and economic
background. Another generation might also be included to provide information to watch
manufacturers that target older generation. Another attribute could also be included to examine
another effect towards consumer preference such as warranty program, packaging, the
availability in the store, the type of services such as delivery or online shop, and so forth. Despite
all the limitations, the result of this study is useful to get deeper insights on consumers and might
help watch manufacturers to differentiate their offerings.
32

References
Angner, Erik. (2016). A Course in Behavioral Economics, 2nd Ed. London: Palgrave Macmillan Badan Ekonomi Kreatif, Badan Pusat Statistik. (2017). Data Statistik dan Hasil Survei Ekonomi Kreatif. Retrieved from http://www.bekraf.go.id/berita/page/17/infografis-data-statistik-dan-hasil-survei-khusus-ekonomi-kreatif
Badan Pusat Statistik. (2016). Profil Usaha/Perusahaan 16 Subsektor Ekraf [978-602-438-196-7]. Retrieved from http://www.bekraf.go.id/berita/page/17/profil-usahaperusahaan-16-subsektor-ekonomi-kreatif
Croson, R., Gneezy, U. (2009). Gender Differences in Preferences. Journal of Economic Literature 2009, 47:2, 1–27.
Erasmus, A. C., et al., (2001), Consumer decision-making models within the discipline of consumer science: a critical approach. Journal of Family Ecology and Consumer Sciences, 29, 82-90.
Gwin, C., & Gwin, C. (2003). Product Attributes Model: A Tool for Evaluating Brand Positioning. Journal of Marketing Theory and Practice, 11(2), 30-42.
Howe, N., Strauss, W. (2000). Millennials Rising: e Next Great Generation. Vintage Books New York.
Hoyer, W.D., MacInnis, D.J., & Pieters, R. (2013). Consumer Behavior. Boston, MA: Cengage Learning.
Huber J, Zwerina K. (1996). The importance of utility balance inefficient choice designs. J Mark Res; 33: 307-17.
Lancaster, K. (1966) "A New Approach to Consumer Theory" Journal of Political Economy
Lancaster, K. (1971). Consumer Demand: A New Approach. New York & London: Columbia University Press.
Lancsar, Emily, and Jordan Louviere (2008) “Conducting discrete choice experiments to inform healthcare decision making,” Pharmacoeconomics, 26(8): 661-677.
33
List, John A. (2011) “Why economists should conduct field experiments and 14 tips for pulling one off,” The Journal of Economic Perspectives, 25(3): 3-15.
Louviere, Jordan & Flynn, Terry & Carson, Richard. (2010). Discrete Choice Experiments Are Not Conjoint Analysis. Journal of Choice Modelling. 3. 10.1016/S1755-5345(13)70014-9.
Mcfadden, D. (1986). The Choice Theory Approach to Market Research. Marketing Science, 5(4), 275-297.
Mendryk, I. (2016). Employees of Generation Y – Their Profile Based on Research Results. International Journal of Synergy and Research, 4(2), 75.
Mokrysz S. (2016). Consumer preferences and behaviour on the coffee market in Poland. Forum Scientiae Oeconomia, vol. 4(4), 91-108.
Nazamuddin, Nazamuddin. (2016). Promoting Creative Industries to Accelerate Indonesian Economic Growth. Conference: International Conference on Multidisciplinary Research (ICMR), At Hasanuddin University, South Sulawesi, Indonesia, Volume: 1.
Postolov, Kiril & Sopova, Marija & Janeska-Iliev, Aleksandra. (2017). E-LEARNING IN THE HANDS OF GENERATION Y AND Z. Poslovna izvrsnost - Business excellence. 11. 107-119. Putrityas, T.F. (2016, June 24). Revealing consumer preference through product attribute and consumer lifestyle:. Economics. Retrieved from http://hdl.handle.net/2105/35444
Richarme, Michael. (2006). Consumer Decision-Making Models, Strategies, and Theories, Oh My!. Decision Analyst, 1.817.640.6166.
Schuiling, I., & Kapferer, J. (2004). Real Differences between Local and International Brands: Strategic Implications for International Marketers. Journal of International Marketing, 12(4), 97-112.
Setiadi, N.J., Boediprasetya, A., & Wahdiaman. (2012). Boosting Indonesia’s Creative Industries: Identification of People’s Characteristics and Creative Behaviour. Quaestiones Geographicae 31(4), Bogucki Wydawnictwo Naukowe, Poznań, pp. 53–62.
Srimulyati, T., Azrimultiya, V., Budiwirman, Herri. (2017); Creative Economy/Creative Industry Development in Indonesia. Int. J. of Inov. and App. Res. 5 (5). 71-75.
34

Suparmin, P. Roniwijaya, S. Priyanto, and B.R. Setiadi. (2017). Eksplorasi sub- sub sektor industri kreatif di pusat-pusat keramaian Kabupaten Kulon Progo. Procedding SENDI_U UNISBANK, pp. 712-720.
Thurstone, L. L. (1927). A law of comparative judgment. Psychological Review, 34 273-286.
Tulgan, B., Martin, C. A. (2001). “Managing Generation Y”, Business Week Online.
Tulgan, B., (2013), Meet Generation Z: e second generation within the giant” Millennial” cohort Rainmaker inking.
Veres, Z., Tarjan, T., & Harmonik, B.P. (2014). Product Attribute Preferences -- A Multidisciplinary Approach. European Scientific Institute, vol. 1
Voicu, M.C. (2013). Characteristics of The Consumer Preferences Research Process. Global Economic Observer, vol. 1, issue 1, 126-134.
Yang, L., Carvalho, D. & de Abreu e Silva, J., Choudhury, C., & Ben-Akiva, M. (2009). Stated Preference Survey for New Smart Transport Modes and Services: Design, Pilot Study and New Revision. MIT-Portugal Transportation Systems, Working Paper Series.
35
Appendix 1:
Questionnaire
Dear Respondent, The purpose of this survey is for my bachelor thesis in International Bachelor Economics and Business Economics at Erasmus University Rotterdam. This research aims to understand consumer preference towards wristwatch product through its product attribute. The survey consists of two parts, choice sets and basic demographic questions. It will take approximately 5 minutes of your time. All answers will be kept confidential and used only for academic research purposes. If you have any questions regarding this research, don’t hesitate to contact me at : [email protected] Thank you for your time and participation. Regards, Nelsa Yuspita.
36

Choice Sets This part consists of 10 choice sets. You will be given two profiles of a wristwatch with different attributes in each set. Please imagine carefully what characteristics that you consider when buying a wristwatch and what component you find the most important. Choose one alternative (profiles) you find the most attractive in each set. Below are the attributes you will find in the choice sets, please read carefully the description: 1. Price : < Rp1.000.000 ; Rp1.000.000 - Rp2.000.000 ; Rp2.000.000 - Rp3.000.000 2. Brands : Indonesian local brands, International brands 3. Additional Features : Day and date display, Stopwatch, Alarm. 4. Strap Materials : Leather, Steel, Plastic, Wood 5. Movements (hands/jarum):
- Quartz : The hand (jarum) move in an individual ticks (make tick-tock sound), powered by battery.
- Mechanical: The hand (jarum) move in a smooth sweeping motion (no sound), no battery needed.
- Digital : Digital display, no hands (jarum) Please go back to above description if you find any confusion.
37

38

* all choice sets are generated by JMP and presented using picture in the online survey.
Demographic Questions This part consists of several demographic questions. Your answers will be kept confidential and used only for this research purposes. Please answer truthfully. Please indicate your gender
● Male ● Female
Please indicate your age ….. Please indicate your year of birth
● Before 1964 ● 1965 - 1979 ● 1980 - 1996 ● 1997 - present
Have you previously buy a wristwatch?
● Yes ● No
If yes when did the last time you buy a wristwatch?
● Within this year (2018) ● 1 year ago ● 2 years ago ● Above 2 years ago ● No, I haven’t bought any wristwatch
39

Appendix 2:
Indonesian Creative Industry
Appendix 2.1: Percentage of each sub-sector
in Indonesian Creative Industry (2016). Source: Badan Ekonomi Kreatif (Bekraf)
and Badan Pusat Statistik (BPS) Indonesia.
Appendix 2.2: Percentage of each sub-sector
contribution to Indonesian GDP (2016). Source: Badan Ekonomi Kreatif (Bekraf)
and Badan Pusat Statistik (BPS) Indonesia.
Appendix 2.3: The most growing sub-sector in 2015.
Source: Badan Ekonomi Kreatif (Bekraf) and Badan Pusat Statistik (BPS) Indonesia.
40

Appendix 3:
Research Methodology - JMP Formulation
Appendix 3.1: Choice Design Formulation
*above are the choice sets computed in the survey. Appendix 3.2: Choice Design generated by JMP.
41

Appendix 4:
Result Analysis
Appendix 4.1: Likelihood Ratio Test for the base model
Appendix 4.2: Likelihood Ratio Test with gender included
Appendix 4.3: Likelihood Ratio Test with age included
Appendix 4.4: Likelihood Ratio Test with generation included
Appendix 4.5: Effect Marginals
42

Appendix 4.6: Utility Profiler for the base model - Highest Utility
Appendix 4.7: Utility Profiler for the base model - Lowest Utility
Appendix 4.8: Utility Profiler with gender included - Male
Appendix 4.9: Utility Profiler with gender included - Female
Appendix 4.10 : Utility Profiler with generation included - Generation Y
Appendix 4.11: Utility Profiler with generation included - Generation Z
43