table of contents - home - bay of plenty regional council technical advisory group: phosphorus...
TRANSCRIPT

Table of Contents Executive Summary ................................................................................................................................ 1
Agenda .................................................................................................................................................... 5
Welcome: Introductions, Workshop Purpose and Format (Andy Bruere) ............................................. 9
Phosphorus loss sources in the BoP Region and why is Phosphorus an issue for the lakes
Lake Rotorua P sensitivity, P sources, P transport and future loads (David Hamilton) ................ 13
BoP Regional Overview: P limitation, state and trends. Lake Rotorua 2032 P load from land
(Paul Scholes) ................................................................................................................................ 27
Lake Rotorua proposed policy on P (Stephen Lamb) .................................................................... 33
P Loss from farms: Sources, Quantification, Mitigation, Cost-effectiveness (Richard McDowell) ..... 37
P use overview and projects to improve knowledge of farm P loss and mitigation
(Paul Scholes, David Burger, Ian Power) ....................................................................................... 59
P and N Loss from Forestry: Changes in P and N loss over the forest cycle, NuBalM nmodel
(Peter Beets) .................................................................................................................................. 71
Workshop Conclusions and Recommendations ................................................................................. 91


Executive Summary
Lake Rotorua Phosphorus Workshop 3rd Nov 2016
The following summarises workshop findings from three keynote presenters:
Phosphorus Loss Sources in BoP Region (Prof. David Hamilton, University of Waikato)
• To achieve the target TLI for Lake Rotorua both catchment N and P need to be reduced.
Sustainable target levels have been set in the BOPRC Policy statement and in the
Rotorua/Rotoiti Action Plan.
• The catchment nutrient reduction strategy must have regard for the in-lake N:P ratio. It is
acceptable to reduce them concurrently, but the ratio itself should not be reduced below the
long-term average of 12:1. A reduction in the N:P ratio could lead to cyanobacteria becoming
dominant with some that can potentially fix N from the atmosphere.
• In Lake Rotorua bioassays it has been shown that cyanobacteria increase growth in response
to additions of N and P individually, but the response to the addition of both N and P is larger
than observed with the addition of only N or P alone.
• The response to additional N or P can vary from season to season depending upon which
nutrient is limiting at the time. Sometimes the response is to N or P, but often it’s to both
simultaneously.
• The Alum dosing programme has reduced available phosphorus in Lake Rotorua. Total P has
been reduced to in-lake target levels since about 2012 due to the alum dosing programme.
The target level is 20 μgP/L In Lake Rotorua. Alum dosing has resulted in a reduction in
cyanobacteria presence since 2010 and there have been no health warnings due to
cyanobacteria blooms in recent years.
• When the lake stratifies, most commonly in summer, bottom waters begin to de-oxygenate
with consequent release of nutrients from bottom sediments. Alum appears to have had a
role in reducing this release. A reduction in nutrients results in a reduction in algal growth,
which in turn reduces the volume of decomposing material settling on the lake bed. The
injection of alum effectively initiates a positive feedback loop; stream dosing of alum beyond
the level required to inactivate phosphorus in the stream helps to create a residual that
controls both natural and anthropogenic sources of P in the lake.
Alum dosing is identified as a short-term intervention to manage P until catchment N and P
loads are controlled and approach the sustainable catchment targets. It is expected that alum
dosing will be phased out as these targets are realised.
• N and P from land take different pathways through the soil and water. Generally N travels as a
soluble phase with water, whereas P attaches readily to soil particles and travels overland,
often as the result of erosion. The techniques available to reduce N leaching will mostly not
provide a similar magnitude of reduction in the loss of P from the same area of land. There is a
Page 1 of 93

need to address P run-off from land use and transport in streams. The objective should be to
increase the retention of P on the land in order to reduce downstream effects.
• Assessment of P inputs to Lake Rotorua from the catchment indicate that around half of the
stream and groundwater inputs are from natural geological sources. Anthropogenic inputs
which may be able to be managed by land use controls contribute the other half of the P load
reaching Lake Rotorua. Hence, any reduction of the P load coming from anthropogenic
sources (catchment land use) can only ever address about 50% of the total catchment P load.
Science advice is that management of algal blooms in Lake Rotorua cannot be achieved by
catchment management of P alone unless in-stream/in-lake controls (e.g., alum dosing) are
used. Current management of P through the alum dosing programme has resulted in an
approximately 50% reduction in P concentrations in the lake, with the alum addressing both
natural and anthropogenic sources, including in-lake releases.
• Both diffuse and point-source urban storm water discharge have been identified as potentially
significant contributors to in-lake phosphorus.
• Removal of urban storm water P could be greatly enhanced by improved engineering
interventions.
P losses and mitigation (Prof. Richard McDowell, Lincoln University)
• There can be a wide seasonal variation in P loss due to climate, soil type, topography and land
management. The interaction of these factors with land management and farmer
environmental practice has a significant effect on the level of P loss from season to season and
from farm to farm. Best management practices are available to minimise P loss from land.
• There is a positive relationship between soil test P (Olsen P) and the P in surface runoff and
leaching. In terms of common pastoral farming land uses within the Lake Rotorua catchment
dairy farming contributes the greatest N loss; deer farming is likely to have the greatest
sediment loss on a per hectare basis. Any land use can contribute P losses depending on soil P,
slope, climate,
There is a need to understand the difference between agronomic optimum and economic
optimum for P fertility. The latter is more important for farm profitability, and tends to be
lower than agronomic optimum, hence lower P run-off.
Soil Olsen P levels should be maintained no higher than the agronomic optimum because
losses of P are potentially greatest from areas with higher Olsen P. However, these losses
only become real where there is a hydrological link to streams .
• Fertilisers, grazing management, and dung are the main sources of P loss within a farm
environment.
• The bulk of P loss from farming systems can be attributed critical source areas. It is important
to target these areas in addressing mitigation and ensure mitigations are correctly
Page 2 of 93

implemented and maintained. Dealing with Critical Source Areas (CSAs) can dramatically
increase the cost-effectiveness of mitigation strategies
• P loss mitigations should be specific to the enterprise and match the region, taking account of
the key local environmental factors including: critical source areas (small areas that account
for most losses), climate, farming and grazing management, fertiliser and effluent
management, flow paths, soil types and characteristics.
• Various P mitigation measures can have variable environmental effectiveness. A useful metric
is $/kg of nutrient (N or P) retained on-farm
• Farm mitigations that are designed to address N leaching will not necessarily achieve the same
level of P mitigation (and vice versa). If changes to both N and P are required then assessment
of the efficacy of the mitigation for each nutrient should be understood.
• There is little research measuring the load of N and P from the harvesting of Radiata Pine
forest. Hence, losses may be greater or less than predicted using the OVERSEER model
predictions within the Rotorua Catchment. The data suggests that sediment loads from
harvesting are high; if we assume a set P concentration for this sediment then P losses should
also be high
• Key priorities to achieve P reduction: recognise that land management decisions heavily
impact P loss; target Critical Source Areas of P loss; assess the cost-effectiveness of
mitigations; develop a plan to put the appropriate mitigation options in place.
Nutrient losses from forestry (Dr. Peter Beets, Scion)
• Forestry plantations currently do not typically receive N or P applications to boost production.
• Forest sites converted from pastoral farming can be highly productive. The soil nutrient stores
at ex pasture sites are generally much higher than trees actually need. This can result in
legacy nutrient loss effects throughout the first rotation, and possibly longer.
• During forest harvesting, the nutrient cycle is interrupted and nutrient export (loss) during the
time where the seedlings are establishing can be expected to occur in drainage water.
• N leaching in the first 3 years after planting can be significant. N is produced from decaying
organic matter and can be as high as 70kgN/ha/year, prior to attenuation occurring.
• Stream water monitoring is not always a good indicator of losses from the forest operations.
Within-stream nutrient processes can be highly variable.
• Sediment runoff during harvest operations is a key source of sediment and associated P loss to
water. The management of sediment runoff during harvesting must be a key consideration
during forest planting planning. Provide buffer zones that effectively stop runoff during forest
harvest and ensure steep slopes that cannot be buffered are not planted for production
forestry.
Page 3 of 93

• Current forestry nutrient focus is on matching supply and demand (using modelling) and on
live and dead biomass-N pools. First rotation radiata pine initial places a high demand on soil
N stores (1000kg/ha removed from mineral soil), however subsequent demands on soil stores
decrease appreciably, assuming continued use of conventional stem only harvesting
operations.
Page 4 of 93

LAND TECHNICAL ADVISORY GROUP: PHOSPHORUS WORKSHOP 9am-4.30pm, Thurs 3rd Nov 2016, Energy Sigma Room, Energy Events Centre, Rotorua
Chair: Phil Journeaux Convener: Andy Bruere Facilitator: Warren Webber
Present: Alastair MacCormick Chris Sutton David Burger David Hamilton Gretchen Sveda (minutes) Hamish Dean Ian Power John Paterson
Paul Scholes Peter Beets Rebecca Burton Richard McDowell Rosemary Cross Stephen Lamb Stuart Morrison Warren Webber
Time Agenda Item Who Comment
9.00 1. Welcome: Introductions,
Workshop Purpose and
Format
Andy Bruere Purpose and Outcomes: to inform BOPRC on
(i) P loss rates, mitigation, costs & N
interactions;
(ii) P priorities for policy, research & extension
The outcome will be a statement from the
TAG workshop, specifically detailing what
we know about P, what data/info gaps are
identified and what recommendations for
application and research.
9.15 2. Phosphorus loss sources in
BOP region and why is
phosphorus an issue for
the lakes
a. Lake Rotorua P sensitivity,
P sources
b. P transport and future
loads
David
Hamilton
Note L Rotorua co-limitation; more recent P
limitation due to alum; summarise P
sources (UoW report); particularly note
forest P loss and the concern re P loss over
the forest cycle.
9.45 c. Bay of Plenty regional
overview: P limitation,
state and trends
Paul Scholes A few slides showing % of streams P or co-
limited across the region, range of values
(DRP and/or TP?); trends – for brevity,
perhaps just focus on Kaituna R to
illustrate?
10.00 d. Lake Rotorua proposed
policy on P
Stephen
Lamb
PC10 N Mgt. Plan P requirements; reliance on
getting enough P via N; science & policy
review method
10.15 e. Lake Rotorua 2032 P ‘load’
from land
Paul Scholes 2 slides on status quo Vs 2032 P loss using
Parsons et al 2015 model scenarios; show
high sensitivity to forest P loss rate.
10.30 Refreshments (30min)
11.00 3. P loss from farms Richard
McDowell
This is to link to Overseer P loss rates and
drivers like Olsen P (show graph of loss vs
soil P), stocking rate, rainfall/soil/runoff,
Page 5 of 93

a. Outline of the sources of P
loss
b. Quantification of P loss
c. Outline of P loss mitigation
strategies
d. Present the cost-effective
method of decreasing P
losses: maximising
mitigation on critical
source areas, are there co-
benefits associated with
decreasing N losses?
e. Other issues:
groundwater, lag times.
crop management and Critical Source
Areas.
Recap from AgR May 2016 slides plus give
latest P research e.g. from Clean Water
Productive Land and Our Land and Water.
This should include P source
differentiation within farms.
Describe P guidance focusing on P mitigation
strategies in actual practice. Discuss
efficacy and, if possible, the quantitative
P reductions to be expected. We would
like to see how effective the strategy was
in getting P reduction and what methods
were most successful in achieving results
vs. those that don’t achieve.
11.45 f. Group Discussion (30min)
- P loss from farms
12.15 g. Possible projects to
improve knowledge of
farm P loss and mitigation
Paul Scholes
David Burger
Ian Power
Canvass 3 possible projects: (i) Redo P soil
sampling to build on BOPRC’s soil health
data, Redding et al (2006) (ii) Case study
to optimise P mitigation on an N-
mitigated farm; (iii) liaise with fert
companies to assess trends in Olsen P and
P fert use, including the L Rotorua
catchment. Attendees can discuss and
refine project scope with presenter (to be
recorded on whiteboard)
12.30 Lunch (30min)
1.00 4. P and N loss from forestry
a. Why is it important to
consider N loss from
forestry; changes in N over
the forest cycle.
b. Research and data on P &
N loss rates; harvest risks
vs whole cycle; Rotorua
applicability
c. NuBalM forestry nutrient
model; scope to link to
OVERSEER
Peter Beets An overview of forestry P & N loss, including
from Baillie & Neary 2015 and Davies 2014
(latter N-focused) and any Rotorua-
specific data (still regionally relevant).
NuBalM could be demo’d plus explain the
hydrology module to improve N/P loss
estimates, potential OVERSEER links and
timeline for this to occur.
We want to cover both N & P due to the
synergy and risks identified in 2c/2d
above.
Why has N has not changed with new
OVERSEER outputs?
We could agree to a ‘resolution’ to ask MBIE
and Overseer Ltd to expedite NuBalM
development and its integration with
Overseer
1.30 d. Group Discussion (60min)
– P & N loss from forestry
2.30 Refreshments (30min)
3.00 Workshop Recommendations
The aim is to consider the
preceding P topics and
provide advice to BOPRC
Facilitator:
Andy
Bruere
Ideally we want some specific direction on
(i) how to optimise P mitigation alongside N
mitigation;
(ii) P monitoring & measurement of gains
(iii) N & P loss from forestry
Page 6 of 93

Identify outcomes.
We anticipate a detailed
statement from the
workshop outlining:
1. What we know about P
loss,
2. P and N loss from Forestry,
3. P research and P info and
research gaps,
4. Recommendations on the
importance of P control
and future
recommendations for
research and information
to support BOP land use
improvements wrt P
(iv) research priorities and /or leveraging
opportunities;
(v) develop P good practice or NOT;
(vi) anything else the group prioritises e.g. P
attenuation.
4.00 Action Summary Phil
Journeaux
Recap specific recommendations, follow-up
actions
APPENDIX TO AGENDA:
DRAFT Land TAG advice on phosphorus sources and mitigation (from May 2016)
1. The OVERSEER P sub-model was recently reviewed (Gray et al, 2016) and, while there was
good prediction of P loss from pastoral systems, multiple potential improvements were
identified, including: non-pastoral uses; more comprehensive sediment losses; and spatial and
temporal capability e.g. Critical Source Areas.
2. Attenuation of P losses (beyond the source e.g. farm or forest) is highly variable and needs to
better understood, including clarity on the ‘boundary’ of OVERSEER P loss predictions
3. Forestry P losses need to be better understood, both for the more vulnerable harvest window
and the long term average.
4. On-farm mitigations that reduce both N and P losses are useful but we do not have good
information on what landowners are actually doing. Farm stocking rates and feed budget
should be the first focus to reduce both N and P losses before jumping to mitigation options
5. The cost effectiveness hierarchy of P mitigation techniques (e.g. as presented May 2016 by
David Houlbrooke) is useful at a generic level but can vary a lot between farms and regions.
6. As with other recommended farm practices, it is important to consider:
a. How to apply learnings via farmer peers and specialist advisors.
b. What happens after advice is provided i.e. auditing is important
c. Reducing the variety of messages given out there
d. Holistic environmental management plans improves buy-in
e. Farmer catchment groups enable farmers to compare notes and support each other
Page 7 of 93

Page 8 of 93

Welcome: Introductions, workshop purpose and format
Presenter: Andy Bruere
We want to inform the Regional Council on P loss rates, potential mitigations and the costs of
these sorts of options and what sorts of interactions we get between P and N if we take either
N or P out of a system
We’re particularly interested in Forestry
We’ve been focussing strongly on Lake Rotorua due to Plan Change 10 (PC10) which refers
specifically to managing nitrogen within the Lake Rotorua catchment
Page 9 of 93

PC10 is focussed on N, but we’re interested in what impact forestry operations have on
nutrient losses, because there are many assumptions about the reduction in nutrients
reaching the lake as a consequence of conversion to trees
We are not clear on whether Overseer is dealing with the impact of harvest cycles or just the growth stage of forests. In recent Overseer updates there was no step change in losses from forestry – why is attenuation between the root zone and lake is deemed to impact pastoral land but not land in forest/bush/scrub given that there was a clear 80% step change in N leaching from pastoral land
uses.
Page 10 of 93

The University of Waikato and the Water Quality TAG have always said that we need to focus
on both N and P
o current P load is est. at 49tP
o sustainable load is est. at 34-39tP to the lake
o hence we have a 10-15tP reduction target, but no regulation in place to this
The University of Waikato have broken the P load down into anthropogenic and baseline
loads. Nearly half is from natural sources. We need to reduce the anthropogenic load by 43-
64% to achieve the P reduction target
Outcomes from this workshop:
o Detail what we know about P in the context of lakes and farming land use
o Where we need to focus to get best P reductions – concern is that the numbers that
we get from estimates have all sorts of conditions around them as to where the loss
might be and how accurate the information is
o Alignment between N actions and P reductions
o What we know about the impact of forestry operations on P and N compared to
Overseer predictions
o Data and information gaps
o Recommendations for application and research
Page 11 of 93

Page 12 of 93

P loss sources in BOP region and why P is an issue for the Lakes.
Presenter: David Hamilton
Page 13 of 93

Rotorua is a complex lake with 9 major inflows, and as many as 20 surface water inflows
80 km2, mean depth 10 m, eutrophic
Alum dosing is done at two sites, Puarenga and Utuhina
David Burger differentiated different algal groups in response to nutrient additions.
Cyanobacteria had the largest response to N and P increases at the same time – the combined
response is larger than seen with just N or just P
Nutrient impact assessments are made by adding a nutrient to a mesocosm within the lake.
This protocol is challenged by some - for example, David Schindler contends that nutrient
Page 14 of 93

assessments are valid only when applied on a ‘whole of lake’ basis. Nonetheless, microcosm
methodology has acceptance by many in the scientific community.
A student worked on three lakes, added N and P to them and got some great data in
L.Rotorua. Adding one or the other caused increases in algal growth, but adding both gave the
greatest increases.
Lake Rotorua has some of the most prolonged sequences of nutrient bioassay research.
You don’t always get the same responses – sometimes the response is to N or P, but often it’s
to both simultaneously
Page 15 of 93

It depends where you are in the lake, what season you’re in as to which nutrient is limited
Adjacent to an inflow (transition zone) there is no nutrient limitation because the inflowing
nutrient alleviates any nutrient limitation
When you add nutrients to the middle of the lake, there is a marked increase in growth
In L. Rotorua, there’s been an amazing drop in cyanobacteria biomass in recent years – it has
decreased markedly
Recent evidence indicates that Taupo may be shifting to P limitation because of a shift to
ongoing increases in nitrogen loading to the lake. Interestingly, none of the calculations have
Page 16 of 93

ever built in the potentially important contribution of N-fixing cyanobacteria to nitrogen in the
lake.
Heterocystous cyanobacteria can fix N, and are the dominant type in Lake Taupō, a lake which
may have been shown to have switched to P limitation. They have the ability to fix N , so you
can drop N but you also have to drop P by a particular ratio to prevent them from potentially
becoming dominant
Alum dosing is knocking out the phosphate in L. Rotorua, and Total P has been dropped down
to target levels. Target level is 20ugP/l
The alum dosing prevents so much P from being released during stratification events
Page 17 of 93

Alum dosing has pushed both dissolved and Total P much closer to the baseline
Ground water that has been in contact with the rhyolitic rock leaches P (phosphate) so there’s
a strong baseline or natural phosphorus. The Awahou and Hamurana streams are particularly
dominated by the ‘natural’ baseline load, despite these also being significant agricultural
catchments
Diffuse urban runoff and storm flow is ‘ungauged’ but has been calculated as a significant part
of the anthropogenic load
Anthropogenic load is largely in the form of particulate P. An obvious target for P mitigation.
Page 18 of 93

The P yield has been separated out by anthropogenic and baseline loads. Waiohewa, Utuhina
and Puarenga have the highest anthropogenic loads
The above graph shows that the dissolve P concentration increases in relation to residence
time and the consequent exposure to ryolitic rock
Blowouts happen less often thanks to the Kaituna catchment control work, but ephemeral
water flow is an ongoing issue which John Paterson has been working on. The P runs off the
land, through the streams and into the lakebed, where it is released during stratification
events when the lower layers of the water are anoxic
Page 19 of 93

Ephemeral run-off loads are high in particulate phosphate
The above graph shows a moderate storm event resulting in elevated suspended sediment
and particulate P loads
Page 20 of 93

Lake Rotokakahi (Green Lake) is an example of what can happen at and around harvest time in
a predominantly afforested catchment. Harvesting close to the lake margins resulted in water
quality declines during the years 2009-2012
Page 21 of 93

This figure demonstrates P translocation from terrestial land which is high in P, through
stream systems, and thence to the lake. Once in the lake sediments this P contributes to the
quantity of P released in stratification events
There is much to be gained from reducing P run-off to streams
Need to retain the P on the land
Page 22 of 93

When the lake stratifies in summer this causes deoxgenation of bottom waters and a
consequent release of nutrient from bottom sediments. Alum has had a significant role in
reducing this release. A reduction in nutrients results in a reduction in algal growth, which in
turn reduces the volume of decomposing material settling on the lake bed. The injection of
alum is effectively initiating a positive feedback loop, Excess stream dosing of alum is helping
to control both natural and anthropogenic sources of P.
Page 23 of 93

A whole of lake nutrient budget has been attempted. Half of the stream and groundwater inputs are
from geological sources; this increases the challenge of removing sufficient P from other sources
Inputs Nitrogen (tN) Phosphorus (tP) Rainfall 30 1.5 Geological 0 20.2 Major streams 439 18.7 Minor streams 154 8.5 Release from sediment 604 60 Total Inputs 1227 109 Outputs Deposition to sediments 1025 93 Denitrification 60 0 Ohau Outflow 142 16 Total Outputs 1227 109
Page 24 of 93

Page 25 of 93

COMMENTS
Hamurana Mitigations
A possible strategy for L. Rotorua P control is to treat the Hamurana stream inflow via water
treatment plant technology; take 80% of the water, put it through a flocculation process to
remove the P and put it back in at the same point. There is even potential to reactivate the
alum (although not easy, and would require pH manipulation). P in the Hamurana outflow is
predominantly dissolved P and is very low in particulate P – this improves the potential
effectiveness of flocculation. This strategy differs from in-stream dosing in that the alum is
removed rather than dispersed to the lake.
Stormwater Mitigations
Both diffuse and point-source urban stormwater discharge are a significant contributor to in-
lake Phosphorus
The effectiveness of stormwater P mitigation could be greatly enhanced by improved
engineering interventions
General
A question arises whether it is possible to alum dose as long as we need to, perhaps 20-30
more years. It’s related to how quickly we get the changes in the catchment, and how quickly
they translate into results in lake
The modelling we’ve had done by NIWA has shown about 70% of changes can be expected
within 35 years
Here in Rotorua we have a larger groundwater P concentration than in other catchments due
to the rock types and high groundwater residence times
Alum dosing may be relatively effective in the Rotorua catchment because it’s constantly
being reworked between the bottom sediments and the water column
Page 26 of 93

P loss from farms
Presenter: Paul Scholes
Quick look at the Tarawera group of lakes – Tikitapu, Rerewhaaaitu and Ōkaro
Ōkaro is showing improvements with the work being done there
Ōkataina, Rotomanana and Tarawera and showing a slight increase in P
The TN/TP ratio of these lakes is quite variable, keep that in mind in terms of targeting P
efforts in those systems
Page 27 of 93

We monitor a whole range of streams across the BoP region, located in indigenous forest,
exotic forest and pasture
Page 28 of 93

Page 29 of 93

CLUES is a GIS tool developed by NIWA for determining nutrient loads. Using it, you can see
where the hotspots for P load are within the catchment. CLUES generally performs better for
N than P.
We’re looking at a range of models for our work, and CLUES is just one of them. It may not be
suitable for what we’re doing due to simplified lookup tables, and data that differs slightly
over measured values
Page 30 of 93

In the river estuaries, dissolved nutrient concentrations and Chlorophyll a is measured, and
the lower reaches of the Kaituna appear to be mainly P limited at the moment
Page 31 of 93

Page 32 of 93

Plan Change 10 (PC 10)
Presenter: Stephen Lamb
PC10 has a nitrogen target (435tN sustainable load), but there isn’t a set target for
phosphorus due to there not being enough evidence for P at the time the Regional Policy
Statement was drafted
Page 33 of 93

The decision was made to focus on N, but we know there’s significant load of P from
anthropogenic sources
Our position around P is that the Rules focus on N but they do recognise P
We continue to work on the basis of the Lake being co-limited. N and P are both part of the
wider programme
Assumption is being made that N reductions will also reduce P. PC10 is built on best science,
and we try to use it when we can
Page 34 of 93

There’s a science review every 5 years, and results of review may require Council to initiate a
formal plan change in the future to amend lake loads or include P reduction
We try to focus on up to date science as we go
Method 2 is a key part of the plan change, and this is where P comes in
o We focus on N but we don’t lose sight of P
o The N specific changes being made on land will include reducing stocking rates and
areas of cropping, retiring some land
Page 35 of 93

Comments:
We have three parts to the N reduction programme
o The rules will bring down N losses
o $40m allocated to reduce N loss via an Incentives Scheme
o Additional funding allocated to getting rid of N through gorse conversion (to trees)
The Council is not targeting P with the rules, but it is still considered
Page 36 of 93

P losses and mitigation –
Presenter: Richard McDowell
Catchment scale data from the 70’s to now
There is a wide variation due to climate, soil type, topography and land management
Sources of P – in terms of surface runoff losses, there is a relationship between soil test P
(Olsen P) and the P in surface runoff
Page 37 of 93

Different soils have different anion storage capacity (ASC), so different soils have different
propensity for P losses. These losses are also influenced by hydrology
Page 38 of 93

The same relationship between P loss and soil ASC occurs in sub surface flow
Page 39 of 93

These losses can reach groundwater
P-rich aquifers connected to surface water can enrich base flow of the stream.
Fertilisers, grazing, and dung are the main sources of P loss
The potential for loss declines quickly with time since deposition
The degree of initial enrichment can vary quite a lot dependant on solubility
It’s not only the form, it’s also the rate and the placement in time that will influence the loss
(eg, runoff events)
Effluent – too much effluent applied at too high a rate can result in ponding which then has
the ability to drain into surface water flows and through artificial drainage systems.
Page 40 of 93

There are times when there are no storm events (green bars), but effluent is still making it into
the streams. This could only be effluent lost via artificial drainage or ponding
Forage crop grazing is another source – the take home message is that although they occupy
less than 10-15% of the land area, they are relatively high emitters so they do occupy a
relatively high percentage of the farm footprint (perhaps 30-40%)
Page 41 of 93

Tracks and lanes are used daily, and the runoff from them has the P concentration of raw
effluent. This is a concern if the runoff from these areas can go directly into waterways
What can we do about it?
Page 42 of 93

The recommendation is to remain as close to the agronomic optimum as possible
Fertilisers (timing, placement, solubility): applications of super phosphate in a wet period (e.g.
June) lead to greater concentrations being lost than applications in dry periods (e.g. Dec).
To mitigate the flush of water soluble P into the soil solution and potential loss of this P should
a runoff event occur, use a less water-soluble P fertilizer
Page 43 of 93

At a catchment scale, two catchments were treated the same (P applied in winter) but one
was treated exclusively with RPR (low water soluble P fertiliser) and there was a 38% decrease
The mitigation for effluent is to use a low rate application, which is also low depth. This
results in drainage or leachate that’s significantly lower in nutrients and E. coli.
Page 44 of 93

Restricted grazing: during winter, only allow stock to have maintenance feed for 3 – 4 hours,
preferably on an area where effluent is collected ie. a feedpad. The lesser quantity of excreta
results in approx. 30% lower losses
Drains – artificial drains can be augmented with a backfill that has P retention (P-sorbing)
rather than greywacke
Page 45 of 93

Alum (aluminium sulphate) can be used on topsoil and will also decrease P loss. Can result in
approx. 30% reduction in losses. It’s very expensive, so only useful in select locations like
tracks or lanes
Stream fencing. Often a mandatory requirement.
Page 46 of 93

Sorbents in and near streams – steel smelter slag is heavy, a good P-sorber and non-toxic. It’s
a short-term fix because it has to be replenished
Natural and constructed wetlands. Good for nitrogen, but not necessarily for P as the process
that removes P via anaerobic conditions will dissolve P from sediment. This is made worse in
wetlands that have a high sediment load. Detention bunds might decrease this sediment load
before flow reaches a wetland.
Page 47 of 93

Split grass-clover – Clover has greatest P demand. Split the sward into monocultures and have
the P-efficient ryegrass in low-P areas with runoff (e.g. along area that floods during runoff
events), and the P inefficient clover in high-P areas that have less chance of runoff (eg away
from ephemeral waterways). To make low-P areas, conventionally till the soil to invert the P
rich topsoil and reduce a 30 Olsen P soil to 15 Olsen P instantly, then re-sow with ryegrass.
Clover sward (maintained at 30-40 OP) is able to express itself better, and in this trial resulted
in a 10% increase in milksolids and 45% dissolved reactive P (DRP)
Negligible impact on N
Page 48 of 93

The above mitigations represent only about 50% of those available.
Mitigations should be specific to your enterprise and matched to your region – climate, flow
paths, soil etc
Main take home message is to always have regard to the cost effectiveness of measures, and
be objective. A useful metric is $/kg of nutrient (N or P) retained on-farm
Take account of lag time, but for most P mitigations this is not significant (within a season)
Ensure mitigations are correctly implemented and maintained – target the right mitigations at
the right place and right time. Dealing with Critical Source Areas (CSAs) can dramatically
increase cost-effectiveness of mitigation strategies
Page 49 of 93

Generalised vs Targeted Mitigations
Targeted = execute specific strategies which may mean higher cost
Page 50 of 93

Page 51 of 93

A generalised approach sees easy low cost – highly efficient strategies implemented first before
those that require more resources (moderate) or even infrastructure (hard) changes. This approach
also includes co-benefits for reductions of other water pollutants such as sediment and faecal
microorganisms
Page 52 of 93

The above graph attempts to show the differences between focussing on either N alone, or
on both N & P. This is reflected in the X-axis for each graph; the graph on the RHS applies the
various mitigation strategies in a different order to the graph on the LHS. There is also an
attempt to take into account both cost-effectiveness and the “can I be arsed” factor
A focus on both N & P results in rapid gains for P mitigation and slower gains for N, and
some impact on farm profitability
Focussing only on N gives more rapid gains for N mitigation, and a similar impact on farm
profitability. A singular focus on N will not bring significant reductions in P loss. There are
sufficient differences in the flow pathways and loss mechanisms of N and P that when the
question is posed “Are there significant gains in P mitigation when the focus is on N?”, the
answer is “No”.
Page 53 of 93

Questions and Discussion
(Note: audio quality of recording was often too poor to capture all of the following discussion)
JP: What is the influence on N and P mitigation from land use change to forestry?
A model has been supplied to EBOP showing the relationship between percentage pasture
(and by difference forestry) and median P concentrations for a river environment class. The
losses are lower. However, if harvest coincides with a period of significant runoff I would
imagine the difference could be small. These perturbations are not accounted for in Overseer
– being an annualised long-term average.
The load from the harvesting of Radiata Pine is probably greater than we thought, but there is
little data.
AB: Does production forestry have a similar nutrient footprint to native forest in Overseer?
Yes. The exception is during harvest (as noted above).
CS: Is the impact of a winter or summer forage crop averaged in Overseer over a year?
Yes. The high initial losses are diluted by lower losses during the rest of the year.
AB: The forestry context can be quite variable (eg. Lake Rotokakahi where much of the harvest
impact is on a single catchment, versus a forest block on the Canterbury Plains, or the Central
Plateau)
It should be a quick and simple fix within Overseer to better capture extreme temporal
variations caused by the impact of harvest, assuming that data is available which defines this
Page 54 of 93

in relation to soil, slope, climate. If not, stream sediment records could be used as a proxy
calibration.
SL: Going back to the impact on P resulting from a focus on N. How much can be gained from a
focus on N?
If you focus on N mitigations only (lower stocking rate, low N feed, low N fertilizer inputs), you
are doing something that is counter-intuitive if you want to focus on both N & P
SL: Surely if you take a dairy farm and convert it to forestry, or decrease the intensity of farming
by conversion to a less intense land use, there must be an impact on P?
It is a common misconception that if you decrease your stocking rate you will also decrease P.
Not true. This only happens with N because of the overwhelming effect of N loss by urine
patches. Urine patches do not drive P losses, so reducing stocking rates will not make a huge
difference to P loss – whether its’ a mob of 200 or a mob of 150 it makes little difference to P.
The potential for runoff, slope and soil type (viz ASC) are the main factors influencing P losses.
Mob grazing of small areas will increase P loss.
AB: So it’s a matter of changing management to significantly reduce the high per ha stocking rates
created by strip grazing?
Absolutely
AB: Let’s go back to the slide which addresses P loads coming from different land uses
Page 55 of 93

Salient point is that it is context sensitive. Can’t change soil type and this can be a significant
influence. A deer farm with many wallows may generate 4/6/8t/ha of sediment, but it’s only
coming from the 1% in wallows. Knock out the wallows and you knock out the problem.
AB: Why in the above slide with sediment loss so high with deer, is the P loss not also high?
Wallows can look very muddy, but in terms of P, most will be coming from excreta via direct
deposition not from the soil, which can be very low P sub-soil.
In regard to the benefits of reducing Olsen P, surely if you reduce stocking rate there will be less
need for a high Olsen P, so there should be an indirect benefit that accrues to reduced stocking?
However, you will probably not go below the agronomic optimum so depending on the soil
type this may or may not decrease soil P losses (compare the yellow and red soil P loss lines
below. There remain all the other factors and sources of P loss.
PJ: Perhaps we are better off talking about the Olsen P which provides an economic optimum,
rather than to focus on the agronomic optimum?
This is probably true, but the problem is that there is considerable variation in the economic
optimum for different regions, soil types and contour. For that reason we tend to focus on an
agronomic optimum for Olsen P
However, in regard to P loss the far more important focus should be on Critical Source Areas
(CSAs). CSA’s are influenced most by hydrology, before considerations of slope, soil type,
anion storage capacity and Olsen P. Where you are in the catchment in relation to streams has
a huge influence on CSA’s
It is then a matter of deciding strategies for CSAs and non-CSAs
Page 56 of 93

Consideration of Olsen P has it’s place farm-wide, but greater gains are made by mitigating P
losses from CSAs
AB: What is the reliability of quantifying nutrient loss?
If Overseer is blocked correctly so that the majority of factors that influence P loss are
captured, the relationship between modelled loads and measured loads is approx. 80%. This is
similar for N.
Discrepancies come when Overseer is not properly blocked e.g. missing important factors that
describe CSAs. Overseer does have a tick box for deer wallows. However, people tend to block
according to farm management not P losses. Hence, the 10% of a block that might have most
of the CSAs is diluted by inclusion in a non-representative block.
MitAgator (Ballance Agri-Nutrient) does a reasonable job of capturing CSAs
AB: are there other means of monitoring and measurement of P gains?
Lookup tables for different farm typologies are available, but that would be stepping
backwards from what you could do with Overseer because you are going for even more of an
average. However, at a catchment scale tables could be fine for estimating gross changes –
e.g. if change went from 30% through to 15% of a land use, how much on average would it
change; you could have confidence intervals about that but they would be quite large; these
would narrow depending on how many farm typologies you had and the representativeness of
those typologies to the management within that catchment. If you had 50 different farm
typologies you could get a reasonable answer which is close to Overseer, but why not just use
Overseer and put the effort into getting the blocking as accurate as possible.
AB: What would be your advice around the development of good practice guidelines for P
management?
Apply strategies that are suitable to your farm, applied them to critical source areas (assessed
objectively, perhaps via MitAgator, or Farm Environment Plan) applied according to cost-
effectiveness and with the “can’t be arsed” factor taken into account (ease of
implementation)
AB: You have given us your thoughts on P losses associated with forestry
Advocate for a “simple fix” in Overseer to capture the perturbations associated with harvest.
This assumes we have data of sufficient temporal resolution to capture the perturbations
associated with harvest.
AB: Any research priorities with forestry?
Ensuring that the data above is available, otherwise the result from Overseer will not be as
good as it could be. That would probably be a priority in the Rotorua lakes catchments, but
may not be the priority in other parts of the country
AB: We talk a lot about attenuation with N. What about attenuation with P? You have said that if
you have good block setups in Overseer then you could get approx. 20% attenuation for P.
Page 57 of 93

Many people use attenuation to mean decreases associated with uptake between the source
of the loss and the site of impact
With N we commonly say 50% gets knocked out as it goes through
With P it will vary dependent upon flow regime and the sediment. If you have a highly reactive
form of P (e.g. DRP) you will get a higher attenuation in the base flow because it will get
sucked up into sediment. Conversely, if you have frequently flushed streams there will be
minimal attenuation
The good thing though is that the attenuation factor for P is taken into account and is
reasonably well modelled within CLUES
PJ: Can you expand on the movement of P to groundwater
The enrichment of streams associated with the influx of P through groundwater occurs where
there is a coincidence of high Olsen P soil, soils that have relatively low anion storage capacity,
are relatively free draining, and coupled with an aquifer with low anion storage capacity that
feeds into surface flow. These findings were based on a 10 year time frame of data collection
and P movement to streams. Meaning it still could happen.
There has been some data locally to suggest that there is some movement of P through the
soil profile, but insufficient data to be statistically robust.
AB: Even though we have free draining soils locally, perhaps the anion storage capacity is too high
for there to be significant P movement through the soil?
Much of the data has been collected over a 10 year time frame. It is possible that in a
20/30/50 year timeframe even high anion storage soils can leach P if enough P is being added
to it
With peat soils in the Waituna you see P in the streams within a day on a very small surface
area
A soil in Central Otago which might have an anion storage capacity of 18-20% we saw
enrichment at 1.5m within a year
Lincoln University Dairy Farm has an anion storage capacity of 25%. Interestingly, instead of
leaching 0.3kgP/ha/yr, after 13 years it is leaching 1.5kgP/ha/yr
AB: With the local WWTP Irrigation System P retention was assessed at 80-100 years
This would be to complete saturation and significant P would move well before that is
reached. Even high anion storage capacity soils will leach P if you add enough to it
Of course P retention does not affect loss by surface runoff.
AB: What should be our priorities?
Know your Critical Source Areas of P loss
Understand the cost-effectiveness of mitigations
Have a plan to put the appropriate mitigation options in place. Management is the most
important thing.
Ensure monitoring is in place for the assessment of efficacy and compliance
Page 58 of 93

Improving our knowledge of farm P loss –
Presenters: Paul Scholes, David Burger and Ian Power
Paul Scholes
Looking at projects repeating the work of Redding et al, to see where the P baselines are at
now
Also looking at working with fert companies to look at their info on fertiliser distribution in the
catchment. Ballance may be willing to contribute
Page 59 of 93

Case study farm to optimise P on an N mitigated farm – good relationships with some farmers
who may be willing to participate
David Burger (oral presentation, no graphics)
Interested in looking at LiDAR and hydrological paths. Looking at test cases
Opportunities for adding detainment bunds and coming up with targets
5-6 case study farms and profiling flow paths on them
Sub catchment groups working together
Controlled drainage (similar to detention bunds but involving culverts) is used extensively in
Scandinavian forestry so they can manage harvesting on the peaty soil, and it does have quite
a significant mitigation effect
work is going into modelling the best places to put detainment bunds based on ephemeral
flow paths
Planning riparian buffers is also important
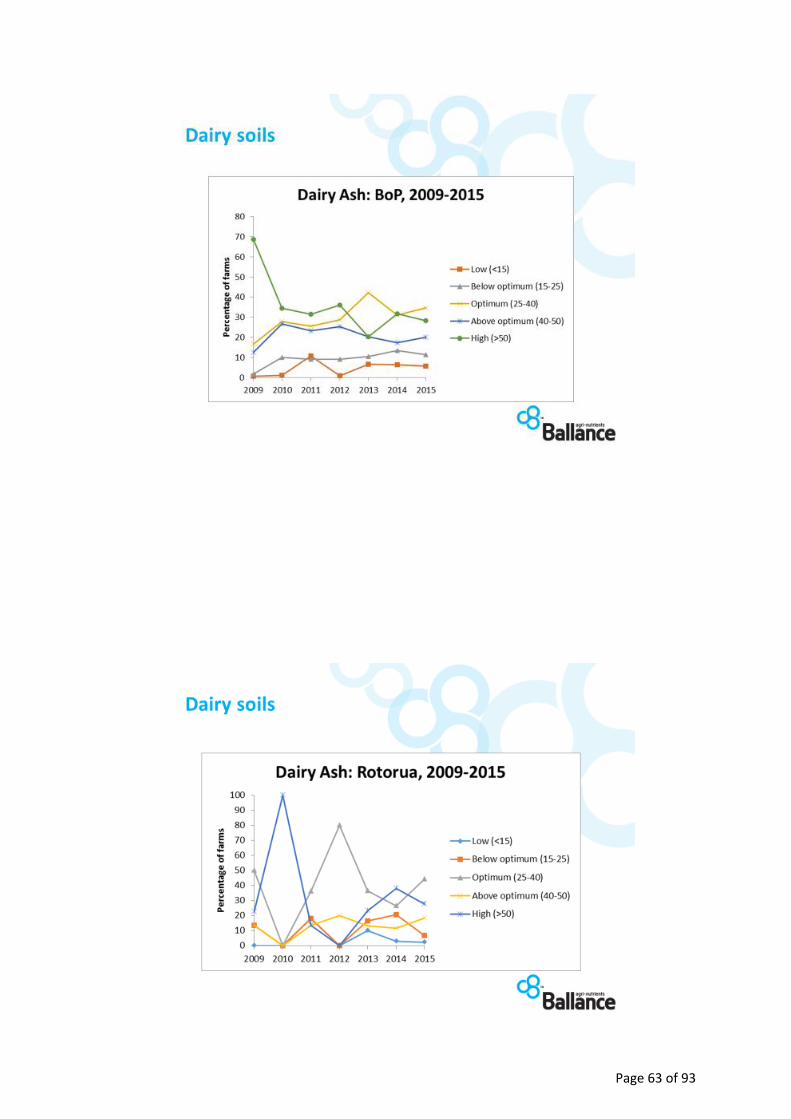
Ian Power
Olsen P survey done over 7 years, and soil test categories used for dairy and dry stock soils
o Statistics still being analysed
o Some years no samples were taken, and the number of soil tests varied
o Some tests were repeated on the same property but different blocks
o More farms were in the optimum, above optimum and high categories across the BoP region
o Most reliable data from ash and pumice soils for both dairy and drystock
o No data for Drystock peat soils
o The proportion of farms with high Olsen p does seem to be declining
o Gaps in data still need to be filled
Page 60 of 93

Page 61 of 93

Page 62 of 93
Page 63 of 93

Page 64 of 93

Page 65 of 93

Page 66 of 93

Page 67 of 93

Page 68 of 93

Page 69 of 93

Page 70 of 93

Nutrient Modelling
Presenter: Peter Beets (Scion)
Nutrient cycling – forests are thought of in terms of being closed, the reason is that when you
grow a plantation forest you don’t fertilise the soil if you want it to grow faster, you fertilise
the trees
The crop is there for 2-3 decades, cycling the nutrients so the idea is to get the nutrients into
the cycle as quickly as possible. Both N & P can be limiting. Unless you get these nutrients into
the organic cycle, it starts to cost.
Page 71 of 93

Forestry is all about getting nutrients into the trees and keeping them there. Trees are good
at that, and most sites work very well so there’s only a few sites where you need to
compensate and give a boost of N or P, for example on sand dunes
When we harvest, we then do weed control and that’s something we need to look at more
seriously
o It’s cheaper to do a blanket weed control than it is to do spot-spray
o Weeds take up nutrients just as trees and grass do, so weed control is
something we need to consider
Page 72 of 93

When the harvest occurs, you interrupt the nutrient cycle and you get nutrient export during
the time where the seedlings are planted again since they don’t have much uptake
Overland flow starts again in the absence of trees, and that’s what moves the sediment
Forestry has come a long way from bulldozing as they used to do, to now when they try to
maintain the organic matter pools from the slash onsite and windrow etc
If foresters are careful, there’s no need for them to purchase or add fertilisers
You’re not going to be doing a lot of fertilisation on forestry, and none at all on ex-pasture
sites
You don’t really have overland flow, and the soils tend to become more permeable over time
and what was originally maybe not infiltrating, will begin to once you have a forest on there
o As a result of trees growing in a stand in a forest, you get more uptake of
nutrients so less nutrient export
o Native forests don’t take up as much nutrients as plantation forest. Pines
have a much bigger requirement for N than native trees
o In theory, planted forests should be able to hold nutrients better than
natives because you’re periodically exporting some of the nutrients in logs
The main loss of nutrients from plantation forests is sediment runoff during harvests
Stream water is a poor indicator of what’s going on in the forest – there’s within-stream
processing which is highly variable, and there are lag effects. Better to deal with groundwater
If you plant an area which is excessively high in nutrients, eventually the trees have had
enough and there is no net uptake from the soil
Trees change the shading in a waterway, the vegetation growing in those areas will be shaded
out so there are several impacts – no in-stream processing, the stream will also start to
change due to sediment runoff where the stream channel vegetation has disappeared from
areas previously vegetated by under-storey species or pasture
Sediment comes from intact forests, especially afterdisturbances (eg harvesting, windblow,
excessive rain). It’s a natural process
Page 73 of 93

Sediment will be greater in previously pastured sites, and it takes at least a rotation to shift
this ephemerally stored sediment.
The impact of sediment in forests with no streams (eg. Kaingaroa) is negligible because it’s just
moving to a different part of the forest
If you can’t build a physical barrier to intercept sediment to the waterway, the forestry
operation shouldn’t be on the steep slope down to a stream. Grow it further back would be
better, but how would we convince foresters to do that?
Kāingaroa is growing at approximately 80% of possible rate because it’s N limited, but they
don’t want to lose any applied nutrients so they’re looking at ways of optimising nutrient use
Ex-pasture sites are high producing sites – they have way more nutrient available for uptake
than trees actually need. The legacy effect of farming lasts for the first rotation
o After a harvest, you get N loss of 5kg per hectare on average, for the first 1-3 years
afterwards. This is because 1-3 year old trees don’t take up as much nutrients as
mature trees, and decaying slash/organic matter will still be present, and there is
also more drainage occurring owing to the reduced pine leaf area index following
harvesting
6-12 years, the trees are closed canopy and intercepting more water
If you’ve got an inherently low nutrient status site, it doesn’t produce much nutrient export.
There’s a little window in the first three years after harvest, but after that nothing to speak of
When urea (200kg/ha) was added at age 14yrs, ammonia in soil went up after a week and
peaked at 4 wks, nitrate went up after two weeks and persisted for at least 3 yrs
After the 1st week 90% of the N was still detectable in the first 10cms of soil
Page 74 of 93

After 3 weeks, 40% of N had been taken up by the trees. Trees have potential to take up 100-
200kgN/ha in one year
So virtually no leaching
There are going to be poor nutrient sites, sites that are rich, and some that are in between
Current focus is on matching supply and demand (NuBalM model) and on live and dead
biomass-N pools
Future developments focus on soil processes
Developed parameters that reflect the potential for the site
After 30 years, there’s about 1000kg/ha of N in the stand
Page 75 of 93

Next steps for NuBalM (next two years)
Quantifying nutrient pools now, and the model to be run against those in order to calibrate
and tune it
Ensuring that it’s accurate and working
Identify soil parameters that determine stand productivity
The forestry sector sees NuBalM as a useful tool for the future nutritional management of
forests
Forestry companies are very interested to find out what their current numbers are
Concerns include leaching and growth rates
Page 76 of 93

Trying now to improve predictions with reference to soil properties
Pasture systems with enough rainfall, will transpire about the same as forests do
Interception is leaf area driven, not atmospheric
Excess nutrients will leach because the trees don’t need all of it – it’s more than they can use,
hence the interest in matching nutrient inputs with crop potential demand
Peter is eager to hear about environmental monitoring studies to improve estimation of
nutrient leaching loss under different forest growing conditions and treatments
Page 77 of 93

Unless physical barriers can be put in place to trap sediment, the only real way to stop
sediment runoff during harvest is to stop planting so close to waterways. It’s simple, but
foresters are getting mixed messages from councils about whether to replant those areas
Pine species left behind and never logged will eventually be replaced by natives
If they just leave the trees on the very steep slope without logging it, eventually it’ll turn back
into native forest – this would essentially result in a riparian zone but the foresters are unlikely
to go for that as with farmers they prefer to use all the land available to them
Page 78 of 93

The above graph shows how the quantity of N in the needles declines with increasing
needle age and is recycled for reuse prior to litterfall. The needles in 1st year are drawing on
the biomass nitrogen of needles from the previous cycle.
Litter is about 1%, but the concentration of N in the forest floor is double that (2%), during
organic matter decay, before N becomes available for tree reuse
Page 79 of 93

Stem and branch dead matter is also recycled to the forest floor and is available for reuse
Page 80 of 93

Page 81 of 93

By the end of the 1st cycle you have accumulated about 1000kgN. This remains at a similar
level in the next rotation.
If you can get enough N into the trees in the first rotation there is a good chance that will be
maintained in subsequent rotations, so long as the organic matter pools are maintained.
Only about 200kg/ha N goes off in logs and there is approx. 1000kg/ha N available
When you see N leaching in the first 3 years it is coming from slash and decaying organic
matter at approx. 70kgN/ha. There is simply too much for the young trees to handle at first
(can use about 20-30kgN/ha)
Page 82 of 93

Page 83 of 93

Page 84 of 93

Page 85 of 93

The difference between a pasture and an afforested site is the water that is intercepted by
the trees and never reaches the ground
After harvest this interception is removed and rainfall reaches the ground, and dramatically
impacts drainage rates
Trees can access soil nutrients at considerable depth (3-5m) if root systems are unimpeded
Page 86 of 93

Page 87 of 93

Page 88 of 93

Page 89 of 93

Page 90 of 93

Workshop Conclusions and Recommendations - Group
Importance of P control
It’s what the Water Quality TAG group came up with about ten years ago – a statement
about the importance of nitrogen and phosphorus. Even if you look at that again now it
would still be relevant (version 2 recently revisited)
Alum dosing – in-lake mitigation, benefits/risks and other options
Alternatives to alum
If you concentrate on N and ignore P, you’re not going to make the progress you expect
Fixation on N only, means that you may result in a cyanobacteria bloom. P must be looked
at as well
More detail around the likelihood that we can turn alum dosing off eventually, and still be
able to manage the levels
We could probably just about put some numbers around the internal anthropogenic P load
10 years ago versus now to work out the current budget
Alum releases under high pH (8.6) and low pH (below 6) so there’s a risk factor there, which
is why it hasn’t been as effective at Ōkaro
If you manage to completely reset the lake with alum which stops the blooms, less biomass
falls to the lake bed, so you effectively switch the lake into another cycle. But the question
is, if you stop alum dosing, will that new cycle continue or will it change back?
Lake model report executive summary for background
We have local stream accumulations of aluminium but there’s no indication of any impacts
on the fauna of any type (fish, mussels etc) and we’re continuing to monitor. There’s no
particular indication that alum bioaccumulates – it gets excreted in similar doses to what’s
taken up
What are the unintended consequences of using alum?
What we know about P loss
N&P interactions
Olsen P optimum. Need to understand the difference between agronomic optimum and
economic optimum. The latter is more important for farm profitability, and tends to be
lower than agronomic optimum, hence lower run-off.
A statement for the lay-public about Olsen P is and what it means. It’s not a definitive
metric. Relationship with N, and why we need to look at both together
Dominant factor is always management – strong social element, and how farmers manage
their environmental practices is fundamentally important
The biophysical aspects of the soil are important, but the crucial thing that affects nutrient
loss is the management practice. How do we get past the ‘can’t be arsed factor?’ (ease of
implementation) and the willingness to engage and implement
Mitigation strategies – refer Rich McDowell report from a couple of years ago
Certainty about what is required is a risk, because it could change down the track. Strategies
for N are not the same as those for P
Applies to all land types/uses, not just dairy and forestry

In terms of calculating the reduction in P achievable on N mitigated farms, we can compare
numbers (Rosemary)
Most of the strategies targeting P are not represented in Overseer
We need a strategy that doesn’t reduce the N:P ratio in the lake. It might reduce them
concurrently, but not the ratio itself
Association of P loss with hydrology – critical source areas, slope, fertility and the ways that
water moves around on and below the surface. Ephemeral flow paths and detainment
bunds
Technologies and informed management that can be brought to this – some of that is
around analysis of soil fertility but you have a whole suite of mitigations and management
Need a statement with a recommendation from the group – P loss has major implications for
upcoming rule changes
Two key messages – the information can inform nutrient management plans that are being
evolved, and this is the start of the process of science review – it may lead to subtle tweaks
to the rules along the track
To date we haven’t put sufficient emphasis on the P part of the equation, and we need to
We know the position with P and Lake Rotorua, and we want to give the ‘powers that be’
that information as it might be the start of some of the science work that’s being reviewed
Looking at P has a direct co-benefit in terms of sediment and bacteria
Climate change risk – the big risk is the length of stratification in the lake – the longer
periods occurring, and erosion from high rainfall events
Monitoring urban inputs
Forest management and N/P loss
Predicting loss Overseer, NuBalM
Planting areas/harvest mgmt.
P&N flux – soil history – understanding that there could be significant differences that we
need to understand
Nobody is saying overseer is bad, but we might have something better coming along in the
future
Duration of high fertility (2 rotations), and impact
Short rotation crops on farms – quickly grow, then take whole lot off. That will make a
difference and draw the N and P away from the land
Changing land use from gorse/pasture to forestry isn’t going to fix things overnight. There
will still be legacy N leaching (lag phase) but we need to understand that it’s going to happen
and manage people’s expectations
Management options – bmp and guidelines that impact nutrients eg weed control- broom
and other nitrogen fixers growing under the trees will continue to produce for a while until
it’s shaded out
Overseer is dependent on block mapping being done well/accurately
How can we supplement Overseer with new tools that are becoming available/available
now, and how does it deal with extreme events

Research and information gaps
What is the best management practice that Overseer uses?
Need to incorporate more P mitigation practices within Overseer
Need to establish the difference between agronomic optimal P levels versus economic
optimums
Management plans and social decisions
Education – management etc – uptake of information e.g. sediment management is
key/obvious
Information targeted to users – right audience, at a level that they understand and can build
on
Treatment and measurement of anthropogenic P, how can we quantify the P losses and
manage them (eg urban/ungauged)
David H – maybe we need to alum dose a lake and demonstrate the resulting imbalance of
N. For example Tutira has degraded over the last couple of years with an increase in N.
N:P ratio in Lake Tarawera
Other options – Hamurana – other natural sources
Catchment model P with N - see if target can be met
Is there a need for a P Strategy for RC Programme
New options – e.g. detention ponds
Need to upgrade the forestry component of Overseer