table of contents introduction (chapter i ... of contents introduction (chapter i)-----4 research...
TRANSCRIPT

TABLE OF CONTENTS
INTRODUCTION (CHAPTER I)------------------------------------------------4
Research Hypothesis-------------------------------------------------------8
Statement of Problem------------------------------------------------------9
Null Hypotheses-------------------------------------------------------------9
REVIEW OF LITERATURE (CHAPTER II)----------------------------------10
METHODOLOGY (CHAPTER III)----------------------------------------------20
Objectives--------------------------------------------------------------------20
Subjects-----------------------------------------------------------------------20
Instrumentation--------------------------------------------------------------20
Procedure for Data Collection--------------------------------------------22
Analysis of Data-------------------------------------------------------------23
Limitations--------------------------------------------------------------------24
RESULTS (CHAPTER IV)---------------------------------------------------------26
Demographic Data----------------------------------------------------------26
Discussion--------------------------------------------------------------------38
SUMMARY, CONCLUSIONS & RECOMMENDATIONS
(CHAPTER V)-------------------------------------------------------------------------41
Summary----------------------------------------------------------------------41
Conclusions-------------------------------------------------------------------42
Recommendations-----------------------------------------------------------42
BIBLIOGRAPHY---------------------------------------------------------------------45
APPENDICES-------------------------------------------------------------------------49

2
A. Tennessee Self-Concept Scale: 2 Adult Form---------49
B. Human Research Consent Form--------------------------54
C. Student Letter/Cover Letter--------------------------------56
D. Demographic Survey for Athletic Participants---------58
E. Demographic Survey for Non-Athletic Participants---61
F. Letter of Thanks----------------------------------------------63

3
LIST OF TABLES
Tables:
1. Current age of respondents for both groups---------------------------26
2. Gender of respondents for both groups---------------------------------27
3. Gender of respondents for each group----------------------------------27
4. Ethnicity of respondents for both groups------------------------------28
5. Ethnicity of respondents for each group-------------------------------29
6. Types of athletic participation-------------------------------------------29
7. Top 4 sports participated in by respondents---------------------------30
8. Reasons for participation in athletics-----------------------------------31
9. Feelings about oneself at the beginning of the season---------------32
10. Feelings about oneself during the middle of the season-------------32
11. Feelings about oneself at the end of the season-----------------------33
12. Feelings about oneself after winning a game/meet-------------------33
13. Feelings about oneself after losing a game/meet----------------------34
14. Feelings about teammates after winning a game/meet---------------35
15. Feelings about teammates after losing a game/meet------------------35
16. Tennessee Self-Concept Scale:2 data------------------------------------38

4
CHAPTER I
INTRODUCTION
Throughout history, it has been suggested by various developmental, humanistic,
and environmental theorists that self-concept is an important developmental process for
young children and adolescents (Beane & Lipka, 1984, p. X). “Cooley (1902)
speculated that the self is actually a ‘looking glass self’ and thus the process of knowing
about oneself is actually one in which we come to view ourselves as we believe others
view us.” (Beane & Lipka, 1984, p. X). Therefore, self-concept can be explained as the
description an individual attaches to himself or herself and can be influenced by feedback
from others, such as parents, peers, and educators. “Educators are charged with the task
of helping young people experience healthy growth and development. In other words, an
educational program without an emphasis on enhancing self-perceptions is an incomplete
program” (Beane & Lipka, 1984, p. x).
“Developmental competencies, which are types of functional life competencies
each person must attain in order to learn, achieve academic success, and prepare for a
satisfying and productive career, have been implemented into education programs and
include self-concept as one of the competencies at every level (K-12). More specifically,
it stresses that students should be able to understand the influence of a positive self-
concept. The purpose or importance of gaining this understanding is to provide young
adults with the skills to maintain a positive self-concept that will be beneficial throughout
adulthood” (Wisconsin Department of Public Instruction, 1986, p. 12). With this
philosophy underlying curriculum development in the State of Wisconsin, the interest and

5
importance of studying self-concept has drastically increased among educators and
professionals.
Although research suggests that physical exercise is important to one’s well-
being, many experts believe that schools need to modify the physical education programs.
Competitive sports is emphasized, but in all actuality, it is very likely that the youngsters
who are not physically fit will draw back when activities demands a high level of skill.
Therefore, physical education programs need to incorporate activities that meet the skill
level and beginning fitness level of each individual student such as walking, jogging,
jumping, and climbing. As a result, it is believed that these physical activities will be
maintained and continued throughout adulthood (Berk, 1993, p. 411). Therefore,
providing for a healthy and positive well being for individuals during adulthood years.
However, in order to enhance self-concept, we must provide students with
additional opportunities that allow them to perceive themselves in a positive manner.
This may include opportunities for growth in cognitive, social, or physical activities.
Participation in athletics, in particular, may serve as an opportunity to enhance student’s
self-concept. At a very early age, we are encouraged and taught that physical fitness is
needed to maintain good health and a positive well being. As a result of this emphasis,
students participate in physical education classes starting in kindergarten and continuing
throughout high school. Beyond curricular classes in physical education, participation in
athletics may also be beneficial to students. In addition to the physical benefit of
participating in a given sport, athletics may provide psychological benefits as well. In
athletic participation, there is a “high level of interaction that allows students the chance
to try out ideas and roles with others and thus to test their self-concept. Athletics also

6
provides the chance to assume and feel leadership responsibilities, which may result in
enhanced self-perception” (Beane & Lipka, 1984, p. 121).
In athletics, players are continually assessing their capabilities and the behavior of
others around them and as a result, skills of successful social behavior can be learned
through membership on a team. When participating in athletics, the student also learns to
work towards a common goal and to cooperate with teammates. Some positive attributes
that can be gained from participation in sports are: group loyalty, self-recognition, and
peer self-image (Alley, 1974, p. 102), therefore, athletic participation appears to provide
not only physical benefits for students, but also psychological benefits as well.
“In a review of sixteen studies on exercise and self-esteem, exercise programs are
associated with significant increases in the self-esteem scores of participants versus non-
participants” (Sonstroem, 1984). Although this data reflects the notion of participation
in exercise programs, it is possible to assume that athletic participation also is significant
with regards to self-concept.
Athletic participation is a different and unique experience for every student
because each athlete has his or her own reasons or desires for choosing a particular sport.
For some, the need may be for excitement and stimulation. For other students,
participation may arise from the desire for affiliation, and the need to be a part of a team,
so that they have a sense of belonging, not because they want to achieve fame or
recognition. Finally, others may want to “demonstrate competence in order to meet the
need to feel worthy. When skills are less developed, and when a person does not have a
mature, positive self-concept, being judged competent and successful by others is very

7
important. It helps athletes move toward being able to judge their own self-worth in the
absence of others, which is an important ability to be developed” (Martens, 1974, p. 25).
Nothing is more important to each of us than our own self-worth and the process
by which we develop self-worth begins at an early age. Unfortunately, athletics can
portray negative aspects with regards to self-feeling and self-confidence. “Early sports
experiences are vital in shaping a youngster’s self-confidence and self-worth. Those who
experience initial success become more self-confident, feel more worthy, and are
motivated to pursue excellence. Those who experience initial failure become more
insecure and feel less worthy” (Martens, 1974, p. 154). Determining the impact that
involvement in athletics has on students self-concept could help identify what is
necessary to compete successfully in society. It is important to determine what role
athletic participation plays in developing an adolescent’s self-concept. “In our society,
those who achieve more are considered to be more worthy individuals. In sports,
achievement is usually measured by one simple criterion, winning. Winning is viewed as
success and losing is viewed as failure. Winners, therefore, are more worthy and losers
are less worthy. And even the youngest athletes quickly learn these standards of
achievement” (Martens, 1974, p. 158). Unfortunately, as a result, it is often believed that
failure precedes a lower self-concept than winning.
For present and future educators, there should be concern regarding the fact that
students have become so convinced that the only criterion for evaluating their worth is
whether or not they win or lose. Certainly, they are in danger of becoming unable to
separate their evaluation of their performance from the outcome. Thus, it is crucial to

8
determine if students recognize that self-concept is not achieved by winning, but by living
up to one’s standards.
However, even though sports and athletic participation is continually publicized
through media, and estimated that the “number of American youths participating in
various organized sports is 40 million” (Ferguson, 1999, p. 54), there is a limited amount
of research which has been conducted to demonstrate how athletic participation
contributes to students level of self-concept. Much of the literature that exists fails to cite
documented research findings. So, one can only speculate about the benefits of athletics
and exercise without supporting empirical data. It is evident that further data is needed
regarding the influence athletic participation has on students self-concept.
Therefore, the research hypothesis for this study is that participation in athletics is
positively related to a higher self-concept score, as compared to those students who do
not participate in athletics.

9
STATEMENT OF PROBLEM
The purpose of this study is to determine the level of difference in self-concept
scores, as measured by the Tennessee Self-Concept Scale:2 for sophomore high school
students that participate in athletics as compared to non-athletic students. Athletic
participation is defined as participating in, or being a member of one extracurricular
school related sporting activity, for at least one-year prior to participating in their current
sporting activity. The variable of self-concept is defined as the description an individual
attaches to himself or herself, which can be influenced by feedback from others.
NULL HYPOTHESES
H 1: There is no statistically significant difference between Total Self-Concept
Summary Scale (TOT) scores for those students who participate in athletics, as compared
to non-athletic students.
H 2: There is no statistically significant difference between Social (SOC) Self-
Concept Scale scores for those students who participate in athletics, as compared to non-
athletic students.
H 3: There is no statistically significant difference between Physical (PHY) Self-
Concept Scale scores for those students who participate in athletics, as compared to non-
athletic students.

10
CHAPTER II
REVIEW OF LITERATURE
Throughout the existing literature regarding self-concept, it is evident that the
dynamics and importance of self-concept remains a central element in one’s life. Self-
concept is believed to be the “the feelings one has about themselves and is partially a
result of societal expectations” (Leighton, 1990, p. 17). Furthermore, self-concept is
incorporated in every child’s life starting at birth.
One developmental domain that is assumed to contribute positively to children’s
self-concept level is physical development. The President’s Council on Physical Fitness
and Sports (1973) stressed the importance of physical activity at an early age. It is
believed that physical activity promotes not only the physical health of the youth, but also
their mental health and self-concept development (Leighton, 1990, p. 17). Self-concept is
still highly emphasized in schools nationally, yet limited empirical research exists to
document the influence of athletic participation upon self-concept.
Theoretical frameworks that conceptualize how individuals perceive themselves
have been in existence for several years. One of the most commonly known
developmental theorists who actively contributed to conducting research in this field in
the late nineteenth and early twentieth centuries was sociologist Charles H. Cooley. His
“development of the emotional aspect of the self, ‘the looking glass self’, shaped
contemporary beliefs” (Hewitt, 1998, p. 38), and continues to be used by educators and
counselors today.

11
Cooley’s theory of the self suggests that the “self and its associated feelings are
inherently social. ‘There is no sense of ‘I’, without its correlative sense of
you, or he, or they” (Hewitt, 1998, p. 38). As previously mentioned, he is primarily well-
known for the development of the notion of the ‘looking glass self’. The ‘looking glass
self’ stresses the comparison of the image we see when we look in the mirror, and
furthermore, greatly depends on our beliefs about judgment made by others around us
(Hewitt, 1998, p. 38).
He elaborated this belief by proposing that self-idea….seems to have three
principal elements: the imagination of our appearance to the other person; the
imagination of his judgment of that appearance; and some sort of self-feeling,
such as pride or mortification. In other words, Cooley says, we arouse feelings in
ourselves by imagining the feelings the other holds toward us. We are thus tied to
the social world, which supplies us with images of what others are and what we
should be, as well as the opportunities for social interaction, in which the looking
glass self is formed. (Hewitt, 1998, p. 39)
One form of social interaction that exists for students, starting as early as
elementary school, is participation in athletics. Athletics is a source of interaction where
judgments about self and others are continuously made. Judgments regarding athletic
potential, abilities, sportsmanship, leadership, dedication, and team building skills are just
a few elements that are frequently analyzed by coaches, spectators, parents, and
teammates. Conclusions are based upon all of the elements previously listed, and
contribute to the development of the students sense of self, as perceived by others, very

12
similar to Cooley’s suggestion. This perception by others results in the student’s feelings
about themselves, or “self-feelings”.
The self-feelings made by students who participate in athletics can be greatly
influenced by comparing their athletic ability or potential to others.
Marsh and Peart (1988) demonstrated the practical implications of frame of
reference effects on physical self-concept in that a competitively oriented aerobics
intervention – where students compared their performances with whomever did
best – actually led to a decline in physical self-concept despite increases in
physical fitness. They further speculated that in highly competitive sport settings,
the frame of reference established by other participants and the expectations of
significant others may have as much influence on physical self-concept as the
actual skill level. For example, young athletes who are “super stars” in their local
communities may experience a decline in physical self-concept when they join
elite athletic teams where everyone is a star (Marsh, 1998, p. 243).
Evidently, not only is social perception important in the formation of one’s self-
concept, but factors such as frame of reference and ability are also influential in
constructing self-concept.
In addition to Charles Cooley, William James was also a founder of a self-
perception theory. He viewed self-concept as primarily being derived through the social
world. He believed that the way that we are perceived by society is essentially what
shapes how we feel about ourselves. In other words, our social interaction is in a sense
the source of our self-esteem (Hewitt, 1998, p. 37). Furthermore, James suggested that it
is controlled by each of us individually. Thus, self-esteem is influenced not only by

13
individual success such as accomplishing tasks or earning the approval of others, but also
by the aspirations which result from the individuals motivation (Hewitt, 1998, p. 37).
When applying this theory to athletic participation, James said
An athlete set on establishing a world record by running the fastest mile or
clearing the highest hurdle, coming in second nearly amounts to failure. To the
average overweight American, even completing a mile run would seem a major
accomplishment and would bolster self-esteem. It follows that individuals can
raise self-esteem either by meeting the expectations they set for themselves, or by
adjusting those expectations so that they are easier to meet. Likewise, because
self-esteem depends on the approval of others, individual’s can increase it either
by doing what is required to secure approval, or by seeking approval from those
who are likely to give it (Hewitt, 1998, p. 37).
Based upon these two theorists’ underlying assumptions, one can readily conclude
that children most often derive their perceptions of self externally through interactions
with others. These perceptions impact children’s lives, and can be carried over into
adulthood. In an attempt to provide concrete evidence reflecting these two social
comparison theories, contradictory results have been found in sports performance
literature related to self-concept issues and sports participation. Stevenson (1985)
provided evidence indicating that participation in sports did not cause any verifiable
socialization or developmental effects. On the other hand, a few studies suggest that
sport participation provides an opportunity to gain interpersonal skills, friendships, and a
sense of unity. One such study suggested that athletes “appear to have the opportunity,

14
and need, to develop strong social support networks, more so than the general student
population” (Curry, Rehm, & Bernuth, 1997, p. 97).
Therefore, it appears that participation in athletics can provide beneficial aspects,
such as the development of strong social support networks, to those students who choose
to participate. Adolescence is a developmental stage, which places a high emphasis on
social connections, the search for one’s identity, which results in self-perception. In
addition to the strong emphasis on peer influence, adolescence is a period of rapid
physical growth and pubertal development. Many observable characteristics and changes
emerge during this stage, leading adolescents to feel anxious and self-conscious about
their bodies. According to several developmentalists, “developing a healthy body image
is an integral part of becoming an adult” (Stassen Berger, 1994, p. 378). Unfortunately,
the search to obtain the ideal body image can become self-absorbing and in some
instances, destructive. This may occur when adolescents perceive their ideal body image
based upon the responses and reactions of others (Stassen Berger, 1994, p. 378).
Adolescents are faced with the challenge of obtaining an ideal image from media and
society, as well as from their peer group.
On the other hand, peer groups can serve as self-help groups, due to the fact that
they have been found to be positive aides in every major task of adolescence, from
adjusting to physical changes of puberty, to developing social skills, and searching for
identity (Stassen Berger, 1994, p. 423).
Nevertheless, concern over identity and body image should be viewed as an
important developmental task during adolescence. “In adolescence, particularly, feelings
of depression among both males and females correlate strongly with a negative body

15
image” (Rierdan, Koff & Stobbs, 1988). Therefore, the importance for studying the
adolescent population is evident, as it clearly is a period of rapid change, uncertainty, and
emotional turbulence.
As previously cited, adolescence is a developmental stage that stresses social
virtues, peer groups, and identity formation. Athletics, perhaps, is one source for
encouraging development of social networks, body image and positive peer relations. In
book “Training and Conditioning of Athletes” (Novich, 1983) discussed the importance
of physical fitness for students. He proposed that physical fitness gives students the
opportunity to enhance physical development, as well as providing a socially acceptable
outlet for aggressive and competitive needs. Along with the physical benefits of regular
activity, numerous studies have determined that appropriate exercise can be positively
linked to one’s physical and mental health (Leighton, 1990, p. 12). Indeed, research
indicates that physical fitness and exercise has a positive impact on one’s psychological
well-being.
Jorgenson and Jorgenson (1979) identified the effect that participation in an
individualized sport, running, has on one’s perception of self. A questionnaire was
provided that focused on perceptions of change due to running on a regular basis. A total
of 497 individuals from three running clubs in the Southwest completed the
questionnaire, and 92% of the respondents recorded that their emotional well-being
increased as a result of running. In addition to an increase in their emotional well-being,
they identified an increase in their physical well-being and a reduction in the number of
times they were ill. As a result of this study, it was suggested that running had a strong

16
impact on the respondent’s perceptions of themselves both psychologically and physically
(Leighton, 1990, p. 15).
Leonardson and Gargiulo (1978) conducted a study to explore the relationship
between exercise and self-concept. In their study, 15 students were given a pre and post-
test on physical fitness and self-concept. The individuals participated in a ten-week
training program consisting of jogging for a minimum of thirty minutes, at least twice a
week. Even though the differences in pre and post scores for the participant’s were not
significant, the results showed an increase in self-concept. Although the study only
entailed 15 subjects, the study still indicated that increased physical activity may impact
positive changes in one’s self-concept (Leighton, 1990, p. 20).
In both of the previously mentioned studies, the participants primary form of
exercise consisted of running or jogging for a given amount of time, which positively
resulted in an increase in the participant’s self-concept. Other types of athletic
participation, in addition to running were evaluated in a study by Hanson and Nedde
(1974). Their study involved 8 previously sedentary women, ages twenty to forty-four
years. The subjects underwent a program for eight months. During those eight moths,
they trained for one hour, five times per week. The training consisted of warm-up
calisthenics and jogging, which was followed by additional activities of either swimming,
racquetball, volleyball or, cross-country running. Prior to the training, the subjects were
assessed using the Tennessee Self-Concept Scale (TSCS). They were tested again
following four months into the program and at the end of the eight-month program.
Continually, after each test was administered, the results indicated significant positive
changes on the TSCS. Because the subjects were inactive in the beginning of the study

17
due to the addition of physical activity, their self-concept was enhanced; the hypothesis
that exercise has a positive impact on an individuals self-concept was supported
(Leighton, 1990, p. 21).
In addition to determining if there is a relationship between those who actively
participate in exercise and their self-concept, there is evidence that suggests that non-
participants have a lower self-concept than those individuals who participate in athletics.
In a study by Smith (1986), 104 boys and girls actively involved in a youth sport program
were given the Martinek-Zaichkowsky Self-Concept Scale and compared the scores with
104 non-participating boys and girls. Those students who had participated in youth sports
had significantly higher self-esteem. However, Smith stressed the need for longitudinal
studies to determine the impact of sports on youth’s self-esteem. Nevertheless, this study
clearly indicated that sport participation does contribute to self-concept, even at a young
age (Leighton, 1990, p. 23).
Finally, Thomas Johnson, M.D. stressed that although sports and competition can
be a normal and potentially beneficial part of each child’s life, coaches and parents are
key to the psychological impact of the sports experiences. He suggests their role is to
place emphasize effort made, rather than results. Their role is to praise participation and
attitude, and to serve as models for students. Therefore, the importance sports can play
on children’s self-esteem depend upon many underlying elements, but if participation and
attitude is stressed, sports can be beneficial and a rewarding experience for the
participants (Leighton, 1990, p.24).
On the other hand, some research findings indicate that athletic participation is
harmful, and potentially damaging to students who chose to partake in such events.

18
A large number of athletes may have a history of being exposed to a win-at-all cost
mentality. As a result, it may be difficult for the athlete to consider the concept of
sportsmanship (Rudd & Stoll, 1998, p41), which may indicate that sports have the
potential to be harmful and instill inappropriate messages to youth participants.
Furthermore, an increase in competitiveness may result when one participates in
athletics. “When adults or parents become involved in children’s games, their focus
becomes overly competitive, which focuses less on the process of playing or participating
in a sport and more on the product of winning” (Berk, 1993, p. 409).
In addition, participation may actually lead to low self-evaluation, instead of an
increase in self-concept for student athletes, due to individual failures, lack of
recognition, comparison of oneself with teammates abilities and potential, or setting
unrealistic and unachievable goals. As mentioned previously, self-concept is formed by
social perceptions and it is possible that those students “who experience initial failure,
become more insecure and feel less worthy” (Martens, 1974, p. 154). One study
regarding individual abilities and potential of athletes suggested that by assigning
children to specific positions on a team, rather than allowing them to experiment and test
capabilities, may hinder the learning experiences for children (Berk, 1993, p. 408).
Finally, undue pressure from coaches and parents are another aspect of sport
participation that can be damaging to students. In the book “Why Johnny Hates Sport”,
author Fred Engh cites that “approximately 73% of kids who quit their childhood sports
by age 13 do so mainly because it ceases to be fun and the pressure put on them by
coaches and parents do not make it worthwhile” (Ferguson, 1999, p. 58). Indeed, many
children feel “additional pressure from coaches and parents, who become overly critical

19
when players make errors or highly structure the sport that it resembles ‘work’ more than
‘play’”(Berk, 1993, p. 408).
From another perceptive, others believe that athletic participation is not a causal
element for an increase in one’s self-concept. “If, for example, students who do better in
school tend to have higher self-esteem scores, we cannot assume that their higher self-
esteem causes their better performance. It might just as likely be the case that they have
higher self-esteem because they do better in school (Hewitt, 1998, p. 52).
Clearly, the relationship between athletics and self-concept is a complex topic and
the results can be insightful for present and future educators alike. The literature which
exists suggests contradictory findings, with some studies displaying no relationship
between athletic or exercise participation and one’s self-concept and other literature
providing significant findings that indeed show a positive relationship between
participation in exercise or athletics, as it relates to an increase in self-concept. In fact,
some studies cite statistically significant increases in the subject’s self-concept. What is
clear is the need for more evidence that supports the influence of athletic participation
upon self-concept. Therefore, this study will primarily focus on the relationship between
those students who actively participate in athletics, as compared to those students who do
not participate in athletics, and their perceptions of self.
20
CHAPTER III
METHODOLOGY
The purpose of this study was to determine the level of difference in self-concept
scores among sophomore high school athletes, as compared to non-athletes. The
objectives of this study were to compare the T scores of the following scales from the
Tennessee Self-Concept Scale: 2: Total Self-Concept Summary Scale (TOT), Physical
(PHY) Self-Concept Scale, and Social (SOC) Self-Concept Scale.
Subjects:
The total population for this study consisted of fifty-two tenth grade students
(twenty-eight athletes and twenty-four non-athletes) who were currently enrolled at
Menomonie High School for the 1999-2000 school year.
The twenty-eight athletic participants were students currently participating in an
athletic sport for the 1999-2000 school year, and who had previously participated in a
sporting activity for one year prior to this study. The twenty-four non-athletic students
were selected using a random sample from seven classes at Menomonie High School.
Those subjects who received parental permission and who were willing to
participate in this study regarding self-concept and athletic participation were asked to
complete a demographic questionnaire and the Tennessee Self-Concept Scale:2, Adult
Form.
Instrumentation:
The Tennessee Self-Concept Scale:2 was used to assess self-concept (Appendix
A). The scale “summarizes an individual’s feelings of self-worth, the degree to which the

21
self-image is realistic, and whether or not that self-image is a deviant one” (Walsh, 1984,
p. 663). There are two forms that can be used when administering the TSCS:2, the Adult
Form (for ages 13-90), which has 82 items and the Child Form (for ages 7-14), which
consists of 76 items. Both of the forms can be administered individually or in a group,
and can be completed in 10-20 minutes, and scored in ten minutes. For this study, the
Adult Form was administered, due to the expectation that students were between the ages
of 14-16 years old.
The Tennessee Self-Concept Scale:2 (TSCS) was originally developed in 1955
and restandardized and published in the 1996 to “provide researchers and clinicians with
materials that are easy to use, yet which retain the characteristics that have given the test
such a wide appeal over the past several decades. Although inefficient and outdated
items have been eliminated and scoring procedures have been simplified, most of the
original items have been retained and the obtained scores are psychometrically equivalent
to their counterparts. The scale was renormed on a nationwide sample of over 3,000
individuals ranging in age from 7 to 90 years old” (Fitts and Warren, 1996, p. 3). In
addition to the restandardization, an Academic/Work Self-Concept Scale was added.
The most important aspects, however, for choosing to administer the TSCS:2 was
the high degree of reliability and validity that it portrays. The internal consistency ranged
from .73 to .95 (median .80) for the two Adult Form normative groups. The test-retest
reliabilities for the TSCS:2 ranged from .47 for Inconsistent Responding score to .82 for
the Total Self-Concept score on the Adult Form (median .76) (Fitts and Warren, 1996, p.
59-60). Therefore, it was evident that the TSCS:2 displays characteristics of validity.

22
Procedure for Data Collection:
At orientation night for the fall sports season, a parental/student consent
form/letter was provided to the parents of tenth grade student athletes participating in a
fall sporting activity (Appendix B). Parents who agreed to provide consent for their child
to participate in the study were asked to sign the consent form that evening and return to
the researcher prior to leaving orientation night. Following receipt of the signed consent
forms, twenty-eight athletes agreed to participate in the study. They were apprised of
their voluntary participation and their responses were kept entirely confidential
(Appendix C). When they agreed to participate, they were given a short demographic
survey (Appendix D) and the Tennessee Self-Concept Scale:2 Adult form.
In addition to those participants obtained from orientation night, several other
student athletes from seven classes at Menomonie High School were recruited to
participate in the study.
The parental/student consent forms were distributed to tenth grade students who
were non-athletes in seven classes, specifically, 1 Band class, 1 Early U.S. History class,
1 3-Dimensional Art class, two English classes, and two Choir classes. Following return
of the parental consent letter (Appendix B) to the researcher, twenty-four non-athletic
students agreed to participate in the study. They were apprised of their voluntary
participation and their responses were kept entirely confidential (Appendix C). When
they agreed to participate, they were given a short demographic survey (Appendix E) and
the Tennessee Self-Concept Scale: 2 Adult Form.

23
When the participants completed the Tennessee Self-Concept Scale: 2 form, the
researcher provided them with a follow-up thank-you letter (Appendix F) for their
participation in the study.
Analysis of the Data:
As stated previously, the purpose of this study was to determine the level of
difference in self-concept among high school athletes as compared to non-athletes.
Therefore, this study compared T-scores on the Tennessee Self-Concept Scale for athletic
students and non-athletic students, specifically for the Total Self-Concept Summary,
Physical (PHY) Self-Concept Scale, and Social (SOC) Self-Concept Scale.
T-tests were used to calculate each of the fifteen subscale scores from the
Tennessee Self-Concept Scale:2 test for both groups of respondents. From this
measurement, the mean, median, standard deviation, frequencies, and percentages were
tabulated for both groups of participants. In addition, T-tests were used to calculate the
fifteen subscale scores from the Tennessee Self-Concept Scale:2 for each of the groups,
independent from one another. T-tests for equality of means was the statistic used to
determine if there was a significant difference at the .05 level for the fifteen subscales
scores for the student athletes and non-athletes. The Pearson-Chi-Square test was used to
calculate the amount of difference at the .05 level regarding gender and ethnicity
representation for the total respondents and for each group of respondents.
The null hypotheses (H:1, H:2, H:3) of this study stated that there would be no
statistically significant difference between Total Self-Concept Summary Scale (TOT)
scores, Social (SOC) Self-Concept Scale scores, and Physical (PHY) Self-
Concept Scale scores for those students who participated in athletics, as compared to non-

24
athletic students. The hypothesis stated that participation in athletics is positively related
to a higher self-concept score, as compared to those students who do not participate in
athletics.
Limitations:
Clearly, there were limitations to this study. One of the factors of limitation was
that all of the subjects were volunteers. In addition to the subjects being volunteers,
parental involvement may have impacted the scores of some of the students that
participated. For example, one non-athletic student, whom scored the highest Total Self-
Concept Summary score overall in the study, 73T, reported that her mother wanted to be
informed of her scores. Additionally, several of the parents who were present at
orientation night and allowed their daughter and/or son to participate in the study, sat near
or next to their child while they completed the Tennessee Self-Concept Scale:2 test.
Therefore, it is possible that parental interest or pressure may have impacted student
responses.
Another limitation of this study was the fact that socioeconomic status was not
considered. It appeared that most of the participants were from lower to middle class
socioeconomic status families. It is possible that students from a high socioeconomic
status might have scored differently on the Tennessee Self-Concept Scale.
Geographic location was another concern regarding the diversity of this study. All
of the participants were rural residents, except for three non-athletic students who
recently moved to the area from California, Oklahoma, and Minnesota. Therefore, urban
students were not represented in this study and may have scored differently on the
Tennessee Self-Concept Scale.

25
The number of the participants, fifty-two, was a very small sample size and
definitely a concern to the researcher. A larger sample size was initially desired at the
beginning of this study and highly recommended to future researchers.
Gender and ethnic representations were also a concern to the researcher. In the
total sample size, males and females were equally represented (See Table 2). However,
gender was not equally represented within the athletic group and non-athletic group,
which was possibly influential to the findings, as males and females may have
discrepancies among their scores. (See Table 3). Ethnic diversity was not represented in
the sample. Most of the participants were Caucasian; other participants were Asian or
Native American (See Table 4). Unfortunately, several of the races were not represented
in the study, such as African Americans and Hispanics. Therefore, a more diverse
population may have scored differently on the Tennessee Self-Concept Scale.
Finally, extracurricular activities of the non-athletic students were not identified.
Participation in extracurricular activities influences self-competency, which influences
self-esteem. Non-athletes may have been involved in other extracurricular activities,
which influenced their scores on the Tennessee Self-Concept Scale.

26
CHAPTER IV
RESULTS AND DISCUSSION
The purpose of this study was to determine the level of difference in self-concept
scores, as measured by the Tennessee Self-Concept Scale:2 for sophomore high school
students that participate in athletics, as compared to non-athletes. The objectives of the
study were to compare T-scores from the following scales from the Tennessee Self-
Concept Scale:2: Total Self-Concept Summary Scale (TOT), Physical (PHY) Self-
Concept Scale, and Social (SOC) Self-Concept Scale.
Demographic Data:
The participants in this study were sophomore students at Menomonie High
School. Their ages ranged from 14 years of age to 16 years of age, with the majority of
students, 40 students or 76.9%, indicating that they were 15 years old. Ten students or
19.2% indicated that they were 16 years old, and 1 student or 1.9% responded that they
were 14 years old. (See Table 1) One student identified herself as a sophomore athlete,
but did not indicate her age. It was evident that all of the students who participated in the
study shared the similarity of being in the developmental stage of adolescence.
Table 1 - Current age of respondents for both groups
AGE FREQUENCY PERCENTAGE14 Years Old 1 1.9 %15 Years Old 40 76.9 %16 Years Old 10 19.2 %TOTAL 51 98.1 %

27
In addition to age, both genders were equally represented for the overall total
population of participants (See Table 2). There were 26 or 50.0% males and 26 or 50.0%
females that participated in the study.
Table 2 - Gender of respondents for both groups
GENDER FREQUENCY PERCENTAGEMales 26 50.0 %Females 26 50.0 %Total 52 100.0 %
However, when the gender of the non-athletes were compared to the gender of the
athletes, there appeared to be a significant discrepancy between the two groups of
respondents, with regards to the representation for each gender. Therefore, when each
group was considered individually, there were an unequal number of males and females
per group. The non-athlete group was composed of 8 or 33.3% males and 16 or 66.7%
females. On the other hand, the athletic group was composed of 18 or 64.3% males and
10 or 35.7% females (See Table 3). There were more females represented in the non-
athletic group and more males represented in the athletic group. As a result of the
unequal gender representation for the two groups, the Pearson Chi-Square analysis
determined at the .05 level there was a statistically significant difference among the two
groups with regards to gender representation, which will be discussed later.
Table 3 - Gender of respondents for each group
GROUPS GENDER COUNT PERCENTAGE1. NON-ATHLETE 1. Males 8 33.3 %
1. Females 16 66.7 % TOTAL 24 100.0 %2. ATHLETES 2. Males 18 64.3 %
2. Females 10 35.7 % TOTAL 28 100.0 %

28
Ethnicity is also an influential factor that must be considered when one is
researching the topic of self-concept. In this particular study, ethnicity was not equally
represented overall for the total participants. As a whole, this study consisted of 6 or
11.5% Asian students, 1 or 1.9% Native American students, and 45 or 86.5% Caucasian
students (See Table 4). The majority of individuals that participated in this study were
Caucasian students. Other ethnic groups, such as African American and Hispanic, were
not represented in this study.
Table 4 - Ethnicity of respondents for both groups
ETHNICITY FREQUENCY PERCENTAGEAsian 6 11.5 %Native American 1 1.9 %White 45 86.5 %TOTAL 52 100.0 %
When considered individually, the non-athletic group consisted of 2 or 8.3 % of
the participants were Asian, 1 or 4.2% of the participants were Native American, and 21
or 87.5% of the participants were Caucasian. Likewise, in the athletic group, 4 or 14.3%
of the participants were Asian, and 24 or 85.7% of the participants were Caucasian (See
Table 5). Therefore, in each individual group, the majority of the respondents that
participated in this study were Caucasian students. Nevertheless, the Pearson Chi-Square
analysis displayed no statistical significance at the .05 level with regards to the ethnic
diversity of the two groups of respondents.

29
Table 5 - Ethnicity of respondents for each group
GROUP ETHNICITY COUNT PERCENTAGE1. NON-ATHLETE 1. Asian 2 8.3 %
1. NativeAmerican
1 4.2 %
1. White 21 87.5 % TOTAL 24 100.0 %2. ATHLETES 2. Asian 4 14.3 %
2. White 24 85.7 % TOTAL 28 100.0 %
When the athletic participants were asked to identify the sport and/or sports that
they had previously participated in for at least one year prior to this study, several sports
were represented among the athletic students and many of the athletes identified being a
member of the same sports. From the sports identified, 16 or 57.1% participated in
soccer, 16 or 57.1% participated in basketball, 12 or 42.9% participated in track, and 9 or
32.1% participated in football (See Table 6).
Table 6 - Types of athletic participation
SPORT FREQUENCY PERCENT SPORT FREQUENCY PERCENTSoccer 16 57.1 % Baseball 4 14.3 %Basketball 16 57.1 % Wrestling 4 14.3 %Track 12 42.9 % Gymnastics 2 7.1 %Football 9 32.1 % Cheer-
Leading 2 7.1 %
Cross-Country
5 17.9 % Hockey 1 3.6 %
Softball 5 17.9 % Dance Line/Pom Pon
1 3.6 %
Volleyball 5 17.9 % Diving 1 3.6 %Swimming 5 17.9 % Other 1 3.6 %Tennis 4 14.3 % TOTAL 28 100.0 %
In addition to soccer, track, basketball, and football being the sports that portrayed
the largest number of athletic participants in the study, these four sports also displayed

30
longevity and commitment from the athletes who participated in each of these sports
(See Table 7). More specifically, of the 16 soccer participants, 4 had participated in the
sport for 5 or more years. Likewise, of the 16 basketball players, 8 had participated in the
sport for 5 or more years. With regards to the 12 track participants, 2 had participated for
4 years. Finally, of the 9 football players, 3 had participated in this sport for 5 or more
years (See Table 7).
Table 7 - Top 4 sports participated in by respondents
SPORTS FREQUENCY YEARS PARTICIPATEDSoccer 16 1 yr. = 4 4 yrs. = 2
2 yrs. = 6 5 + yrs. = 4
Basketball 16 1 yr. = 2 4 yrs. = 12 yrs. = 2 5 + yrs. = 83 yrs. = 3
Track 12 1 yr. = 3 3 yrs. = 32 yrs. = 4 4 yrs. = 2
Football 9 1 yr. = 2 4 yrs. = 12 yrs. = 3 5 + yrs. = 3
When the athletic participants were asked to identify reasons for participating in
sports, several answers were provided. From the answers that were suggested for being
reasons for participating in athletics, the following reasons appeared to be strong
indicators for participation: fun (92.9%), enjoy competition (75.0%), physical
development (71.4%), friendships (71.4%), achievement of individual goals (67.9%),
social (64.3%), skill development (64.3%), and personal goals and/or challenges (64.3%)
(See Table 8). Much like the data reflects, it is anticipated that sports will provide an
opportunity to gain interpersonal skills, friendships, and a sense of unity with peers. As
mentioned earlier, one study suggested that athletes “appear to have the opportunity, and

31
need, to develop strong social support networks, more so than the general student
population” (Curry, Rehm, & Bernuth, 1997, p. 97). Clearly, adolescence is a
developmental stage that places high emphasis on social connections and the search for
one’s identity which results in positive self-perceptions.
Table 8 - Reasons for participation in athletics
REASON FREQUENCY PERCENT REASON FREQUENCY PERCENTFun 26 92.9 % Leadership
Skills 12 42.9 %
EnjoyCompetition
21 75.0 % Scholarship 11 39.3 %
PhysicalDevelopment
20 71.4 % ConfidenceBuilder
8 28.6 %
Friendships 20 71.4 % ParentalInfluence
7 25.0 %
AchieveIndividualGoals
19 67.9 % CollegePreparation
6 21.4 %
Social 18 64.3 % Sense ofBelonging
5 17.9 %
SkillDevelopment
18 64.3 % OtherReasons
4 14.3 %
PersonalGoals/Challenges
18 64.3 % ApprovalFrom others
3 10.7 %
LeadershipSkills
12 42.9 %
Once the athletes had identified their reasons for participating in sports, they were
asked to evaluate how they felt about themselves at the beginning, middle, and end of the
season. At the beginning of the season, 12 students or 42.9% stated they were satisfied
with themselves, 7 students or 25.0% stated that they were neutral, and 5 students or
17.9% suggested that they were very satisfied with themselves. The majority of the

32
respondents were either satisfied or very satisfied with themselves at the beginning of the
season (See Table 9).
Table 9 - Feelings about oneself at the beginning of the season
FEELINGS FREQUENCY PERCENTAGEVery Dissatisfied 1 3.6 %Dissatisfied 3 10.7 %Neutral 7 25.0 %Satisfied 12 42.9 %Very Satisfied 5 17.9 %TOTAL 28 100.0 %
During the middle of the season, 50% or 14 students claimed that they felt
satisfied with themselves, 21.4% or 6 students were very satisfied with themselves, and
17.9% or 5 students were neutral regarding their feeling about themselves at the middle of
the season (See Table 10). Much like the reflections at the beginning of the season, the
majority of the athletes perceived that they were either satisfied or very satisfied with
themselves at the middle of the season.
Table 10 - Feelings about oneself during the middle of the season
FEELINGS FREQUENCY PERCENTAGEVery Dissatisfied 1 3.6 %Dissatisfied 2 7.1 %Neutral 5 17.9 %Satisfied 14 50.0 %Very Satisfied 6 21.4 %TOTAL 28 100.0 %
For the most part, at the end of the season, the athletes expressed feeling of
satisfaction. Of the participants in this study, 13 students or 46.4% said that they were
satisfied with themselves, and 11 students or 39.3%, stated being very satisfied with
themselves at the end of the season (See Table 11).

33
Table 11 - Feelings about oneself at the end of the season
FEELINGS FREQUENCY PERCENTAGEVery Dissatisfied 3 10.7 %Dissatisfied 0 0 %Neutral 1 3.6 %Satisfied 13 46.4 %Very Satisfied 11 39.3 %TOTAL 28 100.0 %
In summary, it appears that student athletes have feelings that were very consistent
at the beginning, middle and end of the season. Several reasons could attribute for the
consistency in their feelings. Clearly, their ability to perceive and accurately reflect their
feelings about themselves is instrumental to the consistency found in their feelings.
Following the reflections about oneself at the beginning, middle and end of the
season, athletes were encouraged to identify how they felt about themselves after winning
a game/meet. Once again, the majority of the students said that they felt either satisfied
(18.5%) or very satisfied (74.1%) with themselves after winning (See Table 12).
Table 12 - Feelings about oneself after winning a game/meet
FEELINGS FREQUENCY PERCENTAGEVery Dissatisfied 2 7.4 %Dissatisfied 0 0 %Neutral 0 0 %Satisfied 5 18.5 %Very Satisfied 20 74.1 %TOTAL 27 100.0 %
In addition to self-perceptions after winning a game/meet, the athletic participants
were asked to identify how they felt about themselves after losing a game/meet. In sports,
achievement is usually measured by one simple criterion, winning. Winning is viewed as
success and losing is viewed as failure. Martens (1974) stated that “winners are

34
therefore, more worthy and losers are less worthy of themselves” (p. 158). However,
based upon the findings in this study, it appeared that the athletic participants obtained
feelings of being neutral about themselves after losing a game, which could suggest that
they are not evaluating their self-worth solely on winning or losing (See Table 13). The
data indicated that several of the students (11 students or 40.7%) stated that they felt
neutral after losing a game/meet. Additionally, 5 students or 18.5% claimed that they felt
satisfied with themselves, while 5 students or 18.5% said they felt very dissatisfied with
themselves, and 4 students or 14.8% felt dissatisfied with themselves after losing a
game/meet (See Table 13).
Table 13 - Feelings about oneself after losing a game/meet
FEELINGS FREQUENCY PERCENTAGEVery Dissatisfied 5 18.5 %Dissatisfied 4 14.8 %Neutral 11 40.7 %Satisfied 5 18.5 %Very Satisfied 2 7.4 %TOTAL 27 100.0 %
On the other hand, the athletes were asked to state how they felt concerning their
teammates after winning a game/meet. The majority of the respondents, 68.0 % or 17
students, felt very satisfied and 16.0 % or 4 students felt satisfied with their teammates
after winning a game/meet (See Table 14).
Table 14 - Feelings about teammates after winning a game/meet
FEELINGS FREQUENCY PERCENTAGEVery Dissatisfied 1 4.0 %
35
Dissatisfied 0 0 %Neutral 3 12.0 %Satisfied 4 16.0 %Very Satisfied 17 68.0 %TOTAL 25 100.0 %
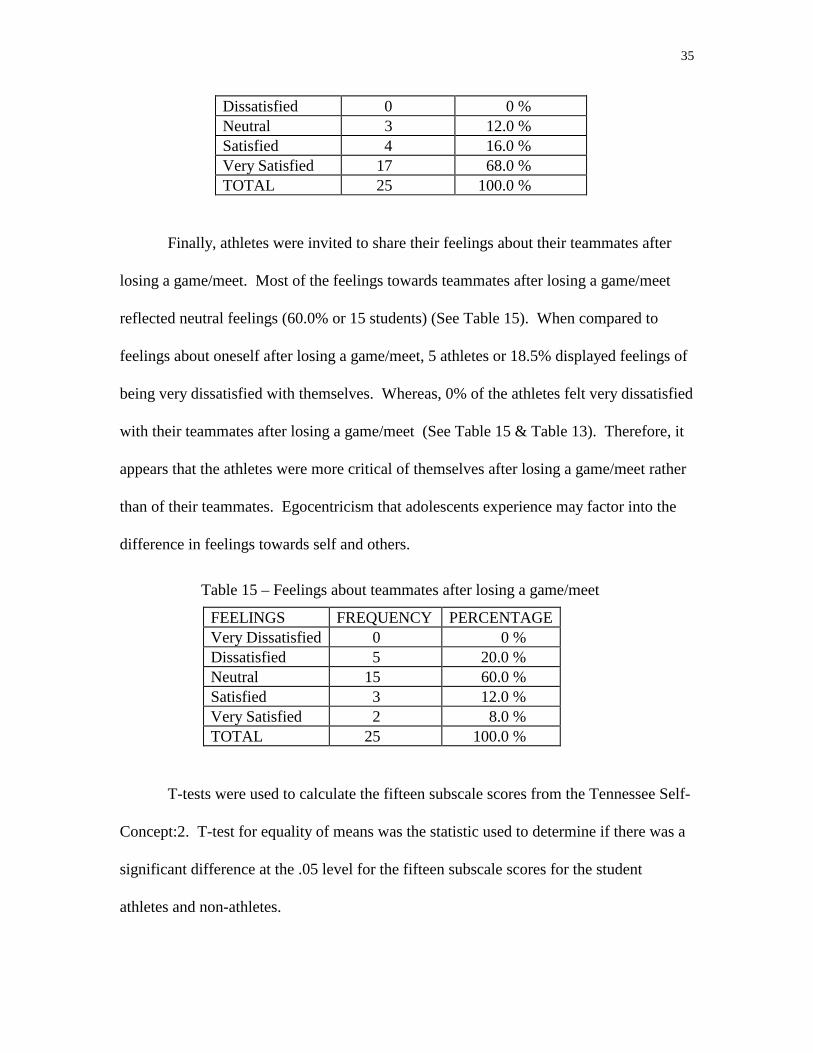
Finally, athletes were invited to share their feelings about their teammates after
losing a game/meet. Most of the feelings towards teammates after losing a game/meet
reflected neutral feelings (60.0% or 15 students) (See Table 15). When compared to
feelings about oneself after losing a game/meet, 5 athletes or 18.5% displayed feelings of
being very dissatisfied with themselves. Whereas, 0% of the athletes felt very dissatisfied
with their teammates after losing a game/meet (See Table 15 & Table 13). Therefore, it
appears that the athletes were more critical of themselves after losing a game/meet rather
than of their teammates. Egocentricism that adolescents experience may factor into the
difference in feelings towards self and others.
Table 15 – Feelings about teammates after losing a game/meet
FEELINGS FREQUENCY PERCENTAGEVery Dissatisfied 0 0 %Dissatisfied 5 20.0 %Neutral 15 60.0 %Satisfied 3 12.0 %Very Satisfied 2 8.0 %TOTAL 25 100.0 %
T-tests were used to calculate the fifteen subscale scores from the Tennessee Self-
Concept:2. T-test for equality of means was the statistic used to determine if there was a
significant difference at the .05 level for the fifteen subscale scores for the student
athletes and non-athletes.

36
The TSCS:2 scores for most individuals tend to fall between 40T and 60T. These
relatively “flat” profiles indicate no disturbance or only mild disturbances in self-
concept. High T-scores (between 60T and 70T) indicate areas of particular
individual strength. Well-rounded individuals who are consistently self-confident
and flexible obtain scores in this range on all TSCS:2 scales. Low scores, below
40T, indicate specific disturbances in self-concept. These individuals are doubtful
about their own worth, but they are cautious and conservative in their self-
descriptions. Individuals with primarily low or very low T-scores, below 30T,
may be experiencing long-standing personal difficulties, such as chronic
depression, eating disorders, persistent self-defeating behavior, and other kinds of
persistent conflict or disturbances (Fitts & Warren, 1996, p. 21).
As mentioned previously, the three null hypotheses for this study stated that there
would be no statistically significant difference between the Total Self-Concept Summary
Scale scores, Social (SOC) Self-Concept Scale scores, and Physical (PHY) Self-Concept
Scale scores from the Tennessee Self-Concept:2 for those students who participated in
athletics, as compared to non-athletic students.
The Total Self-Concept Summary Scale (TOT) score is the “most important score,
as it reflects the individual’s overall self-concept and associated level of self-esteem”
(Fitts & Warren, 1996, p. 21). As shown in Table 16, there were no differences
found at the .05 level between athletes and non-athletes on the Total Self-Concept
Summary Scale.

37
The Social (SOC) Self-Concept Scale score is a “measurement of how the self is
perceived in relation to others. It reflects the individual’s sense of adequacy and worth in
social interaction with other people. The Social Self-Concept Scale score tends to be
associated with the Physical Self-Concept Scale score for people of all ages” (Fitts &
Warren, 1996, p. 24). As noted on Table 16 there were no differences found at the .05
level between athletes and non-athletes on the Social (SOC) Self-Concept Scale.
The Physical (PHY) Self-Concept Scale score is the score that is “related to how
an individual perceives his or her body, state of health, and physical appearance and
because it is always on display for evaluation, physical appearance is highly associate
with global self-esteem across the life-span” (Fitts & Warren, 1996, p. 23). For the
Physical (PHY) Self-Concept Scale score, there was a statistically significance difference
at the .05 level (t = -2.005) in the scores for the athletes, as compared to the non-athletes.
Table 16 indicates the findings from the three subscales that were to be compared
in this study. With regards to the Total Self-Concept Scale (TOT) scores, the null
hypothesis 1 was accepted, as the T-test for equality of means indicated that there was no
statistical significance in TOT scores (t = -1.104) at the .05 level for athletes, as compared
to non-athletes (See Table 16).
The Social Self-Concept Scale score for the two groups indicated that there was
no statistical significance difference at the .05 level (t = .071) and as a result, the null
hypothesis 2 was accepted (See Table 16).
As previously mentioned, the Physical (PHY) Self-Concept Scale score, displayed
that there was a statistically significant difference at the .05 level (t = -2.005) in the scores
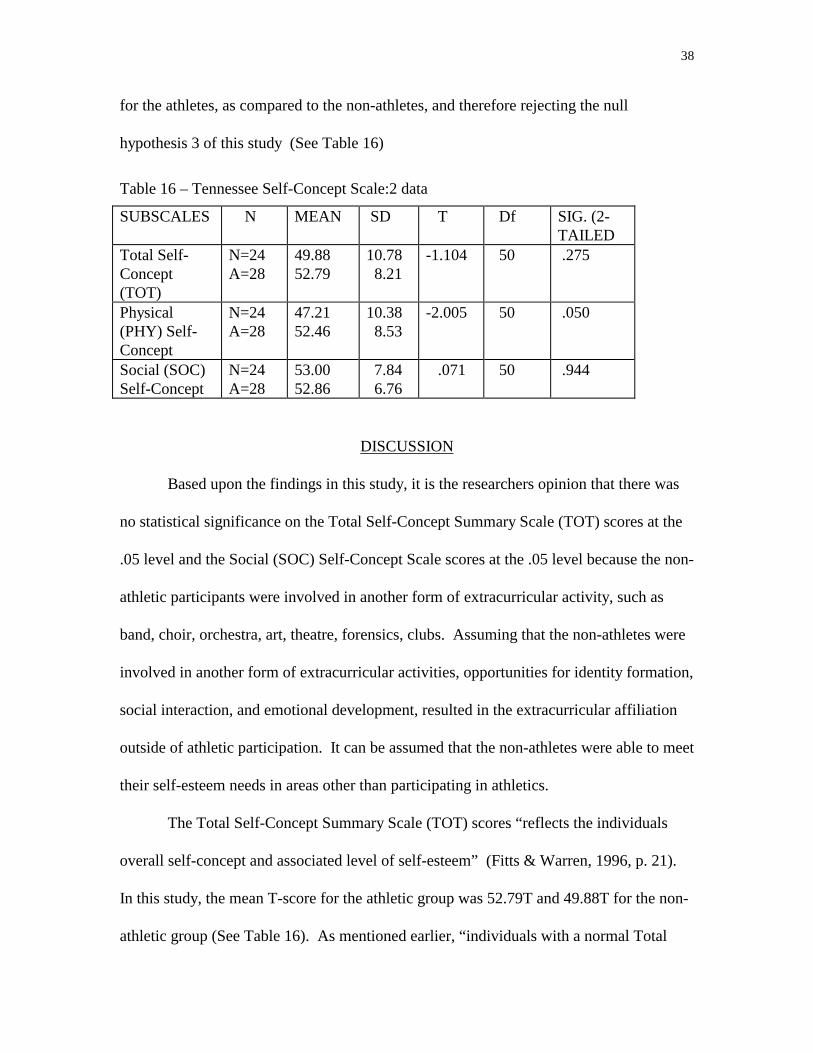
38
for the athletes, as compared to the non-athletes, and therefore rejecting the null
hypothesis 3 of this study (See Table 16)
Table 16 – Tennessee Self-Concept Scale:2 data
SUBSCALES N MEAN SD T Df SIG. (2-TAILED
Total Self-Concept(TOT)
N=24A=28
49.8852.79
10.78 8.21
-1.104 50 .275
Physical(PHY) Self-Concept
N=24A=28
47.2152.46
10.38 8.53
-2.005 50 .050
Social (SOC)Self-Concept
N=24A=28
53.0052.86
7.84 6.76
.071 50 .944
DISCUSSION
Based upon the findings in this study, it is the researchers opinion that there was
no statistical significance on the Total Self-Concept Summary Scale (TOT) scores at the
.05 level and the Social (SOC) Self-Concept Scale scores at the .05 level because the non-
athletic participants were involved in another form of extracurricular activity, such as
band, choir, orchestra, art, theatre, forensics, clubs. Assuming that the non-athletes were
involved in another form of extracurricular activities, opportunities for identity formation,
social interaction, and emotional development, resulted in the extracurricular affiliation
outside of athletic participation. It can be assumed that the non-athletes were able to meet
their self-esteem needs in areas other than participating in athletics.
The Total Self-Concept Summary Scale (TOT) scores “reflects the individuals
overall self-concept and associated level of self-esteem” (Fitts & Warren, 1996, p. 21).
In this study, the mean T-score for the athletic group was 52.79T and 49.88T for the non-
athletic group (See Table 16). As mentioned earlier, “individuals with a normal Total

39
Self-Concept Summary Scale (TOT) score will portray a T-score between 40T and 60T”
(Fitts & Warren, 1996, p. 21). Therefore, the results of this study regarding the average
Total Self-Concept Summary Scale (TOT) T-score complements the existing literature.
As previously stated, the Social (SOC) Self-Concept Scale score “measures how
the self is perceived in relation to others. It reflects the individual’s sense of adequacy
and worth in social interactions with other people” (Fitts & Warren, 1996, p. 24). With
regards to this study, the mean Social (SOC) Self-Concept T-score for the athletic group
was 52.86T and 53.00T for the non-athletic group (See Table 16). Much like the Total
Self-Concept Summary Scale (TOT) score, the majority of individual’s portray a Social
(SOC) Self-Concept Scale T-score between 40T and 60T. These individuals are able to
reflect positive and satisfying relationships with others (Fitts & Warren, 1996, p. 24).
Similar to Fitts and Warran’s (1996) research regarding the Social (SOC) Self-Concept
Scale T-scores, this study suggested the average Social Self-Concept (SOC) T-score was
between 40T and 60T for both groups of participants.
However, it was determined that there was statistical significance in the Physical
Self-Concept Scale T-scores at the .05 level for the athletes, as compared to the non-
athletes. In his book, “Training and Conditioning of Athletes”, Novich (1983) discussed
that physical fitness gives students the opportunities to enhance physical development, as
well as providing a socially acceptable outlet for aggressive and competitive needs
(Leighton, 1990, p. 12). Much like Novich’s book, this study supports and complements
the fact that athletics provides the participants with positive feelings about their physical
appearance and development which was the focus of the Physical (PHY) Self-Concept
Scale.

40
The data gathered in this study revealed that there was little or no difference in
self-concept scores for athletes, as compared to non-athletes. The one exception to the
findings was the results on the Physical (PHY) Self-Concept Scale, which indicated that
the athletes had a greater self-perception regarding physical aspects than non-athletes.

41
CHAPTER V
SUMMARY, CONCLUSIONS, AND RECOMMENDATIONS
Summary:
In summary, the purpose of this study was to determine the level of difference in
self-concept among high school athletes, as compared to non-athletes. The subjects in
this investigation consisted of fifty-two total respondents. Of those respondents, twenty-
six were females and twenty-six were males (See Table 2). When the respondents were
grouped according to athletic participation versus non-athletic participation, twenty-eight
were athletes and twenty-four were non-athletes (See Table 3). All of the participants
were sophomores at Menomonie High School for the 1999-2000 academic school year
(See Table 1). The non-athlete students were obtained from 7 classes during the first
term including: 1 Early U.S. History class, 1 Band class, 1 3-Dimentional Art class, two
Choir classes, and two English classes. The athletic participants were obtained by
attending orientation night for the fall athletic season in September of 1999.
Once parental consent was obtained, the participants in this study were asked to
complete a demographic survey and the Tennessee Self-Concept Scale:2 Adult form. The
findings indicated that there was no statistical significance in T-scores at the .05 level for
athletes when compared to non-athletes with regards to the Total Self-Concept Summary
Scale (TOT) and the Social (SOC) Self-Concept Scale. It is the researcher’s assumption
that the non-athletic participants were involved in other forms of extracurricular
activities, such as band, show choir, theatre, art, forensics, which would allow for the
similarities in T-scores for the two groups of participants. However, the data analysis
regarding the Physical (PHY) Self-Concept Scale was statistically significant at the .05

42
level, with the athletes providing higher T-scores than the non-athletic group. Thus, there
appears to be a higher self-evaluation of one’s body, state of health, physical development
and appearance for the athletes when compared to the group of non-athletic participants.
Conclusions:
The overall results of this study suggest that the self-esteem of athletes is not
significantly different than non-athletes. However, there was a significant difference in
the Physical (PHY) Self-Concept Scale T-scores, with athletes having a higher self-
concept T-score than the non-athletes. This supports the fact that with regards to physical
self-evaluation, athletes portray a greater self-concept. Nevertheless, when the fourteen
other subscales were reviewed, there was no statistical significance in self-concept T-
scores for the athletes, as compared to the non-athletes. Therefore, the results of this
study would propose that participating in athletes does not lead to an overall higher self-
concept.
Recommendations:
There are many influential factors that must be considered when researching the
topic of self-concept. In this particular study, all of the respondents were in the
developmental stage of adolescence, which is an enormous factor that should be
considered regarding level of self-concept. As mentioned earlier, adolescence is a
developmental stage of uncertainty, rapid changes, and emotional turbulence. On any
particular day, an adolescent’s level of self-concept may fluctuate drastically.
Recommendations for future study would include re-testing the same group of
respondents later in their developmental years, such as their senior year of high school

43
rather than their sophomore year of high school, when adolescence was not so much of an
influential factor.
One consideration would be to study a group of athletes that were involved in the
same sport and compare their T-scores to a group of non-athletes not involved in an
extracurricular activity. This would help control for differences in sports and
extracurricular activities.
Furthermore, obtaining a larger sample size with more cultural diversity could
provide more variation in results. Additionally, a study which compares high
socioeconomic status athletes with low socioeconomic status athletes might offer a
different set of results. Geographic location is another consideration. A comparison of
urban and rural students would be suggested for future researchers.
Finally, controlling for participation in extracurricular activities among non-
athletes may result in a different set of findings.
Regardless of the results of this study, in the future, it is important that if we wish
to continue to enhance student’s level of self-concept, we must provide them with
additional opportunities that allow them to perceive themselves in a positive manner.
This should include opportunities for growth in cognitive, social or physical activities.
The relationship between athletics and self-concept is a complex topic. The
literature that exists suggests contradictory findings, with some studies displaying no
relationship between athletic participation and self-concept, and other studies providing
significance that indeed display a positive relationship between athletic participation and
self-concept. This study indicated that athletes scored higher on physical appearance and

44
development than did non-athletes. Therefore, continuing research on the topic of
athletic participation, as it relates to level of self-concept is encouraged.
BIBLIOGRAPHY

45
BIBLIOGRAPHY
Alley, L. (1974). Athletics in education. Phi Delta Kappan, 56, 102-105.
Beane, J. & Lipka, R. (1984). Self-Concept, self-esteem, and the curriculum.
New York, NY: Teachers College, Columbia University.

46
Berk, L. (1993). Infants, children, and adolescents. Needham Heights, MA:
Allyn & Bacon.
Curry, L.A., Rehm, M., & Bernuth, C. (1997). Participation in NCAA Division I
athletics: Self-perception differences in athletics and non-athletes. College Student
Journal, 31(1), 96-102.
Ferguson, A. (1999). Inside the crazy culture of kids sports. Time, 154(2), 52-
60.
Fitts, W.H. & Warren, W.L. (1996). Tennessee self-concept scale: 2 (2nd ed.).
Western Psychological Services.
Hanson, J.S. & Nedde, W.H. (1974). Long term physical training effect on
sedentary females. Journal of Applied Psychology,37, 112-117.
Hewitt, J. (1998). The myth of self-esteem: Finding happiness and solving
problems in America. New York, NY: St. Martin’s Press.
Johnson, T., MD. (1976). Developing a realistic success expectancy in young
athletes, In Timothy T. Craig (Ed.), The Humanistic and Mental Health Aspect of Sports,
Exercise, and Recreation, (p. 68-69). Am. Medical Association.
Jorgenson, D.E., & Jorgenson, C.B. (1979). Effects on running on perception of
self and others. Perception of Motor Skills, 46, 33.
Leighton, M. (1990). A study of the effect of exercise on self-esteem.
Unpublished Master’s Thesis, University of Wisconsin-Stout, Menomonie.
Leonardson, G.R., & Garguilo, R.M. (1978). Self-perception and physical
fitness. Perception and Motor Skills, 46, 338.

47
Marsh, H.W. (1998). Age and gender effects in physical self-concept for
adolescent elite athletes and non-athletes: A multicohort-multioccasion design. Journal
of Sport and Exercise Psychology, 20: 237-259.
Marsh, H.W. & Peart, N. (1988). Competitive and cooperative physical fitness
training programs for girls: Effects on physical fitness and on multidimensional self-
concepts. Journal of Sports and Exercise Psychology, 10, 390-407.
Martens, R. (1974). Coaches guide to sport psychology. Champaign, Illinois:
Human Kinetics Publishers, Inc.
Novich, M.M., MD, & Taylor, B. (1983). Training and conditioning of athletes.
Philadelphia: Lea and Febiger.
President’s Council on Physical Fitness and Sports. (1971). Suggestions for
school programs: Youth physical fitness. Superintendent of Documents, U.S.
Government Printing Office, Washington, D.C.
Rierden, J., Koff, E., & Stubbs, M. (1988). Gender, depression, and body image
in early adolescents. Journal of Early Adolescence, 8, 109-117.
Rudd, A. & Stoll, S. (1998). Understanding sportsmanship. The Journal of
Physical Education, Recreation, and Dance, 69(9), 38-42.
Smith, T.L. (1986). Self-concepts of youth sports participants and non-
participants in grades 3 and 6. Perceptual and Motor Skills, 62, 86.
Sonstroem, R.J. (1984). Exercise and self-esteem. Exercise and Sport Science
Reviews, 12, 123-155.
Stessen Berger, K. (1994). The developing person through the life span. New
York, NY: Worth Publishers.

48
Stevenson, C.L. (1985). College athletics and “character”: The decline and fall
of socialization research. In D. Chu (Ed.), Sports in higher education. Champaign, IL:
Human Kinetics.
Walsh, J. (1984). Test Critiques (Vol. 1). Kansas City, MO: Test Corporation
of America.
Wisconsin Department of Public Instruction. (1986). School counseling
programs: A resource and planning guide. Madison, WI: Wisconsin Department of
Public Instruction.
APPENDIX A
TENNESSEE SELF-CONCEPT SCALE: 2 ADULT FORM

49
APPENDIX B

50
HUMAN RESEARCH CONSENT FORM
(PARENTAL/STUDENT CONSENT FORM)
APPENDIX C

51
STUDENT LETTER/COVER LETTER
APPENDIX D

52
DEMOGRAPHIC SURVEY FOR ATHLETIC PARTICIPANTS
APPENDIX E

53
DEMOGRAPHIC SURVEY FOR NON-ATHLETIC PARTICIPANTS
APPENDIX F

54
LETTER OF THANKS