table of contents - jcia 日本化学工業協会 › ... › iccabuildingtechnologyroadmap.pdfby...
TRANSCRIPT

i

ICCA Building Technology Roadmap ii
Table of Contents
Executive Summary .......................................................................................................................................................................... iv
Foreword ............................................................................................................................................................................................ vii
The International Council of Chemical Associations ......................................................................................................... viii
Introduction ......................................................................................................................................................................................... 1
Roadmap rationale, purpose and vision ..................................................................................................................................... 1
Roadmap scope and structure......................................................................................................................................................... 2
Phase I Overview ................................................................................................................................................................................ 3
Limitations ............................................................................................................................................................................................... 3
Chapter 1: Building stock ................................................................................................................................................................ 4
Overview of regions and building types ..................................................................................................................................... 4
Baseline stock and growth ................................................................................................................................................................ 4
Renovations ............................................................................................................................................................................................. 7
Demolition ................................................................................................................................................................................................ 8
Chapter 2: Use phase energy and GHG modeling .................................................................................................................... 9
Chapter 3: Chemically derived building products ............................................................................................................... 18
Overview ................................................................................................................................................................................................ 18
Insulation ............................................................................................................................................................................................... 19
Pipe and pipe insulation.................................................................................................................................................................. 21
Air sealing .............................................................................................................................................................................................. 22
Overview ................................................................................................................................................................................................ 22
Modeling ................................................................................................................................................................................................ 22
Reflective roof coatings and pigments ...................................................................................................................................... 23
Windows ................................................................................................................................................................................................ 24
Production impacts ........................................................................................................................................................................... 26
Summary of key points .................................................................................................................................................................... 26
Chapter 4: Life cycle energy and GHG savings potential for deployment of chemically-derived building products .......................................................................................................................................................... 28
Savings potential in residential and commercial sectors due to improved building envelope efficiency ............................................................................................................................................................................... 28
Savings potential for envelope improvements in combination with fuel switching and decarbonization of electricity ..................................................................................................................................... 32
Savings potential from value chain for chemically derived products ........................................................................ 33
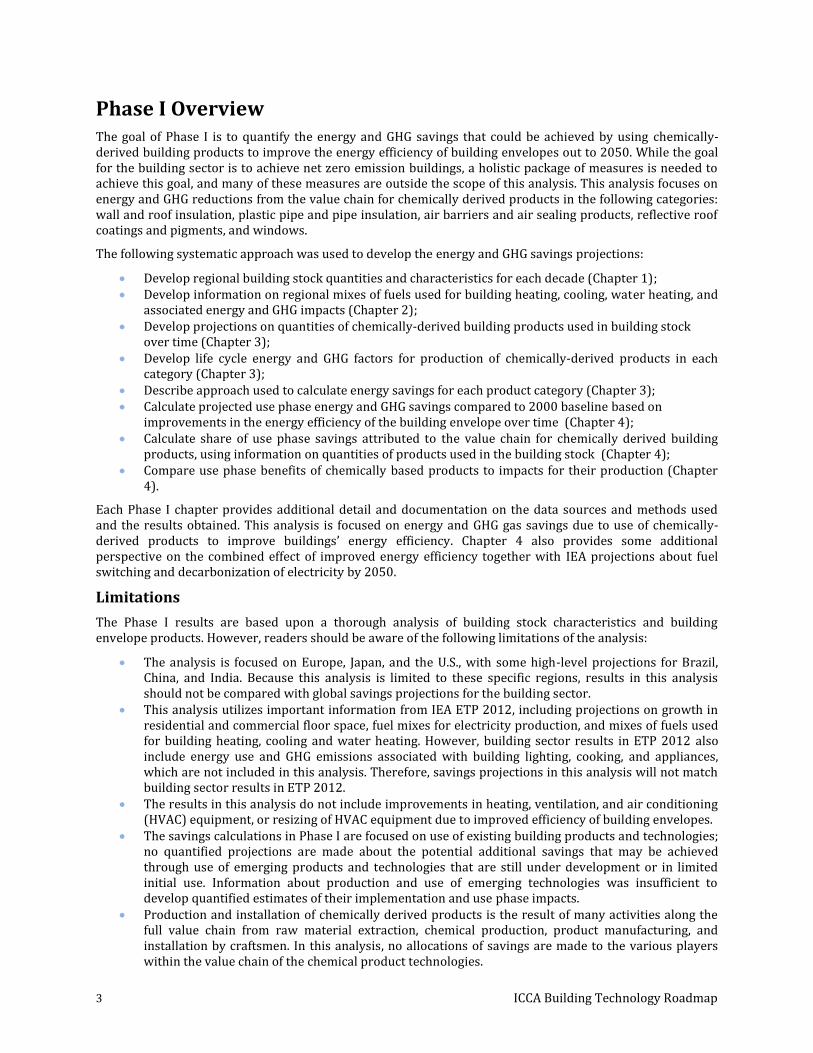
Results by end use category .......................................................................................................................................................... 36
Results by product category .......................................................................................................................................................... 38
Net savings potential for chemically derived products .................................................................................................... 41
Chapter 5: Projections for high-growth regions (Brazil, China, India) ........................................................................ 51
Overview ................................................................................................................................................................................................ 51

iii
Projections ............................................................................................................................................................................................ 51
Heating energy .................................................................................................................................................................................... 52
Cooling energy ..................................................................................................................................................................................... 53
Water heating energy ....................................................................................................................................................................... 53
Savings from chemically derived building products .......................................................................................................... 54
Summary ................................................................................................................................................................................................ 55
Phase I Key Messages ..................................................................................................................................................................... 57
Phase II Overview ............................................................................................................................................................................ 59
Chapter 6: Challenges to greater use of chemically derived building products ....................................................... 60
Overview ................................................................................................................................................................................................ 60
Specific issues relevant to chemically derived products .................................................................................................. 63
Conclusions ........................................................................................................................................................................................... 64
Chapter 7: Technology development ....................................................................................................................................... 65
Overview ................................................................................................................................................................................................ 65
RD&D requirements for each product group ........................................................................................................................ 66
Insulation ............................................................................................................................................................................................... 66
Other opportunities for RD&D ..................................................................................................................................................... 69
Main factors influencing getting new technologies into commercial production and use ................................ 70
Chapter 8: Strategic goals and actions to energy efficient building technology policy ......................................... 73
Overview ................................................................................................................................................................................................ 73
Policy processes .................................................................................................................................................................................. 73
Public investment .............................................................................................................................................................................. 74
Education and outreach .................................................................................................................................................................. 74
Financial ................................................................................................................................................................................................. 75
Conclusions ........................................................................................................................................................................................... 75
Chapter 9: Collaboration and partnerships ........................................................................................................................... 76
Accelerating Energy Efficiency through Partnerships ...................................................................................................... 76
Conclusions ........................................................................................................................................................................................... 77
Phase II Key Messages.................................................................................................................................................................... 78
Roadmap ................................................................................................................................................................................................ 78
Annex I: List of Figures .................................................................................................................................................................. 81
Annex II: List of Tables .................................................................................................................................................................. 83
Annex III: Development Status of Emerging Chemically Derived Technologies ...................................................... 84
Annex IV: List of Acronyms .......................................................................................................................................................... 85
References .......................................................................................................................................................................................... 87

ICCA Building Technology Roadmap iv
Executive Summary According to the International Energy Agency’s Energy Technology Perspectives 2012 report, the building sector is directly or indirectly responsible for about 32% of global energy consumption and for 26% of global total end-use energy-related carbon dioxide (CO2) emissions. Huge amounts of energy – over 970 million tonnes of oil equivalent in 2009 - are required for space heating and space cooling in the global building stock due to heat gains and losses from building envelopes. The energy requirements and associated greenhouse gas (GHG) emissions are substantial in cold and hot climates alike. Overarching climate goals (reduction of GHG emissions by 80 to 95% by 2050) can only be reached with major contributions from the building sector.
The Chemical Industry is indispensable in providing solutions that increase energy efficiency in buildings and pave the way towards the near-zero energy buildings of the future. Many effective chemical industry products – including a range of energy efficient plastics – are already available and in wide use today and new and better technologies are constantly being developed. In this analysis, the potential energy and GHG savings due to use of chemically derived building products are projected out to 2050. The analysis focuses on building stock in Europe, Japan, and the U.S. The report also includes a brief analysis of growing build stock in emerging economies, including Brazil, China and India.
The amount of residential and commercial building stock in Europe, Japan, and the U. S. is projected to increase from 59 billion square meters in 2000 to 93 billion square meters in 2050. With this growth in building stock, energy use for building heating, cooling, and water heating would increase by almost 60% and GHG emissions would rise from 3,400 million metric tonne carbon dioxide equivalent (MtCO2e) in 2000 to 5,200 MtCO2e in 2050 if no improvements were made to the energy efficiency of new and existing buildings.
Improvements in new stock and gradual removal of older, less efficient stock are not enough to offset the growth in stock. Although tightened standards for new construction would hold the increase in GHG to 300 MtCO2e from 2000 to 2050, this is still a net increase of nearly 10% in building sector GHG emissions. In order to achieve net reductions in building energy use and associated GHG emissions while building stock increases, the energy efficiency of the large existing stock of residential and commercial buildings must also be improved. Combining better energy efficiency standards for new buildings with a moderate rate of renovation of 2000 building stock would result in a 12% decrease in energy and GHG by 2050, while tighter new building standards combined with a more ambitious renovation rate could result in a 23% reduction in energy use and GHG compared to 2000.
1
The savings projections described above are due solely to improvements in energy efficiency of the building envelope and hot water piping. When these improvements are combined with projected shifts to lower carbon fuels, including decarbonization of electricity through carbon capture and storage and greater use of renewable fuels, the GHG reductions in 2050 decrease by about 70% from 2000 levels.
Executive Summary 1 shows the changes in GHG emissions for the different future scenarios.
1 Renovation rates per decade by region and building type for the moderate and ambitious scenarios are described in Chapter
1. Savings are based on renovations improving the energy efficiency of the building envelope to 70% of the efficiency of new buildings in each decade.

v
Executive Summary 1. Potential GHG Scenarios for Growth in Building Stock from 2000 to 2050 (combined residential and commercial building stock in Europe, Japan, and the U.S.)
The figure above illustrates the GHG emissions results for use of all types of wall and roof insulation, hot water piping materials, air barriers and air sealing materials, cool roofing, and windows used to improve building energy efficiency, by chemically derived, as well as alternative products in these categories. In 2050, the amount of GHG savings attributed to the value chain for chemically-derived building products (insulation, piping, air barriers and sealing materials, cool roof coatings and pigments) is based on their expected market shares by decade. By 2050, the GHG savings attributed to these products is 970 (MtCO2e) for the moderate renovation rate and over 1,100 MtCO2e for the ambitious renovation rate. Use of energy efficient plastic-frame windows adds another 300 to 370 MtCO2e of GHG savings, where the chemically derived content of the window assembly plays a major role for to the overall performance of the window.
Over time, the emission savings realized by the users of chemically derived building products are many times greater than the energy and GHG impacts for their production. The products continue to accrue use phase savings throughout their life in the building. By 2050, the cumulative net GHG savings (use phase savings minus production impacts) for the chemically-derived building products installed in the buildings from 2000 and 2050 could be 30,000 MtCO2e for Europe, Japan, and the U.S.
2
Clearly, products from the chemical industry play a vital role in achieving substantial energy and GHG reductions for the building sector.
The chemical industry has already made great strides in providing energy efficient solutions to the building sector, and continues to advance acceptance and use of energy efficient building products through efforts such as:
Participating in projects that demonstrate how low energy houses, passive houses and zero emission buildings are realistically achievable and cost effective over time for society and the individual investor alike;
Sponsoring life cycle assessment studies to provide credible, science-based data quantifying the net energy and GHG benefits over the full life cycle of chemically derived building technologies;
2 See Figure 35in Chapter 4.
0
1,000
2,000
3,000
4,000
5,000
6,000
2000 (59 billion m2)
2010 2030 2050 (93 billion m2)
MtC
O2e
No improvement
New bldg improvement, no renovation
New bldg improvement, moderate renovation rate
New bldg improvement, ambitious renovation rate
New bldg improvement, mod renov, low C & fuel switching
New bldg improvement, amb renov, low C & fuel switching

ICCA Building Technology Roadmap vi
Continuing to invest in research and development of new and improved products that achieve higher levels of energy efficiency over longer lifetimes, leading to greater GHG savings;
Cooperating with the value chain from architects to craftsmen with the objective of ensuring proper use and installation of energy efficient building products.
In addition to the chemical industry’s own activities, it is critically important that other stakeholders such as governments, policymakers, institutions, associations and buildings energy efficiency value chain also take actions needed to ensure that the full potential of energy saving building technologies are realized. These actions include:
Ensuring that the regulatory environment and building codes support inclusion and enhanced deployment of energy-efficient chemically-derived technologies;
Providing incentives needed to increase renovation rates and foster new technologies; Utilizing international forums as a platform to harmonize building standards, exchange key information
resources, and facilitate dialogue between policy makers, industry experts, and other stakeholders regarding energy efficient buildings;
Creating greater awareness of the economic and social benefits of high energy efficiency in buildings through collaborative efforts of governments, industry, institutions, and associations.
Working together, stakeholders can achieve the vision of a built environment that meets the needs of occupants worldwide in all types of geographic and climate zones while at the same time minimizing global warming impacts to ensure a sustainable future.

vii
Foreword Through the development of new, innovative products and more efficient technologies, the chemical industry is playing an important role in addressing challenges related to energy and GHG savings, at national, regional and international levels. In 2009, ICCA published a study entitled Innovation for Greenhouse Gas Reductions: A life cycle quantification of carbon abatement solutions enabled by the chemical industry, which analyzed the chemical industry’s role in reducing GHG emissions across a wide range of industry sectors.
The ICCA Buildings Technology Roadmap report focuses on the chemical industry’s contributions to energy and GHG savings in the buildings sector, including the benefits of high performance plastic foam insulation, plastic pipe and pipe insulation, reflective roofing, products and materials used to reduce energy loss due to air infiltration and heat loss, and chemically-derived components of energy-efficient windows. The objective of this report is to provide thorough, credible, scientifically based analyses that quantify the net benefits of the production and deployment of chemically derived building products. Industry and regulators can use this information to guide decisions and actions needed to achieve the substantial reductions in global warming impacts that are possible through greater use of chemically-based building products.
While use of chemically-derived products enables significant reductions in energy requirements for building space conditioning energy and associated GHG emissions, it is also important to consider the global warming impacts associated with the manufacturing of chemical products, extending all the way back to raw material extraction. The analyses in this report show that the emissions reductions attributed to the use of chemically derived building products far exceed the amount of GHGs emitted during their production, resulting in large net GHG savings over the useful life of the products.
ICCA would like to thank Franklin Associates, A Division of ERG, for their role in overall management of the project and leading the development of the life cycle energy and GHG analysis, including guidance on methodology and 2050 scenario modeling. In development of the roadmap, AEA contributed expert analysis of potential challenges to greater implementation of chemically-based building products, and in-depth knowledge of international policies, opportunities for collaboration, and strategies for overcoming these challenges. Building Insight, LLC provided market analysis, building code and building science support. ICCA also thanks the International Energy Agency for providing critical background data to support this report. This effort would also have been impossible without the knowledge and insights of many who supported the ICCA common views and played an active role in providing the necessary product and application information.
The policy implications and recommendations in this report are solely the views of the ICCA.
Sincerely,
Mr. Otsuka Shigenori Executive Consultant, Mitsubishi Chemical Holdings Corporation and Chairman, ICCA Energy and Climate Change Leadership Group

ICCA Building Technology Roadmap viii
The International Council of Chemical Associations The International Council of Chemical Associations (ICCA) is the worldwide voice of the chemical industry, representing chemical manufacturers and producers all over the world. Responding to the need for a global presence, ICCA was created in 1989 to coordinate the work of chemical companies and associations on issues and programs of international interest. It comprises trade associations representing companies involved in all aspects of the chemical industry.
ICCA now accounts for more than 75%of chemical manufacturing operations with a production exceeding USD 1.6 trillion annually. Almost 30 percent of this production is traded internationally. ICCA promotes and co-ordinates Responsible Care® and other voluntary chemical industry initiatives.
ICCA has a central role in the exchange of information within the international industry, and in the development of position statements on matters of policy. It is also the main channel of communication between the industry and various international organizations that are concerned with health, environment and trade-related issues, including the United Nations Environment Programme (UNEP), the World Trade Organization (WTO) and the Organisation for Economic Co-operation & Development (OECD).
ICCA operates by coordinating the work of member associations and their member companies, through the exchange of information and the development of common positions on policy issues of international significance.
Three main issues focused on by ICCA are:
Chemicals Policy & Health Climate Change & Energy Responsible Care®
ICCA also serves as the main channel of communication between the industry and various international entities, such as inter-governmental organizations (IGOs) and NGOs that are concerned with these global issues.
The International Council of Chemical Associations c/o Cefic
Avenue E. Van Nieuwenhuyse 4, box 1
B-1160 Brussels, Belgium
ICCA Website
Further information about the Council and its activities, including various materials for downloading, can be found on the ICCA website:
www.icca-chem.org

1 ICCA Building Technology Roadmap
Introduction
Roadmap rationale, purpose and vision
Since 1980, global energy demand has almost doubled and, if the current trend continues, energy demand will rise by another 85% (i.e. almost doubling again) by 2050. This is a cause for concern in terms of climate change, as energy-related CO2 emissions make up around two-thirds of total global GHG emissions. Scientific evidence suggests that an increase of such magnitude would set the world on the road to a 6 degrees Celsius (°C) rise in average global temperature. The current increasing energy demand, and associated GHG emissions, is therefore unsustainable and improvements in energy technologies and energy efficiency will have a major role to play in reducing this growth.
Energy Technology Perspectives 2012 (ETP 2012), published by the International Energy Agency (IEA), focuses on a scenario that looks to limit the average global temperature increase to 2°C, a globally agreed target. The scenario looks to cutting energy-related CO2 emissions in half by 2050 compared to 2009. The 2°C Scenario (2DS) notes that, while transforming the energy sector is vital, reducing GHG emissions from non-energy sectors also has a vital role to play. It highlights that there are substantial opportunities to increase energy savings, improve energy efficiency and increase knowledge on the use of energy across sectors, including the buildings sector.
ETP 2012 shows that, in order to meet the 2DS, 18% of the total emissions reductions come from the buildings sector (see Figure ). Overall, the 2DS calls for a CO2 emissions reduction of over 60% by 2050 within the buildings sector 3.
Figure 1: Key sector contributions to global CO2 emissions reductions
Source: ETP 2012, Figure 2.1
In 2009, the buildings sector consumed 2,759 million tonnes of oil equivalent (Mtoe), representing 32% of total global energy use and almost 10% of total direct energy-related CO2 emissions. With electricity generation emissions and district heat included, buildings are responsible for just over 30% of total end-use energy-related CO2 emissions.
The global share of energy demand from buildings is expected to grow rapidly, with ETP 2012 indicating that energy demand from the buildings sector will more than double by 2050. In large cities, building energy use can account for up to 80% of carbon emissions. Many of the buildings that will exist to 2050 have already been built. While many of these buildings were not designed for energy efficiency, a typical building can realize significant energy savings by retrofitting with up-to-date technologies and systems, as well as by
3 http://www.iea.org/media/etp/FactsheetETP2012EndUseSector.pdf

ICCA Building Technology Roadmap 2
optimizing operations. ETP 2012 recognizes that there is large potential for countries to put policies in place to enhance the energy performance of buildings; deploy energy efficient end-use technologies and improve energy performance codes and standards for new and existing buildings.
The Chemical Industry has an important, if not crucial, role to play in increasing energy efficiency in buildings and in helping to pave the way towards the near-zero energy buildings of the future, with many technical solutions that are already available or are in development.
The intent of this report is to complement IEA’s work in finding solutions, by creating a zero or low emission building roadmap that defines and communicates the chemical industry’s present and future technological contribution to energy efficiency and GHG emissions savings in the buildings sector. Technology and policy solutions needed to achieve these savings are also highlighted in this report. .
The report develops a potential growth path for the product groups it covers from today to 2050. The overarching goal of the report is to inform the public of the potential energy savings achievable through these product groups, and aid them in realizing their full potential. The report outlines the challenges to achieving these goals and lays out actions needed to overcome these obstacles.
Roadmap scope and structure
The roadmap was developed in two phases. The goal of Phase I was to determine the potential energy efficiency and GHG emissions savings that are technically achievable by 2050 from available building technologies implemented in the residential and commercial building sectors. This phase is discussed in Chapters 1 to 5 of this report.
Phase II discusses the challenges and opportunities for increasing use of chemically-derived building products, and from this, a set of recommended activities for achieving the projected savings has been developed. Outputs from this phase are outlined in Chapters 6 to 9. It should be noted that the primary focus of Phase II is on issues that are specific to the building sector. Although there are larger issues that affect all sectors of global economy, such as policy and legislation around total carbon emissions, in-depth exploration of how these wider policy issues affect production and use of chemically-derived building products is beyond the scope of this analysis.
The report focuses on the built environment in Europe, Japan and the United States (U.S.) relative to the year 2000, which is used as a baseline. The savings projections are focused on established products and technologies. In the IEA ETP 2012, a large percentage of the GHG reductions out to 2050 is expected to come from emerging economies where there is population growth and rapid urbanization (e.g., Brazil, China, and India). Information on building stock in these countries is not available at the same level of detail that is available for Europe, Japan and the U.S. For Brazil, China, and India the report includes only some high-level projections regarding the potential for energy and GHG savings from improvements in energy efficiency of the building stock in these emerging high-growth regions.
3 ICCA Building Technology Roadmap
Phase I Overview The goal of Phase I is to quantify the energy and GHG savings that could be achieved by using chemically-derived building products to improve the energy efficiency of building envelopes out to 2050. While the goal for the building sector is to achieve net zero emission buildings, a holistic package of measures is needed to achieve this goal, and many of these measures are outside the scope of this analysis. This analysis focuses on energy and GHG reductions from the value chain for chemically derived products in the following categories: wall and roof insulation, plastic pipe and pipe insulation, air barriers and air sealing products, reflective roof coatings and pigments, and windows.
The following systematic approach was used to develop the energy and GHG savings projections:
Develop regional building stock quantities and characteristics for each decade (Chapter 1); Develop information on regional mixes of fuels used for building heating, cooling, water heating, and
associated energy and GHG impacts (Chapter 2); Develop projections on quantities of chemically-derived building products used in building stock
over time (Chapter 3); Develop life cycle energy and GHG factors for production of chemically-derived products in each
category (Chapter 3); Describe approach used to calculate energy savings for each product category (Chapter 3); Calculate projected use phase energy and GHG savings compared to 2000 baseline based on
improvements in the energy efficiency of the building envelope over time (Chapter 4); Calculate share of use phase savings attributed to the value chain for chemically derived building
products, using information on quantities of products used in the building stock (Chapter 4); Compare use phase benefits of chemically based products to impacts for their production (Chapter
4).
Each Phase I chapter provides additional detail and documentation on the data sources and methods used and the results obtained. This analysis is focused on energy and GHG gas savings due to use of chemically-derived products to improve buildings’ energy efficiency. Chapter 4 also provides some additional perspective on the combined effect of improved energy efficiency together with IEA projections about fuel switching and decarbonization of electricity by 2050.
Limitations
The Phase I results are based upon a thorough analysis of building stock characteristics and building envelope products. However, readers should be aware of the following limitations of the analysis:
The analysis is focused on Europe, Japan, and the U.S., with some high-level projections for Brazil, China, and India. Because this analysis is limited to these specific regions, results in this analysis should not be compared with global savings projections for the building sector.
This analysis utilizes important information from IEA ETP 2012, including projections on growth in residential and commercial floor space, fuel mixes for electricity production, and mixes of fuels used for building heating, cooling and water heating. However, building sector results in ETP 2012 also include energy use and GHG emissions associated with building lighting, cooking, and appliances, which are not included in this analysis. Therefore, savings projections in this analysis will not match building sector results in ETP 2012.
The results in this analysis do not include improvements in heating, ventilation, and air conditioning (HVAC) equipment, or resizing of HVAC equipment due to improved efficiency of building envelopes.
The savings calculations in Phase I are focused on use of existing building products and technologies; no quantified projections are made about the potential additional savings that may be achieved through use of emerging products and technologies that are still under development or in limited initial use. Information about production and use of emerging technologies was insufficient to develop quantified estimates of their implementation and use phase impacts.
Production and installation of chemically derived products is the result of many activities along the full value chain from raw material extraction, chemical production, product manufacturing, and installation by craftsmen. In this analysis, no allocations of savings are made to the various players within the value chain of the chemical product technologies.

ICCA Building Technology Roadmap 4
Chapter 1: Building stock The first step in analyzing the potential for energy and GHG savings in residential and commercial building stock is to assess the quantity and characteristics of the existing building stock and develop projections for changes in building stock by decade out to 2050.
Overview of regions and building types
The three regions covered in detail by this study are Europe, Japan, and the U.S.. These are broken into a total of seven sub-regions:
U.S. – warm (represented by Dallas) U.S. – cool (represented by Chicago) Europe – warm developed Europe – warm undeveloped Europe – cool developed Europe – cool undeveloped Japan
Europe and the U.S. were broken into sub-regions so as to better model differences in climate and building envelope features. Five commercial and two residential building types are evaluated in each of the seven sub-regions. The residential buildings are represented by detached single-family homes and mid-rise apartment buildings. Commercial building types included in the analysis are: hospitals and other healthcare facilities, hotels, education, retail, and office buildings. These types were chosen as being representative of the greater part of the commercial building stock; however it is acknowledged that not all commercial floor space is covered by these five building types. For example, buildings used for sports and leisure and warehouses are not included. Industrial buildings such as manufacturing facilities also are not included in the scope of this analysis.
Baseline stock and growth
The baseline for the model is the building stock in 2000, which is reported by region and building type. For residential stock, government statistics are used to calculate growth rates between 2000 and 2010 in the U.S. (EIA 2001, EIA 2009). IEA data on the growth rates from 2007 to 2015 are used in conjunction with government data to determine the number of Japanese households in 2000 and 2010 (IEA 2011, MLIT 2011). A 2011 report published by Buildings Performance Institute Europe (BPIE) is used to determine building stock and growth rates in European countries. For years after 2010, IEA projections are used as the main source of data on growth in the number of residential households. Data from IEA are also used to determine the annual increase in household size in square meters (m2) for each region, with projected annual increases of 0.5%, 0.4%, and 0.2% for households in the U.S., Europe, and Japan (IEA 2012). Because the data from IEA are only available for residential buildings as a single category, both single- and multi-family households are projected to have the same growth rates for both the number and size of buildings. A summary of the growth rates for residential buildings over time is provided in Table 1. For Japan, there is a slight net decline in residential stock in 2040 and 2050.

5 ICCA Building Technology Roadmap
Table 1: Residential Growth Rates (annual increase in number of households by decade)
2010* 2010** 2020 2030 2040 2050
U.S. cool 0.2% 0.8% 1.1% 1.1% 0.6% 0.6%
U.S. warm 1.0% 0.8% 1.1% 1.1% 0.6% 0.6%
Europe, cool developed 1.2% -0.3% 1.0% 1.0% 0.4% 0.4%
Europe, cool undeveloped -0.1% 0.0% 1.0% 1.0% 0.4% 0.4%
Europe, warm developed 1.7% 2.0% 1.0% 1.0% 0.4% 0.4%
Europe, warm undeveloped 0.8% 1.6% 1.0% 1.0% 0.4% 0.4%
Japan 0.7% 0.7% 0.3% 0.3% -0.1% -0.1%
*Single-family and **multi-family growth rates from 2000 to 2010 were available separately in some regions. U.S. growth rates during this period represent 2001-2009, and European rates are for 2000-2008.
For commercial buildings, projections from the U.S. 2012 Annual Energy Outlook (EIA 2012) are used for each U.S. commercial building type from 2000 through 2030. For the final two decades modeled, EIA projected growth rates are used for all commercial building types in the U.S., as shown in Table 2.
Table 2: U.S. Commercial Growth Rates (annual increase in million square meters of floor space by decade)
U.S. 2010 2020 2030 2040 2050
Education 0.6% 0.6% 0.6% 0.8% 0.8%
Hospital 1.3% 1.3% 1.3% 0.8% 0.8%
Hotel 1.2% 1.2% 1.2% 0.8% 0.8%
Retail 0.9% 0.9% 0.9% 0.8% 0.8%
Office 1.0% 1.0% 1.0% 0.8% 0.8%
European commercial growth rates from 2000 to 2020 are calculated from data provided by IEA (Table 3). IEA data from the 2012 ETP model are used to model growth rates for Japanese building from 2020 through 2050 (Table 4).
Figure 2 through Figure 4 illustrate the growth in residential, commercial, and total building floor space between 2000 and 2050 for the 7 sub-regions evaluated for Europe, Japan, and the U.S.
Table 3: European Commercial Growth Rates (annual increase in million square meters of floor space by decade)
Europe 2010 2020 2030 2040 2050
Education 2.5% 2.5% 2.0% 1.3% 1.3%
Hospital 2.5% 2.5% 2.0% 1.3% 1.3%
Hotel 2.5% 2.5% 2.0% 1.3% 1.3%
Retail 2.5% 2.5% 2.0% 1.3% 1.3%
Office 2.5% 2.5% 2.0% 1.3% 1.3%

ICCA Building Technology Roadmap 6
Table 4. Japan Commercial Growth Rates (annual increase in million square meters of floor space by decade)
Japan 2010 2020 2030 2040 2050
Education 1.2% 1.2% 1.2% 0.4% 0.4%
Hospital 1.2% 1.2% 1.2% 0.4% 0.4%
Hotel 1.2% 1.2% 1.2% 0.4% 0.4%
Retail 1.2% 1.2% 1.2% 0.4% 0.4%
Office 1.2% 1.2% 1.2% 0.4% 0.4%
Figure 2. Residential Floor Space by Region
Figure 3. Commercial Floor Space by Region
-
10,000
20,000
30,000
40,000
50,000
60,000
70,000
80,000
2000 2010 2020 2030 2040 2050
Mill
ion
m2
Japan
Europe, warm undeveloped
Europe, warm developed
Europe, cool undeveloped
Europe, cool developed
US, warm
US, cool
-
5,000
10,000
15,000
20,000
25,000
2000 2010 2020 2030 2040 2050
Mill
ion
m2
Japan
Europe, warm undeveloped
Europe, warm developed
Europe, cool undeveloped
Europe, cool developed
US, warm
US, cool

7 ICCA Building Technology Roadmap
Figure 4. Total Building Stock Floor Space by Sector and Region
Figure 4 shows that residential space – especially in Europe and the U.S. – accounts for over 75% of the total conditioned area modeled in this study. Figure 2 and Figure 3 show that the cooler regions of Europe and the warm southern portions of the U.S. account for the largest portions of both the residential and commercial floor space. In the warm regions of the U.S., most building stock uses both heating and air conditioning, so improvements in the energy efficiency of the building envelope have the potential to reduce energy use for both types of space conditioning. Building heating is where the most significant improvements can be made in reducing energy use in Europe.
Renovations
Energy savings (and related GHG savings) depend strongly on the rate and depth of renovation of the large quantity of existing, less energy-efficient 2000 building stock that survives into future years. Two scenarios are modeled for the rate of renovations: a moderate rate scenario and an ambitious rate scenario. As a simplifying assumption in this analysis, only buildings from the 2000 stock undergo renovation, as 2000 building stock accounts for the largest share of stock, and have the greatest potential for significant improvements in energy efficiency.
To adjust for physical limitations on renovations of existing buildings (e.g., constraints on space available to add insulation), both scenarios are based on the depth of renovation bringing the building walls, roof, and windows up to 70% of the energy efficiency of a new building from that decade.
In the moderate rate scenario, shown in Table 5, renovation rates lower than the 2.5% per year (or 25% per decade) mentioned in IEA’s ETP 2012 report are used. Single-family homes, which have the highest ratio of building envelope area to conditioned space, have the highest potential for reduced energy requirements, so renovation rates of these buildings are projected to be slightly higher than for apartments or commercial buildings. Based on initial results showing the potential for greater life cycle energy and GHG savings from renovations in colder climates, renovation rates in the moderate renovation scenario are modeled as being highest in the cooler regions of northern Europe and the U.S.
The ambitious renovation rate scenario uses the moderate renovation scenario assumptions for 2010. After 2010, a higher renovation rate of 3% per year is used for all building stock in all regions. To reach IEA 2DS climate goals for 2050, the 2000 building stock must undergo major renovation during that period. A renovation rate of 2% is already fixed as an indicative goal in European policy like the Roadmap to a Resource Efficient Europe or the German Energy Concept.
-
10,000
20,000
30,000
40,000
50,000
60,000
70,000
80,000
90,000
100,000
2000 2010 2020 2030 2040 2050
Mill
ion
m2
Commercial - Japan
Commercial - Europe
Commercial - US
Residential - Japan
Residential - Europe
Residential - US

ICCA Building Technology Roadmap 8
Table 5. Renovation Rates per Decade for Moderate Renovation Scenario
Cool Regions Warm Regions and Japan
Single-family 15% 5%
Apartment building 10% 5%
Commercial 10% 5%
Because the rates only apply to the 2000 stock, which shrinks over time due to demolitions, the number of buildings affected decrease each decade. The model does not differentiate older and newer buildings within the 2000 stock, so any additional savings from upgrading below average stock with poor insulation or high air change per hour (ACH) are not taken into account. Additionally, the upgrades are relative to the composite stock as it moves forward in time. This means that some of the original 2000 stock may be upgraded more than once over time.
Demolition
As buildings age they are slowly removed from the existing stock. To simplify the model, only the stock of buildings existing in 2000 undergoes demolition in the model. The commercial demolition rates are based on the formula provided in the U.S. Energy Information Administration (EIA) National Energy Modeling System (NEMS) model documentation (EIA 2010a), which takes into account the age distribution of each building type.
Table 6. Commercial Building Demolition (percent of 2000 stock demolished per decade)
2010 2020 2030 2040 2050
Hospital stock 14.6% 13.9% 13.1% 11.4% 9.3%
Hotel stock 15.0% 13.5% 12.1% 10.2% 8.4%
Retail stock 17.1% 14.4% 12.4% 10.1% 8.1%
Education stock 13.0% 11.7% 10.8% 9.5% 8.1%
Office stock 12.0% 11.1% 10.5% 9.4% 8.1%
Reliable estimates of residential building demolition rates are difficult to find and often contradict each other. The methodology for residential buildings in the EIA NEMS model gives an annual survival rate of 99.6% for single-family homes and 99.9% for apartment buildings. Over a 50 year period this leaves 82% and 95% of these buildings standing. The 2012 ETP projects that around 60% of today’s residential households in OECD countries will be standing in 2050, which implies a much lower survival rate. For this study the annual demolition rates used are 1.0% for single-family homes in the U.S. and Europe and 1.2% in Japan.4 Demolition rates for apartment buildings are half of these values in each region.
4 The higher demolition rates for Japanese residential buildings are based on input from the ICCA stakeholder committee.

9 ICCA Building Technology Roadmap
Chapter 2: Use phase energy and GHG modeling The modeling approach for the Europe Japan and U.S. was based on simple physical characteristics, such as heat flow through materials and air infiltration, to determine heating and cooling requirements. As outlined in Chapter 1, the three geographic regions are split into seven sub-regions based on climate and country wealth. Each of the sub-regions is subsequently assigned an average number of heating degree days (HDD) and cooling degree days (CDD)5. For the U.S., two sub-regions are used: Cooler sub-regions are represented using climate data for Chicago, IL, and warmer sub-regions are represented using climate data for Dallas, TX. Europe is divided into four sub-regions, defined by warm/cold and more/less developed. Japan is modeled as a single geographic and climate region.
Seven building types – two residential and five commercial – are defined for each of the sub-regions. The representative structures for the residential category are a free-standing single family home and a mid-rise apartment building. The characteristics for the building types within the sectors vary by region. Rather than defining different sized commercial structures for each region, prototype buildings are taken from a U.S. Department of Energy (DOE) report and used throughout the world. Each of the 49 building scenarios (2 residential types and 5 commercial types evaluated for 2 U.S. climate zones, 4 European zones, and Japan) is defined by the following characteristics:
Conditioned area Number of floors Wall height Aspect ratio Roof slope Percent glazing Frame or masonry construction Wall/roof/window R-values6 Air changes per hour (ACH) Area of cool roof deployment
Using the HDD and CDD information for each sub-region it is possible to estimate the heat flow through the building envelope (roof, walls, and windows) and the heat lost through air infiltration in a building.
In addition to savings due to reductions in heat flow and air infiltration, energy savings are also realized through use of plastic pipe and pipe insulation to reduce heat loss during hot water distribution within buildings, and use of reflective cool roof materials. Cool roofs have a higher reflectance than traditional roofing materials, which helps them to maintain a lower temperature. This reduces the need for air conditioning during the summer, but can also lead to energy penalties during the winter. Savings associated with piping and cool roofs are estimated separately from other heat flow calculations in the model.
To determine a baseline of building energy use in 2000, the levels of insulation and airtightness of the existing stock of each building type for every sub-region is defined using a combination of government statistics and published literature. New buildings constructed during each decade between 2000 and 2050 are modeled based on increasingly strict energy standards, which vary by region. A number of sources are used to project the R-values of building envelope components in future years. U.S. residential building projections for new construction through 2010 are based on Energy Savings Measure Packages: Existing Homes (NREL 2011), and International Energy Conservation Code (IECC) compliance guides for window selection in Illinois and Texas in 2006/2009. Projections for R-values for U.S. residential buildings beyond 2010 come from IECC Table R402.1.1. The new construction U.S. commercial R-values through 2010 are from the National Renewable
5 Heating and cooling degree days are based on the difference between the daily mean temperature and 65 degrees F (19
degrees C). The greater the difference, the more heating or cooling is required. 6 The R-value is a measure of thermal resistance to heat flow, used in the building and construction industry.

ICCA Building Technology Roadmap 10
Energy Laboratory (NREL) commercial building report; values from 2010 through 2020 are from the 2012 IECC standards; and values from 2030 to 2050 are based on the relevant American Society of Heating Refrigerating and Air-Conditioning Engineers Inc (ASHRAE) Advanced Design Guides. For European residential and building stock, R-value projections through 2010 are from U-Values for Better Energy Performance of Buildings (Ecofys 2007). The 2011 BPIE report Europe’s Buildings Under the Microscope (BPIE) report Europe’s Buildings Under the Microscope is used for R-values for construction between 2010 and 2020. Both the 2007 Ecofys report and the Low Heat standard from Insulation for Sustainability (XCO2 2002) – a report sponsored by the Federation of European Rigid Polyurethane Foam Associations – are used for R-values of European construction from 2020 out to 2050. The cooler European climates reach higher levels of energy efficiency than do the warmer regions. Projections for the building envelope components in Japanese buildings were supplied by members from the ICCA Stakeholder Committee. The R-values used for the roofs, walls, and windows of the building stock in each region over time are shown in Table 7 through Table 9.
Table 7. Roof R-values 2000-2050
Roof R-value in (square meter °K)/Watt
U.S. Europe Japan
Chicago Dallas
Cold/ developed
Cold/ undeveloped
Warm/ developed
Warm/ undeveloped All
Single-family 2000 1.76 1.76 1.96 1.19 1.44 0.98 1.20
2010 6.69 6.69 5.00 3.33 2.17 1.43 1.60
2030 8.63 6.69 6.67 6.67 5.00 5.00 2.27
2050 8.63 6.69 6.67 6.67 5.00 5.00 2.27
Apartment 2000 2.63 1.94 1.96 1.19 1.44 0.98 1.20
2010 2.79 2.79 5.00 3.33 2.17 1.43 1.60
2030 4.40 3.52 6.67 6.67 5.00 5.00 5.50
2050 4.40 3.52 6.67 6.67 5.00 5.00 6.00
Education 2000 2.62 1.93 1.96 1.19 1.44 0.98 1.20
2010 2.79 2.79 5.00 3.33 2.17 1.43 1.60
2030 4.40 4.40 6.67 6.67 5.00 5.00 5.50
2050 4.40 4.40 6.67 6.67 5.00 5.00 6.00
Hospital 2000 2.65 1.96 1.96 1.19 1.44 0.98 1.20
2010 2.79 2.79 5.00 3.33 2.17 1.43 1.60
2030 5.28 4.40 6.67 6.67 5.00 5.00 5.50
2050 5.28 4.40 6.67 6.67 5.00 5.00 6.00
Hotel 2000 2.69 2.00 1.96 1.19 1.44 0.98 1.20
2010 2.79 2.79 5.00 3.33 2.17 1.43 1.60
2030 3.52 3.52 6.67 6.67 5.00 5.00 5.50
2050 3.52 3.52 6.67 6.67 5.00 5.00 6.00
Office 2000 2.75 2.05 1.96 1.19 1.44 0.98 1.20
2010 2.79 2.79 5.00 3.33 2.17 1.43 1.60
2030 5.28 4.40 6.67 6.67 5.00 5.00 5.50
2050 5.28 4.40 6.67 6.67 5.00 5.00 6.00
Retail 2000 2.64 1.95 1.96 1.19 1.44 0.98 1.20
2010 2.79 2.79 5.00 3.33 2.17 1.43 1.60
2030 3.52 3.52 6.67 6.67 5.00 5.00 5.50
2050 3.52 3.52 6.67 6.67 5.00 5.00 6.00

11 ICCA Building Technology Roadmap
Table 8. Wall R-values 2000-2050
Wall R-value in (square meter °K)/Watt
U.S. Europe Japan
Chicago Dallas
Cold/ developed
Cold/ undeveloped
Warm/ developed
Warm/ undeveloped All
Single family 2000 1.41 1.23 1.37 0.86 1.35 0.90 1.31
2010 2.29 2.29 3.33 2.50 2.00 1.43 1.70
2030 3.17 3.17 5.00 5.00 3.33 3.33 2.22
2050 3.17 3.17 5.00 5.00 3.33 3.33 2.22
Apartment 2000 1.29 0.84 1.37 0.86 1.35 0.90 1.31
2010 2.10 1.42 3.33 2.50 2.00 1.43 1.70
2030 3.61 3.61 5.00 5.00 3.33 3.33 3.30
2050 3.61 3.61 5.00 5.00 3.33 3.33 3.50
Education 2000 1.29 0.84 1.37 0.86 1.35 0.90 0.80
2010 2.10 1.42 3.33 2.50 2.00 1.43 2.20
2030 3.61 2.96 5.00 5.00 3.33 3.33 3.30
2050 3.61 2.96 5.00 5.00 3.33 3.33 3.50
Hospital 2000 1.26 0.67 1.37 0.86 1.35 0.90 0.80
2010 1.17 0.45 3.33 2.50 2.00 1.43 2.20
2030 2.34 2.01 5.00 5.00 3.33 3.33 3.30
2050 2.34 2.01 5.00 5.00 3.33 3.33 3.50
Hotel 2000 1.35 0.87 1.37 0.86 1.35 0.90 0.80
2010 2.10 1.42 3.33 2.50 2.00 1.43 2.20
2030 3.61 3.61 5.00 5.00 3.33 3.33 3.30
2050 3.61 3.61 5.00 5.00 3.33 3.33 3.50
Office 2000 1.40 0.89 1.37 0.86 1.35 0.90 0.80
2010 2.10 1.42 3.33 2.50 2.00 1.43 2.20
2030 5.04 3.61 5.00 5.00 3.33 3.33 3.30
2050 5.04 3.61 5.00 5.00 3.33 3.33 3.50
Retail 2000 1.30 0.85 1.37 0.86 1.35 0.90 0.80
2010 2.10 1.42 3.33 2.50 2.00 1.43 2.20
2030 3.61 3.61 5.00 5.00 3.33 3.33 3.30
2050 3.61 3.61 5.00 5.00 3.33 3.33 3.50

ICCA Building Technology Roadmap 12
Table 9. Window R-values 2000-2050
Window R-value in (square meter °K)/Watt
U.S. Europe Japan
Chicago Dallas
Cold/ developed
Cold/ undeveloped
Warm/ developed
Warm/ undeveloped All
Single family 2000 0.20 0.20 0.36 0.20 0.36 0.20 0.22
2010 0.50 0.35 0.50 0.59 0.40 0.34 0.26
2030 0.55 0.50 0.91 0.91 0.83 0.83 0.35
2050 0.55 0.50 0.91 0.91 0.83 0.83 0.35
Apartment 2000 0.29 0.14 0.36 0.20 0.36 0.20 0.22
2010 0.31 0.14 0.50 0.59 0.40 0.34 0.26
2030 0.39 0.29 0.91 0.91 0.83 0.83 0.52
2050 0.39 0.29 0.91 0.91 0.83 0.83 0.55
Education 2000 0.29 0.14 0.36 0.20 0.36 0.20 0.10
2010 0.31 0.14 0.50 0.59 0.40 0.34 0.21
2030 0.42 0.39 0.91 0.91 0.83 0.83 0.52
2050 0.42 0.39 0.91 0.91 0.83 0.83 0.55
Hospital 2000 0.29 0.14 0.36 0.20 0.36 0.20 0.10
2010 0.31 0.14 0.50 0.59 0.40 0.34 0.21
2030 0.61 0.41 0.91 0.91 0.83 0.83 0.52
2050 0.61 0.41 0.91 0.91 0.83 0.83 0.55
Hotel 2000 0.29 0.14 0.36 0.20 0.36 0.20 0.10
2010 0.31 0.14 0.50 0.59 0.40 0.34 0.21
2030 0.50 0.43 0.91 0.91 0.83 0.83 0.52
2050 0.50 0.43 0.91 0.91 0.83 0.83 0.55
Office 2000 0.29 0.14 0.36 0.20 0.36 0.20 0.10
2010 0.31 0.14 0.50 0.59 0.40 0.34 0.21
2030 0.50 0.43 0.91 0.91 0.83 0.83 0.52
2050 0.50 0.43 0.91 0.91 0.83 0.83 0.55
Retail 2000 0.29 0.14 0.36 0.20 0.36 0.20 0.10
2010 0.31 0.14 0.50 0.59 0.40 0.34 0.21
2030 0.46 0.43 0.91 0.91 0.83 0.83 0.52
2050 0.46 0.43 0.91 0.91 0.83 0.83 0.55
The model takes the 2000 stock for each building type and region and updates it every decade through 2050, removing the fraction of each building stock from 2000 that is demolished each year and adding the amount of new stock, which is built to progressively tighter standards over time. Some of the surviving 2000 stock is also renovated to tighter standards each decade as described in the Renovation section of the previous chapter.
Figure 5 shows the net effect on energy intensity in gigajoules (GJ, or 109 J) per square meter of floor space due to tightened standards for new construction and removal and upgrades of 2000 building stock over time. Note that the results in the figure are expressed on the basis of direct energy use at the building level, not a full life cycle basis, and the reductions in energy intensity include the composite effect of all improvements to the building envelope, not just those improvements attributed to chemically-derived products.

13 ICCA Building Technology Roadmap
Figure 5. Composite Energy Loss at the Building Level, Modest Renovation Rate Scenario
The highest energy intensity (energy use per square meter of floor space) in 2000 is for cool regions of Europe and the U.S. As new building standards are tightened over time, older less-efficient stock is removed, and existing stock is renovated, the energy intensity for buildings in these regions drops substantially and is largely brought in line with energy intensities for other regions by 2030. Under the modest renovation rate scenario, by 2050 energy intensity for all regions is 37 to 71% less than in 2000. The percent decrease is smallest for building stock in Japan, which had the lowest energy intensity to start with and therefore has the least room for improvement. Under the ambitious renovation rate scenario (not shown in the figure), energy intensity for all regions is reduced by 51 to 77% percent by 2050 compared to 2000 levels.
For each decade, the model tracks the stock of buildings, the amount of building envelope products (insulation, windows, house-wrap, etc.) used for new and renovated buildings, and the amount of heat lost or gained through conduction and air infiltration. These energy numbers are converted to amounts of purchased energy based on the efficiency and mix of heating and cooling equipment in each region. Finally, this purchased energy is converted to life cycle energy and GHG results.
Using a life cycle basis for energy calculations means that the results include not only the useful energy derived from combustion of fuels, but also the energy required to extract, process, and deliver those fuels. For electricity used for building heating, cooling, and water heating, the life cycle energy requirements include the additional energy input required for each delivered kilowatt hour (kWh) to make up for generating inefficiencies and transmission and distribution losses. Similarly, life cycle GHG emissions for fuels include process and fuel-related emissions for all processes beginning with extraction of fuel resources from the natural environment and continuing through combustion of fuels to provide the energy directly used at the building level.
The building envelope is a single part of a larger system affecting the life cycle energy and GHG emissions from heating and cooling buildings. The efficiency of heating, cooling, and ventilation systems plays a large role in determining the actual amount of energy used to condition the space within the building envelope. Some buildings, such as hospitals, have special requirements that increase the amount of energy used beyond what is required for simply maintaining a constant internal temperature. As the mix of fuels used – both for direct heating and for producing electricity – changes over time, the life cycle energy and GHG emissions also change. In order to isolate the effect of the building envelope products, the efficiencies, fuel mixes, and life cycle factors are held constant in the model for all years. In reality, shifts to lower carbon fuels are already taking place, which reduce the amount of GHG releases associated with building energy use. The combined effect of more energy-efficient building envelopes and lower carbon fuels is examined in a separate section of the results chapter.
IEA fuel mixes for electricity generation, space heating, and water heating for 2009 are shown in the figures below for Europe, Japan, OECD, and the U.S., as well as for three countries identified by IEA as high-growth regions: Brazil, China, and India. In 2009, all residential space cooling energy was provided by electricity.
0
0.1
0.2
0.3
0.4
0.5
0.6
0.7
0.8
0.9
2000 2010 2020 2030 2040 2050
GJ
pe
r m
2
US, cool
US, warm
Europe, cool developed
Europe, cool undeveloped
Europe, warm developed
Europe, warm undeveloped
Japan

ICCA Building Technology Roadmap 14
Electricity was also the predominant energy source used for commercial cooling in all regions except Japan, where IEA reported almost 70% of commercial cooling energy was from natural gas.
Figure 6. Fuel Mix for Electricity Generation, 2009
Figure 7. Fuel Mix for Residential Heating, 2009
0%
10%
20%
30%
40%
50%
60%
70%
80%
90%
100%
0ECDEurope
US Japan China India Brazil
Wind onshore
Solar PV
Hydropower
Nuclear
Biomass and waste
Oil
Natural gas
Coal
0%
10%
20%
30%
40%
50%
60%
70%
80%
90%
100%
OECDEurope
US Japan China India Brazil
Solar
Coal
Heat
Biomass
Natural gas
Oil
Electricity

15 ICCA Building Technology Roadmap
Figure 8. Fuel Mix for Commercial Heating, 2009
Figure 9. Fuel Mix for Residential Water Heating, 2009
0%
10%
20%
30%
40%
50%
60%
70%
80%
90%
100%
OECDEurope
US Japan China India Brazil
Other
Solar
Biomass
Heat
Electricity
Natural Gas
Oil
Coal
0%
10%
20%
30%
40%
50%
60%
70%
80%
90%
100%
OECDEurope
US Japan China India Brazil
Solar
Coal
Heat
Biomass
Natural gas
Oil
Electricity

ICCA Building Technology Roadmap 16
Figure 10. Fuel Mix for Commercial Water Heating, 2009
The figures below show the total energy and GHG impacts for an average direct megajoule (MJ) of heating, cooling, and water heating energy used at the building level. These factors are shown on a life cycle basis; that is, they take into account the regional mixes of fuels and technologies used for heating, cooling, and water heating; the efficiencies of the equipment used; and the life cycle impacts for extraction, processing, delivery, and combustion of fuels.
Figure 11. Life Cycle Energy Consumption (total MJ of energy required per MJ of direct energy)
0%
10%
20%
30%
40%
50%
60%
70%
80%
90%
100%
OECDEurope
US Japan China India Brazil
Solar
Biomass
Heat
Electricity
Natural Gas
Oil
Coal
0.0
1.0
2.0
3.0
4.0
5.0
6.0
7.0
MJ/
MJ
US
OECD Europe
Japan
China
India
Brazil

17 ICCA Building Technology Roadmap
Figure 12. Life Cycle GHG Emissions (total kilogram (kg) of CO2e per MJ of direct energy)
0.00
0.05
0.10
0.15
0.20
0.25
kg C
O2
e/M
J
US
OECD Europe
Japan
China
India
Brazil

ICCA Building Technology Roadmap 18
Chapter 3: Chemically derived building products
Overview
The use of chemically-derived products to improve the energy efficiency of building envelopes results in substantial savings in energy use and GHG emissions during a building’s use phase. These savings are offset, to some extent, by the energy and GHG impacts associated with production of the chemically-derived products. The following sections describe the process used to quantify the amounts of chemically derived building products used in new and retrofit construction from 2000 to 2050 and the associated “cradle-to-production” energy and GHG impacts. It covers all steps, beginning with initial extraction of raw materials from the natural environment through production of the building product as installed in residential and commercial building stock. Cradle-to-product energy results also include the energy content of petrochemical feedstocks used as raw materials. The product GHG requirements include the process and fuel-related GHG emissions for all steps from raw material extraction through production of the finished product.
A full life cycle assessment of building products would also include end-of-life management. However, life cycle studies on building products show that end-of-life management impacts for products like insulation, piping, and windows are small relative to production impacts, which in turn are small in comparison to use phase impacts during the life cycle of the building in which they are used. For example, GHG emissions from landfill disposal of piping and insulation are less than 1% of the total impacts for their production.7 The dashed lines in the figure below illustrate the life cycle stages included in this analysis.
Figure 13. Product Life Cycle Stages
The quantitative modeling in this analysis includes only current technologies that are in wide use. Although there are emerging building product technologies that have significant potential for additional energy and GHG savings, insufficient information was available about production impacts and use benefits to include them in the modeling.
The product modeling was done in SimaPro LCA software using region-specific fuel grid mixes for the electricity used throughout the sequence of production steps. The use of regional electricity modeling results in different energy and GHG factors for building products produced in each region. Regional fuel mixes for electricity generation were shown earlier in Figure 6.
Because the building use phase energy and GHG results are calculated in the use phase model on an annual basis, the production impacts for each building product are normalized to an annualized basis. This is done by dividing the total production impacts by the product lifetime, enabling a comparison of the energy savings
7 National Institute of Standards and Technology BEES model (Building for Environmental and Economic Sustainability)
Product Useor
Consumption
Energy
Raw Materials Acquisition
Materials Manufacture
End of Life: Landfill,
Incineration, Recycling, Reuse
Wastes Wastes Wastes Wastes
Product Manufacture
EnergyEnergyEnergyEnergy
Wastes
Cradle-to-Product Use Phase
Full Life Cycle (cradle-to-grave)
End of Life

19 ICCA Building Technology Roadmap
and production impacts for chemically derived products on a per-year basis. The annualized approach also facilitates scaling over time. For example, the production impacts for a product with a 10-year life are annualized by dividing the total production impacts by 10 to get the production impacts per year of the product’s life. To project savings for use of that product over a 50 year time period, the annualized production burdens (initial production burdens/10 years) would be multiplied by 50, so the total production burdens for 50 years would be 5 times the original production burdens, as the product would be replaced every 10 years during the 50 year period.
To calculate the production impacts for chemically-derived products in each use category, a step-wise approach is employed:
1. Determine the total amount of product implemented in new and retrofit construction (both
chemically-derived and non-chemical products).
2. Determine the share of implemented product that is chemically-derived.
3. Determine the mix of products within the chemically-derived share.
4. Compile weighted average production energy and GHG factors for the chemically-derived products,
based on the mix of chemically-derived materials used.
Details for each category of building product are presented in the following sections, including a description of the approach used to calculate energy savings associated with use of each type of product.A summary table of cradle-to-production energy and GHG factors for building products is presented at the end of this section.
Insulation
Overview
In an uninsulated home, at least half of the heat is lost through the building envelope (walls, roof, and windows). Therefore, insulating the building envelope is one of the most effective ways to save energy and thereby reduce CO2 emissions.
The chemically-derived building envelope insulation products evaluated in this analysis include the following plastic-based products:
Polystyrene foam (expanded or extruded) Polyurethane foam (rigid, flexible or spray foam) Polyisocyanurate foam
Expanded polystyrene (EPS) foam is a closed-cell insulation material that is manufactured by using steam to expand a polystyrene plastic resin bead that has been impregnated with blowing agent, typically pentane. Closed cell foam insulation is denser than open cell types and is characterized by a small, compact cell structure. These materials provide a very good air and water vapor barrier.
Extruded polystyrene (XPS) foam is a rigid, water resistant material that is also made up of small closed cells. As with EPS, it is made from polystyrene, but, rather than incorporating the blowing agent in the plastic resin beads, the blowing agent is added to the material as it is extruded.
The PU group of insulation materials, which include polyurethane (PUR) and polyisocyanurate (PIR), also have closed cell structure, as well as a high cross-linking density. This gives them good heat stability, high compressive strength and very low thermal conductivity, which makes them excellent insulation materials.
Modeling
Detailed quantified production data on plastic foam insulation were not available for the specific categories of residential and commercial wall and roof insulation applications required for the analysis. Therefore, a bottom-up approach was employed to calculate the amount of wall and roof insulation for residential and commercial buildings in each region. First, the total square meters of wall area and R value of insulation (both chemically-derived and non-chemically derived) was calculated for building stock for each decade based on building stock quantities, dimensions, and tightening R values of building walls and roofs over time. The R values of roof and walls by region over time are shown in Table 7 and Table 8 in Chapter 2. The area of insulation and required R value of insulation were then converted to cubic meters of insulation using the R value per inch for the mix of insulation types used. For Europe and the U.S., market data from Freedonia on

ICCA Building Technology Roadmap 20
relative shares of plastic foam insulation and non-chemically derived insulation (primarily fiberglass and mineral wool insulation) were then used to determine the share of insulation-related savings allocated to plastic foam insulation. For Japan, data on the amounts of insulation types used in residential and commercial construction are published by the Institute for Building Environment and Energy Conservation (IBEC). Within the plastic foam insulation category, information from a previous ICCA report was used to characterize the mix of plastic insulation types for Europe and U.S. (McKinsey 2009). Separate information was not available for residential and commercial sectors in Europe and the U.S., so the same mix of plastic foam insulation types is used for both sectors. For Japan, separate information was available from IBEC on the mix of plastic foam insulation types within the residential and commercial sectors.
Table 10. Mix of Foam Types within Plastic Foam Insulation by Region
Europe – all U.S. – all Japan – residential
Japan – commercial
Japan – residential
Japan – commercial
All years All years 2000 2000 2010 on 2010 on
EPS 48% 22% 13% 9% 12% 12%
XPS 13% 18% 38% 58% 44% 58%
PUR 40% 60% 49% 33% 44% 30%
As insulation requirements are tightened over time, the market share of plastic insulation relative to other types of insulation is expected to grow. Plastic foam insulation has higher R-value per unit of thickness compared to other materials and can provide higher R-values at less bulk. This is advantageous in colder climates, where high R values are needed, or in retrofits, where there may be constraints on the space available for adding insulation. In addition, plastic foam insulation is used in the growing markets for EIFS (exterior insulation and finish systems) and SIP (structural insulated panel) wall assemblies. Market share growth projections from Freedonia for plastic foam insulation based on short-term market trends are shown in the table below. In some European countries, plastic foam insulation is already used at rates similar to or higher than the 2050 projected market shares for Europe as a whole. Therefore, it is likely that plastic foam implementation rates over time may be higher than projected. In that case, a higher share of the total insulation-related energy and GHG savings during building use would be attributed to chemically derived insulation.
Table 11. Plastic Insulation Market Share by Decade in New and Retrofit Insulation
2000 2010 2020 2030 2040 2050
Europe 34% 37% 38% 39% 40% 41%
U.S. 32% 35% 36% 37% 38% 39%
Japan residential 26% 28% 30% 32% 33% 34%
Japan commercial 51% 57% 60% 61% 62% 63%
For each decade, the plastic foam insulation installed in new and retrofit construction in that year is projected to remain in use for 50 years. The energy and GHG savings due to use of the insulation for 50 years are adjusted to subtract the energy and GHG impacts for production of the insulation. If the insulation remains in use longer than 50 years, then the use phase savings will continue to accrue without additional production impacts.
It is worth noting that chemically-derived products are key components of virtually all insulation products. Chemical binders are used in fiberglass and mineral wool insulation, and chemical flame retardants are used

21 ICCA Building Technology Roadmap
in cellulose insulation. However, because of the difficulties in allocating a specific share of insulation benefits to additives such as binders and flame retardants, this analysis does not attempt to determine what share of fiberglass, mineral wool, or cellulose insulation savings could be allocated to the chemically derived content of these insulation products.
Pipe and pipe insulation
Overview
Plastic pipe has lower thermal conductivity than metal pipes. The insulating benefits of plastic pipe and pipe insulation result in energy and GHG savings by preventing heat loss from water in hot water pipes, reducing the amount of wasted water heating energy.
Modeling
As with insulation, sufficiently detailed statistics on hot water pipe and pipe insulation were not available. Bottom-up estimates for different categories of residential and commercial stock were made using representative piping layouts normalized to the basis of meters of pipe per square meter of floor space and multiplied by the total square meters of floor space of corresponding new building stock in the use phase model.
Residential layouts were based on a peer-reviewed life cycle study on residential piping (PPFA 2011), while commercial building layouts were provided by Building Insights. The PPFA study, which evaluated two hot water use patterns for three different residential pipe layouts using plastic and copper pipe, indicated that up to 30% of the total energy used for residential water heating can be wasted due to cooling of hot water in the pipes between uses. On average across the scenarios and use patterns, the wasted heat for use of plastic pipe was 20% lower than the wasted heat for use of copper pipe. A 20% reduction in 30% of total water heating energy use equates to a 6% reduction in total water heating energy when using plastic pipe instead of metal pipe. This energy savings was applied to the share of new construction in all regions using plastic hot water pipe.
Current market shares of plastic water pipe were obtained from Freedonia market studies reporting total use of plastic pipe for potable water including mains and piping within buildings and articles about plastic pipe use for water piping within buildings. Because plastic pipe has numerous benefits over metal pipe including light weight, lower costs, less job site theft, easy installation, and good insulating performance, the market share of plastic hot water pipe in new residential and commercial construction is projected to increase rapidly over the next few decades, as shown in the table below. Market share growth for plastic pipe in commercial buildings in the U.S. is projected to be somewhat slower than in other regions, as commercial building codes in some U.S. cities and regions must be adapted to include use of plastic pipe., However, U.S. commercial stock use of plastic pipe is assumed to eventually reach similarly high levels as projected for other regions. The plastic share of water piping and the mix of polyvinyl chloride (PVC) and polyethylene pipe were also derived from Freedonia market reports.
Table 12. Plastic Hot Water Pipe Market Share Projections by Decade in New Construction
2000 2010 2020 2030 2040 2050
Europe 41% 56% 66% 71% 76% 81%
U.S. residential 39% 54% 64% 69% 74% 79%
U.S. commercial 39% 47% 54% 64% 74% 79%
Japan 67% 77% 85% 87% 89% 91%
Building standards also call for use of insulation on hot water pipe (e.g., 2012 IECC). Quantities of insulation required for the hot water pipe within the buildings were calculated using the same type of bottom-up approach. A paper on testing and validation of a hot water piping simulation model developed by the Davis Energy Group indicated that addition of pipe insulation reduced average daily waste of hot water from 10.2 to

ICCA Building Technology Roadmap 22
8.1 gallons, a 21% reduction in wasted water heating (HWSIM). Plastic pipe insulation is usually made from polyurethane foam, polyethylene foam, or polystyrene foam. No data were available on manufacture of polyethylene foam, so pipe insulation was modeled as a mix of polystyrene and polyurethane foams.
To quantify the magnitude of hot water savings related to use of plastic pipe and pipe insulation, water heating data from IEA ETP 2012 was used (IEA 2012b). Water heating energy per residential household and per square meter commercial floor space was used for the baseline water heating use by region for existing stock. For new stock built with plastic pipe and pipe insulation in subsequent decades, the water heating energy was reduced by 6% to account for the reduction in heating loss through plastic pipe walls and pipe insulated with foam insulation. It is assumed that the installed pipe would last the life of the building.
No estimates are made for savings due to replacing non-plastic pipe in existing buildings with plastic pipe. Because pipe replacement would typically require tearing up existing walls, floors, and ceilings to access the pipe, it is expected that the pipe replacement is very small compared to pipe use in new construction. Although some hot water pipe in existing buildings is exposed and could be retrofitted with insulation, the majority of hot water pipe in existing buildings is likely to be inside finished walls, under foundations, or in other inaccessible areas of building attics and basements. Since only a small portion of hot water pipe in existing buildings is accessible for potentially adding insulation, retrofit application of pipe insulation to incremental sections of existing installed pipe was assumed to make a much smaller contribution to hot water energy and GHG savings compared to plastic pipe and pipe insulation in new construction, and therefore is not modeled.
Air sealing
Overview
In addition to conductive heat loss through the building envelope, a significant amount of heat loss in buildings is due to air infiltration. Ambient air can enter the building and conditioned air can escape through air gaps around doors and windows and at other junctures between walls, roofs, and floor structures. The resulting air changes increase the demand on heating and cooling systems to maintain the desired temperature within the building.
Air tightness is achieved through a combination of good workmanship and use of materials such as caulks, sealants, weather stripping, and air barriers. The large majority of materials used for air barriers and air sealing are chemically-derived. As with other products in this analysis, a bottom-up approach is used to estimate the amount of air barrier and air sealing materials used in new and retrofit construction.
Modeling
Air barrier film, or “house wrap,” is widely used on frame construction buildings to reduce air infiltration. The material is predominantly nonwoven polyethylene and polypropylene. Air barriers used in masonry construction include fluid-applied coatings and spray foams. The amounts of these materials were estimated based on the building stock models. For masonry using spray foam air barrier, the foam serves the dual purposes of insulation and air barrier. Since impacts for foam insulation are already included in the insulation category, spray foam air barrier production impacts are not included in the air sealing category, to avoid double counting. Air barrier materials require small additional material use but achieve high energy savings paybacks. Implementation rates for air barriers in frame and masonry residential and commercial buildings are expected to reach essentially 100% by 2020. Air barriers applied under the exterior finish of the building are assumed to last the lifetime of the building (50 years). Since installation of air barriers as a retrofit would involve removal of the exterior finish of the building, no retrofit application of air barriers was included.
The building stock models are used to calculate the building surface area and linear meters of junctures requiring sealing (caulks and foam sealants around windows and floors, weatherstripping around doors, air barrier flashing membranes around roof perimeters). Amounts of caulk, sealants, and weatherstripping are estimated based on the amount of material required per square meter of surface area covered or per meter of juncture sealed. The main material types modeled for each type of product and mass of material required per unit of surface area or per meter of sealing are based on market report data, government energy efficiency websites, surveys of a variety of manufacturer websites and installation guides, and ICCA stakeholder input (Freedonia, EERE 2001). Exterior caulks and sealants include silicone and synthetic rubber products and expandable foam. Weather stripping is modeled primarily as vinyl and synthetic rubber products. Roof

23 ICCA Building Technology Roadmap
flashing membranes are modeled as thermoplastic olefin (TPO), PVC, and synthetic rubber. Since most materials used in air sealing applications have similar energy and GHG impacts per kg, composite production impacts for air sealing product categories are not particularly sensitive to assumptions about the relative mix of materials used within the category.
Sealing materials covered by exterior building finishes (e.g., foundation caulking) are assumed to remain in place the life of the building, while a 10-year life is assumed for exposed caulking and weatherstripping around doors and windows. Roof flashing membranes are assumed to be replaced when the building roof is replaced.
Use phase savings for air sealing products were calculated based on the air volume in the building (based on the building stock models), reductions in air changes per hour over time due to greater use of air sealing products and improved construction practices, and the amount of energy required to heat and cool the volume of air lost through the air changes.
Reflective roof coatings and pigments
Overview
The primary function of a roof is to provide a weather barrier. Cool roof coatings and pigments increase the reflectivity of roofing materials, reducing the amount of heat absorbed by the roof and the associated cooling requirements for the building. In cold seasons, however, cool roofs prevent absorption of heat that would be beneficial in helping to heat the building, resulting in a heating penalty. The cool roof savings calculations in this analysis take into account both the heating penalty and the cooling benefit, by climate region and building type. By keeping the roof temperature lower, cool roofs can also extend the life of the roofing materials and underlying insulation. The cool roof savings in this analysis are limited to use phase energy and GHG savings; no attempt was made to quantify potential benefits of cool roof in extending the life of other roof components.
The effect of cool roofing materials also depends strongly on the insulation of the roof itself. Very low levels of energy consumption as in passive houses can only be achieved with greater insulation. The largest benefits of cool roofing are in reducing energy consumption for houses with lower levels of insulation. As insulation levels increase, the relative energy savings benefits of cool roofing are reduced.
Modeling
Very little quantified information was available on production amounts and implementation of cool roofs, so a bottom-up approach is used for cool roof projections. The area of cool roofing for each region is estimated based on the building stock model described previously. The shares of different types of roofing material used in each region were obtained from a Freedonia market report on world roofing.
Depending on the type of roof, cool roof pigments can be incorporated in the roofing material itself or applied as a coating. Chemically-derived production impacts for cool roofs are calculated based on the pigment and pigment carrier materials used for cool roofing. All pigments are assumed to be chemically-derived and are modeled using life cycle data for titanium dioxide, a widely used cool roofing pigment, as a representative pigment. The energy and GHG impacts for cool roofing include the impact of production of the chemically derived carriers for cool roofing pigment applied as a coating and impacts of production of ethylene propylene diene monomer (EPDM) rubber, TPO, and PVC roofing membranes incorporating cool pigment. Since different types of roofing have different lifespan, the production impacts for each type of cool roofing are divided by its lifetime to normalize to a lifetime-adjusted basis. Weighted average per-year production impacts are calculated for the mix of cool roofing types used for flat and sloped roofing applications. The production impacts and savings for cool roofing are scaled for a 50-year building life, taking into account the replacement rates for roofing types that have a lifespan less than 50 years.
For flat roofing, typically found on commercial buildings, the cost of installing a new cool roof or replacing an existing roof with a cool roof can be recouped quickly by reduced cooling bills, particularly in warm regions. Residential homeowners may be less willing to replace or install cool roofing on sloped roofs due to aesthetics or costs, particularly if they do not plan to remain in the building long enough for reduced energy bills to offset the investment in cool roofing. When first introduced, cool roof materials were available primarily in shades of white and gray but are now available in a broader range of colors, which will help

ICCA Building Technology Roadmap 24
overcome resistance to installation on aesthetic grounds, particularly in residential applications. Cool roof implementation projections by climate region and building sector are summarized in the table below.
Table 13. Cool Roof Implementation as Percent of New and Replacement Roof, by Decade
Residential 2000 2010 2020 2030 2040 2050
U.S. & Europe warm 0% 0% 10% 20% 30% 40%
U.S. & Europe cool, Japan 0% 0% 2% 4% 6% 8%
Commercial
U.S. & Europe warm 0% 5% 20% 40% 60% 80%
U.S. & Europe cool, Japan 0% 2% 4% 6% 8% 10%
Cooling benefits and heating penalties for residential (sloped) and commercial (low-slope) cool roofs in warm and cool regions are summarized in the following table (Levinson 2010). The table shows that the cold weather heating penalty for cool roofs is much smaller than the warm weather cooling benefit in warm climates. To calculate use phase impacts for cool roofing, the square meters of new and replacement residential and commercial roofing area in each region were multiplied by the cool roofing implementation factors in Table 13 and the energy factors in Table 14.
As stated earlier, the benefits of cool roofing are greatest when used on buildings with low roof insulation levels. The source of the cool roof effects shown in Table 14 did not describe the roof insulation level at which these effects were observed; therefore, there is insufficient information to predict how much cool roof savings will be reduced as roof insulation levels increase over time. For future scenarios with both cool roofing and high levels of roof insulation, it is possible that there may be some double-counting of energy savings. However, as Chapter 4 will demonstrate, projected energy savings due to use of cool roofing in Europe, Japan, and the U.S. is much smaller than savings due to use of insulation, so the effects of any double-counting of roof improvements are minimal.
Table 14. Energy Savings and Penalties for Cool Roofing
Warm commercial
Cool commercial
Warm residential
Cool residential
Energy savings (MJ/m2) 17.7 15.2 10.0 8.5
Heating penalty (MJ/m2) 2.7 10.5 1.1 4.4
Windows
Overview
There are many components that contribute to the energy efficiency of windows. Energy efficient windows can be constructed with various combinations of frame material, multiple glazing, low-emissivity coatings, gas fill between panes, films between panes, and warm edge spacers that prevent thermal bridging. Since the R-value of the window is a result of the mix of features used in the assembly, it is not possible to definitively attribute a specific portion of the energy savings to specific components of the window.
The use phase model calculates the total savings due to use of energy-efficient windows in residential and commercial buildings in each region. Energy and GHG impacts associated with production of chemically-derived frame and spacer materials are also calculated for each region based on estimated production; however, no attempt is made to attribute a specific percentage of the use-phase savings from windows to the chemically-derived content of the window frames and spacers.

25 ICCA Building Technology Roadmap
Modeling
Current shares of plastic-frame windows are derived from a Freedonia market report on plastic doors and windows. Growth projections for residential plastic windows are based on data from a 2010 Industry Statistical Review and Forecast report prepared by Ducker Worldwide for the American Architectural Manufacturers Association and the Window & Door Manufacturers Association. The article included separate statistics for plastic in new and replacement windows. It is assumed that growth rates for Europe would be similar to U.S. Japanese residential markets have traditionally used aluminum windows, but strong growth in plastic windows is projected based on new government requirements for increased energy efficiency of windows by 2020. Market share projections are summarized below. The production impacts for plastic window frames and warm edge spacer materials are allocated over an estimated 30 year window lifespan (NREL 2012).
Use phase energy savings for windows were calculated in the same manner as savings for insulation. First, the total square meters of window area was calculated for building stock for each decade based on building stock quantities, wall area, and the percent of wall area that is glazed. The R values of windows by region over time are shown in Table 9 in Chapter 2. The total energy and GHG savings due to increased window R values over time were then calculated based on reduced heat losses through the glazing area, and the market share of plastic-framed windows in each region was used to determine the share of savings attributed to energy efficient plastic- framed windows. As noted above, the R-value of the window is a result of the combined features of the window assembly (frame, spacers, glazing, coatings, gas fill) which includes non-chemical components, so no attempt was made to attribute energy savings specifically to the chemically derived content of these windows.
Existing windows can also be retrofitted by application of reflective surface films. Adding film is a lower cost option than window replacement, but there is less energy savings. The benefit of films is limited to reducing solar gain; they do not add significant R-value. Temperature imbalances between inner and outer panes of multi-glazed windows due to addition of reflective surface films can lead to thermal stresses and cracking; therefore, retrofit reflective window films are primarily beneficial when added to single-pane windows in areas where sunlight makes a significant contribution to the building cooling load. Information on implementation levels for retrofit reflective window film could not be found. This analysis focuses on window replacement as the retrofit option with better savings and does not include estimates of deployment of retrofit film production impacts or use phase savings.
Table 15. Residential and Commercial Windows Market Share
2000 2010 2020 2030 2040 2050
Residential Windows
Europe - New 40% 54% 67% 67% 67% 67%
Europe - Replacement 58% 68% 78% 78% 78% 78%
U.S. - New 43% 56% 70% 70% 70% 70%
U.S. - Replacement 58% 68% 78% 78% 78% 78%
Japan - New 10% 30% 50% 55% 60% 65%
Japan - Replacement 10% 30% 50% 55% 60% 65%
Commercial Windows (new and replacement)
Europe 5% 7% 9% 11% 13% 15%

ICCA Building Technology Roadmap 26
U.S. 5% 7% 9% 11% 13% 15%
Japan 2% 4% 6% 8% 10% 12%
Production impacts
Composite production energy and GHG factors for chemically-derived products by region and building sector are presented in Table 16 on the following page. The factors show the cradle-to-production impacts for the mix of chemically derived products in each category, expressed in terms of the units used to calculate product amounts required based on the physical characteristics of the building stock. For example, kg of insulation were calculated based on the roof and wall area of new and renovated building stock and the R value and density of the insulation types used. Meters of pipe were calculated based on the total square meters of floor space and the average meters of hot water pipe per square meter of building floor space. Quantities of caulks and sealants are shown on the basis of linear meters of door, window, roof, and foundation perimeters sealed.8
Summary of key points
Chemically-derived products represent a large and growing share of products used to improve the energy efficiency of building envelopes and hot water piping systems within buildings. In product categories like air barriers, caulks, and sealants, most if not all products are chemically-derived. Cool roofing materials owe their energy efficient properties to chemically-derived content of pigments and coatings.
In categories such as insulation, plastic pipe, and window frames, where both chemically-derived products and non-chemical products are available, the desirable properties of chemically-derived products result in significant and growing market shares relative to alternatives. Chemically-derived products may also have cost advantages over alternative products, e.g., lower prices for plastic pipe compared to copper pipe.
For most chemically-derived products considered in this analysis, use phase benefits can be directly attributed to the product’s chemical content. Chemical content also makes important contributions to energy-efficient windows, with chemical content in the frame materials, warm edge spacers, films, and other components. However, because the overall efficiency of a window also depends upon non-chemical components such as glazing, metallized coatings, and gas fill between panes. Therefore, this analysis does not attempt to assign a specific percentage of window energy savings to their chemically derived content.
8 This table is provided for the purpose of documenting the life cycle energy and GHG impacts per unit of building product on an
annualized basis. The table is not intended to illustrate or support any particular conclusions.

27 ICCA Building Technology Roadmap
Table 16. Cradle-to-Production Impacts for Chemically-Derived Construction Products (normalized to per-year basis over product lifetime)
Frame Masonry
Foundation
Caulk
Window
Caulk
Weather-
stripping
Flashing
Membrane
Plastic
Frame
Surface
Film
Warm
Edge
Spacer
Product reporting basis: per kg per m per kg
per m2
wall area
per m2
wall area per m sealed per m per m per m
per m2
roof area
per m2
window
area
per m2
window
area
per m
window
perimeter
Product lifetime (yrs): 50 50 20 50 50 50 10 10 20 mixed* 30 15 30
Production Energy (MJ)
Residential Products
US 1.74 0.38 4.89 0.20 0.28 0.044 0.22 1.30 1.72 0.13 17.1 0.95 0.010
Europe 2.01 0.40 5.25 0.22 0.30 0.048 0.24 1.43 1.89 0.39 18.7 1.07 0.011
Japan 1.96 0.39 4.98 0.20 0.28 0.045 0.23 1.33 1.76 0.36 17.5 0.98 0.010
Commercial Products
US 1.74 0.38 4.89 0.20 0.28 0.044 0.22 1.30 1.72 3.14 17.1 0.95 0.010
Europe 2.01 0.40 5.25 0.22 0.30 0.048 0.24 1.43 1.89 2.58 18.7 1.07 0.011
Japan 2.11 0.39 0.39 0.20 0.28 0.045 0.23 1.33 1.76 2.67 17.5 0.98 0.010
Production GHG (kg CO2 eq)
Residential Products
US 0.07 0.012 0.17 0.0073 0.0058 0.0020 0.0100 0.058 0.067 0.008 0.74 0.042 0.00045
Europe 0.07 0.011 0.17 0.0072 0.0057 0.0020 0.0099 0.057 0.066 0.021 0.74 0.042 0.00045
Japan 0.08 0.012 0.16 0.0065 0.0052 0.0019 0.0093 0.053 0.061 0.020 0.69 0.038 0.00042
Commercial Products
US 0.07 0.012 0.17 0.0073 0.0058 0.0020 0.0100 0.058 0.067 0.12 0.74 0.042 0.00045
Europe 0.07 0.011 0.17 0.0072 0.0057 0.0020 0.0099 0.057 0.066 0.10 0.74 0.042 0.00045
Japan 0.08 0.012 0.01 0.0065 0.0052 0.0019 0.0093 0.053 0.061 0.10 0.69 0.038 0.00042
* Cool roof impacts within the residential and commercial categories are based on a mix of roofing types with different lifetimes.
Composite results shown in table reflect the relative shares for each type of roof normalized by its lifetime.
Impacts for residential roofs are based on cool roof pigment amount per m2 of sloped roofing (bituminous and fiber cement shingles, clay and concrete tiles).
Impacts for commercial roofing are higher, as they include pigment and chemically derived pigment carrier materials such as acrylic coatings on metal roofs and cool roof membrane.material
Air SealingWall Air Barrier
Wall and
Roof
Insulation
Plastic
Pipe
Pipe
Insulation
Window Components
Cool
Roof

ICCA Building Technology Roadmap 28
Chapter 4: Life cycle energy and GHG savings potential for deployment of chemically-derived building products Based on the projected implementation levels of chemically-derived products over time in residential and commercial construction, and the associated improvements in the energy efficiency of the building envelope and hot water piping within the building, the potential associated energy and GHG savings can be estimated out to 2050 for each of the developed regions in this analysis. The following sections present savings projections broken out in several ways: by region, by building sector (residential, commercial), by end use in the building (heating, cooling, water heating), and by product category (wall and roof insulation, cool roof, air sealing products, hot water piping and pipe insulation, and windows). Details of the calculation approach for individual product categories are provided in Chapter 3.
Results presented in this chapter are based on the total amount of direct energy required for heating, cooling and water heating at the building level, adjusted to take into account the efficiencies of heating and cooling equipment and water heaters. The reported results also include the energy and GHG emissions required to extract, process, and deliver the fuels and energy used by the equipment. An example GHG savings calculation is presented in the box below.
To illustrate how the GHG savings are calculated, imagine a section of wall that is 3 meters by 3 meters, or 9 square meters. The amount of heat loss through this wall depends on the temperatures inside and outside, and on the R value of the wall assembly. If the starting R-value of the wall is 1.5 m2°K/watt, and the building is in a region with 1000 heating degree days (HDD) per year, then the conductive heat loss through the 9 m2 of wall will be 518 MJ per year.
The heat lost through the section of wall is replaced within the building by heat from a furnace. If a gas furnace with an efficiency of 80% is used, then 518/0.8 = 648 MJ of natural gas are needed to compensate for the heat lost. The life cycle GHG emissions from extraction, processing, and combustion of natural gas are 0.07 kg CO2e per MJ of natural gas, so the amount of CO2e for the amount of gas used in the furnace is 648 x 0.07 = 45.4 kg CO2e.
If the building is renovated and R-2 foam insulation is added to the wall, the R-value of the wall is increased to R-3.5, and the amount of heat loss through the wall will be reduced. Using the same calculations as above for a wall with R-3.5, the heat loss through the wall would be 222 MJ, natural gas consumption 278 MJ, and GHG emissions 19.5 kg CO2 eq. Therefore, the GHG savings for adding R-2 foam insulation are 45.4-19.5 = 25.9 kg CO2e per year for the 9 m2 area. This equates to 25.9 / 9 m2 = 2.9 kg CO2e savings per m2 of wall area per year.
A typical single family home in the United States has approximately 180 square meters of wall area, so the annual savings from the added foam insulation would equate to 2.9 kg CO2e/m2 x 180 m2 = 518 kg CO2 eq. Approximately 52 million homes in the U.S. are located in areas with 1000 HDD/year, which means that the potential GHG savings for reduced heat loss through walls for those homes would be on the order of 27 million tonnes CO2e per year. A similar process would be followed to calculate savings for air conditioning, based on cooling degree days, MJ of electricity to operate the air conditioning unit, and kg CO2e per MJ of electricity.
Throughout this chapter, energy results are expressed in terms of million tonnes of oil equivalent (Mtoe). One Mtoe is equivalent to 41.868 x 10¹⁵ Joules of energy. GHG emissions are expressed on the basis of million tonnes of carbon dioxide equivalents (MtCO2e).
Savings potential in residential and commercial sectors due to improved building envelope efficiency
To illustrate the potential impacts in Europe, Japan, and the U.S. for energy efficient building envelopes, the figures below show life cycle energy use into the future with growth in building stock, but no change in R-values or infiltration rates (i.e., the energy and GHG intensity per square meter of building floor space remains constant). When assumptions about fuel mix and carbon intensity of electricity are held constant, GHG emissions follow a similar growth trend, increasing from 3,400 MtCO2e in 2000 to 5,200 MtCO2e in 2050.

29 ICCA Building Technology Roadmap
Figure 14. Life Cycle Energy for Growth in Building Stock with no Improvements to Energy Efficiency of the Building Envelope
Figure 15. Life Cycle GHG for Growth in Building Stock with no Improvements to Energy Efficiency of the Building Envelope (no change in carbon intensity of fuels and electricity over time)
The growth in building stock for Europe, Japan, and the U.S. from 2000 to 2050 would result in a 54% growth in building energy use and an increase in GHG emissions of 1,800 MtCO2e if no improvements were made to new building stock after 2000.
The life cycle energy use and GHG emissions for a single household or a square meter of commercial space will be reduced over time as building envelope R-values are increased and air infiltration rates go down. In the following figures, life cycle energy use and GHG emissions are calculated using Franklin Associates data on fuel production published in the U.S. Life Cycle Inventory (LCI) Database and information about the electricity grid in each region provided by the IEA.
The results in the following figures include the savings due to all types of building products used to improve wall and roof insulation, hot water piping systems, air sealing, cool roofing, and windows. Later sections will break out the amount of savings due to use of chemically-derived products in these categories.
Figure 16 and Figure 17 show the changes in energy and GHG as older less-efficient building stock is removed and new building stock is added, built to building codes and standards that are tightened over time. The figures show that improvement of new stock and gradual removal of older stock is not sufficient to offset the net growth in the number and size of new buildings
0
500
1000
1500
2000
2500
2000 2010 2030 2050
Mto
e
Japan Commercial
Japan Residential
Europe Commercial
Europe Residential
US Commercial
US Residential
0
1000
2000
3000
4000
5000
6000
2000 2010 2030 2050
MtC
O2
e
Japan Commercial
Japan Residential
Europe Commercial
Europe Residential
US Commercial
US Residential

ICCA Building Technology Roadmap 30
Figure 16. Life Cycle Energy for Growth in Stock with Improvements to New Stock and No Renovation of Existing Stock
Figure 17. Life Cycle GHG for Growth in Stock with Improvements to New Stock and No Renovation of Existing Stock (no change in carbon intensity of fuels and electricity over time)
Tightened standards for new construction would hold the increase in building energy use to approximately 9% with an increase in GHG of about 300 MtCO2e while the amount of building floor space increases by 57% from 2000 to 2050. At this growth rate, however, better standards for new buildings alone will not reduce total GHG emissions from the building sector.
In order to achieve net reductions in building energy use and associated GHG emissions while building stock increases, the energy efficiency of the large existing stock of residential and commercial buildings must also be improved. Figure 18 and Figure 19 show the relative changes over time for the two renovation rate scenarios (moderate and ambitious) that were described in Chapter 1. Even with more (and bigger) households and growing amounts of commercial space, the building envelope changes outlined in Chapters 1 and 2 can lead to overall decreases in energy use and GHG emissions. Combining new building standards with a moderate rate of renovation to 2000 stock results in a 12% decrease in energy and GHG by 2050, while tighter new building standards combined with the ambitious renovation scenario rate results in a 23% reduction in energy use and GHG compared to 2000. These savings are achieved while the total amount of building stock for the three regions increases from 59 billion square meters in 2000 to 93 billion square meters in 2050. The largest potential for savings comes from residential stock, mainly in Europe and the U.S., with GHG reductions of 450 and 107 MtCO2 respectively under the moderate renovation rate scenario, and savings of 592 and 232 MtCO2e under the ambitious renovation rate scenario. Residential building stock in Japan shows a net savings of 23 MtCO2e for the moderate renovation rate and 48 MtCO2e for the ambitious renovation rate. For commercial building stock, the growth rate tends to outpace improvements in energy efficiency of the commercial building envelope. Under the moderate renovation rate scenario, GHG emissions
0
200
400
600
800
1000
1200
1400
1600
1800
2000 2010 2030 2050
Mto
e
Japan Commercial
Japan Residential
Europe Commercial
Europe Residential
US Commercial
US Residential
0
500
1,000
1,500
2,000
2,500
3,000
3,500
4,000
2000 2010 2030 2050
MtC
O2
e
Japan Commercial
Japan Residential
Europe Commercial
Europe Residential
US Commercial
US Residential

31 ICCA Building Technology Roadmap
increase by 33 MtCO2e for U.S. commercial stock and 118 MtCO2e for European commercial stock. For the ambitious renovation rate scenario, the net increase in GHG for European stock drops to 97 MtCO2e, and there is a small net decrease in GHG of 5 MtCO2e for U.S. stock. Under both renovation scenarios, there is a small net decrease in GHG for commercial building stock in Japan – 1 MtCO2e for the moderate renovation rate scenario and 8 MtCO2e for the ambitious rate scenario.
Figure 18. Life Cycle Energy for Growth in Stock with Improvements to New Stock and Renovations to Existing Stock
Figure 19. Life Cycle GHG for Growth in Stock with Improvements to New Stock and Renovations to Existing Stock (no change in carbon intensity of fuels and electricity over time)
Tightened standards for new construction combined with renovation of existing stock has the potential to reduce building sector GHG emissions while the amount of stock increases by 34 billion square meters. A moderate renovation rate scenario could reduce total GHG by 427 MtCO2e by 2050, while the ambitious renovation rate scenario has the potential to reduce overall GHG emissions for the building sector in the three regions by 786 MtCO2e while the amount of building floor space increases by 57%.
0
200
400
600
800
1,000
1,200
1,400
1,600
2000 2010 2030Mod
2030Amb
2050Mod
2050Amb
Mto
e
Japan Commercial
Japan Residential
Europe Commercial
Europe Residential
US Commercial
US Residential
0
500
1,000
1,500
2,000
2,500
3,000
3,500
4,000
2000 2010 2030Mod
2030Amb
2050Mod
2050Amb
MtC
O2
e
Japan Commercial
Japan Residential
Europe Commercial
Europe Residential
US Commercial
US Residential

ICCA Building Technology Roadmap 32
Savings potential for envelope improvements in combination with fuel switching and decarbonization of electricity
In the preceding sections, the fuel mix is held constant through 2050 in order to focus on the impacts of improvements in the energy efficiency of the building envelope and hot water piping systems. The figures in this section show the additional reductions in energy and GHG when building envelope improvements are combined with changes in fuels and electricity used for heating, cooling, and water heating. The fuel mixes are based on information from IEA ETP 2012 2DS. The 2DS fuel scenarios include significant shifts away from use of fossil fuels to increased use of solar power and other renewables, both for direct building energy uses as well as for generation of electricity. The 2DS fuel mixes are based on greater use of fuels that are not lower in carbon, but are more energy-efficient to produce and deliver. For example, switching from a natural gas heater to solar energy improves energy efficiency, since solar energy does not have the energy losses that are associated with combustion of fossil fuels to provide direct energy use at the building level. In the 2DS, electricity is further decarbonized by utilizing carbon capture for much of the remaining fossil fuel generation. Together, these changes result in building energy that is both more energy-efficient and significantly less CO2-intensive.
Figure 20 and Figure 21 illustrate the additional benefit of combining building envelope improvements with lower-carbon fuels and electricity. In Figure 20, building improvements and renovations without changes in fuels show a decrease from baseline of 13% for the moderate renovation rate scenario and 24% for the ambitious renovation rate scenario. Combining 2DS fuel switching and lower-carbon electricity with the effect of building envelope improvements shows further reductions in energy use, achieving a 33% reduction from baseline for the moderate renovation scenario and a 41% reduction in baseline for the ambitious renovation scenario.
The results for GHG reductions are more dramatic, as shown in Figure 21. In addition to the reduction in CO2 emissions from fuel switching from fossil fuels to renewable fuels, the 2DS includes implementation of carbon capture and storage (CCS) technology for the share of electricity generation derived from fossil fuel combustion. CCS leads to CO2 savings, but additional energy is needed to capture the CO2 and dispose it. When improvements to the building envelope are combined with lower-carbon 2DS fuel scenarios the 12% reduction from baseline for the moderate renovation rate scenario increases to a 68% reduction from baseline, and the 23% reduction for the ambitious renovation rate scenario increases to a 73% reduction when compared to the 2000 baseline. While this report focuses on the role of the chemical industry in energy efficient building products, chemistry also plays a key role in the decarbonization of the energy supply to achieve these additional GHG savings. For example, chemistry is essential to carbon capture and storage technologies, as well as to renewable energy technologies (e.g., biomass refining; development of new materials for solar energy capture and conversion; development of materials used in wind energy systems such as coatings, hardeners, concrete additives, etc.).
As fuel mixes and electricity become less carbon intensive over time, the GHG emissions per MJ of energy use will progressively become smaller. As a result, the same amount of energy savings will result in smaller GHG savings, but there will be a progressively greater decrease in overall GHG emissions compared to the 2000 baseline.

33 ICCA Building Technology Roadmap
Figure 20. Added Effect of Fuel Switching on Energy Results
Figure 21. Added Effect of Fuel Switching on GHG Results
Savings potential from value chain for chemically derived products
Because not all improvements in building envelopes will come from the use of chemically derived products, it is necessary to separate out the savings that can be directly attributed to the value chain for chemically derived products. The contribution of chemically derived products can be determined by taking the total savings for each product category and adjusting for the market share of chemically derived products in each building product category in each region. Production and installation of chemically derived products is the result of many activities along the full value chain from raw material extraction, chemical production, product manufacturing, and installation by craftsmen. In this analysis, no allocations of savings are made to the various players within the value chain of the chemical product technologies. The life cycle energy and GHG emissions that result from the production of these chemically derived products are allocated over the years of their expected use.
Savings are based on the deployment rates of chemically derived products laid out in Chapter 3. The figures below show the potential annual life cycle savings in energy and GHG emissions from chemically derived products, excluding windows. While energy-efficient windows with plastic frames and other chemically-derived content make major contributions to energy and GHG savings, the overall efficiency of a window reflects the combined effect of the frame, glazing, films and coatings, gas fill and warm edge spacers. Therefore, this analysis does not attempt to attribute a specific portion of window-related savings to the chemical content of the windows.
0
200
400
600
800
1000
1200
1400
1600
2000 baseline 2050 modrenov, 2009
fuels
2050 ambrenov, 2009
fuels
2050 modrenov, 2050
2DS fuels
2050 ambrenov, 2050
2DS fuels
Mto
e
Japan Commercial
Japan Residential
Europe Commercial
Europe Residential
US Commercial
US Residential
0
500
1000
1500
2000
2500
3000
3500
4000
2000 baseline 2050 modrenov, 2009
fuels
2050 ambrenov, 2009
fuels
2050 modrenov, 2050
2DS fuels
2050 ambrenov, 2050
2DS fuels
MtC
O2
e
Japan Commercial
Japan Residential
Europe Commercial
Europe Residential
US Commercial
US Residential

ICCA Building Technology Roadmap 34
In the following figures, savings due to chemically derived products are shown for the two renovation rate scenarios, moderate (“mod”) and ambitious (“amb”). To focus on the effect of the building products, fuel mixes and carbon intensity are held constant over time. Under the more ambitious renovation rate scenario, greater quantities of savings are achieved through use of greater quantities of chemically derived products. Note that only one set of results is shown for 2010 since both renovation scenarios use the same assumptions for 2010; the 3% per year ambitious renovation rate was not retroactively applied to 2010.
Figure 22. Life Cycle Energy Savings per Year for Use of Chemically-derived Building Products, Excluding Windows
Figure 23. Life Cycle GHG Savings per Year for Use of Chemically-derived Building Products, Excluding Windows
The savings in Figure 22 and Figure 23 are expressed relative to the results for 2050 stock quantities evaluated at 2000 stock efficiency. As shown in Figure 14 and Figure 15, at 2000 efficiencies the 93 billion square meters of building stock in 2050 would use over 2,200 Mtoe of energy, producing about 5,200 MtCO2e of GHG emissions. As shown in Figure 19, with improvements in new buildings and renovations to existing buildings, the GHG emissions in 2050 for the moderate renovation rate scenario would be about 3,000 MtCO2e (savings of 2,200 MtCO2e), or 2,600 MtCO2e (savings of 2,600 MtCO2e) for the ambitious renovation rate scenario. Of these total savings, Figure 23 shows the amount of savings that can be attributed to chemically derived building products (excluding windows) – 970 MtCO2e for the moderate renovation scenario and 1,113 MtCO2e for the ambitious renovation scenario.
0
50
100
150
200
250
300
350
400
450
500
Mod Amb Mod Amb
2010 2030 2050
Mto
e
Japan Commercial
Japan Residential
Europe Commercial
Europe Residential
US Commercial
US Residential
0
200
400
600
800
1,000
1,200
Mod Amb Mod Amb
2010 2030 2050
MtC
O2
e
Japan Commercial
Japan Residential
Europe Commercial
Europe Residential
US Commercial
US Residential

35 ICCA Building Technology Roadmap
The largest share of savings comes from the European and U.S. residential sectors, which include both single-family and multi-family buildings. Within the residential sector, single-family homes provide most of the potential for savings, averaging at least 75% of the heat loss in residential households. As improvements are made to single-family and multi-family residential building stock over time, the share of energy loss from single-family homes remains at about 75% out to 2050. This is influenced by the fact that the same growth rates are used for both household types in the model. Although the total amount of residential floor space in 2050 is similar for Europe and the U.S., savings for European residential stock are considerably higher than for the U.S., which can be attributed to more ambitious European legislation aimed at near-zero energy buildings.
For each decade, the same growth rate was modeled for all categories of a region’s commercial building stock. That is, the same growth rate was applied to the region’s schools, hospitals, hotels, retail, and office buildings, with the exception of U.S. commercial stock from 2010 to 2030, where specific data were available for different types of commercial buildings.9 Because of this, the U.S. is the only region where the results show any significant change in the share of energy used by different types of commercial buildings. Even so, office buildings continue to make up the largest share of energy use in the U.S. In Europe, retail buildings are responsible for the largest portion of commercial energy use, while office, education, and retail are more evenly split in Japan. 10
Figure 24. Share of U.S. Commercial Energy Use by Building Type
9 U.S. projections through 2030 are based on the 2012 Annual Energy Outlook. Data through 2010 are available by commercial building type for both the U.S. and Europe.
10 European retail space also includes wholesale, which may explain the large share of energy use.
0%
20%
40%
60%
80%
100%
2000 2010 2030 2050
Office
Education
Retail
Hotel
Hospital
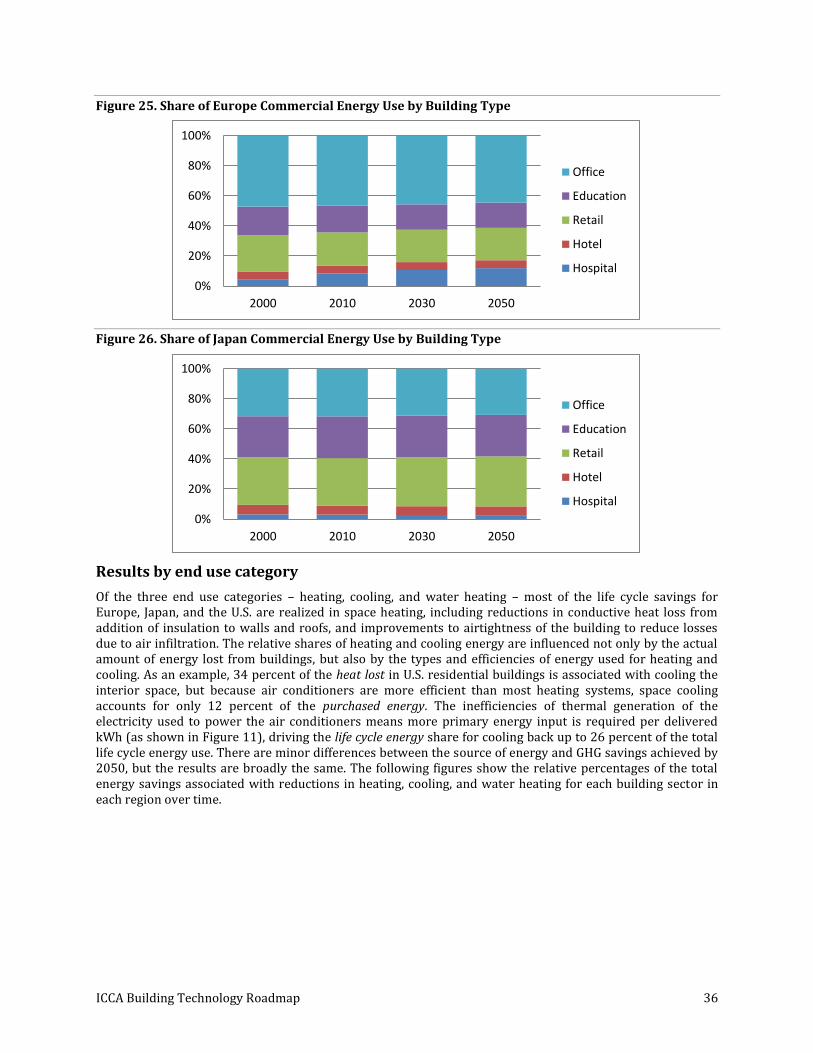
ICCA Building Technology Roadmap 36
Figure 25. Share of Europe Commercial Energy Use by Building Type
Figure 26. Share of Japan Commercial Energy Use by Building Type
Results by end use category
Of the three end use categories – heating, cooling, and water heating – most of the life cycle savings for Europe, Japan, and the U.S. are realized in space heating, including reductions in conductive heat loss from addition of insulation to walls and roofs, and improvements to airtightness of the building to reduce losses due to air infiltration. The relative shares of heating and cooling energy are influenced not only by the actual amount of energy lost from buildings, but also by the types and efficiencies of energy used for heating and cooling. As an example, 34 percent of the heat lost in U.S. residential buildings is associated with cooling the interior space, but because air conditioners are more efficient than most heating systems, space cooling accounts for only 12 percent of the purchased energy. The inefficiencies of thermal generation of the electricity used to power the air conditioners means more primary energy input is required per delivered kWh (as shown in Figure 11), driving the life cycle energy share for cooling back up to 26 percent of the total life cycle energy use. There are minor differences between the source of energy and GHG savings achieved by 2050, but the results are broadly the same. The following figures show the relative percentages of the total energy savings associated with reductions in heating, cooling, and water heating for each building sector in each region over time.
0%
20%
40%
60%
80%
100%
2000 2010 2030 2050
Office
Education
Retail
Hotel
Hospital
0%
20%
40%
60%
80%
100%
2000 2010 2030 2050
Office
Education
Retail
Hotel
Hospital

37 ICCA Building Technology Roadmap
Figure 27. Percent of Energy Savings by End Use in 2050 for Use of Chemically-derived Building Products
For Europe, Figure 27 shows that the projected energy savings in 2050 are more concentrated in space heating than for the Japan or the U.S. Space cooling savings are small for Europe for several reasons. Warm European countries have fewer cooling degree days and more heating degree days than the southern U.S. In addition, European households are less likely to have air conditioning than the Japan or the U.S. The combination of fewer days when cooling is needed and less use of air conditioning on those days means that increasing the efficiency of the building envelope will lead to only modest reductions in the energy use and GHG emissions for cooling in Europe. Improvements in the energy efficiency of the building envelope will have much larger impacts on the amount of energy (and associated GHG) needed for space heating.
Figure 28. Energy Savings by Region, Building Sector, and End Use in 2050
0%10%20%30%40%50%60%70%80%90%
100%
Water Heating
Cooling
Heating
0
50
100
150
200
250
Mod Amb Mod Amb Mod Amb Mod Amb Mod Amb Mod Amb
USResidential
USCommercial
EuropeResidential
EuropeCommercial
JapanResidential
JapanCommercial
Mto
e
Water Heating
Cooling
Heating

ICCA Building Technology Roadmap 38
Figure 29. GHG Savings by Region, Building Sector, and End Use in 2050
The large savings for European and U.S. residential building stock and the small potential savings for Japanese building stock are a function of both the initial energy use – determined by the quantities and characteristics of 2000 building stock and climate conditions in each region – and how improvements to the building envelope are made in each region over time. The most aggressive improvements in new and renovated building stock are needed in the cold regions of Europe and the U.S. The milder climate in Japan, where buildings typically contain far less insulation, means that increased insulation would show less benefit there.
Results by product category
Each of the building envelope components serves to prevent heat loss, either by reducing conduction – through the roof, walls, and windows – or by reducing the infiltration of outside air. Additionally, this study looks at energy used in water heating, and the potential for plastic pipe and pipe insulation to reduce heat lost from hot water as it is distributed within the building hot water piping system. The amount of energy consumed, by component, annually in the 2000 residential and commercial stock of each region is shown in Figure 30. As previously discussed, the European and U.S. residential buildings use the most energy (with corresponding associated GHG), but this provides additional perspective on how much energy is lost through the different parts of the building envelope.11
Figure 31 shows where chemically derived products make the greatest contributions to the energy savings in the 2050 building stock. The majority of the energy savings is achieved by better insulation of walls and roof and by improving the air tightness of the building. The quantity of savings broken out by product category is shown in Figure 32 (derived by multiplying savings totals from Figure 23 by the contribution percentages in Figure 31). The savings in the figure do not include savings associated with windows.
Although windows that use chemically derived components such as plastic frames and warm edge spacers also make significant contributions to the reductions in energy consumption and GHG emissions, the chemically derived components are used in combination with other energy-saving window components that are not chemically derived, such as multi-glazing and e-coatings. This makes it extremely difficult to determine how much of the savings are due to the chemically derived content of the windows. This is especially true when examining all windows installed by 2050. Therefore, the savings from energy-efficient windows with plastic frames (and that may include other chemically derived components as well) are shown in separate figures rather than including them in the savings that can readily be attributed to chemically
11 The energy use related to walls is overstated here by approximately 15 percent because of the way that R-values for masonry walls
are reduced in the model. This impacts the energy flow through walls, but the overall savings are correct. The actual life cycle energy use related to walls is slightly more than for windows.
0
100
200
300
400
500
600
Mod Amb Mod Amb Mod Amb Mod Amb Mod Amb Mod Amb
USResidential
USCommercial
EuropeResidential
EuropeCommercial
JapanResidential
JapanCommercial
MtC
O2
e
Water Heating
Cooling
Heating

39 ICCA Building Technology Roadmap
derived products. The window savings shown in Figure 333 and Figure 344 do not include savings for non-plastic frame windows that use smaller amounts of chemically derived content in components such as warm edge spacers and films.
Figure 30. Life Cycle Energy Use by Envelope Component, 2000
Figure 31. Percent of Energy Savings by Category of Chemically Derived Building Envelope Product, 205012
12 Excludes savings from windows.
0
50
100
150
200
250
300
350
400
450
Walls Roof Windows Airexchange
HotWater
Mto
e
Japan Commercial
Japan Residential
Europe Commercial
Europe Residential
U.S. Commercial
U.S. Residential
0%10%20%30%40%50%60%70%80%90%
100%
Reflective roof coatings and pigments forcool roof
Plastic pipes and pipe insulation for hotwater transport
Air sealing materials to reduce airexchange
Roof insulation material
Wall insulation material
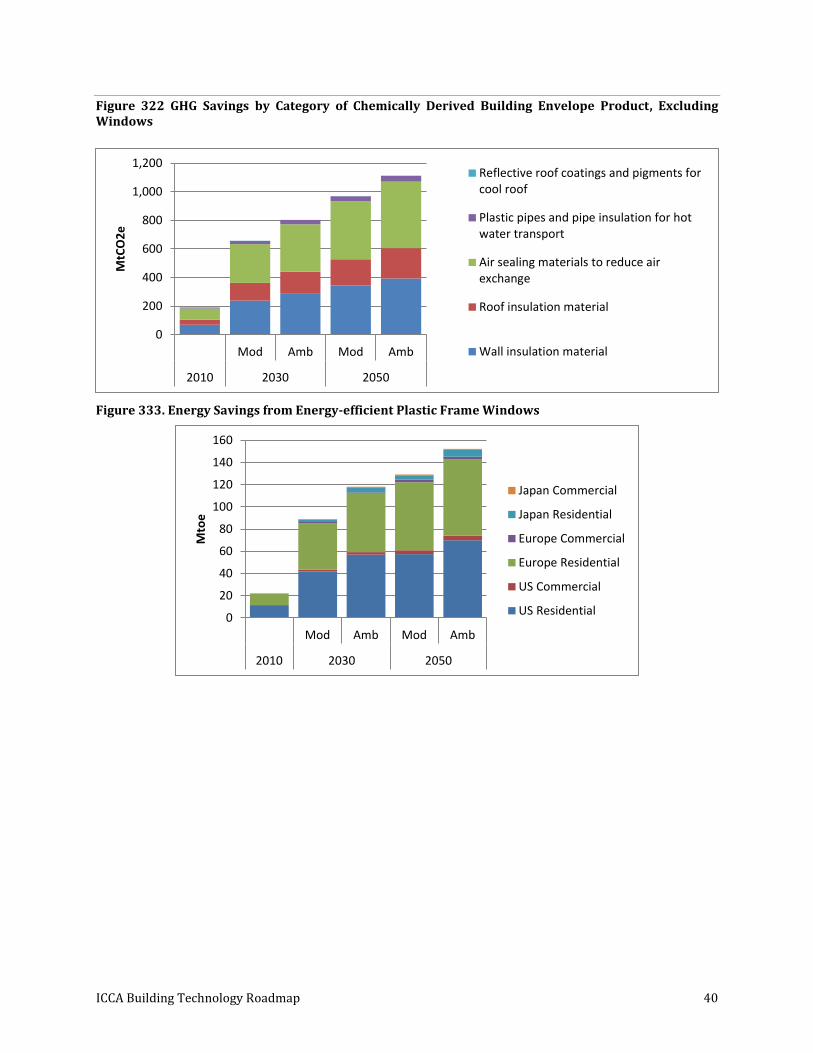
ICCA Building Technology Roadmap 40
Figure 322 GHG Savings by Category of Chemically Derived Building Envelope Product, Excluding Windows
Figure 333. Energy Savings from Energy-efficient Plastic Frame Windows
0
200
400
600
800
1,000
1,200
Mod Amb Mod Amb
2010 2030 2050
MtC
O2
e
Reflective roof coatings and pigments forcool roof
Plastic pipes and pipe insulation for hotwater transport
Air sealing materials to reduce airexchange
Roof insulation material
Wall insulation material
0
20
40
60
80
100
120
140
160
Mod Amb Mod Amb
2010 2030 2050
Mto
e
Japan Commercial
Japan Residential
Europe Commercial
Europe Residential
US Commercial
US Residential

41 ICCA Building Technology Roadmap
Figure 344. GHG Savings from Energy-efficient Plastic Frame Windows
Although not all of the savings for energy-efficient windows with plastic frames can be attributed to the chemically derived content of the window assembly, total savings for use of plastic-frame windows are substantial in residential building stock, adding 294 MtCO2e of GHG savings for the moderate renovation rate scenario and 349 MtCO2e savings for the ambitious rate scenario in 2050. Plastic frame windows are not as widely used in commercial markets, so the commercial stock savings are smaller, 17 and 19 MtCO2e for the moderate and ambitious renovation scenarios, respectively, in 2050.
Net savings potential for chemically derived products
The use of chemically derived building envelope products saves energy and prevents GHG emissions. At the same time the production of these products causes emissions. To get an indication of whether the chemically derived products avoid more emissions in their use phase than are caused during their production, the cradle-to-chemical product emissions were calculated. Emissions caused by further steps in the value chain up to the implemented technology (further processing of chemical product, application of product by craftsmen) were not assessed in detail in this analysis but are generally small in comparison to the cradle-to-product emissions, based on full life cycle studies that have been conducted on these types of chemically derived building products. Table 17 through Table 20 show the cumulative life cycle energy use and GHG emissions from the production of chemically derived building products, as well as the cumulative potential savings attributable to their use. These values do not include burdens or savings from windows. The top section of each table shows results for the moderate renovation rate scenario, while the bottom section shows results for the ambitious renovation rate scenario. By comparing the cradle-to-production impacts to the use phase savings, it can be seen that the benefits of using these technologies are many times greater than the energy and GHG impacts for producing them.
Table 17. Cumulative Energy Demand for Production of Chemically Derived Building Products, Excluding Windows (Mtoe)
2010 2020 2030 2040 2050
MODERATE RENOVATION RATE
U.S. Residential 2.1 7.3 13.6 19.4 24.3
U.S. Commercial 0.3 0.9 1.7 2.6 3.4
Europe Residential 2.5 7.9 15.0 21.8 27.4
Europe Commercial 0.6 2.1 4.1 6.0 7.9
0
50
100
150
200
250
300
350
400
Mod Amb Mod Amb
2010 2030 2050
MtC
O2
e
Japan Commercial
Japan Residential
Europe Commercial
Europe Residential
US Commercial
US Residential

ICCA Building Technology Roadmap 42
Japan Residential 0.3 0.8 1.3 1.6 1.9
Japan Commercial 0.2 0.6 1.0 1.4 1.7
AMBITIOUS RENOVATION RATE
U.S. Residential 2.1 8.5 17.3 25.4 32.5
U.S. Commercial 0.3 1.1 2.2 3.5 4.7
Europe Residential 2.5 9.1 18.7 28.5 36.8
Europe Commercial 0.6 2.3 4.7 7.1 9.4
Japan Residential 0.3 1.0 1.7 2.4 3.0
Japan Commercial 0.2 0.6 1.3 2.0 2.5
Table 18. Cumulative Energy Savings for Use of Chemically Derived Building Products, Excluding Windows (Mtoe)
2010 2020 2030 2040 2050
MODERATE RENOVATION RATE
U.S. Residential 98 416 976 1,740 2,672
U.S. Commercial 23 105 261 489 788
Europe Residential 222 925 2,147 3,771 5,682
Europe Commercial 44 192 461 847 1,344
Japan Residential 8 31 67 114 169
Japan Commercial 8 31 67 114 169
AMBITIOUS RENOVATION RATE
U.S. Residential 98 461 1,155 2,099 3,211
U.S. Commercial 23 117 309 587 941
Europe Residential 222 1,000 2,445 4,361 6,548
Europe Commercial 44 203 503 932 1,474
Japan Residential 8 38 94 168 251
Japan Commercial 8 33 81 143 215

43 ICCA Building Technology Roadmap
Table 19. Cumulative GHG Emissions from Production of Chemically Derived Building Products, Excluding Windows (MtCO2e)
2010 2020 2030 2040 2050
MODERATE RENOVATION RATE
U.S. Residential 3.7 12 23 33 41
U.S. Commercial 0.5 1.5 2.9 4.3 5.7
Europe Residential 3.5 11 21 31 39
Europe Commercial 0.9 3.0 5.7 8.6 11
Japan Residential 0.5 1.3 2.0 2.6 3.0
Japan Commercial 0.3 0.9 1.6 2.3 2.8
AMBITIOUS RENOVATION RATE
U.S. Residential 3.7 15 30 44 56
U.S. Commercial 0.5 1.8 3.7 5.8 7.9
Europe Residential 3.5 13 26 40 52
Europe Commercial 0.9 3.3 6.6 10.1 13
Japan Residential 0.5 1.6 2.8 3.9 4.8
Japan Commercial 0.3 1.0 2.1 3.2 4.0

ICCA Building Technology Roadmap 44
Table 20. Cumulative GHG Savings for Use of Chemically Derived Building Products, Excluding Windows (MtCO2e)
2010 2020 2030 2040 2050
MODERATE RENOVATION RATE
U.S. Residential 252 1,068 2,506 4,471 6,864
U.S. Commercial 63 289 715 1,340 2,161
Europe Residential 498 2,074 4,814 8,458 12,744
Europe Commercial 100 437 1,050 1,927 3,059
Japan Residential 20 77 168 284 420
Japan Commercial 19 76 172 297 446
AMBITIOUS RENOVATION RATE
U.S. Residential 252 1,184 2,971 5,400 8,261
U.S. Commercial 63 322 847 1,610 2,581
Europe Residential 498 2,241 5,483 9,778 14,682
Europe Commercial 100 461 1,145 2,121 3,355
Japan Residential 20 94 234 418 624
Japan Commercial 19 84 203 361 541
The most important tables in this section are Table 21 and

45 ICCA Building Technology Roadmap
Table 22, which show the ratios of the potential savings due to use of chemically derived products relative to the impacts for producing them. The figures show that the benefits of using chemically derived building products are many times greater than the energy and GHG impacts for producing them. For example, the first number in Table 21 shows that in 2010, the cumulative energy savings for use of chemically derived building products in U.S. residential buildings was 46 times the energy required to produce the products. The ratios become progressively larger over time, as products installed in previous years continue to accrue savings while new products continue to be added. Figure and Figure 35 show the cumulative net savings over time when the cumulative production impacts for the chemically derived products (shown in Table 17 and Error!
eference source not found.) are subtracted from the cumulative use phase benefits (shown in Error!
Reference source not found. and Table 20).
The energy ratios in Table 21 are somewhat different from the GHG ratios in

ICCA Building Technology Roadmap 46
Table 22. A large share of the production energy for chemically derived products is embodied energy associated with the use of petroleum and natural gas as material feedstocks, rather than combustion energy that produces GHG emissions. Therefore, the energy savings ratios are different from the GHG savings ratios.
On a product-level basis, the largest savings ratios are for air sealing products, where small quantities of products, combined with good construction practices, can result in significant reductions in energy loss through air infiltration and exfiltration. While products such as insulation provide large use phase savings, they also require greater masses of products to achieve the savings, which increases the production impacts and reduces the ratio of use phase benefits to production impacts.
Table 21. Energy Ratio, Cumulative Savings to Cumulative Production Impacts (Windows Excluded)
2010 2020 2030 2040 2050
MODERATE RENOVATION RATE
U.S. Residential 46 57 72 89 110
U.S. Commercial 83 115 152 191 231
Europe Residential 89 116 143 173 207
Europe Commercial 68 91 114 140 171
Japan Residential 27 38 53 69 88
Japan Commercial 39 55 68 83 103
AMBITIOUS RENOVATION RATE
U.S. Residential 46 54 67 83 99
U.S. Commercial 83 109 139 170 200
Europe Residential 89 110 131 153 178
Europe Commercial 68 88 108 131 157
Japan Residential 27 39 54 69 84
Japan Commercial 39 53 63 73 87

47 ICCA Building Technology Roadmap
Figure 35. Cumulative Net Energy Savings for Chemically Derived Building Products (Use Phase Savings – Production Impacts)
0
2,000
4,000
6,000
8,000
10,000
12,000
14,000
Mod Amb Mod Amb
2010 2030 2050
Mto
e
Japan Commercial
Japan Residential
Europe Commercial
Europe Residential
US Commercial
US Residential

ICCA Building Technology Roadmap 48
Table 22. GHG Ratio, Cumulative Savings to Cumulative Production Impacts (Windows Excluded)
2010 2020 2030 2040 2050
MODERATE RENOVATION RATE
U.S. Residential 68 86 108 135 165
U.S. Commercial 134 187 249 313 380
Europe Residential 140 184 228 275 330
Europe Commercial 108 146 183 225 274
Japan Residential 42 59 83 109 138
Japan Commercial 61 86 107 130 162
AMBITIOUS RENOVATION RATE
U.S. Residential 68 81 100 124 149
U.S. Commercial 134 177 226 277 327
Europe Residential 140 174 207 243 282
Europe Commercial 108 141 174 210 251
Japan Residential 42 60 84 107 129
Japan Commercial 61 82 98 115 136
Figure 35. Cumulative Net GHG Savings for Chemically Derived Building Products (Use Phase Savings – Production Impacts)
0
5,000
10,000
15,000
20,000
25,000
30,000
35,000
Mod Amb Mod Amb
2010 2030 2050
MtC
O2
e
Japan Commercial
Japan Residential
Europe Commercial
Europe Residential
US Commercial
US Residential

49 ICCA Building Technology Roadmap
All of the life cycle savings and impacts shown in Table 17 through

ICCA Building Technology Roadmap 50
Table 22 are due to the production and use of chemically derived building envelope products. Table 23 provides a summary of the total amounts of chemically derived products produced and used in residential and commercial buildings from 2000 through 2050. The installed quantities are expressed on the same units as the production impacts in Table 16 at the end of Chapter 3. These units relate the quantities of product to the physical characteristics of the building stock (e.g., total m2 of wall, roof, and glazing area; perimeters of doors, windows, and foundation that are sealed, etc.).
Table 23. Chemical-Based Product Installation, 2000-2050
Wall & roof
insulation (kg)
Cool roof (m2)
New/upgraded windows (m2)
Pipe insulation
(kg)
Frame air
barrier (m2)
Masonry air
barrier (m2)
Foundation caulk (m)
Window caulk (m)
Roof perimeter membrane
(m)
Door weather-strip (m)
U.S. Residential 4.5E+10 2.2E+09 1.8E+09 2.3E+08 1.0E+10 1.0E+10 3.1E+09 3.1E+10 3.1E+09 1.4E+09
U.S. Commercial 5.2E+09 8.1E+08 5.6E+07 1.0E+08 1.0E+09 1.3E+09 1.9E+08 2.4E+09 1.9E+08 1.0E+08
Europe Residential 3.4E+10 2.7E+09 1.6E+09 2.3E+08 6.7E+09 1.1E+10 2.9E+09 2.0E+10 2.9E+09 1.3E+09
Europe Commercial 5.8E+09 1.4E+09 5.1E+07 1.0E+08 1.3E+09 1.4E+09 2.4E+08 3.0E+09 2.4E+08 1.1E+08
Japan Residential 2.2E+09 5.1E+07 3.2E+08 2.8E+07 1.2E+09 1.2E+09 3.3E+08 3.7E+09 3.3E+08 2.6E+08
Japan Commercial 2.7E+09 5.3E+07 9.3E+06 2.3E+07 2.9E+08 3.3E+08 6.3E+07 6.7E+08 6.3E+07 2.9E+07
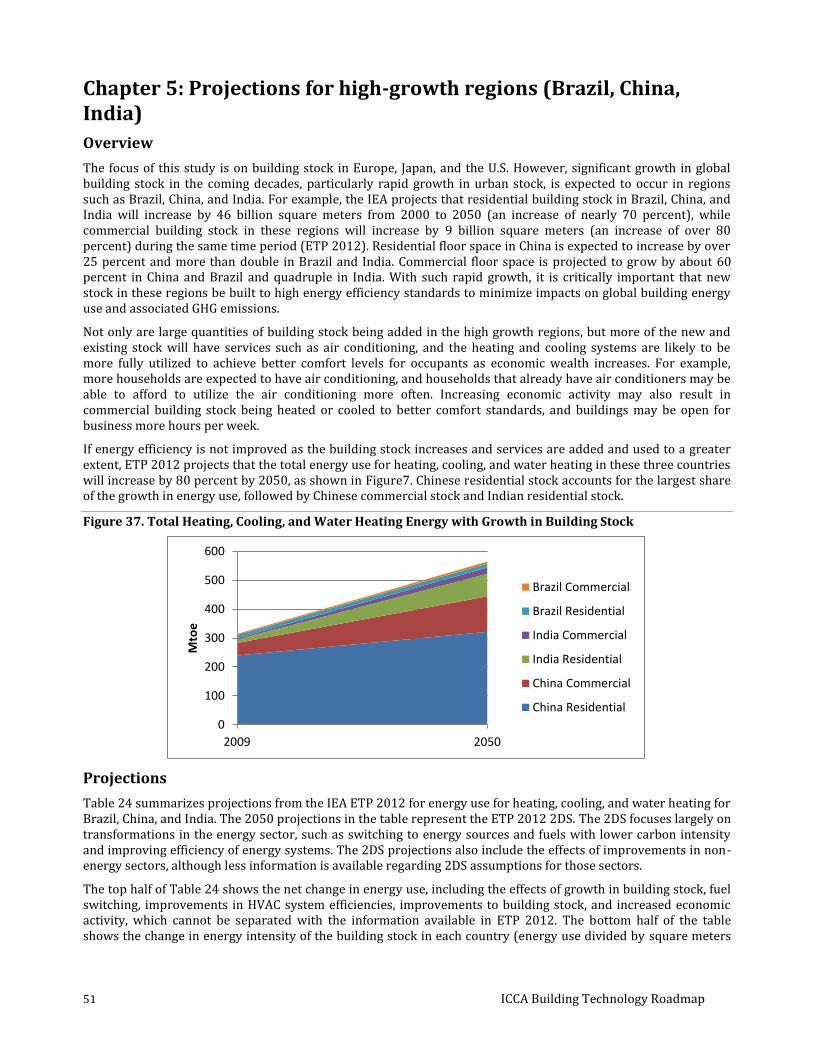
51 ICCA Building Technology Roadmap
Chapter 5: Projections for high-growth regions (Brazil, China, India)
Overview
The focus of this study is on building stock in Europe, Japan, and the U.S. However, significant growth in global building stock in the coming decades, particularly rapid growth in urban stock, is expected to occur in regions such as Brazil, China, and India. For example, the IEA projects that residential building stock in Brazil, China, and India will increase by 46 billion square meters from 2000 to 2050 (an increase of nearly 70 percent), while commercial building stock in these regions will increase by 9 billion square meters (an increase of over 80 percent) during the same time period (ETP 2012). Residential floor space in China is expected to increase by over 25 percent and more than double in Brazil and India. Commercial floor space is projected to grow by about 60 percent in China and Brazil and quadruple in India. With such rapid growth, it is critically important that new stock in these regions be built to high energy efficiency standards to minimize impacts on global building energy use and associated GHG emissions.
Not only are large quantities of building stock being added in the high growth regions, but more of the new and existing stock will have services such as air conditioning, and the heating and cooling systems are likely to be more fully utilized to achieve better comfort levels for occupants as economic wealth increases. For example, more households are expected to have air conditioning, and households that already have air conditioners may be able to afford to utilize the air conditioning more often. Increasing economic activity may also result in commercial building stock being heated or cooled to better comfort standards, and buildings may be open for business more hours per week.
If energy efficiency is not improved as the building stock increases and services are added and used to a greater extent, ETP 2012 projects that the total energy use for heating, cooling, and water heating in these three countries will increase by 80 percent by 2050, as shown in Figure7. Chinese residential stock accounts for the largest share of the growth in energy use, followed by Chinese commercial stock and Indian residential stock.
Figure 37. Total Heating, Cooling, and Water Heating Energy with Growth in Building Stock
Projections
Table 24 summarizes projections from the IEA ETP 2012 for energy use for heating, cooling, and water heating for Brazil, China, and India. The 2050 projections in the table represent the ETP 2012 2DS. The 2DS focuses largely on transformations in the energy sector, such as switching to energy sources and fuels with lower carbon intensity and improving efficiency of energy systems. The 2DS projections also include the effects of improvements in non-energy sectors, although less information is available regarding 2DS assumptions for those sectors.
The top half of Table 24 shows the net change in energy use, including the effects of growth in building stock, fuel switching, improvements in HVAC system efficiencies, improvements to building stock, and increased economic activity, which cannot be separated with the information available in ETP 2012. The bottom half of the table shows the change in energy intensity of the building stock in each country (energy use divided by square meters
0
100
200
300
400
500
600
2009 2050
Mto
e
Brazil Commercial
Brazil Residential
India Commercial
India Residential
China Commercial
China Residential

ICCA Building Technology Roadmap 52
of floor space). Focusing on changes in building energy and energy intensity rather than on changes in GHG projections minimizes the effects of assumptions about shifts to lower carbon fuels, but it is not possible to isolate the effects of improvements in building envelope energy efficiency from the effects of assumptions about increased economic activity.
Table 24. Changes in Energy Use for High Growth Regions
Heating Energy
Cooling Energy
Water Heating Energy
Residential Commercial
Residential Commercial
Residential Commercial
Energy Use (Mtoe)
Brazil
2009 Baseline 2.3 0.1
0.3 1.4
8.5 2.1
2050 2DS 1.9 0.3
1.7 2.4
7.2 3.1
2050 as % of 2009 85% 174%
558% 177%
85% 149%
China
2009 Baseline 142 25
8.8 4.1
88 14
2050 2DS 125 38
34.4 17.0
69 23
2050 as % of 2009 88% 151%
389% 415%
78% 163%
India
2009 Baseline 0.5 0.1
2.0 2.4
9.6 1.9
2050 2DS 0.7 0.5
29.6 9.0
11.5 4.3
2050 as % of 2009 152% 330%
1451% 372%
121% 227%
Energy Intensity (MJ/m2)
Brazil
2009 Baseline 30 17
4.0 153
111 236
2050 2DS 13 18
11.0 173
47 225
2050 as % of 2009 42% 111%
277% 113%
42% 95%
China
2009 Baseline 139 107
8.6 17
86 58
2050 2DS 96 98
26.5 43
53 58
2050 as % of 2009 69% 92%
307% 254%
62% 99%
India
2009 Baseline 1.0 6.8
4.1 118
19.4 93
2050 2DS 0.6 5.5
23.9 107
9.3 51
2050 as % of 2009 60% 80%
577% 90%
48% 55%
Heating energy
Figure 3836 shows the net change in energy use for heating residential and commercial building stock in Brazil, China, and India from 2009 to 2050 under the ETP 2DS scenario. The figure shows that the heating energy use in China is far greater than in India and Brazil. There is a slight net decrease in total heating energy, as the decrease in Chinese residential heating energy is largely offset by an increase in heating energy for Chinese commercial stock.

53 ICCA Building Technology Roadmap
Figure 3836. Heating Energy for High-Growth Regions
Due to the warm climate in India and Brazil, energy intensities for heating in India and Brazil are much lower than heating intensity in China, in both the residential and commercial sectors. In fact, the combined heating energy requirements for Brazil and India are only about 2% of the heating requirements for China, so they are barely visible in the figure. The greatest potential for reducing energy and GHG emissions for heating in rapid growth countries is therefore in China.
Cooling energy
The net growth in cooling energy use for residential and commercial building stock in Brazil, China, and India from 2009 to 2050 is shown in Figure9. The figure shows substantial increases in cooling energy for all three countries. In 2050, not only will there be substantially more building stock in these countries, but more of the building stock will have air conditioning. This includes air conditioning installed in new buildings and added to existing building stock. As economic activity increases, building occupants are likely to utilize these cooling systems more frequently for better comfort levels.
Figure 39. Cooling Energy for High-Growth Regions
The 2050 2DS projections show residential cooling energy intensity more than doubles in Brazil, triples in China, and increases almost sixfold in India. As noted previously, the large increases in cooling energy intensity are due to the increasing deployment and use of air conditioning in both new and existing homes.
Cooling energy intensity for commercial stock in China also shows a substantial increase from 2009 to 2050, from 17 to 43 MJ/m2, but 2050 commercial cooling intensity is China is less than half of the 2050 cooling intensities for commercial stock in India and Brazil, which are 107 and 173 MJ/m2, respectively.
Water heating energy
Figure 3740 shows the net decrease in energy use for water heating in residential and commercial building stock in Brazil, China, and India from 2009 to 2050. Fuel shifting information from ETP 2012 shows that reductions in water heating energy intensity can largely be attributed to significant projected increases in the share of solar
0
50
100
150
200
2009 2050
Mto
e
Brazil Commercial
Brazil Residential
India Commercial
India Residential
China Commercial
China Residential
0
20
40
60
80
100
2009 2050
Mto
e
Brazil Commercial
Brazil Residential
India Commercial
India Residential
China Commercial
China Residential
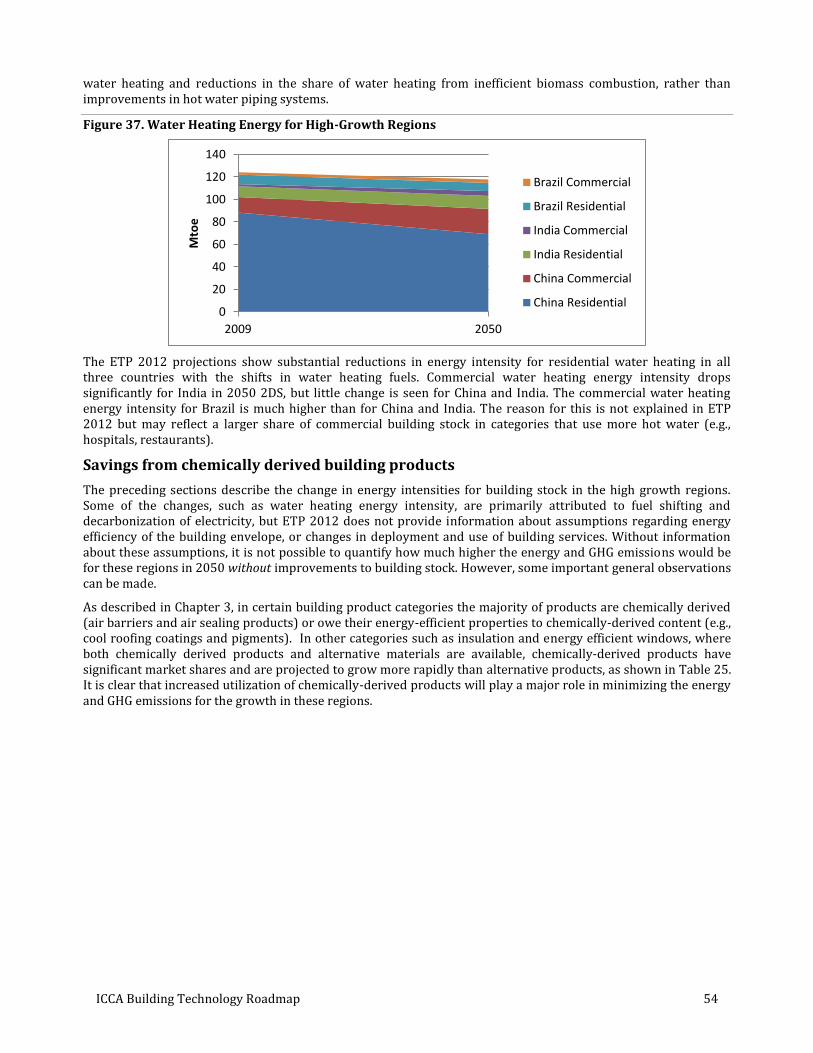
ICCA Building Technology Roadmap 54
water heating and reductions in the share of water heating from inefficient biomass combustion, rather than improvements in hot water piping systems.
Figure 37. Water Heating Energy for High-Growth Regions
The ETP 2012 projections show substantial reductions in energy intensity for residential water heating in all three countries with the shifts in water heating fuels. Commercial water heating energy intensity drops significantly for India in 2050 2DS, but little change is seen for China and India. The commercial water heating energy intensity for Brazil is much higher than for China and India. The reason for this is not explained in ETP 2012 but may reflect a larger share of commercial building stock in categories that use more hot water (e.g., hospitals, restaurants).
Savings from chemically derived building products
The preceding sections describe the change in energy intensities for building stock in the high growth regions. Some of the changes, such as water heating energy intensity, are primarily attributed to fuel shifting and decarbonization of electricity, but ETP 2012 does not provide information about assumptions regarding energy efficiency of the building envelope, or changes in deployment and use of building services. Without information about these assumptions, it is not possible to quantify how much higher the energy and GHG emissions would be for these regions in 2050 without improvements to building stock. However, some important general observations can be made.
As described in Chapter 3, in certain building product categories the majority of products are chemically derived (air barriers and air sealing products) or owe their energy-efficient properties to chemically-derived content (e.g., cool roofing coatings and pigments). In other categories such as insulation and energy efficient windows, where both chemically derived products and alternative materials are available, chemically-derived products have significant market shares and are projected to grow more rapidly than alternative products, as shown in Table 25. It is clear that increased utilization of chemically-derived products will play a major role in minimizing the energy and GHG emissions for the growth in these regions.
0
20
40
60
80
100
120
140
2009 2050
Mto
e
Brazil Commercial
Brazil Residential
India Commercial
India Residential
China Commercial
China Residential

55 ICCA Building Technology Roadmap
Table 25. Growth in Market Share of Chemically Derived Building Products (chemical product sales as percent of total sales)
Plastic Foam Insulation 1999 2019
Brazil 36% 45%
China 64% 82%
India 56% 65%
Plastic Frame Windows 2000 2020
Brazil 3% 7%
China 21% 43%
India 9% 16%
Source: Freedonia World Insulation and World Windows and Doors reports
China is the high-growth region with the greatest potential for heating savings from greater use of insulation and energy-efficient windows. The market projections in Table 25 show that plastic products’ share of insulation and windows is high and is growing in China. Therefore, plastic foam insulation and energy-efficient windows with plastic frames will make large contributions to the heating energy savings for building stock in China.
As noted earlier, cooling energy intensity is a more important consideration for Brazil and India, due to their warm climates. In warm regions, adding insulation to building walls and roof can increase a building’s cooling load if the building does not have adequate air circulation. A good way of reducing cooling load in warm regions is to utilize cool roofing, to reflect sunlight from the building roof. Table 26 provides an estimate of potential energy savings for cool roofing in Brazil and India. The net energy savings are based on projections of total new and replacement roofing, using Freedonia square meters of roofing for 2020 extrapolated out to 2050, and the low-slope warm region factors in Table 14 in the cool roofing section of Chapter 3. The final column shows 2050 estimated cool roof savings as a percent of total cooling energy, if 100% of new and replacement roof installed in India and Brazil residential and commercial stock in 2050 were cool roof. The table shows that 100% use of cool roof for new and replacement roofs could potentially reduce total cooling energy for Brazilian residential stock by 9%. The potential savings in cooling energy in India is larger in magnitude although a smaller percentage of total cooling energy.
Summary
Building stock in Brazil, China, and India is projected to increase from 88 billion square meters of floor space in 2009 to 133 billion square meters by 2050. This rapid growth in building stock could result in an 80 percent increase in energy use for building heating, cooling, and water heating if improvements are not made to the energy efficiency of the building stock and changes are not made in the fuels used.
Chemically derived products have a significant role to play in minimizing the energy and GHG emissions for the growth in building stock in these regions. For China, the largest share of energy use is for residential heating. By 2020, over 80 percent of insulation used in China is projected to be plastic foam insulation, and over 40 percent of window sales will be plastic frame windows. Therefore, plastic foam insulation and energy-efficient windows with plastic frames will make large contributions to the heating energy savings for building stock in China. Chemically derived air barriers and air sealing products will also contribute to reductions in heat loss.
In Brazil and India, cooling energy is a more important consideration. Cool roofing, which owes its reflective properties to chemically derived pigments and coatings, has the potential to make significant contributions to reductions in cooling energy in these regions.

ICCA Building Technology Roadmap 56
Table 26. Cool Roof Projections for Brazil and India, 2050
Million m2 roofing, 2050
(new and replacement)
2050 2DS
cooling energy (Mtoe)
Cool roof savings as % of 2050 2DS
cooling energy
Cool roof savings at various implementation levels (Mtoe)
25% 50% 75% 100%
Brazil Residential 363 0.04 0.08 0.12 0.15 1.7 9.1%
Commercial 110 0.01 0.02 0.03 0.05 2.4 1.9%
India Residential 616 0.07 0.13 0.20 0.26 29.6 0.9%
Commercial 842 0.09 0.18 0.27 0.36 9.0 4.0%
Total, Brazil and India Residential 979 0.10 0.21 0.31 0.41 31.3 1.3%
Commercial 952 0.10 0.20 0.30 0.40 11.4 3.5%
Total 1931 0.20 0.41 0.61 0.82 42.7 1.9%

57 ICCA Building Technology Roadmap
Phase I Key Messages With projected large net increases in residential and commercial building stock in the coming decades, it is critically important that associated GHG emissions be reduced by improving the energy efficiency of building envelopes. Chemically derived building products have a significant role to play in achieving substantial reductions in energy use and associated GHG emissions by improving the energy performance of new and existing buildings.
The primary goal of Phase I of this analysis was to quantify the potential energy and GHG savings achievable through use of chemically derived products in insulation, piping, air barriers, air sealing, cool roofing, and windows in the residential and commercial building sectors of Europe, Japan, and the U.S. High-level observations are also provided for three rapid growth countries: Brazil, China, and India. Key points from the Phase I analysis are summarized below.
Chapter 1:
The total amount of floor space in the residential and commercial sectors of Europe, Japan, and the U.S. is projected to increase from 59 billion square meters in 2000 to 93 billion square meters in 2050.
Single-family and multi-family stock will increase from 49 billion square meters in 2000 to 72 billion square meters in 2050, an increase of 47% in residential floor space.
Commercial floor space (healthcare, hotels, education, retail, office) in these regions is projected to more than double, from 10 billion square meters in 2000 to almost 21 billion square meters in 2050.
Of the total residential and commercial stock in Europe, Japan, and the U.S., the largest amounts of building stock are residential stock in cool regions of Europe (25% of total building floor area in 2050) followed by residential stock in warm regions of the U.S. (22% of 2050 total).
Chapter 2:
The highest energy intensity (energy use per square meter of floor space) in 2000 is for cool regions of Europe and the U.S. As building standards are tightened over time and existing stock is renovated, the energy intensity for buildings in these regions drops substantially and by 2030 is largely in line with energy intensities for building stock in Japan and warmer regions of Europe and the U.S.
Under the modest renovation rate scenario, by 2050 energy intensity for all regions is 37 to 71 % less than in 2000. Under the ambitious renovation rate scenario, energy intensity for all regions is reduced by 51 to 77% percent by 2050 compared to 2000 levels.
Chapter 3:
Chemically derived building products are dominant in some building product categories such as air barriers and air sealing materials. For cool roofing, the energy efficient properties of cool roof pigments and coatings can be attributed to their chemically derived content.
In other product categories such as insulation, pipe, and window frames, chemically derived products share the market with products that have little or no chemically derived content (e.g., fiberglass insulation, copper pipe, wood and aluminum frame windows). In these product categories chemically derived products have significant and growing market share, driven by their desirable properties and in some cases cost advantages over alternative materials.
Chapter 4:
For the projected growth in building stock in Europe, Japan, and the U.S. but without concurrent improvements to new and existing stock, GHG emissions would rise from 3,400 MtCO2e in 2000 to 5,200 MtCO2e in 2050.
Improvements in new stock alone are not enough to offset the net growth in stock. Although tightened standards for new construction would hold the increase in GHG to 300 MtCO2e from 2000 to 2050 –an increase of less than 10% while the amount of building floor space increases by almost 60% – this is still a net increase in building sector GHG emissions.
In order to achieve net reductions in building energy use and associated GHG emissions while building stock increases, the energy efficiency of the large existing stock of residential and commercial buildings must also be improved.

ICCA Building Technology Roadmap 58
Combining new building standards with a moderate rate of renovations to 2000 stock results in a 12% decrease in energy and GHG by 2050, while tighter new building standards combined with the ambitious renovation rate scenario results in a 23% reduction in energy use and GHG compared to 2000.
The largest potential for savings comes from European and U.S. residential buildings. Residential stock in Europe and the U.S. accounts for over 70% of the total residential and commercial floor space in Europe, Japan, and the U.S.
When improvements to the building envelope are combined with lower-carbon IEA ETP 2012 2DS fuel scenarios, the 12% reduction from baseline for the moderate renovation rate scenario increases to a 68% reduction from baseline, and the 23% reduction for the ambitious renovation rate scenario increases to a 73% reduction when compared to the 2000 baseline.
Across the product categories evaluated, the amount of GHG savings that can be attributed to the value chain for chemically derived building products (excluding windows) is 970 MtCO2e for the moderate renovation rate scenario and 1,113 MtCO2e for the ambitious renovation rate scenario.
Although not all of the savings for energy-efficient windows with plastic frames can be attributed to the chemically derived content of the window assembly, total savings for use of plastic-frame windows are substantial in residential building stock, adding 294 MtCO2e of GHG savings for the moderate renovation rate scenario and 349 MtCO2e savings for the ambitious rate scenario.
Of the three end use categories – heating, cooling, and water heating – most of the life cycle savings for Europe, Japan, and the U.S. are realized in space heating, including reductions in conductive heat loss from addition of insulation to walls and roofs, and improvements to airtightness of the building to reduce losses due to air infiltration.
Use phase savings for chemically derived building products are many times greater than the cradle-to-production energy and GHG impacts for making the products. Products installed in early years will continue to accrue use phase savings throughout their life in the building.
Chapter 5:
Residential and commercial building stock in Brazil, China, and India is projected to increase from 88 billion square meters of floor space in 2009 to 133 billion square meters by 2050.
Not only are large quantities of building stock being added in the high growth regions, but more of the new and existing stock will have services such as air conditioning, and the heating and cooling systems are likely to be more fully utilized to achieve better comfort levels for occupants as economic wealth increases.
With such rapid growth in floor space and use of services, it is critically important that new stock in these regions be built to high energy efficiency standards to minimize impacts on global building energy use and associated GHG emissions. This rapid growth in building stock could result in an 80 percent increase in energy use for building heating, cooling, and water heating if improvements are not made to the energy efficiency of the building stock and changes are not made in the fuels used.
Increased utilization of chemically-derived products will play a major role in minimizing the energy and GHG emissions for the growth in these regions.
o China is the high-growth region with the greatest potential for reducing heating impacts through greater use of insulation and energy-efficient windows. Plastic products’ share of insulation and windows in China is high and is growing. Therefore, plastic foam insulation and energy-efficient windows with plastic frames will make large contributions to the heating energy savings for building stock in China.
o In Brazil and India, cooling energy is a more important consideration. Cool roofing, which owes its reflective properties to chemically derived pigments and coatings, has the potential to make significant contributions to reductions in cooling energy in these regions.
Investments in the building sector are long-term infrastructure investments that will reap significant benefits over many years. To tap the savings potential, the right framework conditions have to be in place. Phase II of this roadmap report addresses barriers to implementation and opportunities to overcome barriers in order to achieve the savings projections.

59 ICCA Building Technology Roadmap
Phase II Overview
The chemical industry has played a key role in providing energy efficient building products that reduce energy consumption and associated GHG for the built environment. Phase I of this report demonstrated the contribution that chemically derived products can have to energy and GHG savings through 2050, under two scenarios with differing rates of renovation of the existing building stock. Moving forward, it is clear that chemically derived products will continue to be essential in achieving the low or zero emission buildings needed to mitigate global warming.
Despite the potential of chemically derived products to improve the energy efficiency of buildings and reduce GHG emissions, existing market barriers have preventing the widespread use of chemically based energy saving products. In order to realize significant energy and GHG savings in the building sector through the use of chemically based products, it is crucial that the challenges affecting the deployment and uptake of such technologies are addressed.
Phase II of this study considers the following:
What are the key challenges to deployment of chemically based technologies to achieve greater energy efficiency? (Chapter 6)
What technology developments need to occur to enable increased use, market penetration and market acceptance? (Chapter 7)
What strategic actions should be considered to support wider use and acceptance of appropriate technologies? (Chapter 8)
How can international collaboration support market penetration of technologies? (Chapter 9)
Prioritized actions for stakeholders are summarized in Phase II Key Messages.

ICCA Building Technology Roadmap 60
Chapter 6: Challenges to greater use of chemically derived building products
Overview
As part of this study, experts from several organizations linked to ICCA provided input on significant challenges that need to be addressed in order to achieve more widespread use of energy efficient building products. These challenges are relevant not only in the focus regions of this analysis (Europe, Japan, and the U.S.), but globally. The information gathered from stakeholders has been supplemented by a review of literature developed in recent years.
This chapter details some of the key challenges to wider use, market penetration and acceptance of the chemically based product groups outlined in Chapter 3. It is important to note that while there are a number of issues to be dealt with, there are also many corresponding opportunities for overcoming the aforementioned challenges. In this chapter, some specific opportunities are discussed alongside the challenges, while Chapters 7 to 9 specifically discuss potential solutions for addressing the various issues. The challenges and opportunities for deployment of chemically derived products can be grouped into six broad categories, as shown in Table 27.
Table 27. Summary of Challenges vs. Opportunities
Opportunities
Policy & Legislation
Incentives Building Codes Product LCA & Specification Guidelines
Investment Opportunities for New Technologies
Open up Markets for New
Technologies Financial Costs Up-front costs
Demonstrating ROI / payback
Information Availability
Knowledge gap
Negative perceptions
Technology Application
New technology
Difficulties in renovation
Incorporating products
Ease of use
Market Structures
New technologies
Value of energy efficiency
Paths of deployment
Behavior and Organizational Characteristics
Purchasing decisions
Product familiarity
Lifestyle choices Institutional and Administrative Challenges
Regulatory, planning and administrative systems
Multi-stakeholder issues Aesthetics and design
Challenges

61 ICCA Building Technology Roadmap
Financial costs
Up-front cost and return on investment: Upfront cost associated with energy efficiency upgrade can pose a barrier for building owners. Building owners can also be reluctant to commit to big investments when the associated return on investment will take place in future years. Commercial organizations typically have short time-frames for achieving payback on energy efficiency measures, typically on the order of one to three years. Therefore, products need to be able to demonstrate short payback periods and good return on investment in order for them to be installed on commercial properties.
Split Incentive Decision: A split incentive exists when a homeowner or business does not expect to hold a property for a long enough period of time to realize the full financial benefit of investing in energy-efficient building technologies. This issue is prevalent in both the commercial leasing market and in rental housing. A 2007 study suggested that as much as 50% of residential energy use in the USA is affected by a split incentive decision. (Prindle 2007).
Solutions / Opportunities:
Financial incentives (e.g. energy efficiency mortgage benefits, tax benefits, rebates, grants, energy incentives, etc.) for particular energy efficiency technologies can support the uptake of efficient building technologies in both retrofit and new construction.
Payback period does not reflect profitability. To calculate profitability the gains and costs over the entire lifetime of a product must be taken into account. For example, an investment could pay for itself after one year, but depreciate entirely at the end of that one year. On the other hand, another investment may pay back after a longer period, say 3 years, but last for a lifetime of 15 years. All else equal, the latter investment has a longer payback period, but is a more profitable investment. Assessment of profitability based solely on payback period can therefore be a misleading concept.
Information availability
Knowledge Gap: Consumers, vendors, manufacturers, banks and policy makers often have inadequate information about energy efficiency technologies and their benefits.
Negative perceptions of chemically based products, stemming from general lack of widespread knowledge regarding the energy efficiency benefit from use of building products weighed against the environmental impacts for producing the products, can pose a challenge to greater adoption of energy efficient technologies.
Solutions / Opportunities:
Help consumers make more informed decisions by providing information that reassures them that new technologies are proven and reliable, making readily available life cycle studies on the relative impacts and benefits of chemically derived products, and ensuring intermediaries (i.e. contractors) are informed of the benefits derived from energy efficient products.
Centralized websites can be used as clearinghouses for information on best practices and new technologies. For example, the BUILD UP initiative was established by the European Commission in 2009 to assist EU Member States in implementing the Energy Performance of Buildings Directive. The website shares collective intelligence developed in member countries, allowing transfer of knowledge, tools, and resources.
Technology application
Uncertainty regarding technology performance of products can pose a challenge to the development and market uptake of energy efficient building products.
The perception that new, better and more cost-effective technologies will be available in the future may influence consumers’ choice and timing of purchasing and installing energy efficient technologies.

ICCA Building Technology Roadmap 62
Renovation issues, such as the loss of internal space when insulating walls internally or a lack of space for external wall insulation, can present a challenge to the uptake of energy efficient building products.
Incorporating products in a partial renovation can pose technical difficulties.
Lack of technical knowhow by installers and contractors can pose a challenge to the deployment of high efficiency products.
Buildings need to be viewed in the context of a holistic system. It is not well understood by consumers and contractors that proper installation of insulation can result in downsizing heating and cooling equipment, thus providing a multitude of savings (e.g. financial, installation, etc.).
Solutions / Opportunities:
Efficiency derived from buildings technology products need to be translated into costs or savings for consumers and/or society.
Proper education of trade contractors is required to ensure that there is an understanding of building energy requirements and that correct technical solutions are selected.
Low energy, near zero emission buildings and passive houses demonstrate the holistic approach and serve as examples for new built as well as renovated structures. Others can use and adapt for future construction projects in other regions.
Market structures
Building codes must cover new technologies. If a technology is not addressed in codes, or offers benefits that codes do not recognize, it is difficult to get the technology into a market. For example, this is true of passive solar design, which is currently not recognized by evaluation programs used to underpin building regulations and environmental assessment systems, such as Building Research Establishment Environmental Assessment Method (BREEAM), Leadership in Energy and Environmental Design (LEED), Green Globes, and others.
Markets need to properly value energy efficiency. Cheaper, less energy efficient buildings often lead to higher overall cost, when taking energy cost into account. It is also unusual to find commercial organizations that attach a true value to reducing carbon emissions. ICCA supports global and regional efforts to address rising CO2 emissions, including appropriate price signals to the market.
The path of deployment / route to market (existing vs. new channels) is very important for getting a new product out into the marketplace and taken up by consumers. If channels already exist it is much easier to get the product out into the market.
Solutions / Opportunities:
Collaboration with governments and organizations can help to ensure that benefits of chemically-derived products, particularly newer technologies, are properly appreciated, valued and, where relevant, incorporated into building codes.
Need for greater transparency on the energy efficiency standard of structures (building/house).
Behavior and organizational characteristics
Competing purchasing decisions: When investing in a new home, consumers with limited budgets may prefer to spend more on up-front purchases such as furniture, appliances, etc., rather than items which may reduce longer term energy costs. Additionally, lifestyle choices, such as space design, service provision, comfort levels etc., often override energy efficiency decisions. This type of behavior is also seen in the construction sector when budgets are tight, where developers are likely to focus on reducing up-front construction costs rather than investing in energy efficient products that will have benefits in the long term. Some see this obstacle as an issue related to awareness, while others deal with it separately as a financial issue.

63 ICCA Building Technology Roadmap
Familiarity with products: Individuals and contractors tend to be most inclined to select products that they are most familiar with. At the building level, if contractors are not familiar with a technology they may not use it or may not install it correctly. They are unlikely to undertake innovative work and installations without precedent. Similarly, at the design level, if architects and engineers are not familiar with the potential and properties and benefits of chemically derived products they are less likely to consider using them.
Solutions / Opportunities:
Training and educating designers, specifiers and developers of the benefits of energy savings technologies, and encouraging behavior change, is vital.
Incentives for early adopters of energy efficiency building technologies can promote wider commercialization of new technologies that are competing with mature technologies.
Institutional and administrative challenges
Regulatory and planning: Conflicts between regulations must be identified and addressed, to avoid confusion, ambiguity, fragmentation of policy, delay and gaps in regulatory action of public planning. All of these can impact significantly upon the drive and ambition to adopt energy efficiency in buildings.
Institutional: In association with the above, administrative systems must be simplified. Complex administrative systems surrounding planning policy and permits can be off-putting for investment in construction or renovation programs that go beyond the norm and utilize high efficiency or new “risky” technology.
Multi-stakeholder issues: Both of the above issues can be exacerbated where there are multiple owners and/or occupiers of buildings. If ownership and responsibility are not clear, it can be challenging to agree on energy saving investments. For example, in Slovenia there is scattered ownership in apartment buildings (with privatization only taking place in the 1990s) and there must be a 75% consensus in multi-owned buildings for undertaking technical improvements.
Aesthetics and design of products can also affect the uptake of particular products. For example, the historical and environmental preservation of some buildings can hinder the adoption of certain technologies. However, this is being overcome through innovative design to reduce the negative aesthetic aspects. It is also likely to be an issue only in specific regions, and the absolute number of historic buildings globally is relatively low.
Specific issues relevant to chemically derived products
In addition to the above issues faced by all energy efficiency technologies, there are a number of product specific barriers that need to be addressed to accelerate use, acceptance and market penetration of chemically derived products. The following are some examples highlighting issues that are relevant to chemically derived products, based on their properties or their dominance in certain end uses:
Increasing temperatures in some climate zones are leading to changes in the balance between heating and cooling needs. This shift may impact the necessary levels of insulation and use of particular chemically derived technologies. It is therefore important to have a clear understanding of how insulation levels and building function will respond to changing climates, and how the heating and cooling requirements will change. Such changes may also offer opportunities for chemically-derived products, such as phase-change or responsive materials. In order to capitalize on these opportunities, further R&D will be required, together with a better understanding of climate change mitigation needs.
Building airtightness, which is largely achieved through use of chemically derived products, is increasingly important. Building standards such as BREEAM and Passivhaus, which go beyond national level building regulations, are increasingly focused on the airtightness of the building envelope. Achieving high levels of airtightness typically requires construction practices to be extremely regulated and monitored on site, or delivered through off-site construction. Proper construction and product application techniques are key to air sealing and reducing thermal bridging. Trained installers are needed to achieve stated performance of products.

ICCA Building Technology Roadmap 64
Within construction there is a growing focus on the use of natural and recycled fibers in insulation materials, intended to support an overall lower life cycle footprint. However, studies showing that these materials are more sustainable in the final application are missing. It is important that chemically derived products are not disadvantaged by perception rather than science, e.g. by taking decisions focused only on the carbon footprint for producing the product. Differences in the relative performance of products during the use phase must be taken into account in order to support decisions that will result in a lower carbon footprint over the full life cycle of the product.
Material interactions that are not fully understood or accounted for in the design process can complicate the quantification of product benefits. For example, reflective roof coatings can reduce internal building temperatures by reflecting the sun’s rays away from roof surfaces, reducing heat absorption and thus reducing internal cooling loads. However, in winter the coatings could adversely impact heating requirements, not only within the internal building, but also in other buildings through the wider urban heat island effect13 in built up areas. Overall, the technology could create a cooler overall environment. Similarly, the use of window film coatings can reduce solar glare and cooling requirements but can also reduce natural light transmission and increase the use of internal lighting. Further modeling and understanding of these interactions is required to provide clear, unequivocal benefits from product installation.
Rating systems and non-consensus based standards that become “pseudo-standards” often vary from region to region. These are different from building codes but are popular from a marketing perspective. A clear distinction between building code requirements and “green building initiatives” is important for each region to deal with. In some cases, “green” programs may exhibit bias against specific products or materials based on unsupported concerns about toxicity issues, or may favor materials based on single attributes such as recycled content, without considering whether these products have holistic production or use phase benefits compared to alternative products. Depending on the criteria used, “green” rating systems can be unfavorable to chemically derived products. Industry needs to ensure that performance data with a life cycle assessment basis is facilitated throughout the products of chemistry value chain from cradle to end-product and that accurate cost/performance data for delivering, installing, and maintaining products is publically available through credible third parties. While use phase savings for chemically-derived products will vary depending on the specific building in which they are used, use phase information for representative building applications must be included in holistic evaluations of building products in order to illustrate and communicate the savings achieved through use of the products.
Conclusions
While there are barriers that can inhibit the use, market penetration and market acceptance of chemically derived products, there are a number of actions that can help to overcome such barriers. Chapters 7 and 8 discuss these actions, while Chapter 9 tackles the importance of collaborating to achieve GHG reduction goals and maximize the chemical industry’s continuing contribution in this area.
13 As urban areas develop, changes occur in their landscape. Buildings, roads, and other infrastructure replace open land and vegetation. Surfaces that were once permeable and moist become impermeable and dry. These changes cause urban regions to become warmer than their rural surroundings, forming an "island" of higher temperatures in the landscape – source: U.S. EPA.

65 ICCA Building Technology Roadmap
Chapter 7: Technology development
Overview
State-of-the-art zero or near zero emission buildings and passive buildings have been constructed or achieved by renovation of existing structures in various regions around the world, including China, Germany, Japan, the U.S., Singapore, and other locations. These buildings serve as models that architects, builders, and consumers can utilize and adapt, as needed, to meet requirements for specific building applications in different geographic regions. These example buildings utilize established chemically derived product technologies addressed in Phase I of this report. Some of them also use emerging technologies.
This section focuses on research, development and demonstration (RD&D) needs and opportunities to further improve already existing solutions and overcome the barriers identified in Chapter 6. These areas can help chemically derived products achieve their full potential in contributing to reductions in energy use and GHG emissions from the building sector.
Innovative technologies can fail in the marketplace based on one or more of the following key issues:
New technologies take too long to get to market or there is a shift in needs while the technology is in development/testing. This can mean that by the time the technology gets to market, it is no longer relevant or no longer solves the customer need that it was intended to meet;
RD&D efforts are underfunded, which can mean new technologies take longer to get to market or are not developed to their full potential;
New technologies are poorly launched, which can lead to funders and customers not realizing the full potential;
New technologies may require too much work to get them to the stage where they are ready to adopt, which can discourage developers and funders from investing in them.
Figure1 illustrates the common process by which innovative technologies move from the exploratory phase through development and eventually to market. Innovations fail if they are not adequately supported through the negative cash-flow phases. Support from the public sector and then direct investment in the product is required to bridge the gap until an innovation becomes marketable and ultimately profitable.
Figure 41: The Path from Innovation and Research to Market
Source: U.S. Department of Energy (2008) Carbon Lock-In: Barriers to Deploying Climate Change Mitigation Technologies
If initial basic research indicates that an innovative technology has promise, further investment and testing is normally required to determine whether the technology can be commercialized. At this early stage, technology

ICCA Building Technology Roadmap 66
developers are not in a position to project a return on investment, as there are still many uncertainties around costs of commercial production and long-term performance issues. Innovation institutes play an important role here, but practical limits on financial and staffing resources generally mean they are unable to develop all technologies that become available at the research stage. Instead, further RD&D efforts tend to be focused on technologies that show the most promise within an organization’s specific realm of expertise.
The following perspectives about the priority RD&D needs have therefore been assessed for each of the product groups:
The current “state of the art” in technology and knowledge; A description of any RD&D needs; What key knowledge and/or technology advancements are required; What impacts on society can be used to justify funding.
All opportunities, including opportunities for innovation, are time related. Therefore, the potential window of opportunity for each RD&D need must be considered. To be successful, innovative technologies must be brought from concept to production within the time frame required to meet the need in the marketplace.
RD&D requirements for each product group
The energy and GHG savings projections developed earlier in this report are based on established, commercially available products. In addition to these existing technologies, significant additional improvements can be expected in the future with increased RD&D efforts, particularly in terms of optimizing products for a wider range of applications. These improvements are needed to achieve the energy savings and CO2 emissions reductions from the built environment envisioned in the IEA roadmap.
In addition to energy and GHG savings, RD&D can result in cost reductions, such as greater efficiencies in the production process or savings from more efficient installation. However, this is limited due to the large share of working cost when applying these products. If installations can be made more efficient, particularly retrofits which are often labor-intensive, there may be reductions in the labor required to carry out projects. The following sections discuss trends in product development for the five technology groups included in this analysis:
Insulation Pipe and Pipe Insulation Reflective Roof Coverings and Pigments Air Sealing Windows
A table summarizing the RD&D status of emerging technologies for each of these product categories is provided in Annex III.
Insulation
Space heating and cooling accounts for approximately 60% of the energy use of most buildings.14 Reduction of heat loss reduces energy demand for space heating and cooling within the building. Households living in fuel poverty (i.e. unable to afford to maintain a comfortable living temperature without sacrificing another basic need) will benefit directly from improved insulation. This could have additional benefits, such as improved occupant health and corresponding reductions in healthcare costs to society, although such benefits would be more difficult to quantify.
The state of the market for new insulation products varies widely according to the type of insulation under consideration. Plastic foam insulations such as EPS, XPS, polyisocyanurate, and spray polyurethane are well
14 IEA quoted in IEC July 2012 states 75% including domestic water heating
67 ICCA Building Technology Roadmap
established products which are widely in use, while other chemically derived insulation types such as aerogels and vacuum insulated panels (VIPs) are not yet fully developed.
For all technologies, advancement is required in in-situ long-term testing, to ascertain if there is degradation in performance over time. However, there is already a lot of experience from early lighthouse projects and studies from regions where these materials first came into the market. For EPS foams long-term experience already exists, as these products have been in use since the 1970s.
Proper installation is an important issue with insulation and cladding. There is a risk of damage to buildings if products are incorrectly applied, and certain products require special handling. This is a consideration with RD&D of new insulation and cladding products, as the installation considerations for emerging products may differ from conventional products with which installers are currently familiar. Therefore, the demonstration phase should include educating installers, site managers and ultimately occupants on the correct use of new products. The need for better quality management during the installation process needs to be checked.
With climate change, high relative humidity rates and prolonged periods of heavy rain are expected to become more common in some regions, and the incidence of flooding has increased recently in some countries. As development on flood plains becomes more common, the use of flood resilient construction will increase so that buildings will stand up to the effects of climate change. This represents an opportunity for chemically derived products that are resistant to the effect of water, such as rigid foams. RD&D is needed to demonstrate the savings from using these resilient products and avoiding costs of replacing mineral wool and other non-chemical forms of insulation after flooding events.
Pipe and pipe insulation
Reduced heat loss from pipes has the potential to reduce energy use for hot water provision in both residential and non-residential buildings. If pipes with low thermal conductivity are used and/or effective pipe insulation is applied, heat loss from water sitting in the pipes between uses will be reduced, and desired temperatures will be attained at the outlet much more quickly for the next hot water use. Not only does this reduce energy demand for water heating, but water use is also reduced because less cooled water will need to be purged.
Although is it clear that reduced heat transfer through pipe walls saves energy, to date there has not been extensive research on the savings available from improved pipe insulation across a wide variety of building layouts. As a result, rules of thumb are commonly used for estimating savings. Further research is required to establish savings for a greater variety of locations and types of building uses. The configuration of the hot water distribution system is also an important factor, so research needs to be sufficiently widespread to take these major variables into account and produce statistically reliable results. Information on energy savings for a wider variety of building applications will provide more motivation for use of plastic pipe and pipe insulation.
It is important that pipe insulation maintain its properties throughout the life of the building. While pipe insulation saves energy, as demonstrated in Phase I, most hot water distribution pipe is installed in inaccessible locations (e.g., inside walls) and cannot easily be replaced. Therefore, it is important that the pipe insulation last throughout the life of the piping system. Better information on savings from reducing heat loss through pipe walls will provide an incentive to the market to fund RD&D into insulations that have better longevity.
Reflective roof coatings and pigments
Reflective roofing products can be used to achieve reductions in space cooling demand in buildings where there are space constraints, or where the layout or expected life of buildings prevents application of more conventional insulation products. Better savings in this product group are achieved in larger commercial buildings. The opportunity to reduce the heat island effect is a promising application of this technology, and this may be an effective way to justify further research in this area. (Energy calculations in Phase I were conducted on the basis of individual buildings and did not account for heat island effects.)
Additional RD&D is needed for developing roofing technologies such as hydrophobic materials and thermochromic roofing. Some companies are researching technologies to improve the long-term resistance to dirt pickup and microbial growth on white elastomeric roof coatings. Work is underway in Brazil to develop markets for PVC roof tiles as a replacement for cement or ceramic roof tiles. The PVC tiles have lower thermal conductivity and can be made in light colors that will reflect heat, resulting in a more comfortable environment inside the building while reducing the need for air conditioning.

ICCA Building Technology Roadmap 68
The U.S. DOE estimates that replacing or resurfacing conventional roofing materials with improved reflective elastomeric roof coatings can reduce a commercial building’s annual air conditioning energy use by up to 25%. More widely, the potential impact of reflective coatings on the heat island effect in cities has yet to be determined in all relevant climates. RD&D in this area would remove the uncertainty over the impact of reflective coatings on reducing this effect and ultimately strengthen the case for their widespread introduction.
Phase change materials
Further R&D is ongoing - notably in the arena of phase change materials. Phase change materials are those that undergo a phase change transition from solid to liquid and liquid to solid in order to absorb or release large amounts of latent heat at a relatively constant temperature.
Air tightness
Air tightness is achieved in buildings through the use of two main product types – house wrap and sealants. House wrap is primarily used in new construction, particularly timber frame, in order to provide the basis for an effective air seal around the entire building. For masonry buildings, liquid applied air barriers may be used. Air sealing materials are needed to reduce air infiltration and exfiltration through penetrations in the sealed surfaces (e.g., around windows and doors), and at junctions between thermal elements (walls, roof and floors). Sealants play an important role in achieving the air tightness required by modern regulations for new buildings, as well as in retrofit applications, particularly in cases where no house wrap was used, where junctions between thermal elements were not properly sealed, and where materials with differing rates of thermal expansion and contraction were installed adjacent to each other.
Sealants
Draft proofing is one of the most cost-effective ways to reduce heat loss from buildings. Materials are inexpensive, and no significant building envelope material needs to be replaced. In many cases more heat is lost through gaps around windows and doors than through the windows and doors themselves. A variety of products can be used to seal air gaps and reduce air leaks and infiltration, all of which are currently in commercial production.
Over time, sealants can break down due to the impact of extreme weather and to the differing rates of thermal expansion and contraction of different materials and therefore periodic replacement is required. Research could help identify unknown lifespan of existing materials and aid development of new low impact materials with a longer lifespan. This could be of particular benefit for inaccessible areas of the building where sealants are used to achieve air tightness. Such benefits apply mainly to the retrofit sector, as in new buildings the aim should be to design out the need for any building elements with limited lifespan.
As insulation improves, air tightness becomes increasingly important as a potential source of heat loss, so the role of weather-stripping, caulks and sealants becomes critical to overall building performance. Quantified effects of sealing various types of existing buildings can be measured by the blower door test. The results show that much depends on the quality of workmanship. A wider use of this test should be promoted to assure quality of the installation.
Indoor air quality issues must also be considered, as these can be affected by reductions in uncontrolled ventilation. At present, the perception that air tightness can lead to “stuffy” buildings (i.e. with poor indoor air quality) can hamper attempts to develop this market further Collaboration with other industries offering air-changing systems is required. The use of heat recovery on controlled ventilation systems further increases the importance of draft proofing to eliminate uncontrolled ventilation.
Wall air barriers: building wrap and fluid-applied barriers
Building wrap is widely used as an air barrier on frame buildings, while fluid applied barriers are often used on masonry buildings. The primary function of these barriers is to prevent water ingress, though it also has the effect of reducing air ingress. Technologies used for building wrap are currently all commercially available.
There is at present a lack of agreement on the importance of vapor permeability. In theory, if a wall cavity gets wet, a wrap should be sufficiently vapor permeable to allow the wall materials to dry out. At the same time, building wrap needs to prevent water vapor from being driven into a wall. Material that has one-way permeability (allowing water vapor out but not in) has not yet been developed. A further complication arises due to changing

69 ICCA Building Technology Roadmap
functions during different seasons - high vapor permeability is desirable during cold winter weather, but not during hot, humid weather, when the action of the sun on saturated siding can cause vapor penetration.
As noted above, one function of impermeable membranes is to prevent water vapor from being driven into the wall. This is particularly important for buildings that use forms of insulation that lose insulative properties when it becomes wet. By contrast, foam insulation retains its both structural integrity and its insulative properties even after becoming wet. Further research is required into the effectiveness of different types of building wrap in preventing non-chemical insulation from becoming wet – bearing in mind that water vapor can be driven in from inside or outside the walls. If the question of vapor permeability can be resolved for different types of structures, the barriers to wider deployment of vapor impermeable (closed) wraps can be reduced, and the effect of building wrap in terms of reducing heat loss could be increased, leading to a stronger justification for its use.
Windows
Window technology has evolved rapidly in recent years. Triple-glazed windows with insulating frames minimize energy losses through the window. A large manufacturer of window and door products recently partnered with DOE under the Recovery Act to develop a thermally optimized frame design, with enhanced frame cavities and wider thermal breaks. High performance insulating frames together with high performance glazing can produce windows with composite R-values that approach R-values of (older) walls. Currently, super-insulated windows are available, but the premium price acts as a challenge to their wider deployment. Further research may find ways of reducing these costs, or educating consumers on the additional benefits of these windows could help overcome this challenge.
“Smart window” technologies that enable windows to change their physical state to respond or react to changes in heat and light incidence are in various stages of development. Smart window technologies include:
Electrochromic – windows that use electrical energy to switch between clear and darkened states to control light and heat gain
Thermochromic – in response to heat, glazing changes from clear to diffused or white and reflective, reducing the transmission of solar heat. Changes in opacity may limit suitability to use in applications such as skylights rather than view windows.
Photochromic – glazing tint changes in response to light (similar to photosensitive eyeglass lenses)
More RD&D is needed for photochromic glazing; thermochromic and electrochromic glass are only at demonstration stage. There are durability and cost issues to be resolved, as well as cosmetic issues – it is essential that the technology does not adversely affect transparency/clarity of viewing panes.
The development and use of reactive films in glazing will be particularly valuable in highly glazed buildings in warm climates – as they have the potential to deliver a significant reduction in cooling load. If climate change does indeed lead to higher temperatures and more extreme weather events, reactive building elements – especially windows – will become increasingly important.
Other opportunities for RD&D
In this section, a number of issues are discussed that apply to chemically-derived products in general, rather than falling under the specific product categories considered in the previous sections.
Durability is an advantage of plastic products, particularly in end uses such as building products that need to last a long time without degradation of performance and appearance. Currently, it is difficult to use durability as a competitive advantage, since there are no durability requirements in building codes, nor is there a standard system for measuring and reporting durability. If research can demonstrate the failure or relatively faster deterioration of non-chemically derived products then this will strengthen the case for use of chemically-derived products. Life cycle analysis can show the benefits, including production as well as the use phase and recycling impacts. LCAs can also give valuable information when comparing non-renewable hydrocarbon resources as a material feedstock for resin production to biomass feedstocks. Biomass feedstock is being used to develop new polymers (although none are currently available with the properties needed for building applications). However, to evaluate sustainability, not only ecologic but also economic and social criteria have to be taken into account.
Non-reinforced plastics have less structural strength compared to some other construction materials, which can limit use of plastic in some applications such as frames for very large windows. Strength can be improved by using reinforcing materials or composites.

ICCA Building Technology Roadmap 70
Renovation of commercial buildings is an area with huge potential but significant challenges in implementation. Further research is needed on a whole-building basis to understand how to make renovation easier and more cost effective. This research needs to be widespread in terms of building types and locations. Research into the environmental impact of carrying out retrofits at the community rather than at a building level may also find that larger projects are more cost-effective, thereby increasing demand for all types of chemically-derived building products. The whole building strategy also requires a more rigorous systems approach, as the retrofit of one component has to follow a holistic plan, e.g. installing new windows together with wall insulation. There may be a role for chemically-derived products in delivering renovation products and processes that minimize disruption to buildings and their occupants. As retrofit expands, it is clearly necessary to develop retrofit products and processes that are minimally disruptive – that do not require occupants to move out during the retrofit process. An example would be use of reflective window films that can be applied to existing window glazing to reduce heat gain, as opposed to removal and replacement of windows.
Main factors influencing getting new technologies into commercial production and use Research, Development Funding
One of the primary factors influencing the commercialization of new technologies is cost. In the present economic environment there are RD&D funding constraints in both the public and private sectors, and it is possible that this situation will remain for some time. An important first step, therefore, is to ensure that current RD&D funding is being spent wisely and effectively. It is critical that funding priorities are aligned with building sector goals to allow focus on development of the products with the most potential to achieve significant energy and GHG reductions. Continuity of support is also vitally important with RD&D, so that development efforts are not interrupted or cancelled once they are underway. It is therefore imperative that there is consensus between stakeholders as to which sectors and technology developments should be financed. The findings within Phase I of this study will provide impetus for this.
The development costs for state-of-the-art products often lead to higher initial costs for consumers, and this could limit willingness to buy and install such products. All new technologies begin with limited production and therefore face the barrier of coming to market before economies of scale have been achieved. However, there are a number of ways in which these challenges could be addressed:
Firstly, tighter regulations, codes and standards will drive demand for better-performing products. It is worth noting that local (often state) level regulations may be easier and quicker to influence than national regulations. However, harmonized standards over larger regions minimize work needed that products are compliant with a certain standard.
Secondly, more widespread use of performance-based codes will encourage innovation and the introduction of state-of-the-art products.
Thirdly, it is critically important to educate designers and specifiers about new products and their value in delivering energy-efficient buildings. For developers and owners of buildings being refurbished, better information on payback will help to overcome barriers of relatively increased costs of installation compared to conventional technologies.
Lastly, government incentives for purchasing high-performing products will not only reduce the upfront cost of new technologies but will also serve as an effective endorsement in the marketplace.
Material supply issues
The issue of material supply may be worldwide or regional. In some global regions, materials needed for state-of-the-art products may not be available or may be in limited supply. To limit the environmental impact of the production and installation of new technologies, it is most efficient for them to be used near the point at which they are sourced and manufactured. If only a small component needs to be sourced from distance, the marginal impact of this one component will be limited as a percentage of the overall product impact.
Commercial risks
There are several commercial risks arising from being first to market with any new technology. If products do not perform as expected, the producer may be held liable for underperformance and implementation of measures needed to correct the problem. The performance of new technologies in conjunction with other building components can also be difficult to anticipate or assess at an early stage. The potential for unexpected consequences can only be reduced by sufficiently extensive research, and spread of knowledge of already existing

71 ICCA Building Technology Roadmap
examples, but this increases costs. However, the costs of correcting problems experienced after installation could be significantly higher, so this should be used as a justification for very thorough research before new products come to market. These commercial risks can be reduced to an extent by the introduction of tax incentives which would provide immediate guaranteed incentive, as opposed to relying on codes and regulations to drive demand.
Education and communication
At present, consumers may not have knowledge of the full extent of product options that are available to choose from when they are building or retrofitting a building. To address this, both manufacturers and governments should generate more information needed to communicate to the public the balance of impacts versus benefits for new products, ensuring that the information is provided in a format which is specifically designed for the target audience. At the same time, it is necessary to develop ways to communicate energy results more meaningfully. For example, expressing home energy use as a total amount of energy units (e.g., MJ or kWh per year for the entire home) may show that a larger home uses substantially more energy than a smaller one but does not allow a consumer to compare the energy efficiency of the two sizes of homes directly. Expressing building energy use on a common basis such as MJ/m2/year makes it easier for the public to understand and compare the energy efficiency of different sizes and types of buildings, in the same way that miles per gallon ratings can be used to compare the fuel economy of different types and sizes of personal vehicles.
It may also be necessary to find ways to make energy savings more appealing to consumers who are often more willing to pay extra for cosmetic features, rather than energy efficiency features. The wider use of IT technology may also help to demonstrate the energy benefits of new products in real-time. For example, reactive windows could be a good example of this. Training and education of contractors and installers is also essential to overcome barriers to the commercialization of new products.
Consumer priorities
Some consumers (e.g., those with more economic wealth) tend to be more concerned with personal issues such as indoor comfort and indoor air quality rather than building energy and GHG savings. This barrier is gradually being addressed as the importance of energy efficiency climbs up the social and environmental agenda. More importantly, consumers are becoming increasingly aware of LCA considerations for a broad range of products. To address this, LCA should be included in the design process to make people better understand the benefits.
Conclusions
The key conclusions for research and development to increase the use of chemically-derived products designed to reduce GHG emissions may be summarized as follows:
Alignment of funding priorities with sector goals is needed to assure continuity of RD&D support and ensure that RD&D efforts are focused on achieving maximum potential in meeting the intended goals.
Long-term in-situ testing of product performance will establish long-term benefits and identify any degradation issues. Experiences from regions with a longer history of application of such products should share their knowledge.
Additional research to quantify heat loss from uninsulated pipework for a wider variety of building applications will provide a better basis for motivating increased use of plastic pipe and pipe insulation.
Further research is required to fully understand and quantify the net benefits of cool roofs, including heating/cooling tradeoffs and understanding the effect of reflective roof materials in reducing urban heat islands.
Clear and consistent guidance is needed regarding proper use and deployment benefits of air barrier materials, while ensuring at the same time that vapor permeability issues are properly addressed.
Further research in photochromic, thermochromic and electrochromic glazing is needed to develop products that are both durable and fully transparent.
In a wider sense, a better sharing of knowledge of the benefits of whole building retrofit and a better understanding of the interaction between materials would be beneficial. In addition, understanding whole building systems and investigating options for efficient, low-impact renovation would significantly expand the retrofit market. Many existing lighthouse projects which can be checked for their performance today can provide a good database. The chemical industry can further lead by example by ensuring that their own corporate buildings

ICCA Building Technology Roadmap 72
are constructed or renovated to the highest energy efficiency standards using chemically-derived building products.
New technologies are not always a good fit across all regions; differences in geographic and climate regions may drive development of product configurations or material sourcing that is appropriate for different regions.
To speed commercialization of new products, commercial risks need to be addressed, and more imaginative approaches are required to overcome cost constraints. Education is essential – it is necessary to educate clients, designers, contractors and installers about new products to break down barriers to their wider deployment.

73 ICCA Building Technology Roadmap
Chapter 8: Strategic goals and actions to energy efficient building technology policy
Overview
This section reviews the potential regulatory mechanisms and other national policies15 that could facilitate the deployment of energy efficient building envelope technologies that will help achieve zero or low-emission buildings. Some policies and regulatory mechanisms are tailored for new buildings (e.g. design standards and building codes), while others are targeting retrofitting of existing buildings (e.g. supplier obligations and grant schemes, mandatory obligations for renovation). The actions outlined in this chapter will drive greater use of all types of energy efficient building products leading to greater reductions in building energy use and associated GHG emissions.
The following broad categories are addressed in this chapter:
Policy processes, regulatory instruments and voluntary agreements Public investment Education and outreach Financial incentives and subsidies
For each of the aforementioned categories the existing regulatory setup has been summarized, and the opportunities for strengthening and expanding existing policy measures to provide greater incentives for energy efficiency and GHG reduction are considered.
Policy processes
In recent years, there has been a wide range of policy and programmatic activity in Europe, Japan and the U.S. to address energy efficiency in existing buildings. The level of interest in improving building energy performance are driven by general concern over global climate change, concerns over energy supply, societal concerns regarding energy efficiency, and significant technological advances in building envelope technology. A robust mix of efficiency program and policies, and accelerating interest in new technologies will generate the greatest level of efficiency improvements in the buildings sector.
Policy positions must be consistent and stable in the face of changing short-term fiscal or political priorities. Strong policy coordination based upon robust evidence will play a key role in overcoming the limited planning horizon and funding commitments of many consumers and industry players.
Because there are numerous stakeholders in the building sector, with various agendas and priorities, policies and regulatory instruments need to be both broad (in order to tackle all the barriers) and deep (in order to ensure that challenges are effectively addressed). Stakeholder involvement and consensus building should be prioritized by national governments.
It is also necessary to identify and address existing policies and/or regulations that may inhibit the acceptance and use of chemically-derived products. As has been discussed previously, the chemical industry should take a leading role in providing reliable information to overcome any negative perceptions surrounding the production, use and disposal of their products.
Local legislation can drive improvement, as in the case of the City of Frankfurt, where building legislation contains a requirement for new houses built on city grounds to meet passive house standards. This led local architects to increase their knowledge on passive house building technologies. As a result, more architects are now able to build passive houses.
15
International efforts are addressed in a separate chapter.

ICCA Building Technology Roadmap 74
Example of Effective Regulatory and Voluntary Instruments
The European Commission Energy Performance of Buildings Directive (EPBD) is a key policy mechanism for improving the energy efficiency of new and existing building stock in the European Union Member States, along with the national policies that flow from it around building codes and zero carbon buildings. The EPBD requires that all new buildings be nearly zero-energy buildings by 2020.
A first set of standards to support the EPBD was issued by the European Committee for Standardization (CEN) in 2007-2008. Consistent European standards are needed to achieve comparable and objective energy performance evaluations and avoid costly and inefficient development of separate standards by individual Member States, while at the same time flexibility is needed to allow for national and regional differentiation. Work to prepare a second generation of CEN standards to meet these needs is now underway.
Additional impetus for renovation of the building stock is given by the agreement on the Energy Efficiency Directive 2012. It requires member states to establish a long-term strategy for mobilizing investment in the renovation of the national stock of residential and commercial buildings, both public and private. This strategy encompasses an overview of the national building stock based, as appropriate, on a suite of actions, including statistical sampling and identification of cost effective approaches to renovations relevant to the building type and climatic zone. In addition, policies and measures to stimulate cost-effective deep renovations of buildings, including staged deep renovations, and a forward-looking perspective to guide investment decisions of individuals, the construction industry and financial institutions are included, as well as an evidence-based estimate of expected energy savings and wider benefits.
Voluntary agreements
In addition to regulatory requirements, several voluntary environmental assessment rating systems are in use in various global regions, and new systems are emerging. LEED, Green Globes, BREEAM and the German DGNB label are examples of existing systems. ASHRAE 189.1 and the International Green Construction Code (IGCC) are recent new standards and codes respectively. These often require minimum standards of energy efficiency and procurement of “environmentally friendly” products.
Public investment
The public sector is now acutely aware of the environmental and financial benefits derived from energy efficient buildings. In recent years, the public sector has invested significant resources to expand the knowledge base regarding energy efficient buildings. In addition, the public sector is promoting both voluntary initiatives and codes and standard that support their environmental and financial objective. Despite the public sector’s efforts to promote energy efficiency, more still needs to be done. For example, an important policy opportunity exists in public procurement policy, with the public sector leading the way by ensuring that policies are in place to mandate the specification and procurement of high-efficiency products. The use of publically funded buildings as exemplars to demonstrate best practice could be another route.
Education and outreach
As awareness of global warming issues increases, the role of education and outreach to all members of the community will be critical in driving consumer demand for energy-efficient buildings. Ensuring all market actors (government, contractors, and consumers, etc.) have access to a wide variety of information to support purchasing decisions that optimize their overall cost and energy savings is vital. Buildings constructed to zero or near zero energy standards serve as proof that ambitious targets are achievable. Successful examples from around the world include: the “3-liter house” in Germany, the Zero Energy Building (ZEB) in Singapore, and various examples from the Passive House Institute, to name a few.
A“3-liter house” requires only 3 liters or less of heating oil per square meter of floor space per year, compared to older average apartment buildings that use 20+ liters per square meter per year. The “3-liter house” uses a combination of features including chemically-derived insulation panels, triple-glazed windows with inert gas fill, and use of solar energy for water heating and electricity generation. Similarly, the Singapore ZEB uses photovoltaic panels, devices that fully utilize natural lighting, low-e glass and shading devices, among other features. Advanced chemistry and material science play a key role in the ZEB building in roof, wall, and floor materials, photovoltaic systems, window coatings, etc.

75 ICCA Building Technology Roadmap
The Passive House Institute website contains technical guidance on many types of passive buildings, including office buildings, retail stores, schools, gymnasiums, and more, as well as guidance for passive houses in different climate zones and retrofits. Another excellent centralized source of information mentioned previously is BUILD UP, the European web portal for energy efficiency in buildings, where a wide variety of informational resources are available, including case studies, tools, energy efficiency news and events, publications and links for national and international legislation, etc. The U.S. DOE’s Energy Efficiency and Renewable Energy website also serves as a good central location for information about energy efficiency in buildings, with sections on technologies, programs and initiatives, case studies, and links to other information resources for homes and commercial buildings.
Financial
Renovation of existing building stock is one of the lowest cost options to reduce CO2 emissions as reported in a recent study (add reference to Copenhagen Economics October 2012 report). Renovations to improve energy efficiency often pay for themselves and have additional benefits, such as improving energy security by reducing reliance on imported fossil fuels and improving worker productivity and health due to less air pollution and better indoor climate (although the savings associated with related health benefits can be very uncertain to estimate). Renovation projects not only can boost the economy by providing additional jobs, but it can also improve public finances by lowering energy bills and reducing outlay on subsidies.
Resources should be allocated to educating end-users regarding the full financial and environmental benefits of an investment in energy-efficiency measures. Many of the same types of market transformation programs targeted toward electric and gas appliances and equipment could be used to increase the use of energy efficient building products. In particular, loans, rebates, technical assistance, financial incentives, and education/awareness programs could be implemented with similar effects.
Conclusions
There are several key conclusions from this review of strategic goals and actions.
National regulation is by no means consistent at present but has played a key role in pushing forward the agenda of energy efficiency, and will continue to do so given the long-term nature of the targets that the regions have committed to.
Action should be taken to identify and address existing policies and/or regulations that inhibit the use of chemically-derived products.
Industry needs to ensure that performance data with a life cycle assessment basis is facilitated throughout the products of chemistry value chain from cradle to end-product and that accurate cost/performance data for delivering, installing, and maintaining products is publically available through credible third parties.
There is a need to provide clear, unambiguous information to educate all sectors, including legislators, specifiers, installers, and consumers. Information needs to be made available, and a multi-tiered approach taken to ensure the information is accessible, understandable and practicable.
In cases where little or no legislation or required building standards exist, the use of green/energy efficiency elements of building codes has played a significant role in developing the market, particularly in driving innovation in green technologies. Similarly these remain under on-going development to meet the needs of the (inter)national policies.
The impact of fiscal and other monetary incentives differs by region. It strongly depends on legislative background and design of the measures. Packages of measures combining direct subsidies and fiscal incentives have been valuable in driving market transformation to date, but these need to be backed up with quality information for consumers if the transformation is to be maintained once incentives are removed.
Research and development, combined with public investment in education and knowledge sharing, is critical to the growth of this market and to the development of new and innovative products to deliver the energy efficiencies required to meet or exceed GHG reduction targets.

ICCA Building Technology Roadmap 76
Chapter 9: Collaboration and partnerships Climate change is arguably one of the key global policy concerns of the 21st century. Governments around the world agree that action needs to be taken to mitigate climate change, particularly through reducing GHG emissions over the coming decades. Buildings present the largest and most cost-effective potential for energy savings and GHG reductions through improved energy efficient building envelope technologies. Improvements in the building envelope should receive greater focus in national and international political agendas and policy-making relating to energy savings and GHG reductions. Collaborative approaches, at a global scale, could support transformative change in energy efficiency in the building sector.
This chapter will explore the following: 1) why collaboration and partnerships are essential to accelerate efficient development and deployment of sustainable energy technologies, and 2) how world leaders, through partnerships, can promote policy coherence in international inter-governmental bodies, so that the critical tools, such as chemically-derived building products, can be best used to respond to these global challenges.
Accelerating Energy Efficiency through Partnerships
Achieving ambitious energy and GHG savings in the buildings sector requires strong collaboration all along the chain – from governments to green building network representatives - to help drive large-scale energy efficiency improvements in the marketplace. Many collaborative networks already exist. The IEA itself has by far the most comprehensive network, in which thousands of technology experts from around the world coordinate their energy technology programs. Diverse coalitions of partners can drive a supportive market environment for continuous energy improvements and undertake activities that drive a supportive market environment for continuous energy improvement, including:
Engaging with a broader group of energy users in the buildings sector both nationally and internationally; Expanding access to energy assessments, training, tools, and technical assistance; Supporting partners’ development and delivery of technical and financial energy efficiency incentive
programs that are life cycle, whole building system based; Facilitating pilot projects on energy efficient buildings technologies;
Coalescing support for policy measures that optimize uptake of energy efficiency buildings technologies; Exchanging best-practice policy packages and programs to maximize the benefits of policy interventions
such as green building codes and standards developed with open, transparent and stakeholder inclusive consensus processes;
Incentivizing national and international R&D collaboration, demonstration, and education programs; Collectively supporting higher standards of efficiency in developing countries, where the rate of new
construction is high, and encouraging greater building energy refurbishment in developed countries.
Numerous international, national and regional partnerships exist that work to promote common messages and build capacity to deliver energy efficiency in buildings. Two examples of successful collaborative partnership follow:
The U.S. Department of Energy’s Industrial Technologies Program (ITP) is supporting work under the IEA’s Industrial Energy-Related Technologies and Systems Implementing Agreement and the Global Superior Energy Performance Partnership, which aim to reduce energy use, GHG emissions, and financial costs in the global industrial sector. ITP currently supports bilateral agreements on energy and climate issues with India, China (e.g., University Alliance for Industrial Energy Efficiency), Russia, Brazil, Kazakhstan, and Argentina. ITP international collaborations include exchanging assessment training modules and organizing energy efficiency workshops to provide guidance on the ISO 50001 energy standard.
The Global Superior Energy Performance Partnership is a multi-country effort aimed at accelerating accredited energy performance certification programs to serve a global market, development to create and harmonize codes and standards nationally, and sharing lessons learned and best practices in energy efficiency.
At the international policy level, energy efficiency in the building sector especially with respect to the building envelope has not yet received the focus it deserves in global climate change policy-making. Governments should explore cross-geographical policy coherence for energy efficiency in buildings and translate political commitment

77 ICCA Building Technology Roadmap
on policy coherence into practice. International policy efforts should reinforce domestic action on energy and GHG savings. The United Nations Framework Convention on Climate Change parties should bring together leaders from world economies to set policies and best practices to improve energy efficiency in the buildings sector. Governments can accomplish more together than by working alone.
Conclusions
Collaborative initiatives that combine a broad range of complementary abilities, resources and expertise can lead to successful projects that accelerate the deployment of energy efficient building products. Equally important, capacity, regulatory frameworks, social and research infrastructures, and effective financial and legal frameworks and institutions are needed to enable collaborative projects and support uptake of current and new technologies. Combined initiatives can maximize the impact of individual experiences and resources where they matter most.

ICCA Building Technology Roadmap 78
Phase II Key Messages
Roadmap
Phase I of this low emission building roadmap has defined the chemical industry’s present and future potential technological contribution to energy efficiency and GHG emissions savings in the buildings sector. Phase II has highlighted key technology and policy actions needed to achieve these goals.
The chemical industry has already made and is continuing to make significant contributions to advance acceptance and use of energy efficient building products. Examples include the following:
Use of chemically-derived products in high-profile demonstration projects, including passive houses, houses with zero or near-zero energy or emissions, and plus-energy buildings that produce more energy than they consume,
Conducting training programs to educate architects and craftsmen about proper use and installation of chemically-derived products,
Sponsoring life cycle assessment studies to provide credible data demonstrating and quantifying net energy and GHG benefits over the full life cycle of chemically-derived building products,
Ongoing RD&D to develop products that achieve higher levels of energy efficiency, leading to greater GHG savings during use.
The following figure from the Fraunhofer Institute illustrates how technology development by industry stays ahead of legislative activity. In the figure, WSVO stands for Wärmeschutzverordnung, (German ordinance on thermal insulation), while EnEV stands for Energieeinsparverordnung (German energy decree). The figure shows that technology is not the limiting factor. Advances in building technology have made zero-heating energy buildings possible, and are moving ahead into the realm of buildings that produce more energy than they consume. It is crucial that national and international stakeholders take the necessary actions to ensure that the potential of this technology is realized, to achieve the emission reductions needed as growth in building stock continues in the coming decades.
Figure 42. Technology Lead in Energy-efficient Construction
Table 28 identifies the near-term priority actions to be taken by stakeholders in order to achieve the vision set out in this roadmap.

79 ICCA Building Technology Roadmap
Table 28. Priority Actions for Stakeholders
Lead Stakeholder Actions
Government
(national level)
Ensure the regulatory environment supports the enhanced deployment of energy efficient buildings technologies;
o Update existing standards regularly to capture savings in improved products;
o Expand standards to cover new products;
Promote greater harmonization of methodology procedures behind building codes and building performance assessment;
Ensure building codes support the inclusion of appropriate chemically-derived building products;
Promote market-based approaches to facilitate the uptake of energy efficient products;
Promote resource acquisition activities and incentives to cover the initial incremental costs of higher efficiency technologies and practices in buildings applications;
Ensure sustained R&D funding.
Government
(international level)
Utilize international forum to harmonize building certification of standards;
Utilize international forums as a platform for information and resource exchange;
Expand international RD&D collaboration;
Provide capacity building/training for regulatory frameworks to promote energy efficiency in buildings;
Utilize international forums to facilitate dialogue between policy makers and industry experts and other stakeholders regarding energy efficient building products.
Chemical Industry and Buildings Energy Efficiency Value Chain
Accelerate the development of technologies for building materials that improve energy efficiency and reduce GHG emissions;
Accelerate capital investment and speed up commercialization of R&D in buildings energy efficient technology;
Prompt collaboration and public private partnerships with governments, institutions, and associations to promote energy efficiency in buildings;
Create greater awareness of the economic and social benefits of high energy efficiency in buildings;
Improved data on end uses benefits of buildings energy-efficiency technologies and practices;
Support market transformation initiatives, including the training of practitioners, to bring energy efficient technologies and practices into the buildings marketplace.
University Institutions and Associations
Engage in aggressive R&D of promising energy saving technologies and practices.
Promote appropriate coordination among program providers to ensure maximum impact on buildings energy efficiency initiatives;
Engage in training and capacity building to make all market actors aware of new technologies and practices and to remove existing knowledge and skills gaps;
Conduct periodic studies on the implementation and enforcement of building energy efficiency codes toward new and existing buildings and ways to improve their effectiveness.

ICCA Building Technology Roadmap 80

81 ICCA Building Technology Roadmap
Annex I: List of Figures Figure 1: Key sector contributions to global CO2 emissions reductions ...................................................................1
Figure 2. Residential Floor Space by Region ...........................................................................................................6
Figure 3. Commercial Floor Space by Region ..........................................................................................................6
Figure 4. Total Building Stock Floor Space by Sector and Region ............................................................................7
Figure 5. Composite Energy Loss at the Building Level, Modest Renovation Scenario .......................................... 13
Figure 6. Fuel Mix for Electricity Generation, 2009 .............................................................................................. 14
Figure 7. Fuel Mix for Residential Heating, 2009 ................................................................................................. 14
Figure 8. Fuel Mix for Commercial Heating, 2009 ................................................................................................ 15
Figure 9. Fuel Mix for Residential Water Heating, 2009 ....................................................................................... 15
Figure 10. Fuel Mix for Commercial Water Heating, 2009 .................................................................................... 16
Figure 11. Life Cycle Energy Consumption (total megajoules of energy required per megajoule of direct energy) 16
Figure 12. Life Cycle GHG Emissions (total kg of CO2e per megajoule of direct energy) ........................................ 17
Figure 13. Product Life Cycle Stages .................................................................................................................... 18
Figure 14. Life Cycle Energy for Growth in Building Stock with no Improvements to Energy Efficiency of the Building Envelope ............................................................................................................................................... 29
Figure 15. Life Cycle GHG for Growth in Building Stock with no Improvements to Energy Efficiency of the Building Envelope............................................................................................................................................................. 29
Figure 16. Life Cycle Energy for Growth in Stock with Improvements to New Stock and No Renovation of Existing Stock .................................................................................................................................................................. 30
Figure 17. Life Cycle GHG for Growth in Stock with Improvements to New Stock and No Renovation of Existing Stock .................................................................................................................................................................. 30
Figure 18. Life Cycle Energy for Growth in Stock with Improvements to New Stock and Renovations to Existing Stock .................................................................................................................................................................. 31
Figure 19. Life Cycle GHG for Growth in Stock with Improvements to New Stock and Renovations to Existing Stock ........................................................................................................................................................................... 31
Figure 20. Added Effect of Fuel Switching on Energy Results ............................................................................... 33
Figure 21. Added Effect of Fuel Switching on GHG Results ................................................................................... 33
Figure 22. Life Cycle Energy Savings per Year for Use of Chemically-derived Building Products, Excluding Windows ............................................................................................................................................................ 34
Figure 23. Life Cycle GHG Savings per Year for Use of Chemically-derived Building Products, Excluding Windows ........................................................................................................................................................................... 34
Figure 24. Share of U.S. Commercial Energy Use by Building Type ....................................................................... 35
Figure 25. Share of Europe Commercial Energy Use by Building Type ................................................................. 36
Figure 26. Share of Japan Commercial Energy Use by Building Type .................................................................... 36
Figure 27. Percent of Energy Savings by End Use in 2050 for Use of Chemically-derived Building Products ......... 37
Figure 28. Energy Savings by Region, Building Sector, and End Use in 2050 ........................................................ 37
Figure 29. GHG Savings by Region, Building Sector, and End Use in 2050 ............................................................ 38
Figure 30. Life Cycle Energy Use by Envelope Component, 2000 ......................................................................... 39
Figure 31. Percent of Energy Savings by Category of Chemically Derived Building Envelope Product, 2050 ......... 39

ICCA Building Technology Roadmap 82
Figure 32. Energy Savings from Energy-efficient Plastic Frame Windows ............................................................ 40
Figure 33. GHG Savings from Energy-efficient Plastic Frame Windows ................................................................ 41
Figure 34. Cumulative Net Energy Savings for Chemically Derived Building Products (Use Phase Savings – Production Impacts) ........................................................................................................................................... 47
Figure 35. Cumulative Net GHG Savings for Chemically Derived Building Products (Use Phase Savings – Production Impacts) ............................................................................................................................................................. 48
Figure 36. Total Heating, Cooling, and Water Heating Energy with Growth in Building Stock ................................51
Figure 37. Heating Energy for High-Growth Regions ........................................................................................... 53
Figure 38. Cooling Energy for High-Growth Regions ............................................................................................ 53
Figure 39. Water Heating Energy for High-Growth Regions ................................................................................. 54
Figure 40: The path from innovation and research to market .............................................................................. 65
Figure 41. Technology Lead in Energy-efficient Construction .............................................................................. 78

83 ICCA Building Technology Roadmap
Annex II: List of Tables Table 1: Residential Growth Rates (annual increase in number of households by decade) ......................................5
Table 2: U.S. Commercial Growth Rates (annual increase in million square meters of floor space by decade) .........5
Table 3: European Commercial Growth Rates (annual increase in million square meters of floor space by decade) 5
Table 4. Japan Commercial Growth Rates (annual increase in million square meters of floor space by decade) .......6
Table 5. Renovation Rates per Decade for Moderate Renovation Scenario ..............................................................8
Table 6. Commercial Building Demolition (percent of 2000 stock demolished per decade) .....................................8
Table 7. Roof R-values 2000-2050 ...................................................................................................................... 10
Table 8. Wall R-values 2000-2050 ....................................................................................................................... 11
Table 9. Window R-values 2000-2050 ................................................................................................................. 12
Table 10. Mix of Foam Types within Plastic Foam Insulation by Region ............................................................... 20
Table 11. Plastic Insulation Market Share by Decade in New and Retrofit Insulation ........................................... 20
Table 12. Plastic Hot Water Pipe Market Share Projections by Decade in New Construction ................................ 21
Table 13. Cool Roof Implementation as Percent of New and Replacement Roof, by Decade .................................. 24
Table 14. Energy Savings and Penalties for Cool Roofing ..................................................................................... 24
Table 15. Residential and Commercial Windows Market Share............................................................................ 25
Table 16. Cradle-to-Production Impacts for Chemically-Derived Construction Products (normalized to per-year basis over product lifetime) ................................................................................................................................ 27
Table 17. Cumulative Energy Demand for Production of Chemically Derived Building Products, Excluding Windows (Mtoe) ................................................................................................................................................. 41
Table 18. Cumulative Energy Savings for Use of Chemically Derived Building Products, Excluding Windows (MtCO2e) ............................................................................................................................................................ 42
Table 19. Cumulative GHG Emissions from Production of Chemically Derived Building Products, Excluding Windows (Mtoe) ................................................................................................................................................. 43
Table 20. Cumulative GHG Savings for Use of Chemically Derived Building Products, Excluding Windows (MtCO2e) ........................................................................................................................................................................... 44
Table 21. Energy Ratio, Cumulative Savings to Cumulative Production Impacts (Windows Excluded) ................. 46
Table 22. GHG Ratio, Cumulative Savings to Cumulative Production Impacts (Windows Excluded) ..................... 48
Table 23. Chemical-Based Product Installation, 2000-2050 ................................................................................. 50
Table 24. Changes in Energy Use for High Growth Regions .................................................................................. 52
Table 25. Growth in Market Share of Chemically Derived Building Products (chemical product sales as percent of total sales) .......................................................................................................................................................... 55
Table 26. Cool Roof Projections for Brazil and India, 2050................................................................................... 56
Table 27. Summary of Challenges vs. Opportunities ............................................................................................ 60
Table 28. Priority Actions for Stakeholders ......................................................................................................... 79

ICCA Building Technology Roadmap 84
Annex III: Development Status of Emerging Chemically Derived Technologies
Emerging chemically derived insulation products
Technology Classification
Aerogels Laboratory
Nano dimensional technologies* Laboratory
Vacuum insulated panels Commercial/Laboratory
Emerging reflective roof coverings and pigments
Technology Classification
Highly hydrophobic materials that resist dirt In development
Thermochromic roofing: color/phase change with temperature
Commercial/ Prototype
Emerging window technologies
Technology Classification
Electrochromic (phase change as a result of current)
Prototype
Thermochromic Prototype
Photochromic Laboratory
*For example, nano-scale pores in foam insulation.

85 ICCA Building Technology Roadmap
Annex IV: List of Acronyms 2DS 2°C Scenario (lowest carbon scenario in International Energy Agency ETP 2012 report)
ACC American Chemistry Council
ACH Air change per hour
ASHRAE American Society of Heating, Refrigerating, and Air Conditioning Engineers
BPIE Buildings Performance Institute Europe
BREEAM Building Research Establishment Environmental Assessment Method
CASBEE Comprehensive Assessment System for Building Environmental Efficiency
CCS Carbon capture and storage
CDD Cooling degree days
CEFIC European Chemical Industry Council
CEN European Committee for Standardisation
DOE Department of Energy (U.S.)
EERE Energy Efficiency and Renewable Energy (Office within U.S. Department of Energy)
EIA Energy Information Administration (U.S.)
EIFS Exterior insulation and finish systems
EPBD Energy Performance of Buildings Directive
EPDM Ethylene propylene diene monomer (a form of synthetic rubber)
EPS Expanded polystyrene
ETP Energy Technology Perspectives (ETP 2012 is version of this report published in June 2012)
GHG Greenhouse gas
HDD Heating degree days
HVAC Heating, ventilation, and air conditioning
IBEC Institute for Building Environment and Energy Conservation
ICCA International Council of Chemical Associations
IEA International Energy Agency
IECC International Energy Conservation Code
IGCC International Green Construction Code
JCIA Japan Chemical Industry Association
LCA Life Cycle Assessment
LCCM Life Cycle Carbon Minus
LCI Life Cycle Inventory
LEED Leadership in Energy and Environmental Design
METI Ministry of Economy, Trade, and Industry (Japan)
MLIT Ministry of Land, Infrastructure, Transport and Tourism (Japan)
MtCO2e Million tonnes carbon dioxide equivalents (metric tonnes)
Mtoe Million tonnes of oil equivalent (metric tonnes)

ICCA Building Technology Roadmap 86
NEMS National Energy Modeling System (U.S.)
NGO Non-governmental organization
NREL National Renewable Energy Laboratory (U.S.)
nZEB Nearly Zero-Energy Building
OECD Organisation for Economic Co-operation & Development
PIR Polyisocyanurate
PPFA Plastic Pipe and Fittings Association
PUR Polyurethane
PVC Polyvinyl chloride
RD&D Research, development, and demonstration
ROI Return on investment
SIP Structural insulated panel
TPO Thermoplastic olefin
UNEP United Nations Environment Programme
UNFCCC United Nations Framework Convention on Climate Change
USD U.S. dollars
VIP Vacuum insulated panels
WTO World Trade Organization
XPS Extruded polystyrene
ZEB Zero Energy Building

87 ICCA Building Technology Roadmap
References 2000 IECC: International Energy Conservation Code, IECC Compliance Guide to Window Selection in Illinois Designed to Comply with the IECC Requirements for New Single-Family Residential Buildings in Illinois, ICC: International Code Council, 2000
2000 IECC: International Energy Conservation Code, IECC Compliance Guide to Window Selection in Texas Designed to Comply with the IECC Requirements for New Single-Family Residential Buildings in Texas, ICC: International Code Council, 2000
2000 IECC: International Energy Conservation Code, IECC Compliance Guide to Windows Used for Replacement and Remodeling in Illinois Designed to Comply with the IECC Requirements for Existing Single-Family Residential Buildings in Illinois, ICC: International Code Council, 2000
2000 IECC: International Energy Conservation Code, IECC Compliance Guide to Windows Used for Replacement and Remodeling in Texas Designed to Comply with the IECC Requirements for Existing Single-Family Residential Buildings in Texas, ICC: International Code Council, 2000
2006 IECC: International Energy Conservation Code, Energy Code Compliance Guide to Window Selection in Illinois, ICC: International Code Council, 2006
2006 IECC: International Energy Conservation Code, Energy Code Compliance Guide to Window Selection in Texas, ICC: International Code Council, 2006
2009 IECC: International Energy Conservation Code, Energy Code Compliance Guide to Window Selection in Illinois, ICC: International Code Council, 2009
2009 IECC: International Energy Conservation Code, Energy Code Compliance Guide to Window Selection in Texas, ICC: International Code Council, 2009
ANSI/ASHRAE: American National Standard Institute/American Society of Heating, Refrigerating and Air-Conditioning Engineers, Inc., ANSI/ASHRAE Addendum b to ANSI/ASHRAE Standard 90.2-2001, ASHRAE Standard, Energy-Efficient Design of Low-Rise Residential Buildings, 2003
ASHRAE: American Society of Heating, Refrigeration and Air-Conditioning Engineers, Advanced Energy Design Guide for Medium to Big Box Retail Buildings, Achieving 50% Energy Savings Toward a Net Zero Energy Building, ASHRAE, 12/30/11
ASHRAE: American Society of Heating, Refrigeration and Air-Conditioning Engineers, Advanced Energy Design Guide for Highway Lodging, Achieving 30% Energy Savings Toward a Net Zero Energy Building, ASHRAE, 4/27/11
ASHRAE: American Society of Heating, Refrigeration and Air-Conditioning Engineers, Advanced Energy Design Guide for K-12 School Buildings, Achieving 30% Energy Savings Toward a Net Zero Energy Building, ASHRAE, 4/27/11
ASHRAE: American Society of Heating, Refrigeration and Air-Conditioning Engineers, Advanced Energy Design Guide for Small to Medium Office Buildings, Achieving 50% Energy Savings Toward a Net Zero Energy Building, ASHRAE, 9/27/11
BPIE: Building Performance Institute Europe, “Europe’s Buildings Under the Microscope, A country-by-country review of the energy performance of buildings”, October 2011
Copenhagen Economics. Multiple benefits of investing in energy efficient renovation of buildings: Impact on Public Finances. Commissioned by Renovate Europe. 5 October 2012.
Deru et al., “U.S. Department of Energy Commercial Reference Building Models of the National Building Stock”, NREL: National Renewable Energy Laboratory, NREL/TP-5500-46861, February 2011
ECOFYS, “U-values For Better Energy Performance of Buildings”, 10/2007
EIA (2001), U.S. Department of Energy, Energy Information Administration, 2001 Residential Energy Consumption Survey.
EIA (2009), U.S. Department of Energy, Energy Information Administration, 2009 Residential Energy Consumption Survey.

ICCA Building Technology Roadmap 88
EIA (2010a), U.S. Energy Information Administration, Commercial Sector Demand Module of the National Energy Modeling System: Model Documentation 2010, DOE/EIA-M066(2010), May 2010
EIA (2010b), U.S. Energy Information Administration, Model Documentation Report: Residential Sector Demand Module of the National Energy Modeling System, DOE/EIA-M067(2010), May 2010
EIA (2012), U.S. Energy Information Administration, Annual Energy Outlook 2012. DOE/EIA-0383(2012)
Emmerich et al., “Investigation of the Impact of Commercial Building Envelop Airtightness on HVAC Energy Use”, NIST: National Institute of Standards and Technology, NISTIR 7238, June 2005
International Council of Chemical Associations (ICCA), Innovations for Greenhouse Gas Reductions, A life cycle quantification of carbon abatement solutions enabled by the chemical industry, July 2009
International Energy Agency (IEA), Energy Technology Perspectives: Pathways to a Clean Energy System, June 2012
IWAMURA, Kazuo, “The Existing Housing Typology in Japan and Proposals to Improve Insulation Performance Levels”, The 2005 World Sustainable Building Conference, Tokyo, 27-29 September 2005
Levinson, Ronnen, “The case for cool roofs”, Berkley Lab Heat Island Group, 15 Nov 2011
MLIT: Ministry of Land, Infrastructure and Transport. Residential Building Stock Statistics. http://www.mlit.go.jp/report/press/joho04_hh_000255.html. Accessed November 2011.
Oakdene Hollins, Environmentally Beneficial Nanotechnologies: Barriers and Opportunities. A report for the Department of Environment, Food, and Rural Affairs, May 2007
Origgi et al., “Influence of Thermal Insulation and Phase-Change Material on Energy Demand and CO2-Emissions in Different European Climates”, Passiv Haus Institut, July 2006
The Freedonia Group, Inc. World Roofing: Industry Study with Forecasts for 2014 & 2019. Report #2656. July 2010. Selected tables.
The Freedonia Group, Inc. World Insulation: Industry Study with Forecasts for 2014 & 2019. Report #2707. February 2011. Selected tables.
The Freedonia Group, Inc. World Plastic Pipe: Industry Study with Forecasts for 2015 & 2020. Report #2748. May 2011. Selected tables.
The Freedonia Group, Inc. World Windows & Doors: Industry Study with Forecasts for 2015 & 2020. Report #2790. October 2011. Selected tables.
The Freedonia Group, Inc. World Housing: Industry Study with Forecasts for 2014 & 2019. Report #2692. September 2010. Selected tables.
The Freedonia Group, Inc. U.S. Sealants & Caulks: Industry Study with Forecasts for 2012 & 2017. Report #2393. September 2008. Selected tables.
Wallace et al., “Continuous measurements of air change rates in an occupied house for 1 year: The effect of temperature, wind, fans, and windows”, Journal of Exposure Analysis and Environmental Epidemiology, Nature Publishing Group, 2002
XCO2 consibee, “Insulation for Sustainability: A Guide”, XCO2, 2000
Yanfeng, Qian, “Most homes to be demolished in 20 years”, China Daily, SHANGHAI, 2010-08-07