table of contents - msu extensionmsue.anr.msu.edu/uploads/235/52630/2014_tare_field_trials... ·...
TRANSCRIPT


TABLE OF CONTENTS
Introduction .................................................................................................................... 1 Cooperating Farms and TARE Committee Members ..................................................... 2 Summary of Precipitation and Growing Degree Days .................................................... 3 CORN Corn Study Introduction ................................................................................................. 4 Corn Hybrid Trial Results – 100 to 105 RM ................................................................ 5-6 Corn Hybrid Trial Results – 95 to 99 RM .................................................................... 7-8 Corn Hybrid Trial Results – 85 to 94 RM .................................................................. 9-10 Corn Fungicide Trial .................................................................................................... 11 Corn Nitrogen Rate Study ............................................................................................. 12 Corn Planting Depth Trial ............................................................................................. 13 Corn Planting Speed Trial ............................................................................................. 14 Corn Seed Treatment Study: Poncho/VOTiVO ............................................................ 15 SOYBEAN Soybean Study Introduction ......................................................................................... 16 Soybean Variety Trial Results – 2.3 RM or more .................................................... 17-18 Soybean Variety Trial Results – 2.0 – 2.2 RM ......................................................... 19-20 Soybean Variety Trial Results – 1.9 RM or less ..................................................... 21-22 Soybean Variety Trial Results - Liberty Link ................................................................. 23 Soybean Variety Trial Results – Conventional .............................................................. 24 Soybean Foliar Feed Trial ............................................................................................. 25 Soybean Planting Trials: Depth of Seed/Speed of Planting......................................... 26 Soybean Clariva ™ Complete Beans Seed Treatment ................................................... 27 Soybean SCN Resistance Variety Study ........................................................................ 28 CORN / SOYBEAN COMPOST STUDY Yard Waste in Corn/Soybean Rotation ......................................................................... 29 CONCERVATION DISTRICT PHOSPHORUS REDUCTION Soybean Phosphorus Reduction Study ......................................................................... 30 WHEAT Effect of fungicides on the performance of winter wheat ..................................... 31-32 Effect of fungicide application timing on head blight .................................................. 33 Effect of Palisade 2EC plant growth regulator on soft winter wheat ......................... 34 2014 Custom Machine and Work Rate Estimates ........................................................ 35 2013 Participating Seed Companies ............................................................................. 39 Sponsors and Funding Partners ...................................................................... Back Cover

Introduction
2014 TARE Plot Report
This report represents the tenth year of a multi-county strategy for evaluating corn hybrids and soy-
bean varieties as well as agronomic practices. The TARE Committee, comprised of farmer, and agri-
business representatives, serves as an advisory board, and provides oversight for the project’s direc-
tion, finances and equipment needs. We gratefully acknowledge the committee’s contributions and
the support provided by our industry partners, listed on the back cover of this publication.
Each study is analyzed statistically to determine the Least Significant Difference (LSD) at the 0.05 (5%)
level. The LSD represents the maximum difference between treatments (hybrid, variety, population,
or evaluated input) for the difference to be attributed to the treatment rather than some external
factor, like soil variability, or rainfall. An LSD at the 0.05, level means that statistically, we can be
95% confident with the results. Within studies any result that is bolded is statistically the same.
Therefore, if a treatment is bolded, it yielded the same, statistically speaking, as the highest yielding
treatment in that study. Any treatment result, within a study, that is not bolded yielded significantly
less than the highest yielding treatment. We also include the Coefficient of Variation (CV). The CV is
a measure of the variability of the data that cannot be explained by the statistics. The lower the CV,
the more confident you can be that the data is good. Generally, a CV of less than 10% is good data. A
CV of less than 5% is very good data.
We hope you find these results useful to your operation. Ultimately it is you, the grower, whom we
aim to serve with this project!
2014 MSU Extension Greater Thumb Area Field Crops Team
Bob Battel, Extension Educator, Corn and Soybeans
Phil Kaatz, Extension Educator, Forages & Field Crops
Martin Nagelkirk, Extension Educator, Wheat
Jim Vincent, Project Technician
Chad Alexander, Assistant Technician
Click & Like us
on Facebook

Farm Cooperators:
Name City County Planting Date Harvest Date Corn Rich D’Arcy Kingston Sanilac 5-20-14 11-07-14 Don Koning Capac St. Clair 5-25-14 11-10-14 Don Koth Filion Huron 5-28-14 11-11-14 Greg Wagner Reese Tuscola 5-10-14 11-14-14 Randy & David Reibling Elkton Huron 5-29-14 11-16-14 Ken Landsburg Sandusky Sanilac 5-24-14 11-17/24-14
Soybeans Steve Kalbfleisch Brown City St. Clair 6-02-14 11-01-14 Randy & David Reibling Elkton Huron 5-30-14 11-03-14 Rob Foster Fairgrove Tuscola 6-01-14 11-04-14 Ken Landsburg Sandusky Sanilac 6-04-14 11-05-14
Compost Trial Steve Listwak North Branch Lapeer 5/20/14 10/27/14 Gordon Spencer Imlay City Lapeer 6/04/14 10/24/14 Ryan Schweihofer China St. Clair 5/27/14 11/21/14
Wheat McConnachie Farms Deckerville Sanilac 10-03-13 07-24-14
TARE Committee Members: Seth Broilat Huron Tom Durand Sanilac Jay Ferguson St. Clair Matt Frostic Sanilac Jason Haag Tuscola Mike Houghtaling Saginaw Bill Hunt Genesee Jeff Krohn Huron Dave Rupprecht Tuscola
Agribusiness Representatives: Company: John Kohr Monsanto Dale Kundinger CPS Chuck Kunisch MAC Jeff Reinbold Great Lakes Hybrids
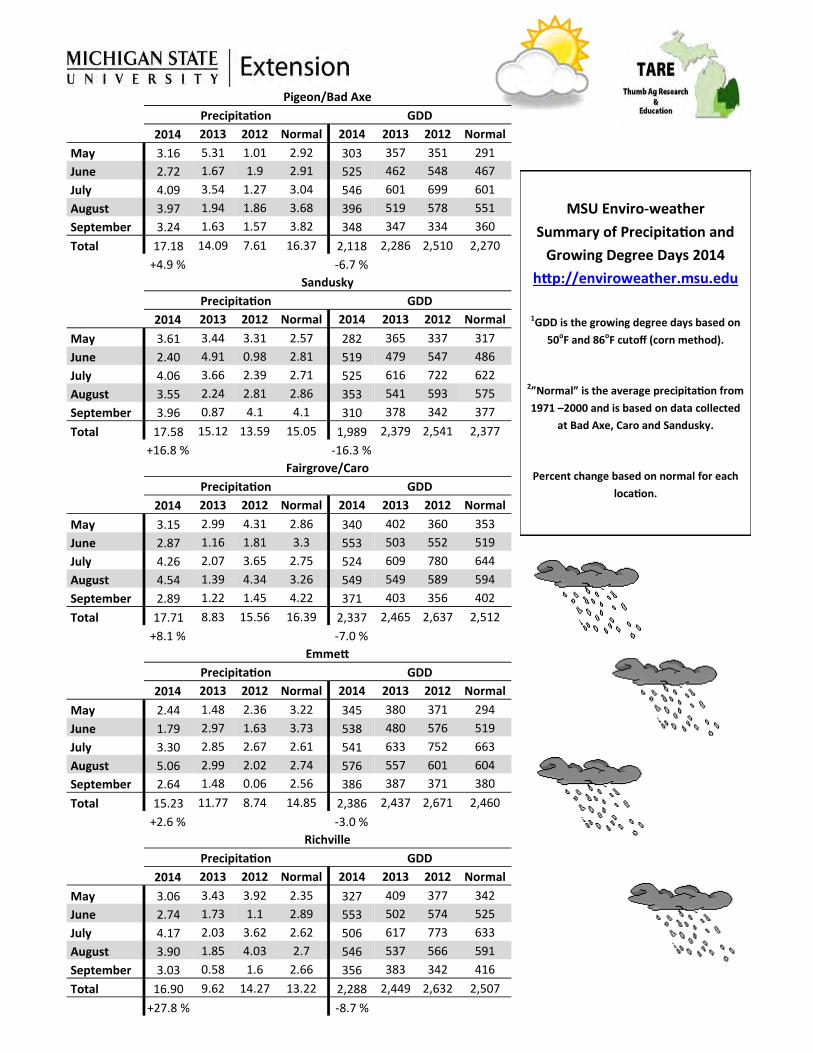
MSU Enviro-weather
Summary of Precipitation and
Growing Degree Days 2014
http://enviroweather.msu.edu
1GDD is the growing degree days based on
50oF and 86oF cutoff (corn method).
2”Normal” is the average precipitation from
1971 –2000 and is based on data collected
at Bad Axe, Caro and Sandusky.
Percent change based on normal for each
location.
Pigeon/Bad Axe
Precipitation GDD
2014 2013 2012 Normal 2014 2013 2012 Normal
May 3.16 5.31 1.01 2.92 303 357 351 291
June 2.72 1.67 1.9 2.91 525 462 548 467
July 4.09 3.54 1.27 3.04 546 601 699 601
August 3.97 1.94 1.86 3.68 396 519 578 551
September 3.24 1.63 1.57 3.82 348 347 334 360
Total 17.18 14.09 7.61 16.37 2,118 2,286 2,510 2,270
+4.9 % -6.7 %
Sandusky
Precipitation GDD
2014 2013 2012 Normal 2014 2013 2012 Normal
May 3.61 3.44 3.31 2.57 282 365 337 317
June 2.40 4.91 0.98 2.81 519 479 547 486
July 4.06 3.66 2.39 2.71 525 616 722 622
August 3.55 2.24 2.81 2.86 353 541 593 575
September 3.96 0.87 4.1 4.1 310 378 342 377
Total 17.58 15.12 13.59 15.05 1,989 2,379 2,541 2,377
+16.8 % -16.3 %
Fairgrove/Caro
Precipitation GDD
2014 2013 2012 Normal 2014 2013 2012 Normal
May 3.15 2.99 4.31 2.86 340 402 360 353
June 2.87 1.16 1.81 3.3 553 503 552 519
July 4.26 2.07 3.65 2.75 524 609 780 644
August 4.54 1.39 4.34 3.26 549 549 589 594
September 2.89 1.22 1.45 4.22 371 403 356 402
Total 17.71 8.83 15.56 16.39 2,337 2,465 2,637 2,512
+8.1 % -7.0 %
Emmett
Precipitation GDD
2014 2013 2012 Normal 2014 2013 2012 Normal
May 2.44 1.48 2.36 3.22 345 380 371 294
June 1.79 2.97 1.63 3.73 538 480 576 519
July 3.30 2.85 2.67 2.61 541 633 752 663
August 5.06 2.99 2.02 2.74 576 557 601 604
September 2.64 1.48 0.06 2.56 386 387 371 380
Total 15.23 11.77 8.74 14.85 2,386 2,437 2,671 2,460
+2.6 % -3.0 %
Richville
Precipitation GDD
2014 2013 2012 Normal 2014 2013 2012 Normal
May 3.06 3.43 3.92 2.35 327 409 377 342
June 2.74 1.73 1.1 2.89 553 502 574 525
July 4.17 2.03 3.62 2.62 506 617 773 633
August 3.90 1.85 4.03 2.7 546 537 566 591
September 3.03 0.58 1.6 2.66 356 383 342 416
Total 16.90 9.62 14.27 13.22 2,288 2,449 2,632 2,507
+27.8 % -8.7 %
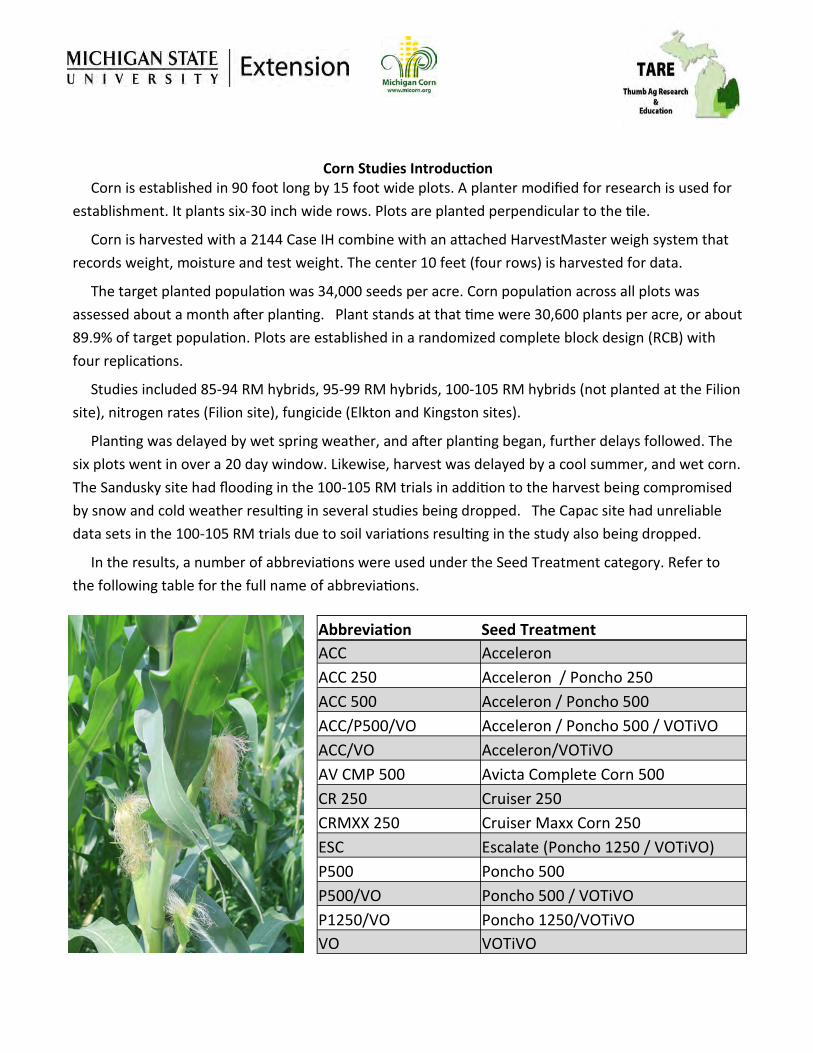
Corn Studies Introduction Corn is established in 90 foot long by 15 foot wide plots. A planter modified for research is used for
establishment. It plants six-30 inch wide rows. Plots are planted perpendicular to the tile.
Corn is harvested with a 2144 Case IH combine with an attached HarvestMaster weigh system that
records weight, moisture and test weight. The center 10 feet (four rows) is harvested for data.
The target planted population was 34,000 seeds per acre. Corn population across all plots was
assessed about a month after planting. Plant stands at that time were 30,600 plants per acre, or about
89.9% of target population. Plots are established in a randomized complete block design (RCB) with
four replications.
Studies included 85-94 RM hybrids, 95-99 RM hybrids, 100-105 RM hybrids (not planted at the Filion
site), nitrogen rates (Filion site), fungicide (Elkton and Kingston sites).
Planting was delayed by wet spring weather, and after planting began, further delays followed. The
six plots went in over a 20 day window. Likewise, harvest was delayed by a cool summer, and wet corn.
The Sandusky site had flooding in the 100-105 RM trials in addition to the harvest being compromised
by snow and cold weather resulting in several studies being dropped. The Capac site had unreliable
data sets in the 100-105 RM trials due to soil variations resulting in the study also being dropped.
In the results, a number of abbreviations were used under the Seed Treatment category. Refer to
the following table for the full name of abbreviations.
Abbreviation Seed Treatment
ACC Acceleron
ACC 250 Acceleron / Poncho 250
ACC 500 Acceleron / Poncho 500
ACC/P500/VO Acceleron / Poncho 500 / VOTiVO
ACC/VO Acceleron/VOTiVO
AV CMP 500 Avicta Complete Corn 500
CR 250 Cruiser 250
CRMXX 250 Cruiser Maxx Corn 250
ESC Escalate (Poncho 1250 / VOTiVO)
P500 Poncho 500
P500/VO Poncho 500 / VOTiVO
P1250/VO Poncho 1250/VOTiVO
VO VOTiVO
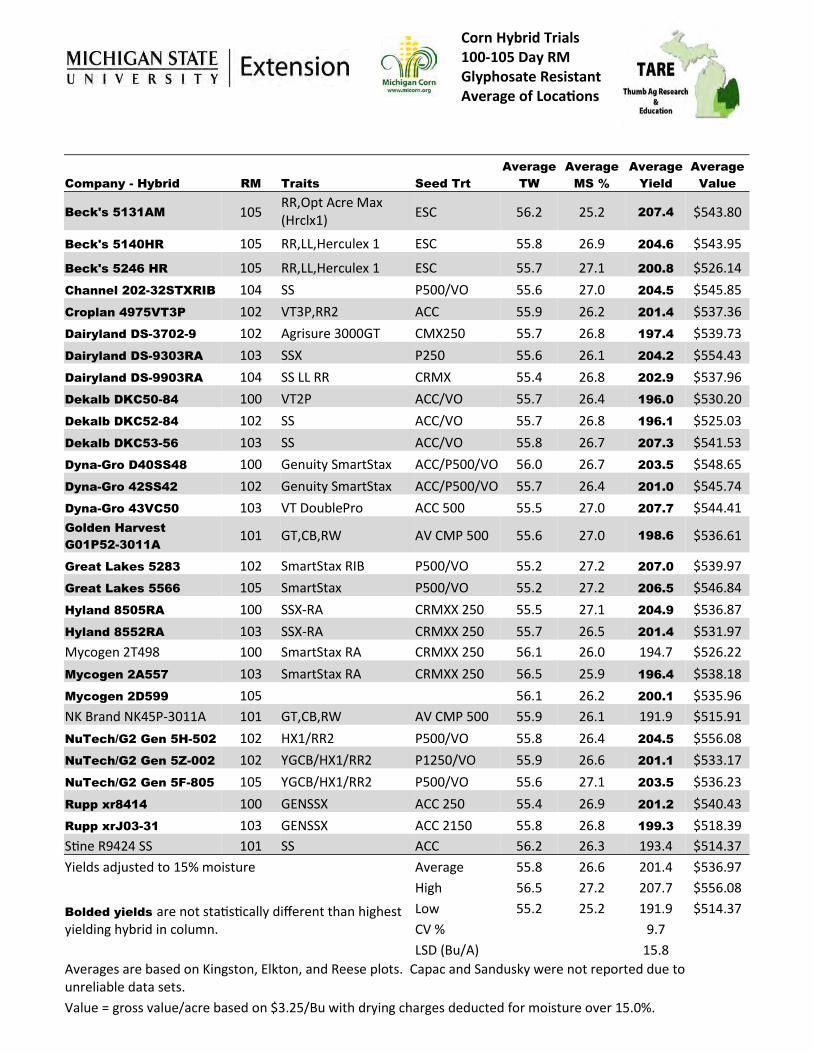
Corn Hybrid Trials 100-105 Day RM Glyphosate Resistant Average of Locations
Company - Hybrid RM Traits Seed Trt
Average
TW
Average
MS %
Average
Yield
Average
Value
Beck's 5131AM 105 RR,Opt Acre Max (Hrclx1)
ESC 56.2 25.2 207.4 $543.80
Beck's 5140HR 105 RR,LL,Herculex 1 ESC 55.8 26.9 204.6 $543.95
Beck's 5246 HR 105 RR,LL,Herculex 1 ESC 55.7 27.1 200.8 $526.14
Channel 202-32STXRIB 104 SS P500/VO 55.6 27.0 204.5 $545.85
Croplan 4975VT3P 102 VT3P,RR2 ACC 55.9 26.2 201.4 $537.36
Dairyland DS-3702-9 102 Agrisure 3000GT CMX250 55.7 26.8 197.4 $539.73
Dairyland DS-9303RA 103 SSX P250 55.6 26.1 204.2 $554.43
Dairyland DS-9903RA 104 SS LL RR CRMX 55.4 26.8 202.9 $537.96
Dekalb DKC50-84 100 VT2P ACC/VO 55.7 26.4 196.0 $530.20
Dekalb DKC52-84 102 SS ACC/VO 55.7 26.8 196.1 $525.03
Dekalb DKC53-56 103 SS ACC/VO 55.8 26.7 207.3 $541.53
Dyna-Gro D40SS48 100 Genuity SmartStax ACC/P500/VO 56.0 26.7 203.5 $548.65
Dyna-Gro 42SS42 102 Genuity SmartStax ACC/P500/VO 55.7 26.4 201.0 $545.74
Dyna-Gro 43VC50 103 VT DoublePro ACC 500 55.5 27.0 207.7 $544.41
Golden Harvest
G01P52-3011A
101 GT,CB,RW AV CMP 500 55.6 27.0 198.6 $536.61
Great Lakes 5283 102 SmartStax RIB P500/VO 55.2 27.2 207.0 $539.97
Great Lakes 5566 105 SmartStax P500/VO 55.2 27.2 206.5 $546.84
Hyland 8505RA 100 SSX-RA CRMXX 250 55.5 27.1 204.9 $536.87
Hyland 8552RA 103 SSX-RA CRMXX 250 55.7 26.5 201.4 $531.97
Mycogen 2T498 100 SmartStax RA CRMXX 250 56.1 26.0 194.7 $526.22
Mycogen 2A557 103 SmartStax RA CRMXX 250 56.5 25.9 196.4 $538.18
Mycogen 2D599 105 56.1 26.2 200.1 $535.96
NK Brand NK45P-3011A 101 GT,CB,RW AV CMP 500 55.9 26.1 191.9 $515.91
NuTech/G2 Gen 5H-502 102 HX1/RR2 P500/VO 55.8 26.4 204.5 $556.08
NuTech/G2 Gen 5Z-002 102 YGCB/HX1/RR2 P1250/VO 55.9 26.6 201.1 $533.17
NuTech/G2 Gen 5F-805 105 YGCB/HX1/RR2 P500/VO 55.6 27.1 203.5 $536.23
Rupp xr8414 100 GENSSX ACC 250 55.4 26.9 201.2 $540.43
Rupp xrJ03-31 103 GENSSX ACC 2150 55.8 26.8 199.3 $518.39
Stine R9424 SS 101 SS ACC 56.2 26.3 193.4 $514.37
Yields adjusted to 15% moisture Average 55.8 26.6 201.4 $536.97
High 56.5 27.2 207.7 $556.08
Bolded yields are not statistically different than highest yielding hybrid in column.
Low 55.2 25.2 191.9 $514.37
CV % 9.7
LSD (Bu/A) 15.8
Averages are based on Kingston, Elkton, and Reese plots. Capac and Sandusky were not reported due to unreliable data sets.
Value = gross value/acre based on $3.25/Bu with drying charges deducted for moisture over 15.0%.

Corn Hybrid Trial 100-105 Day RM Glyphosate Resistant Yield By Location
Company - Hybrid RM Kingston Capac Elkton Reese Sandusky
Beck's 5131AM 105 221.8 194.7 205.7
Beck's 5140HR 105 220.6 190.7 202.5
Beck's 5246 HR 105 223.8 178.5 200.0
Channel 202-32STXRIB 104 215.0 176.5 221.9
Croplan 4975VT3P 102 200.2 176.3 227.6
Dairyland DS-3702-9 102 191.9 177.5 223.0
Dairyland DS-9303RA 103 212.8 179.1 220.8
Dairyland DS-9903RA 104 218.1 179.0 211.6
Dekalb DKC50-84 100 194.9 179.7 213.5
Dekalb DKC52-84 102 192.3 180.6 215.4
Dekalb DKC53-56 103 209.5 200.6 211.7
Dyna-Gro D40SS48 100 195.8 191.6 223.0
Dyna-Gro 42SS42 102 205.1 176.1 221.8
Dyna-Gro 43VC50 103 203.6 197.0 222.5
Golden Harvest
G01P52-3011A
101 199.9
177.8 218.3
Great Lakes 5283 102 229.8 180.4 210.9
Great Lakes 5566 105 216.7 190.1 212.7
Hyland 8505RA 100 220.5 184.8 209.3
Hyland 8552RA 103 206.1 188.3 209.8
Mycogen 2T498 100 205.6 177.5 200.9
Mycogen 2A557 103 200.3 187.4 201.5
Mycogen 2D599 105 217.1 183.5 199.5
NK Brand NK45P-3011A 101 196.9 177.4 201.5
NuTech/G2 Gen 5H-502 102 211.6 187.4 214.6
NuTech/G2 Gen 5Z-002 102 193.1 181.4 228.8
NuTech/G2 Gen 5F-805 105 217.1 184.8 208.5
Rupp xr8414 100 209.7 178.3 215.7
Rupp xrJ03-31 103 188.0 191.2 218.6
Stine R9424 SS 101 203.3 169.2 207.8
Yields adjusted to 15.0 % moisture. 207.6 183.4 213.1
229.8 200.6 228.8
188.0 169.2 199.5 Bolded yields are not statistically different than highest yielding hybrid in column.
CV % 6.3 4.8 5.1
LSD (Bu/A) 21.8 14.6 18.1
Plo
t Data N
ot sh
ow
n d
ue to
un
reliable d
ata sets.
Plo
t Data N
ot sh
ow
n d
ue to
un
reliable d
ata sets.

Corn Hybrid Trial 95 - 99 Day RM Glyphosate Resistant Average of Locations
Company Hybrid RM Traits Seed Trt
Average
TW
Average
MS %
Average
Yield
Average
Value
Beck's 4321AM 99 GT,CB,WBC AV CMP 500 55.6 26.1 178.2 $488.60
Channel 196-06VT3PRIB 96 SS P500/VO 56.2 25.3 183.2 $509.30
Channel 197-33STXRIB 97 SmartStax RA CRMXX 250 56.2 25.4 182.4 $505.78
Channel 197-68STXRIB 97 SmartStax CRMXX 250 55.9 25.7 180.5 $498.91
Croplan 3533VT2P 96 VT2P,RR2 ACC 55.9 25.5 180.0 $498.44
Croplan 4099SS/RIB 99 SS,RR2 ACC 55.5 26.3 182.6 $499.37
Dekalb DKC45-65 95 SS ACC/VO 56.1 25.8 185.9 $513.66
Dekalb DKC46-20 96 VT3P ACC/VO 56.1 25.7 183.8 $508.08
Dekalb DKC48-12 98 SS ACC/VO 56.0 25.7 182.3 $503.83
Dekalb DKC49-72 99 SS ACC/VO 56.1 25.6 183.2 $506.30
Dyna-Gro D35VC95 95 VT3P P500/VO 56.1 25.4 182.6 $505.12
Dyna-Gro D37SS60 97 SS P500/VO 56.2 25.3 190.5 $528.04
Dyna-Gro D39VP 14 99 VT TriplePro ACC 500 55.8 25.8 186.1 $512.93
Golden Harvest G97X48-3110 97 GT,CB,WBC AV CMP 500 55.6 26.1 182.0 $498.59
Great Lakes 4548 95 YGCB/HX1/RR2 P500/VO 56.1 25.6 189.9 $524.48
Great Lakes 4699 96 YGCB/HX1/RR2 P500/VO 56.0 25.7 187.3 $517.64
Great Lakes 4879 98 VT3Pro RIB P500/VO 56.2 25.3 185.3 $514.04
Hyland 8380 95 GT/CB/LL/RW CRMXX 250 55.9 25.6 177.2 $489.69
Hyland 8445RA 99 SSX-RA CRMXX 250 55.8 25.7 177.3 $489.24
Hyland 8450RA 98 55.7 26.0 181.4 $497.35
Mycogen 2Y479 98 Herculex 1,RR ESC 55.5 26.4 184.9 $503.58
NK Brand NK36A-3220 96 GT,CB,WBC AV CMP 500 55.8 26.1 181.2 $497.49
NuTech/G2 Gen 5F-198 98 VT DoublePro ACC 500 56.0 25.6 187.1 $518.06
NuTech/G2 Gen 5F-399 99 SmartStax ACC/P500/VO 56.0 25.7 179.5 $496.00
NuTech/G2 Gen 5Y-196 96 GT,CB,WBC AV CMP 500 56.0 25.3 185.7 $515.16
NuTech/G2 Gen 5Z-295 95 SmartStax RIB P500/VO 56.1 25.7 181.1 $499.55
Rupp 8xp280 55.7 26.4 175.3 $489.61
Rupp xrD97-56 97 GENVT2Pro ACC 250 56.0 25.9 183.1 $504.30
Rupp xrD99-30 99 55.7 25.9 182.5 $501.81
Rupp xrJ97-17 97 GENSSX ACC 250 56.0 25.9 179.3 $494.02
Stine R9313 VT2Pro RIB 95 YGCB/HX1/RR2 P1250/VO 56.0 25.3 179.8 $490.95
Stine R9417 VT3Pro RIB 98 YGCB/HXT/RR2 P1250/VO 55.8 25.6 180.3 $494.56
Yields adjusted to 15% moisture Average 182.5 $503.58
Max 190.5 $528.04
Min 190.5 $528.04 Bolded yields are not statistically different than highest yielding hybrid in column CV % 7.7
LSD (Bu/A) 9.0
Value = gross value/acre based on $3.25/Bu with drying charges deduct-ed for moisture over 15.0%.

Corn Hybrid Trial 95 - 99 Day RM Glyphosate Resistant Yield by Location
Yield by Location Bu/A
Company Hybrid RM Kingston Capac Elkton Filion Reese Sandusky
Beck's 4321AM 99 183.3 161.5 172.7 178.4 185.6 187.4
Channel 196-06VT3PRIB 96 188.4 165.9 201.8 190.2 188.8 164.1
Channel 197-33STXRIB 97 193.7 167.9 187.0 187.9 188.9 169.1
Channel 197-68STXRIB 97 189.2 165.4 192.2 164.6 204.3 167.2
Croplan 3533VT2P 96 188.0 172.9 182.7 179.1 183.6 173.4
Croplan 4099SS/RIB 99 197.9 168.1 183.8 188.7 190.2 166.9
Dekalb DKC45-65 95 192.8 175.6 186.9 186.7 204.7 168.5
Dekalb DKC46-20 96 189.0 166.6 192.9 188.2 196.7 169.0
Dekalb DKC48-12 98 183.5 175.0 194.2 177.6 192.0 171.3
Dekalb DKC49-72 99 183.2 177.9 186.4 192.3 189.4 170.2
Dyna-Gro D35VC95 95 192.1 173.1 183.0 180.4 189.4 177.6
Dyna-Gro D37SS60 97 193.2 184.9 195.1 202.2 193.0 174.4
Dyna-Gro D39VP 14 99 197.6 189.1 183.0 182.7 195.9 168.2
Golden Harvest G97X48-3110 97 191.6 174.4 182.7 169.5 191.4 182.3
Great Lakes 4548 95 196.5 172.9 196.1 196.4 196.5 180.8
Great Lakes 4699 96 189.7 180.6 200.9 182.3 192.8 177.5
Great Lakes 4879 98 181.5 173.3 192.8 191.5 192.3 180.4
Hyland 8380 95 182.9 179.4 176.4 169.8 177.7 177.2
Hyland 8445RA 99 184.7 165.3 176.6 170.5 183.4 183.5
Hyland 8450RA 98 189.6 179.1 181.1 170.4 189.2 178.9
Mycogen 2Y479 98 189.5 186.9 183.6 186.1 190.5 172.7
NK Brand NK36A-3220 96 182.9 174.8 190.4 181.6 183.2 174.6
NuTech/G2 Gen 5F-198 98 195.4 182.0 175.3 186.9 203.5 179.4
NuTech/G2 Gen 5F-399 99 190.5 172.4 182.7 178.3 183.0 170.2
NuTech/G2 Gen 5Y-196 96 189.2 177.7 180.6 184.6 195.7 186.8
NuTech/G2 Gen 5Z-295 95 181.6 179.0 183.5 183.3 182.9 176.5
Rupp 8xp280 193.2 183.6 182.7 166.7 180.6 170.9
Rupp xrD97-56 97 181.6 159.7 189.4 197.7 188.8 181.4
Rupp xrD99-30 99 188.1 177.0 196.0 170.5 189.1 174.3
Rupp xrJ97-17 97 187.9 162.9 184.2 165.6 199.1 175.9
Stine R9313 VT2Pro RIB 95 196.4 165.5 189.3 157.9 189.2 162.6
Stine R9417 VT3Pro RIB 98 182.8 157.6 178.7 191.7 186.1 177.1
Average 189.0 173.4 186.4 181.2 190.5 174.7
Max 197.9 189.1 201.8 202.2 204.7 187.4
Min 181.5 157.6 172.7 157.9 177.7 162.6
CV % 5.7 5.2 5.9 7.4 4.9 5.2
LSD (Bu/A) 17.9 15.1 18.4 22.4 15.6 15.11
Yields adjusted to 15% moisture
Bolded yields are not significantly different than highest yielding hybrid in column.

Corn Hybrid Trial 85 - 94 Day RM Glyphosate Resistant Average of Locations
Company Hybrid RM Trait Seed Trt
Average
TW
Average
MS %
Average
Yield
Average
Value
Channel 192-09VT3PRIB 92 VT3P P500/VO 56.6 24.8 178.4 $500.58
Croplan 3399SS/RIB 93 SS,RR2 ACC 56.4 25.0 178.5 $498.56
Croplan 3499VT3P 94 VT3P,RR2 ACC 56.4 24.9 177.0 $495.50
Dairyland DS-9791RA 91 SSX,RR2 SA1250 56.5 25.0 175.5 $489.64
Dekalb DKC43-10 93 VT2P ACC/VO 56.8 24.4 177.8 $500.07
Dyna-Gro D29VC30 89 VT DoublePro ACC 500 56.8 24.3 172.0 $484.52
Dyna-GroD32VC56 92 VT DoublePro ACC 500 56.6 24.9 175.9 $492.27
Golden Harvest G92T43-3220 92 GT,CB,WBC AV CMP 500 56.7 24.3 177.1 $498.78
Great Lakes 3847 88 VT2 RIB P500/VO 56.9 24.1 171.6 $486.00
Great Lakes 4206 92 SmartStax RIB P500/VO 56.7 24.7 171.8 $481.65
Great Lakes 4250 92 SmartStax P500/VO 56.8 24.3 175.9 $496.03
Hyland 8295RA 90 SSX-RA CRMXX 250 56.4 24.7 173.6 $486.21
Hyland 8202RA 91 SSX-RA CRMXX 250 56.7 24.6 177.6 $498.42
Hyland 8315RA 92 SSX-RA CRMXX 250 56.4 25.0 176.8 $493.27
Mycogen 2V357 93 SmartStax RA CRMXX 250 56.2 25.2 178.0 $494.69
Mycogen 2K395 94 SmartStax RA CRMXX 250 56.1 25.3 170.1 $473.19
NK Brand NK29T-3220 92 GT,CB,WBC AV CMP 500 56.6 24.7 173.3 $486.93
NuTech/G2 Gen 5X-894 94 HXT/RR2 P500/VO 56.8 24.4 173.6 $488.90
Rupp xrD90-64 90 AgriSure VIP3220 CR 250 56.7 24.7 168.2 $471.64
Rupp xrT94-06 94 GENVT3Pro ACC 250 56.6 24.7 175.6 $492.21
Stine 9207 GTCBLL 90 GTCBLL ACC 56.7 24.4 176.3 $497.10
Stine R9209 VT2Pro RIB 90 VT2Pro ACC 56.4 25.1 175.1 $487.85
Average 56.6 24.7 175.0 $490.64
Yields adjusted to 15% moisture Max 56.9 25.3 178.5 $500.58
Min 56.1 24.1 168.2 $471.64
Bolded yields are not statistically different than highest yielding hybrid in column
CV % 7.4
LSD (Bu/A) 8.7
Value = gross value/acre based on $3.25/Bu with drying charges deducted for moisture over 15.0%.

Corn Hybrid Trial 85 - 94 Day RM Glyphosate Resistant Yield by Location
Yield by Location Bu/A
Company - Hybrid RM Kingston Capac Filion Sandusky Elkton Reese
Channel 192-09VT3PRIB 92 178.9 168.3 182.3 168.5 170.3 202.1
Croplan 3399SS/RIB 93 177.7 171.2 182.5 171.0 180.1 188.6
Croplan 3499VT3P 94 176.0 179.1 174.0 170.7 172.9 189.7
Dairyland DS-9791RA 91 172.7 172.7 180.7 169.7 168.8 188.6
Dekalb DKC43-10 93 183.1 170.5 177.8 172.8 166.9 196.0
Dyna-Gro D29VC30 89 179.0 161.5 175.2 163.9 163.6 188.8
Dyna-GroD32VC56 92 176.6 167.9 171.1 173.1 174.3 192.4
Golden Harvest G92T43-3220 92 176.9 172.9 173.8 175.9 177.9 185.4
Great Lakes 3847 88 175.0 163.9 174.0 165.5 165.1 185.8
Great Lakes 4206 92 168.1 171.0 174.6 163.4 168.7 184.8
Great Lakes 4250 92 179.8 162.9 189.4 156.9 169.1 197.1
Hyland 8295RA 90 172.7 155.8 182.0 179.6 170.6 180.8
Hyland 8202RA 91 173.2 162.0 185.3 185.6 175.1 184.3
Hyland 8315RA 92 165.7 170.2 175.1 184.3 179.7 185.6
Mycogen 2V357 93 176.8 163.5 175.4 180.5 178.4 193.4
Mycogen 2K395 94 170.6 169.1 165.3 154.8 173.8 187.0
NK Brand NK29T-3220 92 179.8 163.3 175.8 171.5 164.8 184.5
NuTech/G2 Gen 5X-894 94 177.2 169.2 182.5 154.5 173.7 184.3
Rupp xrD90-64 90 177.5 155.3 169.2 165.8 161.7 179.4
Rupp xrT94-06 94 178.6 171.3 184.0 166.2 162.2 191.0
Stine 9207 GTCBLL 90 176.3 174.9 168.2 166.7 167.2 204.3
Stine R9209 VT2Pro RIB 90 173.6 162.6 183.4 167.8 169.8 193.2
Average 175.7 167.2 177.3 169.5 170.7 189.4
Max 183.1 179.1 189.4 185.6 180.1 204.3
Min 165.7 155.3 165.3 154.5 161.7 179.4
CV % 5.5 5.5 5.4 6.4 6.8 5.7
LSD (Bu/A) 16.3 15.5 16.2 18.3 19.6 18.1
Yields adjusted to 15% moisture
Bolded yields are not statistically different than highest yielding hybrid in column.

Corn Fungicide Trial
Corn Fungicide Study
Purpose:
To compare the effect of two fungicides, sprayed at a vegetative growth stage, and an untreated check
on corn yield.
Methods:
Priaxor (8 oz./A) and Stratego YLD (5 oz./A) were sprayed on corn at growth stages V5 (Elkton site) and
V6 (Kingston site). Applications were made at 40 psi, and 15 gallons per acre. The applications were
made at each site on June 27 and were 28 days, and 37 days after planting at the Elkton and Kingston
sites, respectively.
Results:
The statistical analysis was conducted on the MSU campus, in cooperation with the Dr. Martin Chilvers
Field Crops Pathology Lab. The lab reports p Values, rather than CV % and LSD. A p Value of greater
than 0.05 should be viewed as non-significant. Therefore, there were no significant differences among
any treatment at either site, and no significant differences when the data sets were combined.
Elkton Kingston Average
Treatment Yield Bu/A Yield Bu/A2 Yield Bu/A3
Priaxor 175.0 174.6 174.8
Stratego 174.5 173.2 173.8
Untreated Check 173.6 173.3 173.4
p Value 0.66 0.84 0.8
ns ns ns

Corn Nitrogen Rate Study
Corn Nitrogen Study
Purpose: To compare the effect of nitrogen fertilizer applied at six rates as a sidedress application on yield in a
high yielding environment.
Methods: 28% UAN was applied at six rates – 0, 50, 100, 150, 200, 250 pounds per acre. The application was
made as a sidedress application at the V5 growth stage, on June 27.
Pre-Sidedress nitrate samples were pulled prior to the fertilizer application. The results showed that the nitrate
level was 30ppm, giving a nitrogen credit of 180 pounds per acre.
This study was conducted at the Filion site, a heavy textured soil. No pre-plant nitrogen fertilizer was applied. The
previous crop was sugar beets. The average cost of N/lb. applied during the summer was $460/T of 28% UAN.
Results: Results show that only the 0 pound per acre rate yielded significantly less than the other rates. All oth-
er nitrogen fertilizer rates yielded statistically similar to the 250 pound per acre rate, which was the highest rate,
and the highest yield.
Discussion: Value = gross value/acre based on $3.25/Bu with drying charges deducted for moistures
over 15.0%. Total value = value minus the cost of nitrogen ($0.82/lb) applied per treatment.
$-
$100.00
$200.00
$300.00
$400.00
$500.00
$600.00
250 lb 200 lb 150 lb 100 lb 50 lb 0 lb
$346.97 $379.62 $420.62
$458.99 $487.21 $522.04
Total value (Value - N cost)
N Rate MS % Yield Bu/A Value N cost: Total value
(Value - N cost)
250 lb N/A 29.1 211.4 a $ 551.97 $205.00 $ 346.97
200 lb N/A 28.7 206.6 a $ 543.62 $164.00 $ 379.62
150 lb N/A 29.0 206.6 a $ 543.62 $123.00 $ 420.62
100 lb N/A 29.1 202.3 a $ 540.99 $82.00 $ 458.99
50 lb N/A 28.8 205.6 a $ 528.21 $41.00 $ 487.21
0 lb N/A 28.8 198.4 b $ 522.04 $0.00 $ 522.04
Average 28.9 205.2
CV (%) 5.6
LSD Bu/A 12.6

Corn Depth of Planting Trial
Purpose:
The purpose of this study was to evaluate the effect of planting depth on corn yield.
Methods:
Corn was planted at three depths – 0.75 in. (shallow depth), 1.5 in. (standard depth), and 2.0 in (deep depth) at three locations – Kingston, Capac, Reese. The hybrid Great Lakes 4567VT3PRIB was used at all three sites.
Results:
Statistics were not run on these results. However, the standard 1.5 in. depth appears to provide for the greatest yield, and the shallow 0.75 in. depth appears to provide for the least yield. The average yield of the 1.5 in. depth was 2.6 bushels per acre greater than the 2.0 in. depth, and 6.9 bushels per acre greater than the 0.75 depth.
Depth
Yiel
d B
u/A

Corn Planting Speed Trial
Purpose:
The purpose of this study was to evaluate the effect of planting speed on corn yield.
Methods:
Corn was planted at three speeds – 1.5 mph (slow speed), 4.0 mph (standard speed), and 5.8 mph
(fast speed at four locations – Kingston, Capac, Elkton, Reese. Great Lakes Hybrid 4567VT3PRIB
was used at all four sites.
Results:
Statistics were not run on these results. However, there appears to be an increasing trend in yield
as speeds decrease. The average yield of the 1.5 mph planting was 4.3 bushels per acre greater
than the 4.0 mph planting, and 4.9 bushels per acre greater than the 5.8 mph planting.
Yiel
d B
u/A

Corn Seed Treatment Study:
Poncho/VOTiVO
Purpose:
The purpose of this study was to compare corn yields of two seed treatments on corn at each location of the TARE Trials. Poncho is a systemic insecticide corn seed treatment for the control of certain insect pests and VOTiVO is a biological seed treatment for protection from soil nematodes. The cost of the additional VOTiVO seed treatment is approximately $6.80/acre.
Current company yield data shows that 60% of the sites have a positive response with the ad-dition of VOTiVO with 40% having very little yield differences. The highest responses have been shown to occur in light textured soils. Differences would be attributed to the amount of insect and soil nematode pressure within any particular field. The TARE sites have historically been planted in locations that are rotated with several crops that would reduce the incidence of insect and nematode pressure on corn.
Method:
The two seed treatments were applied to Great Lakes Hybrid 4879 RR planted within the TARE Trials at each of the location sites and replicated four times. The average of the results were statisti-cally analyzed to determine any significant differences between the Poncho vs Poncho/VOTiVO seed treatments.
Results:
Two of the five plots had a positive response with the addition of VOTiVO. However, when the plots were averaged, there was no significant differences between treatments.
- - - Yield Bu/A - - -
Treatment Capac Elkton Filion Kingston Reese Average
Poncho 500/VOTiVO 179.5 255.5 199.6 185.8 211.4 206.4
Poncho 250 181.2 260.6 203.7 182.7 203.0 206.2
CV (%) 5.7
LSD (bu/A) 17.6
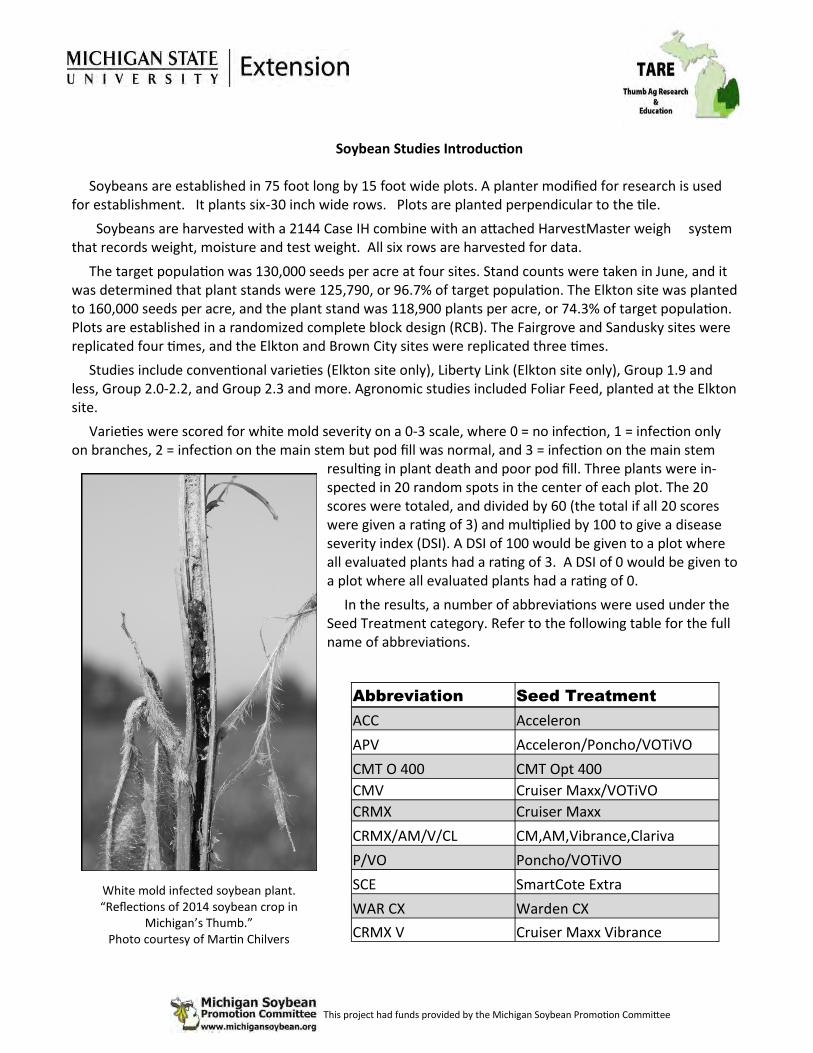
Soybean Studies Introduction
Soybeans are established in 75 foot long by 15 foot wide plots. A planter modified for research is used for establishment. It plants six-30 inch wide rows. Plots are planted perpendicular to the tile.
Soybeans are harvested with a 2144 Case IH combine with an attached HarvestMaster weigh system that records weight, moisture and test weight. All six rows are harvested for data.
The target population was 130,000 seeds per acre at four sites. Stand counts were taken in June, and it was determined that plant stands were 125,790, or 96.7% of target population. The Elkton site was planted to 160,000 seeds per acre, and the plant stand was 118,900 plants per acre, or 74.3% of target population. Plots are established in a randomized complete block design (RCB). The Fairgrove and Sandusky sites were replicated four times, and the Elkton and Brown City sites were replicated three times.
Studies include conventional varieties (Elkton site only), Liberty Link (Elkton site only), Group 1.9 and less, Group 2.0-2.2, and Group 2.3 and more. Agronomic studies included Foliar Feed, planted at the Elkton site.
Varieties were scored for white mold severity on a 0-3 scale, where 0 = no infection, 1 = infection only on branches, 2 = infection on the main stem but pod fill was normal, and 3 = infection on the main stem
resulting in plant death and poor pod fill. Three plants were in-spected in 20 random spots in the center of each plot. The 20 scores were totaled, and divided by 60 (the total if all 20 scores were given a rating of 3) and multiplied by 100 to give a disease severity index (DSI). A DSI of 100 would be given to a plot where all evaluated plants had a rating of 3. A DSI of 0 would be given to a plot where all evaluated plants had a rating of 0.
In the results, a number of abbreviations were used under the Seed Treatment category. Refer to the following table for the full name of abbreviations.
Abbreviation Seed Treatment
ACC Acceleron
APV Acceleron/Poncho/VOTiVO
CMT O 400 CMT Opt 400
CMV Cruiser Maxx/VOTiVO
CRMX Cruiser Maxx
CRMX/AM/V/CL CM,AM,Vibrance,Clariva
P/VO Poncho/VOTiVO
SCE SmartCote Extra
WAR CX Warden CX
CRMX V Cruiser Maxx Vibrance
This project had funds provided by the Michigan Soybean Promotion Committee
White mold infected soybean plant. “Reflections of 2014 soybean crop in
Michigan’s Thumb.” Photo courtesy of Martin Chilvers

Soybean Variety Trials Late Maturity 2.3 or More Glyphosate Resistant Average of Locations
Company Variety Mat
SCN
Source
Average
T.W.
Average
MS %
Average
Bu/A
Average
Value
White Mold
(DSI)
Asgrow AG2433 2.4 PI88788 58.0 14.5 48.5 $468.42 53.0
Asgrow AG2632 2.6 PI88788 57.8 14.7 50.2 $484.37 52.5
Beck's 229NR 2.3 PI88788 58.3 14.1 52.7 $510.59 49.7
Beck's 241NR 2.4 PI88788 58.0 14.5 50.3 $486.50 47.8
Beck's 278R4 2.7 PI88788 58.0 14.6 50.8 $490.93 39.7
Channel 2306R2 2.3 PI88788 58.0 14.4 52.1 $504.16 50.2
Channel 2508 2.5 PI88788 58.2 14.3 53.0 $512.36 51.7
Croplan R2C2394 2.3 PI88788 58.1 14.4 51.6 $499.18 59.5
Dairyland DSR-2612R2Y 2.6 PI88788 58.0 14.6 52.2 $505.14 46.7
DF Seeds DF 5244 N R2Y 2.4 PI88788 58.0 14.5 51.8 $500.06 63.0
DF Seeds DF 5263 R2Y/STS 2.5 None 57.8 14.7 51.3 $495.20 64.9
Dyna-Gro S24RY65 2.4 PI88788 57.8 14.7 51.6 $498.67 56.7
Dyna-Gro S25RY44 2.5 PI88788 58.0 14.5 52.1 $503.52 56.0
Dyna-Gro S26RS75 2.6 PI88788 57.8 14.8 50.9 $491.06 58.3
Great Lakes 2319 R2 2.3 PI88788 58.1 14.4 50.8 $490.84 58.6
Great Lakes 2469 R2 2.4 PI88788 57.8 14.7 49.8 $481.24 51.8
Hyland HS 24RY05 2.4 None 58.1 14.3 53.8 $520.54 52.9
Hyland 5A255RR2 2.5 PI88788 57.8 14.8 50.3 $485.43 45.9
Hyland HS 25RYS47 2.5 PI88788 57.9 14.6 50.4 $487.14 65.4
Hyland HS 26RYS16 2.6 PI88788 57.8 14.7 51.2 $493.81 50.9
Mycogen 2N263R2 2.4 None 58.2 14.4 51.3 $496.66 43.4
NuTech 7233 G2 Genetics 2.3 PI88788 58.1 14.4 51.9 $502.06 50.7
NuTech 7240 G2 Genetics 2.4 Peking 58.0 14.6 50.7 $489.95 54.7
NuTech 7250 G2 Genetics 2.5 Peking 58.0 14.6 49.6 $479.63 54.5
NuTech 7261 G2 Genetics 2.6 PI88788 57.9 14.6 52.6 $508.18 43.0
Rupp rs7245 2.4 PI88788 58.0 14.6 51.4 $496.09 59.0
Rupp rs7251 2.5 PI88788 58.0 14.5 52.8 $510.75 55.0
Rupp rs7262 2.6 PI88788 58.0 14.6 49.1 $473.64 60.0
Stine 24RE03 2.4 PI88788 57.8 14.8 52.6 $507.37 52.2
Yield adjusted to 13.0 % moisture Average 51.3 $495.64 53.4
Bolded yields are not statistically different than the highest yielding variety in column.
High 53.8 $520.54 65.4
Low 48.5 $468.42 39.7
Value = gross value/acre based on $9.75/Bu with discounts of $0.05/point of moisture over 13%.
CV (%) 6.1
LSD (Bu/A) 3.9
White Mold Disease Severity Index (DSI) ratings are an average rating and were taken at the Elkton, Fairgrove and Sandusky locations. A “0” rating represents no infection, and a “3” represents infection on the main stem resulting in plant death and or pod fill. See explanation of White Mold DSI on page 16, Soybean Introduction.
This project had funds provided by the Michigan Soybean Promotion Committee

Soybean Variety Trials Late Maturity 2.3 or More Glyphosate Resistant Yield By Location
Yield By Location Bu/A
Company Variety Mat Trait Seed Trt
Brown
City Elkton
Fair-
grove Sandusky
Asgrow AG2433 2.4 RR2Y ACC 44.0 53.4 47.3 49.1
Asgrow AG2632 2.6 RR2Y ACC 46.1 52.8 52.3 49.5
Beck's 229NR 2.3 RR, SCN ESC 52.1 54.2 56.5 48.0
Beck's 241NR 2.4 RR, SCN ESC 47.1 52.1 54.1 48.0
Beck's 278R4 2.7 RR, SCN ESC 48.1 55.2 50.5 49.6
Channel 2306R2 2.3 R2 ACC 50.6 54.3 54.9 48.8
Channel 2508 2.5 R2 ACC 53.5 54.8 53.0 50.7
Croplan R2C2394 2.3 RR2/SCN WAR CX 49.2 53.7 53.1 50.6
Dairyland DSR-2612R2Y 2.6 R2Y,Rpslk CMT O 400 51.0 54.5 52.7 50.7
DF Seeds DF 5244 N R2Y 2.4 R2Y APV 51.6 56.0 48.2 51.3
DF Seeds DF 5263 R2Y/STS 2.5 STS R2Y APV 49.7 53.6 54.9 46.9
Dyna-Gro S24RY65 2.4 RR2Y ACC 52.1 53.1 51.8 49.6
Dyna-Gro S25RY44 2.5 RR2Y ACC 49.1 52.4 54.7 52.1
Dyna-Gro S26RS75 2.6 RR2YSTS ACC 52.1 52.5 51.2 47.8
Great Lakes 2319 R2 2.3 R2 P/VO 46.9 54.1 53.3 48.7
Great Lakes 2469 R2 2.4 R2 P/VO 47.5 52.4 46.1 53.4
Hyland HS 24RY05 2.4 RR2Y CMV 53.8 56.8 53.5 51.2
Hyland 5A255RR2 2.5 RR2Y/SCN CMV 48.8 52.3 50.4 49.7
Hyland HS 25RYS47 2.5 RR2Y/SCN CMV 47.0 54.8 52.0 48.1
Hyland HS 26RYS16 2.6 RR2Y/SCN CMV 51.3 51.9 52.0 49.4
Mycogen 2N263R2 2.4 RR2 CRMX 50.0 52.2 50.9 52.2
NuTech 7233 G2 Genetics 2.3 RR1 SCE 49.3 56.2 51.1 51.1
NuTech 7240 G2 Genetics 2.4 RR1 SCE 48.5 51.8 50.8 51.5
NuTech 7250 G2 Genetics 2.5 RR1 SCE 45.1 53.3 51.8 48.4
NuTech 7261 G2 Genetics 2.6 RR1 SCE 51.9 57.0 52.5 49.0
Rupp rs7245 2.4 RR2Y CRMX 52.5 54.5 48.0 50.5
Rupp rs7251 2.5 RR2Y CRMX 51.2 53.1 54.8 52.2
Rupp rs7262 2.6 RR2Y CRMX 44.6 52.3 50.8 48.6
Stine 24RE03 2.4 RR2 53.0 53.1 52.7 51.5
Yield adjusted to 13.0% moisture Average 49.6 53.7 51.9 49.9
High 53.8 57.0 56.5 53.4
Low 44.0 51.8 46.1 46.9
CV (%) 7.4 4.5 7.7 5.8 Bolded yields are not statistically different than the highest yielding variety in column. LSD (Bu/A) 7.2 4.7 6.7 4.8
This project had funds provided by the Michigan Soybean Promotion Committee

Soybean Variety Trials Mid Maturity 2.0 - 2.2 Glyphosate Resistant Average of Locations
Variety Mat
SCN
Source
Average
T.W.
Average
MS %
Average
Bu/A
Average
Value
White Mold
(DSI)
Asgrow AG2031 2.0 PI88788 57.7 14.8 51.9 $500.40 44.4
Asgrow AG2035 2.0 PI88788 58.0 14.3 52.9 $512.33 39.6
Asgrow AG2232 2.2 PI88788 58.3 14.2 51.5 $498.55 43.0
Channel 2108 2.1 PI88788 58.0 14.5 55.2 $533.16 28.7
Channel 2105R2 2.1 PI88788 58.4 14.1 52.9 $512.45 36.5
Croplan R2C2072 2.0 PI88788 58.3 14.1 55.0 $532.14 32.9
Croplan R2C2124 2.1 PI88788 58.2 14.3 53.1 $514.05 47.5
Dairyland DSR-2105R2Y 2.1 PI88788 58.2 14.2 53.9 $521.35 45.0
DF Seeds DF 5213 N R2Y 2.1 Peking 58.1 14.4 51.5 $497.81 38.2
Dyna-Gro S20RY45 2.0 PI88788 57.8 14.6 51.7 $499.15 41.6
Dyna-Gro S20RY94 2.0 PI88788 58.0 14.5 55.2 $534.05 39.5
Dyna-Gro S22RY64 2.2 PI88788 57.8 14.6 50.5 $487.75 43.1
Great Lakes 2019 R2 2.0 PI88788 57.7 14.7 50.7 $489.91 46.6
Great Lakes 2039 R2 2.0 PI88788 58.1 14.3 52.6 $509.48 38.9
Great Lakes 2289 R2 2.2 PI88788 57.8 14.7 51.7 $498.39 42.9
Hyland HS 22RYS03 2.2 PI88788 57.9 14.5 52.9 $510.87 45.4
Mycogen 5N206R2 2.0 PI88788 57.6 14.9 53.3 $513.86 41.3
Mycogen 5N223R2 2.2 PI88788 58.1 14.3 53.2 $514.17 41.2
NK Brand S20-T6 2.0 PI88788 58.1 14.3 54.0 $506.32 41.0
NK Brand S22-S1 2.2 PI88788 58.3 14.2 53.8 $517.76 42.3
NuTech 7204R2 G2 Gen 2.0 PI88788 58.0 14.5 52.3 $506.54 37.3
NuTech 7216 G2 Gen 2.1 PI88788 58.1 14.4 53.4 $512.25 28.1
Rupp rs7222 2.2 PI88788 58.0 14.5 52.4 $495.25 44.2
Stine 20RD20 2.0 PI88788 58.1 14.3 53.0 $521.96 45.5
Stine 22RD00 2.2 PI88788 58.3 14.1 51.3 $521.33 39.3
Yields adjusted to 13.0% moisture Average 52.8 $510.45 40.6
High 55.2 $534.05 47.5
Bolded yields are not statistically different than the Low 50.5 $487.75 28.1
highest yielding variety in column. CV (%) 6.3
LSD (Bu/A) 3.1
Value = gross value/acre based on $ 9.75/Bu with
discounts of $0.05/point of moisture over 13%.
White Mold Disease Severity Index (DSI) ratings are an average rating and were taken at the Elkton, Fairgrove
and Sandusky locations. A “0” rating represents no infection, and a “3” represents infection on the main stem
resulting in plant death and poor pod fill. See explanation of White Mold DSI on page 16, Soybean Introduction.
This project had funds provided by the Michigan Soybean Promotion Committee

Soybean Variety Trials Mid Maturity 2.0 - 2.2 Glyphosate Resistant Yield By Location
Yield by Location Bu/A
Company Variety Mat Trait Seed Trt
Brown
City Elkton
Fair-
grove Sandusky
Asgrow AG2031 2.0 RR2Y ACC 45.2 51.4 55.5 55.3
Asgrow AG2035 2.0 RR2Y ACC 44.0 56.0 55.6 56.1
Asgrow AG2232 2.2 RR2Y ACC 44.2 53.5 52.1 56.3
Channel 2108 2.1 R2 ACC 53.8 59.8 57.0 50.1
Channel 2105R2 2.1 R2 ACC 50.0 54.7 52.5 54.4
Croplan R2C2072 2.0 RR2/SCN WAR CX 46.7 60.9 56.2 56.1
Croplan R2C2124 2.1 RR2/SCN WAR CX 47.2 55.3 53.9 56.1
Dairyland DSR-2105R2Y 2.1 R2Y,Rpslk CMT O 400 47.5 57.4 57.6 53.1
DF Seeds DF 5213 N R2Y 2.1 R2Y APV 44.1 53.0 56.1 52.8
Dyna-Gro S20RY45 2.0 RR2Y ACC 43.6 55.8 55.2 52.1
Dyna-Gro S20RY94 2.0 RR2Y ACC 51.7 53.7 59.8 55.8
Dyna-Gro S22RY64 2.2 RR2Y ACC 42.0 52.6 59.4 48.1
Great Lakes 2019 R2 2.0 R2 P/VO 48.1 53.0 53.5 48.4
Great Lakes 2039 R2 2.0 R2 P/VO 50.2 55.1 51.6 53.5
Great Lakes 2289 R2 2.2 R2 P/VO 43.0 55.3 56.1 52.2
Hyland HS 22RYS03 2.2 RR2Y/SCN CMV 44.4 57.5 57.6 52.0
Mycogen 5N206R2 2.0 RR2 CRMX 49.4 55.9 53.3 54.5
Mycogen 5N223R2 2.2 RR2 CRMX 48.5 52.0 60.7 51.4
NK Brand S20-T6 2.0 RR2Y CRMX/AM/V/CL 44.8 60.3 55.5 55.3
NK Brand S22-S1 2.2 RR2Y CRMX/AM/V/CL 47.3 53.6 59.7 54.7
NuTech 7204R2 G2 Genetics 2.0 RR2 Yield SCE 48.8 53.4 57.2 49.9
NuTech 7216 G2 Genetics 2.1 RR1 SCE 49.4 55.4 57.2 51.8
Rupp rs7222 2.2 RR2Y CRMX 46.0 54.2 57.8 51.7
Stine 20RD20 2.0 RR2 None 42.5 57.7 52.8 59.0
Stine 22RD00 2.2 RR2 None 40.3 52.7 60.6 51.5
Average 46.5 55.2 56.2 53.3
Yields adjusted to 13.0% moisture High 53.8 60.9 60.7 59.0
Low 40.3 51.4 51.6 48.1
CV (%) 8.1 5.1 7.1 6.1
LSD (Bu/A) 7.4 5.5 6.7 5.5
Bolded yields are not statistically different than the highest yielding variety in the column.
This project had funds provided by the Michigan Soybean Promotion Committee

Soybean Variety Trials
Early Maturity 1.9 or Less
Glyphosate Resistant
Average of Locations
Company Variety Mat SCN Source
Average
T.W.
Average
MS %
Average
Bu/A
Average
Value
White Mold
(DSI)
Asgrow AG1832 1.8 PI88788 58.1 14.4 50.7 $490.17 36.9
Asgrow AG1835 1.8 PI88788 58.2 14.3 49.1 $475.74 36.0
Asgrow AG1935 1.9 PI88788 58.1 14.5 51.8 $500.59 43.6
Croplan R2C1770 1.7 PI88788 58.1 14.3 50.2 $486.06 30.8
Croplan R2C1873 1.8 PI88788 58.1 14.4 50.7 $490.89 29.7
Dairyland DSR-1515R2Y 1.5 PI88788 58.1 14.4 52.4 $507.19 33.9
DF Seeds DF 51931 N R2Y 1.9 PI88788 58.1 14.3 52.3 $506.58 30.6
Dyna-Gro 34RY17 1.7 PI88788 58.1 14.3 52.1 $504.23 34.4
Great Lakes 1441 R2 1.4 None 58.1 14.4 52.5 $507.64 28.1
Great Lakes 1689 R2 1.6 PI88788 58.2 14.3 51.7 $500.65 30.5
Great Lakes 1829 R2 1.8 PI88788 58.2 14.3 52.5 $508.08 41.0
Hyland HS 14RYS44 1.4 PI88788 58.1 14.4 50.5 $488.63 17.4
Hyland HS 15RYS45 1.5 PI88788 58.0 14.4 50.6 $489.03 25.8
Hyland HS 18RY09 1.8 None 58.0 14.4 50.2 $485.84 35.1
Hyland HS 18RYS13 1.8 PI88788 57.9 14.6 48.7 $471.20 37.8
Mycogen 5B130R2 1.3 None 58.2 14.2 51.0 $493.80 20.4
NuTech 7157 G2 Genetics 1.5 PI88788 58.1 14.3 51.3 $496.54 27.7
Rupp rs7184 1.8 PI88788 58.0 14.5 51.9 $502.31 32.3
Stine 14RD62 1.4 PI88788 58.1 14.4 52.4 $507.03 23.9
Syngenta NK Brand S19-Z9 1.9 PI88788 58.2 14.3 50.8 $491.32 35.5
Yields adjusted to 13.0 % moisture Average 51.2 $495.18 31.6
High 52.5 $508.08 43.6
Bolded yields are not statistically different than the highest yielding variety.
Low 48.7 $471.20 17.4
CV (%) 6.9
LSD Bu/A 3.5
Value = gross value/acre based on $ 9.75/Bu with dis-
counts of $0.05/point of moisture over 13.0 %.
White Mold Disease Severity Index (DSI) ratings are an average rating and were taken at the Elkton, Fairgrove and Sandusky locations. A “0” rating represents no infection, and a “3” represents infection on the main stem resulting in plant death and poor pod fill. See explanation of White Mold DSI on page 16, Soybean Introduction.
This project had funds provided by the Michigan Soybean Promotion Committee

Soybean Variety Trials
Early Maturity 1.9 or Less
Glyphosate Resistant
Yield By Location
Yield By Location Bu/A
Company Variety Mat Trait Seed Trt
Brown
City Elkton
Fair-
grove Sandusky
Asgrow AG1832 1.8 RR2Y ACC 39.8 56.2 58.0 48.9
Asgrow AG1835 1.8 RR2Y ACC 33.8 55.0 56.4 51.4
Asgrow AG1935 1.9 RR2Y ACC 38.4 55.7 56.8 56.2
Croplan R2C1770 1.7 RR2/SCN WAR CX 33.1 56.1 58.1 53.5
Croplan R2C1873 1.8 RR2/SCN WAR CX 39.4 56.6 55.4 51.5
Dairyland DSR-1515R2Y 1.5 R2Y,Rpslk CMT O 400 45.1 55.8 55.5 53.4
DF Seeds DF 51931 N R2Y 1.9 R2Y APV 44.8 53.7 58.2 52.7
Dyna-Gro 34RY17 1.7 RR2Y ACC 45.8 53.1 56.7 52.9
Great Lakes 1441 R2 1.4 R2 P/VO 38.4 55.6 61.3 54.6
Great Lakes 1689 R2 1.6 R2 P/VO 38.2 56.3 57.7 54.7
Great Lakes 1829 R2 1.8 R2 P/VO 43.0 58.2 54.0 54.8
Hyland HS 14RYS44 1.4 RR2Y/SCN CMV 35.7 55.4 57.6 53.5
Hyland HS 15RYS45 1.5 RR2Y/SCN CMV 40.4 53.2 56.9 51.8
Hyland HS 18RY09 1.8 RR2Y CMV 36.7 52.8 58.4 53.0
Hyland HS 18RYS13 1.8 RR2Y/SCN CMV 39.8 51.6 55.5 48.0
Mycogen 5B130R2 1.3 41.0 55.8 56.3 50.9
NuTech 7157 G2 Genetics 1.5 RR1 SCE 41.5 54.4 57.4 51.9
Rupp rs7184 1.8 RR2Y CRMX 42.1 55.9 57.4 52.4
Stine 14RD62 1.4 RR2 None 39.7 56.8 60.0 53.0
Syngenta NK Brand S19-Z9 1.9 RR2Y CRMX/AM/V/CL 39.7 54.5 57.0 51.9
Yields adjusted to 13.0% moisture Average 39.8 55.1 57.2 52.5
Bolded yields are not statistically different than the highest yielding variety in column.
High 45.8 58.2 61.3 56.2
Low 33.1 51.6 54.0 48.0
CV (%) 9.9 6.0 5.5 7.4
LSD (Bu/A) 7.8 6.5 5.3 6.6
This project had funds provided by the Michigan Soybean Promotion Committee

This project had funds provided by the Soybean Promotion Committee
Soybean Variety Trial Liberty Link Specialty Soybeans
Company Variety Mat Seed Trt
SCN
Source TW MS% Yield Bu/A
DF Seeds DF 9182 N LL 1.8 APV PI88788 58.0 14.4 50.5
DF Seeds DF 9221 N LL 2.2 APV PI88788 57.8 14.9 50.6
DF Seeds DF 9251 N LL 2.5 APV None 57.7 15.1 56.0
Great Lakes 2239 LL 2.2 None 57.8 14.8 54.4
NuTech 3153L 1.5 SCE PI88788 57.8 14.9 55.0
NuTech 3181L 1.8 SCE PI88788 57.7 14.9 53.4
NuTech 3223L 2.2 SCE PI88788 57.8 14.9 51.9
NuTech 3248L 2.4 SCE PI88788 57.8 14.8 55.5
Stine 22LD23 2.2 PI88788 57.8 14.9 52.3
Stine 24LD00 2.4 PI88788 57.9 14.8 53.3
Yields adjusted to 13.0% moisture Ave 57.8 14.8 53.3
High 58.0 15.1 56.0
Low 57.7 14.4 50.5 Bolded yields are not statistically different than the highest yielding variety. CV (%) 2.87
LSD (Bu/A) 3.2
According to USDA, in 2012,
soybean exports increased
40% through the year with
$668.7 million in exports.

This project had funds provided by the Soybean Promotion Committee
Soybean Variety Trial
Conventional Non-GMO Sandusky, MI
Company Variety Mat Traits Seed Trt
SCN
Source T.W. MS%
Yield
Bu/A
DM
Prot %
DM
Oil %
DF Seeds D 251 N/S 2.5 Non GMO APV PI88788 58.0 14.6 53.3 41.0 19.6
DF Seeds DF 155 F
2.5 Non GMO APV None 57.9 14.9 53.9 42.1 20.1
DF Seeds DF 242 N/S 2.4 Non GMO APV PI88788 58.0 14.6 53.0 43.1 20.5
DF Seeds Lily
2.5 Non GMO APV None 58.0 14.8 48.3 43.4 19.6
DR Seeds Jackson F
2.5 Non GMO APV None 57.8 15.2 49.4 43.1 19.8 Huron Commodities
OAC Avatar 1.9 CRMX V 57.9 14.8 55.8 40.8 20.3 Huron Commodities
OAC Brooke 2.2 CRMX V 58.1 14.4 55.5 43.9 19.5 Huron Commodities
OAC Marvel 2.1 CRMX V PI88788 58.0 14.7 48.7 42.9 20.6 Huron Commodities
SG 2311 2.3 CRMX V 57.8 15.0 52.6 42.7 20.3
Hyland HS 21CS43 2.1 SCN CMV PI88788 58.1 14.6 49.6 41.8 20.6
Schillinger 247r 2.4 57.9 15.0 46.3 45.5 19.7
Schillinger r S20-G7 2.0 57.9 14.9 50.9 43.7 20.4
ZFSelect 1326 2.6 P/VO PI88788 58.0 14.8 54.6 41.2 20.3
ZFSelect 1407 0.7 57.8 15.0 49.9 45.9 19.2
ZFSelect 1414 1.4 57.8 15.0 51.3 44.0 19.8
ZFSelect 1420 LS
2.2 Low Sat Oil CRMX None 57.9 14.8 51.7 41.1 19.2
ZFSelect 251 LS
2.5 Low Sat Oil P/VO None 58.0 14.8 53.8 41.2 20.3
ZFSelect 728 LL
2.7 Low Linolenic P/VO None 57.9 14.8 49.0 42.1 20.3
ZFSelect eMerge 1993 1.9 CRMX PI88788 58.2 14.5 47.5 40.5 19.3
Yields adjusted to 13.0% moisture Average 57.9 14.8 51.3 42.6 20.0
High 58.2 15.2 55.8 45.9 20.6
Low 57.8 14.4 46.3 40.5 19.2
CV (%) 7.6 Bolded yields are not statistically different than the highest yielding variety. LSD (Bu/A) 7.8

Soybean Trial
Foliar Feed Fertilizer
This project had funds provided by the Michigan Soybean Promotion Committee
Treatment Yield Bu/A
UTC 59.2 a
TMR-F 58.5 a
SRN+TMR-F 57.7 a
CV (%) 3.2
LSD Bu/A ns
Purpose: The purpose of this trial was to observe two foliar fertilizer products, and their effect on
soybean yield. The field used for this study had optimum to above optimum fertility, according to the
MSU Soil and Plant Nutrient Lab.
Method: The two foliar feed products were Nachurs TMRF and Nachurs SRN. According to the
manufacturer, Nachrurs TMRF contains: 3.4% total nitrogen, 1.82% available phosphate, 1.82% solu-
ble potash, .27% manganese, and .0008% molybdenum. The SRN product contains 28% nitrogen, 72%
of which is slow release. The three treatments were TMRF at 1 gallon per acre, TMRF + SRN at one gal-
lon per acre each, and an untreated check (UTC). The application was made at soybean stage R1. The
manufacturer recommends a second application 1.5 gal./A TMRF and 1.5 gal./A SRN at R3. That appli-
cation was not made on this study.
The soil at the site was analyzed prior to planting. The fertility results were: pH - 7.5; Phosphorus - 22
ppm; Potassium - 155 ppm; and CEC - 13.4.
The cooperating grower supplied liquid fertilizers at the bottom of a 9” strip tillage slot, including 2
gal/A 28% N, 4 gal/A Nachurs TMR-DP (2-8-11-1.2S), and 1.5 qt/A Nachurs Soy Grow micro mix. These
products were mixed together. Additionally, 3 gal/A Nachurs G20 (6-24-6), and 3.5 gal/A Nachurs K-
Thiol (0-0-25-17S) were applied. The grower cooperator recommends that you consult an agronomist
for your own fertility needs. Cost for both products is $12.26/acre.
The products were sprayed 49 days after planting on July 18, 2014.
Thanks to Randy and David Reibling for cooperating and supplying product.
Results and Discussion: There were no statistical differences between treatments. According to
MSU Fertilizer recommendations, a response would not be expected.

Soybean Trial
Depth of Planting Speed of Planting
This project had funds provided by the Michigan Soybean Promotion Committee
Depth of Planting Study
Purpose: The purpose of this study was to evaluate the effect of planting depth on soybean yield.
Methods: Soybean was planted at three depths – 0.75 inch; 1.5 inch; and 2.0 inches at two locations –
Brown City and Fairgrove. The variety NK S20-T6 was used at both sites.
Results: Statistics were not
run on these results. While the
0.75 in. depth treatment did
yield the greatest, all yields
appear to be similar.
Yiel
d B
u/A
Depth of Planting (in.)
Speed of Planting Study
Purpose: The purpose of this
study was to evaluate the effect of
planting speed on soybean yield.
Methods: Soybean was planted
at three speeds – 1.5 mph (slow
speed), 4.0 mph (standard
speed), and 5.8 mph (fast speed)
at two locations – Brown City
and Fairgrove. The variety
NK S20-T6 was used at both sites.
Results: Statistics were not run
on these results. The 1.5 and 4.0
mph speeds appeared to yield simi-
larly, and greater than the 5.8 mph speed.
Yiel
d B
u/A
Speed of Planting (mph)

This project had funds provided by the Michigan Soybean Promotion Committee
Soybean
Clariva ™ Complete Beans Seed Treatment Trial
Purpose: The purpose of this trial was to evaluate the effect of the Pasturia nishizawae contained in
Clariva Complete Beans on SCN populations and soybean yields in 2014.
Procedure: Two seed treatments (Clariva Complete Beans and CruserMaxx + Vibrance) were applied to SCN-
resistant soybean seed and compared at four locations in Michigan in 2014. Each treatment was replicated six
times in the Ingham trial, four times in the TARE trials in Tuscola. (The St. Clair and Sanilac County trials had no
detectable SCN and were not used in the data summary.) A RCB experimental design was used at each location.
Soil samples were taken at planting and harvest to determine the effect of the treatments on SCN populations.
Results: The Clariva Complete Beans seed treatment did not improve soybean yields at any of the four
locations when compared to the CruiserMaxx + Vibrance seed treatment. SCN was present at the TARE site in
Tuscola County and in the Ingham County trials and the Clariva Complete Beans seed treatment did not affect
soybean yields at either of these sites or when the two sites were combined and analyzed. The Ingham County
location had the highest SCN population so the PI, PF and PF/PI are reported for this location. The Clariva Com-
plete Beans seed treatment did not significantly affect SCN development at this location.
Treatment Ingham Tuscola **Average
Average
Income ($/ac)
- - - Yield (Bu/A) - - -
CruiserMaxx + Vibrance 51.6 a 51.4 a 51.5 a $499
Clariva Complete Beans 52.2 a 52.9 a 52.5 a $498
LSD0.10 2.1 5.9 2.0
Soybean price = $10.00 per bushel Clariva Complete Beans seed treatment cost = $26.80 per acre CruiserMaxx + Vibrance seed treatment cost = $16.10 per acre
Fig. 1 Average yield for Tuscola and Ingham sites.

This project had funds provided by the Michigan Soybean Promotion Committee
Soybean Variety Study Soybean Cyst Nematode Resistance Analysis
Purpose:
Soybean cyst nematode (Heterodera glycines), or SCN, remains the number one cause of yield loss for soybeans in the United States. In order to determine the significance of this pest at sites in the Thumb area, the Michigan Soybean Promotion Committee funded this project to measure the effect that varie-ty selection has on SCN. Identifying varieties that are able to yield in environments that have con-firmed SCN will enable producers to make informed decisions about resistance management.
Since each site is unique and may have different types of SCN. The ability to withstand SCN at one site may not indicate the ability of the variety to withstand SCN at other farms and field sites. Several genes provide resistance to SCN in soybeans for each of the sources of resistance (PI88788, Peking, etc.). And not every soybean variety described as resistant to SCN necessarily possesses all of the resistance genes. Therefore, SCN-resistant soybean varieties can vary greatly in the amount for nematode resistance they possess, as well as in their agronomic performance.
Methods:
At the Fairgrove soybean variety trials for TARE, each of the four replications for each variety (20 early, 25 mid, and 29 late maturity) was sampled for SCN. The sampling of each treatment was done at the time of planting (Pi) and after harvest (Pf) to detect if there had been an increase in SCN during the growing season. The four treatment samples were combined according to variety and submitted to the MSU Diagnostic Lab for detection of SCN cysts, SCN eggs, and SCN juveniles. The samples from this site will also be type tested to determine which population of SCN is predominant at this site. Other TARE soybean sites were not tested.
Results:
The results for this study are reported by group in Table 1. The SCN reproduction factor is: (Pf) # SCN eggs & juveniles at harvest divided by (Pi) # SCN eggs & juveniles at planting (Pf/Pi=SCN reproduc-tion factor). A SCN reproduction factor of 1.0 or less indicates that there was no increase or a reduc-tion in SCN eggs & juveniles during the growing season.
Table 1. Early Varieties Mid Varieties Late Varieties
SCN Source Susceptible Peking PI88788 Susceptible Peking PI88788 Susceptible Peking PI88788
Number 3 --- 17 --- 1 24 4 2 23
Yield Bu/A 58.7 --- 56.9 --- 56.1 56.2 52.2 52.2 51.8
Average - Nematodes per 100 cm3 soil
Planting SCN Eggs + Juv (Pi)
160 --- 213 --- 1 217 104 132 197
Harvest SCN Eggs & Juv (Pf)
4960 --- 1655 --- 5920 2054 597 2560 2202
Pf/Pi = SCN Reproduction Factor
P factor 1481 --- 382 --- 5920 306 93 389 733

Yard Compost in a Corn/Soybean Rotation Study
Purpose: The purpose of this study is to evaluate the use of compost generated from yard waste
that can be used as a soil amendment applied in a corn/soybean rotation. The goal is to determine if
an economical rate can be applied that will maintain crop yields, increase soil quality, and reduce
commercial fertilizer use. This study is funded as a Farmer/Rancher grant by North Central SARE for
two years.
Methods: Three farmers were selected in Lapeer and St. Clair County that have a corn/soybean
rotation. Each farm had soil tests done by the Michigan State University Soil Lab (Table 1.) and the
Woods End Soil Laboratory in Mount Vernon, ME. The Woods End Laboratory is utilizing the USDA-
ARS H3A Extraction Method Soil Test to evaluate soil health. A comparison of the soil tests will be
done at the end of the trial. 5 tons/acre was applied in a RCB with four replications.
Results: Two locations had a 6.2 % yield response, however only one of the responses was signifi-
cantly better than the control. The average of all plots shows a trend for a positive yield response of
3.7 %, however, it was not significantly better than the control (Table 2).
Table 1. MSU Soil Lab - Spring 2014 Soil Test Results
Site: North Branch Almont China
Soil type: Boyer Loamy Sand Conover Loam Allendale-Lenawee-Toledo Complex
pH: 6.6 6.3 6.8
Phosphorus (P) ppm: 41 55 51
Potassium (K) ppm: 90 190 60
Magnesium (Mg) ppm: 131 191 171
Calcium (Ca) ppm: 770 1725 1255
CEC: 5.2 11.9 7.9
Fertilizer applied: 100 lbs. 0 - 0 - 60 none 120 lbs. 0 - 0 - 60
Other: 5 lbs. 20-20-20 Foliar
Variety: Lilly Asgrow 2632 Croplan R2C 2980
Previous crop: corn corn corn
Plant date: 20-May-14 4-Jun-14 27-May-14
Harvest date: 27-Oct-14 24-Oct-14 28-Nov-14
Table 2. Location
North Branch Almont China Average
Treatment - - - Yield Bu/A - - -
Control 44.4 a 53.3 a 47.7 a 48.5 a
5 Ton/A 47.1 a 53.0 a 50.7 b 50.3 a
CV (%) 3.0 1.0 1.2 7.3
LSD (Bu/A) ns ns 1.9 ns

This field has had 4 randomized and replicated strips of 3 different rates of P2 O 5 since 2008. The strips are no
phosphorus (P), low phosphorus, and a high rate of phosphorus. The strips have remained constant since the plot
work started. The 2013 crop was sugar beets and annual rye grass was flown on 15 days prior to harvest. Once
harvested, 100 lbs/A of potash (K2O) was applied to the whole field; no fall tillage was performed.
Annual rye grass burn-down occurred June 3, and a deep tillage occurred on June 9 (strip-tilled) to remove com-
paction from sugar beet harvest. The following day a vertical tillage tool was used to level the site. Ten gallons of
28% nitrogen (N), ten gallons of water along with 1.33 pint of Dual Magnum was broadcast and incorporated with
the vertical tillage tool. Black bean variety 06252, upright, was planted June 16 in 7.5 in. twin rows over the slotted
strips at 117,000 seeds per acre, and rolled prior to planting. The post emergent weed control program was Basa-
gran 10 oz; Reflex 7 oz; Raptor 3 oz; crop oil and AMS. Basagran was applied a second time at 10 oz. A white mold
preventive spray was applied Aug 1st using Propluse. There was some white mold damage and an additional appli-
cation for white mold prevention would have been beneficial.
Fertilizer applied on the No-P strips was 3 gallons of 0-0-25 and 3 gallons of 28% N, for a total of 39 lbs. N, 0 lbs.
P, and 9 lbs. potassium (K).
Fertilizer applied on the Low-P strips was 5.2 gallons of 6-24-6; 2 gallons of 0-0-25; and 2 gallons of 28% N, for a
total of 39lbs. N, 14 lbs. P, and 9.8 lbs K.
Fertilizer applied on the High-P strips was 15 gallons of 6-24-6 for a total of 39 lbs. N, 40.5 lbs. P, and 10.5 lbs. K.
The site is comprised of 2 fields: the front field and back field. The soil type in the front field is a Kilmanagh loam
and the back field is a Shebeon loam.
In the fall of 2014, fertilizer was applied using three rates of phosphorus and planted to wheat using a no-till drill.
Soil samples will be taken after wheat harvest to determine draw down and in preparation for next year’s trial.
Huron Conservation District
Phosphorus Reduction
Study

Location: JGDM McConnachie Farms Deckerville, MI Collaborators: DuPont, Bayer, BASF
Soil Type Parkhill silt loam Previous crop: dry beans Variety: Ambassador Nitrogen rate: 110 lbs/ac
Plot design: RCB Replications: four Plot area: 18 x 65 ft Treatment area: 17 x 65 ft Harvest area: 15 x 60 ft
Planting date: Oct 3, 2013 Seeding rate: 1.8 m/ac Harvest date: July 24, 2014
Herbicide: none Insecticide: none
Effect of fungicides on the performance of winter wheat, 2014
Martin Nagelkirk, Michigan State University Extension Each year a fungicide efficacy trial is conducted on soft winter wheat in collaboration with industry to observe the performance of various fungicide products. A randomized complete block design with four replications was superimposed on a commercial stand of Ambassador soft white winter wheat. The variety is particularly susceptible to Septoria
leaf spot, Stagonospora leaf blotch and Fusarium head blight. The fungicide products, rates and application timings are provided in Table 1 below. The fungicides were applied using a tractor mounted boom sprayer. Alll treatments included a nonionic surfactant (Induce) at the rate of 0.125 percent. The T1, (feekes growth stages 6) applications were made on May 9; the T1.5 (growth stage 7) on May 19; and the T2 (growth stage 9) on May 29. These three application timings were made using 16 gallons of water per acre, 45 psi and Turbo TeeJet 11002 nozzles. The early flower treatment timing (T3; growth stage 10.51) was applied on June 10 using Turbo TeeJet Duo bodies with double 11001 nozzles, 16 gallons of water per acre, and 45 psi. Other than a trace of Septoria leafspot and powdery mildew, leaf diseases were not found throughout the vegetative stages. However, during grain-fill both leaf rust and Stagonospora leaf blotch levels became notable. In addition to rating leaf diseases, the severity and incidence of fusarium head blight was estimated.
The trial was harvested on July 9 using an International 2144 combine equipped with a Juniper HarvestMaster system that provided grain weight, test weight, and moisture. Grain samples were collected to test for DON levels. Statistical analysis was performed by the Adam Byrne, Research Associate, MSU. Although the site had a relatively consistent stand, the wheat exhibited considerable variability in growth presumably due to inconsistent levels of winter injury and variable soil conditions.
T1 T1.5 T2 T3
1 non treated control 14.5 a 61.4 a 107.5 e
2 Apr Prima 6.8oz x 14.5 a 61.4 a 112.9 cde
3 Aproach 3oz, Apr Prima 6.8oz. x x 14.5 a 61.4 a 111.3 cde
4 Apr Prima 3.4oz., Prosaro 6.5 oz. x x 14.7 a 61.2 a 114.5 bcde
5 Apr Prima 6.8oz, Prosaro 6.5oz x x 14.5 a 61.4 a 116.2 bcd
6 Stratego 4oz x 14.5 a 61.4 a 111.5 cde
7 Prosaro 6.5oz x 14.7 a 61.2 a 109.6 cde
8 Prosaro 6.5oz & Baythroid 2oz x 14.6 a 61.3 a 109.0 de
9 Prosaro 6.5 x 14.5 a 61.4 a 112.3 cde
10 Prosaro 8oz x 14.6 a 61.4 a 114.1 bcde
11 Stratego 2oz ,Prosaro 6.5oz x x 14.7 a 61.3 a 114.0 bcde
12 Priaxor 2oz, Caramba 13.5oz x x 14.5 a 61.4 a 117.0 bc
13 Priaxor 2oz, Caramba 13.5oz, (extra N)2
x x 14.7 a 61.4 a 121.2 ab
14 Priaxor 4oz, Caramba 13.5oz (extra N)2
x x 14.6 a 61.2 a 117.1 bc
15 Priaxor 2oz, Caramba 17 oz (extra N)2
x x 14.6 a 61.4 a 125.0 a
16 Caramba 13.5oz x 14.4 a 61.4 a 111.1 cde
Table 1: Effect of fungicides on the grain moisture, test weight and
yield of soft winter wheat, Deckerville,MI 2014
fungicide treatment 1timing
1 all fungicides applied with Induce nonionic surfactant at 0.125% ;
2 received 45 lbs additional N fertilzer per acre ³ reported as dry grain (13% moisture)
moist.
%
tst wt
lbs
yield ³ bu/ac
harvested grain

Table 1 provides the results pertaining to the grain’s moisture and test weight at harvest, and grain weight expressed as yield in bushels per acre of dry grain (13 percent moisture content). All fungicide treatments resulted in an increase in grain yield ranging from 4 to 10 bushels per acre. However, only the highest yielding treatments proved statistically significant. Where a fungicide was combined with an extra 45 lbs of fertilizer N, yields were further improved (note treatments 13, 14, and 15). At harvest, there were no significant differences in test weight or grain moisture. Grain samples were sent to the University of Minnesota to determine DON levels. All fungicide applications significantly reduced levels of Leaf rust, Septoria leaf spot, and Stagonospora leaf blotch (table 2). Where Prosaro or Caramba was applied at early flower (T3), the average Don levels were reduced by a third. In addition, these products at this timing consistently and significantly reduced both Fusarium incidence and index. The Fusarium severity rating was not altered by any fungicide treatment.
Stagonospora leaf blotch was the
dominant disease on flag leaves.
timing Lf rust Septoria
T1 T1.5 T2 T3 incid. sev. index DON
1 non treated control 2.6 a 4.1 a 3.3 a 10.9 a 15 a 56 a 8.2 a 0.52 ab
2 Apr Prima 6.8oz x 0.5 bc 1.4 bcd 0.3 b 4.0 bcd 15 a 56 a 8.4 a 0.55 a
3 Aproach 3oz, Apr Prima 6.8oz. x x 0.9 bc 1.8 bc 0.3 b 3.8 bcd 13 ab 63 a 7.9 a 0.44 abcd
4 Apr Prima 3.4oz., Prosaro 6.5 oz. x x 0.3 c 1.4 bcd 0.0 b 2.5 d 9 bc 39 a 3.5 b 0.41 abcd
5 Apr Prima 6.8oz, Prosaro 6.5oz x x 0.5 bc 2.0 bc 0.0 b 4.6 bc 7 cd 34 a 2.4 b 0.31 cdef
6 Stratego 4oz x 0.3 c 1.3 bcd 0.1 b 3.8 bcd 16 a 45 a 7.3 a 0.41 abcd
7 Prosaro 6.5oz x 0.4 bc 1.1 cd 0.1 b 4.1 bcd 13 ab 58 a 7.1 a 0.45 abc
8 Prosaro 6.5oz & Baythroid 2oz x 0.4 bc 2.0 bc 0.3 b 4.4 bcd 8 cd 48 a 3.4 b 0.18 f
9 Prosaro 6.5 x 0.9 bc 2.1 b 0.3 b 5.4 b 8 cd 50 a 3.7 b 0.37 abcde
10 Prosaro 8oz x 0.8 bc 1.5 bcd 0.1 b 5.0 b 7 cd 50 a 3.6 b 0.26 def
11 Stratego 2oz ,Prosaro 6.5oz x x 0.6 bc 1.8 bc 0.1 b 4.1 bcd 6 cd 43 a 2.3 b 0.38 abcd
12 Priaxor 2oz, Caramba 13.5oz x x 0.6 bc 1.5 bcd 0.0 b 4.0 bcd 7 cd 56 a 3.9 b 0.33 cdef
13 Priaxor 2oz, Caramba 13.5oz, (extra N)2
x x 1.3 b 1.6 bcd 0.3 b 4.1 bcd 5 d 53 a 2.7 b 0.27 cdef
14 Priaxor 4oz, Caramba 13.5oz (extra N)2
x x 0.4 bc 0.8 d 0.1 b 3.8 bcd 6 cd 48 a 2.7 b 0.36 bcdef
15 Priaxor 2oz, Caramba 17 oz (extra N)2
x x 0.8 bc 1.3 bcd 0.0 b 2.6 cd 6 cd 50 a 2.7 b 0.26 def
16 Caramba 13.5oz x 0.9 bc 1.9 bc 0.0 b 4.4 bcd 6 cd 45 a 2.5 b 0.19 ef
Table 2: Effect of fungicides on leaf diseases and Fusarium head blight if winter wheat, Deckerville, MI, 2014
⁴ leaf rust and Stagonospora leaf blotch on flag leaf surface as percent
³ leaf rust on flag leaf as %; Septoria leaf spot given as relative score on no. 2 leaf1 all fungicides applied with Induce nonionic surfactant at 0.125%;
2 received 45 lbs additional N fertilzer per acre
Lf rust Stag. Fusarium head blight ratingsfungicide treatment 1
rated July 2 ⁴ rated June 23 ³
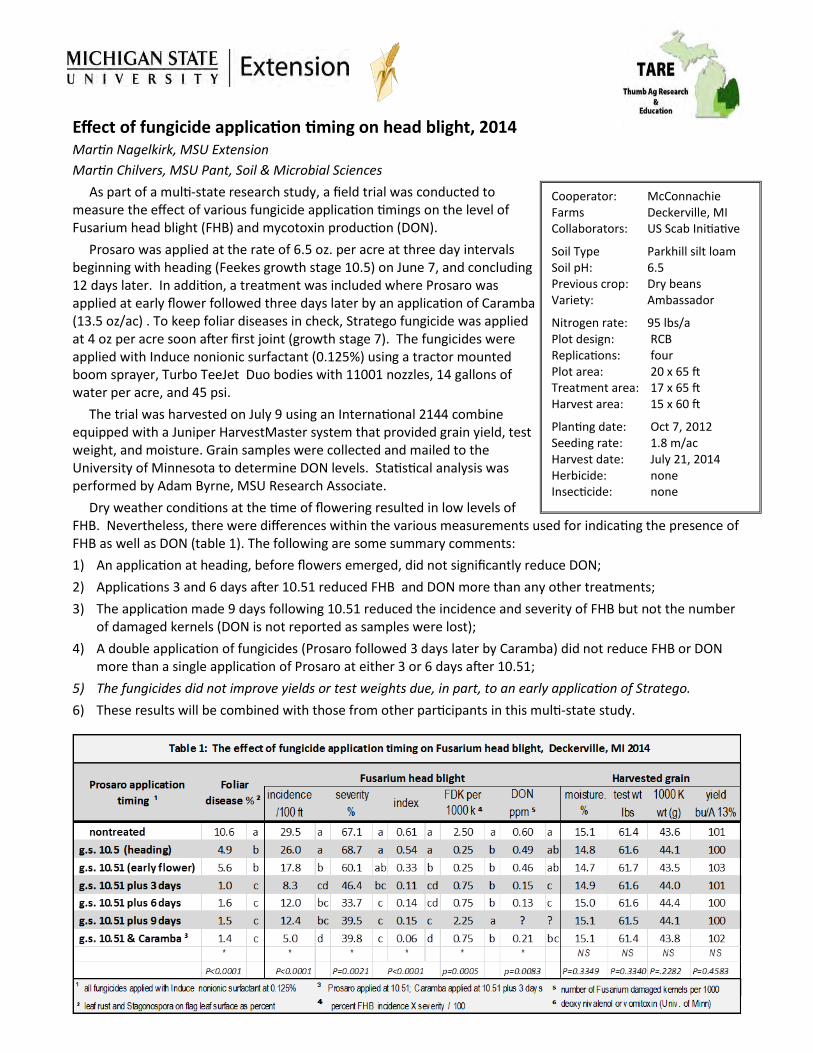
Effect of fungicide application timing on head blight, 2014 Martin Nagelkirk, MSU Extension
Martin Chilvers, MSU Pant, Soil & Microbial Sciences
As part of a multi-state research study, a field trial was conducted to measure the effect of various fungicide application timings on the level of Fusarium head blight (FHB) and mycotoxin production (DON).
Prosaro was applied at the rate of 6.5 oz. per acre at three day intervals beginning with heading (Feekes growth stage 10.5) on June 7, and concluding 12 days later. In addition, a treatment was included where Prosaro was applied at early flower followed three days later by an application of Caramba (13.5 oz/ac) . To keep foliar diseases in check, Stratego fungicide was applied at 4 oz per acre soon after first joint (growth stage 7). The fungicides were applied with Induce nonionic surfactant (0.125%) using a tractor mounted boom sprayer, Turbo TeeJet Duo bodies with 11001 nozzles, 14 gallons of water per acre, and 45 psi.
The trial was harvested on July 9 using an International 2144 combine equipped with a Juniper HarvestMaster system that provided grain yield, test weight, and moisture. Grain samples were collected and mailed to the University of Minnesota to determine DON levels. Statistical analysis was performed by Adam Byrne, MSU Research Associate.
Dry weather conditions at the time of flowering resulted in low levels of FHB. Nevertheless, there were differences within the various measurements used for indicating the presence of FHB as well as DON (table 1). The following are some summary comments:
1) An application at heading, before flowers emerged, did not significantly reduce DON;
2) Applications 3 and 6 days after 10.51 reduced FHB and DON more than any other treatments;
3) The application made 9 days following 10.51 reduced the incidence and severity of FHB but not the number of damaged kernels (DON is not reported as samples were lost);
4) A double application of fungicides (Prosaro followed 3 days later by Caramba) did not reduce FHB or DON more than a single application of Prosaro at either 3 or 6 days after 10.51;
5) The fungicides did not improve yields or test weights due, in part, to an early application of Stratego.
6) These results will be combined with those from other participants in this multi-state study.
Cooperator: McConnachie Farms Deckerville, MI Collaborators: US Scab Initiative
Soil Type Parkhill silt loam Soil pH: 6.5 Previous crop: Dry beans Variety: Ambassador
Nitrogen rate: 95 lbs/a Plot design: RCB Replications: four Plot area: 20 x 65 ft Treatment area: 17 x 65 ft Harvest area: 15 x 60 ft
Planting date: Oct 7, 2012 Seeding rate: 1.8 m/ac Harvest date: July 21, 2014 Herbicide: none Insecticide: none

The effect of Palisade EC plant growth regulator on the performance of soft winter wheat, 2014 Martin Nagelkirk, MSU Extension Educator For a third year, a field trial was conducted to observe the effect of Palisade®EC plant growth regulator on the performance of soft winter wheat. A randomized complete block design with four replications was superimposed on a commercial stand of Ambassador soft white winter wheat. The Palisade treatments, listed in table 1, include a split application, and applications at various growth stages (Feekes), and several product rates. These treatments were applied to plots that received 165 lbs/ac of fertilizer nitrogen (N). In addition, treatments included variable N rates with a single rate and timing (12 oz. at gs 7) of Palisade. A tractor mounted boom sprayer that delivered 14 gal/ac of water through Turbo TeeJet 02 nozzles with a pressure of 40 psi. All treatments received Prosaro fungicide at early flowering. Varying application timings and rates of Palisade had little effect on grain yield. However, increasing rates of fertilizer N did improve grain yields and the use of Palisade protected against plant lodging. Statistical analysis will be reported once completed and the data will be combined with that from the past two years to create a three year summary.
Trial Information
Collaborator: JGDM McConnachie Farms Deckerville, MI
Soil Type: Parkhill silt loam Previous crop: Dry beans Wheat variety: Ambassador Planting date: October 3, 2013 Harvest date: July 24, 2014
Plot design: RCB Replications: Four Plot size: 18 x 65 ft. Treatment area: 17 x 65 ft. Harvest area: 15 x 65 ft.
Fertilizer N rate: Various Herbicide: None Fungicide: Prosaro Insecticide: None
Comparisons Treatment
(oz/ac & growth
stage)
Grain
yield
bu/ac
Harv.
Moist.
%
Test
weight
lbs.
Plant
height
in.
Plant
lodging
%
heads #
per foot
of row
kernels
per head
#
1,000
kernel
wt, g
nontreated: control 110.7 15.1 60.9 34.4 14.5 35.4 26.3 42.7
split application: 6 oz at g.s. 7 & 8 113.1 15.1 60.9 33.7 0.0 37.0 26.1 42.1
10 oz at 5 113.2 15.1 60.9 35.3 1.8 35.2 26.7 43.3
10 oz at g.s. 7 * 113.0 15.1 60.9 33.4 0.3 36.0 26.2 41.7
10 oz. g.s. 8 113.7 15.2 60.9 34.1 8.0 36.2 27.0 43.5
8 oz. at g.s.7 113.9 15.2 60.9 33.6 0.0 37.6 26.2 42.9
10 oz at g.s.7 * 113.0 15.1 60.9 33.4 0.3 36.0 26.2 41.7
12 oz at g.s. 7 ** 112.8 15.2 60.9 33.3 1.5 36.5 25.9 42.4
14 oz. at g.s.7 110.3 15.1 60.9 32.3 0.0 35.9 26.5 42.6
16oz at g.s.7 112.1 15.2 60.9 33.4 1.8 37.4 26.7 42.9
90 control 106.2 15.2 60.9 34.3 1.8 33.9 25.0 44.0
varialble N 90 12 oz at g.s.7 102.7 15.1 60.9 33.1 1.5 33.6 26.2 42.7
rates (lb/ac) 110 12 oz at g.s.7 108.5 15.2 60.9 34.0 0.3 34.2 26.5 43.3
165 12 oz at g.s.7 ** 112.8 15.2 60.9 33.3 1.5 36.5 25.9 42.4
* same data source used for application timing and rate comparisons. Nagelkirk
Table 1: Effect of Palisade on the performance of soft winter wheat, Deckerville MI, 2014
application
timings:
M Nagelki rk, 2014
** same data source used for application timing and rate comparisons.
application rates:

LABOR:
Farm Labor Unskilled7 = $ 13.17 per hour $3.60 per gallon of fuel
Farm Labor Skilled7 = $ 16.08 per hour$3.96 per gallon lube & fuel cost
TRACTORS ONLY: max. min.Custom
$/HourMachine
Cost $/Hour Est. Fuel
Gal. / HourEst. Fuel Cost
per Hour
No Driver or fuel costs MFWD - +260 hp. $ 143.00 $ 143.00 $143.00 $111.17 9.95 $39.40
MFWD - 200 hp. $ 125.00 $ 55.47 $86.44 $77.13 7.04 $27.88
MFWD - 130 hp. $ 80.60 $ 42.60 $63.57 $51.25 5.72 $22.65
Est. Tractor Cost $0.27/hp/hr. 2- WD - 75 hp. $ 56.88 $ 20.25 $36.13 $23.30 3.3 $13.07
Est. Fuel use .044 gal. diesel/PTO hp / hour 2- WD - 40 hp. $25.00 $11.66 1.76 $6.97
Auto Steer systems charge per acre $2.29
TILLAGE OPERATIONS: Custom $/Acre 1 max. min.Total Machine
Cost/ Ac 3
Machine Rate per
Hour4Acres/Hr. 5
Est. Fuel
Gal./Acre6
Plowing: Moldboard (6 bottom) $18.69 $ 21.34 $ 14.67 $23.38 $97.49 4.17 1.32
Chisel Plow (23 ft.) $16.65 $ 20.50 $ 11.65 $11.14 $145.15 13.03 0.60
Chisel – front disk (16.3 ft.) $16.68 $13.87 $127.74 9.21 0.97
Vertical tillage $19.25 $ 22.45 $ 15.48
Disk-V.Ripper combo (17.5 ft) $20.53 $ 21.00 $ 19.50 $21.60 $194.83 9.02 1.47
Subsoiler 30" - 10ft (12-15") $18.98 $ 21.67 $ 15.56
Discing - tandem (21 ft) $14.42 $ 20.40 $ 9.96 $10.67 $130.39 12.22 0.58
Field Cultivator (23 ft.) + incorp. $13.34 $ 13.35 $ 12.69 $11.75 $194.93 16.59 0.38
Field Cultivator (23 ft.) $12.45 $6.46 $107.17 16.59 0.32
Harrow $11.04 $ 17.00 $ 7.43
Soil Finisher $15.99 $ 18.44 $ 13.85
Strip tillage $18.71
Row Cultivate (12 rows) $12.84 $ 14.50 $ 9.56 $7.39 $114.18 15.45 0.46
Row Cultivate-high residue (12rows) $15.58
Stalk Shredder (20 ft.) $14.38 $ 16.88 $ 11.40 $13.13 $101.89 7.76 0.74
Rotary Hoe (21 ft.) $8.81 $ 9.15 $ 8.14 $2.62 $68.02 25.96 0.18
Land Rolling $8.10
Highboy spraying $7.69
Boom Sprayer-self-Prop.80ft. $7.85 $ 11.20 $ 5.56 $6.58 $290.31 44.12 0.14
Boom Sprayer-pull type 50ft. $6.69 $3.70 $94.76 25.61 0.10
Spraying- road ditches/ hr 62.83/hr
PLANTING: Custom $/Acre 1 max. min.Total Machine
Cost/ Ac 3
Machine Rate per
Hour 4Acres/Hr. 5
Est. Fuel
Gal./Acre6
Planter- conventional (12row) w/fert 30" corn-soys
$18.84 $ 21.77 $ 14.29 $11.92 $166.88 14.00 0.32
Planter- soybean 15" rows $17.37 $ 21.11 $ 14.62
Planter- No Till w/fert (12 row) $20.33 $ 22.56 $ 17.54
Planter- Min Till (12 row) $19.78 $ 21.60 $ 17.00 $15.12 $192.48 12.73 0.53
GPS mapping addition to planting $2.51
Variable rate seeding $2.51
Air Seeder Drill w/cart 52ft $18.14 $18.50 $408.11 22.06 0.45
Drill Soybeans Conventional $17.43 $ 19.90 $ 15.75
Drill-AirSeeder with cart $19.58
Drill- No Till (15 ft.) $18.60 $ 22.07 $ 16.01 $24.29 $154.48 6.36 0.81
Drill- No Till - drill only no tractor $12.25
2014 Custom Machine and Work Rate EstimatesFIRM Team Fact Sheet Number 13‐06Available at http://www.firm.msue.msu.eduAuthor : Dennis Stein, District Farm Business Management EducatorMichigan State University Extension • November 2013
FIRM Team Fact Sheet 13-06 • Page 1

PLANTING: Custom $/Acre 1 max. min.Total Machine
Cost/ Ac 3
Machine Rate per
Hour 4Acres/Hr. 5
Est. Fuel
Gal./Acre6
Drill press wheels - (20 ft) $16.26 $ 20.90 $ 12.46 $12.81 $108.63 8.48 0.61
Grain drill- only-no tractor $10.17
Seed Tender $3.13
Pest Control- scouting $5.00
SUGAR BEETS: Custom $/Acre 1 max. min.Total Machine
Cost/ Ac 3
Machine Rate per
Hour 4Acres/Hr. 5
Est. Fuel
Gal./Acre6
Sugar Beets - Planting (12 row) $28.25 $0.00 4.67 0.99
Sugar Beet Cultivation $14.91 $0.00 5.60 0.81
Sugar Beet Topper (8 rows) $15.63 $0.00 7.13 0.56
Sugar Beet Harvester (6 rows) $97.38 $0.00 3.03 2.22
Sugar Beet Cart ( 20 ton) $35.88 $0.00 5.20 1.80
HARVESTING: Custom $/Acre 1 max. min.Total Machine
Cost/ Ac 3
Machine Rate per
Hour 4Acres/Hr. 5
Est. Fuel
Gal./Acre6
Combine - (Corn -8 row head) $31.15 $ 32.90 $ 26.36 $43.53 $295.57 6.79 2.35
Combine - stalk chopper head $33.18 $ 38.00 $ 26.41
Combine Small grains (20 ft head) $28.95 $ 32.10 $ 22.00 $0.00 $0.00 6.79 1.49
Combine Soybeans (25 ft. head) $30.72 $0.00 $0.00 7.42 1.95
Combine Soybeans- air reel- flex $38.21 $ 39.55 $ 35.00
Combine, cart, haul to storage - Corn $42.87 $ 46.15 $ 37.50
Combine, cart, haul to storage - Soybeans $36.99 $ 43.80 $ 29.45
GPS mapping addition to harvesting $2.51
Picker 2 row- Ear Corn + 3 wagons $28.24
Combine Field Beans (belt pickup) $33.75 $33.90 $226.79 6.69 1.81
Pulling Dry Beans (knife 6 row) $9.50 $0.00 $0.00 8.73 0.66
Pulling Dry Beans (rod 6 row) $8.50 $0.00 $0.00 8.73 0.66
Dry Bean – windrowing (6 row) $9.50 $21.34 $186.30 8.73 0.66
Grain Cart- corn / acre $6.30 $ 6.80 $ 5.50 $0.00 $0.00 6.87 1.44
Chopping Forage - Pull type (2 Row corn head) / ton
$6.12/ ton $ 6.50 $ 5.45 $60.27 $83.17 1.38 3.35
Chopping Forage - Pull type Pickup head-10ft/hr.
$9.45/ ton $25.00 $101.75 4.07 1.40
Chopping Forage-Self-propelled (6 row corn head)
$247/ hr. $47.61 $65.70 1.38 2.35
Silo Filling-Tower silo: 1 Tractor, 1Chopper & Driver, Wagons
$9.53/ ton $ 13.62 $ 7.90
Bunker: Chopper and forage wagons or trucks & packer
$13/ ton
Haylage $9.50/ ton
Silage Bagging per ft. (9 ft diameter) $8.54/ ton $ 10.15 $ 4.85
Mowing $15.14 $ 20.33 $ 11.45
Raking – Hay 9ft. $8.00 $ 13.85 $ 4.19 $6.04 $21.08 3.49 0.50
Tedding $6.27
Windrowing - hay or straw $12.30 $ 12.50 $ 11.50
Mower-Conditioner Pull-type (9 ft.) $15.55 $ 19.35 $ 12.62 $13.50 $59.27 4.39 0.40
Mower-Conditioner- Self Propelled (16ft) $16.13 $ 19.35 $ 13.00 $0.00 $0.00 7.76 0.64
Mower - Conditioner- Rotary (12ft) $14.99 $ 15.75 $ 13.49 $9.28 $72.01 7.76 0.38
Small Square Baling Hay $0.82 per bale $ 0.97 $ 0.60 $13.95 $48.83 3.50 0.40
Straw $0.75 per bale $ 0.85 $ 0.55
Mow, Rake, Baler & Handle - small square $1.77 per bale $ 2.00 $ 1.45
Baler, Rake & Handle: Lrg Round $20.50/bale
Complete Hay harvesting per ton $34.44
Baling Round- 600-800 # per bale $9.00 per bale $ 10.00 $ 7.70
Baling Round -1200 -1500 # $11.23 per bale
Baler 1000# Round/ with wrapper $11.97 per bale $ 12.36 $ 11.00 $9.18 $27.63 3.01 0.35
Mow-Rake-Bale-fld Haul- Lrg. Round/bale $19.76 per bale $ 20.05 $ 18.50
Baling -1500 #- Lrg. Round - stalks/straw $12.47 per bale $ 14.00 $ 11.00
Baling -1500 #- Lrg. Round stalks / straw - with wrap
$13.82 per bale $ 15.45 $ 12.00 $13.00 $39.52 3.04 0.49
Baling – Lrg Sqr. Hay 4x3x6 $10.58 per bale $ 12.17 $ 8.35 $12.96 $150.85 11.64 0.49
Baling – Lrg Sqr. Hay 4x3x8 $13.98 per bale $ 14.02 $ 13.25
FIRM Team Fact Sheet 13-06 • Page 2

FERTILIZER: Custom $/Acre 1 max. min.Total Machine
Cost/ Ac 3
Machine Rate per
Hour 4Acres/Hr. 5
Est. Fuel
Gal./Acre6
Fertilizer Dry Bulk: Spreading $6.99 $ 10.70 $ 4.95
Lime application $9.29 $ 12.90 $ 6.30
Fertilizer- Liquid-Knifed In $11.18 $ 12.30 $ 8.94
Liquid-Sprayed: $7.60 $ 11.30 $ 5.37
Fertilizer- Anhydrous: 21 ft. $12.10 $ 12.40 $ 10.99
Manure Hauling-semi-solid - Load&Spread / hr.
87.59 per hr $ 126.00 $ 54.20 $38.66 $77.32 2.00 2.31
Liquid Manure Haul - Injected Spreader- 1000 gal.
11.22 per 1000 gal. $ 11.90 $ 10.00 $11.35 $5.68 0.50 2.86
Manure Pump, Hauling, Spreading - liquid (9500 gallon cap.) per hour
$92 / hour
Manure Pump, Hauling, Injecting 1000 gal. - liquid (9500 gallon cap.)
$12.50 per 1000 gal.
Bobcat/Skid Loader / hr. $75.85 per hr. $ 76.00 $ 72.00
Ditch Mowing $59.81 per hour
Brush Hogging $22.05 $ 28.60 $ 14.46
Grain Drying- continuous flow / point / bu. $0.04/pt./bu. $ 0.05 $ 0.03
Grain Drying- in bin dryer / point / bu. $0.06/pt/bu. $ 0.07 $ 0.04
Grain Auger / bu. $0.07 per bu.
Grain Storage / mo. $0.05/bu./mo. $ 0.06 $ 0.03
Grain Storage for season $ 0.21 per bu.
Grain Haul - per bu.- field to farmstead $0.09/ up to 10 miles .16/25mi
Grain Haul - per bu.- farm to market - 25mi $0.17/ up to 25 miles $ 0.18 $ 0.16
Power Washing per hr. 42.38
Rock picking $13.79
Custom Farming- Corn $115.44 $ 126.65 $ 95.00 (all machine operations for growing & harvest)
Custom Farming- Soybeans $97.18 $ 112.40 $ 80.00 (all machine operations for growing & harvest)
Custom Farming- Small Grains $85.00 $ 89.50 $ 76.67 (all machine operations for growing & harvest)
Fuel cost is calculated by adding fuel, oil and lube calculated by adding 10% to the power fuel cost.
$3.60 Fuel Price = $3.960 ** base fuel & lube price used
1 Custom $ per acre: Represents the rate obtained from surveys of actual farm data surveys for 2012 & 2013 from Universities listed below
to do this type of machine work for another farm on a general basis. Higher or lower rates apply in each situation depending on crop conditions, soil conditions,
size of fields and there locations. This numbers includes machine, power unit & operator where needed. Values have been adjusted higher to reflect the change in
power fuel costs noted above. Rate adjusted 2.5% above 2013 values.
3 Total Machine Cost/Acre: Includes tractor, fuel cost**, lubricants, repairs, maintenance, labor and overhead costs including depreciation. This could be considered
as an estimate of the ownership cost and operation of this machine on a per acre basis. No profit or return to management, which would be necessary for on going
enterprises were included in this number. Values are based on "Farm Machinery Economic Cost Estimates for 2012, University of Minnesota
4 Machine Rate per Hour: This number takes the Total Machine Cost per Acre and factors in the estimated Acres per Hour to give a value that
represents an estimate of the hourly operational and ownership cost of machinery supported by ©University of Minnesota, Machinery Economic
cost estimates for 2012. If the machine is run at full capacity (or engine clock hours) this per acre rate should be in the custom work value generated.
5 Acres/ Hour: This is an estimate of the acres this machine should average on a per hour basis with normal down time.
6 Gal./ Acre: This is an estimated machine use of fuel consumed to do this activity and is based on a factor of 0.044 gallons of diesel fuel.
per PTO hoursepower-hour on an average. Your individual machines fuel use may vary from this number.
7 Labor cost : Charged for this table at a rate of $15.00 per hour for unskilled tasks and $20.00 per hour for skilled labor (planter, sprayer, harvester).
Costs were developed as an adjusted estimate of common rates being used by farms in this area to cover their cost of operation.
Major shifts in power fuel cost during the past few year has had an impact on and has changed the cost of machine operational cost.
As a thumb rule it is estimated that each $1.00 increase in fuel cost, will increase most machine operations by an additional 15%.
● University of Minnesota: Machinery Economic cost estimates for 2013 © -- http://faculty.apec.umn.edu/wlazarus/documents/machdata.pdf
● Iowa State University: 2013 Iowa Farm Custom Rate Survey - Ag Decision Maker @ http://www.extension.iastate.edu/agdm/crops/html/a3-10.html
● Kansas State Univeristy: 2013 Projected Custom Rates for Kansas @ http://www.agmanager.info/farmmgt/machinery/Tools/KCD_CustomRates(Sep2013).pdf
● Texas A&M University: 2011 Texas Agricultural Custom Rates @ http://agecoext.tamu.edu/files/2013/08/2011TxCustomRates04-22-11.pdf
● NASS- USDA & Pennsylvania Department of Ag: 2013 Machinery Custom Rates- Adam Pike, April 2013 http://pss.uvm.edu/vtcrops/articles/PA_CustomRates_2013.pd
● University of Kentucky: Custom Machinery Rates March 2013 @ http://www2.ca.uky.edu/cmspubsclass/files/ghalich/CustomMachineryRatesKentucky2013.pdf
● Purdue Extension: 2013 Indiana Farm Custom Rates 06-13 @ http://www.extension.purdue.edu/extmedia/ec/ec-130-w.pdf
● University of Illinois: Machinery Cost Estimates© 5-2012, Univ. of Illinois @ http://farmdoc.illinois.edu/manage/machinery/summary%202012.pdf
● University of Nebraska Lincoln: 2012 Nebraska Farm Custom Rates May2012 @ http://ianrpubs.unl.edu/epublic/live/ec823/build/ec823.pdf
* This report is a summary of information extracted from various sources. Your actual cost may vary greatly from the numbers presented. It is recommended that
you calculate your own cost and economic returns necessary for the operation of machinery and equipment on your individual farm.
This document was compiled by: Dennis Stein, District Farm Business Management, Extension Educator, Michigan State University Extension. revised 11/2013
362 Green Street, Caro, Michigan 48723 email: [email protected] or web page: http://www.msu.edu/user/steind/
FIRM Team Fact Sheet 13-06 • Page 3

HOW TO FIGURE YOUR MACHINE WORK RATESIf you are hiring or doing custom work, the following will help you determine the custom rate. Custom rates are based on tradition
or usual rates set in the community, the bargaining positions of both parties (i.e., availability of machinery services and demand for
machinery services in your local area) and cost of operating the machines on your farm.
Cost of ownership and operation can be determined as follows:
Ownership cost per unit (e.g., acre, bushel, ton, hour)using the DIRTI 5:
1. Depreciation: original cost - salvage value $
years of use
2. Interest: interest rat x AIVa $
3. Repairs: estmated 2 to 5 % of original cost $
4. Taxes: (0 in Michigan - i.e., no taxes on personal $
property used in agriculture)
5. Insurance: (estimated 0.5% x AIV for insurance premium) $
6. Total ownership cost per year (add lines 1 thru 5) $
A. Ownership cost per unit: total ownership cost ÷ estimated (A) $
annual use (acre, hour, bushel, ton)
Operating Cost per (acre, hour, bushel, ton)
1. Tractor: fuel
(gallon fuel per unit x price/gallon) x 1.15b$
2. Machine: gas or fuel gallons per unit x 1.15b$
3. Labor: hours per unit x wage rate
(if labor wage unit is per acre, bushel or ton multiply this wage by acres
bushels or tons per hour to determine wage/hour) $
B. Total operating cost per unit (B) $
C. Total ownership and operating cost per unit (A+B) $
D. Desired profit margin and / or risk premium %
E. Custom Rate (per acre, hour, bushel, ton) Line C x [1+(Line D/100)] $
a Average investment value (AIV) = (original cost basis - salvage value) ÷ 2.
b The addition of 15 percent above fuel cost is for oil & lube. maintenance.
Author: Dennis Stein, District Farm Business Management Educator, Michigan State University Extension 362 Green Street, Caro, Michigan 48723-1032 phone: 989.672.3870 email: [email protected] web: http:www.msu.edu/user/steind
MSU is an affirmative-action, equal-opportunity employer, committed to achieving excellence through a diverse workforce andinclusive culture that encourages all people to reach their full potential. Michigan State University Extension programs andmaterials are open to all without regard to race, color, national origin, gender, gender identity, religion, age, height, weight,disability, political beliefs, sexual orientation, marital status, family status or veteran status. Issued in furtherance of MSUExtension work, acts of May 8 and June 30, 1914, in cooperation with the U.S. Department of Agriculture. Thomas G. Coon,Director, MSU Extension, East Lansing, MI 48824. This information is for educational purposes only. Reference tocommercial products or trade names does not imply endorsement by MSU Extension or bias against those not mentioned.
FIRM Team Fact Sheet 13-06 • Page 4

ASGROW / DEKALB
Monsanto Company
800 N. Lindbergh Blvd.
St. Louis, MO 63167
www.monsanto.com
BECK’S SUPERIOR
HYBRIDS
Beck’s Hybrids
6767 E 276th St.
Atlanta, IN 46031
www.beckshybrids.com
CHANNEL BIOSEED
Monsanto Company
800 N. Lindbergh Blvd.
St. Louis, MO 63167
www.channel.com
CROPLAN
Croplan Genetics
P.O. Box 64281
St. Paul, MN 55164-5324
www.croplangenetics.com
D.F. SEEDS
D.F. Seeds, Inc.
905 S. Jackson St.
Dansville, MI 48819
www.dfseeds.com
DAIRYLAND
Dairyland Seed Company
P.O. Box 958
West Bend, WI 53095
www.dairylandseed.com
DYNA-GRO
Crop Production Services
443 Allenby Drive
Marysville, OH 43040
www.dyna-groseed.com
GOLDEN HARVEST
NK BRAND
Syngenta
11055 Wayzata Blvd
Minnetonka, MN 55305
www.syngentaseeds.com
GREAT LAKES
Great Lakes Hybrids
9915 West M-21
Ovid, MI 48866
www.greatlakeshybrids.com
HURON COMMODITIES,
INC.
75 Wellington St.
Clinton, ON NOM 1LO,
Canada
HYLAND SEEDS
Hyland Seeds
1015 N. 51st St, Suite E
Grand Forks, ND 58203
www.hylandseeds.com
MYCOGEN
Mycogen Seeds
9330 Zionsville Road
Indianapolis, IN 46268
www.mycogen.com
NU TECH/G2 GENETICS
NuTech Seed, LLC
2321 North Loop Drive
Ames, IA 50010
www.nutechseed.com
RUPP
Rupp Seeds, Inc.
17919 Co. Rd. B
Wauseon, OH 43567
www.ruppseeds.com
SCHILLINGER SEED
Citizens L.L.C.
421 N. Cochran Rd.
Charlotte, MI 48813
www.citizenselevator.com
STINE
Stine Seed Co.
22555 Laredo Trl.
Adel, IA 50003
www.stineseed.com
ZF SELECT
Zeeland Farm Services, Inc.
2525 84th Avenue
Zeeland, MI 49464
www.zfsinc.com
2014 Participating Seed Companies:

MSU is an affirmative action/equal opportunity employer. Michigan State University Extension programs and materials
are open to all without regard to race, color, national origin, gender, gender identity, religion, age, height, weight, disa-
bility, political beliefs, sexual orientation, marital status, family status, or veteran status. Issued in furtherance of MSU
Extension work, acts of May 8 and June 30, 1914, in cooperation with the U.S., Department of Agriculture. Margaret
Bethel, Director, MSU Extension, East Lansing, MI 48824. This information is for educational purposes only. Reference
to commercial products or trade names does not imply endorsement by MSU Extension or bias against those not men-
tioned.

The 2014 TARE Trials were made
successful by the generous support
of the following organizations:
Corn Marketing Program of Michigan
Crop Production Services
Great Lakes Hybrids
Indian Summer Compost
Michigan Crop Improvement Association
Michigan Soybean Promotion Committee
Michigan Wheat Program
North Central S.A.R.E.
P and C Ag Solutions
Sanilac County Corn Growers
Syngenta
T N T Equipment Inc.
Weiss Farm Equipment
Yale Steel