table of contents page - county of...
TRANSCRIPT


Table of Contents Page Summary ................................................................................................................................... 1 Background ................................................................................................................................... 7 Section 1: Milwaukee County does not have a contemporary, comprehensive workforce
diversity policy…………………………………………………………………………….....8 Section 2: Milwaukee County has experienced problems with the collection and maintenance of data necessary to accurately report and effectively analyze and
manage issues relating to workforce diversity .......................................................... 17 Section 3: Milwaukee County’s overall fulltime workforce is more diverse than GMIA’s; there is wide variation in workforce diversity among fulltime staff in major County departments ............................................................................................................. 24
Section 4: Although documentation was incomplete, detailed review of available GMIA human resources data show adherence to Civil Service procedures but reflect mixed results in demonstrating an emphasis on increasing workforce diversity ...... 41 Section 5: Conclusions and Recommendations…………………………………………………….52 Exhibit 1: Audit Scope………………………………………………………………………………...57 Exhibit 2: County Board Resolution (File No. 13-97) Requesting Audit…………………………59 Exhibit 3: Milwaukee County Fulltime Employees' Race/Ethnicity as of Year-End 2013
Select Departments……………………………………………………………………….60 Exhibit 4: Milwaukee County Fulltime Employees' Race/Ethnicity as of Year-End 2013
Select Departments……………………………………………………………………….61 Exhibit 5: Response from the Department of Human Resources and GMIA………………......63
Milwaukee County Can Benefit from a Contemporary, Comprehensive Workforce Diversity Policy

Summary
Milwaukee County operates and maintains both General Mitchell International Airport (GMIA) and
Lawrence J. Timmerman Field under authority granted by Chapters 59 and 114 of the Wisconsin
Statutes. The Airport Director is responsible for operations of the Airport Division, with a 2014
Adopted Budget expenditure appropriation of $84.2 million. The 2014 budget includes funding for
273.6 Fulltime Equivalent (FTE) positions for the division, of which 5.7 FTE are in the form of
seasonal/hourly/pool positions. This audit of General Mitchell International Airport personnel
practices was initiated in response to a request contained in a County Board Resolution (File No.
13-97; see Exhibit 2). Although this audit began with a focus on personnel practices with respect
to workforce diversity at General Mitchell International Airport, many of our findings and
recommendations are Countywide in scope.
Milwaukee County does not have a contemporary, comprehensive workforce diversity policy. Included among ‘whereas’ clauses providing context and a rationale for the resolution requesting
this audit of GMIA personnel practices is the following statement:
WHEREAS, it is vital that GMIA is reflective of the County’s commitment to diversity because it is the “gateway” for persons visiting Milwaukee County for business or leisure; and…
That statement presumes there is an established, well-recognized and uniformly understood policy
or principle that defines the “County’s commitment to diversity.” Our research indicates that, at the
beginning of our audit fieldwork, there was no comprehensive, definitive statement of policy
regarding diversity in the Milwaukee County workforce. Consequently, a review of important
developments in the evolution of federal laws and regulations, federal Executive Branch actions,
judicial decisions and County personnel practices over several decades is informative in attempting
to accurately describe the “County’s commitment to diversity” as referenced in County Board
Resolution 13-97. Section 1 of this report provides an overview of developments in that evolution,
including the Department of Human Resources’ recent efforts to work with the Office of the County
Executive and the various departmental diversity committees to develop a Diversity Committee
mission statement and goals for Countywide application.
1

Since 2007, Milwaukee County has experienced problems with the collection and maintenance of data necessary to accurately report and effectively analyze and manage issues relating to workforce diversity. The County’s 2007 conversion to its current Ceridian Human Resources management information
system created problems affecting its ability to manage workforce diversity issues. Subsequent
corrective measures have been ad hoc, limited in scope and have lacked an overall policy initiative
to fashion a cohesive workforce diversity objective. Ceridian conversion applied EEO-1 (Private
Sector) racial/ethnicity classifications, which are more detailed than the EEO-4 (State & Local
Governments) classifications that are necessary for Milwaukee County to comply with mandatory
federal reporting requirements. This negatively affected the accuracy and completeness of County
racial/ethnicity reports. Based on a review of year-end County workforce data for 2010, 2011 and
2012, we concluded that data from 2011 forward was relatively complete. However, we were
unable to rely on historic data to analyze the County’s workforce diversity during the period 2007
through 2010, and chose to focus our review primarily using 2012 and 2013 data. In addition,
Ceridian conversion problems/confusion appear to have resulted in suspension of the County’s
ability to provide departments with annual ‘underutilization’ reports for affirmative action plan
development and monitoring purposes.
Clean-up of potential inconsistencies in job classifications, some of which may have preceded the
Ceridian conversion, was one of the objectives of the Human Resources Division’s Job Evaluation
Questionnaire (JEQ) project. However, the former Director of Compensation was using EEO-1
(Private Sector) job categories in lieu of EEO-4 (State & Local Governments) job categories in
reviewing, re-titling and re-classifying Milwaukee County positions. Our survey of other counties
locally and nationally shows that Milwaukee County’s assignment of EEO-1 Job Categories to
government job titles is not a common or ‘Best Practice.’ The County Director of Employee
Benefits, currently serving in the additional capacity of Interim Director of Compensation, indicated
that EEO-1 job categories are used by the major national compensation surveys and is useful
information for the County’s Compensation Division. He pointed out that the County competes in
the same labor market as the private sector for many positions. He also stated that the County
must maintain accurate EEO-4 data for mandatory federal reporting requirements. During the
course of audit work, managers within the Office of the Comptroller’s Payroll Division and the
Human Resources Compensation Division recognized and concurred that a coordinated clean-up of
Milwaukee County EEO data is needed.
2
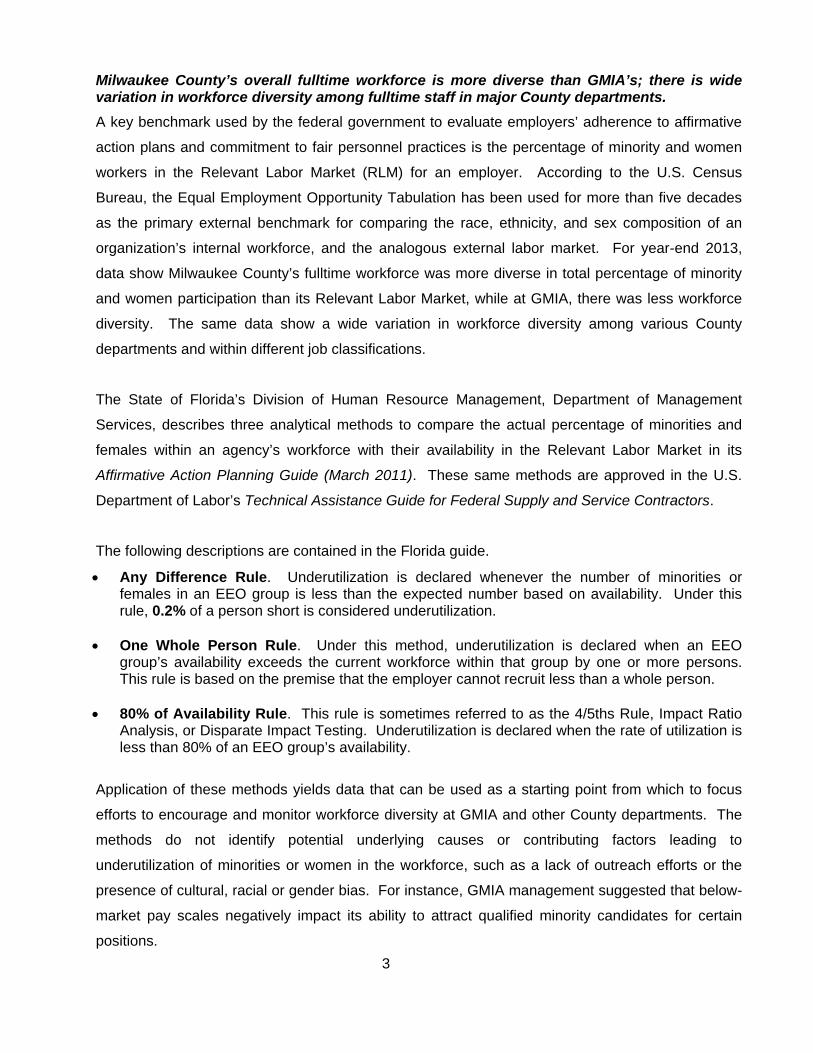
Milwaukee County’s overall fulltime workforce is more diverse than GMIA’s; there is wide variation in workforce diversity among fulltime staff in major County departments. A key benchmark used by the federal government to evaluate employers’ adherence to affirmative
action plans and commitment to fair personnel practices is the percentage of minority and women
workers in the Relevant Labor Market (RLM) for an employer. According to the U.S. Census
Bureau, the Equal Employment Opportunity Tabulation has been used for more than five decades
as the primary external benchmark for comparing the race, ethnicity, and sex composition of an
organization’s internal workforce, and the analogous external labor market. For year-end 2013,
data show Milwaukee County’s fulltime workforce was more diverse in total percentage of minority
and women participation than its Relevant Labor Market, while at GMIA, there was less workforce
diversity. The same data show a wide variation in workforce diversity among various County
departments and within different job classifications.
The State of Florida’s Division of Human Resource Management, Department of Management
Services, describes three analytical methods to compare the actual percentage of minorities and
females within an agency’s workforce with their availability in the Relevant Labor Market in its
Affirmative Action Planning Guide (March 2011). These same methods are approved in the U.S.
Department of Labor’s Technical Assistance Guide for Federal Supply and Service Contractors.
The following descriptions are contained in the Florida guide.
• Any Difference Rule. Underutilization is declared whenever the number of minorities or females in an EEO group is less than the expected number based on availability. Under this rule, 0.2% of a person short is considered underutilization.
• One Whole Person Rule. Under this method, underutilization is declared when an EEO group’s availability exceeds the current workforce within that group by one or more persons. This rule is based on the premise that the employer cannot recruit less than a whole person.
• 80% of Availability Rule. This rule is sometimes referred to as the 4/5ths Rule, Impact Ratio
Analysis, or Disparate Impact Testing. Underutilization is declared when the rate of utilization is less than 80% of an EEO group’s availability.
Application of these methods yields data that can be used as a starting point from which to focus
efforts to encourage and monitor workforce diversity at GMIA and other County departments. The
methods do not identify potential underlying causes or contributing factors leading to
underutilization of minorities or women in the workforce, such as a lack of outreach efforts or the
presence of cultural, racial or gender bias. For instance, GMIA management suggested that below-
market pay scales negatively impact its ability to attract qualified minority candidates for certain
positions. 3

Our analysis shows GMIA’s 2013 fulltime workforce reflects an underutilization of minority workers
in the aggregate under each of the three distinct measurement approaches in the following four job
categories:
• Professionals
• Protective Service Workers
• Skilled Craft Workers
• Service-Maintenance Workers We performed the same type of analysis Countywide. Based on year-end 2013 data, the fulltime
County workforce reflects an underutilization of minority workers in the aggregate under each of the
three distinct measurement approaches in two job categories:
• Skilled Craft Workers
• Service-Maintenance Workers
Female workers are clearly underutilized in five GMIA job categories. Similarly, GMIA’s 2013 fulltime workforce reflects an underutilization of female workers under each
of the three distinct measurement approaches in the following five job categories:
• Professionals
• Technicians
• Protective Service Workers
• Skilled Crafts Workers
• Service-Maintenance Workers
Applying the same analysis Countywide, the three methods for determining underutilization show a
clear underutilization of woman in two job categories:
• Skilled Craft workers.
• Service-Maintenance workers.
Although documentation was incomplete, detailed review of available GMIA human resources data show adherence to Civil Service procedures but reflects mixed results in demonstrating an emphasis on increasing workforce diversity. The racial and gender composition of applicants at various stages of a continuous open recruitment
for Airport Service Workers in 2012 and the first quarter of 2013 reflect a sufficient degree of
diversity throughout the hiring process. However, as a result of the departure of four minority
employees, the racial/ethnic composition of the 10 remaining Airport Maintenance Workers is less
diverse than the 14 hires from GMIA’s continuous recruitment. Three of the four were discharged 4

during the probationary period, and one resigned. GMIA management offered reasonable
justification for the dismissals. We raise this issue in the context of considering not only hiring
practices, but retention strategies, when developing comprehensive workforce diversity objectives.
The data from our review of the continuous recruitment of Airport Maintenance Workers during the
period 2012 through the first quarter of 2013 reflects a concerted effort on the part of GMIA
management to hire minorities and females. However, as demonstrated from this review, retention
of targeted groups is also an important component of maintaining a diverse workforce.
None of the 17 promotions within the GMIA workforce in those two years were granted to a minority employee. The data in 2012 and 2013 reflects a lack of diversity in both racial/ethnicity and gender categories
with respect to promotions within the GMIA workforce. In 2012, nine of the departmental
promotions were non-minorities, with one female representing 11 percent. In 2013, all eight of the
departmental promotions were non-minorities, with two females representing 25 percent.
We emphasize that our audit did not include an evaluation of the merits of either promotions or
terminations at GMIA. GMIA management noted that for the 17 promotions included in our two-
year review period, there were limited instances in which minority or women workers qualified for
advancement. Further, there are prescribed remedies for individuals that believe they were the
object of unfair personnel actions, including appeals to the Milwaukee County Personnel Review
Board for wrongful termination and complaints to the Equal Rights Division of the State Department
of Workforce Development or federal Equal Employment Opportunity Commission for discriminatory
personnel actions.
None of the 70 discrimination complaints against Milwaukee County filed with the Equal Employment Opportunity Commission or the Equal Rights Division of the State Department of Workforce Development in 2012 and 2013 involved employees or management at GMIA. Our review of discrimination complaints filed with state and federal agencies for 2012 and 2013
showed there were 70 claims involving 33 complainants filed during that period. None of the 70
claims involved personnel actions at GMIA.
A review of the limited number of GMIA personnel disciplinary actions appealed before the Personnel Review Board in 2012 and 2013 showed no pattern of reductions or reversals that would suggest racial or gender bias on the part of GMIA management. Data from the Milwaukee County Personnel Review Board (PRB) shows a limited number of GMIA
personnel disciplinary actions appealed to the PRB in 2012 and 2013. In 2012, three GMIA 5

employees appealed disciplinary actions to the PRB; in 2013, nine GMIA employees (including one
of the three included in the 2012 data) appealed disciplinary actions to the PRB. As a result of the
limited number of employees involved, it is difficult to discern any potential racial or gender bias in
those disciplinary actions based on proportionality with the racial/ethnicity or gender composition of
the entire GMIA workforce.
However, analyzing the data in several ways does not present a pattern of PRB reductions or
reversals that would suggest a racial or gender bias on the part of GMIA management.
Although this audit began with a focus on personnel practices with respect to workforce diversity at
General Mitchell International Airport, many of our findings and recommendations are Countywide
in scope. Section 5 of this report presents a recap of our conclusions and several
recommendations designed to address issues raised during the audit.
We would like to acknowledge the cooperation extended by staff at GMIA as well as the
Department of Human Resources. A management response to audit recommendations from DHR
and GMIA is included as Exhibit 5.
6

Background
Milwaukee County operates and maintains both General Mitchell International Airport (GMIA) and
Lawrence J. Timmerman Field under authority granted by Chapters 59 and 114 of the Wisconsin
Statutes. The Airport Director is responsible for operations of the Airport Division, with a 2014
Adopted Budget expenditure appropriation of $84.2 million. The 2014 budget includes funding for
273.6 Fulltime Equivalent (FTE) positions for the division, of which 5.7 FTE are in the form of
seasonal/hourly/pool positions.
The Airport Director reports to the Director of Transportation. Under the terms of a negotiated
agreement between Milwaukee County and six signatory airlines, all operating expenses and debt
service costs for the airport are recovered through rates and charges assessed to users of GMIA
facilities through terminal space and land rentals, concession fees and landing fees.
GMIA has five runways, the longest two of which are used primarily for commercial air passenger
and cargo jet aircraft. The remaining three smaller runways serve smaller jets and general aviation
propeller aircraft. GMIA’s main terminal complex comprises a central terminal building and three
passenger concourses with 48 gates. Total passenger traffic in 2013, including both enplanements
(departures) and deplanements (arrivals) was 6.5 million.
This audit of General Mitchell International Airport personnel practices was initiated in response to a
request contained in a County Board Resolution (File No. 13-97; see Exhibit 2).
Conclusions and recommendations to address issues identified in our audit are presented in
Section 5 of this report.
7

Section 1: Milwaukee County does not have a contemporary, comprehensive workforce diversity policy.
Included among ‘whereas’ clauses providing context and a
rationale for the resolution requesting this audit of GMIA
personnel practices is the following statement:
WHEREAS, it is vital that GMIA is reflective of the County’s commitment to diversity because it is the “gateway” for persons visiting Milwaukee County for business or leisure; and…
That statement presumes there is an established, well-
recognized and uniformly understood policy or principle that
defines the “County’s commitment to diversity.” Our research
indicates that, at the beginning of our audit fieldwork, there was
no comprehensive, definitive statement of policy regarding
diversity in the Milwaukee County workforce. Consequently, a
review of important developments in the evolution of federal laws
and regulations, federal Executive Branch actions, judicial
decisions and County personnel practices over several decades
is informative in attempting to accurately describe the “County’s
commitment to diversity” as referenced in County Board
Resolution 13-97.
The Federal Civil Rights Act of 1964, as amended, prohibits discrimination in hiring, promotion, discharge, pay, fringe benefits, job training, classification, referral, and other aspects of employment, on the basis of race, color, religion, sex or national origin. Title VII of the act created the Equal Employment Opportunity
Commission (EEOC) to implement the law. Subsequent
legislation and rule-making authority vested in the EEOC
resulted in expanded powers of investigatory authority, creating
conciliation programs, filing lawsuits and conducting voluntary
assistance programs.
The resolution requesting this audit presumes there is an established, well-recognized and uniformly understood policy or principle that defines the “County’s commitment to diversity.”
8

The term ‘affirmative action’ is not included in the original
language of the Civil Rights Act of 1964. The term was initially
invoked in Executive Order 10925, signed by President John F.
Kennedy on March 6, 1961. The order created the President’s
Committee on Equal Employment Opportunity, and established a
framework for the federal government to review current
personnel practices and “…to consider and recommend
additional affirmative steps which should be taken by executive
departments to realize more fully the national policy of
nondiscrimination within the Executive Branch of government.”
Executive Order 10925 also required federal contractors and
sub-contractors to take affirmative action to ensure equality of
opportunity in all aspects of employment. Subsequent Executive
Orders and amendments broadened and enhanced the
affirmative action concepts and techniques initiated within the
framework of Executive Order 10925. Affirmative action, defined
by the West Encyclopedia of American Law “refers to both
mandatory and voluntary programs intended to affirm the civil
rights of designated classes of individuals by taking positive
action to protect them” from discrimination.
Presently, according to information provided by the EEOC, the
Commission is responsible for enforcing federal laws that make it
illegal to discriminate against a job applicant or an employee
because of the person’s race, color, religion, sex (including
pregnancy), national origin, age (40 or older), disability or genetic
information. It is also illegal to discriminate against a person
because the person complained about discrimination, filed a
charge of discrimination, or participated in an employment
discrimination investigation or lawsuit.
Included among EEOC oversight efforts are mandatory collection
and reporting of racial and gender demographic data within
The term ‘affirmative action’ is not included in the original language of the Civil Rights Act of 1964. The term was initially invoked in Executive Order 10925, signed by President John F. Kennedy on March 6, 1961.
The Equal Employment Opportunity Commission is responsible for enforcing federal laws that make it illegal to discriminate against a job applicant or an employee because of the person’s race, color, religion, sex, disability or genetic information.
9

specified EEO job categories. Separate reporting requirements
apply to public and private sector employers.
The Johnnie G. Jones et al. v. Milwaukee County Consent Order in 1979 imposed some affirmative action requirements on Milwaukee County as redress for earlier discrimination in hiring. Beginning in 1980 and throughout the next three decades,
Milwaukee County’s hiring practices have been heavily
influenced by the existence of a court order commonly referred
to as the ‘Johnnie Jones Consent Decree’ or ‘Johnnie Jones
Consent Order’ (Consent Order). In 1974, a lawsuit was filed
seeking relief from unlawful discriminatory practices with respect
to employment, transfer and promotion of black and other
minority persons in the classified service of Milwaukee County.
The action was brought under Title VII of the Civil Rights Act of
1964, as amended by the Equal Employment Opportunity Act of
1972. In 1975, the court approved class action status for all
Black, Spanish-surnamed and American Indian persons falling
within the parameters of the complaint. The Consent Order was
signed by the affected parties in December 1979 and approved
by Judge Myron L. Gordon on March 10, 1980.
In addition to specific requirements for individual relief of several
named plaintiffs in the action, the Consent Order imposed some
affirmative action requirements on Milwaukee County applicable
to all eight EEOC job categories established for state and local
governments. For example, the Consent Order established a
minority representation goal of 16% of position titles in the
Technicians job category until December 31, 1985. After
December 31, 1985 the goal reverted to the percentage of
minorities in the Milwaukee County population (whether greater
than or less than 16%), according to the 1980 U.S. census.
Specific actions were required when percentage goals were not
reached for some job categories. For instance, in the
Officials/Administrators job category, if the goal of 9.6% was not
Beginning in 1980 and throughout the next three decades, Milwaukee County’s hiring practices have been heavily influenced by the existence of a court order commonly referred to as the ‘Johnnie Jones Consent Decree’ or ‘Johnnie Jones Consent Order.’
10

reached by December 31, 1982, then class members were to be
appointed to every second vacancy in the category until the goal
was reached.
The Consent Order also provided for the eventuality of reaching
the established goals:
H. Validation or Elimination of disparate Impact 71. After defendants reach the goal established for
any position title by paragraphs 51-70 of this consent order, defendants shall thereafter select employees for that position title only by means of test, criteria, or other selection procedures
(a) which have no adverse impact on class
members, or
(b) which the parties agree or the court determines have been validated in accordance with the Uniform Guidelines on Employee Selection Procedures, 43 Red. Reg. 38290 (August 25, 1978).
Other provisions of the Consent Order provided back-pay and
settlement payments to certain class members, and established
varying amounts of retroactive seniority credit for purposes other
than pension service credit and off-time accumulation for various
class members. The County was also required to provide
opposing counsel a series of monthly and annual reports related
to the racial composition of its workforce and changes in the
workforce.
Correspondence documenting recent discussions between the
Milwaukee County Office of Corporation Counsel and Legal
Action of Wisconsin (counsel for the plaintiffs in Johnnie G.
Jones, et al. v. Milwaukee County) establish a mutual
understanding that, with one exception, provisions of the
Consent Order are no longer relevant. There is mutual
understanding that the retroactive seniority credit granted to a
number of class members remains intact. According to the
Correspondence documenting recent discussions between the Milwaukee County Office of Corporation Counsel and Legal Action of Wisconsin establish a mutual understanding that, with one exception, provisions of the Consent Order are no longer relevant.
11

Department of Human Resources, as of early March 2014, there
were 227 active Milwaukee County employees whose seniority
was adjusted as a result of the Consent Order. The adjusted
seniority date is recorded in the County payroll database, thus
providing for accurate calculations of seniority rights for layoffs
and transfers. The mutual understanding documented in the
correspondence indicates that the requirements now imposed on
the County by a host of federal and state Equal Employment
Opportunity provisions surpass the requirements imposed by the
remaining Consent Order provisions, including record retention
and reporting provisions, and thus render those Consent Order
provisions moot.
A comprehensive workforce analysis of minority and female participation was performed annually as part of Milwaukee County’s affirmative action planning and monitoring, but was discontinued in 2007. According to the former Employment Relation Manager for DHR,
the last annual Countywide workforce analysis of minority and
female participation was prepared in 2006. The discontinuation
of this annual report coincides with the County’s conversion from
its former Genesys human resources computer platform to the
Ceridian system currently in place. As described further in
Section 2 of this report, problems with data conversion to the
new system appears to have affected the County’s ability to
accurately report the racial makeup of the County workforce or to
produce ‘underutilization’ reports used to establish departmental
affirmative action goals.
Subsequent actions have resulted in the resumption of reports
used to establish affirmative action goals at the departmental
level, but the comprehensive analysis and reporting of
Countywide workforce diversity has not been resumed.
Federal Executive Branch actions and Supreme Court rulings have abolished strict quotas but did not nullify affirmative action efforts.
The last annual Countywide workforce analysis of minority and female participation was prepared in 2006.
12

• In 1969, President Richard Nixon initiated the ‘Philadelphia
Plan’ to guarantee fair hiring practices in federally funded construction jobs. In a statement to Senate and House Conferees, President Nixon stated, “The Philadelphia Plan does not set quotas; it points to goals. It does not presume automatic violation of law if the goals are not met; it does require affirmative action if a review of the totality of a contractor’s employment practices shows that he is not affording equal employment opportunity.”
• In Hazelwood School District v. United States, 433 U.S. 299 (1977), the Supreme Court agreed that the comparison of Hazelwood’s teacher workforce to its student population fundamentally misconceived the role of statistics in employment discrimination cases. The proper comparison was between the racial composition of Hazelwood’s teaching staff and the racial composition of the qualified public school teacher population in the relevant labor market. In its opinion, the Court cited from an earlier ruling, Teamsters v. United States, 431 U.S. 340 (1977), stating: “absent explanation, it is ordinarily to be expected that nondiscriminatory hiring practices will in time result in a work force more or less representative of the racial and ethnic composition of the population in the community from which employees are hired.”
• In University of California Regents v. Bakke, 438 U.S. 265 (1978), the Supreme Court decided that a public university may take race into account as a factor in admissions decisions but rejected racial quotas by imposing limitations on affirmative action.
• In United States v. Paradise, 480 U.S. 149 (1987), the Supreme Court ruled that judges can order employers to use numerical racial quotas in promotions and hiring to cure “egregious” past discrimination against blacks, ruling that under a strict scrutiny analysis, the one-black-for-one-white promotion requirement is permissible under the Equal Protection Clause of the Fourteenth Amendment.
• In Adarand Constructors, Inc. v. Pena, 515 U.S. 200, 115 S. Ct. 2097, 132 L. Ed. 2d 158 (1995), the Supreme Court ruled that all racial classifications, imposed by whatever federal, state, or local governmental actor, must be analyzed by a reviewing court under strict scrutiny. The Court noted in its opinion that federal racial classifications, like those of a state, must serve a compelling governmental interest, and must be narrowly tailored to further that interest. The Court further noted that when race-based action is necessary to further a compelling interest, such action is within constitutional
13

constraints if it satisfies the “narrow tailoring” test set out in the Court’s earlier rulings.
• In 1995 President Bill Clinton gave an address in which he
announced that affirmative action was still needed to right past wrongs. At the same time, he issued a White House memorandum to federal Executive Branch departments and agencies, giving specific instructions to eliminate or reform any affirmative action program that:
(a) creates a quota; (b) creates preferences for unqualified individuals; (c) creates reverse discrimination; or (d) continues even after its equal opportunity purposes
have been achieved.
• In Grutter v. Bollinger, 539 U.S. 306 (2003), the Supreme Court ruled that the Equal Protection Clause, Title VI, did not prohibit the law school’s narrowly tailored use of race in admissions decisions to further a compelling interest of the educational benefits of a diverse student body.
• In Schuette v. Coalition to Defend Affirmative Action, Docket 12-682 (2014), the Supreme Court reversed a lower court’s ruling that set aside a Michigan State Constitutional provision that prohibits the use of race-based preferences as part of the admissions process for state universities. In one of the Court’s majority opinions, Justice Kennedy noted that in this case, “…the principle that the consideration of race in admissions is permissible when certain conditions are met was not being challenged. Rather, the question concerns whether, and in what manner, voters in the States may choose to prohibit the consideration of such racial preferences.”
Achieving diversity in the workforce is a broader concept than traditional affirmative action planning but is compatible with, and expands on, affirmative action concepts. There is voluminous information distinguishing the concept of
workforce diversity from traditional affirmative action programs
and policies. Information provided by the Office of Diversity and
Affirmative Action at Stony Brook University, part of the New
York State University system, embraces the essence of many
publications we reviewed:
While there is some overlap both in philosophy and practice, there are significant differences [between diversity and affirmative action], as outlined below: Motivation
14

Affirmative Action changes are driven by law…. It is a remedial approach, righting past wrongs. Employers have been expected to make a positive effort to recruit, hire, train, and promote employees of previously excluded groups. Managing diversity, on the other hand, is strategically driven, and brings a pragmatic orientation. It focuses on benefits to the organization. Capitalizing on diversity is seen as contributing to organizational goals such as profit, productivity, and morale, rather than just avoiding lawsuits or meeting legal requirements. Targeted Groups Affirmative action is selective in mandating changes that benefit previously disadvantaged groups. Diversity is inclusive, encompassing everyone in the workplace. It seeks to create a working environment in which everyone and every group fits, feels accepted, has value, and contributes. Bringing People In Affirmative action generally uses an assimilation approach, expecting that people brought into the system will adapt to existing conditions. Diversity operates with a different approach; a synergy model. This view assumes that the diverse groups will devise new, creative ways of working that will move beyond the way we’ve always done things to improve the organization. Desired Results Affirmative action is numbers oriented, aimed at changing the demographics within the organization. Managing diversity is behavioral, aimed at changing the organizational culture, and developing skills and policies that get the best from everyone. Affirmative action opens doors in the organization while managing diversity opens the culture and the system. Managing diversity does not replace affirmative action; rather, it builds on the critical foundation laid by workplace equity programs. Affirmative action and managing diversity go hand-in-hand, each reinforcing the gains of the other. Without affirmative action’s commitment to hiring and promoting diverse employees, organizations would rarely have the diversity of staff to reach a stage where differences are valued and diversity is effectively managed. Once diverse staff is on board, the Organization can focus on creating an inclusive environment where everyone’s needs and values are taken into account, where no one is disadvantaged because of his or her differentness, and where
15

organizational policies and management practices work for everyone.
The Department of Human Resources has recently worked with the Office of the County Executive and the various departmental diversity committees to develop a Diversity Committee mission statement and goals for Countywide application. Over the past several years, Milwaukee County has begun
incorporating concepts of workforce diversity into its traditional
Countywide affirmative action planning and monitoring. Since at
least 2008, DHR has referred to departmental affirmative action
committees as diversity committees.
Earlier this year, DHR worked with the departmental diversity
committees and the Office of the County Executive to draft a
mission statement and goals to guide activities for the remainder
of 2014. By the end of May, the following were embraced by the
department as consensus statements to be considered ‘works in
progress’ and reviewed for possible revisions in January 2015.
Mission Milwaukee County’s Diversity Committee strives to honor inclusiveness, advocating for education, awareness, acceptance, and outreach in the workplace and community. Goals • To effectively communicate the works of the Diversity
Committee.
• Promote initiatives that enhance the quality of life for the community by celebrating diversity through community outreach.
• Provide leadership; promote equality and acceptance for all differences through education.
In addition, four sub-committees have been established to further
the committee’s goals. The four sub-committees are Diversity
Learning, Community Involvement, Communications and
Volunteer Support.
By the end of May, a Diversity Committee mission statement and goals were embraced by DHR as consensus statements to be considered ‘works in progress’ and reviewed for possible revisions in January 2015.
16

Section 2: Milwaukee County has experienced problems with the collection and maintenance of data necessary to accurately report and effectively analyze and manage issues relating to workforce diversity.
The Equal Employment Opportunity Commission (EEOC)
collects workforce data from employers with more than 100
employees (the threshold is 50 for federal contractors). Data
collected includes gender and race/ethnicity by various job
categories. The data is used for a variety of purposes including
law and regulatory enforcement, self-assessment by employers,
and research. The information is shared with other authorized
federal agencies to avoid duplication and aggregated data is
available to the public. Table 1 shows the four reports currently
mandated by the EEOC, the types of employers subject to each
reporting mandate, and the timetable for reporting.
17

The County’s 2007 conversion to its current Ceridian Human Resources management information system created problems affecting its ability to manage workforce diversity issues. Subsequent corrective measures have been ad hoc, limited in scope and have lacked an overall policy initiative to fashion a cohesive workforce diversity objective. Ceridian conversion applied EEO-1 (Private Sector)
racial/ethnicity classifications, which are more detailed than the
EEO-4 (State & Local Governments) classifications that are
necessary for Milwaukee County to comply with mandatory
Table 1
EEOC-Mandated Employer Reports
EEO Survey Required
Types of Employers Required to Complete EEO Surveys
EEOC Schedule
EEO-1
Employers with federal government contracts of $50,000
or more and 50 employees; and who do not have a
federal government contract but have 100 or more
employees, excluding state and local governments,
primary and secondary school systems, institutions of
higher education, Indian tribes and tax-exempt private
membership clubs other than labor organizations.
EEO-1 Surveys - Conducted and
collected annually from EEOC and the
Department of Labor, Office of Federal
Contract Compliance Programs.
EEO-3
Employers collect data from "Referral Unions." This term
describes unions under whose normal methods of
operation, individuals customarily and regularly seek or
gain employment through the union, or an agent of the
union.
EEO-3 Surveys - Conducted and
collected from EEOC biennially, in even-
numbered years.
EEO-4
Employers collect labor force data from state and local
governments that have 15 or more employees within 50
U.S. states and the District of Columbia and all other
political jurisdictions which have 15 or more employees.
EEO-4 Surveys - Conducted and
collected biennially, in odd-numbered
years from EEOC.
EEO-5
Employers collect labor force data from public elementary
and secondary school districts with 100 or more employees
within 50 U.S. States and District of Columbia.
EEO-5 Surveys - Conducted and
collected biennially, in even-numbered
years from EEOC.
Source: Federal Equal Employment Opportunity Commission.
18

federal reporting requirements. This negatively affected the
accuracy and completeness of County racial/ethnicity reports.
Table 2 shows the racial/ethnicity classifications used for data
collection and reporting under each of the two distinct federal
mandates.
According to the Payroll Manager, who began County
employment after the Ceridian conversion, she noticed
incomplete data when attempting to run the mandatory EEO-4
reports in 2009. The Payroll Manager stated the problem was
associated with County employees hired subsequent to the
transition off of the old payroll system, last used in November
2007. According to the Payroll Manager, she was able to identify
the source of the problem and correct the racial/ethnicity
categories collected for new hires in 2010. Based on the Payroll
Manager’s comments and a review of year-end County
workforce data for 2010, 2011 and 2012, we concluded that data
from 2011 forward was relatively complete. However, we were
unable to rely on historic data to analyze the County’s workforce
diversity during the period 2007 through 2010, and chose to
focus our review primarily using 2012 and 2013 data.
Table 2 Federally-Mandated Racial/Ethnicity Classifications
for Data Collection and Reporting Purposes
EEO-4 (State & Local Governments) EEO-1 (Private Sector) 1) American Indian or Alaskan Native 1) American Indian or Alaskan Native
2) Asian or Pacific Islander 2) Asian
3) Native Hawaiian or other Pacific Islander
3) Black (Not of Hispanic Origin) 4) Black or African American
4) White (Not of Hispanic Origin) 5) White
5) Hispanic 6) Hispanic or Latino
7) Two or More Races
Source: Federal Equal Employment Opportunity Commission instructional booklets.
According to the Payroll Manager, she noticed incomplete data when attempting to run the mandatory EEO-4 reports in 2009.
19

In addition, Ceridian conversion problems/confusion appear to
have resulted in suspension of the County’s ability to provide
departments with annual ‘underutilization’ reports for affirmative
action plan development and monitoring purposes.
For example, a form attached to an e-mail sent from the County
Employment Relations Manager to departmental diversity
committee chairs in April 2011 discusses a Utilization Analysis
Report available through the Ceridian Human Resources Payroll
Web (HPW) module. According to the form:
This EEO-1 [emphasis added] report compares the workforce representation with the computed availability and calculates the utilization status of minorities and females within your department.
A subsequent e-mail sent from the Employment Relations
Manager to diversity committee chairs, in May 2011,
acknowledges problems with data used to generate the above-
referenced reports:
I have received several e-mails from Chairs on how to determine the underutilization of employees in your departments. Many of you remember that we previously had a [sic] different software, whereby the underutilization report was built in, however this report was not dumped into Ceridian, and currently the total of employees broken down by gender and race are incorrect. It is okay to submit your plan on or ahead of schedule and to leave this report out until we have accurate information. I would simply say that a goal for your department would be to continue to recruit and hire a diverse work group.
Our survey of other counties locally and nationally shows that Milwaukee County’s assignment of EEO-1 Job Categories to government job titles is not a common or ‘Best Practice.’ Clean-up of potential inconsistencies in job classifications, some
of which may have preceded the Ceridian conversion, was one
of the objectives of the Human Resources Division’s Job
Evaluation Questionnaire (JEQ) project. However, the former
Director of Compensation was using EEO-1 (Private Sector) job
20

categories in lieu of EEO-4 (State & Local Governments) job
categories in reviewing, re-titling and re-classifying Milwaukee
County positions.
Table 3 shows the similar, but different, job categories
established for state and local governments (EEO-4), and the
private sector (EEO-1), respectively.
The former Director of Compensation told us that the County
was not adopting the EEO-1 classification system fully, that the
Human Resources Compensation Division was using it for
benchmarking compensation. Asked if it wouldn’t make more
sense to benchmark EEO-4 classification data, since all state
and local governments have to maintain that information, the
former director said that when she attends conferences, people
are using EEO-1 classifications. The former director said EEO-1
was a “more holistic approach, the data is cleaner.” The former
director further stated that there are considerable problems with
the EEO-4 data in the Ceridian system. She said the EEO-1
data was being used in preparation for use in a planned Ceridian
Table 3 Federally-Mandated Job Categories
for Data Collection and Reporting Purposes
EEO-4 (State & Local Governments) EEO-1 (Private Sector) 1) Officials and Administrators 1) Officials and Managers (a) Executive/Senior Level (b) First/Mid-Level 2) Professionals 2) Professionals 3) Technicians 3) Technicians 4) Protective Service Workers 5) Paraprofessionals 4) Sales Workers 6) Administrative Support Workers 5) Administrative Support Workers -(Including Clerical and Sales)
7) Skilled Craft Workers 6) Craft Workers 7) Operatives 8) Laborers and Helpers 8) Service-Maintenance 9) Service Workers Source: Federal Equal Employment Opportunity Commission instructional booklets.
21

module that will be used by the Compensation Division but will
interface with HPW, the County’s Ceridian payroll module.
The County Director of Employee Benefits, currently serving in
the additional capacity of Interim Director of Compensation,
indicated that EEO-1 job categories are used by the major
national compensation surveys and is useful information for the
County’s Compensation Division. He pointed out that the County
competes in the same labor market as the private sector for
many positions. He also stated that the County must maintain
accurate EEO-4 data for mandatory federal reporting
requirements.
We surveyed the EEO data collection practices of seven other
Wisconsin counties, as well as six counties nationwide that are
similar in population to Milwaukee County. All of the counties
surveyed collect, maintain and report federally-mandated EEO-4
data. None of the counties surveyed collect, maintain or report
EEO-1 data.
We confirmed with staff in the Compensation Division that,
throughout the JEQ project, the EEO-1 job categories have been
assigned only on paper and that all County positions in the HPW
system retain EEO-4 job categories. However, a menu of job
groups contained in HPW designed to ‘roll up’ into the broader
EEO-4 job categories pertain to EEO-1 job categories. For
instance, one of the job groups contained in HPW is ‘Factory
Supervisor.’
During the course of audit work, managers within the Office of
the Comptroller’s Payroll Division and the Human Resources
Compensation Division recognized and concurred that a
coordinated clean-up of Milwaukee County EEO data is needed.
Complicating matters further, we recently confirmed that at least
one major County department, and possibly more, continue to
The County Director of Employee Benefits indicated that EEO-1 job categories are used by the major national compensation surveys and is useful information for the County’s Compensation Division.
We surveyed the EEO data collection practices of seven other Wisconsin counties, as well as six counties nationwide that are similar in population to Milwaukee County. None of the counties surveyed collect, maintain or report EEO-1 data.
The federal government has announced that it
22

use a document that records racial/ethnicity data for new hires
using the 7-category EEO-1 classification system, thus
perpetuating EEO-4 reporting errors.
The federal government has announced that it will adopt the
EEO-1 expanded racial/ethnic categories (but not the job
categories structure) to all reporting entities, including State and
Local Governments, in the near future. As a result, Milwaukee
County will need to remain vigilant in monitoring this eventuality
and ensure that its data collection and reporting capabilities are
consistent with federal mandates.
23

Section 3: Milwaukee County’s overall fulltime workforce is more diverse than GMIA’s; there is wide variation in workforce diversity among fulltime staff in major County departments.
A key benchmark used by the federal government to evaluate
employers’ adherence to affirmative action plans and
commitment to fair personnel practices is the percentage of
minority and women workers in the Relevant Labor Market
(RLM) for an employer. According to the U.S. Census Bureau,
the Equal Employment Opportunity Tabulation has been used for
more than five decades as the primary external benchmark for
comparing the race, ethnicity, and sex composition of an
organization’s internal workforce, and the analogous external
labor market, within a particular geography and job category,
including the use by organizations to develop and update their
affirmative action plans.
The most recent EEO Tabulation includes the Census Bureau’s
5-year American Community Survey data for the period
2006−2010. The EEO Tabulation is sponsored by four federal
agencies or sub-divisions within those agencies:
• Equal Employment Opportunity Commission; • Department of Justice; • Department of Labor; and • Office of Personnel Management.
The EEO Tabulation includes five geographic levels: nations,
states, metropolitan areas, counties, and places.
The Relevant Labor Market consists of those individuals in the
civilian labor force between the ages of 16 and 65 who are
employed or actively seeking employment, are U.S. citizens, and
who reside in the area from which the employer commonly
attracts candidates. With some exceptions for specialized
According to the U.S. Census Bureau, the EEO Tabulation has been used for more than five decades as the primary external benchmark for comparing the race, ethnicity, and sex composition of an organization’s internal workforce, and the analogous external labor market.
24

executive-level positions, Milwaukee County’s Relevant Labor
Market is generally identified as Milwaukee County. Until July
2013, Milwaukee County enforced a residency requirement for
most employees, with a relatively small number of exceptions
consisting of positions for which recruitments were difficult.
Effective July 2, 2013, such residency requirements were
nullified by §66.052(3)(b), Wis. Stats.
Arguably, Milwaukee County’s Relevant Labor Market could be
viewed as the federal Metropolitan Statistical Area (formerly
known as the Standard Metropolitan Statistical Area) comprising
the counties of Milwaukee, Ozaukee, Washington and
Waukesha. However, given the longstanding history of the
County’s residency requirement and its core mission of serving
and representing County residents, we selected Milwaukee
County as the Relevant Labor Market benchmark for this review.
Accordingly, we based our calculations and comparisons on the
EEO Tabulation 2006-2010, State and Local Government Job
Groups by Sex and Race/Ethnicity for Residence Geography,
with a Universe of Civilian labor force of 16 years and over who
are U.S. citizens for Milwaukee County, Wisconsin.
In addition to specific Civil Rights enforcement purposes, the
Relevant Labor Market can be used to:
• Assess an employer’s level of diversity in relation to its local labor market;
• Establish reasonable goals for minority and women
workforce composition based on availability of those groups in various categories of job classifications within the labor market; and
• Measure progress in attaining established goals.
25

For year-end 2013, data show Milwaukee County’s fulltime workforce was more diverse in total percentage of minority and women participation than its Relevant Labor Market, while at GMIA, there was less workforce diversity. Table 4 compares the percentage of minority and women
workers in Milwaukee County’s Relevant Labor Market with both
the countywide fulltime workforce and GMIA’s fulltime workforce
in 2013.
Table 4 2013 Workforce Diversity
Milwaukee County and GMIA
Race/Ethnicity RLM
Countywide
GMIA American Indian or
Alaskan 4,249 0.9%
26 0.7%
3 1.2% Asian or Pacific Islander 10,529 2.4%
62 1.7%
1 0.4%
Black (Not of Hispanic) 103,395 23.1%
1,183 31.7%
54 21.7% Hispanic 31,800 7.1%
214 5.7%
14 5.6%
White (Not of Hispanic) 297,955 66.5%
2,246 60.2%
177 71.1% Total 447,928 100.0%
3,731 100.0%
249 100.0%
Total Minority 149,973 33.5%
1,485 39.8%
72 28.9% White 297,955 66.5%
2,246 60.2%
177 71.1%
Total 447,928 100.0%
3,731 100.0%
249 100.0%
Male 220,218 49.2%
1,787 47.9%
199 79.9% Female 227,710 50.8%
1,944 52.1%
50 20.1%
Total 447,928 100.0%
3,731 100.0%
249 100.0% Notes: RLM = Relevant Labor Market GMIA = General Mitchell International Airport Numbers may not add due to rounding. Source: U.S. Census Bureau RLM from EEO-CIT06R Report for Milwaukee County, 2006-2010 Average
(minor adjustments made for presentation purposes). Milwaukee County workforce data from year-end 2013 payroll records, fulltime employees only.
26

The same data show a wide variation in workforce diversity among various County departments and within different job classifications. The data in Table 5 provide examples of Milwaukee County’s
wide variation in workforce diversity among different
departments. Additional examples are presented as Exhibit 3.
One explanation for variations in gender diversity among
departments within Milwaukee County workforce is the
prevalence of certain categories of jobs traditionally dominated
by one or the other gender. As previously noted, the following
job categories have been established as a framework for state
and local governments to collect and report workforce
demographic information. These EEO-4 job categories along
with descriptive language and some examples included in a
Table 5 2013 Workforce Diversity
of Select County Departments
Race/Ethnicity GMIA
Parks
BHD
DA
DHHS
American Indian or Alaskan 3 1.2%
1 0.5%
3 0.6%
2 1.5%
2 0.6%
Asian or Pacific Islander 1 0.4%
0 0.0%
20 4.0%
3 2.2%
1 0.3%
Black (Not of Hispanic) 54 21.7%
10 5.2%
171 34.3%
43 31.4%
154 49.4%
Hispanic 14 5.6%
9 4.7%
19 3.8%
9 6.6%
22 7.1%
White (Not of Hispanic) 177 71.1%
173 89.6%
285 57.2%
80 58.4%
133 42.6%
Total 249 100.0%
193 100.0%
498 100.0%
137 100.0%
312 100.0%
Total Minority 72 28.9%
20 10.4%
213 42.8%
57 41.6%
179 57.4%
White 177 71.1%
173 89.6%
285 57.2%
80 58.4%
133 42.6%
Total 249 100.0%
193 100.0%
498 100.0%
137 100.0%
312 100.0%
Male 199 79.9%
144 74.6%
126 25.3%
26 19.0%
120 38.5%
Female 50 20.1%
49 25.4%
372 74.7%
111 81.0%
192 61.5%
Total 249 100.0%
193 100.0%
498 100.0%
137 100.0%
312 100.0% Notes: RLM = Relevant Labor Market GMIA = General Mitchell International Airport Numbers may not add due to rounding. Source: U.S. Census Bureau RLM from EEO-CIT06R Report for Milwaukee County, 2006-2010 Average (minor adjustments
made for presentation purposes). Milwaukee County workforce data from year-end 2013 payroll records, fulltime employees only.
27

federal instructional booklet designed to provide guidance in
classifying local government positions, are as follows:
• Officials and Administrators. Occupations in which employees set broad policies, exercise overall responsibility for execution of these policies, or direct individual departments or special phases of the agency’s operation, or provide specialized consultation on a regional, district or area basis. Examples include department heads, bureau chiefs, division chiefs, directors, deputy directors, controllers, wardens, superintendents, sheriffs, as well as police and fire chiefs and inspectors, among others.
• Professionals. Occupations which require specialized and theoretical knowledge which is usually acquired through college training or through work experience and other training which provides comparable knowledge. Examples include personnel and labor relations workers, social workers, doctors, psychologists, registered nurses, economists, dietitians, lawyers, systems analysts, accountants, engineers, as well as police and fire captains and lieutenants, among others.
• Technicians. Occupations which require a combination of basic scientific or technical knowledge and manual skill which can be obtained through specialized post-secondary school education or through equivalent on-the-job training. Examples include computer programmers, drafters, survey and mapping technicians, licensed practical nurses, high technicians, technicians (medical, dental, electronic, physical sciences), police and fire sergeants, and production inspectors, among others.
• Protective Service Workers. Occupations in which workers are entrusted with public safety, security and protection from destructive forces. Includes police patrol officers, firefighters, guards, deputy sheriffs, bailiffs, correctional officers, detectives, marshals, game and fish wardens and park rangers (except maintenance), among others.
• Paraprofessionals. Occupations in which workers perforrm some of the duties of a professional or technician in a supportive role, which usually require less formal training and/or experience normally required for professional or technical status. Such positions may fall within an identified pattern of staff development and promotion under a “New Careers” concept. This category includes research assistants, medical aides, child support workers, recreation assistants, home health aides, as well as library assistants and clerks, among others.
28

• Administrative Support (Including Clerical and Sales). Occupations in which workers are responsible for internal and external communication, recording and retrieval of data and/or information and other paperwork required in an office. Examples include bookkeepers, messengers, clerk-typists, stenographers, payroll clerks, telephone operators, cashiers, and toll collectors, among others.
• Skilled Craft Workers. Occupations in which workers perform jobs which require special manual skill and a thorough and comprehensive knowledge of the process involved in the work which is acquired through on-the-job training and experience or through apprenticeship or other formal training programs. Examples include mechanics, electricians, heavy equipment operators, stationary engineers, carpenters, power plant operators, and water and sewage treatment plan operators, among others.
• Service-Maintenance. Occupations in which workers perform duties which result in or contribute to the comfort, convenience, hygiene or safety of the general public or which contribute to the upkeep and care of buildings, facilities or grounds of public property. Workers in this group may operate machinery. Examples include laundry and dry cleaning operatives, truck drivers, bus drivers, garage laborers, park rangers (maintenance), custodial employees, gardeners and groundskeepers, refuse collectors and construction laborers, among others.
For illustrative purposes, Table 6 provides the percentage of
fulltime workers within each EEO-4 job category for the County
as a whole as well as for GMIA and three other County
departments. Additional examples of Milwaukee County
departmental workforce compositions are presented as Exhibit 4.
29

An assessment tool used to establish and monitor progress in achieving affirmative action goals provides context to some of the variation in workforce diversity among County departments. The State of Florida’s Division of Human Resource
Management, Department of Management Services, describes
three analytical methods to compare the actual percentage of
minorities and females within an agency’s workforce with their
availability in the Relevant Labor Market in its Affirmative Action
Planning Guide (March 2011). [Note: The guide contains a
fourth method that is a more complex analysis using statistical
standard deviation techniques and is not discussed in this
report.] These same methods are approved in the U.S.
Department of Labor’s Technical Assistance Guide for Federal
Supply and Service Contractors.
The following descriptions are contained in the Florida guide.
• Any Difference Rule. Underutilization is declared whenever the number of minorities or females in an EEO group is less
Table 6 2013 Fulltime Workforce Composition of
Milwaukee County and Select County Departments by EEO-4 Job Categories
EEO-4 Classification Countywide
GMIA
Parks
BHD
DA
Officials and Administrators - 1 217 5.8%
7 2.8%
8 4.1%
32 6.4%
2 1.5%
Professionals - 2 885 23.7%
25 10.0%
35 18.1%
232 46.6%
45 32.8%
Technicians - 3 119 3.2%
3 1.2%
0 0.0%
31 6.2%
3 2.2%
Protective Service Workers - 4 942 25.2%
54 21.7%
0 0.0%
0 0.0%
12 8.8%
Paraprofessionals - 5 248 6.6%
0 0.0%
3 1.6%
90 18.1%
17 12.4%
Adm. Support - 6 725 19.4%
10 4.0%
10 5.2%
93 18.7%
58 42.3%
Skilled Craft Workers - 7 158 4.2%
39 15.7%
24 12.4%
0 0.0%
0 0.0%
Service-Maintenance - 8 437 11.7%
111 44.6%
113 58.5%
20 4.0%
0 0.0%
Total 3,731 100.0%
249 100.0%
193 100.0%
498 100.0%
137 100.0% Notes: GMIA = General Mitchell International Airport; BHD = Behavioral Health Division; DA = Districe Attorney’s Office Numbers may not add due to rounding. Source: Milwaukee County workforce data from year-end 2013 payroll records, fulltime employees only.
The State of Florida’s Division of Human Resource Management describes three analytical methods to compare the actual percentage of minorities and females within an agency’s workforce with their availability in the Relevant Labor Market. These same methods are approved by the U.S. Department of Labor.
30

than the expected number based on availability. Under this rule, 0.2% of a person short is considered underutilization.
• One Whole Person Rule. Under this method, underutilization is declared when an EEO group’s availability exceeds the current workforce within that group by one or more persons. This rule is based on the premise that the employer cannot recruit less than a whole person.
• 80% of Availability Rule. This rule is sometimes referred to
as the 4/5ths Rule, Impact Ratio Analysis, or Disparate Impact Testing. Underutilization is declared when the rate of utilization is less than 80% of an EEO group’s availability.
Application of these methods yields data that can be used as a
starting point from which to focus efforts to encourage and
monitor workforce diversity at GMIA and other County
departments. The methods do not identify potential underlying
causes or contributing factors leading to underutilization of
minorities or women in the workforce, such as a lack of outreach
efforts or the presence of cultural, racial or gender bias. For
instance, GMIA management suggested that below-market pay
scales negatively impact its ability to attract qualified minority
candidates for certain positions.
Minority workers in the aggregate are clearly underutilized in four GMIA job categories. To illustrate application of the three methods and to highlight
those job categories in which GMIA’s workforce is clearly lacking
diversity, we applied all three analytical methods to seven of the
eight EEO-4 job categories to GMIA’s fulltime workforce as of
year-end 2013. [Note: The Paraprofessional job category was
not analyzed because the 2006-2010 EEO Tabulation report
used to establish the County’s Relevant Labor Market did not
include that data.] As shown in the following tables, GMIA’s
2013 fulltime workforce reflects an underutilization of minority
workers in the aggregate under each of the three distinct
measurement approaches in the following four job categories:
• Professionals
31

• Protective Service Workers
• Skilled Craft Workers
• Service-Maintenance Workers Table 7 shows the data for Professionals.
Table 7 Underutilization of Minority Workers in GMIA’s
Professionals EEO-4 Job Category
Total Nat. Amer./ Total
Employees White Black Hispanic Asian/PI Alaskan Nat. Minority
# Employees 25 21 4 0 0 0 4 % Employees 84.0% 16.0% 0.0% 0.0% 0.0% 16.0%
% Available 78.9% 14.1% 3.7% 2.6% 0.6% 21.1%
Any Difference Rule Yes Yes Yes Yes Yes % Under -- 3.7% 2.6% 0.6% 5.1%
1 Whole Person Rule 4.0% No No No No Yes 80% of Availability 2.8 0.7 0.5 0.1 4.2
80% Rule No Yes Yes Yes Yes Note: Numbers may not add due to rounding. Source: Availability data from EEO-CIT06R Report for Milwaukee County, 2006-2010 Average. Milwaukee County
workforce data from year-end 2013 payroll records, fulltime employees only.
32
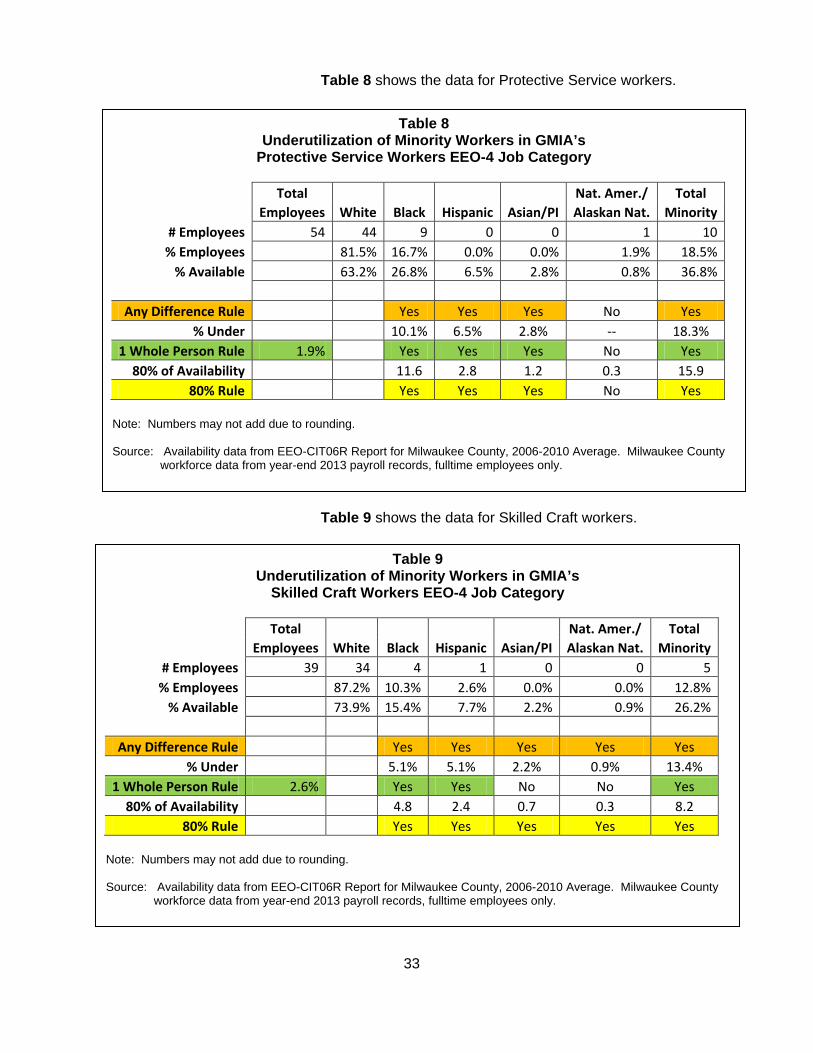
Table 8 shows the data for Protective Service workers.
Table 9 shows the data for Skilled Craft workers.
Table 8 Underutilization of Minority Workers in GMIA’s
Protective Service Workers EEO-4 Job Category
Total Nat. Amer./ Total
Employees White Black Hispanic Asian/PI Alaskan Nat. Minority
# Employees 54 44 9 0 0 1 10 % Employees 81.5% 16.7% 0.0% 0.0% 1.9% 18.5%
% Available 63.2% 26.8% 6.5% 2.8% 0.8% 36.8%
Any Difference Rule Yes Yes Yes No Yes % Under 10.1% 6.5% 2.8% -- 18.3%
1 Whole Person Rule 1.9% Yes Yes Yes No Yes 80% of Availability 11.6 2.8 1.2 0.3 15.9
80% Rule Yes Yes Yes No Yes Note: Numbers may not add due to rounding. Source: Availability data from EEO-CIT06R Report for Milwaukee County, 2006-2010 Average. Milwaukee County
workforce data from year-end 2013 payroll records, fulltime employees only.
Table 9 Underutilization of Minority Workers in GMIA’s
Skilled Craft Workers EEO-4 Job Category
Total Nat. Amer./ Total
Employees White Black Hispanic Asian/PI Alaskan Nat. Minority
# Employees 39 34 4 1 0 0 5 % Employees 87.2% 10.3% 2.6% 0.0% 0.0% 12.8%
% Available 73.9% 15.4% 7.7% 2.2% 0.9% 26.2%
Any Difference Rule Yes Yes Yes Yes Yes % Under 5.1% 5.1% 2.2% 0.9% 13.4%
1 Whole Person Rule 2.6% Yes Yes No No Yes 80% of Availability 4.8 2.4 0.7 0.3 8.2
80% Rule Yes Yes Yes Yes Yes Note: Numbers may not add due to rounding. Source: Availability data from EEO-CIT06R Report for Milwaukee County, 2006-2010 Average. Milwaukee County
workforce data from year-end 2013 payroll records, fulltime employees only.
33

Table 10 shows the data for Service-Maintenance workers
We performed the same type of analysis Countywide. Based on
year-end 2013 data, the fulltime County workforce reflects an
underutilization of minority workers in the aggregate under each
of the three distinct measurement approaches in two job
categories:
• Skilled Craft Workers
• Service-Maintenance Workers
Table 10 Underutilization of Minority Workers in GMIA’s
Service-Maintenance Workers EEO-4 Job Category
Total Nat. Amer./ Total
Employees White Black Hispanic Asian/PI Alaskan Nat. Minority
# Employees 111 64 34 10 1 2 47 % Employees 57.7% 30.6% 9.0% 0.9% 1.8% 42.3%
% Available 66.4% 23.6% 7.5% 1.7% 0.8% 33.6%
Any Difference Rule No No Yes No No % Under -- -- 0.8% -- --
1 Whole Person Rule 0.9% No No No No No 80% of Availability 21.0 6.7 1.5 0.7 29.8
80% Rule No No Yes No No Note: Numbers may not add due to rounding. Source: Availability data from EEO-CIT06R Report for Milwaukee County, 2006-2010 Average. Milwaukee County
workforce data from year-end 2013 payroll records, fulltime employees only.
34

Table 11 shows the data for Skilled Craft workers.
Table 12 shows the data for Service-Maintenance workers
Table 11 Underutilization of Minority Workers in Milwaukee County’s
Skilled Craft Workers EEO-4 Job Category
Total Nat. Amer./ Total
Employees White Black Hispanic Asian/PI Alaskan Nat. Minority
# Employees 158 139 11 7 0 1 19 % Employees 88.0% 7.0% 4.4% 0.0% 0.6% 12.0%
% Available 73.9% 15.4% 7.7% 2.2% 0.9% 26.2%
Any Difference Rule Yes Yes Yes Yes Yes % Under 8.4% 3.3% 2.2% 0.3% 14.2%
1 Whole Person Rule 0.6% Yes Yes Yes Yes Yes 80% of Availability 19.5 9.7 2.8 1.1 33.1
80% Rule Yes Yes Yes Yes Yes Note: Numbers may not add due to rounding. Source: Availability data from EEO-CIT06R Report for Milwaukee County, 2006-2010 Average. Milwaukee County
workforce data from year-end 2013 payroll records, fulltime employees only.
Table 12 Underutilization of Minority Workers in Milwaukee County’s
Service-Maintenance Workers EEO-4 Job Category
Total Nat. Amer./ Total
Employees White Black Hispanic Asian/PI Alaskan Nat. Minority
# Employees 437 308 90 32 1 6 129 % Employees 70.5% 20.6% 7.3% 0.2% 1.4% 29.5%
% Available 52.6% 33.0% 10.0% 2.8% 1.6% 47.4%
Any Difference Rule Yes Yes Yes No Yes % Under 12.4% 2.7% 2.6% 0.2% 17.9%
1 Whole Person Rule 0.2% Yes Yes Yes Yes Yes 80% of Availability 115.4 35.0 9.8 5.6 165.7
80% Rule Yes Yes Yes No Yes Note: Numbers may not add due to rounding. Source: Availability data from EEO-CIT06R Report for Milwaukee County, 2006-2010 Average. Milwaukee County
workforce data from year-end 2013 payroll records, fulltime employees only.
35

Female workers are clearly underutilized in five GMIA job categories. Similarly, GMIA’s 2013 fulltime workforce reflects an
underutilization of female workers under each of the three
distinct measurement approaches in the following five job
categories:
• Professionals
• Technicians
• Protective Service Workers
• Skilled Crafts Workers
• Service-Maintenance Workers
Table 13 shows the data for Professionals
Table 14 shows the data for Technicians. The small number of
Technician positions at GMIA illustrates the importance of
considering the level at which an organization establishes and
monitors workforce diversity goals. Applying the underutilization
Table 13 Underutilization of Women Workers In GMIA’s
Professionals EEO-4 Job Category
Total
Employees Male Female
# Employees 25 15 10 % Employees 60.0% 40.0%
% Available 41.1% 58.9%
Any Difference Rule Yes % Under 18.9%
1 Whole Person Rule 4.0% Yes 80% of Availability 11.8
80% Rule Yes Note: Numbers may not add due to rounding. Source: Availability data from EEO-CIT06R Report for Milwaukee County, 2006-2010 Average. Milwaukee
County workforce data from year-end 2013 payroll records, fulltime employees only.
36

methods described in this report to organizational units with a
very small number of positions within individual EEO job
categories can effectively render goals established on the basis
of the percentage of minority and women available in the
Relevant Labor Market meaningless. For instance, referring
back to Table 6 of this report, it is a matter of practicality that
there would be many more opportunities to pursue and achieve
racial/ethnic and gender diversity among the 119 Technician
positions occupied within the County’s fulltime workforce than
among the three Technician positions occupied within the GMIA
fulltime workforce.
Table 14 Underutilization of Women Workers in GMIA’s
Technicians EEO-4 Job Category
Total
Employees Male Female
# Employees 3 3 0 % Employees 100.0% 0.0%
% Available 39.8% 60.2%
Any Difference Rule Yes % Under 60.2%
1 Whole Person Rule 33.3% Yes 80% of Availability 1.4
80% Rule Yes Note: Numbers may not add due to rounding. Source: Availability data from EEO-CIT06R Report for Milwaukee County, 2006-2010 Average. Milwaukee
County workforce data from year-end 2013 payroll records, fulltime employees only.
37

Table 15 shows the data for Protective Service workers.
Table 16 shows the data for Skilled Craft workers.
Table 16 Underutilization of Women Workers in GMIA’s
Skilled Craft Workers EEO-4 Job Category
Total
Employees Male Female
# Employees 39 38 1 % Employees 97.4% 2.6%
% Available 91.6% 8.4%
Any Difference Rule Yes % Under 5.8%
1 Whole Person Rule 2.6% Yes 80% of Availability 2.6
80% Rule Yes Note: Numbers may not add due to rounding. Source: Availability data from EEO-CIT06R Report for Milwaukee County, 2006-2010 Average. Milwaukee County
workforce data from year-end 2013 payroll records, fulltime employees only.
Table 15 Underutilization of Women Workers in GMIA’s
Protective Service Workers EEO-4 Job Category
Total
Employees Male Female
# Employees 54 49 5
% Employees 90.7% 9.3%
% Available 76.5% 23.5%
Any Difference Rule Yes
% Under 14.2%
1 Whole Person Rule 1.9% Yes
80% of Availability 10.2
80% Rule Yes Note: Numbers may not add due to rounding. Source: Availability data from EEO-CIT06R Report for Milwaukee County, 2006-2010 Average. Milwaukee County
workforce data from year-end 2013 payroll records, fulltime employees only.
38

Table 17 shows the data for Service-Maintenance workers.
Applying the same analysis Countywide, the three methods for
determining underutilization show a clear underutilization of
woman in two job categories:
• Skilled Craft workers.
• Service-Maintenance workers.
Table 17 Underutilization of Women Workers in GMIA’s
Service-Maintenance EEO-4 Job Category
Total
Employees Male Female
# Employees 111 89 22 % Employees 80.2% 19.8%
% Available 55.1% 44.9%
Any Difference Rule Yes % Under 25.1%
1 Whole Person Rule 0.9% Yes 80% of Availability 39.9
80% Rule Yes Note: Numbers may not add due to rounding. Source: Availability data from EEO-CIT06R Report for Milwaukee County, 2006-2010 Average. Milwaukee County
workforce data from year-end 2013 payroll records, fulltime employees only.
39
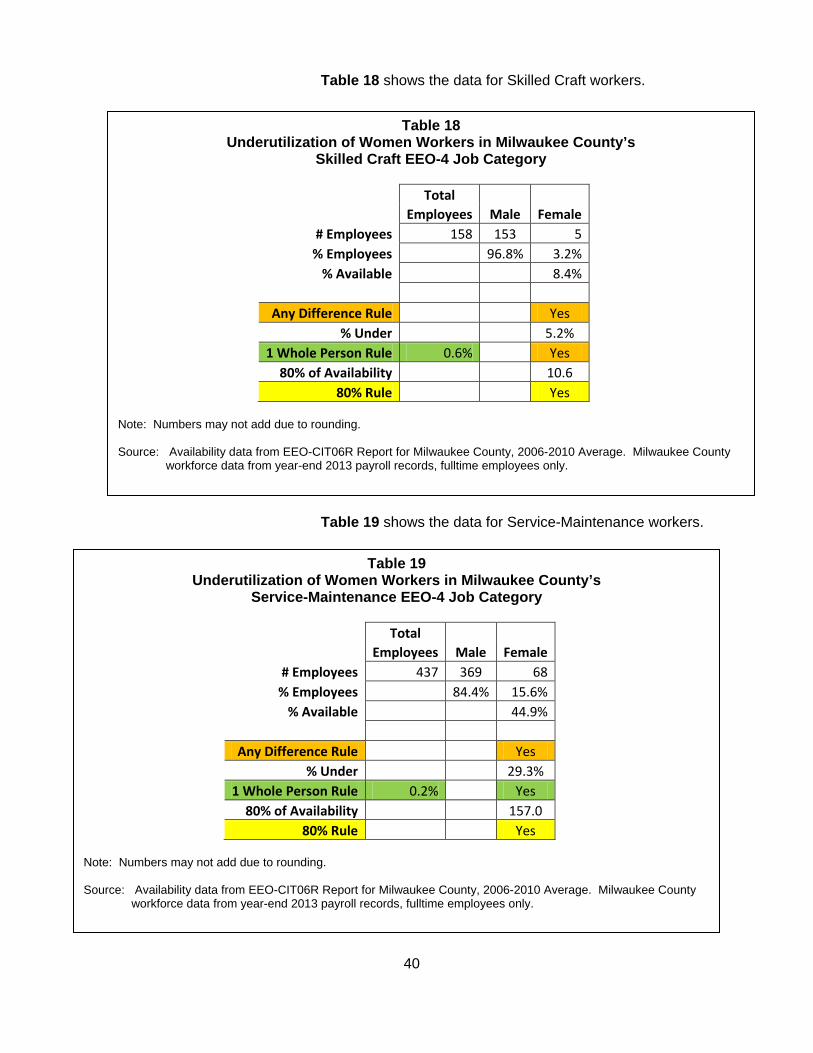
Table 18 shows the data for Skilled Craft workers.
Table 19 shows the data for Service-Maintenance workers.
Table 19 Underutilization of Women Workers in Milwaukee County’s
Service-Maintenance EEO-4 Job Category
Total
Employees Male Female
# Employees 437 369 68 % Employees 84.4% 15.6%
% Available 44.9%
Any Difference Rule Yes % Under 29.3%
1 Whole Person Rule 0.2% Yes 80% of Availability 157.0
80% Rule Yes Note: Numbers may not add due to rounding. Source: Availability data from EEO-CIT06R Report for Milwaukee County, 2006-2010 Average. Milwaukee County
workforce data from year-end 2013 payroll records, fulltime employees only.
Table 18 Underutilization of Women Workers in Milwaukee County’s
Skilled Craft EEO-4 Job Category
Total
Employees Male Female
# Employees 158 153 5 % Employees 96.8% 3.2%
% Available 8.4%
Any Difference Rule Yes % Under 5.2%
1 Whole Person Rule 0.6% Yes 80% of Availability 10.6
80% Rule Yes Note: Numbers may not add due to rounding. Source: Availability data from EEO-CIT06R Report for Milwaukee County, 2006-2010 Average. Milwaukee County
workforce data from year-end 2013 payroll records, fulltime employees only.
40
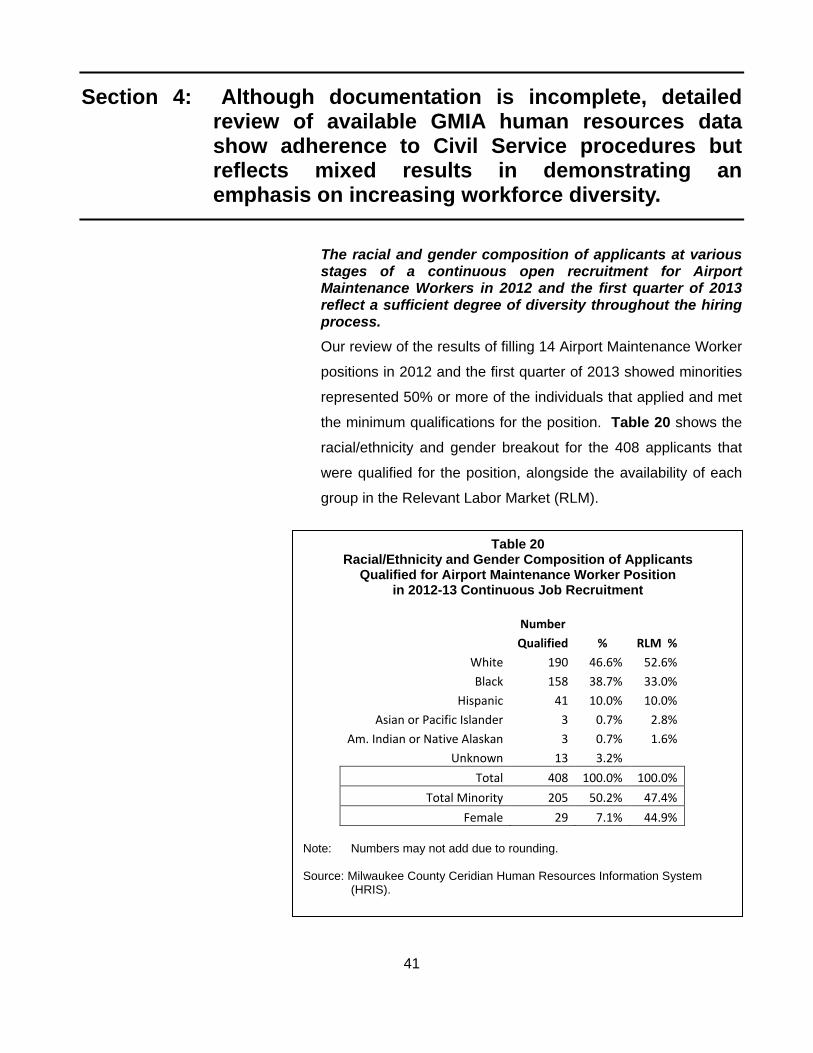
Section 4: Although documentation is incomplete, detailed review of available GMIA human resources data show adherence to Civil Service procedures but reflects mixed results in demonstrating an emphasis on increasing workforce diversity.
The racial and gender composition of applicants at various stages of a continuous open recruitment for Airport Maintenance Workers in 2012 and the first quarter of 2013 reflect a sufficient degree of diversity throughout the hiring process. Our review of the results of filling 14 Airport Maintenance Worker
positions in 2012 and the first quarter of 2013 showed minorities
represented 50% or more of the individuals that applied and met
the minimum qualifications for the position. Table 20 shows the
racial/ethnicity and gender breakout for the 408 applicants that
were qualified for the position, alongside the availability of each
group in the Relevant Labor Market (RLM).
Table 20 Racial/Ethnicity and Gender Composition of Applicants
Qualified for Airport Maintenance Worker Position in 2012-13 Continuous Job Recruitment
Number
Qualified % RLM %
White 190 46.6% 52.6%
Black 158 38.7% 33.0%
Hispanic 41 10.0% 10.0%
Asian or Pacific Islander 3 0.7% 2.8%
Am. Indian or Native Alaskan 3 0.7% 1.6%
Unknown 13 3.2% Total 408 100.0% 100.0%
Total Minority 205 50.2% 47.4%
Female 29 7.1% 44.9%
Note: Numbers may not add due to rounding. Source: Milwaukee County Ceridian Human Resources Information System
(HRIS).
41

The data in Table 20 show there were an ample supply of
minority applicants qualified for the position relative to their
presence in the RLM, while qualified female applicants fell far
short of their availability.
Table 21 shows the racial/ethnic and gender composition of the
14 Airport Maintenance Workers hired from continuous
recruitment during 2012 and the first quarter of 2013. While the
total number of hires from minority racial/ethnic groups exceeded
their relative presence in the RLM, the number of females hired,
was slightly less than half of their availability based on the RLM.
However, of the 14 employees hired during the period reviewed,
four—all minority males—are no longer employed by Milwaukee
County. Three of the four were discharged during the
probationary period, and one resigned. As a result, the
racial/ethnic composition of the 10 remaining Airport
Maintenance Workers is less diverse than the 14 hires from
GMIA’s continuous recruitment. This data is shown in Table 22.
Table 21 Racial/Ethnicity and Gender Composition of 14
Airport Maintenance Workers Hired from Continuous Recruitment in 2012-13
Number
Hired % RLM %
White 6 42.9% 52.6%
Black 7 50.0% 33.0%
Hispanic 1 7.1% 10.0%
Asian or Pacific Islander 0 0.0% 2.8%
Am. Indian or Native Alaskan 0 0.0% 1.6%
Total 14 100.0% 100.0%
Total Minority 8 57.1% 47.4%
Female 3 21.4% 44.9%
Source: Milwaukee County Ceridian Human Resources Information System (HRIS).
As a result of the departure of four minority employees, the racial/ethnic composition of the 10 current Airport Maintenance Workers is less diverse than the 14 hires from GMIA’s continuous recruitment.
42

The data from our review of the continuous recruitment of Airport
Maintenance Workers during the period 2012 through the first
quarter of 2013 reflects a concerted effort on the part of GMIA
management to hire minorities and females. However, as
demonstrated from this review, retention of targeted groups is
also an important component of maintaining a diverse workforce.
GMIA management offered reasonable justification for the
dismissals. We raise this issue in the context of considering not
only hiring practices, but retention strategies, when developing
comprehensive workforce diversity objectives.
Documentation of hiring decisions made at the field level was not well organized or complete. While management appears to have attempted to increase minority and female hiring, interviews suggest there was little or no discussion of goals or strategies to increase the diversity of Airport Maintenance Workers, at either the field level, or at the Human Resources departmental or central office levels. GMIA management told us that there is an effort on
management’s part to make sure GMIA has a diverse workforce
that is reflective of the community. The data from our review of
the Airport Maintenance Worker continuous recruitment supports
Table 22 Racial/Ethnicity and Gender Composition of 10
Currently Employed Airport Maintenance Workers From Continuous Recruitment in 2012-13
Number
Hired % RLM %
White 6 60.0% 52.6%
Black 3 30.0% 33.0%
Hispanic 1 10.0% 10.0%
Asian or Pacific Islander 0 0.0% 2.8%
Am. Indian or Native Alaskan 0 0.0% 1.6%
Total 10 100.0% 100.0%
Total Minority 4 40.0% 47.4%
Female 3 30.0% 44.9%
Source: Milwaukee County Ceridian Human Resources Information System (HRIS).
The data from our review of the continuous recruitment of Airport Maintenance Workers during the period 2012 through the first quarter of 2013 reflects a concerted effort on the part of GMIA management to hire minorities and females. However, retention of targeted groups is also an important component of maintaining a diverse workforce.
43

that statement. However, GMIA management also said there
was little support from the Human Resources Department in
working through the hiring process, particularly during 2012,
which preceded the addition of a Human Resources Generalist
assigned exclusively to GMIA.
During our examination of the 2012-2013 continuous recruitment
for Airport Maintenance Workers, we found the organization,
completeness and detail of documentation for several key steps
in the process to be lacking.
For instance, we were unable to find a definitive list of certified
candidates from which Airport Maintenance selected individuals.
Rather, we had to reconstruct that list from the Human
Resources Information System and e-mails sent from Human
Resources personnel to GMIA management.
We were also unable to discern, in complete form, all candidates
contacted for interviews from the certified list. Nor was there a
comprehensive record of standard questions asked of
candidates interviewed, and their responses.
In 2013, the Human Resources Generalist was hired to assist
the Human Resources Coordinator assigned to the Department
of Transportation. The Generalist is in the process of
establishing clear guidance on the hiring process for GMIA
managers, including modifying interview questions and providing
clear guidelines on document retention.
During our examination of the 2012-2013 continuous recruitment for Airport Maintenance Workers, we found the organization, completeness and detail of documentation for several key steps in the process to be lacking.
44

None of the 17 promotions within the GMIA workforce in those two years were granted to a minority employee. The data in 2012 and 2013 reflects a lack of diversity in both
racial/ethnicity and gender categories with respect to promotions
within the GMIA workforce. In 2012, nine of the departmental
promotions were non-minorities, with one female representing 11
percent. In 2013, all eight of the departmental promotions were
non-minorities, with two females representing 25 percent. This
data is presented in Table 23.
We emphasize that our audit did not include an evaluation of the
merits of either promotions or terminations at GMIA. GMIA
management noted that for the 17 promotions included in our
two-year review period, there were limited instances in which
minority or women workers qualified for advancement. Further,
there are prescribed remedies for individuals that believe they
were the object of unfair personnel actions, including appeals to
the Milwaukee County Personnel Review Board for wrongful
termination and complaints to the Equal Rights Division of the
State Department of Workforce Development or federal Equal
Employment Opportunity Commission for discriminatory
personnel actions. We reviewed GMIA records associated with
Table 23 Racial/Ethnicity and Gender Composition of 17
Promotions at GMIA in 2012-13
Number of Promotions
2012 % 2013 % Combined %
White 8 100.0% 9 100.0% 17 100.0% Black 0 0.0% 0 0.0% 0 0.0%
Hispanic 0 0.0% 0 0.0% 0 0.0% Asian or Pacific Islander 0 0.0% 0 0.0% 0 0.0%
Am. Indian or Native Alaskan 0 0.0% 0 0.0% 0 0.0% Total 8 100.0% 9 100.0% 17 100.0%
Total Minority 0 0.0% 0 0.0% 0 0.0% Female 2 25.0% 1 11.1% 3 17.6%
Source: Milwaukee County Ceridian Human Resources Information System (HRIS).
GMIA management noted there were limited instances in which minority or women workers qualified for advancement. We did not evaluate the merits of promotions or terminations at GMIA. There are prescribed remedies for individuals that believe they were the object of unfair personnel actions.
45

those avenues of remedy for employees and discuss that
information later in this report section.
The data showing the lack of minority and female promotions at
GMIA provide another example of an important metric that
should be considered in the development of a comprehensive
workforce development objective.
Staff turnover data for 2012 and 2013 show GMIA turnover rates are lower than the Countywide average and well within turnover rate ranges of other major County departments. Excessive staff turnover rates can be an indication of low staff
morale or other issues reflective of a poor working environment.
We measured staff turnover rates for Milwaukee County’s
fulltime workforce for both 2012 and 2013. The rates are
calculated by taking the total number of fulltime employee
terminations for the year and dividing by the average number of
fulltime employees in the workforce during the year. As shown in
Table 24, GMIA’s staff turnover rate was lower than the
Countywide average in both years, and well within the range of
turnover rates calculated for other major County departments.
46

None of the 70 discrimination complaints against Milwaukee County filed with the Equal Employment Opportunity Commission or the Equal Rights Division of the State Department of Workforce Development in 2012 and 2013 involved employees or management at GMIA. When an employee or citizen files a discrimination complaint
against Milwaukee County with either the Equal Employment
Opportunity Commission or the Equal Rights Division of the
State Department of Workforce Develoment, the County has a
limited number of days (typically 30 to 45 days, but often
involving extensions) to respond to the agency. At that time the
agency conducts any additional investigation it desires and
ultimately reaches an administrative determination. Our review
of discrimination complaints filed with state and federal agencies
for 2012 and 2013 showed there were 70 claims involving 33
complainants filed during that period. None of the 70 claims
involved personnel actions at GMIA. Table 25 provides a listing
Table 24
Staff Turnover Rates for Major County Departments 2012 and 2013
Department 2012 Rate 2013 Rate Behavioral Health Division 15.6% 18.3% District Attorney’s Office 9.0% 10.7% General Mitchell International Airport 10.5% 6.9%
Dept. of Health & Human Services 9.1% 9.6%
Department of Human Resources 16.6% 14.0% Department of Parks 8.6% 7.2% Milwaukee County Average 13.7% 12.2% Source: Calculated from Ceridian monthly personnel action reports, January 2012
through December 2013.
47

of the County departments involved in the 70 cases during that
two-year period.
A review of the limited number of GMIA personnel disciplinary actions appealed before the Personnel Review Board in 2012 and 2013 showed no pattern of reductions or reversals that would suggest racial or gender bias on the part of GMIA management. Data from the Milwaukee County Personnel Review Board (PRB)
shows a limited number of GMIA personnel disciplinary actions
appealed to the PRB in 2012 and 2013. In 2012, three GMIA
employees appealed disciplinary actions to the PRB; in 2013,
nine GMIA employees (including one of the three included in the
2012 data) appealed disciplinary actions to the PRB. As a result
of the limited number of employees involved, it is difficult to
discern any potential racial or gender bias in those disciplinary
actions based on proportionality with the racial/ethnicity or
gender composition of the entire GMIA workforce.
Table 25 Number of Equal Employment Opportunity Claims
Filed in 2012−2013, by County Department
Department
Claims Office of the Sheriff
23
Behavioral Health Division
13 Department of Health & Human Services
9
Department of Family Care
5 House of Correction
5
Information Management Systems Division
4 Child Support Enforcement
2
Facilities Management Division
2 Department of Parks, Recreation & Culture
2
Housing and Community Development Division
2 Circuit Courts-Probate
1
Department of Human Resources
1 Zoological Department
1
Total 2012 & 2013
70 Source: Records maintained by the Milwaukee County Office of Corporation
Counsel.
As a result of the limited number of employees involved, it is difficult to discern any potential racial or gender bias in those disciplinary actions based on proportionality with the racial/ethnicity or gender composition of the entire GMIA workforce.
48

However, analyzing the data in several ways does not present a
pattern of PRB reductions or reversals that would suggest a
racial or gender bias on the part of GMIA management.
Table 26 presents the combined 2012 and 2013 data by
individual, and by type of disciplinary action appealed (e.g.,
termination or suspension).
Table 27 shows the data by number of unique personnel actions.
For instance, one employee appealed five unique instances of
suspensions issued by GMIA management in 2013.
Table 26
GMIA Disciplinary Actions Appealed by Individual Employee, by Action
2012 and 2013 Combined
Action Employees White % Minority % Female* % Discharge 6 4 66.7% 2 33.3% 1 16.7%
Suspension 4 2 50.0% 2 50.0% 0 0.0% Grievance 1 1 100.0% 0 0.0% 0 0.0%
Total Employees 11 7 63.6% 4 36.4% 1 9.1%
*Note: Female data also included in racial category. Source: Milwaukee County Personnel Review Board internal database.
49

Overall, GMIA management disciplinary actions appealed by
employees to the PRB in 2012 and 2013 were sustained or
achieved in effect in 76.5% of the cases. For instance, if the
personnel action was discharge and the employee, after
appealing the discharge, instead resigned or retired from County
employment, the discharge was, in effect, achieved. Table 28
shows this data.
Table 27
GMIA Disciplinary Actions Appealed by Number of Cases, by Action
2012 and 2013 Combined
Action Cases White % Minority % Female* % Discharge 8 6 75.0% 2 25.0% 1 12.5%
Suspension 10 4 40.0% 6 60.0% 0 0.0% Grievance 1 1 100.0% 0 0.0% 0 0.0%
Total Cases 19 11 57.9% 8 42.1% 1 5.3%
*Note: Female data also included in racial category. Source: Milwaukee County Personnel Review Board internal database.
Overall, GMIA management disciplinary actions appealed by employees to the PRB in 2012 and 2013 were sustained, or achieved in effect, in 76.5% of the cases.
50

Table 28
GMIA Disciplinary Actions Appealed Case Disposition
2012 and 2013 Combined
Action Cases White % Minority % Female* % Discharge 8 6 75.0% 2 25.0% 1 12.5%
Sustained or Achieved In Effect 3 2
1 Reduced or Oral/Written Agreement 3 2
1
1
Dismissed 1 1 Pending 1 1
Suspension 10 4 40.0% 6 60.0% 0 0.0% Sustained or Appeal Withdrawn 10 4
6
Reduced 0 Dismissed 0
Grievance 1 1 100.0% 0 0.0% 0 0.0% Dismissed--(No Jurisdiction) 1 1
Total Cases 19 11 57.9% 8 42.1% 1 5.3%
Sustained or Achieved in Effect 13 6
7
0 Reduced 3 2
1
1
Dismissed 2 2 Pending 1 1
Total Cases Determined** 17
Total Cases Sustained or Achieved in Effect 13
% of Cases Sustained or Achieved in Effect 76.5% *Note: Female data also included in racial category. **Excludes pending discharge case and grievance case dismissed due to lack of jurisdiction. Source: Milwaukee County Personnel Review Board internal database.
51

Section 5: Conclusions and Recommendations.
Although this audit began with a focus on personnel practices
with respect to workforce diversity at General Mitchell
International Airport, many of our findings and recommendations
are Countywide in scope. Following is a recap of our
conclusions and several recommendations designed to address
issues raised in the report.
Conclusions
Milwaukee County does not have a contemporary, comprehensive workforce diversity policy. Earlier this year, the Department of Human Resources worked
with departmental diversity committees and the Office of the
County Executive to draft a mission statement and goals to guide
ongoing activities for the remainder of 2014. This effort forms
the foundation for addressing many of the issues of concern
identified in this report.
Milwaukee County has experienced problems with the collection and maintenance of data necessary to accurately report and effectively analyze and manage issues relating to workforce diversity. The County’s 2007 conversion to its current Ceridian Human
Resources management information system created problems
affecting its ability to manage workforce diversity issues.
Subsequent corrective measures have been ad hoc, limited in
scope and have lacked an overall policy initiative to fashion a
cohesive workforce diversity objective.
Milwaukee County’s overall fulltime workforce is more diverse than GMIA’s; there is wide variation in workforce diversity among fulltime staff in major County departments.. For year-end 2013, data show Milwaukee County’s fulltime
workforce was more diverse in total percentage of minority and
52

women participation than its Relevant Labor Market, while at
GMIA, there was less workforce diversity.
Minority workers in the aggregate are clearly underutilized in four
GMIA job categories, and female workers are clearly
underutilized in five GMIA job categories.
Although documentation was incomplete, detailed review of available GMIA human resources data show adherence to Civil Service procedures but reflects mixed results in demonstrating an emphasis on increasing workforce diversity. GMIA management told us that there is an effort on
management’s part to make sure GMIA has a diverse workforce
that is reflective of the community. The data from our review of
the Airport Maintenance Worker continuous recruitment supports
that statement. However, we found the organization,
completeness and detail of documentation for several key steps
in the process to be lacking.
None of the 17 promotions within the GMIA workforce in 2012
and 2013 were granted to a minority employee. GMIA
management noted that for the 17 promotions included in our
two-year review period, there were limited instances in which
minority or women workers qualified for advancement.
However, none of the 70 discrimination complaints against
Milwaukee County filed with the Equal Employment Opportunity
Commission or the Equal Rights Division of the State
Department of Workforce Development in 2012 and 2013
involved employees or management at GMIA. And a review of
the limited number of GMIA personnel disciplinary actions
appealed before the Personnel Review Board in 2012 and 2013
showed no pattern of reductions or reversals that would suggest
racial or gender bias on the part of GMIA management.
53

Recommendations
DHR management should build on its current efforts to develop a Diversity Committee mission statement by developing of a comprehensive Milwaukee County workforce diversity policy. In developing an updated, contemporary workforce diversity
policy for Milwaukee County, DHR management should address,
at a minimum, the following issues identified in this report:
1. Proper classification of Milwaukee County’s positions into appropriate EEO-4 job categories, based on consistent application of criteria established with meaningful input from operations management.
2. Selection of appropriate criteria for evaluating underutilization of minority and women participation in the eight EEO-4 job categories in Milwaukee County’s workforce. Three accepted methods were demonstrated in this audit They are commonly referred to as the:
• Any Difference Rule; • One Whole Person Rule; and • 80% of Availability Rule.
3. Determination of the appropriate level at which workforce diversity goals should be established and achievement monitored. This could involve viewing the County workforce in a more comprehensive manner and looking for opportunities to establish meaningful workforce diversity goals across organizational units, rather than relying on traditional departmental structures, regardless of size or workforce composition, establishing individual goals.
4. Establishment of a process for developing, refining and
updating appropriate Relevant Labor Market data for use in establishing workforce diversity goals and monitoring achievement.
5. Development of strategies flowing from the County’s workforce diversity policy to promote operations management’s awareness, understanding and application of Milwaukee County workforce diversity principles.
DHR management should convene a workgroup, including staff from Human Resources, Payroll and Information Technology, to address EEO data collection, maintenance and reporting issues identified in this report. EEO data collection, maintenance and reporting problems
surfaced during the County’s conversion from its predecessor
54

payroll system, Genesys, to its current Human Resource
Information System, Ceridian. Exacerbating these problems
were significant staff turnover in key management positions in
such areas as Information Technology, Payroll, and Human
Resources. A workgroup comprising management from each of
those areas should, at a minimum:
6. Re-examine the County’s process for collecting, maintaining and reporting EEO data with the express purpose of complying with applicable EEO-4 reporting requirements.
7. Ensure compatibility between racial/ethnicity source documents (e.g., 7-category EEO-1 vs. 5-category EEO-4 classification systems). This will also require updating if/when a pending EEOC reporting change is finalized.
8. Ensure compatibility of data fields and drop-down menus (e.g., current job groups, a sub-set of HPW’s EEO-4 job categories, consist of EEO-1 classifications).
9. Ensure that, if EEO-1 data is determined to be useful for compensation benchmarking purposes, there is an automated cross-walk that avoids duplicate classification of positions and produces valid, consistent results when queried.
DHR management should work with management at General Mitchell International Airport to devise a specific strategy to emphasize a commitment to increasing the diversity of the GMIA workforce, in both minority and female categories of employees. In developing such a strategy, particular attention should be paid
to:
10. Working in a manner consistent with, and in harmony with, the efforts undertaken on a Countywide basis in recommendation No. 5.
11. Maintaining and retaining additional detail documenting steps within the hiring process at GMIA (e.g., who was contacted for an interview, questions asked during interviews, etc.).
12. Assigning responsibility at DHR for monitoring GMIA promotions and terminations for racial/ethnicity and gender disparities, and to discuss the results of such monitoring with GMIA management on an annual basis.
55

This Page Intentionally Left Blank
56

Exhibit 1
Audit Scope
This audit was initiated in response to a request contained in a County Board Resolution (File No.
13-97). The overall objective of this audit was to evaluate personnel practices at General Mitchell
International Airport (GMIA) as they relate to the Milwaukee County’s commitment to workforce
diversity. Included in the overall audit objective was to identify GMIA’s minority and gender hiring
practices, and to include historical diversity data on GMIA promotions, termination practices, and
turnover.
We conducted this performance audit in accordance with generally accepted government auditing
standards. Those standards require that we plan and perform the audit to obtain sufficient,
appropriate evidence to provide a reasonable basis for our findings and conclusions based on our
audit objectives. We believe that the evidence obtained provides a reasonable basis for our
findings and conclusions based on our audit objectives.
We limited our review to the areas specified in this Scope Section. During the course of the audit,
we:
• Reviewed relevant regulations, policies, administrative procedures, budgets and resolutions including federal, state and County statutes, laws, and ordinances relating to affirmative action and workforce diversity concepts.
• Reviewed applicable federal Executive Branch actions and United States Supreme Court decisions that had significant impact with regard to racial/ethnicity quotas and affirmative action programs.
• Interviewed management staff from various County departments, including GMIA, Human
Resources, and the Office of the Comptroller–Payroll Division, to obtain relevant information on the implementation of various policies and procedures, race/ethnicity and gender data collection and implementation, and employee recruitment efforts and hiring practices at GMIA.
• Analyzed data on minorities and female hires, promotions and terminations at GMIA.
• Analyzed workforce data using U.S. Census Bureau Relevant Labor Market/Equal Employment Opportunity reports, and Milwaukee County Ceridian Human Resources Information System (HRIS), including both the Human Resources Payroll Web (HPW) and the Ceridian Recruiting Solutions modules.
57

• Reviewed data on formal Equal Employment Opportunity claims filed against Milwaukee County departments.
• Analyzed data from the Milwaukee County Personnel Review Board (PRB) with regard to GMIA management’s personnel disciplinary actions that were appealed by employees.
• Calculated various methods of underutilization of minorities and females using three analytical methods approved by the U.S. Department of Labor.
• Gathered data and interviewed key individuals from various authoritative sources including U.S. Equal Employment Opportunity Commission (EEOC), U.S. Census Bureau, and State of Wisconsin’s Office of State Employment Relations.
• Surveyed other counties within Wisconsin and nationally on the collection, maintenance and reporting of federally-mandated EEO workforce data.
• Reviewed historical information from Milwaukee County on processes and procedures used to report Countywide workforce diversity and affirmative action goals.
58

Exhibit 2 File No. 13-97
(ITEM ) A resolution by Supervisors Mayo, Johnson and Romo West authorizing and directing
the Comptroller’s Audit Services Division to conduct an audit of General Mitchell international
Airport (GMIA) as it relates to minority and gender hiring practices, historical data, promotions,
termination practices and turnover, by recommending adoption of the following:
A RESOLUTION
WHEREAS, the 2013 Adopted Budget provides 289 County staff for GMIA; and
WHEREAS, it is vital that GMIA is reflective of the County’s commitment to diversity
because it is the “gateway” for persons visiting Milwaukee County for business or leisure;
and
WHEREAS, questions have been raised about diversity and employment practices at GMIA;
and
WHEREAS, as a means to ensure diversity is being stressed and employment practices are
fair and consistent it is reasonable and prudent that an audit be conducted of employment
practices at GMIA; and
WHEREAS, the Committee on Transportation, Public Works and Transit, at its meeting on
January 23, 2013, recommended adoption of the said resolution (vote 7-0); and
WHEREAS, the Committee on Finance Personnel and Audit, at its meeting on January 31,
2013, also recommended adoption of the said resolution (vote 9-0) and added two
cosponsors; now, therefore,```````
BE IT RESOLVED, the Milwaukee County Board of Supervisors does hereby authorize and
direct the Comptroller’s Audit Services Division to conduct an audit of GMIA as it relates to
minority and gender hiring practices, historical data, promotions, termination practices and
turnover. H:\Shared\COMCLERK\Committees\2013\Jan\FPA\Resolutions\13-97.doc
59

Exhibit 3
Milwaukee County Fulltime Employees' Race/Ethnicity as of Year-End 2013
Select Departments Notes: Numbers may not add due to rounding. Airport = General Mitchell International Airport Parks = Department of Parks, Recreation and Culture BHD = Behavioral Health Division DHR = Department of Human Resources DA = District Attorney’s Office DHHS – Department of Health and Human Services
Race/Ethnicity Countywide Airport Parks BHD DHR DA DHHS American Indian or
Alaskan 26 0.7% 3 1.2% 1 0.5% 3 0.6% 0 0.0% 2 1.5% 2 0.6% Asian or Pacific Islander 62 1.7% 1 0.4% 0 0.0% 20 4.0% 0 0.0% 3 2.2% 1 0.3% Black (Not of Hispanic) 1183 31.7% 54 21.7% 10 5.2% 171 34.3% 19 35.2% 43 31.4% 154 49.4%
Hispanic 214 5.7% 14 5.6% 9 4.7% 19 3.8% 6 11.1% 9 6.6% 22 7.1% White (Not of Hispanic) 2246 60.2% 177 71.1% 173 89.6% 285 57.2% 29 53.7% 80 58.4% 133 42.6%
Total 3,731 100.0% 249 100.0% 193 100.0% 498 100.0% 54 100.0% 137 100.0% 312 100.0%
Minority 1,485 39.8% 72 28.9% 20 10.4% 213 42.8% 25 46.3% 57 41.6% 179 57.4% White 2,246 60.2% 177 71.1% 173 89.6% 285 57.2% 29 53.7% 80 58.4% 133 42.6% Total 3,731 100.0% 249 100.0% 193 100.0% 498 100.0% 54 100.0% 137 100.0% 312 100.0%
Male 1787 47.9% 199 79.9% 144 74.6% 126 25.3% 12 22.2% 26 19.0% 120 38.5% Female 1944 52.1% 50 20.1% 49 25.4% 372 74.7% 42 77.8% 111 81.0% 192 61.5%
Total 3,731 100.0% 249 100.0% 193 100.0% 498 100.0% 54 100.0% 137 100.0% 312 100.0%
60

Exhibit 4
Milwaukee County Fulltime Workforce Composition by EEO-4 Job Classification as of Year-End 2013
Select Departments
EEO-4 Classification Countywide Airport Parks BHD DHR DA DHHS Officials and Administrators - 1 217 5.8% 7 2.8% 8 4.1% 32 6.4% 9 16.7% 2 1.5% 10 3.2% Professionals - 2 885 23.7% 25 10.0% 35 18.1% 232 46.6% 26 48.1% 45 32.8% 127 40.7% Technicians - 3 119 3.2% 3 1.2% 0 0.0% 31 6.2% 1 1.9% 3 2.2% 9 2.9% Protective Service Workers - 4 942 25.2% 54 21.7% 0 0.0% 0 0.0% 0 0.0% 12 8.8% 71 22.8% Paraprofessionals - 5 248 6.6% 0 0.0% 3 1.6% 90 18.1% 0 0.0% 17 12.4% 46 14.7%
Administrative Support - 6 725 19.4% 10 4.0% 10 5.2% 93 18.7% 18 33.3% 58 42.3% 46 14.7% Skilled Craft Workers - 7 158 4.2% 39 15.7% 24 12.4% 0 0.0% 0 0.0% 0 0.0% 0 0.0% Service-Maintenance - 8 437 11.7% 111 44.6% 113 58.5% 20 4.0% 0 0.0% 0 0.0% 3 1.0% Total 3,731 100.0% 249 100.0% 193 100.0% 498 100.0% 54 100.0% 137 100.0% 312 100.0%
Notes: Numbers may not add due to rounding. Airport = General Mitchell International Airport Parks = Department of Parks, Recreation and Culture BHD = Behavioral Health Division DHR = Department of Human Resources DA = District Attorney’s Office DHHS – Department of Health and Human Services
61

This Page Intentionally Left Blank
62


