table of contents - rsc.org file2 i. general . solvents and starting materials were purchased from...
TRANSCRIPT
Table of Contents
I. General ............................................................................................................................ S2
II. Experimental details ..................................................................................................... S3
III. Association experiments............................................................................................... S7
Job Plot..................................................................................................................... S7
NMR Binding Experiments...................................................................................... S7
IV. Crystallographic details .............................................................................................. S12
V. UV/Vis spectroscopy ..................................................................................................... S20
VI. References ................................................................................................................... S21
VII. 1H, 19F and 13C NMR Spectra.................................................................................... S22
Electronic Supplementary Material (ESI) for ChemComm.This journal is © The Royal Society of Chemistry 2019
2
I. General Solvents and starting materials were purchased from Sigma Aldrich, TCI, Fisher Scientific, Alfa Aesar or
Carl Roth and used as received. Dry solvents were obtained from an MBRAUN solvent purification
system. Reactions were monitored by thin layer chromatography (TLC) carried out on silica gel plates
(ALUGRAM® Xtra SIL G/UV254, Macherey Nagel) using UV light for visualization. Column
chromatography was carried out with silica gel (Silica 60 M, 0.04-0.063 mm, Macherey Nagel) using
eluents as specified.
NMR spectra were recorded on a Bruker Avance III 300 and a Bruker Avance III 600 spectrometer at
25 °C using residual protonated solvent signals as internal standards for 1H and 13C spectra
(1H: δ(CDCl3) = 7.26 ppm, δ(C6D6) = 7.16 ppm, δ(CD3CN) = 1.94 ppm ; 13C: δ(CDCl3) = 77.16 ppm,
δ(C6D6) = 128.06 ppm, δ(CD3CN) = 118.26, 1.32 ppm). Splitting patterns are abbreviated as follows:
singlet (s), doublet (d), triplet (t), doublet of doublet (dd) and multiplet (m). Infrared spectra were recorded
on a Jasco FT/IR-6200 and Shimadzu FT/IR IR Affinity-1 with an ATR attachment. Relative intensities
of absorption bands are reported as s (strong), m (medium), w (weak) and br (broad). Electro-spray
ionization high-resolution mass spectrometry was performed on a UHR-QTOF maXis 4G (Bruker
Daltonics, Billerica, Massachusetts).
UV/vis spectroscopy was performed on a Perkin Elmer Lambda 19. A 405 nm LED (M405L3) and a 455
nm LED (M455L3), together with a LED driver (LEDD1B), from Thorlabs were applied for
photoisomerization.
1,8-dichloroanthraquinone was used to prepare 1,8-dibromoanthraquinone.[1] Reducing 1,8-
dibromoanthraquinone with aluminium in H2SO4[2] followed by sodium borohydride addition[1] gave 1,8-
dibromoanthracene. 1,8-Diiodo-9-mesitylanthracene was synthesized from 4,5-diiodo-9-anthrone[3]
which was obtained from 1,8-dichloroanthraquinone by halide exchange[3,4] followed by reduction using
sodium borohydride.[5] 3,5-Lutidine was used to prepare 3,5-lutidine-4-boronic acid pinacol ester by
oxidation to the corresponding N-oxide, para-selective bromination, reduction followed by a bromine-
lithium exchange and treatment with tributylborate and pinacol.[6-9] 4,4’-Diiodooctafluoroazobenzene
(A1) was synthesized starting from 2,3,5,6-tetrafluoroaniline via 4-iodo-2,3,5,6-tetrafluoroaniline.[10] 2,6-
Difluoro-4-iodoaniline, which was obtained by para-selective iodination of 2,6-difluoroaniline, was used
to prepare 2,2’,6,6’-tetrafluoro-4,4’-diiodoazobenzene (A3).[11]
3
II. Experimental details
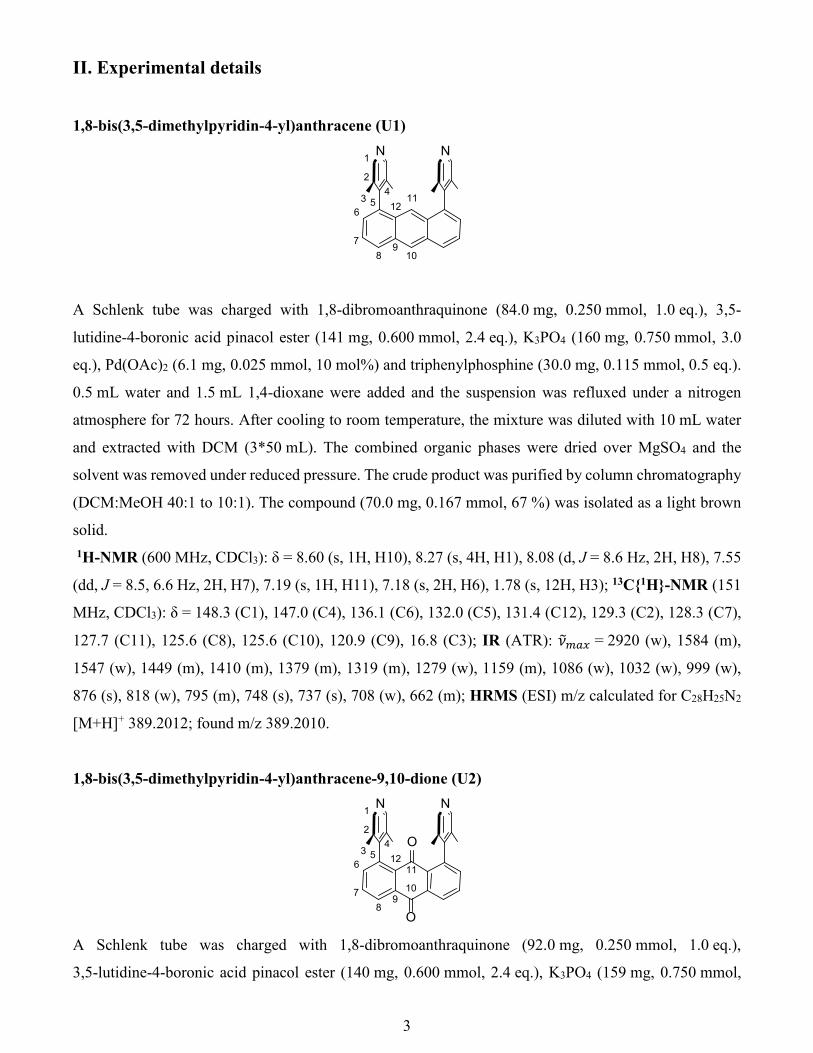
1,8-bis(3,5-dimethylpyridin-4-yl)anthracene (U1)
6
78
9
125
10
114
N1
2
3
N
A Schlenk tube was charged with 1,8-dibromoanthraquinone (84.0 mg, 0.250 mmol, 1.0 eq.), 3,5-
lutidine-4-boronic acid pinacol ester (141 mg, 0.600 mmol, 2.4 eq.), K3PO4 (160 mg, 0.750 mmol, 3.0
eq.), Pd(OAc)2 (6.1 mg, 0.025 mmol, 10 mol%) and triphenylphosphine (30.0 mg, 0.115 mmol, 0.5 eq.).
0.5 mL water and 1.5 mL 1,4-dioxane were added and the suspension was refluxed under a nitrogen
atmosphere for 72 hours. After cooling to room temperature, the mixture was diluted with 10 mL water
and extracted with DCM (3*50 mL). The combined organic phases were dried over MgSO4 and the
solvent was removed under reduced pressure. The crude product was purified by column chromatography
(DCM:MeOH 40:1 to 10:1). The compound (70.0 mg, 0.167 mmol, 67 %) was isolated as a light brown
solid.
1H-NMR (600 MHz, CDCl3): δ = 8.60 (s, 1H, H10), 8.27 (s, 4H, H1), 8.08 (d, J = 8.6 Hz, 2H, H8), 7.55
(dd, J = 8.5, 6.6 Hz, 2H, H7), 7.19 (s, 1H, H11), 7.18 (s, 2H, H6), 1.78 (s, 12H, H3); 13C{1H}-NMR (151
MHz, CDCl3): δ = 148.3 (C1), 147.0 (C4), 136.1 (C6), 132.0 (C5), 131.4 (C12), 129.3 (C2), 128.3 (C7),
127.7 (C11), 125.6 (C8), 125.6 (C10), 120.9 (C9), 16.8 (C3); IR (ATR): 𝜈𝜈�𝑚𝑚𝑚𝑚𝑚𝑚 = 2920 (w), 1584 (m),
1547 (w), 1449 (m), 1410 (m), 1379 (m), 1319 (m), 1279 (w), 1159 (m), 1086 (w), 1032 (w), 999 (w),
876 (s), 818 (w), 795 (m), 748 (s), 737 (s), 708 (w), 662 (m); HRMS (ESI) m/z calculated for C28H25N2
[M+H]+ 389.2012; found m/z 389.2010.
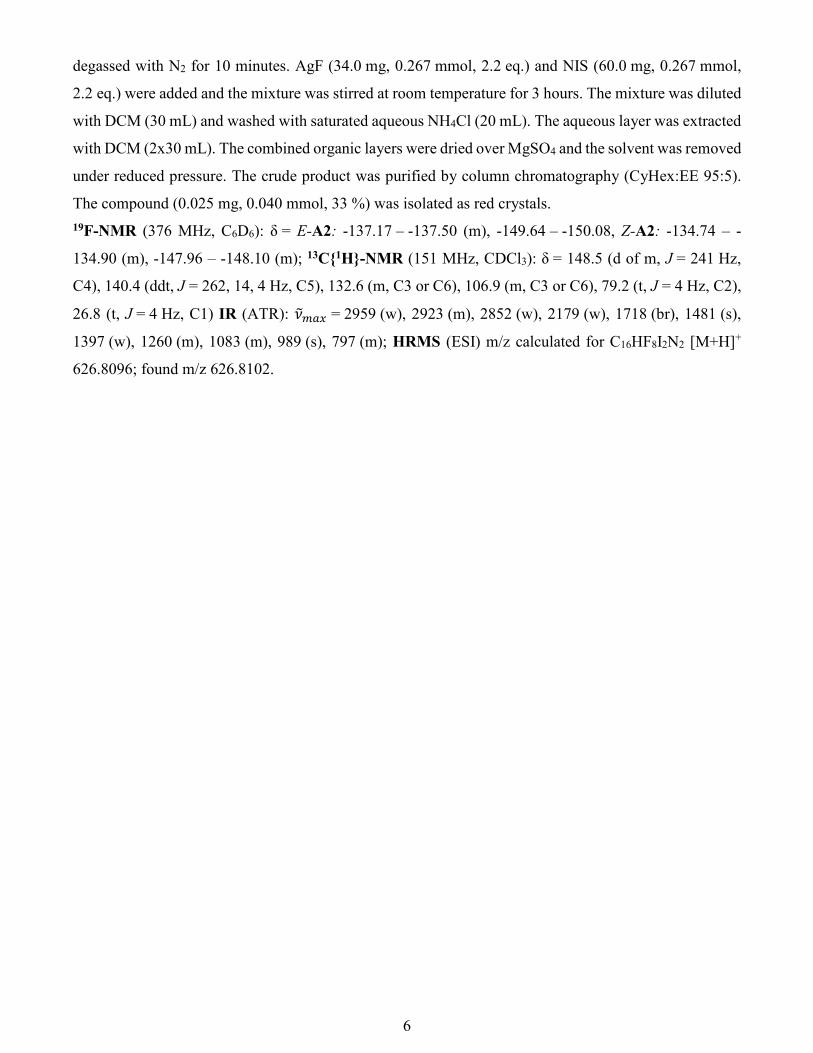
1,8-bis(3,5-dimethylpyridin-4-yl)anthracene-9,10-dione (U2)
6
78
9
125
10
11
4
O
N1
2
3O
N
A Schlenk tube was charged with 1,8-dibromoanthraquinone (92.0 mg, 0.250 mmol, 1.0 eq.),
3,5-lutidine-4-boronic acid pinacol ester (140 mg, 0.600 mmol, 2.4 eq.), K3PO4 (159 mg, 0.750 mmol,

4
3.0 eq.), Pd(OAc)2 (6.0 mg, 0.025 mmol, 10 mol%) and triphenylphosphine (30.0 mg, 0.115 mmol, 0.5
eq.). 0.5 mL water and 1.5 mL 1,4-dioxane were added and the suspension was refluxed under a nitrogen
atmosphere for 72 hours. After cooling to room temperature, the mixture was diluted with 10 mL water
and extracted with DCM (3*50 mL). The combined organic phases were dried over MgSO4 and the
solvent was removed under reduced pressure. The crude product was purified by column chromatography
(DCM:MeOH 40:1 to 10:1). The compound (70.0 mg, 0.167 mmol, 67 %) was isolated as a yellow solid. 1H-NMR (600 MHz, CDCl3): δ = 8.43 (dd, J = 7.9, 1.3 Hz, 2H, H8), 8.22 (s, 4H, H1), 7.83 (dd, J = 7.6
Hz, 2H, H6), 7.30 (dd, J = 7.5, 1.3 Hz, 2H, H7), 1.80 (s, 12H, H3); 13C{1H}-NMR (151 MHz, CDCl3):
δ = 183.5 (C11), 182.8 (C10), 149.2 (C4), 148.2 (C1), 139.5 (C2), 136.3 (C6), 134.4 (C9), 133.9 (C7),
131.6 (C12), 129.1 (C5), 127.5 (C8), 17.2 (C3); IR (ATR): 𝜈𝜈�𝑚𝑚𝑚𝑚𝑚𝑚 = 3588 (w), 2941 (m), 1668 (s), 1574
(m), 1427 (m), 1410 (m), 1329 (s), 1283 (w), 1248 (s), 1161 (m), 1098 (m), 1076 (m), 1028 (w), 997 (w),
962 (m), 912 (m), 883 (m), 851 (m), 808 (s), 741 (s), 710 (m), 700 (m), 679 cm-1 (m); HRMS (ESI) m/z
calculated for C28H23N2O2 [M+H]+: 419.1754; found m/z 419.1760.
4,4'-(10-mesitylanthracene-1,8-diyl)bis(3,5-dimethylpyridine) (U3)
6
78
9
125
10
114
N1
2
3
N
13
171614
18
15
A Schlenk tube was charged with 1,8-diiodo-10-mesitylanthracene (126 mg, 0.230 mmol, 1.0 eq.), 3,5-
lutidine-4-boronic acid pinacol ester (161 mg, 0.690 mmol, 3.0 eq.), K3PO4 (146 mg, 0.690 mmol,
3.0 eq.), Pd(OAc)2 (5.0 mg, 0.023 mmol, 10 mol%) and triphenylphosphine (30.0 mg, 0.115 mmol,
0.5 eq.). 0.5 mL water and 1.5 mL 1,4-dioxane were added and the suspension was refluxed under a
nitrogen atmosphere for 42 hours. 2.5 equivalents of the boronic acid ester were added again and the
mixture was refluxed for additional 42 hours. After cooling to room temperature, the mixture was diluted
with 5 mL water and extracted with DCM (3*50 mL) and ethyl acetate (2*50 mL). The combined organic
phases were dried over MgSO4 and the solvent was removed under reduced pressure. The crude product
was purified by column chromatography (DCM:MeOH:TEA 10:1:0.1). The compound (49.0 mg,
0.097 mmol, 42 %) was isolated as a yellow solid.

5
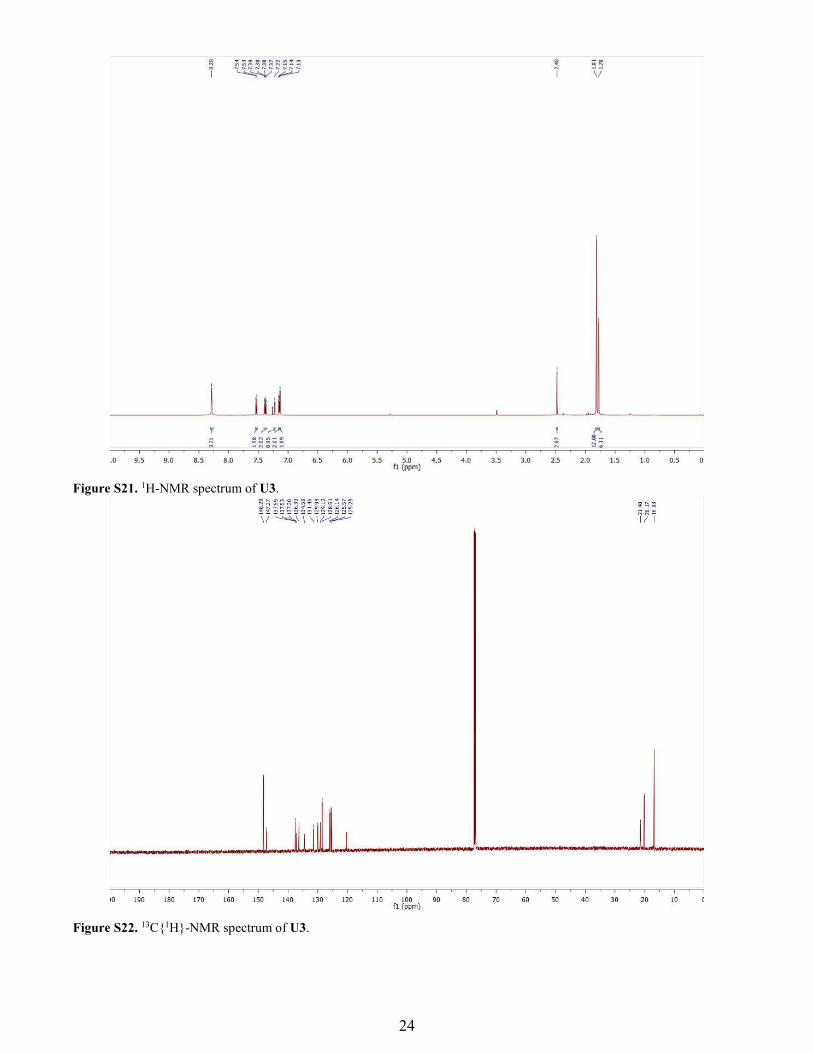
1H-NMR (600 MHz, CDCl3): δ = 8.28 (s, 4H, H1), 7.53 (d, J = 8.8 Hz, 2H, H8), 7.38 (dd, J = 8.8, 6.6
Hz, 2H, H7), 7.22 (s, 1H, H11), 7.15 (d, J = 6.6 Hz, 2H, H6), 7.13 (s, 2H, H16), 2.48 (s, 3H, H18), 1.81
(s, 12H, H3), 1.78 (s, 6H, H15); 13C{1H}-NMR (151 MHz, CDCl3): δ = 148.3, 147.3, 137.6, 137.5, 137.2,
136.3, 134.5, 131.5, 130.0, 129.1, 128.5, 126.1, 125.6, 125.3, 120.4, 21.4, 20.2, 16.8; IR (ATR):
𝜈𝜈�𝑚𝑚𝑚𝑚𝑚𝑚 = 2966 (w), 2918 (m), 2854 (w), 2360 (s), 2337 (m), 1734 (m), 1585 (m), 1450 (m), 1414 (w),
1377 (w), 1276 (m), 1261 (w), 1166 (w), 826 (m), 748 (s), 706 cm-1 (w); HRMS (ESI) m/z calculated for
C37H35N2 [M+H]+ 507.2795; found m/z 507.2800.
1,2-bis(2,3,5,6-tetrafluoro-4-((trimethylsilyl)ethynyl)phenyl)diazene
NN
F
FF
FF
F
FF
TMS
TMS A mixture of 1,2-bis(2,3,5,6-tetrafluoro-4-iodophenyl)diazene (130 mg, 0.225 mmol, 1.0 eq.),
trimethylsilylacetylene (0.64 mL, 4.50 mmol, 20 eq.) and triethylamine (1.00 mL, 7.20 mmol, 32 eq.) was
purged with nitrogen for 10 minutes. CuI (4.0 mg, 0.023 mmol, 10 mol%) and Pd(PPh3)Cl2 (6.0 mg,
0.009 mmol, 4 mol%) were added and the mixture was refluxed for 5 hours. After cooling to room
temperature, the mixture was diluted with 20 ml DCM and washed with 10 mL saturated aqueous NH4Cl
solution. The aqueous phase was extracted with DCM and the combined organic layers were dried over
Mg2SO4 and filtrated over a small silica plug. The solvent was removed under reduced pressure yielding
83.0 mg (0.160 mmol, 71 %) of the crude product, which was used without further purification. HRMS
(ESI) m/z calculated for C22H19F8N2Si2 [M+H]+ 519.0954; found m/z 519.0952.
1,2-bis(2,3,5,6-tetrafluoro-4-(iodoethynyl)phenyl)diazene (A2)
3 4
5
6 NN
2F
FF
FF
F
FF
I
1I
A solution of the previously synthesized 1,2-bis(2,3,5,6-tetrafluoro-4-
((trimethylsilyl)ethynyl)phenyl)diazene (63.0 mg, 0.121 mmol, 1.0 eq.) in 15 mL acetonitrile was
6
degassed with N2 for 10 minutes. AgF (34.0 mg, 0.267 mmol, 2.2 eq.) and NIS (60.0 mg, 0.267 mmol,
2.2 eq.) were added and the mixture was stirred at room temperature for 3 hours. The mixture was diluted
with DCM (30 mL) and washed with saturated aqueous NH4Cl (20 mL). The aqueous layer was extracted
with DCM (2x30 mL). The combined organic layers were dried over MgSO4 and the solvent was removed
under reduced pressure. The crude product was purified by column chromatography (CyHex:EE 95:5).
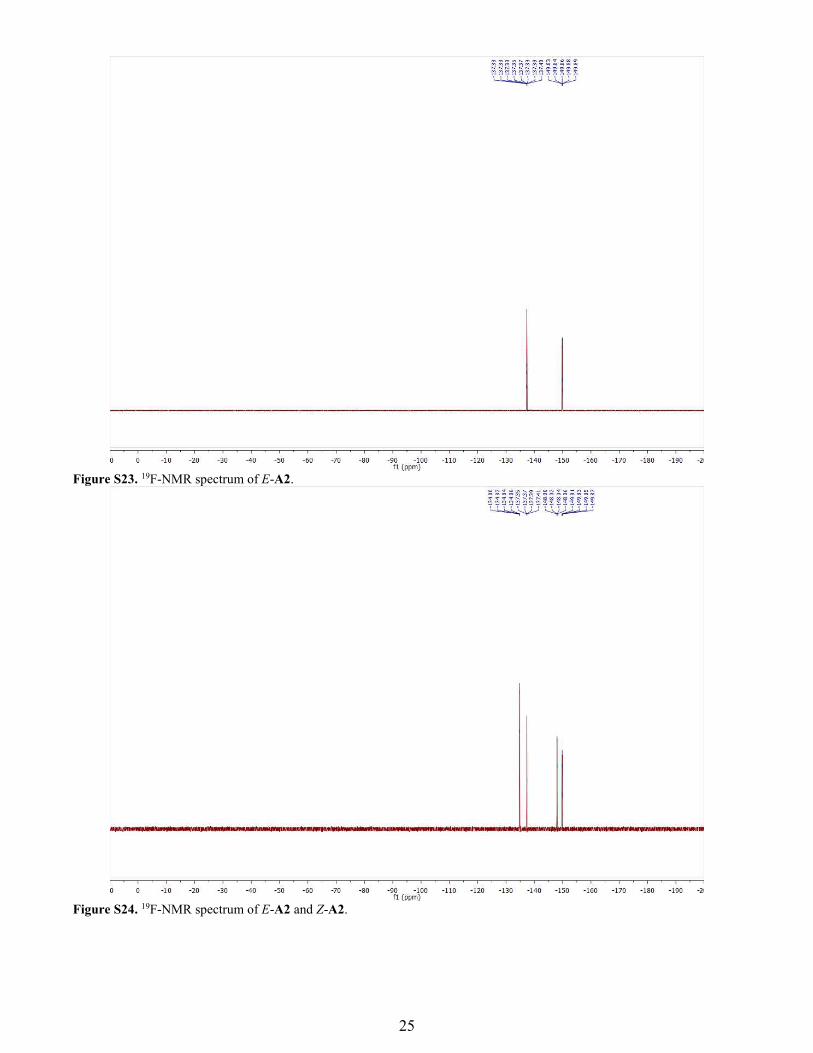
The compound (0.025 mg, 0.040 mmol, 33 %) was isolated as red crystals. 19F-NMR (376 MHz, C6D6): δ = E-A2: -137.17 – -137.50 (m), -149.64 – -150.08, Z-A2: -134.74 – -
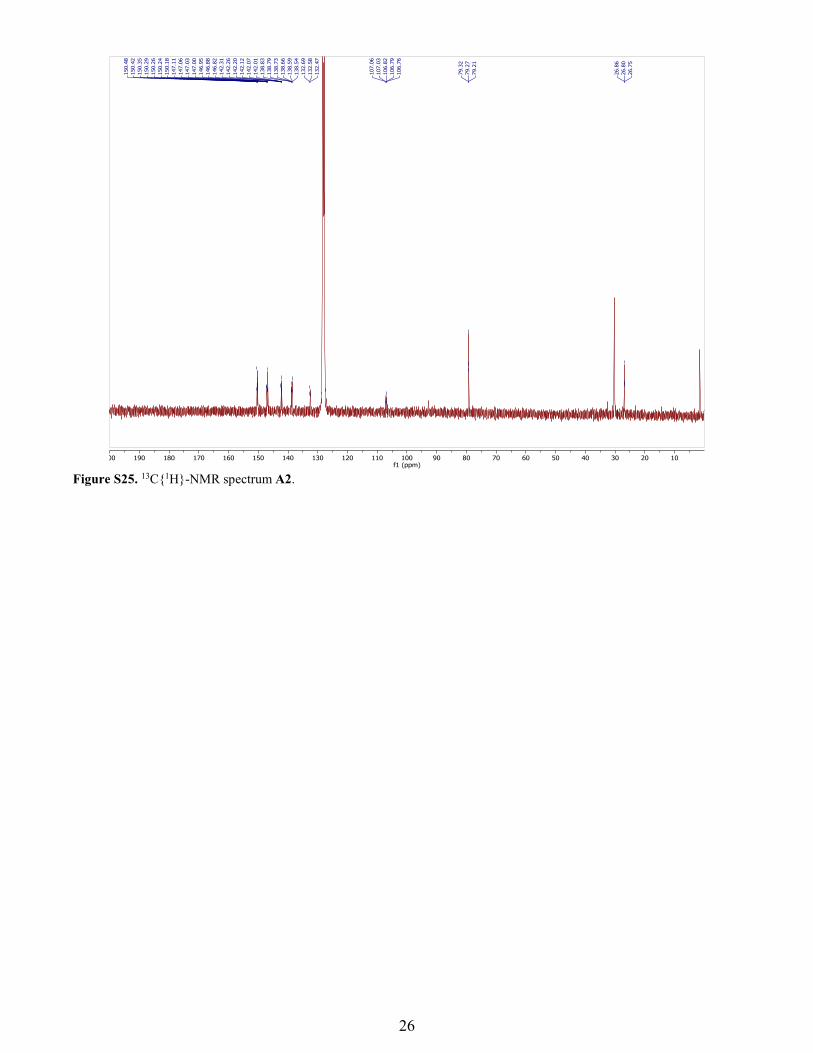
134.90 (m), -147.96 – -148.10 (m); 13C{1H}-NMR (151 MHz, CDCl3): δ = 148.5 (d of m, J = 241 Hz,
C4), 140.4 (ddt, J = 262, 14, 4 Hz, C5), 132.6 (m, C3 or C6), 106.9 (m, C3 or C6), 79.2 (t, J = 4 Hz, C2),
26.8 (t, J = 4 Hz, C1) IR (ATR): 𝜈𝜈�𝑚𝑚𝑚𝑚𝑚𝑚 = 2959 (w), 2923 (m), 2852 (w), 2179 (w), 1718 (br), 1481 (s),
1397 (w), 1260 (m), 1083 (m), 989 (s), 797 (m); HRMS (ESI) m/z calculated for C16HF8I2N2 [M+H]+
626.8096; found m/z 626.8102.

7
III. Association experiments The constant component is referred to as “host” while the varied compound is called “guest”. Due to the
lower solubility the XB acceptor was chosen as the host. NMR-spectra were recorded on a 600 MHz
Bruker Avance III at 283 K. Chemical shifts are reported relative to the residual protonated solvent signal.
Job’s Plot
The method of continuous variation was applied to determine the stoichiometry of the formed boxes.
Stock solutions of A2 (c = 4.655 mmol/L) and U3 in benzene-d6 were used to prepare samples containing
the host in different mole fractions. The observed difference in chemical shift multiplied with the mole
fraction of the host against the mole fraction of the host results in a parable with the maxima at 0.5 for a
1:1 or 2:2 complex.
Figure S1. Job’s Plot of the complexation of U3 and A2.
NMR Binding Experiments
Solutions of the host U3 (c = 2.00 mmol/L) and both azobenzenes in C6D6 (c(A1) = 11.4 mmol/L and
c(A2) = 13.9 mmol/L) were prepared, using only gravimetric analyses, and used as parent solutions to
prepare samples containing 1:1 mixtures of host and guest. The measured spectra (Figure S.2) were used
to estimate which of the synthesized azo compounds shows higher association tendencies.
0,0 0,2 0,4 0,6 0,8 1,00,000
0,001
0,002
0,003
0,004
0,005
[H] 0
Δδ
x(H0)

8
Figure S2. 1H-NMR spectra of U3 (blue), 1:1 mixtures of U3⋯A1 (green) and U3⋯A2 (red) at 283 K.
Solutions of the host U3 (c = 2.17 mmol/L) and guest A2 (c = 39.05 mmol/L) in C6D6 were prepared
using only gravimetric analyses. The guest solution was successively added to the host solution. Using
OriginPro 2018b the graphs of the change of the chemical shift ∆𝛿𝛿 against the guest concentration [𝐺𝐺]0
were curve fitted using the orthogonal distance regression iteration algorithm. The following equation
was used for curve fitting[12]:
∆𝛿𝛿 =∆𝛿𝛿𝑠𝑠𝑚𝑚𝑠𝑠
2��
[𝐺𝐺]0
[𝐻𝐻]0+ 1 +
1𝐾𝐾𝑚𝑚[𝐻𝐻]0
� − ��[𝐺𝐺]0
[𝐻𝐻]0+ 1 +
1𝑘𝑘𝑚𝑚[𝐻𝐻]0
�2
− 4[𝐺𝐺]0
[𝐻𝐻]0 �
The total concentration of the host [H]0 is constant while the total concentration of the guest [G]0 is varied.
The association constant Ka and the change in chemical shift for a saturated system are obtained by curve
fitting.

9
Figure S3. 1H-NMR binding titration progress in C6D6 at 283 K. Displayed are the chemical shifts of the protons a (left), c
(middle) and b (right). The shifts of a were used for the determination of Ka.
N
NN
NN
NF
F F
FF F
FFI
I
NNF
F F
FF F
FFI
I
a b
c
10
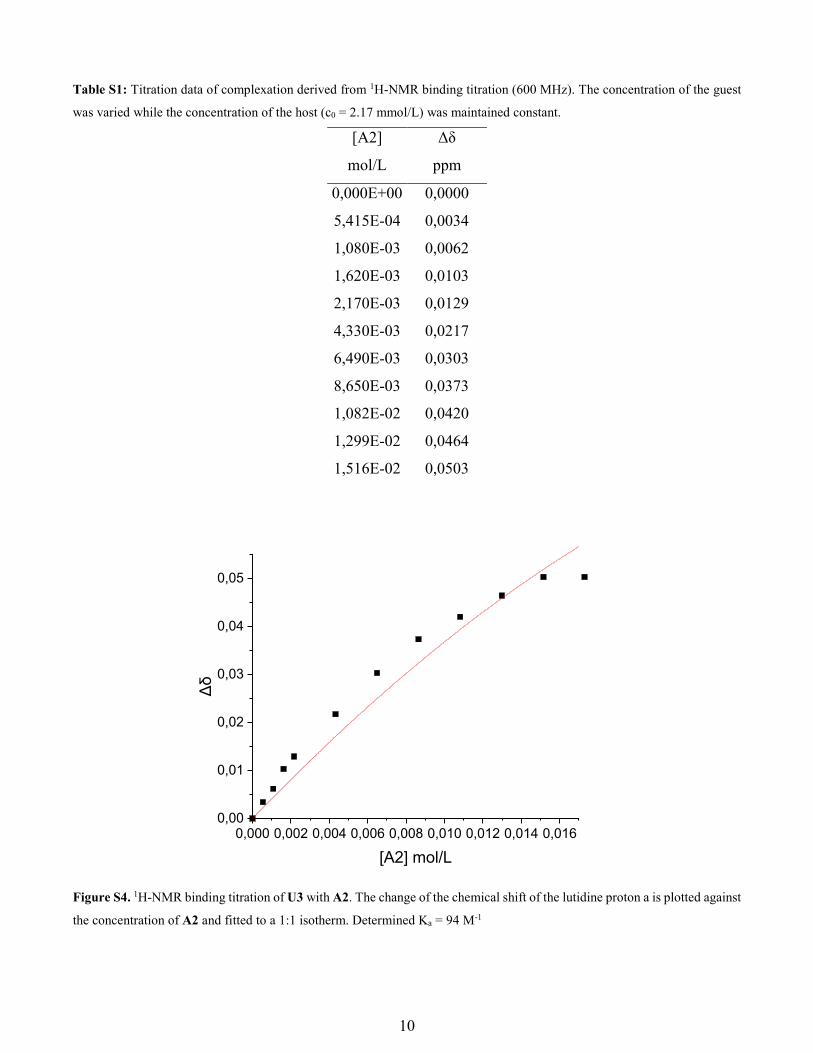
Table S1: Titration data of complexation derived from 1H-NMR binding titration (600 MHz). The concentration of the guest
was varied while the concentration of the host (c0 = 2.17 mmol/L) was maintained constant.
[A2] Δδ
mol/L ppm
0,000E+00 0,0000
5,415E-04 0,0034
1,080E-03 0,0062
1,620E-03 0,0103
2,170E-03 0,0129
4,330E-03 0,0217
6,490E-03 0,0303
8,650E-03 0,0373
1,082E-02 0,0420
1,299E-02 0,0464
1,516E-02 0,0503
Figure S4. 1H-NMR binding titration of U3 with A2. The change of the chemical shift of the lutidine proton a is plotted against
the concentration of A2 and fitted to a 1:1 isotherm. Determined Ka = 94 M-1
0,000 0,002 0,004 0,006 0,008 0,010 0,012 0,014 0,0160,00
0,01
0,02
0,03
0,04
0,05
Δδ
[A2] mol/L
11
Common errors taken into account for the titration results are attributed to inaccurate temperature
measurement inside of the NMR during the measurements, gravimetric errors while preparing the stock
solutions and NMR data processing (such as peak picking). Due to difficulties fitting the obtained data,
although an r2 value of 0.997 was obtained, we decided to report binding as very low or unspecific, as
indicated by Ka < 102 M-1 in the main manuscript.

12
IV. Crystallographic details
Single-crystals were mounted using a microfabricated polymer film crystal-mounting tool (dual-thickness
MicroMount, MiTeGen) using low viscosity oil (perfluoropolyalkylether; viscosity 1800 cSt, ABCR) to
reduce the X-ray absorption and scattering. A Bruker D8 Venture single-crystal X-ray diffractometer with
area detector using Mo-Kα (λ = 0.71073 Å) or Cu-Kα (λ = 1.54178 Å) radiation was used for data collection
at the temperature stated for each compound. Multiscan absorption corrections implemented in
SADABS[13] were applied to the data. The structures were solved by intrinsic phasing (SHELXT-2013)[14]
and refined by full-matrix least-squares methods on F2 (SHELXL-2014).[15] The hydrogen atoms were
placed at calculated positions and refined by using a riding model. CCDC 1909803 (U1⋯A1), 1909801
(U1⋯A2), 1909802 (U2⋯A1) and 1909804 (A3) contain the supplementary crystallographic data for this
paper. These data can be obtained free of charge from The Cambridge Crystallographic Data Centre.
Figure S5. Single-crystal X-ray data of U1⋯A1 showing the asymmetric unit with thermal ellipsoids set at 50% probability.
The structure was measured at 100 K and solved in the monoclinic space group P21/n with RInt = 0.0482, R1 = 0.0196 and wR2
= 0.0462. Selected bond lengths [Å]: I1–N4 2.784(2), I2–N3 2.756(1), N1–N2 1.234(2). The structure shows C-H⋯F contacts such as F1⋯H36 2.65, F6⋯H18C 2.75, F7⋯H13 2.55 and F7⋯H39B 2.66.

13
Figure S6. Single-crystal X-ray data of U1⋯A1, a) with thermal ellipsoids set at 50% probability and b) showing a space-
filling model.
Figure S7. View of the unit cell of U1⋯A1 along the crystallographic b axis. The anthracene units of engage in an infinite
herringbone type arrangement, supported by CH⋯π interactions in the range from 3.14–3.56 Å.
14
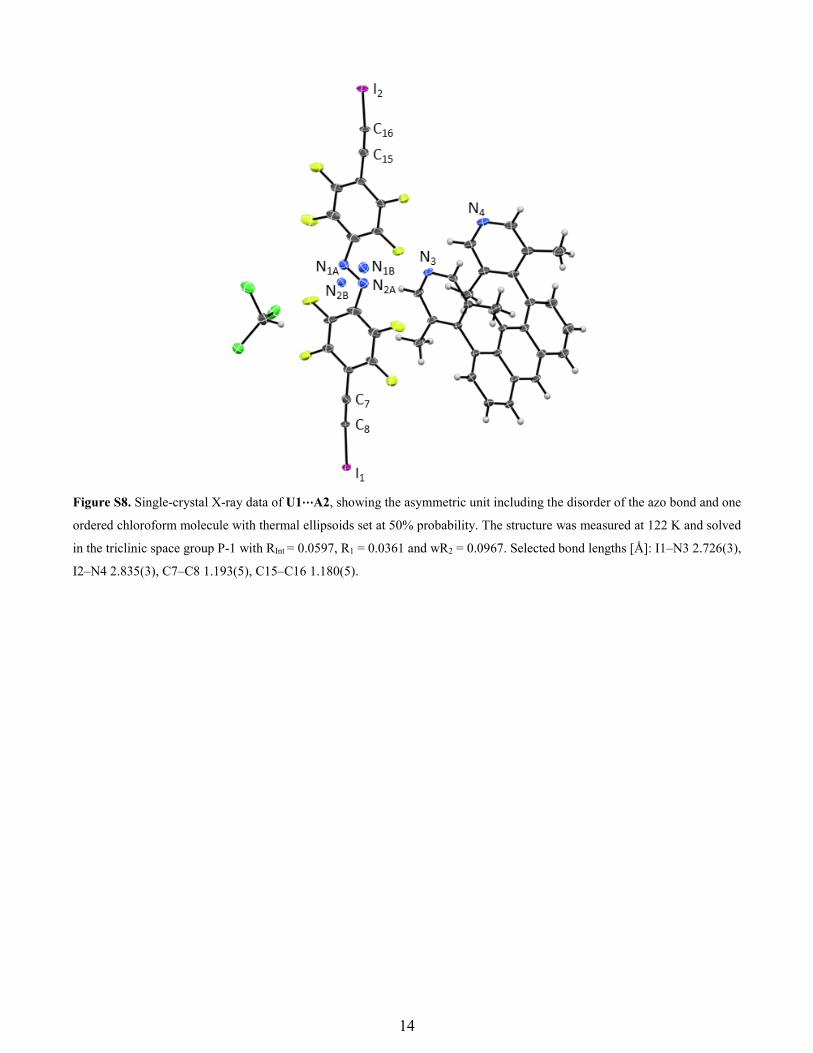
Figure S8. Single-crystal X-ray data of U1⋯A2, showing the asymmetric unit including the disorder of the azo bond and one
ordered chloroform molecule with thermal ellipsoids set at 50% probability. The structure was measured at 122 K and solved
in the triclinic space group P-1 with RInt = 0.0597, R1 = 0.0361 and wR2 = 0.0967. Selected bond lengths [Å]: I1–N3 2.726(3),
I2–N4 2.835(3), C7–C8 1.193(5), C15–C16 1.180(5).
15
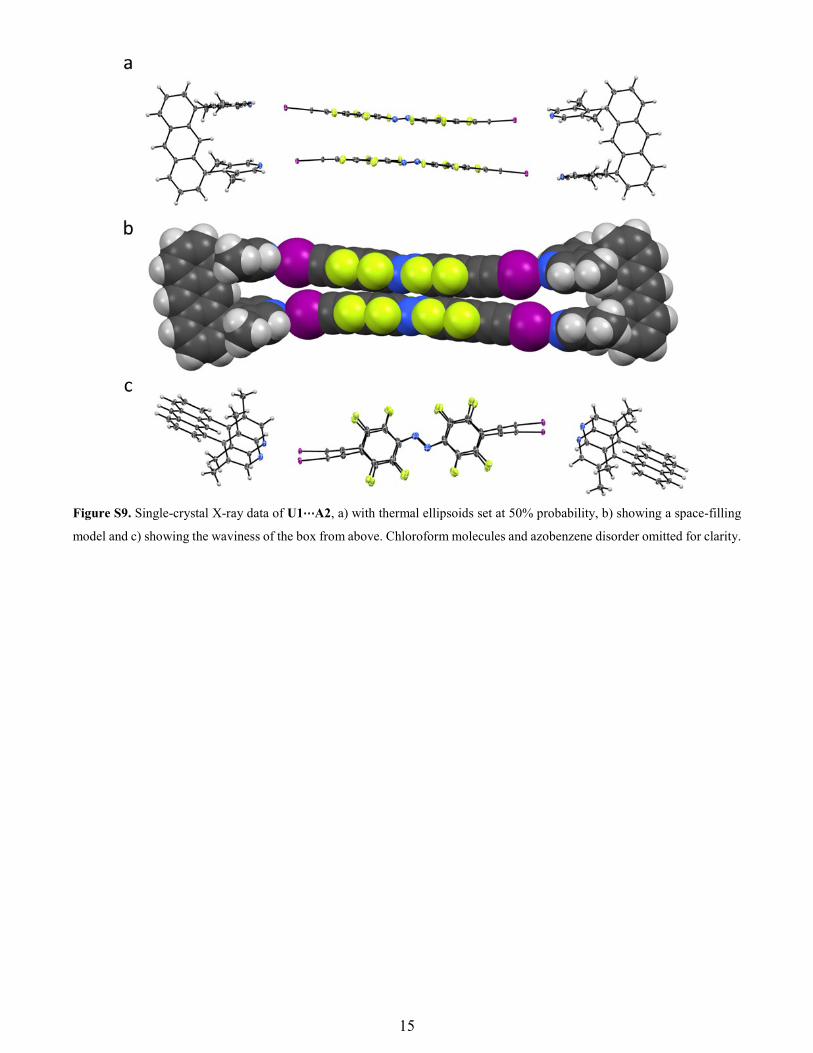
Figure S9. Single-crystal X-ray data of U1⋯A2, a) with thermal ellipsoids set at 50% probability, b) showing a space-filling
model and c) showing the waviness of the box from above. Chloroform molecules and azobenzene disorder omitted for clarity.

16
Figure S10. View of the unit cell of U1⋯A2 along the crystallographic b axis. The anthracene units interact loosely by forming
head-to-tail dimers with centroid-to-centroid distances of 4.24–4.34 Å.

17
Figure S11. Single-crystal X-ray data of U2⋯A1, a) with thermal ellipsoids set at 50% probability and b) showing a space-
filling model. The structure was measured at 100 K and solved in the triclinic space group P-1 with RInt = 0.0361, R1 = 0.0353
and wR2 = 0.0770. Selected bond lengths [Å]: I1–N4 2.764(3), I2A–N3 2.777(5), N1–N2 1.256(5).
Figure S12. Single-crystal X-ray data of U2⋯A1, a) with thermal ellipsoids set at 50% probability and b) showing a space-
filling model.
18
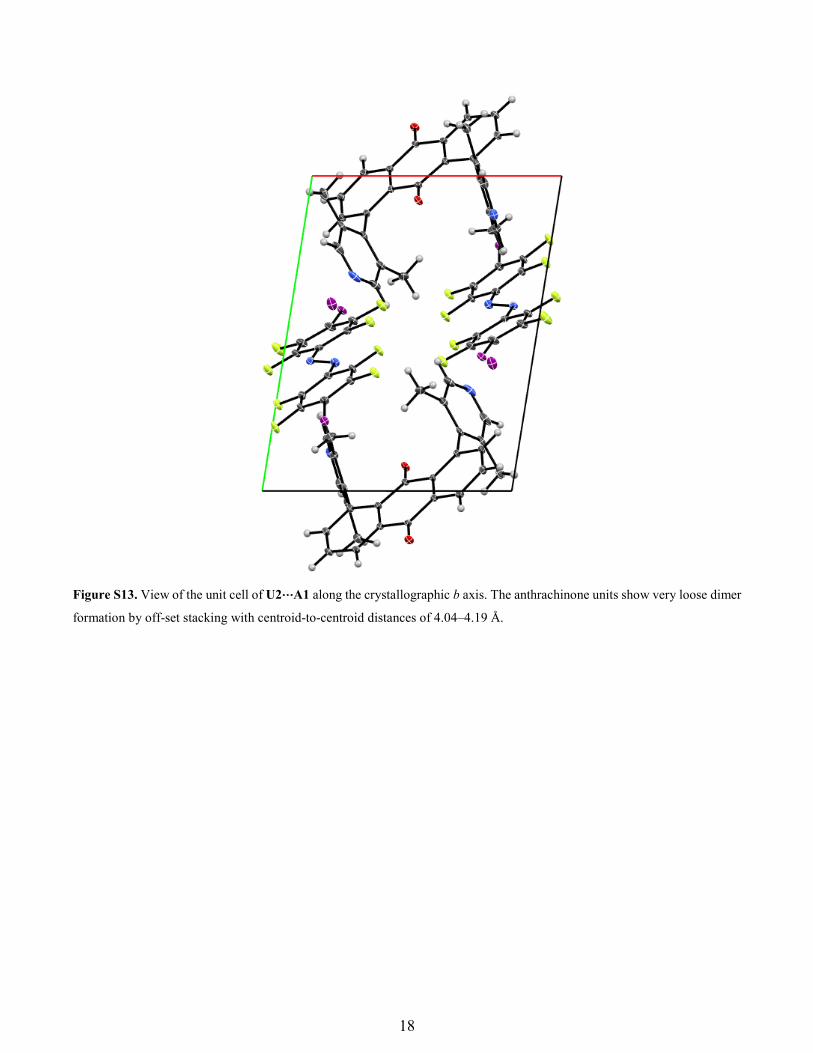
Figure S13. View of the unit cell of U2⋯A1 along the crystallographic b axis. The anthrachinone units show very loose dimer
formation by off-set stacking with centroid-to-centroid distances of 4.04–4.19 Å.
19
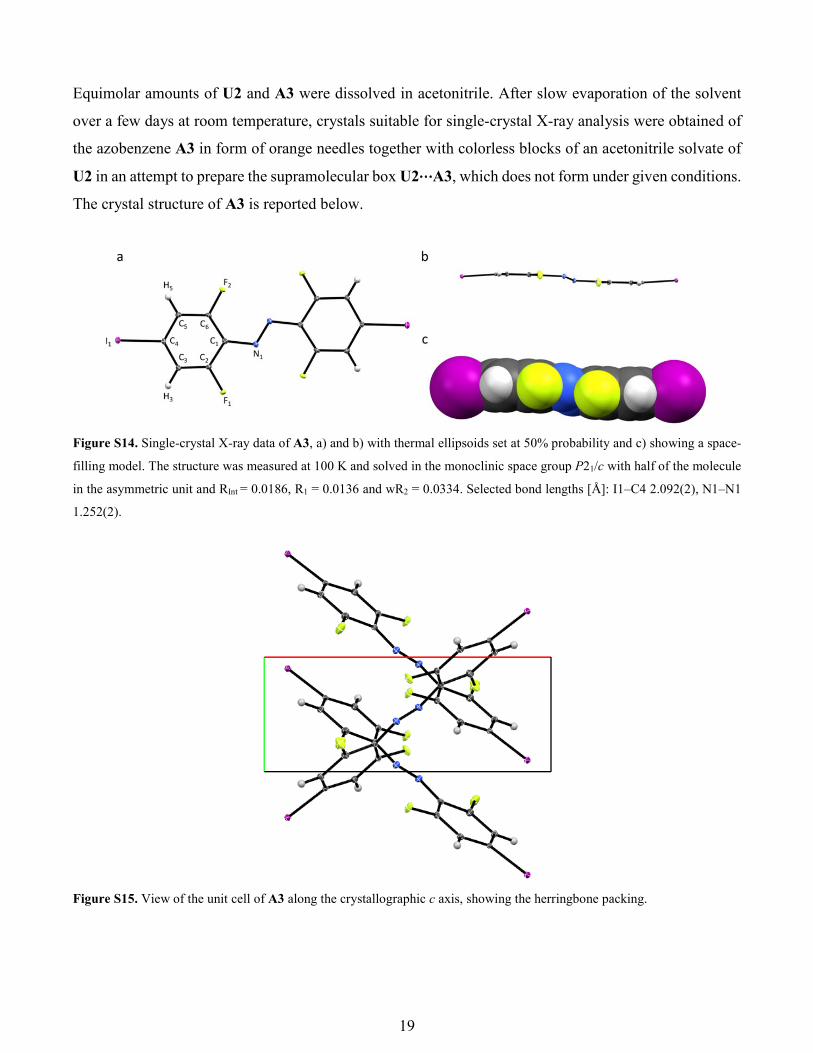
Equimolar amounts of U2 and A3 were dissolved in acetonitrile. After slow evaporation of the solvent
over a few days at room temperature, crystals suitable for single-crystal X-ray analysis were obtained of
the azobenzene A3 in form of orange needles together with colorless blocks of an acetonitrile solvate of
U2 in an attempt to prepare the supramolecular box U2⋯A3, which does not form under given conditions.
The crystal structure of A3 is reported below.
Figure S14. Single-crystal X-ray data of A3, a) and b) with thermal ellipsoids set at 50% probability and c) showing a space-
filling model. The structure was measured at 100 K and solved in the monoclinic space group P21/c with half of the molecule
in the asymmetric unit and RInt = 0.0186, R1 = 0.0136 and wR2 = 0.0334. Selected bond lengths [Å]: I1–C4 2.092(2), N1–N1
1.252(2).
Figure S15. View of the unit cell of A3 along the crystallographic c axis, showing the herringbone packing.

20
V. UV/Vis spectroscopy
Figure S16. UV/Vis spectra of A2 in acetonitrile (c = 7.67 μmol/L) after irradiation with 𝜆𝜆𝑖𝑖𝑖𝑖𝑖𝑖 = 565 nm, as indicated by the
green band. Irradiation times were determined using a stopwatch.
21
VI. References
[1] M. Pérez-Trujillo, I. Maestre, C. Jaime, A. Alvarez-Larena, J. Francesc Piniella and A. Virgili,
Tetrahedron Asymmetry, 2005, 16, 3084.
[2] M. Yamashita, Y. Yamamoto, K. Akiba, D. Hashizume, F. Iwasaki, N. Takagi and S. Nagase, J. Am.
Chem. Soc., 2005, 127, 4371.
[3] M. Inoue, T. Iwanaga and S. Toyota, Chem. Lett., 2013, 42, 1499.
[4] Y. Yang, J. Cui, Z. Li, K. Zhong, L. Y. Jin and M. Lee, Macromolecules, 2016, 49, 5912.
[5] M. Goichi, K. Segawa, S. Suzuki and S. Toyota, Synthesis, 2005, 13, 2116.
[6] S. Duric and C. C. Tzschucke, Org. Lett., 2011, 13, 2310.
[7] P. Klán, Monatsh. Chem., 1993, 124, 327.
[8] V. Diemer, H. Chaumeil, A. Defoin, A. Fort, A. Boeglin and C. Carré, Eur. J. Org. Chem., 2008, 10,
1767.
[9] E. Ay, H. Chaumeil and A. Barsella, Tetrahedron, 2012, 68, 628.
[10] O. S. Bushuyev, A. Tomberg, T. Friščić and C. Barrett, J. Am. Chem. Soc., 2013, 135, 12556.
[11] D. Bléger, J. Schwarz, A. M. Brouwer and S. Hecht, J. Am. Chem. Soc., 2012, 134, 20597.
[12] K. Hirose, Quantitative Analysis of Binding Properties in Analytical Methods in Supramolecular
Chemistry (Ed.: C. A. Schalley), Wiley-VCH, Weinheim, 2012, 27-66.
[13] G. M. Sheldrick, SADABS, program for empirical absorption correction of area detector data,
University of Göttingen, Göttingen, 1996.
[14] G. M. Sheldrick, SHELXT-2013, Program for Crystal Structure Solution, University of Göttingen,
Göttingen, 2013.
[15] G. M. Sheldrick, SHELXL-2014, Program for Crystal Structure Refinement, University of
Göttingen, Göttingen, 2014.

22
VII. 1H, 19F and 13C NMR Spectra
Figure S17. 1H-NMR spectrum of U1.
Figure S18. 13C{1H}-NMR spectrum of U1.
23
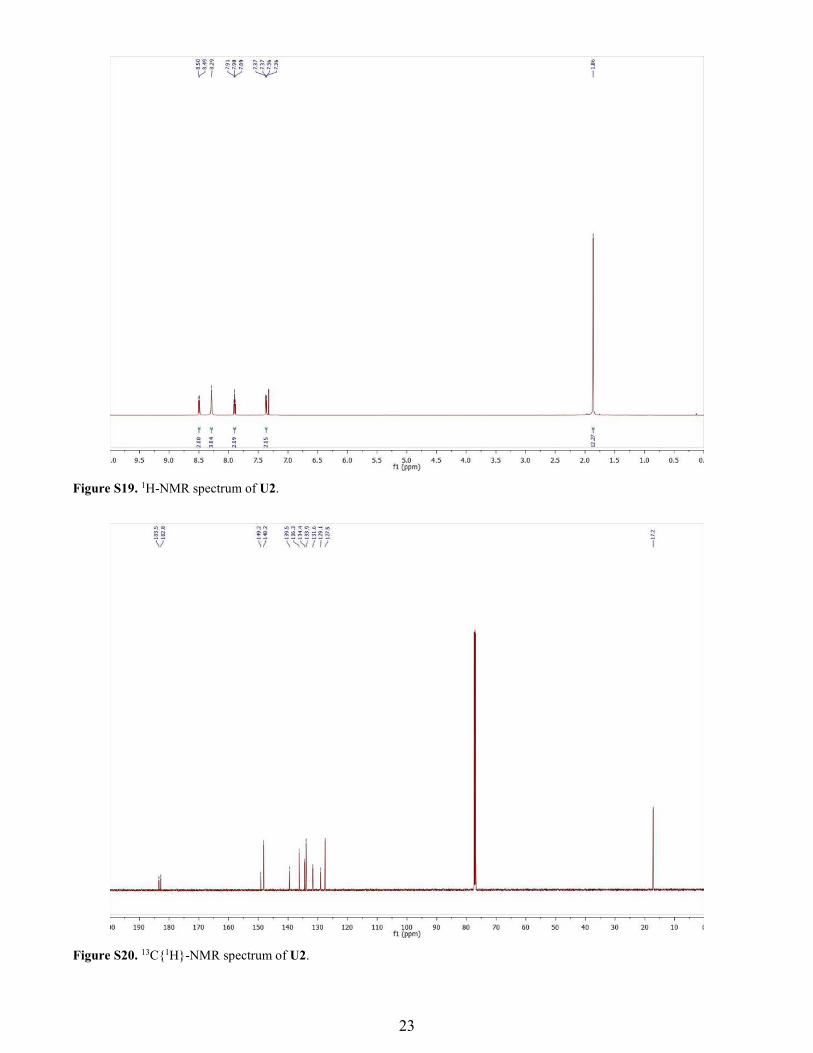
Figure S19. 1H-NMR spectrum of U2.
Figure S20. 13C{1H}-NMR spectrum of U2.
24
Figure S21. 1H-NMR spectrum of U3.
Figure S22. 13C{1H}-NMR spectrum of U3.
25
Figure S23. 19F-NMR spectrum of E-A2.
Figure S24. 19F-NMR spectrum of E-A2 and Z-A2.
26
Figure S25. 13C{1H}-NMR spectrum A2.
10203040506070809010011012013014015016017018019000f1 (ppm)
26.7
526
.80
26.8
6
79.2
179
.27
79.3
2
106.
7610
6.79
106.
8210
7.03
107.
06
132.
4713
2.58
132.
6913
8.54
138.
5913
8.66
138.
7313
8.79
138.
8314
2.01
142.
0714
2.12
142.
2014
2.26
142.
3114
6.82
146.
8814
6.95
147.
0014
7.03
147.
0614
7.11
150.
1815
0.24
150.
2615
0.29
150.
3515
0.42
150.
48