table of contents - rudy's homepagezhuam.com/pages/files/memo.doc · web viewalthough shear...
TRANSCRIPT
Process Proposal for MAb Production in
Dunaliela tertiolecta
Report Submitted: 6/6/2006
For: Dr. Haluk Hamamci

MAb Background and Process Proposal
Therapeutic Protein History
The introduction of monoclonal antibodies has enriched the tapestry of the biological and biomedical field given that it has extended our understanding of immunology and provided new strategies for the combating and treatment of immune deficient diseases. Produced through the use of hybridoma cells for therapeutic purposes, recombinant protein antibodies like Avastin, which is currently being marketed as a treatment for colon and rectal cancer, have pioneered a multi-billion dollar biotechnology industry.
Vascular Endothelial Growth Factor, VEGF, a growth signal sent out by the tumor, enables tumors to receive nutrients. Avastin functions by attaching directly to VEGF therefore preventing the tumor blood vessels from growing and spreading. Targeting the tumor’s blood vessels reduces the size of the tumor because in order for tumors to grow they need a constant supply of oxygen and other nutrients. Thus by cutting off the tumor’s supply line, they can no longer grow and spread.
Market Considerations________________________________
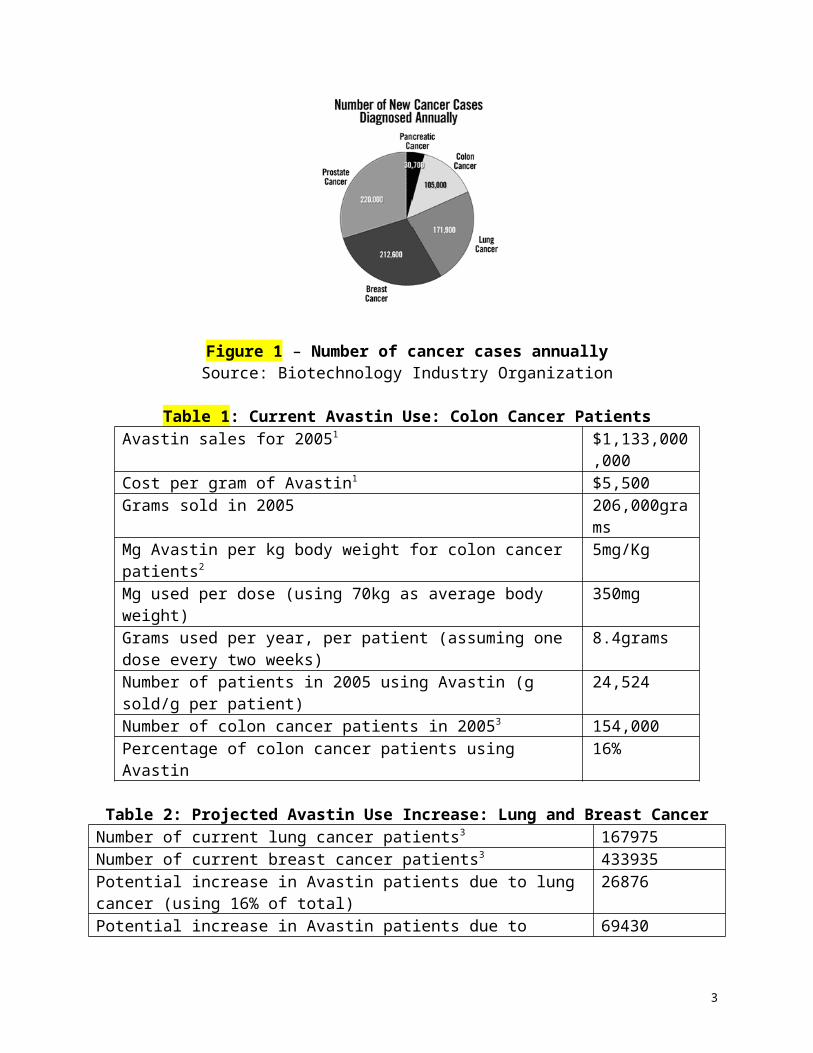
Antibody drugs are expected to exceed $68 billion in worldwide sales by the year 2010 (Liszewski). The recent prospects of expanding Avastin to treat both lung and breast cancer patients may play a large part in the therapeutic protein market. Considering that the yearly number of diagnosed colon cancer patients is about one third of both breast and lung cancer combined (see Figure 4), and that the dosage for the potential patients is twice that of patients currently using Avastin, it is no wonder that the demand for this product is expected to clearly surpass the supply (see Tables 1-3). If we do some rough calculations with current Genentech capacity in mind, we can approximately quantify the increased demand of this particular product. As illustrated in Table 2, 1.6 million grams of additional Avastin is needed yearly to meet
1
demands for all three cancers. Considering that Genentech plans on utilizing a 90,000 liter facility to meet this demand and current mammalian cell lines produce roughly only 0.3grams of MAb per liter of production (Hu, Wei-Shou), Table 3 illustrates that the exceeded yearly demand for this protein alone could be approximately 19,000 grams.
Figure 1 – Number of cancer cases annuallySource: Biotechnology Industry Organization
Table 1: Current Avastin Use: Colon Cancer PatientsAvastin sales for 20051 $1,133,000,000Cost per gram of Avastin1 $5,500Grams sold in 2005 206,000gramsMg Avastin per kg body weight for colon cancer patients2 5mg/KgMg used per dose (using 70kg as average body weight) 350mgGrams used per year, per patient (assuming one dose every two weeks) 8.4gramsNumber of patients in 2005 using Avastin (g sold/g per patient) 24,524Number of colon cancer patients in 20053 154,000Percentage of colon cancer patients using Avastin 16%
Table 2: Projected Avastin Use Increase: Lung and Breast CancerNumber of current lung cancer patients3 167975Number of current breast cancer patients3 433935Potential increase in Avastin patients due to lung cancer (using 16% of total) 26876Potential increase in Avastin patients due to breast cancer (using 16% of total)
69430
Mg Avastin per Kg body weight for both lung and breast cancer2 10mg/KgMg used per dose (using 70kg as average body weight) 700mgGrams used per year, per patient (assuming one dose every two weeks) 16.8gramsYearly increase of Avastin sold due to lung and breast cancer 1.6 million
grams
2
Yearly Avastin sales increase due to lung and breast cancer $8.9 billion
Table 3: Increased Production DemandGenentech’s expected capacity to meet this demand2 90,000LitersYield MAb per liter using current mammalian cell line 0.3grams/LiterGram MAb per gram Avastin (approximate)4 .025g/gTotal gram of MAb produced per fermentation 27000 gramsTotal gram of Avastin produced per fermentation 1,080,000 gramsTotal gram of Avastin needed (current plus potential increase) 1,823,941gramsTotal grams of Avastin needed that will exceed Genentech capacity
743,941grams
Total grams of MAb needed that will exceed Genentech capacity
19,000 grams
Information sources for Tables 1-3:1-Genentech Financial Report 2005 2-Hu, Jim, Blogs for Industry3-American Cancer Society4-Food and Drug Administration
In addition to the demand increase due to the existing drugs on the market ( 22% MAb), the pipeline of 200+ pending therapeutic protein pharmaceuticals (57% MAb) also pushes for increased production levels (Steiner). Because of the expected rise in required production, most of the pharmaceutical and biotechnology companies already outsourcing some of their biopharmaceutical manufacturing are planning to increase their spending in the next two years. Median contract spending in 2004 was reported as roughly $3 to $4 million per contract organization per year and this number has been predicted to double by the end of this year (Fox). The size of the worldwide contract manufacturing market is expected to reach $2.5 billion this year (Fox). Considering the nearly two-fold increase from the $1.7 billion earned in 2004, contract manufacturing is looking at a very bright future.
Process Cost Considerations
As competition and production volumes increase in response to the accelerated demands, incentives for improving efficiencies are expected to take a big leap forward. In other words, low production costs will be crucial for the success of our company. Although lower production costs are desired, lower yields are not. When considering current expression systems utilized to
3

fabricate monoclonal antibodies, there are both advantages and disadvantages in terms of the bottom line.
There are currently two strategies for producing monoclonal antibodies like Avastin: CHO cells lines and plant cultures. There are many differences between plant, and CHO based expression systems. These differences become very important when considering how to make our organization as competitive as possible and are summarized below in Table 4.
Table 4: Comparison of CHO and Plant Cell Expression Systems
Expression System
CHO Plant Cells (Traditional and algae)
Shear Resistance Lowest MediumRespiration Rate Lowest MediumGrowth Rate Medium Slow (traditional plants such as tobacco)
Fast (algae)Doubling Time 1 day One week (traditional plant)
3.5 hours (algae)Excreted Protein Yes YesPost-translational Modifications
Yes. Post-translational modifications are almost identical to humans.
Yes, with some restrictions. Plant proteins may be immunogenic.
Problems faced in production
Oxygen transfer is often a problem because cells cannot withstand high agitation or aeration.
Getting enough light to cells is often a problem. Plant cultures can grow densely and become viscous.
Media Complex. Contains serum, which is expensive and easily contaminated.
Simple.
Safety Can transmit disease-causing agents such as viruses.
Cannot transmit animal diseases.
Other Suitable for large and complicated proteins.
Easy to scale up.
Currently monoclonal antibodies like Avastin (Bevacizumab) are being mass produced in a Chinese Hamster Ovary (CHO) mammalian cell expression system in a nutrient medium containing the antibiotic gentamicin. Through post-translational modifications and Bevacizumab’s covalent structure, the molecule was modified to posses similar characteristics of a human IgG1 (European Medicines Agency).1 The current expression vector used to express this antibody is the plasmid pSVID5.ID.LLnspeV.xvegf36HC.LC. The plasmid is encoded with Bevacizumab and then inserted into CHO DP-12 (European Medicines Agency)2. To begin the 1 Scientific Discussion. European Medicines Agency. 4 Apr. 2006. <www.emea.eu.int/humandocs/PDFs/ EPAR/avastin/17199204en6.pdf> pg 7.2 IBIDEM. pg 4.
4

inoculation train 20L of culture cells are inoculated, and the cells sub-cultivated every three to four days in a subsequent series of increasing volumes (80L 400L 2000 L). An aliquot of the cells are then placed in a 12000L CHO cell fed-batch suspension culture for harvesting (European Medicines Agency).3 Post fermentation, the cells are run through a recovery train which isolates and purifies the therapeutic protein. Due to the animal protein requirements of this cell line, viral contamination is an issue and involves rather expensive filtering and deactivation procedures. Overall, the current technology is expensive and time consuming.
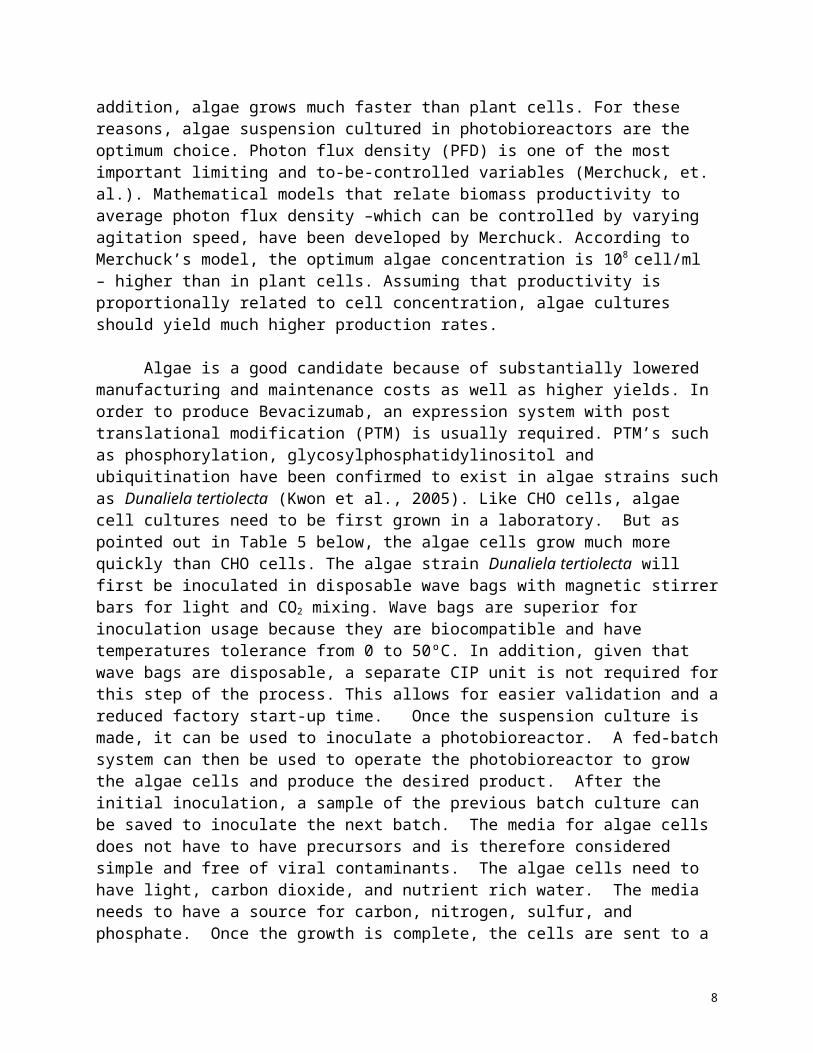
Alternatively, two approaches exist to produce these proteins from plants: plant cell and algae suspension culture. Due to damage by twisting motion (in turbulent mix regime) to plant cells, gas-to-liquid mass transfer is limited. Because of plant’s low cell growth rate, aseptic conditions in plant suspension cultures have to be maintained for two to four weeks. Although shear stress affects the growth of algaein a concentric tube airlift photobioreactor (Contreras, et. al.), the effects are less drastic than in plant cell cultures (Wu, et. al). In addition, algae grows much faster than plant cells. For these reasons, algae suspension cultured in photobioreactors are the optimum choice. Photon flux density (PFD) is one of the most important limiting and to-be-controlled variables (Merchuck, et. al.). Mathematical models that relate biomass productivity to average photon flux density –which can be controlled by varying agitation speed, have been developed by Merchuck. According to Merchuck’s model, the optimum algae concentration is 108 cell/ml – higher than in plant cells. Assuming that productivity is proportionally related to cell concentration, algae cultures should yield much higher production rates.
Algae is a good candidate because of substantially lowered manufacturing and maintenance costs as well as higher yields. In order to produce Bevacizumab, an expression system with post translational modification (PTM) is usually required. PTM’s such as phosphorylation, glycosylphosphatidylinositol and ubiquitination have been confirmed to exist in algae strains such as Dunaliela tertiolecta (Kwon et al., 2005). Like CHO cells, algae cell cultures need to be first grown in a laboratory. But as pointed out in Table 5 below, the algae cells grow much more quickly than CHO cells. The algae strain Dunaliela tertiolecta will first be inoculated in disposable wave bags with magnetic stirrer bars for light and CO2 mixing. Wave bags are superior for inoculation usage because they are biocompatible and have temperatures tolerance from 0 to 50ºC. In addition, given that wave bags are disposable, a separate CIP unit is not required for this step of the process. This allows for easier validation and a reduced factory start-up time. Once the suspension culture is made, it can be used to inoculate a photobioreactor. A fed-batch system can then be used to operate the photobioreactor to grow the algae cells and produce the desired product. After the initial inoculation, a sample of the previous batch culture can be saved to inoculate the next batch. The media for algae cells does not have to have precursors and is therefore considered simple and free of viral contaminants. The algae cells need to have light, carbon dioxide, and nutrient rich water. The media needs to have a source for carbon, nitrogen, sulfur, and phosphate. Once the growth is complete, the cells are sent to a recovery train which involves centrifugation for both cell isolation and cell debris removal, cell lysing to extract the desired product, and further purification steps involving Protein A columns, Gel Chromatography, and Anion Exchange Chromatography. The general schematic of the proposed process is represented below in Fig. 2.
3 IBID. pg 5.
5

Figure 2: Process flowsheet of MAb Production via Dunaliela tertiolecta algal cells
Cell Concentration Build-up
Inoculation TrainUpstream Processing
Cell Growth Growth Photobioreactor
CentrifugationCell Isolation, Broth
Removal
Cell Lysis
Centrifugation Cell Debris Removal
Downstream Processing Protein A Column Protein Isolation
Gel Column Chromatography
Improper Protein Removal
Cation Exchange Column
Protein Purification
Anion Exchange Column
Protein Purification
Final Protein Product
6

The following is an estimated timeline for the completion of the project.
TimelineProgram Phase; 1 Month1. Facility Program
a. Furnishes all data for plant and decide plant capacityb. List Operational Description- list of all products to be produced, a general description
of a the production process, expectation of process control, and a statement on the future plans of the plant
c. List of Organization Chart- anticipated facility staff and their main dutiesd. Master List of Required Spaces and why they are needede. Functional Resolution Analysis- include warehousing needed and ingredient
preparationsf. Comparative Analysis of Spatial Sizes- compares and contrast areas and volumes
using modular incrementsg. Estimation of the volume prediction and area needed
2. Site Analysis a. Decide on location to ensure that it can accommodate the large facility.b. Location and property surveyc. Conduct a topographic map of the site and explore the subsurface of the desire area
3. Design Criteriaa. Rough design estimate should be done for each piece of material
4. Utility a. List all utilities needed and their approximate cost; include also cost of peak demands
for each utility itemb. Report all capacity of all utilities used, ie 50 psig of steam available for heat
exchanger5. Target data for plant completion and execution6. Prepare a rough project budgetConceptual Design Phase; 1.5 Months1. Process Flow Diagrams2. Process is scaled up and defined and utilities systems are outline3. List of equipment and their specifications4. Facility Layout is developed5. Decide if project is economically feasible by performing detail economic analysis6. Develop alternative schemes and estimates7. Generate a general project scheduleDesign Development Phase; 1.5 Months1. P&ID, instrumentations and flow diagrams2. Prepare list of all equipment needed
7
3. Prepare equipment specifications4. Prepare lists of where equipments can be purchase5. Prepare Piping diagrams6. Estimate a general cost by taking vendors quotations7. Also note equipment that needs to be shipped or transported to plant and their costs8. Identify emergency power requirement9. Control system Configuration10. Heating, ventilation, and air conditioning systems are defined if needed11. Define electrical systems12. Design layout of plant structure13. Notify FDA concerning plans for project completion and start-up. Detail Design Phase; 3-4 Months1. Prepare detail structural drawing of building2. Show how construction is performed3. Prepare detail mechanical drawing of building and operating equipment4. Prepare detail electrical drawings of all operating equipment5. Purchase equipment
a. Have manufacturer of all equipment bought pre-tested before shipping6. Deliverable equipment
a. Backup/Extra Equipment Partsb. Documentation (include number of copies)-including operating manuals, test
results, guarantees, help manualsc. Drawings-including final P&IDs and wiring diagrams of all equipment purchasedd. Backup copies of software and important manualse. List of company contacts and technical support policy/numbers
7. Construction Bid Documents8. Construct design of upstream and downstream unitsConstruction Phase; 4 -5 Months1. Site Preparations2. Build plant3. Include all needed wiring and mechanical parts4. Install all the needed equipment and check to make sure everything is running properlyValidation Phase; 6 Months1. Document Preparation- prepare checklist and procedures to be used during filed validation2. Installation Qualification3. Operational Qualification
Start-Up
8

Upstream Processing
Culture Requirements
Light Energy
The light will be provided using monochromatic lights at various sizes specified in the following specification tables. Light transfer is an issue, and becomes increasingly so as density increases, therefore, the size of the light source increases rather exponentially as the size of the reactor increases. Chlorophyl absorbs at 650-700 nm; this is equivalent to 4.6x10¹⁴-4.3 x10¹⁴Hz. At this energy, Planck’s law indicates 3.3-3.5x10¹⁸ photons Joule-1. A proton flux density of 58μmol m-2s-1 has given a maximum biomass yield of 1.2 g mol (Janssen et al., 2000). Assuming the PFD optimum value to be 58μmol m-2s-1, and taking 3.4 x10¹⁸ photons Joule-1 (monochromatic light), the required power per area will be 10.3 Wm-2. Yet a more conservative PFD estimate of 200-300 μmol m-2s-1(Quigg & García-González) is considered, which would correspond to 34.46-51.7 W m-2. The light concentrations can be measured using a photosynthetic photon flux density device (PPFD) using a quantum sensor connected to a quantum photometer.
Nutrients
To determine the type of media that will be used and the amount of nutrients required, elements present in the algae strain used for our production line were determined and are shown below in Table 5. In addition, 3.5% protein/dry weight (w/w) ( Dr. Baez ) is assumed for protein yield per biomass. This results in a production of 17,150 kg of dry weight per year of
9

biomass. A summary of the amount of substrate required for the production of such amount of biomass is shown in Table 6.
Table 5: Elements Found in Dunaliela tertiolectaElement MW
[g/mol]Proportion by moles [moles]
Total weight
Proportion by weight [%]
Normalized to 4 g/day
C 12 222 2664 64.21 2.57N 14 38 532 12.82 0.51P 30.97 1 31 0.75 0.03S 32 0.28 9 0.22 0.01K 39 0.36 14 0.34 0.01Mg 24.3 0.37 9 0.22 0.01Ca 40 0.019 1 0.02 0.00Sr 87.62 0.0081 1 0.02 0.00Fe 55.84 11.3 631 15.21 0.61Mn 54.9 1.9 104 2.51 0.10Zn 65.4 1.49 97 2.35 0.09Cu 63.5 0.67 43 1.03 0.04Co 58.9 0.01 1 0.01 0.00Cd 112.4 0.1 11 0.27 0.01Mo 95.94 0.011 1 0.03 0.00
Total 4148.60806 100 4Source: Phytoplankton Dynamics Laboratory. University of Texas A&M at Galveston.
Table 6: Substrates Required for 1715kg of Dry BiomassCompound Substrate Proportion
by weight [%]
Kg element needed [Kg/year]
MW Percent element in substrate
Substrate required [Kg/year]
C CO2 64.21 1101.20 44 0.27 4037.7
N KNO3 12.82 219.86 101.1 0.14 1587.7
P K2HPO4 0.75 12.86 136.1 0.23 56.5
S CuSO4·5H2O 0.22 3.77 249.7 0.13 29.3
Ca CaCl2·2H2O 0.02 0.34 147 0.27 1.3
Fe FeCl3, Na2EDTA 15.21 260.85 162.2 0.34 758.2
Mn MnCl2·4H2O 2.51 43.05 147.9 0.37 116.0
Co CoCl2·6H2O 0.01 0.17 237.9 0.25 0.7
Mo NH4)6Mo7O24·4H2O 0.03 0.51 1235.9 0.54 0.9
Trace Various 4.22 72.37 - - - 100 1715
Source: Aizawa and Miyachi, Brown et al., Mil'ko, Grant; Borowitzka and Borowitzka, McLachlan, Massyuk.
10

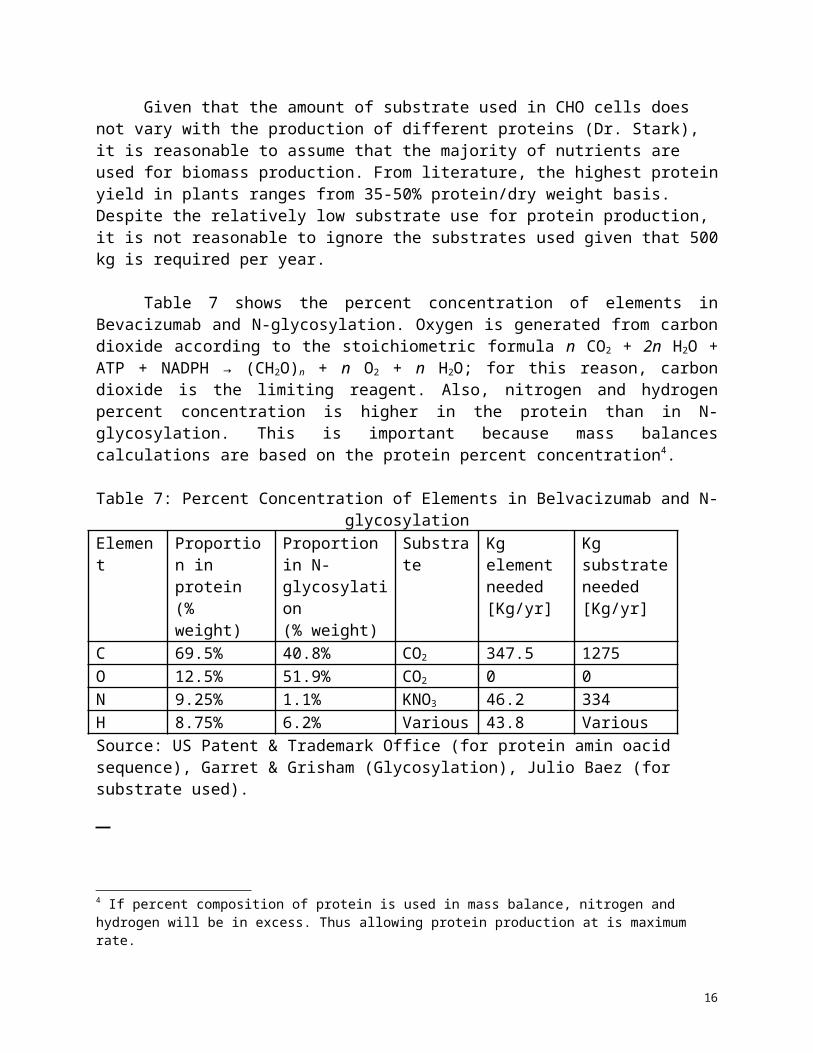
Given that the amount of substrate used in CHO cells does not vary with the production of different proteins (Dr. Stark), it is reasonable to assume that the majority of nutrients are used for biomass production. From literature, the highest protein yield in plants ranges from 35-50% protein/dry weight basis. Despite the relatively low substrate use for protein production, it is not reasonable to ignore the substrates used given that 500 kg is required per year.
Table 7 shows the percent concentration of elements in Bevacizumab and N-glycosylation. Oxygen is generated from carbon dioxide according to the stoichiometric formula n CO2 + 2n H2O + ATP + NADPH → (CH2O)n + n O2 + n H2O; for this reason, carbon dioxide is the limiting reagent. Also, nitrogen and hydrogen percent concentration is higher in the protein than in N-glycosylation. This is important because mass balances calculations are based on the protein percent concentration4.
Table 7: Percent Concentration of Elements in Belvacizumab and N-glycosylationElement Proportion in
protein(% weight)
Proportion in N-glycosylation(% weight)
Substrate Kg element needed [Kg/yr]
Kg substrate needed [Kg/yr]
C 69.5% 40.8% CO2 347.5 1275O 12.5% 51.9% CO2 0 0N 9.25% 1.1% KNO3 46.2 334H 8.75% 6.2% Various 43.8 Various Source: US Patent & Trademark Office (for protein amin oacid sequence), Garret & Grisham (Glycosylation), Julio Baez (for substrate used).
Upstream Design Specifications_________________________
Medium Preparation
The primary method of sterilizing the media is through heat. The gaseous CO2 supply does not need to be heat sterilized but must be filter sterilized before it enters the reactor. Before heat sterilizing the media, it should be microfiltered in order to remove any large particles. Then, the media should be heat sterilized using steam to the point at which the probability of contamination is very low. Heat sterilizing the media will also degrade some of the media components. Thus the initial concentration of nutrients in the media must account for this reduction to the final concentration. After the media is heat sterilized, it must be quarantined before it is used in order to verify that it is not contaminated.
4 If percent composition of protein is used in mass balance, nitrogen and hydrogen will be in excess. Thus allowing protein production at is maximum rate.
11

The liquid media is sterilized in a continuous sterilization system. Continuous sterilization systems have advantages over batch sterilization systems such as lower energy costs, more efficient use of energy, and the fact that the time to sterilize is lower because the temperature is higher. The system (detailed specifications listed below in Table 8 ) consists of two heat exchangers, a retention coil, and a holding tank. Two heat exchangers are used in order to recover the energy used to heat up the media. The primary heat exchanger has a hot incoming feed from the sterilized media leaving the retention coil. Energy is recovered when the hot sterilized media heats up the incoming cold media feed that needs to be sterilized.
The media first enters the primary heat exchanger and is heated from 30˚C to 120˚C. The cold media is heated up by the hot sterilized media, which is cooled from 130˚C to 50˚C. The media then enters the secondary heat exchanger where it is further heated by steam to 130˚C. The media next enters the 33 meters long retention coil at a velocity of 0.11 m/s. It takes the 130˚C media 5 minutes to travel through the retention coil, where the majority of any contaminants are killed. The sterilized media then returns to the primary heat exchanger, heating up the fresh, incoming media. The sterilized media is then held in a 10,000 L collection tank. A detailed schematic of this process is illustrated below in Fig. 3.
Table 8: Media Preparation SpecificationsEquipment Material DimensionsCollection Tank 316L SS 10,000 L. Diameter of 1.62m and
height of 4.86m.Regen. Heat Exchanger 316L SS 16 plates. Each plate is 40 cm x
30 cm x 11.17 mm.Steam Heat Exchanger 316L SS 24 plates. Each plate is 40 cm x
30 cm x 11.17 mm.Retention Coil 316L SS 3 inch inner diameter. 3.5 inch
outer diameter. 91.4 meters long.Centrifugal Pump 316L SS Magnatex Pumps, ISO 9000Temperature probe WQ101 Temperature SensorpH Probe PHR-212Flow Meter Celcon PS601CLiquid Level Meter LV800 Series Level MeterAcid Supply Tank 316L SS 1,000 L. Diameter of 0.75m and
height of 2.25 m.Base Supply Tank 316L SS 1,000 L. Diameter of 0.75m and
height of 2.25 m.Diaphragm Valve High-Purity Two-Way
Diaphragm Valve EW-98613-56Sampling Probe PFA 100 Probe
12
Figure 3: Medium Preparation P&ID
13

Inoculation Train
From Dunaliella tertiolecta’s annual biomass production and the saturation concentration, the volume to process annually should be 343,000 L (sample calculations shown in Appendix A). This means that 34300 L of inoculate stream is required. Detailed specifications of the inoculation train are listed below in Table 9.
Growth rate for green algae at light saturation differs from strain to strain. For example, Scenedesmus obliquus doubles 2.2 times per day, whereas Chrorella pyrenoidosa doubles 9.2 times per day. Since growth rate data is not available for Dunaliela tertiolecta, an estimate has to be made. Given that most algal strains double at 3.5 hours5, a conservative estimate is 4 hours. 10% inoculants in the inoculation train would, therefore, take 16hours to grow (see calculation in Appendix A).
Due to absolute sterility as well as cost effectiveness, disposable wave bags were chosen as the reactor for the inoculation train. Since the largest wave bags produced are 2000L and the working volume is 50%, the inoculation scheme will be as follows (Fig. 4):
Figure 4: Inoculation Flow Sheet
The total time to inoculate the photobioreactor will be 96 hours, or 4 days. Due to the working capacity of 50%, the actual size of the bags (and test-tube – 10mL) used are two times that of the loaded volume listed above. The first inoculation will be from a standard Petrie dish and into a 20mL disposable test tube filled with 9mL of fresh medium using a disposable inoculation needle. The second inoculation will involve a 200mL wavebag. The bag is first filled with sterilized air until rigid and then filled with 90mL of fresh medium. The bag is then placed on the mechanical system and then rocked at 15 rocks per minute at an angle of 6 degrees. The temperature is allowed to equilibrate and then the inoculant (10mL) is transferred via peristaltic pump. The same procedure is repeated for each of the remaining steps in the train: 10% inoculant from the previous step and 90% fresh medium (of half of the bag volume).
In addition to the light energy mentioned above, each step of the train requires adequate CO2. The CO2 will be provided using simple plastic tubing (much like those used at Genentech) of 1” diameter. For the larger bags, 200L and above, multiple tubes will be placed to ensure adequate CO2 transfer. Conveniently, the bags in question come equipped with filters to ensure absolute sterility of any incoming substance. The CO2 requirement, as further discussed in the previous section, “Medium Preparation”, is approximately 60% of the cell biomass. The dissolved CO2 concentrations will be measured with a sensor. The pH of the trains should also be measured and will be monitored and maintained at pH 6.8 with a standard probe. A sampling probe will also be utilized to extract samples and monitor the cell density of each step of the train. The bags have custom made probes to ensure absolute sterility and each probe measurement will take place every 6 hours during each step of the train
Table 9: Innoculation Specifications5 Julio Baez.
14

Innoculation Step 1 2 3 4 5 6Wave Bag Dimensions
20mL 200mL 2L 20L 200L 2000L
Innoculant Volume 1mL 10mL .1L 1L 10L 100LMedia Requirements 9mL 90mL .9L 9L 90L 900LLight Source 34.46-51.7 W m-2 “ “ “ “ “CO2 SupplyTime Required 16hrs “ “ “ “ “Total Time for Innoculation
96hrs
CO2 Supply Lines 1-1” silicon tube “ “ “ “ “
CO2 Valves membrane “ “ “ “ “CO2 Pressure
ElementAt pump-Positive displacement – release at 1000psi
“ “ “ “ “
CO2 Flow Element Magnetic meter : 0-62.3 L/min “ “ “ “ “CO2 Probe Electrode: 10mbar minima “ “ “ “ “pH Probe Electrode: 7.0+ 5 “ “ “ “ “
Light Probe Quantum:2-300 µmol m-2s-1 “ “ “ “ “Sampling Probe Optical “ “ “ “ “Transfer Pump Diaphragm: 0-62.3 L/min “ “ “ “ “Transfer Tubes 1.5” silicon tubing “ “ “ “ “
Photobioreactor
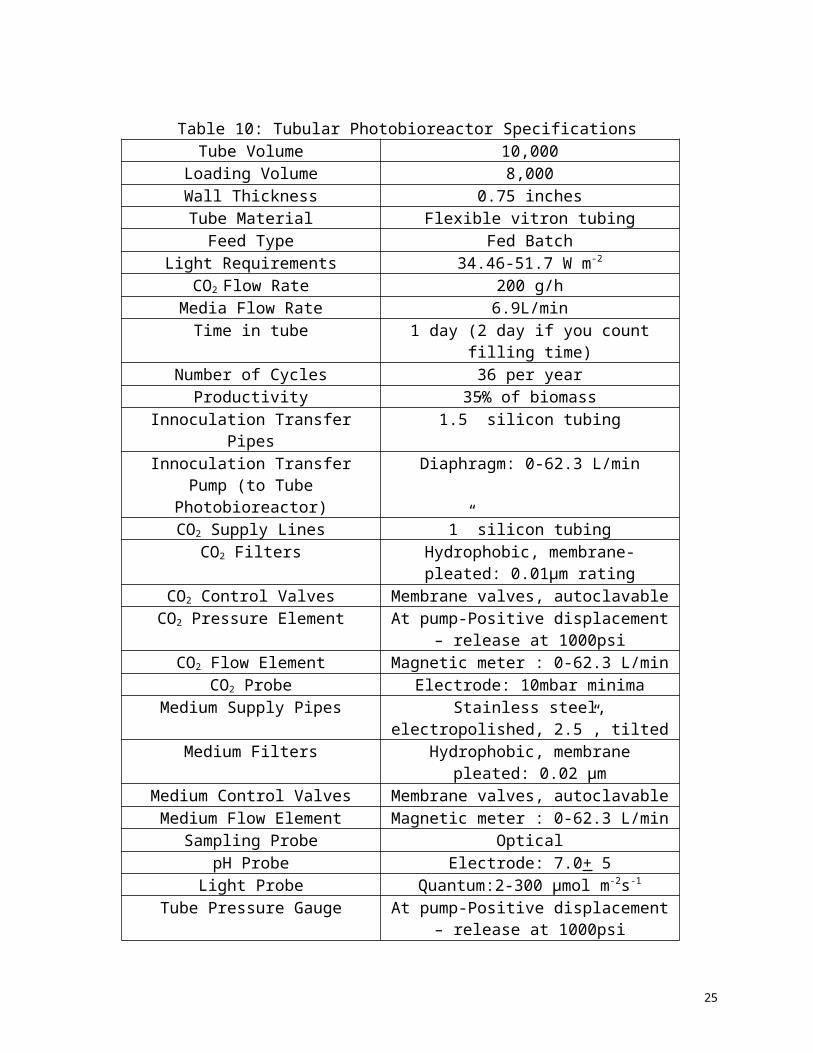
In order to successfully produce 600kg of MAb per year, as the calculation highlighted in the appendix illustrates, 343000 L of saturated cultivation solution will be required. This will require 10- 10,000L tubular photobioreactors that are detailed below in Table 10. Every batch will require two days: 1 to fill the tanks, and one to run the reaction. To meet the MAb demand, we will perform 36 batches (fed batch) per year.
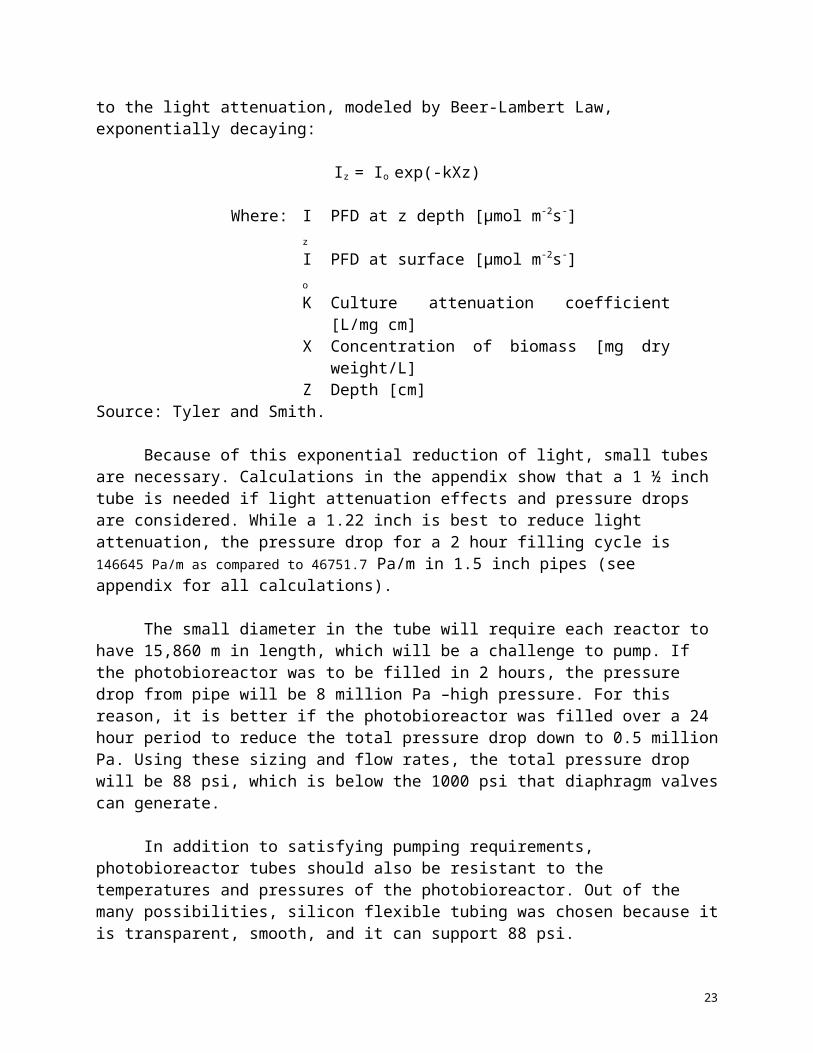
The tubular reactors currently used are in the order of 1cm-2.5cm (García-González et al., Mullikin and Rorrer). This is due to the light attenuation, modeled by Beer-Lambert Law, exponentially decaying:
Iz = Io exp(-kXz)
Where: Iz PFD at z depth [μmol m-2s-]Io PFD at surface [μmol m-2s-]K Culture attenuation coefficient [L/mg cm]X Concentration of biomass [mg dry weight/L]Z Depth [cm]
Source: Tyler and Smith.
15
Because of this exponential reduction of light, small tubes are necessary. Calculations in the appendix show that a 1 ½ inch tube is needed if light attenuation effects and pressure drops are considered. While a 1.22 inch is best to reduce light attenuation, the pressure drop for a 2 hour filling cycle is 146645 Pa/m as compared to 46751.7 Pa/m in 1.5 inch pipes (see appendix for all calculations).
The small diameter in the tube will require each reactor to have 15,860 m in length, which will be a challenge to pump. If the photobioreactor was to be filled in 2 hours, the pressure drop from pipe will be 8 million Pa –high pressure. For this reason, it is better if the photobioreactor was filled over a 24 hour period to reduce the total pressure drop down to 0.5 million Pa. Using these sizing and flow rates, the total pressure drop will be 88 psi, which is below the 1000 psi that diaphragm valves can generate.
In addition to satisfying pumping requirements, photobioreactor tubes should also be resistant to the temperatures and pressures of the photobioreactor. Out of the many possibilities, silicon flexible tubing was chosen because it is transparent, smooth, and it can support 88 psi.
Even though standard manufacturing practices using mammalian or bacterial cells require the employment of impellers for mixing and jacket characteristics for adequate heat removal, our design does not require the use of impellers or jackets. Algae in general prefer stagnant environments and vigorous agitation hinders growth. Because light absorption is the only limiting reagent in our reaction, and agitation does not increase light absorption, agitation is not required for optimal growth. Dunaliella tertiolecta is also an alga that is capable to grow and produce proteins optimally at ranges from 25-35ºC. Generally, algae thrive at higher temperatures and therefore heat removal is an unnecessary expenditure. This allows our organization to utilize a room thermostat from a standard HVAC to control temperature.
As mentioned previously, CO2 transfer will be accomplished using simple silicon tubing of 1” diameter. Unlike CHO and E. coli expression systems, gas transfer is not a limiting reagent in our algae process. The CO2 will be filtered upon entry into the photobioreactor to ensure absolute sterility. In addition, our exit gas stream will also be filtered to eliminate outside contamination.
The medium, detailed previously, will be fed into the photobioreactor in a fed batch manner and filtered upon entry. The detailed process diagram is illustrated below in Figure 5.
16
Table 10: Tubular Photobioreactor SpecificationsTube Volume 10,000
Loading Volume 8,000Wall Thickness 0.75 inchesTube Material Flexible vitron tubing
Feed Type Fed BatchLight Requirements 34.46-51.7 W m-2
CO2 Flow Rate 200 g/hMedia Flow Rate 6.9L/min
Time in tube 1 day (2 day if you count filling time)Number of Cycles 36 per year
Productivity 35% of biomassInnoculation Transfer Pipes 1.5” silicon tubing
Innoculation Transfer Pump (to Tube Photobioreactor)
Diaphragm: 0-62.3 L/min
CO2 Supply Lines 1” silicon tubingCO2 Filters Hydrophobic, membrane-pleated: 0.01µm
ratingCO2 Control Valves Membrane valves, autoclavable
CO2 Pressure Element At pump-Positive displacement – release at 1000psi
CO2 Flow Element Magnetic meter : 0-62.3 L/minCO2 Probe Electrode: 10mbar minima
Medium Supply Pipes Stainless steel, electropolished, 2.5”, tiltedMedium Filters Hydrophobic, membrane pleated: 0.02 µm
Medium Control Valves Membrane valves, autoclavableMedium Flow Element Magnetic meter : 0-62.3 L/min
Sampling Probe OpticalpH Probe Electrode: 7.0+ 5
Light Probe Quantum:2-300 µmol m-2s-1
Tube Pressure Gauge At pump-Positive displacement – release at 1000psi
17

Figure 5: Photobioreactor P&ID
Deoxygenation
Oxygen removal is crucial for the photosynthetic activity of plant cells. Not only does oxygen inhibit photosynthesis, but also high irradiance levels inside the photobioreactor with high dissolved oxygen leads to photo-oxidation. A photobioreactor lacking dissolved oxygen (DO) has an increased photosynthetic activity of 14%. Photosynthetic activity has been known to decrease 35% when the DO content is 1.38 mol/m3 at 20ºC (Rubio et al. 1999). For these reasons deoxygenating is required for photobioreactors. Currently, there are three ways in which this can be achieved: Catatalytic oxygen removal systems (CORS), Activated Carbon Deoxygenation (DEOX), and Gas Transfer Membranes (GTM).
CORS removes oxygen by treating media with hydrogen, and passing it trough a palladium catalyst to produce water that is less than 1ppb in dissolved oxygen concentration. DEOX, on the other hand, feeds a chemical oxygen scavenger known as hydrazine; the stream is then directed to a ion-exchange resin vessel to removed trace impurities leached by the activated
18

carbon. This process yields a purity of 1ppb of dissolved oxygen. Finally GTM is the passing of the stream through an impermeable membrane, but with gas transfer. This method also yields to less than 1ppb in dissolved oxygen. Alternatively, hybrid methods have been suggested to reduce oxygen to <5 ppb and be cheaper than DEOX (Gorry et al. 2004).
Because annual processing volumes for the proposed algal photobioreactor amounts to 3600000 L, DEOX is not a valuable option due to the price of hydrazine. CORS operation is cost-effective, and has been employed in photobioreactors (Christensen and Iversen et al.). Hydrogen however is highly flammable and dangerous. GTM is also cost effective, but will also remove some carbon dioxide and other gases from the media.
After considering the alternative options, GTM was considered safer than CORS and was therefore chosen. In GTM, a X-40 polypropylene fiber is used to remove oxygen preferentially as shown in Figure 6.
Figure 6: GTM Deoxygenation Schematic
The processing capacity of this system can reach up to 141 gpm wih only three 10-inch high-purity Membrane contractors in a parallel configuration to a <5ppb concentration of oxygen (Liqui-Cel Mmebrane Contractors). A real life example of this system is shown below in Figure 7.
19

Figure 7: GTM Deoxygenation System Example
Upstream CIP/SIP Systems
For the production of monoclonal antibodies, a multi-use cleaning system is appropriate, given that it is commonly used for bioprocess plant running on multiple products. In a multi-use system cleaning reagents are dispersed through the circuits for different intervals of time at varying temperatures. The system consists of 3 tanks for chemical and water recovery, an associated single pump, recirculatory pipe work, and a heat exchanger. Using a multi-use cleaning system is advantageous because the recirculation times and temperatures for the final water rinse are controlled. In addition, the water use for rinsing can be discharged to a drain or recovered. The system also allows different chemicals or a combination of chemicals to be used as needed. This is made possible because the detergent can be programmed to circulate through either the detergent tank or the bypass loop. Note also that the whole system is suited for automatic control, hence reducing the time and error caused by manual labor. Costs of waste on cleaning reagents are also reduced since they can be reused. In addition to cost saving on pipe work and storage tank, the system is also designed to provide some recovery of energy and material. The upstream CIP system utilized is fully described with detailed specifications in Tables 11, and is illustrated in Figure 8. It will be utilized for the cleaning of both the medium preparation system, the photobioreactor system, and deoxygenation system mentioned in full detail in the previous sections above. Typical cleaning schedules for the upstream side of the process using this system a also described in Tables 12 and 13.
The water for injection is used to supply the water necessary in the CIP, SIP, and steam heat exchanger sources. Combined, these processes require 360,000 liters of WFI. Before using the water, it first needs to be sterilized. The water is carbon filtered and then undergoes reverse osmosis. The reverse osmosis membrane captures ions, microbes, endotoxins, and other small contaminants (Lydersen, 548).
20

Material Description DimensionScavenge Return Pump The return pump pumps the fluids out of the clean
process equipment, and either returns it to the CIP unit (recycling) or pumps it directly to the drainage system.
Double Pipe Heat exchanger The built-in heating elements heat the fluid to a specified temperature.
Piping 316L SS Use to connect equipment to one another 1.5 inchSodium hydrochlorite 10000L tank
316L SS Detergent for CIP. Use to id media and algae residues.
Diameter:1.62m Height: 4.86m
Water 10000L tank 316L SS Water comes from WFI. Use for cleaning and for buffer media.
Diameter:1.62m Height: 4.86m
Sodium hydroxide 10,000L tank
316L SS Second solvent used for cleaning purposes. Diameter:1.62m Height: 4.86m
Nitric Acid 10,000L tank 316L SS Acid used for Deoxygenating System. Diameter:1.62mHeight: 4.86m
Control valves Used to monitor and control amount of fluid leaving and entering.
Cold Water Supply tank (3000L)
316L SS Supply the system with cool to cold water. Diameter:1.08m Height: 3.25m
Steam Supply tank (3000L) 316L SS Supply heat exchanger with steam. Diameter:1.08m Height: 3.25m
Condensate Return box (200L)
316L SS Return the collected condensate amount to heat exchanger.
Diameter: 0.4m Height: 1.3m
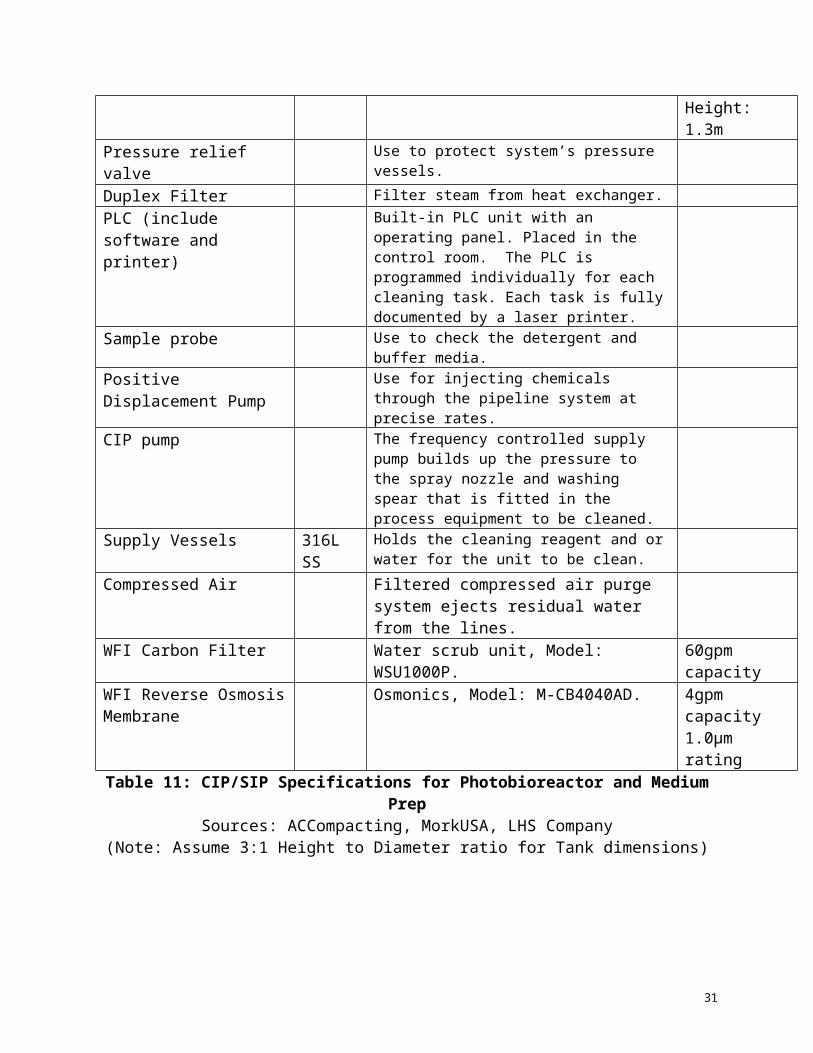
Pressure relief valve Use to protect system’s pressure vessels.Duplex Filter Filter steam from heat exchanger.PLC (include software and printer)
Built-in PLC unit with an operating panel. Placed in the control room. The PLC is programmed individually for each cleaning task. Each task is fully documented by a laser printer.
Sample probe Use to check the detergent and buffer media.Positive Displacement Pump
Use for injecting chemicals through the pipeline system at precise rates.
CIP pump The frequency controlled supply pump builds up the pressure to the spray nozzle and washing spear that is fitted in the process equipment to be cleaned.
Supply Vessels 316L SS Holds the cleaning reagent and or water for the unit to be clean.
Compressed Air Filtered compressed air purge system ejects residual water from the lines.
WFI Carbon Filter Water scrub unit, Model: WSU1000P. 60gpm capacity
WFI Reverse Osmosis Membrane
Osmonics, Model: M-CB4040AD. 4gpm capacity1.0µm rating
Table 11: CIP/SIP Specifications for Photobioreactor and Medium PrepSources: ACCompacting, MorkUSA, LHS Company
21

(Note: Assume 3:1 Height to Diameter ratio for Tank dimensions)
Figure 8: CIP P&ID
Table 12: Typical Cleaning Schedule for Photobioreactor and Media Prep(Note : An air blow step is occurs in between each of the cleaning step) Equipment
Operation Flow Rate module**
Amount* Time Temperature
Pressure****
10,000L Holding Tank
Water Rinse 38L/min* 760L or 200.64gal 15-20 min
Ambient 2-8bar (water feeding pressure)
Sodium hydroxide (.1N) wash (4g/L)***
38L/min 15.048 gal of Sodium hydroxide+135.4 gal of water
15-20 min
Ambient to 75 C
Water Rinse 38L/min 570L or 150.48gal 5-15 min
Ambient 2-8bar (water feeding pressure)
Sodium hydrochlorite wash
38 L/min 15.048 gal of Sodium hydrochlorite+135.43of water
15-20 min
Ambient to 75C
Water Rinse 38L/min 380L or 100.32 gal 5-10 min
Ambient 2-8bar (water feeding pressure)
Purged/Drainage
38L/min --------- 10-15 ---------
Steam 130 lb/hr 43 lb 5-20 Ambient to 3-5 bar
22
sterilized min 100CTubing Water Rinse .06996gal/
min.6996 gal 5-10
minAmbient 2-8bar
(water feeding pressure)
Sodium hydroxide (.1N) wash (4g/L)
.06996gal/min
.0699 gal of sodium hydroxide + .62964gal water
15-20 min
Ambient
Water Rinse .06996gal/min
.6996gal 5-10 min
Ambient to 75C
2-8bar (water feeding pressure)
Sodium hydrochlorite wash
.06996gal/min
.0699 gal of sodium hydrochlorite + .62964 gal water
15-20 min
Ambient
Water Rinse .06996gal/min
.6996 gal 5-10 min
Ambient 2-8bar (water feeding pressure)
Purge/Drainage 38L/min -------- 10-15 min
----------
Steam sterilized
130lb/hr 43lb 5-20 min
Ambient to 100C
3-5bar
Piping Water Rinse .06996gal/min
.6996gal 5-10 min
Ambient 2-8bar (water feeding pressure)
Sodium hydroxide (.1N) wash (4g/L)
.06996gal/min
.0699 gal of sodium hydroxide + .62964gal water
15-20 min
Ambient to 75C
Water Rinse .06996gal/min
.6996 gal 5-10 min
Ambient 2-8bar (water feeding pressure)
Sodium hydrochlorite wash
.06996gal/min
.0699 gal of sodium hydrolchlorite + .6294 gal water
15-20min
Ambient to 75C
Water Rinse .06996gal/min
.6996 gal 5-10 min
Ambient 2-8bar (water feeding pressure)
Steam sterilized
130 lb/hr 43lb 5- 20 min
Ambient to 100C
3-5bar
Purge/Drainage .06996gal/min
-------- 10-15 min
--------- -------
*Amount based on flow rate Sources: Lyderson, ACCompacting, MorkUSA, LHS Company***** taken to be 1-10% of volume
23
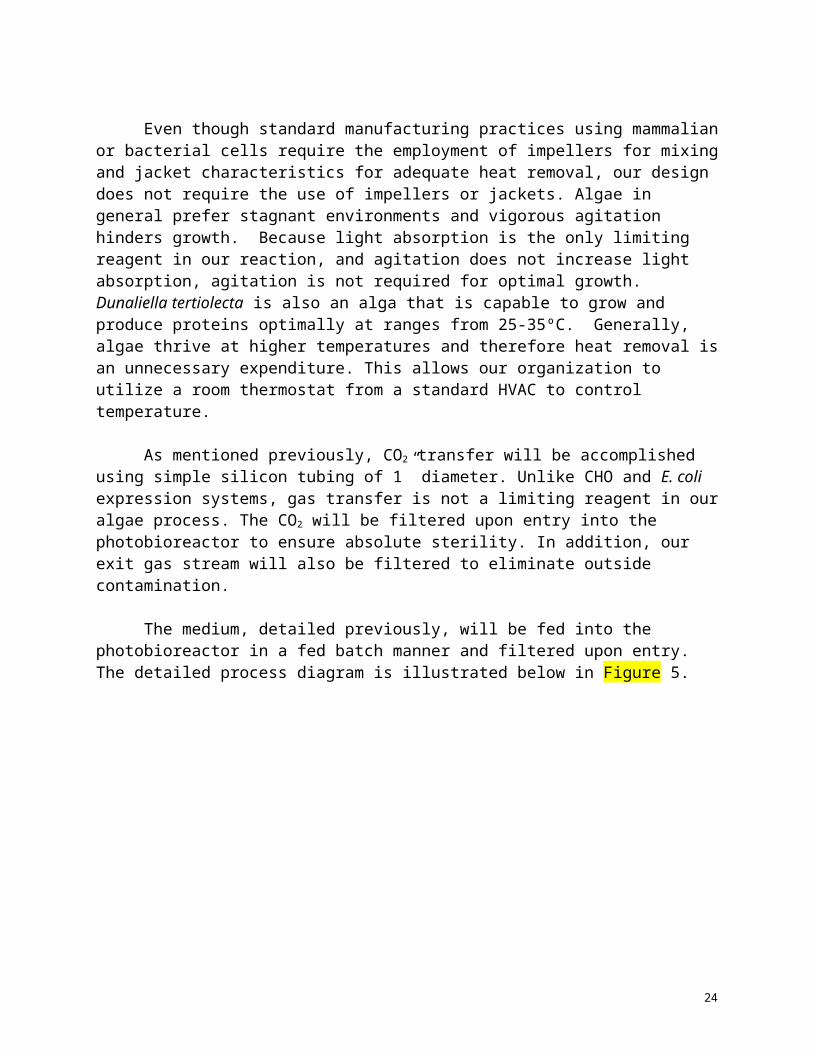
Table 13: Cleaning Schedule for Deoxygenating System
Source: Liqui-Cel Cleaning Guidelines.
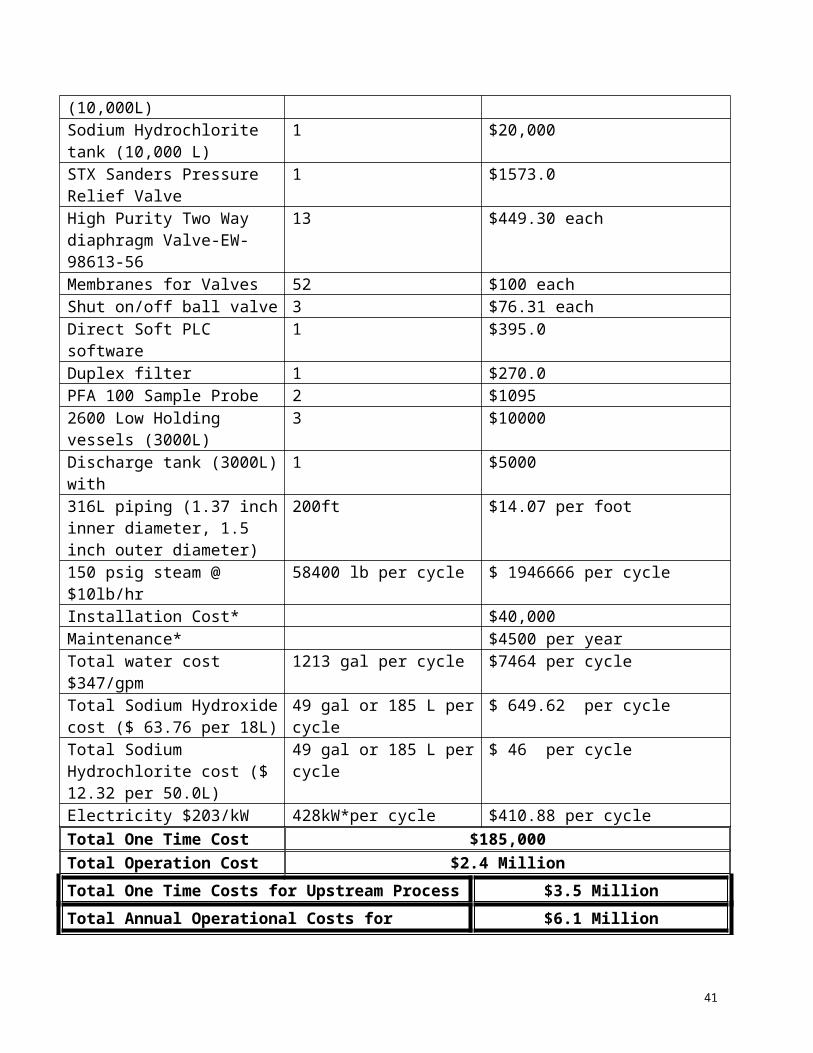
Cost Analysis of Upstream Process____
The four sections of the upstream processing include: medium preparation, inoculation train, photobioreactor, and CIP/SIP. The costs associated with both installation, maintenance, and operation of each section have been determined and listed in the following tables. The final total one time costs of the upstream part of the process sums up to be $3.5 million and the annual operational costs sums up to be $6.1 million. This cost does not consider employee compensation or building costs at this time. The cost also does not include the cost of the deoxygenating system yet.
Table 14: Costs of Cell Requirements (Media, light, CO2)Substrate Cost
[$/Kg]Comments Item # From Substrate
needed [Kg/year]
Costs per Year ($)
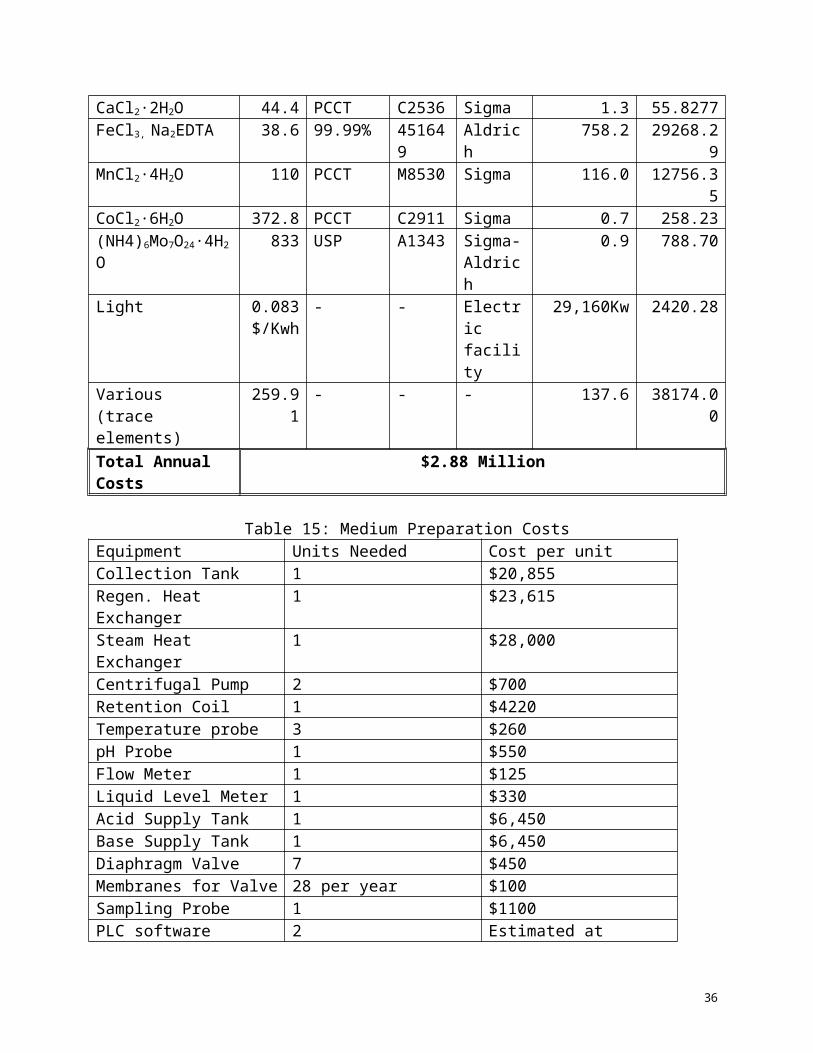
CO2 676.2 99.80% 295108 Aldrich 4037.7 2,730,319KNO3 36.2 PCCT P8291 Sigma 1587.7 57475.64K2HPO4 130.8 MBG 60353 Fluka 56.5 7386.34CuSO4·5H2O 97.2 PCCT C3036 Sigma 29.3 2852.76CaCl2·2H2O 44.4 PCCT C2536 Sigma 1.3 55.8277FeCl3, Na2EDTA 38.6 99.99% 451649 Aldrich 758.2 29268.29MnCl2·4H2O 110 PCCT M8530 Sigma 116.0 12756.35CoCl2·6H2O 372.8 PCCT C2911 Sigma 0.7 258.23(NH4)6Mo7O24·4H2O 833 USP A1343 Sigma-
Aldrich0.9 788.70
Light 0.083 $/Kwh
- - Electric facility
29,160Kw 2420.28
Various 259.91 - - - 137.6 38174.00
24
(trace elements)Total Annual Costs $2.88 Million
Table 15: Medium Preparation CostsEquipment Units Needed Cost per unitCollection Tank 1 $20,855Regen. Heat Exchanger 1 $23,615Steam Heat Exchanger 1 $28,000Centrifugal Pump 2 $700Retention Coil 1 $4220Temperature probe 3 $260 pH Probe 1 $550 Flow Meter 1 $125Liquid Level Meter 1 $330Acid Supply Tank 1 $6,450Base Supply Tank 1 $6,450Diaphragm Valve 7 $450Membranes for Valve 28 per year $100Sampling Probe 1 $1100PLC software 2 Estimated at $1500.00 per
controllerSteam 46 lb/hr for 10,000 L of
medium$50 per lb/hr
Electricity 17032.8 kW-hr for 10,000 L of medium
$0.04 per Kw-hr
316L SS Piping 400 feet $14.07 per footInstallation Cost Estimated at $40,000Maintenance Estimated at $5,000 per
year35 media prep cycles are needed to make 3.43x10⁵ liters of media to produce 600 kg of MabTotal One Time Costs $140,000Total Annual Operational Costs $16,500Sources: Lydersen, Lewin
25
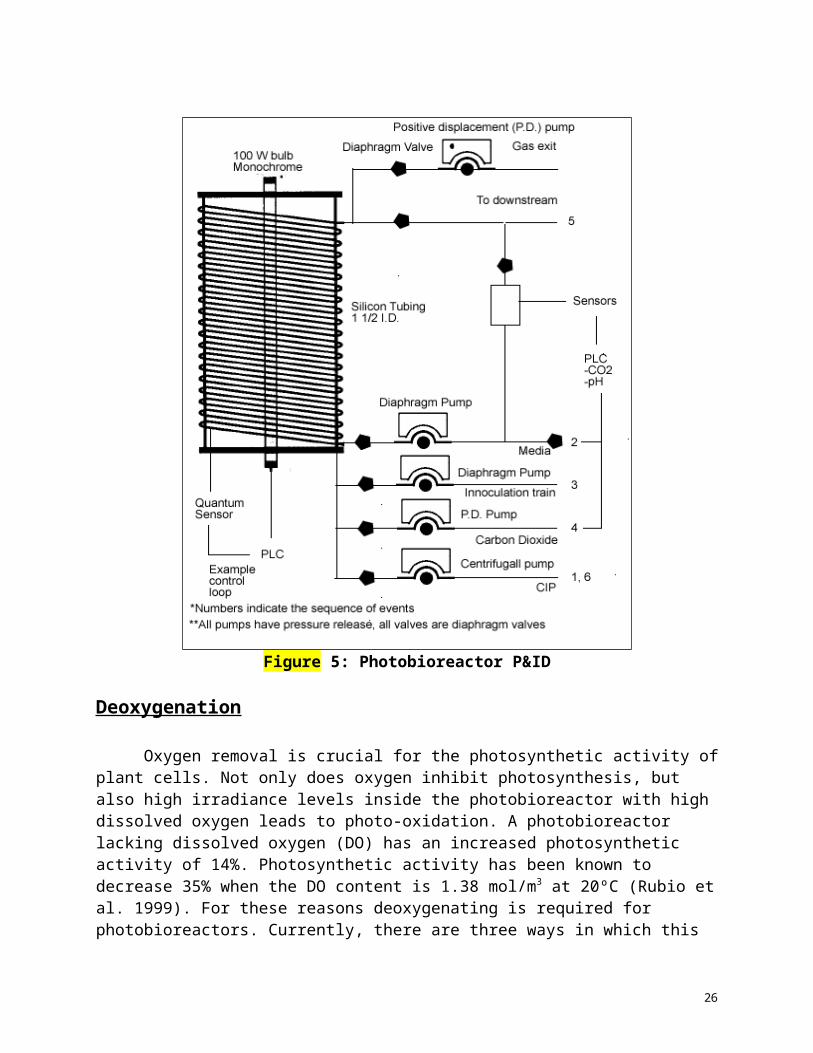
Table 16: Inoculation CostsEquipment Type Quantity Cost [each] Cost Pumps Diaphragm
P.D. Centrigugal
321
$3000$3000$3000
$18,000
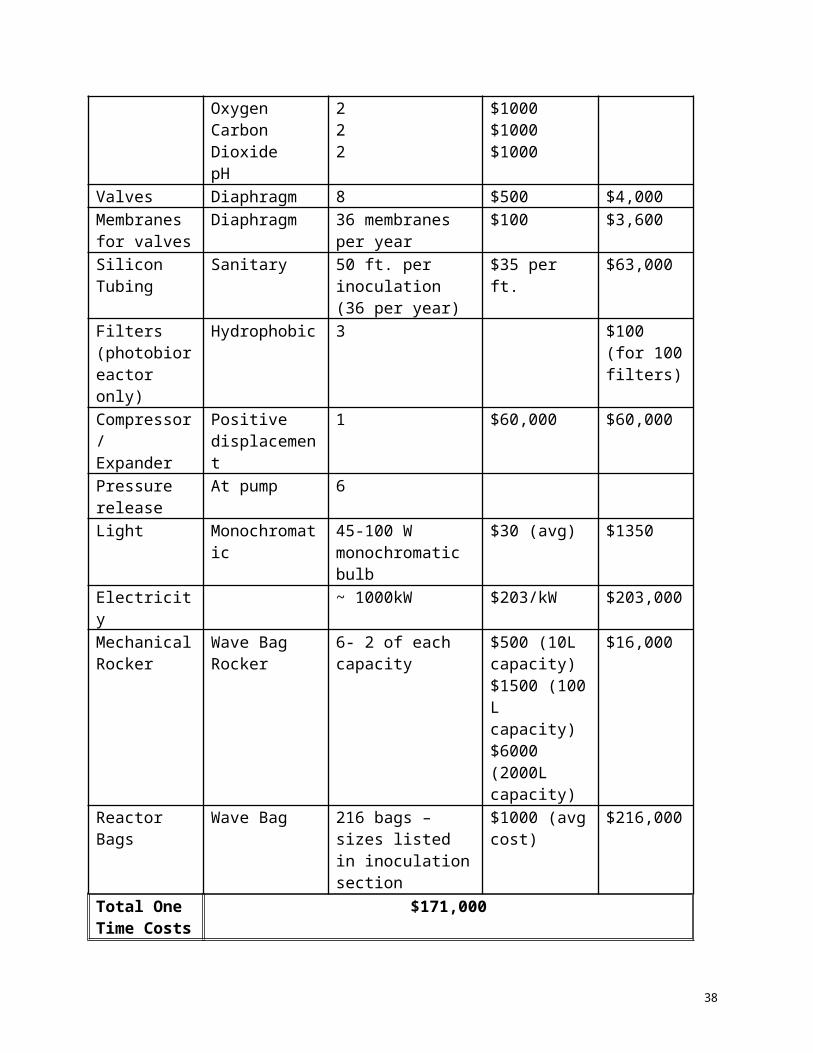
Sensor QuantumTurbidityOxygenCarbon DioxidepH
22222
$1000$1000$1000$1000$1000
$10,000
Valves Diaphragm 8 $500 $4,000Membranes for valves
Diaphragm 36 membranes per year
$100 $3,600
Silicon Tubing Sanitary 50 ft. per inoculation (36 per year)
$35 per ft. $63,000
Filters (photobioreactor only)
Hydrophobic 3 $100 (for 100 filters)
Compressor/Expander
Positive displacement
1 $60,000 $60,000
Pressure release
At pump 6
Light Monochromatic 45-100 W monochromatic bulb
$30 (avg) $1350
Electricity ~ 1000kW $203/kW $203,000Mechanical Rocker
Wave Bag Rocker
6- 2 of each capacity $500 (10L capacity)$1500 (100 L capacity)$6000 (2000L capacity)
$16,000
Reactor Bags Wave Bag 216 bags – sizes listed in inoculation section
$1000 (avg cost)
$216,000
Total One Time Costs
$171,000
Total Annual Operational Costs
$424,000
26

Table 17: Photobioreactor Costs Equipment Type Quantity Cost [each] CostPumps Diaphragm
P.D. Centrigugal
321
$5000$5000$5000
$90,000
Sensor QuantumTurbidityOxygenCarbon DioxidepH
11111
$1000$1000$1000$1000$550.00
$5,550
Valves Sanitary 8 $500 $4,000Membranes for Valves
Diaphragm 36 per year $100 $3,600
Piping Sanitary 5,000 m $113 per meter $565,670Filters Hydrophobic 1 $100 $100Mixing Tubular
bioreactor1 $113 per meter $2,262,678
Compressor/Expander
Positive displacement
1 $60,000 $60,000
Pressure release
At pump 6 Comes with pump 0
Light Monochromatic 45-100 W monochromatic bulb
$30 $1,350
Electricity ~2000kW 203/kW $406,000Maintenance Reparation Per year .05% of total cost $10,000Installation One time $40,000Total One Time Costs
$3 Million
Total Annual Operational Costs
$420,000
27
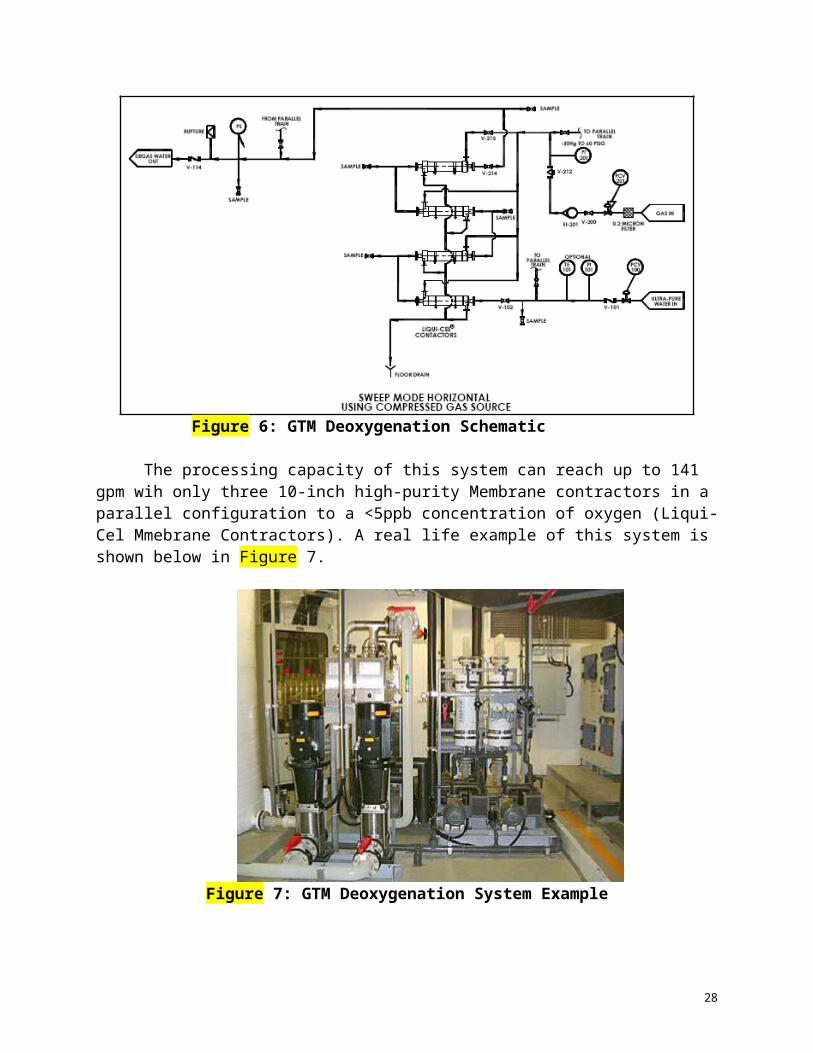
Table 18: Cost Assessment for CIP/SIP SystemCIP Equipment Quantity costDouble Seat Valves 3 $599.00Double Pipe Heat exchanger and Condensate Container
1 $24,000
EW-75201-10 CIP pump 1 $6854.00 / each Scavenge Return pump 1 $799.00Air Cooled Power Pak Positive Displacement pump PER-4414230
1 $2,836.40
Sodium Hydroxide Holding (10,000L)
1 $20,000
Rinsing Water tank (10,000L) 1 $20,000Sodium Hydrochlorite tank (10,000 L)
1 $20,000
STX Sanders Pressure Relief Valve
1 $1573.0
High Purity Two Way diaphragm Valve-EW-98613-56
13 $449.30 each
Membranes for Valves 52 $100 eachShut on/off ball valve 3 $76.31 eachDirect Soft PLC software 1 $395.0Duplex filter 1 $270.0PFA 100 Sample Probe 2 $10952600 Low Holding vessels (3000L)
3 $10000
Discharge tank (3000L) with 1 $5000316L piping (1.37 inch inner diameter, 1.5 inch outer diameter)
200ft $14.07 per foot
150 psig steam @ $10lb/hr 58400 lb per cycle $ 1946666 per cycleInstallation Cost* $40,000Maintenance* $4500 per yearTotal water cost $347/gpm 1213 gal per cycle $7464 per cycleTotal Sodium Hydroxide cost ($ 63.76 per 18L)
49 gal or 185 L per cycle $ 649.62 per cycle
Total Sodium Hydrochlorite cost ($ 12.32 per 50.0L)
49 gal or 185 L per cycle $ 46 per cycle
Electricity $203/kW 428kW*per cycle $410.88 per cycleTotal One Time Cost $185,000Total Operation Cost $2.4 MillionTotal One Time Costs for Upstream Process $3.5 Million
28
Total Annual Operational Costs for Upstream Process $6.1 Million
Downstream Processing
Process Requirements ____________________
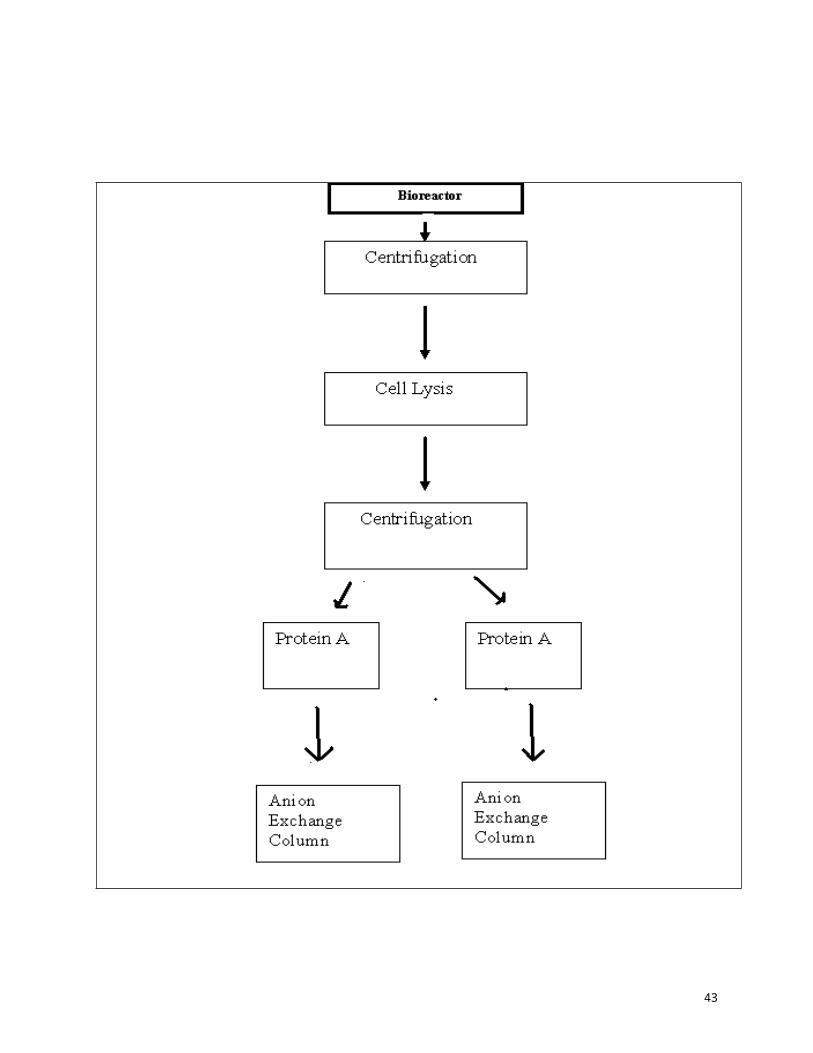
Downstream processing of fermentation broth is used to separate and purify the protein bevacizumab from Dunaliella Tertiolecta. For algae and the majority of aquatic cells, there has been no data found that provides information on how the protein is produced, either extracellularly or intracellularly. But studies done by scientists on plants suggest that the product is most likely produced by intracellular means. Thus, it is assumed that Bevacizumab (Avastin) is produced intracellularly. At large, intracellular products can be recovered through different processes. While the latter is true, in order to compete successfully in the aggressive protein market, a cheap and efficient means of recovery is needed. To achieve this, a schematic of an efficient downstream process is shown below in Figure 9 along with a detail description of the material and equipment used at each step.
29

Figure 9: Flow sheet of Downstream Process
30
Downstream Process Design_____________________________
Cell Harvest and Cell Debris Removal
Centrifuge Selection There are several different basic types of centrifugation frequently used in industrial
applications. The decanter centrifuge is commonly used for greater solids concentrations with large particle sizes. The disk stack centrifuge, on the other hand, is ideal for a wide range of separation tasks that involve lower solids concentrations and smaller particle sizes. The disk stack centrifuge can handle difficult separation tasks in which similar densities and ultra small particle sizes are involved. For this reason, it is the common choice of centrifugation in the biotechnology industry and will be used for all centrifugation applications in our recombinant protein recovery.
The disc stack centrifuge normally features four main sections: inlet zone, disc stack area,
liquid discharge section, and solids discharge section. A properly designed centrifuge makes sure that the feed solids and liquids are not degraded by preventing foaming, reducing sheer, minimizing temperature increase, and avoiding oxygen uptake. The key to good separation lies in the efficiency of the disc stack itself. The disc stack is very unique to each process and will be optimized by the unit manufacturer.
31

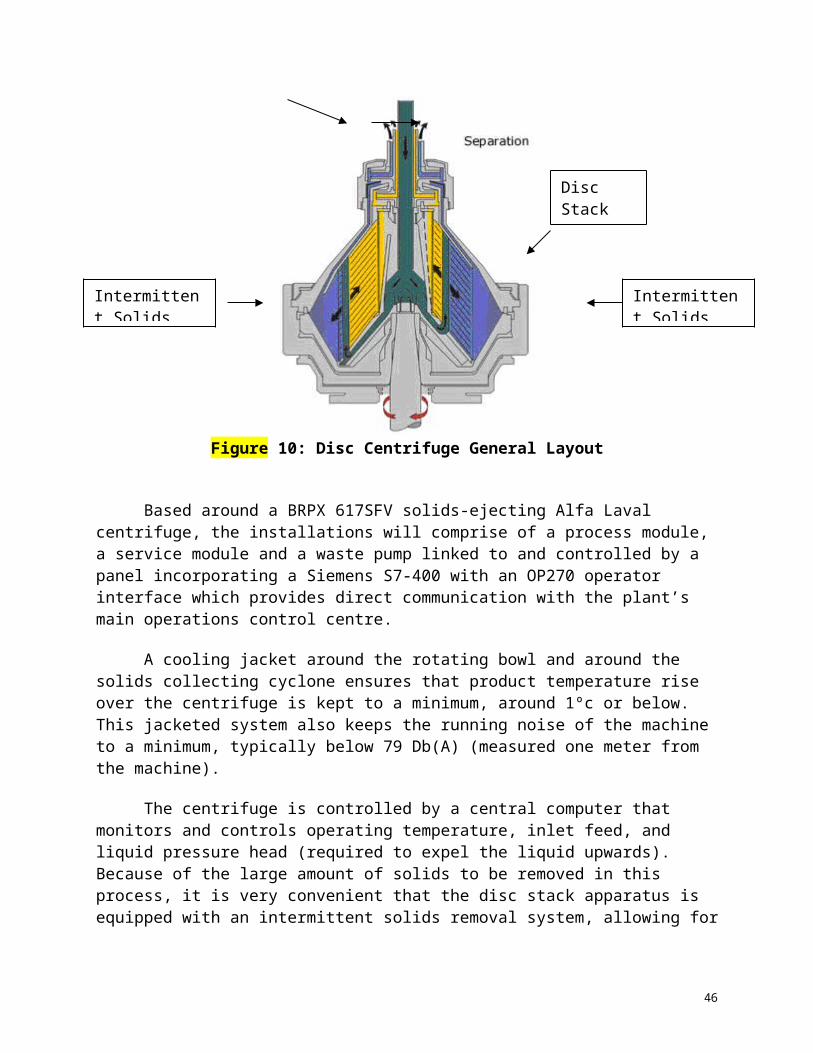
Figure 10: Disc Centrifuge General Layout
Based around a BRPX 617SFV solids-ejecting Alfa Laval centrifuge, the installations will comprise of a process module, a service module and a waste pump linked to and controlled by a panel incorporating a Siemens S7-400 with an OP270 operator interface which provides direct communication with the plant’s main operations control centre.
A cooling jacket around the rotating bowl and around the solids collecting cyclone ensures that product temperature rise over the centrifuge is kept to a minimum, around 1ºc or below. This jacketed system also keeps the running noise of the machine to a minimum, typically below 79 Db(A) (measured one meter from the machine).
The centrifuge is controlled by a central computer that monitors and controls operating temperature, inlet feed, and liquid pressure head (required to expel the liquid upwards). Because of the large amount of solids to be removed in this process, it is very convenient that the disc stack apparatus is equipped with an intermittent solids removal system, allowing for a semi-continuous operation. An electro-pneumatic device constantly monitors the amount of solids within the bowl and signals the computer when a pre-determined amount has collected. The
32
Intermittent Solids Removal
Intermittent Solids Removal
Inlet Zone
Liquid Discharge
Disc Stack Area

following figure illustrates the highly advanced centrifuges that we will employ in our manufacturing plant.
Figure 11: Alfa Laval BRPX 617SFV, 316L SS
Cell Harvest
After the fermentation is complete, the algae cells, which contain our desired product, must be separated from the rest of the broth. Due to the sufficiently large difference in cell density (1.02 g/cm3) and the liquid broth density (1.00 g/cm3) , this step does not require as large of a centrifuge and ultimately takes less time to achieve good separation. Using disc stack centrifuge equations found in Harrison, Todd, Rudge, and Petrides (2003), as well as the standard centrifugation constant, Gt=0.3E6 s (Atkinson, 1991), for algae cells, operating parameters were optimized (see Appendix A for calculations) in terms of: flow rate capabilities, time required to separate, centrifuge dimensions (smaller=cheaper), and energy usage (higher rpm=more energy). The required centrifuge operating specifications and dimensions are listed in Table 1 below.
Due to the operating limitation of around 6 hours on a given centrifuge when operated at its maximum bowl speed, the decision has been made to purchase two individual centrifuges to be rotated throughout the day. Alfa Laval recommends that a centrifuge that has operated for 6 continuous hours at its maximum capabilities be shut down for a period of time (at least half of the length of the operating time). The high rotational energy can heat up the product to dangerous temperatures and must be controlled with the cooling jacket system mentioned above. If the centrifuge operates beyond manufacturer recommendations, product may be damaged and/or the energy required to successfully cool the system will be outrageous. Because it has been determined that this step will require 24hours of continuous operation to successfully extract the algae cells, each of the centrifuges will be ran for a total of 6 hours at a time, two times a day. This extra initial expenditure will save time and should quickly pay for itself due to energy and product savings. A detailed P&ID for this system is illustrated below in Figure. 9.
33

Table 19: Cell Harvest Centrifuge SpecificationsAlgae Cell Diameter 10μmAlgae Cell Density 1.02 g/cm3
Liquid Broth Density 1.00 g/cm3
Process Flow Rate (from bioreactors :10 each at 6.9L/min) 70L/minNumber of Discs 100Angle of Discs 42◦Bowl Radius 30cmLargest Disc Radius, Ro (from center of rotation to outer edge of discs) 25cmShortest Disc Radius, R1 (from center of rotation to inner edge of discs) 8cmMaximum Bowl Speed 8000 rpmMaximum Allowable Throughput 90 L/minGt (106 s) for Algae Cells 0.3Time to Achieve Seperation 17sCentrifuge Volume Capacity 20LCentrifuge Height 30cmTotal Centrifugation Time for Entire 100,000L of Ferementation Broth 24Hours
34

P103.1, etc. Centrifugal PumpD103.6 Diaphragm Valve
B103.5, etc. Butterfly ValvePE Pressure ElementPT Pressure TransmitterFE Flow ElementFT Flow Transmitter
FAH Flow AlarmTE Temperature ElementTT Temperature Transmitter
TAH Temperature AlarmPLC Programmable Logical ControllerC301 Cell Harvest Centrifuge
Figure 12: Cell Harvest Centrifuge P&ID
35
Cell Debris Removal
After the cells have been broken (design located in following section) and the contents spilled into the remaining broth, it is essential to eliminate any cell debris with centrifugation prior to running the mixture through a column. Because this step of the process involves densities that are more similar (cell debris density: 1.08 g/cm3, protein density: 1.07 g/cm3) and particles that are much smaller, a larger centrifuge will be required. Using the same process mentioned above, and a much larger general centrifugation constant, Gt=2E6 s (Atkinson, 1991) for algae cell debris, the operating conditions were optimized based on the same essential guidelines and are listed below in Table 20. The method of rotating two identical centrifuges will be employed for reasons already discussed above. All of the centrifuges from both cell harvest and cell debris removal swill be operated with a 6.5kW XP motor with XP start/stop control, yet another feature embedded in the Alfa Laval models chosen for our process. The motor specs are tabulated below in Table 21. A detailed P&ID for this system is illustrated below in Figure 10. Because of the bottlenecking caused by the next step in the process, the protein A column, a holding tank will be included directly after centrifugation. The dimensions for this tank are included in the Intermediate Purification section in Table 23.
Table 20: Cell Debris Removal Centrifuge SpecificationsAlgae Cell Debris Simulated Diameter 5μmAlgae Cell Debris Density 1.08 g/cm3
Protein Broth Density 1.07 g/cm3
Process Flow Rate 70L/minNumber of Discs 100Angle of Discs 42◦Bowl Radius 50cmLargest Disc Radius, Ro (from center of rotation to outer edge of discs) 45cmShortest Disc Radius, R1 (from center of rotation to inner edge of discs) 8cmMaximum Bowl Speed 9000 rpmMaximum Allowable Throughput 74 L/minGt (106 s) for Algae Cell Debris 2Time to Achieve Separation 49sCentrifuge Volume Capacity 57LCentrifuge Height 27cmTotal Centrifugation Time for Entire 100,000L of Fermentation Broth 24 Hours
Table 21: Centrifuge XP Motor SpecificationsMotor Size 6.5 kW (10 hp)
Motor speed 2900 rpmVoltage 450 voltCycles 50Phase 3
36

P103.1, etc. Centrifugal PumpD103.6 Diaphragm Valve
B103.5, etc. Butterfly ValvePE Pressure ElementPT Pressure TransmitterFE Flow ElementFT Flow Transmitter
FAH Flow AlarmTE Temperature ElementTT Temperature Transmitter
TAH Temperature AlarmPLC Programmable Logical ControllerC302 Cell Debris Removal Centrifuge
Fig.10: Cell Harvest Centrifuge P&ID
37
Cell Disruption
Disruption Requirements
The expression of monoclonal antibodies in Dunaliella Tertiolecta can be intra or extracellular. If the MAb is extracellular, the cell culture can undergo centrifugation to remove the biomass from the protein of interest. However, there are times in which intracellular protein is produced. In the latter case, cell disruption systems would be required to release the MAbs from the cell prior to purification.
There are two principle methods of lysing cells to obtain their desired contents: chemical cell lysis and mechanical destruction via external force. Surfactants and enzymes added to a cell suspension act by dissolving portions of the cell membrane or cell wall. Because these chemical methods are often detrimental to the delicate protein products inside, it is often desired to use pure physical methods with high shear and high pressures. Sonication, ball or bead milling, grinding, and homogenization are some of the cell disruption techniques currently applied. Equipment selection depends very much on the type of organism and to some extent the physiology of the organism. Because algae is typically in the category of cells which are highly resistant to breakage, a device with high liquid shear gradients is required. One such economical device capable of operating at large scale is the classical bead mill. Often used for producing fine powders of minerals, clays, and pigments, the bead mill has been adapted to accommodate the biotechnology industry with cell disruption applications.
The unit consists of a horizontal or verticle cylinder filled with typically glass Ballotini balls. The beads are tumbled by rotating the agitator disks. The cells are broken by the high liquid shear gradients and collisions with the beads. A large number of small beads will be much more effective than a smaller volume of large beads. For this reason, it has been suggested that 0.5mm diameter glass beads are chosen for algal applications (Dyno-Mill).
In general increased bead loading increases cell breakage and protein release but also increases heat generation and power consumption. Heat production is the major problem associated with the use of bead mills for cellular protein extraction due to the potential denaturation of the product. Due to the large scale of this process, a piece of equipment with an embedded cooling system through the agitator shaft and impeller system is required. Other problems that cell disruption may impose include the release of acidic materials such as phenols, as well as degradative enzymes known as proteases. Buffers with pH around 6.5-7.2 should be used to maintain optimal pH levels . The buffers should also contain inhibitors and reducing agents such as ascorbate and thiols to prevent the accumulation of quinines and hence the inactivation of enzymes during extraction.
38

Bead Mill Design
In order to proceed with the cell disruption of the remaining 34000 Liters (66% of fermentation volume removed with the first centrifugation) in a timely manner of 24hours, more than one bead mill will be required. The cells need to be agitated through the glass beads for 60min in order to successfully achieve the desired level of protein extraction. Using bead mills with a 305 Liter capacity, this will require 5 units each ran 22 times a day. We have recommended the 316L stainless steel Dyno-Mill MULTI-PILOT bead mill equipped with 0.5mm glass beads. Used extensively for “no pressure” cell disruption of algae cells, this system keeps process temperature to as low as 4 degrees Celsius with yields approaching 100%. It is also possible to avoid air entrapment and utilize a standard CIP with the use of this machine (Dyno-Mill). This system also requires only one pass to effectively rupture the cells. The specifications of the bead mills are given below in Table 22.
Table 22: Bead Mill SpecificationsBead Mill Capacity 305 LitersAgitation Speed 5000rpmFlow Rate 70L/minFill Time 4.5 minMill Time 60 minTotal Time to Complete all 34,000L of Harvested Cells (One Batch) 24 hoursRequired Number of Units 5Runs per Fermentation Batch in Required 24 hours 22
The cells isolated from the fermentation broth with the first centrifuge will be transferred to a 1906 Liter 316L stainless steel holding tank. The holding tank will serve as both a cell resuspender and mixer for the buffer solution required. The buffer solution will be pumped in from a 381 Liter 316L stainless steel holding tank and mixed with the algae cells. The prepared cell solution will then be pumped from the holding tank at a flow rate of 350L/min. This stream will ultimately be split into five separate flows each of 70L/min and dispensed into the five required bead mills. The Dyno-Mill units are equipped with a PLC controller unit which will maintain flow rates coming into the mills as well as temperature and pH of the disrupted contents. The disrupted cells and their contents will then be pumped to the second centrifuge to begin the purification process. The diagram below in Figure 11 represents the equipment required and the proposed process connections.
39

Figure 11: Bead Mill P&ID
40
Alternative System: Microfluidizer
Research has suggested that the algae strain we have chosen lacks a cell wall (reference required here). This is unusual for algae and may result in a more fragile cell. If this is the case, we may be able to use a less aggressive system for cell rupture. Although high-pressure homogenizer systems have a better processing rate (1600 gallon per hour) compared to microfluidizer (540 gallon per hour), little information is available for the process. Moreover, microfluidizers systems require less power (200hp) than high-pressure systems (250 hp). Thus, given that it is more efficient and that more literature is available for the disruption process, amicrofluidizer is the process of choice for the less aggressive, alternative system.
In microfluidizers, cell samples are placed in two 100-µm-diameter channels, at high velocity. The two streams then collide head-on, then combine and turn 90º to exit as one stream. When the streams collide it generates the highest shear rates. Typical rupture rates vary from 90-99% and from 1-5 passes. Microfluidizers lyse cells by three different mechanisms: high liquid shear in the nozzle, large shear upon collision and impingement on entry to the nozzle area. Typical rupture rates will vary from 90-99% and from 1-5 passes.
This shearing process inherently will produce heat. Calculations in Appendix B show that the temperature change will be 6ºC after the cell solution is put through the microfluidizer. For this reason, tubular heat exchangers (provided by microfluidizer corp.) will be needed to stabilize the temperature.
For E. coli, the industrial standard for the microfluidizer pressure is 11,000 psi and 1 pass to lyse 90% of the cells. Given that no literature is available for algae cells, the estimated operating pressure for the microfluidizer is 40,000 psi. At this pressure, a single pass will lyse at minimum 99.98% of the cells. However, due to safety considerations, the microfluizer will be operated at 20,000 psi, producing a single pass lysing of 99.68%. Additionally, operating conditions for the microfluidizer are described in Table 23 along with the accompanying equipment in Table 24. Figure 12 shows the P&ID of the microfluidizer being used.
As seen from the diagram, the brand of microfluidizer used is the M-610 system manufactured by Microfluidic Corp. It was chosen because the system includes operator controls, sensors, highly resistant pumps and fittings, and an inherent CIP system. Moreover, the maximum operating pressure of the microfluidizer is 40,000 psi, with a single pass percent rupture of 99.98% thus this machine meets our desired operating conditions which are listed in Table 23 below.
41

Table 23: Microfluidizer Operating ConditionsOperating Condition Protein A affinity ColumnPressure 20,000 psiPasses 1Percent rupture 99.68%Process temperature 30 ºCFlow rate (cell suspension) 35 L/minHeat generated by shear 64.3 Watts Flow rate in of cold water 92.3 L/minTemperature water in 0 ºCTemperature water out 15 ºCTime to transfer heat 261 seconds
Table 24: Description of Microfluidizer equipmentMaterials | StandardMaterials of construction for wetted parts.
316 stainless steel, alumina, ultra high molecular weight polyethylene, Teflon, Polyetheretherketone (PEEK), 17.4 pH stainless steel, Nitronic 60, 15.5 pH, 15.5 pH stainless steel
Pumps Highly durable intensifier pumping systemSeals and valve High pressure Fittings Coned
Optional (included by company)Outlet heat exchanger 1 m2 surface area tube plate heat exchangerCIP 0 ºCTemperature water out 15 ºCTime to transfer heat 261 secondsSource: Microfluidics corp.
42
Legend MeaningPumps CentrifugalValves Diaphragm ValvesTCE Temperature control elementPCE Pressure control element
Figure 12: P & ID for Microfluidizer
Intermediate Purification: Protein A
Affinity column chromatography is one of the most efficient and most specific ways to separate monoclonal antibodies from a solution. Affinity chromatography is a separation technique based on non-covalent binding between the specific immobilized ligand (protein A in this case) and the target molecule (bevacizumab in this case). This makes affinity chromatography highly specific, like a key for its lock, and can separate mAbs from other proteins. Thus, under binding conditions the target mAb will bind to the ligand, protein A, while all the other unwanted components, including other proteins, will not bind and completely flow through the column.
Protein A affinity chromatography is highly effective when purifying antibodies. Protein A columns can have recovery rates higher than 90% and can increase the concentration of the mAb by more than 60-fold. Protein A affinity chromatography is also an effective step for virus removal. Though there are many benefits to using the Protein A affinity column such as high throughput and purity, the downsides to using this technique include the high cost and lack of separation of properly and improperly modified mAbs. This means that an additional step is necessary to separate the properly and improperly modified mAbs. This can be done using gel
43
filtrations chromatography. Another downside to using protein A is that there is a low probability for protein A to leak into the eluted product. Any protein A leakage will be removed by the ion exchange columns that are in place after the protein A affinity columns.
The affinity chromatography step will consist of two identical columns operated under identical conditions in parallel. Two columns will be used instead of one in order to maintain a smaller height and therefore a lower pressure drop along the column. The protein A affinity column is operated by first loading the incoming protein solution from the second centrifuge onto the column. The mAb will bind to the protein A while everything else in the protein solution will not bind but continue through the column and exit the column as waste. Then the column is washed with tris-HCl buffer to wash away any excess protein or components that did not bind to the column. The mAb is then eluted using 0.1 M sodium citrate and continues on to the ion exchange columns. A sampling probe will also be utilized to extract samples every 6 hours during the Protein A recovery step. The recovery rate is estimated at 95%. The details of operating conditions are explained in Table 25 along with the P&ID drawing (see Figure 13). The additional equipment involved for this step is also described in Table 26.
Table 25: Operating Conditions for Each Affinity Column.Operation Condition Protein A affinity ColumnResin Affi-prep Protein A from Bio-Rad The
matrix used is a pressure stable polymer.Schedule to replace resin Resin will be replaced by fresh resin
every 36 cycles.Media flow rate 11 L/minNumber of identical columns run in series 2Dimensions of each column: diameter, bed height, column volume
Diameter = 1.80 metersHeight = 0.61 metersVolume = 1540 liters
Binding capacity 12 mg mAb per 1 mL of resinVolume of resin needed in column 810 L per columnLoad time 120 minutesLoad flow rate 11 L/minCycle time 7 hoursCross section area of each column 2.16 m2
Wash solution and pH 0.1M Tris-HCl. pH = 8.0Wash time 120 minutesWash volume 2,500 LWash flow rate 20.8 L/minElution media 0.1 M Sodium CitrateElution pH pH 3.65 0.05. Adsorption reading at
280 nm.* Elute time 120 minutesElution volume 2,500 LElution flow rate 20.8 L/minNumber of cycles 36 cycles per year
44
Resin Particle Diameter 64 ± 19 µm**
Recovery 95%Incoming mAb concentration 0.006 mg/mLOutgoing mAb concentration 7.018mg/mLEluted Protein Amount 17.54 kg mAb per cycleMaximum pressure resin can withstand 1,000 psi***
Operational Pressure Drop 310 psiAdsorption spectrophotometer equipped with LabView to monitor adsorption
Takes adsorption readings consistently at 280 nm.
* Subramanian, pg 16** Ryu, 1992.***Bio-Rad website.
Table 26: List of Equipment for Affinity ColumnsEquipment Material Dimensions PurposeAffinity Column
316L SS Diameter = 1.80 metersHeight = 0.61 metersVolume = 1540 liters
House protein A and incoming protein solution in the same place to allow for purification.
Holding Tank 316L SS 10,000 L. Diameter of 1.62m and height of 4.86m.
Hold the incoming protein solution from the second centrifuge.
Resin Affi-prep Protein A with pressure stable polymer matrix.
Capacity to capture mAb is 12 mg mAb per 1 mL of resin. The beads have a diameter of 64 ± 19 µm.*
Bind and capture only the desired mAb while letting everything else pass through the column.
0.1M Sodium Citrate Elutant Container
316L SS 10,000 L. Diameter of 1.62m and height of 4.86m.
Contain citrate elutant until it is needed to elute the mAb from the column.
Affi-prep Protein A Container
316L SS 2,000 L. Diameter of 0.92 meters and height of 2.76 meters.
Contain affi-prep protein A until it is needed to replace the old resin in the column.
Tris-HCl Buffer Container
316L SS 10,000 L. Diameter of 1.62m and height of 4.86m.
Contain wash buffer until it is needed to wash the column after it is loaded with protein solution.
Centrifugal Pump
316L SS Magnatex Pumps, ISO 9000 Control and apply flow rate of streams.
Piping 316L SS 2 inch inner diameter, 2.25 inch outer diameter.
Transport media in sterile manner.
Temperature probe
WQ101 Temperature Sensor Measure temperature.
Pressure Meter Extech Instruments Heavy Duty Pressure Meter
Measure pressure.
pH Probe PHR-212 Measure pH.Flow Meter Celcon PS601C Measure flow rate.
45
Diaphragm Valve
High-Purity Two-Way Diaphragm Valve EW-98613-56
Open or close flow.
Sampling Probe PFA 100 Probe Extract samples from column to perform scheduled tests on samples.
* (Ryu, 1991)
Figure 13: Adsorption Chromatography Columns P&ID
Final Polishing StepsIon exchange chromatography
Ion exchange chromatography is a rapid and inexpensive procedure that has been employed to purify antibodies from different species. This type of chromatography is useful for the isolation of antibodies that do not bind or bind weakly to Protein A. The method is based on the electrostatic interaction between the charged species on the column and the charged surface of the desired protein. The protein’s net charge can be used to predict the retention behavior of proteins on the ion exchange column and thus is the method of choice for purification of MAbs. In general, proteins follow three observable patterns: (1) will not be retained on ion-exchange columns at their pI because they have no net charge; (2) will be retained above their pI on anion-exchange columns because they have a net negative charge; (3) will be retained below their pI on cation exchange columns because they have a net positive charge. Though there are many benefits to using the ion exchange columns such as high media capacity, robustness, a variety of column choices and media, it also has constraints such as flow rate limitation (Kemp, 2004).
46

Cation Exchange ChromatographyOne cation exchange chromatography columns immediately follows gel filtration
separation and is use for capturing the remaining trace contaminants such as host cell protein and DNA residues from the protein A and gel filtration media. An additional purpose for using this type of column is to rid undesired proteins that are similar in weight to the desire protein, but was not captured in the gel filtration step. The typical contaminant clearance value for host cell protein (hcp) in this step is 1000 for every ng/ml while for DNA it is 1000 for every pg/ml (Kemp, 2004). Determined by Necina et al. (1993) the main ligand for cation exchange column is the sulfo group and for the anion exchange column it is the amino group. Given that most antibodies are basic proteins, pI >7,(Kemp, 2004) and the contaminants are acidic using a cation exchange column is appropriate. Here the desire proteins will bind to the column while the contaminants and unwanted proteins will not be retain and leave as waste. Before every run the column is sterilized with NaOH and regenerated with NaCl. Afterwards media from the gel filtraion column is loaded on the column and allowed to bind. The proteins are then eluded with a solution of .03M Na-Phosphate and .1M NaCl at pH 6.5. It is estimated that 95% of the proteins will be recovered. In addition, samples of the out coming effluent will be tested every 6 hours with a sampling probe. The cation exchange column utilized is fully described in Table , and is illustrated in Figure 8. Additional equipment involved in this recovery step are described in Table .
Anion Exchange ChromatographyTwo anion exchange chromatography columns operated identically in parallel will
immediately follow cation exchange separation and are used for capturing the remaining trace contaminants such as host cell protein and DNA residues from the protein media. Its main function is to remove the negatively charged contaminants. It also separates all protein A leakage products and removes small amount of oligomers from the antibody. Thus a large amount of host cell proteins (hcp) will be bound while the neutral antibodies are allowed to flow through. The typical contaminant clearance value for hcp removal is 10 for every ng/ml while for DNA it is 100 for every pg/ml (Kemp, 2004). At this step, the column is operated in the flow through mode (Kemp pg. 93). Given that most antibodies are basic proteins, pI >7, (Kemp, 2004) and the contaminants are acidic, using an anion exchange column is appropriate. In order to maintain high volumetric flow rates and to prevent bottlenecking, the column is required to have a minimum depth of approximately 10cm (Kemp, 2004, pg. 93). Determined by Necina et al. (1993) the main ligand for the anion exchange column is the amino group. The anion exchange column utilized is fully described in Table 7, and is illustrated in Figure 8. Additional equipment involved in this recovery step are described in Table 8.
The anion exchange column is operated by first loading the incoming protein solution from the protein A column onto the column. The contaminants will bind to the resin while the protein will flow through. Before every run the column is regenerated with NaCl followed by a NaOH wash. The mAb is then eluted using Na-Phosphate and NaCl solutions, pH 8.5. The recovery rate is estimated to be 95%. A sampling probe will also be utilized to extract samples every 6 hours during the anion exchange recovery step.
47

Table 7: Ion Exchange Operating ModulesCM- Hyper D Cation Exchange Chromatography
Mono Q Anion Exchange Chromatography (2)
Mass (kg) in per cycle 18.5 kg 8.77 kg
Mass (kg) out per cycle 17.5kg 8.3 kg
Recovery % .95 .95Bed volume 2769.95 L 4154.92 L
Bed height 0.95m 1.09 m
Bed diameter 1.92 m 2.19m
Concentration of protein in
6.67mg/mL 2.11mg/mL
Concentration of protein out
2.11mg/mL 0.33 mg/mL
Conductivity Ranges (AU)
4-10 4-6
Typical Buffer Media**
8309 L of 0.03M Na-Phosphate, 8309 L of 0.03M NaCl, pH 6.5
12.5L of 50mM Na-Phosphate, 12.5L of 1M NaCl pH 6.3*
Buffer time 280 min 280 minElution Buffer 8309 L of 0.03 M Na-Phosphate
containing 8309 L of 1M NaCl, pH 6.5
12.5L of 0.03 M Na-Phosphate containing 12.5L of 1M NaCl, pH 8.5
Elution flow rate 9.89 L/min 14.84L/min
Elution Time 280 min 280 min
Volumetric flow rate 0.0099 m^3 /min 0.014m^3/min
Resin type Fractogel EMD SE Hicap(M) beads Q-Sepharose, Preswollen in 20% ethanol
Resin pore size 800 A ~4,000,000 Da exclusion limitResin particle size 90 um 45 μm (wet)Resin binding capacity 36mg of mAb mg/mL 30mg of mAb/mLResin storage temperature
NA 2-8°C
Particle size distribution
NA Not less than 95% than within 45 and 165 microns
Regeneration buffer 1-2 CV( or 2769L) of 1-2 M of NaCL
1-2 CV ( or 8309 L) of 1-2MNaCl followed by 1 CV ( or 8309 L ) of .1M NaOH in 8309L .5 MNaCL
Sanitization 2729L of .1-.5 M NaOH 8309L of.1-.5 M NaOHSanitization Flow rate 9.89L/min 14.84 L/minResin usage Needs to replace every 56 cycles Needs to be replaced every 20
cyclesRegenerate time 280 min 280 minResin Regeneration 1832.07mL/min 1044.23 mL/min
48

flow rate Resin Volume 512978.4 mL 292397.7 mL
Linear gradient flow rate
9.892659 L/min 14.83899 L/min
*Column outer diameter
2.49m 2.85 m
*Column inner diameter
1.91m 2.19m
*Column height 1.24 m 1.42 m
*Column Volume 3600.93 L 5401.40 L
Absorbance 280 nm 280nm Number of cycles 36 cycles per year 36 cycles per yearCycle time 14 hr 14 hrpH condition range 1-13 2-12Column Pressure drop limit
8 bar 1000 psi
Actual estimated Pressure drop of column
5.47 bar 455.32 psi
Source: Sigma-Aldrich website, Subramanian, http://www.merck.de/servlet/PB/show/1225330/w214154_Fracotgel_WF.pdf* taken to be 30% bigger than bed dimensions
Table 8. Additional Equipment for the Cation and Anion Exchange Column and their Dimensions
Material Dimension PurposePump 316L The pump removes solvents from the
elution, buffer, or regenerating tanks and delivers it to the anion exchange column at the appropriate flow rate
Na-Phosphate tank -5000L
316L Diameter: 1.289m; Height: 3.86m
Solvent used for the buffer and elution media for the cation and anion exchange columns
NaOH tank-5000L
316L Diameter: 1.289m; Height: 3.86m
Solvent used for regenerating the anion column. Also use as a media for sanitizing the cation exchange columns
NaCl tank-5000L
316L Diameter: 1.289m; Height: 3.86m
Solvent used for regenerating both the cation and anion column. Also used in the buffer and elution media for the anion and cation exchange columns
Elution buffer tank for cation- 10,000L
316L Diameter: 1.62m, Height: 3.25m
It is also used for eluding the bound proteins from the cation exchange columns.
Elution 316L Diameter: 1.62m, Used for eluding the bound contaminants
49
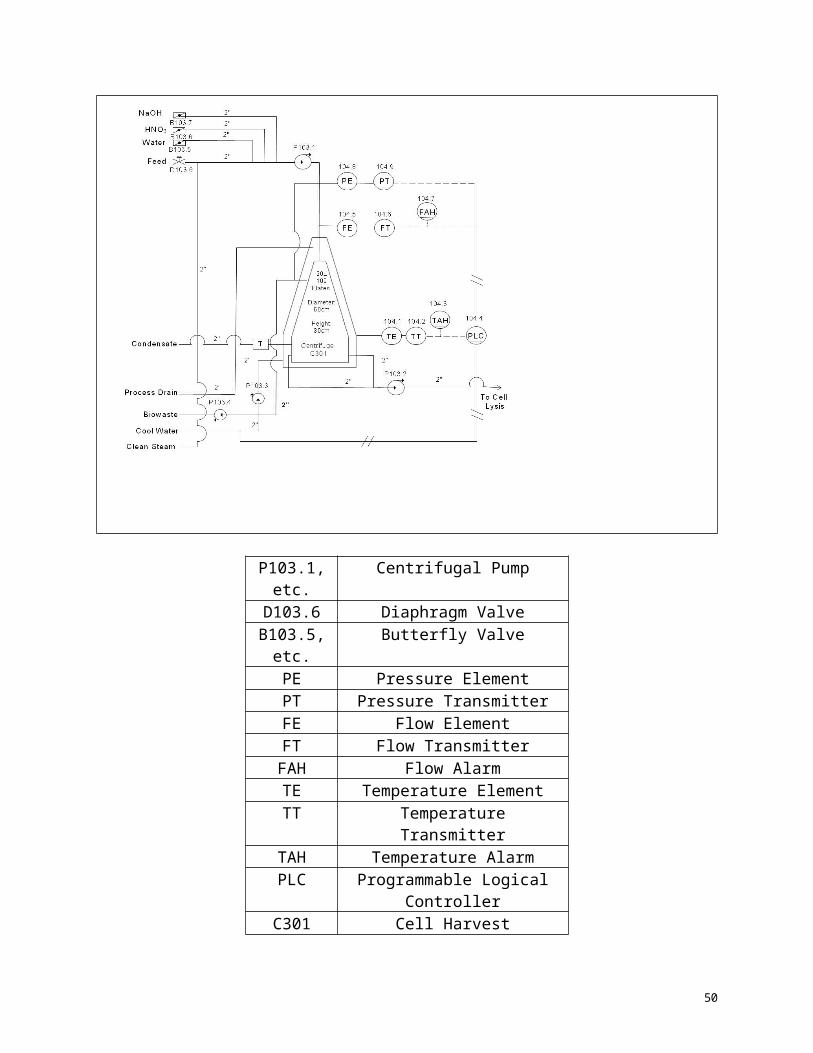
buffer tank for anion- 10,000L
Height: 3.25m from the anion column. The contaminants will leave the column and go to a waste tank.
Buffer tank for anion exchange columns-10,000L
316L Diameter: 1.62m, Height: 3.25m
Use to maintain the appropriate pH
Buffer tank for cation exchange columns-10,000L
316L Diameter: 1.62m, Height: 3.25m
Use to maintain the appropriate pH
Regeneration tank- 10,000L
316L Diameter: 1.62m, Height: 3.25m
Use to regenerate the column so that the contaminant from the incoming influent stream will bind to the column
Air vent 316L To remove air from the highest point of a coil or piping assembly
Valves 316L Use to monitor and control amount of fluid leaving and entering
Sample Probes
Use to check the media in and leaving the anion and cation exchange column
UV and conductivity monitor
Monitor the absorbance (at 280nm) and conductance of the product leaving the effluent stream.
Pressure gauge
Use to monitor the pressure of the influent
Air Vent For air bubbles or bypassPiping 1.5 inch
Inner Diameter: 1.5 inchOuter Diameter: 1.37 inch
Transport media from one location to another
50
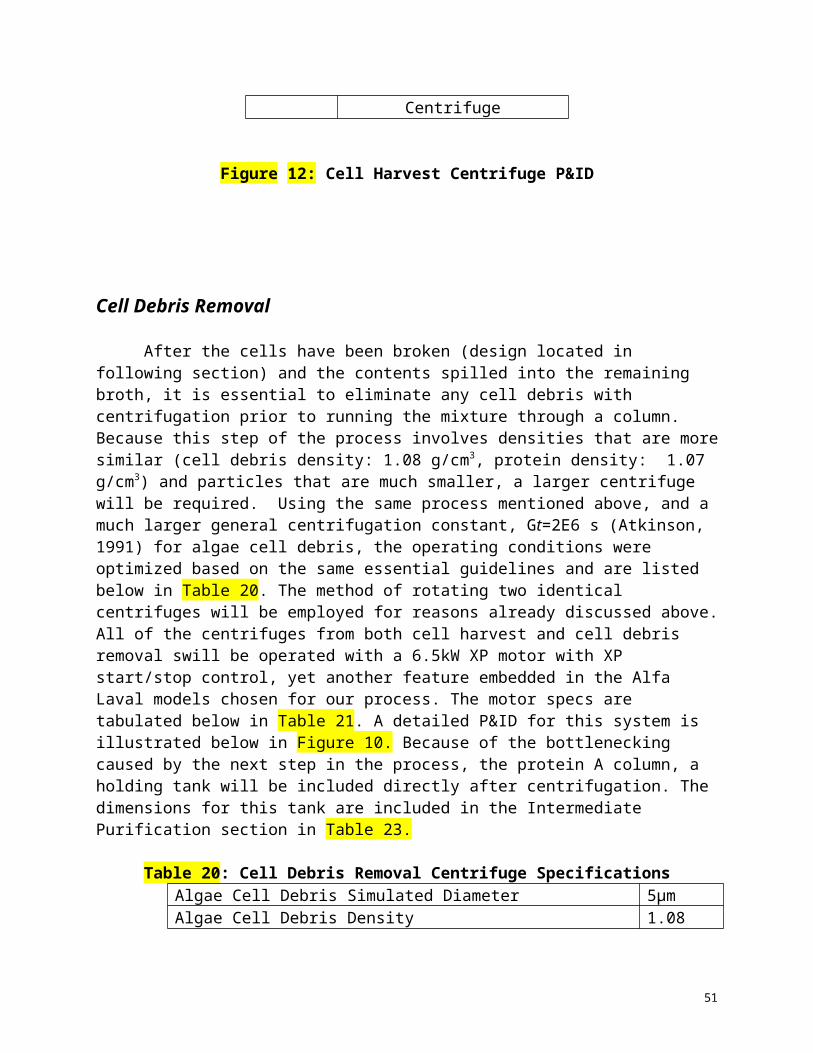
Figure 8. P&ID of Cation and Anion Exchange Columns
51

Downstream CIP/SIP Systems__________________________
For the downstream process, the same multi-use cleaning system that was used to clean the upstream units will be utilized. The figure of the multi-use cleaning system is available in part 2 of the project. Again cleaning reagents are dispersed through the circuits for different intervals of time at varying temperatures. The specifications for the CIP/SIP systems are described in Table 29. A typical cleaning schedule for our system is illustrated in Table 30.
The water for injection is used to supply the water necessary in the CIP and SIP systems. Combined, these processes required 54,520 L of WFI. Before using the water, it first needs to be sterilized. The water is carbon filtered and then undergoes reverse osmosis. The reverse osmosis membrane captures ions, microbes, endotoxins, and other small contaminants (Lyderson, pg. 548).
52
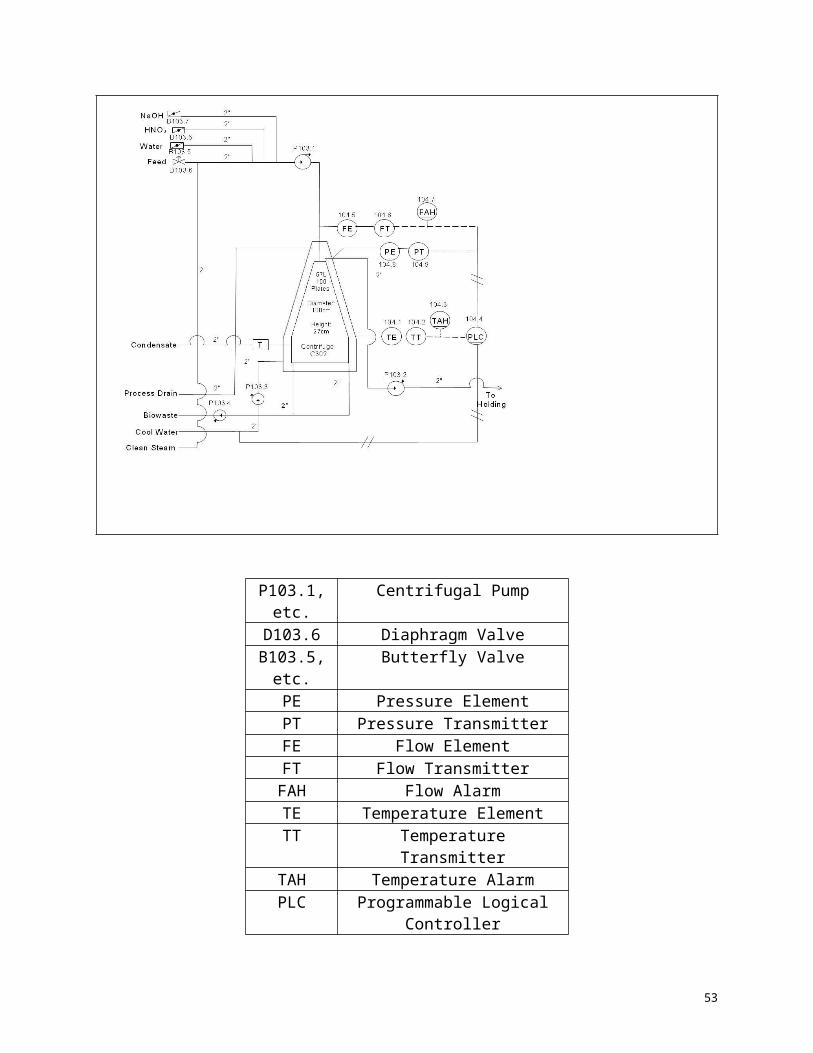
Table 29: CIP/SIP Specifications for Downstream Processing
Material Description DimensionScavenge Return Pump The return pump pumps the fluids out of the
clean process equipment, and either returns it to the CIP unit (recycling) or pumps it directly to the drainage system.
Double Pipe Heat exchanger The built-in heating elements heat the fluid to a specified temperature.
Piping 316L SS Use to connect equipment to one another 1.5 inchSodium hydrochlorite 10000L tank
316L SS Detergent for CIP. Use to id media and algae residues
Diameter: 1.62m, Height: 4.86m
Water tank 10000L 316L SS For multiple cleaning and solution preparation purposes.
Diameter: 1.62m, Height: 4.86m
Sodium hydroxide 10000L 316L SS Chemical for cell disruptor. Diameter: 1.62m, Height: 4.86m
Sodium hydrochloride 10000L 316L SS Chemical for cell disruptor. Diameter: 1.62m, Height: 4.86m
Acetone 100L 316L SS Chemical for centrifuge. Diameter: 0.34, Height: 1.05
H3PO4 10000L 316L SS Protein A Column Diameter: 1.62m, Height: 4.86m
Guanidine hydrochloride10000L 316L SS Protein A Column Diameter: 1.62m, Height: 4.86m
C2H6O10000L 316L SS Ion Exchange Column Diameter: 1.62m, Height: 4.86m
0.05 M CH2O2 in 40% C2H6O and 60% H2010000L
316L SS Ion Exchange Column Diameter: 1.62m, Height: 4.86m
0.2 NaH2PO4 + 0.3 M CH3COONa10000L
316L SS Ion Exchange Column Diameter: 1.62m, Height: 4.86m
Water 10000L tank 316L SS Water comes from WFI . Use for cleaning and for buffer media
with Diameter: 1.62m, Height: 4.86m
Sodium hydroxide 10,000L tank 316L SS Second solvent used for cleaning purposes with Diameter: 1.62m, Height:
53

4.86mControl valves Use to monitor and control amount of fluid
leaving and entering Cold Water Supply tank (3000L) 316L SS Supply the system with cool to cold water with Diameter:
1.08m, Height: 3.25m
Steam Supply tank (3000L) 316L SS Supply heat exchanger with steam with Diameter: 1.08m, Height: 3.25m
Condensate Return box (200L) 316L SS Return the collected condensate amount to heat exchanger
with Diameter: .4m, Height: 1.3m
Pressure relief valve Use to protect system’s pressure vessels
Duplex Filter Filter steam from heat exchangerPLC (include software and printer) Built-in PLC unit with an operating panel.
Placed in the control room.The PLC is programmed individually for each cleaning task. Each task is fully documented by a laser printer.
Sample probe Use to check the detergent and buffer mediaPositive Displacement Pump Use for injecting chemicals through an the
pipeline system at precise rates.CIP pump The frequency controlled supply pump
builds up the pressure to the spray nozzle and washing spear, that is fitted in the process equipment to be cleaned.
Supply Vessels 316L SS Holds the cleaning reagent and or water for the unit to be clean
Compressed Air Filtered compressed air purge system ejects residual water from the lines.
WFI Carbon Filter Water scrub unit, Model: WSU1000P 60gpm capacity
WFI Reverse Osmosis Membrane Osmonics, Model: M-CB4040AD 4gpm capacity1.0µm rating
Sources: ACCompacting, MorkUSA, LHS Company(Note: Assume 3:1 Height to Diameter ratio for Tank dimensions)
Table 30: Typical Cleaning Schedule(Note: An air blow step occurs in between each of the cleaning step)Equipment Operation Flow
rateAmount Time Temperature Pressure
Cell disruptor
Water Rinse 38 L/min 760 L 15-20 min
Ambient 2-8 bar (water feeding)
Sodium hydroxide wash
38 L/min 15.048 of NaOH +
15-20 min
Ambient to 75 ºC
54
(0.1, ) 135.4 gal of water
Water Rinse 38 L/min 570L or 150.48 gal
5-15 min
Ambient 2-8 bar (water feeding pressure)
Sodium hydrochloride wash
38 L/min 15.048 gal of Sodium Hydrochlorite + 135.43 gal of water
15-20 min
Ambient to 75 ºC
Water Rinse 38 L/min 380 L or 100.32 gal
5-10 min
Ambient 2-8 bar (water feeding pressure)
Purged/Drainage 38 L/min ----- 10-15 min
------
Steam sterilized 130 lb/hr 43 lb 5-20 min
Ambient to 100C
3-5 bar
Centrifuge (first step)
Water rinse 10 L/min 10L 1 min 100 ºC 2-8 bar (water feeding)
Water flood 10 L/min 10L 1 min 100 ºC 2-8 bar (water feeding)
Water rinse 10 L/min 6L 0.6 min Ambient 2-8 bar (water feeding)
Acetone flood 10 L/min 5L 0.5 min Ambient 2-8 bar (water feeding)
Water rinse 10 L/min 40L 4 min 100 ºC 2-8 bar (water feeding)
Centrifuge (2nd step)
Water rinse 10 L/min 40L 4 min 100 ºC 2-8 bar (water feeding)
Water flood 10 L/min 40L 4 min 100 ºC 2-8 bar (water feeding)
Water rinse 10 L/min 30L 3 min Ambient 2-8 bar (water feeding)
55
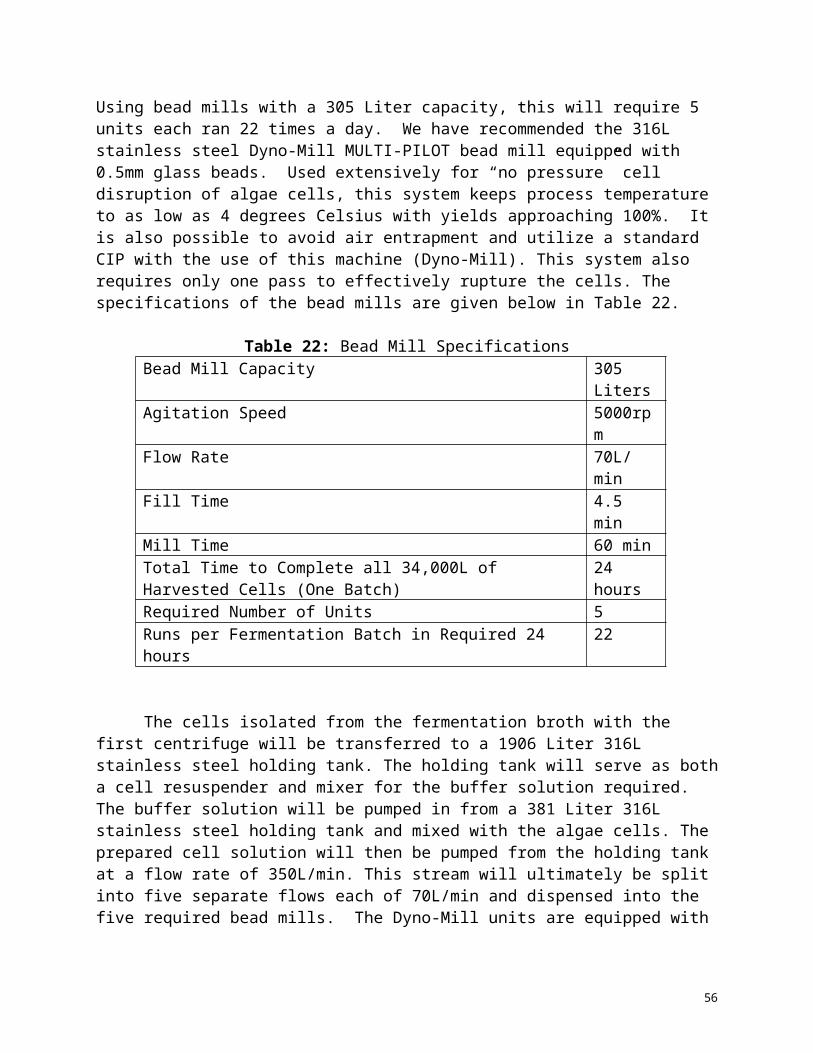
Acetone flood 10 L/min 25L 2.5 min Ambient 2-8 bar (water feeding)
Water rinse 10 L/min 40L 4 min 100 ºC 2-8 bar (water feeding)
All 1000L tanks-ie Holding Tank, Elution tank, Regeneration tank, Buffer tank, Citrate tank, Tris-HCL tank
Water Rinse 38 L/min 760 L 15-20 min
Ambient 2-8 bar (water feeding)
Sodium hydroxide wash (0.1, )
38 L/min 15.048 of NaOH + 135.4 gal of water
15-20 min
Ambient to 75 ºC
Water Rinse 38 L/min 570L or 150.48 gal
5-15 min
Ambient 2-8 bar (water feeding pressure)
Sodium hydrochloride wash
38 L/min 15.048 gal of Sodium Hydrochlorite + 135.43 gal of water
15-20 min
Ambient to 75 ºC
Water Rinse 38 L/min 380 L or 100.32 gal
5-10 min
Ambient 2-8 bar (water feeding pressure)
Purged/Drainage 38 L/min ----- 10-15 min
------
All 5000L tank- NaCl tank, NaOH
Water Rinse 38 L/min 760 L 15-20 min
Ambient 2-8 bar (water feeding)
56
tank, Na-P tank
Sodium hydroxide wash (0.1, )
38 L/min 15.048 of NaOH + 135.4 gal of water
15-20 min
Ambient to 75 ºC
Water Rinse 38 L/min 570L or 150.48 gal
5-15 min
Ambient 2-8 bar (water feeding pressure)
Sodium hydrochloride wash
38 L/min 15.048 gal of Sodium Hydrochlorite + 135.43 of water
15-20 min
Ambient to 75 ºC
Water Rinse 38 L/min 380 L or 100.32 gal
5-10 min
Ambient 2-8 bar (water feeding pressure)
Purged/Drainage 38 L/min ----- 10-15 min
------
2000L Affinity Prep Protein A container
Water Rinse 38 L/min 760 L 15-20 min
Ambient 2-8 bar (water feeding)
Sodium hydroxide wash (0.1, )
38 L/min 15.048 of NaOH + 135.4 gal of water
15-20 min
Ambient to 75 ºC
Water Rinse 38 L/min 570L or 150.48 gal
5-15 min
Ambient 2-8 bar (water feeding pressure)
Sodium hydrochloride wash
38 L/min 15.048 gal of Sodium Hydrochlorite + 135.43 of water
15-20 min
Ambient to 75 ºC
Water Rinse 38 L/min 380 L or 5-10 Ambient 2-8 bar
57

100.32 gal min (water feeding pressure)
Purged/Drainage 38 L/min ----- 10-15 min
------
Protein A Column
Acid wash- H3PO4, pH 1.5
64 L/min 7700L 15-20 min
Ambient 2-8 bar (water feeding)
Water flood-4-6 M Guanidine hydrochloride
22 L/min 7700L 15-20 min
Ambient 2-8 bar (water feeding)
Storage - C2H6O 22 L/min 3080L 15-20 min
Ambient 2-8 bar (water feeding)
Ion Exchange Column
Cleaning-0.05 M CH2O2 in 40% C2H6O and 60% H20
22 L/min 21,000L 15-20 min
Ambient 2-8 bar (water feeding)
Water wash- H20
22 L/min 21,000L 5-10 min
Ambient 2-8 bar (water feeding)
Conditioning-0.2 NaH2PO4 + 0.3 M CH3COONa
22 L/min 21,000L 15-20 min
Ambient 2-8 bar (water feeding)
Salt removal- H20
22 L/min 21,000L 5-10 min
Ambient 2-8 bar (water feeding)
Non-specific saturation- Gelatin
22 L/min 1400L 15-20 min
Ambient 2-8 bar (water feeding)
Cost Analysis of Downstream Process Design
The five sections of the downstream processing include: centrifugation, cell disruption, another centrifugation step, two protein A affinity columns operated in parallel, a gel filtration
58

column, a cation exchange column, and two anion exchange chromatography columns operated in parallel. The cost associated with both installation, maintenance, and operation of each section have been determined and listed in the following tables. The final yearly operational cost of the downstream side of the process sums up to be $ 14.1 Million, while the one time start up cost is estimated to be $10.3 Million. This cost does not take into account employees compensation or building costs. This cost also does not yet include the cost of the gel filtration column.
Cell Harvest : Centrifugation
Table 31: Fixed Capitol Costs for Cell Harvest CentrifugationItem Quantity Unit
CostTotal Cost
BRPX617SFV, 20L, 8000rpm, 60cm Diameter 2 $500,500 $1,001,031Diaphragm Valve 2 $449 $898
Butterfly Valves (CIP) 6 $300 $1,800Centrifugal Pump 8 $3,000 $24,000
Process Piping (20% of major equipment cost, Atkinson 1991)
__ __ $200,206
Installation (25% of major equipment, Atkinson, 1991) __ __ $250,258
Validation (20% of major equipment, Atkinson, 1991) __ __ $200,206
Shipping (40% of major equipment cost, Atkinson, 1991) __ __ $400,000
Total Capitol Investment for Cell Harvest Centrifugation
$2.1 million
Table 32:Yearly Operational Cost for Cell Harvest CentrifugationItem Quantity per Year Unit Cost Total
CostMaintenance 2 3% of Capitol Investment
(Atkinson, 1991)$45,000
Cooling Water 100,000L, 36 times per year: 3,600,000L
$0.50 per Liter $1,800
Biological Waste Treatment
66% of 100,000L, 36 times per year: 2.4million Litres
$0.20/100L $4783
Steam Sterilization 500tonne $15/tonne $7500Energy Consumption 35,840 kWh $0.09/kWh $3226
59

Total Yearly Operational Costs
$62,310
Cell disruption
Table 33: Capitol Costs for Bead Mill OperationItem Unit
CostQuantity Total Cost
316L s.s. Dyno-Mill MULTI-PILOT305 Liter , 5000rpm, 70L/min
$229,000 5 $1.15 million
316L Buffer Solution Holding Tank, 381 Liter $900 1 $900316L Mixing Tank, 1906 Liter $4000 1 $4000
Installation Costs (25% major equipment cost, Atkinson, 1991))
__ __ $286,000
Process Piping (20% of major equipment cost, Atkinson, 1991)
__ __ $230,000
Splitters $100 7 $700Diaphragm Valve $449 4 $1,800Centrifugal Pump $3,000 7 $31,000
Shipping (40% of major equipment, Atkinson, 1991) __ __ $460,000
Validation (up to 20% of major equipment, Atkinson, 1991)
__ __ $230,000
Total Fixed Capitol Costs for Bead Mill $2.4 million
Table 34: Yearly Operational Costs for Bead Mill OperationItem Unit Cost Quantity per Year Total
CostMaintenance 3% of Capitol
Investment, Atkinson, 1991
2 $72,000
Cooling Water $0.50 per Liter $34,000L, 36 times per year: 1.2 million liters
$612,000
Buffer Solution (plus reducing agents and
inhibitors)
$3.00 per liter $8,400 L. 36 times per year: 302,400 liters
$907,200
Energy Consumption $0.09/kWh 40,000 kWh $3,600Total Yearly Operational
Costs for Bead Mill$1.6 million
60
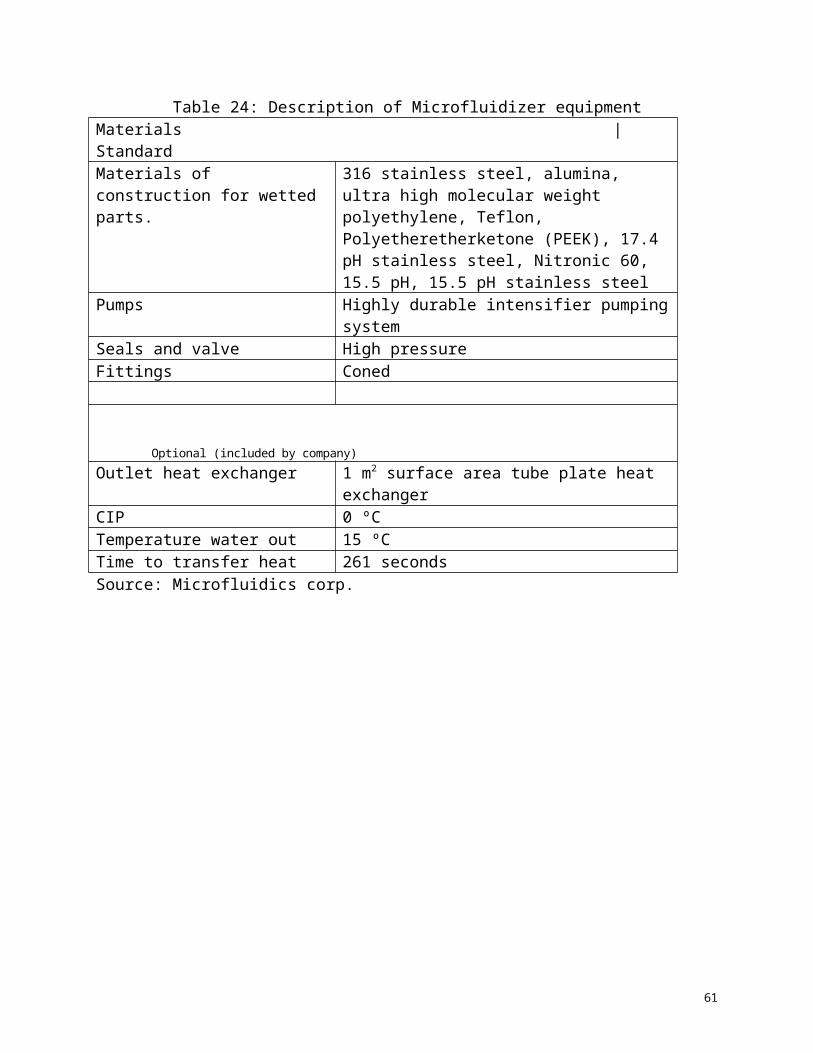
If the lack of cell wall on our algae strain results in easy cell rupture, an alternative , more cost effective Microfluidizer system can be used instead. Homogenizers were priced around $278,000 in 1986. This equipment, adjusted for 3% annual inflation, will cost approximately $500,000 in 2006. Because the microfluidizer system includes the control elements, programmable logic controllers, and heat exchanger, the cost analysis for cell disruption will not require the addition of these elements. The only additional cost associated with this system is the cost of electricity and the cost for running the heat exchanger, which was estimated to annually cost $19000 and $4000, respectively. For calculating total capitol investment as well as selling price required, we will use the more costly bead mill system to ensure proper budgeting.
Cell Debris Removal: Centrifugation
Table 35: One Time Costs for Cell Debris Removal CentrifugationItem Quantity Unit Cost Total Cost
BRPX617SFV, 57L, 9,000rpm, 100cm Diameter 2 $1,430,044 $2,860,088Diaphragm Valve 2 $449 $898
Butterfly Valve (CIP) 6 $300 $1,800Centrifugal Pump 8 $3,000 $24,000
Process Piping (20% of major equipment, Atkinson, 1991) __ __ $572,018
Installation (25% of major equipment , Atkinson, 1991) __ __ $715,022
Shipping (40% of major equipment, Atkinson, 1991) __ __ $1.2 million
Valladation (20% of major equipment, Atkinson, 1991) __ __ $580,000
Total Fixed Capitol Costs for Cell Debris Removal Centrifugation
$6.0 million
Table 36 :Yearly Operational Cost for Cell Debris Removal CentrifugationItem Quantity per Year Unit Cost Total
CostMaintenance 2 3% of Capitol Investment
(Atkinson, 1991)$126,000
Cooling Water 100,000L, 36 times per year: 3,600,000L
$0.50 per Liter $1,800
Biological Waste Treatment
5% of 100,000L, 36 times per year: 180,000 Litres
$0.20/100L $360
Steam Sterilization 500tonne $15/tonne $7500Energy Consumption 35,840 kWh $0.09/kWh $3226
61

Total Yearly Operational Costs
$138,886
Affinity Column
Table 37: Cost of Equipment and Operation of Affinity Column.Equipment Units Needed Cost per unitAffinity Column Shell 2 Columns $8,032.55*
Holding Tank 1 $20,855.36*
Resin 1540 L per year $6,000 per liter of affi-prep protein A**
Tris-HCl 180,000 L per year
$1.47 per liter***
Sodium Citrate 180,000 L per year
$0.08 per liter****
Adsorption spectrophotometer equipped with LabView to monitor adsorption
2 $5,000
Centrifugal Pump 1 $707.28Motor for Pump 1 $1850Pressure Meter 2 $500 per meterTemperature probe 2 $260 per probepH Probe 2 $550 per probeFlow Meter 2 $125 per meterTris-HCl Buffer Container 1 $20,855.36*
Sodium Citrate Elutant Container
1 $20,855.36*
Affi-prep Protein A Container 1 $9,177.89*
Diaphragm Valve 12 $449.30 per valveDiaphragm Membranes 48 per year $100 per membraneSampling Probe 2 $1095.00 per probePiping (20% of major equipment)
$32,000
Maintenance (3% of capital costs)
$5,000
Installation (25% of major equipment)
$40,000
Total Fixed Capital Costs $162,320.00Total Annual Operational Cost
$9.5 Million
* (Seider, 2004)** (Harrison, pg. 367)***(Bio-Rad website)****(Sigma-Aldrich website)
62
Cation Exchange Columns
Table 14. Cost of Cation Exchange ColumnEquipment Type Quantity Cost (for each) Total costResin (replace every 56 cycles)
Fractogel EMD SE Hicap(M) beads
512978.4 mL
$445.49 for 500 mL
$457053.5
Column Cation 1 $374,000 $374,000Membranes for valves
28 $100 each $2800
Elution Buffer tank
10,000L; 316L 1 $20,000 $20,000
Buffer tank 10,000L; 316L 1 $20,000 $20,000Computer Program Software (ie Lab view)
1 $4095.0 $8190
UV and Conductivity monitor
PC 1 $2105 $4210
Sample probes PFA 100 1 $1095 $6579Pumps Diaphragm
1 $5000 each $5000
Valves High Purity Two Way diaphragm Valve- EV-98613-56
7 $449.30 $3143
Pressure gauge High-accuracy digital test gauge, 0 to 30" Hg range EW-68330-00
1 $800.0 $800.0
Electricity 856 kW* .8 cent per kW
$68.48 per cycle
316L Piping (1.5 in)
Estimated to be 20% of major equipment
$ 18000
NaOH cost 5538 L $63.78 per 18L $ 2211.04 per cycle
NaCl cost 19387 L $81.70 per 300mL $45316.67 per cycle
63
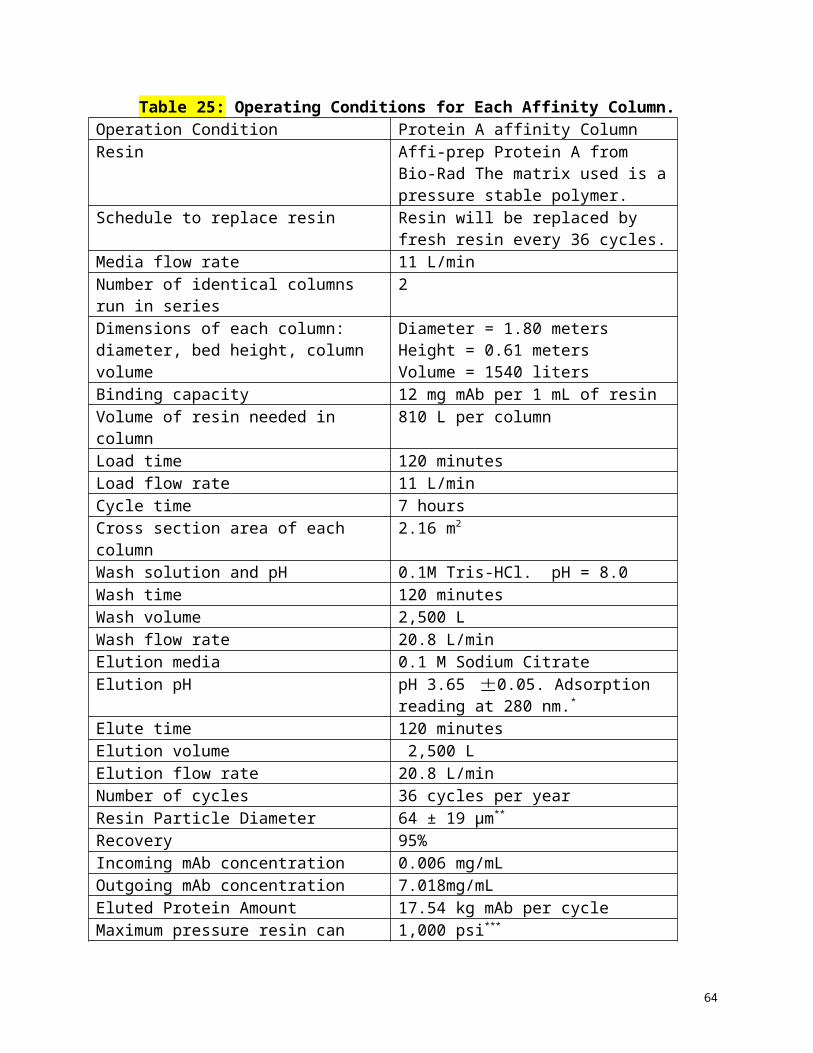
Na-Phosphate 16618 L $51.0 for 2.5kg $ 16972.8 per cycle
Motor for Pump 32" Commerical Mower with 10.5 B&S Engine 1
$1849.95 $1859.95
Pressure Release At pump 6- come with pump
$0 $0
Conductivity Cell 1 $5000 $5000UV Cell 1 $5000 $5000Direct Soft PLC software
1 $395.0 each $790
PLC controller 2 $1095.0 $2190STV Sanders Pressure relief valve
1 $1573.0 $3146
Maintenance Estimated to be 3% of major equipment
$2700 per year
Installation Estimated to be 25% of major equipment
$22500
Shipping Estimated to 40% of major equipment
$36000
Validation Estimated to be 20% of major equipment
$18000
Total Fixed Capital Costs
.54 Million
Total operational cost
7.5 Million
Anion Exchange ColumnsTable 14. Cost of Anion Exchange ColumnsEquipment Type Quantity Cost (for each) Total costResin (replace every 20 cycles)
Q-Sepharose, Preswollen in 20% ethanol
555666.67 mL per column
$383.50 for 500mL
$852392.66
Column Anion 2 $254,000 $508,000Membranes for valves
72 $100 each $7200
Regeneration Buffer tank
10,000L; 316L 1 $20,000 $20,000
Elution Buffer 10,000L; 316L 1 $20,000 $20,000
64
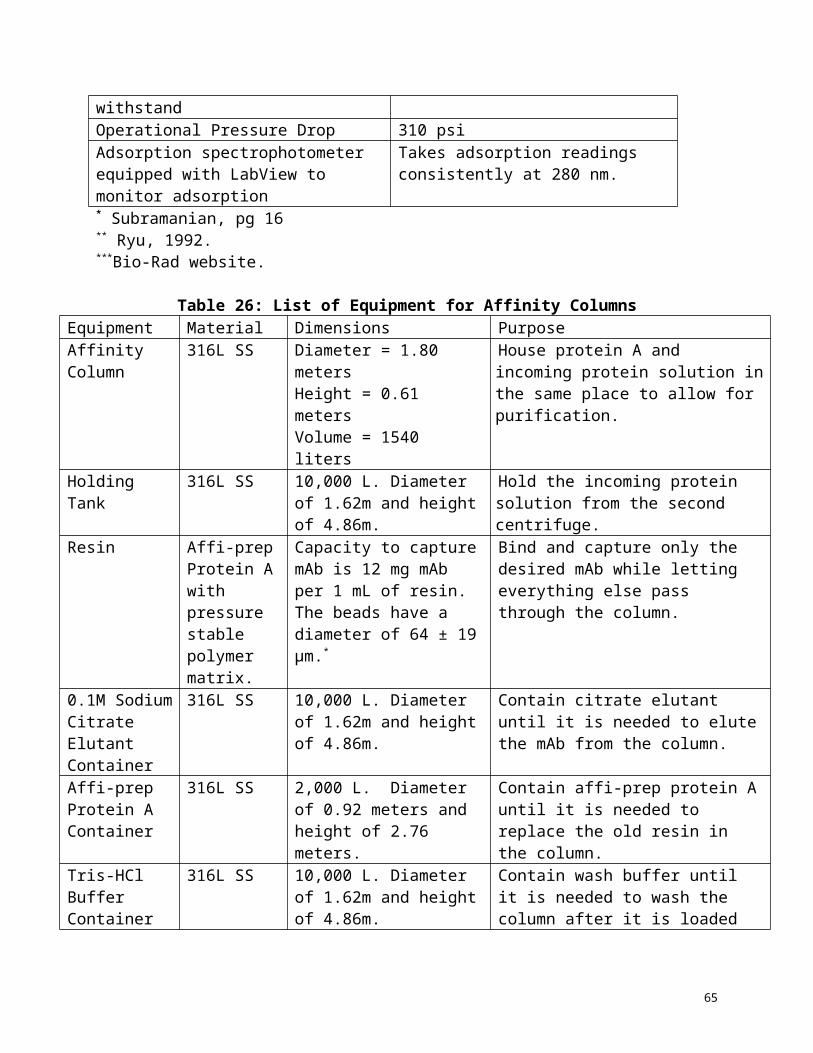
tankBuffer tank 10,000L; 316L 1 $20,000 $20,000Computer Program Software (ie Lab view)
2 $4095.0 $8190
UV and Conductivity monitor
PC 2 $2105 $4210
Sample probes PFA 100 6 $1095 $6579Pumps Diaphragm
5 $5000 each $25,000
Valves High Purity Two Way diaphragm Valve- EV-98613-56
18 $449.30 $8087.4
Na-Phosphate tank
5,000L; 316L 1 $10,000 $10,000
NaCl tank 5,000L; 316L 1 $10,000 $10,000NaOH tank 5,000L; 316L 1 $10,000 $10,000Air Vent 1 $1200 $1200Pressure gauge High-accuracy
digital test gauge, 0 to 30" Hg range EW-68330-00
1 $800.0 $800.0
Electricity 856 kW* .8 cent per kW
$68.48 per cycle
316L Piping (1.5 in)
300ft Estimated to be 20% of major equipment
$ 124600
NaOH cost 16618 L per cycle
$63.78 per 18L $ 58883 per cycle
NaCl cost 16643 L per cycle
$81.70 per 300mL
$4532443 per cycle
Na-Phosphate 832L per cycle $51.0 for 2.5 L $ 16972.8 per cycle
Motor for Pump 32" Commerical Mower with 10.5 B&S Engine 5
$1849.95 $9249.75
Pressure Release At pump 6- come with pump
$0 $0
Conductivity Cell 1 $5000 $5000UV Cell 1 $5000 $5000
65

Direct Soft PLC software
2 $395.0 each $790
PLC controller 2 $1095.0 $2190STV Sanders Pressure relief valve
2 $1573.0 $3146
Maintenance Estimated to be 3% of major equipment
$18690 per year
Installation Estimated to be 25% of major equipment
$155750
Shipping Estimated to be 40% of major equipment
$249200
Validation Estimated to be 20% of major equipment
$ 124600
Final Fixed Capital Costs
$2.9 Million
Total Operational Cost
$5.3 Million
Source: Sigma Aldrich website, Harrison* The electricity cost is estimated as 20% of the process equipment cost* * The maintenance and installation cost is estimated as 3% of the process equipment cost
CIP/SIP for Downstream Process
Table 39: Cost of CIP/SIP system for downstream processCIP materials Quantity Cost per unit Total Cost316L piping 1500ft $14.07 ft $21,105
Electricity 515kW $ 203/kW $104545NaOH 58.75 L per cycle $5.16 per kg $30315H20 54,519.37 L per cycle $.50 gallon $2710H3PO4, pH 1.5 10000 L $466 per gallon $1211600CH3COCH3 30L per cycle $87.4 per gallon $2644CH6ClN3 3840 kg per cycle $354.3 per kg $1360512C2H6O $16000 L per cycle $40.9 per gallon $170144
66
CH2O2 69kg per cycle $151 per gallon $10419NaH2PO4 983 kg per cycle $172 per kg $169144.8CH3COONa 738 kg per cycle $125 per kg $92250Gelatin 3kg per cycle $138 per kg $615Total Fixed Capital Costs
$21,105
Total Operational Cost $ 3.1 Million
Economic Feasibility of MAb Production in
Dunaliela tertiolecta
67
Fixed and Operational Costs of Entire Process____________
The total process for producing monoclonal antibodies includes both an upstream and a downstream. The upstream includes four steps: medium preparation, inoculation train, photobioreactor, and CIP/SIP. The downstream includes seven steps: centrifugation, cell disruption, another centrifugation step, two protein A affinity columns operated in parallel, a gel filtration chromatograph column, a cation exchange column, and two anion exchange chromatography columns operated in parallel. The total cost of the process is summarized in Tables 40 and 41 below. The total one time cost for the entire process is $13.8 million and the total annual operational cost is $18.9 million.
Table 40: Total One Time Costs for Entire ProcessOne Time Costs Cost ($)
Upstream Process $3.5 MillionDownstream Process $10.3 Million
Total Fixed Capital Costs for Entire Process $13.8 Million
Table 41: Total Annual Operational Costs for Entire ProcessAnnual Operational Costs Cost ($)
Upstream Process $6.1 MillionDownstream Process $14.1 Million
Total Annual Operational Costs for Entire Process
$20.2 Million
Selling Price to Receive 20% Return on Investment________
The following tables show potential sell prices to receive the minimum 20% return on investment (ROI) for the first year of production (Table 42) as well as years after (Table 43). We have included 50% contingency and 10% interest rates on money borrowed to account for the high risk business venture we are pursuing. We have also accounted for employee salaries, pensions, and healthcare. Considering that current contract manufacturing procedures result in MAb selling prices between $2000 and $5000, our proposed algal process is a very competitive business venture.
Table 42: Sell price per gram of MAb required to receive 20% ROI for first year of production
68
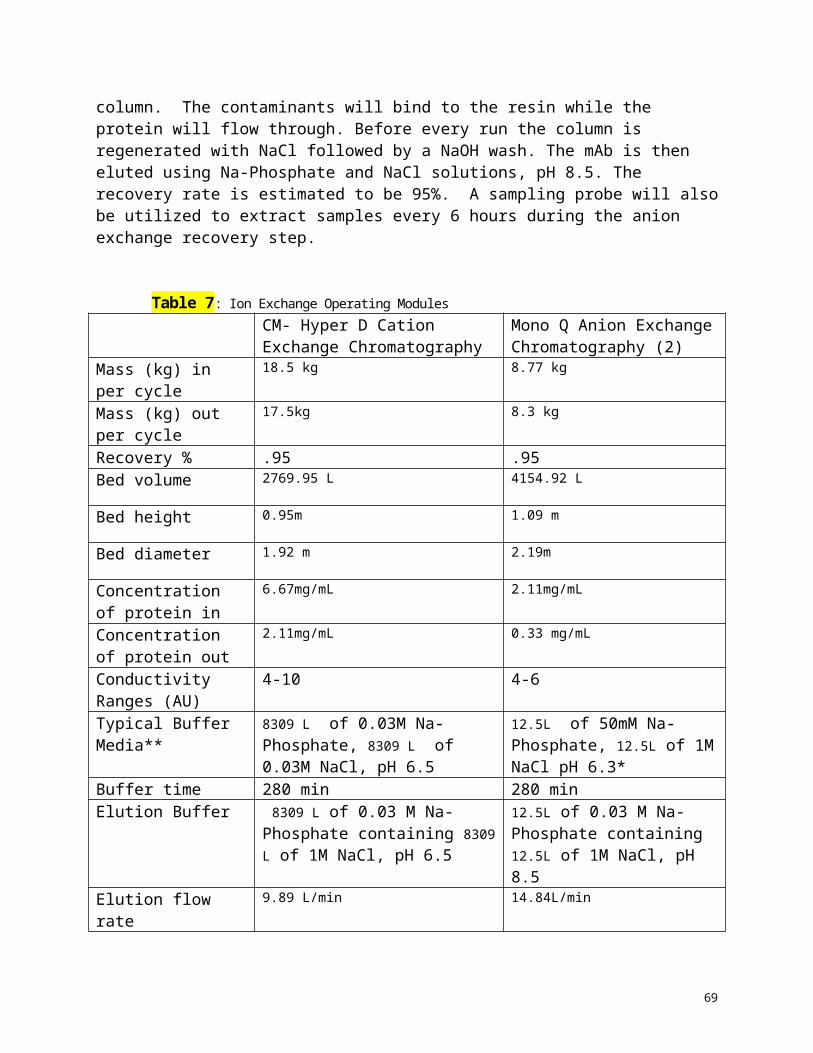
Total Annual Operating Costs (includes maintenance and utilities)Total Capitol Investment (includes shipping and validation)Annual Labor and Payroll (300 employess with avg. salary of $100,000 per year to include pensions and healthcare)
$30 million
Start-up Expenses (10% of capitol investment, Atkinnson, 1991)Contingency (50% of capitol investment for unventured process, Atkinson, 1991)Other Plant Overhead (telephone, sewer, freight, travel, legal, rentals) $400,000Taxes and Insurance (6% of capitol investment, Atkinson 1991)Annual Expense due to Interest Rate for Capitol Investment (10%)Sales and MarketingTotal costs for first year of operationPrice per gram MAb to receive minimum 20% ROI
Table 43: Sell price per gram of MAb required to receive 20% ROI every other year of production
Total Annual Operating Costs (includes utilities) $20.2 million
Annual Labor and Payroll (300 employees with avg. salary $100,000 per year to include pensions and healthcare)
$30 million
Contingency (50% of capitol investment for un-ventured process, Atkinson, 1991) $6.9 millionOther Plant Overhead (telephone, sewer, freight, travel, legal, rentals) $400,000Taxes and Insurance (6% of capitol investment, Atkinson 1991) $828,000Annual Expense due to Interest Rate for Capitol Investment (10%)Sales and MarketingTotal annual costs after first year $58.3
millionPrice per gram MAb to receive minimum 20% ROI $117
Nomenclature
Symbol Meaning
69
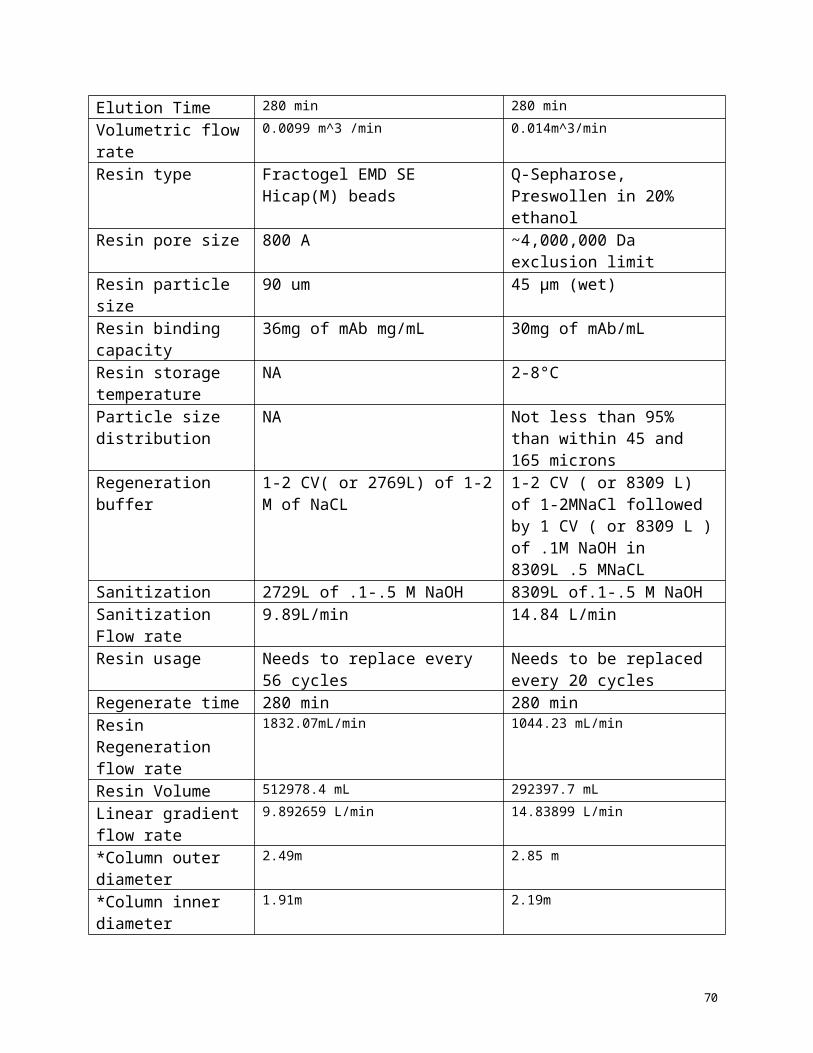
F ForceQ ChargeE Dielectric constantr RadiusVg Sedimentation
velocityn Plate number w Angular velocityg Gravity constantΣ Sigma Factora Areaρ Densityμ Viscosity
Works Cited
ACCompacting. Master 280 Washing System. Copyright 2005. http://www.accompacting.com/html/ico/washer_mastercl280.html. April 1,2005.
Alfa Laval. http://www.alfalaval.com . May 16th, 2006.American Cancer Society. Cancer Statistics 2006: A Presentation by the American Cancer
Society. http://www.cancer.org/docroot/stt/stt_0.asp April 10th, 2006.Atkinson, Bernard. 1991. Biochemical Engineering and Biotechnology Handbook.
Stockton Press. New York, NY.Baez, J. Talks about different kinds of bioreactors. Fibrogen. 2006. Barbosa, Maria J., Marcel Janssen, Nienke Ham, Johannes Tramper, and Rene´ H. Wijffels.
Microalgae Cultivation in Air-Lift Reactors: Modeling Biomass Yield and Growth Rate as a Function of Mixing Frequency. Wiley Interscience Journal, 2002.
70
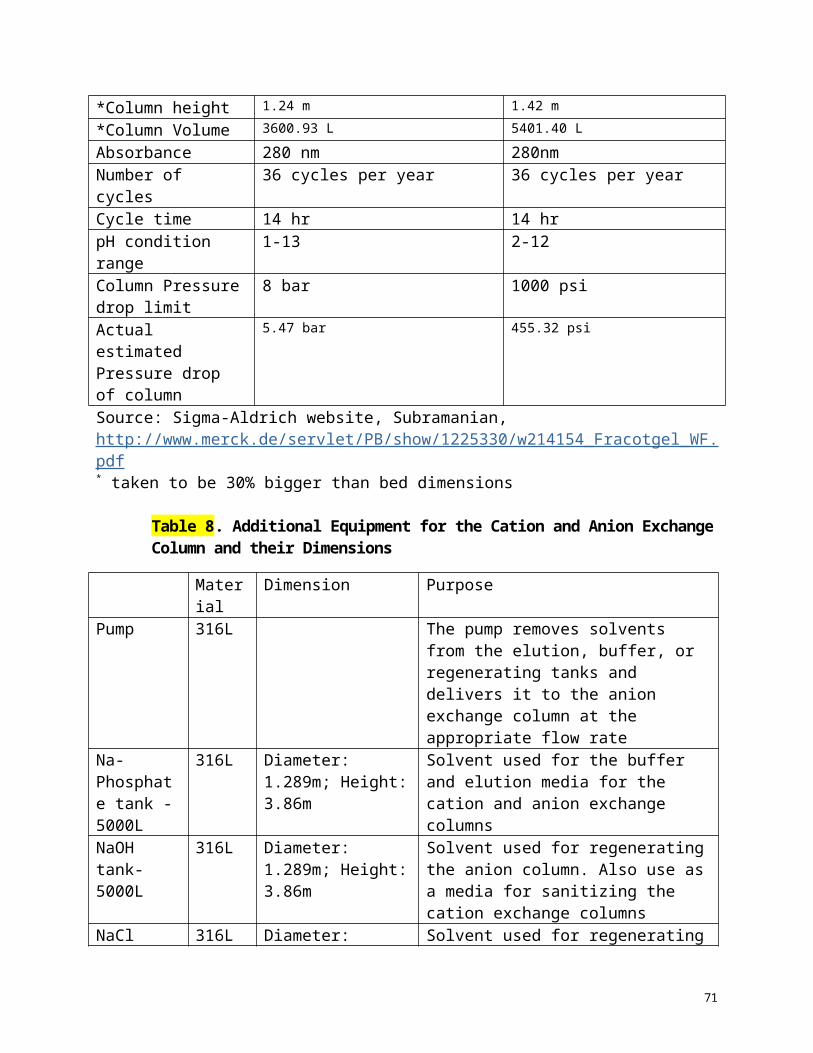
Bio-Rad Website. http://www.bio-rad.com/B2B/BioRad/jsp/default.do?BV_SessionID=@@@@0629350043.1147759348@@@@&BV_EngineID=cccgaddhkjmhjhkcfngcfkmdhkkdflm.0&catalogNumber=161-0798&contentDescrip=1.5+M+Tris-HCl%2C+pH+8.8%2C+1+L&nextPage=BRCatalogPage&oid=16362
Bio-Rad Website. http://www.bio-rad.com/B2B/BioRad/product/br_category.jsp?BV_SessionID=@@@@1869198434.1147637990@@@@&BV_EngineID=ccccaddhkifekmkcfngcfkmdhkkdflm.0&categoryPath=%2fCatalogs%2fLife+Science+Research%2fChromatography+%7c+Protein+Purification%2fChromatography+Media%2fAffinity&catLevel=5&divName=Process+Separations&loggedIn=true&lang=English&country=US&catOID=-31129&isPA=false&serviceLevel=Lit+Request
Biotech Industry Organization. Advantages of Plants to Produce Therapeutic Proteins. 2006. http://www.bio.org/healthcare/pmp/factsheet3.asp April 9th, 2006.
Contreras A, Garcia F, Molina EC, Merchuck JC. 1998. Interaction between CO2 mass transfer, availability and hydrodynamic stress in the growth of Phaeodactylun tricornutum in a concentric tube airlift photobioreactor. Biotechnol Bioeng 60:317-325.
CNNMoney.com. “Genentech: An expensive darling” by Aaron Smith. January 10, 2006. http://money.cnn.com/2006/01/09/news/companies/genentech/> April 8, 2006
Crabtree, Penny. Algae to Antibodies. Union Tribune. May 20th, 2005. http://www.signonsandiego.com/news/business/biotech/20050520-9999- lz1b20algae.html April 8th, 2006.
Crisenten L, Iversen JL. A Bubble Column Photobioreactor with Online Optimization of Light Intensity and Determination of Photosynthetic Quotient. Institute of Biochemistry and Molecular Biology. University of Southern Denmark. Odense, Denmark.
Datar, Cartwright, and Rosen. Process Economics of Animal Cell and Bacterial Fermentations. Biotechnology. Volume 11 (1993). 349-57.
Davies, Julian E. and Arnold L. Demain, editors in chief. Manual of Industrial Microbiology and Biotechnology, 2nd Edition. Washington, D.C.: ASM Press, 1999.
Deindoerfer, F. H. and A. E. Humphrey. Microbiological Process Discussion: Analytical Method for Calculating Heat Sterilization Times. Applied Microbiology. 1958.
D’Elia, Nancy A., Bjorn K. Lydersen, and Kim L. Nelson. Bioprocess Engineering: Systems, Equipment, and Facilities. New York: Wiley, 1994.
Demain, Arnold L. and Nadine A. Solomon, editors. Manual of Industrial Microbiology and Biotechnology, 1st Edition. Washington, D.C.: ASM Press.1986.
Food and Drug Administration. Avastin Consumer Reports. July 21st, 2004. http://www.fda.gov/cder/consumerinfo/druginfo/Avastin.HTM April 10th, 2006.
Fox, Sandra. Contract Manufacturing Fills Industry Niche. Genetic Engineering News. Volume 25, No. 17. October 1st, 2005. http://www.genengnews.com/current/article.aspx?id=777 April 8th, 2006.
García González M, Moreno J, Manzano JC, Florencio FJ, Guerrero. Production of Dunaliella salina biomass rich in 9-cis-B-carotene and lutein in a closed tubular photobioreactor. J. Biotech. 115:81-90. 2005.
Genentech .“What is Avastin?” 2005. <http://www.avastin.com/avastin/patBrochure.m> April 8, 2006
Genentech. “Lucentis” March 2006 http://www.gene.com/gene/pipeline/status/vascular/amd/index.jsp ?> . April 8, 2006
Genentech. 2005 Annual Reports. March 14th, 2006.
71

http://www.gene.com/gene/ir/financials/annual-reports/2005/index.jsp April 9th, 2006.Gorry SB, Haas WE, Mahaffee JW. Effective Deoxygenation by a Hybrid Process Combining
High Transfer Membranes with Catalytic Oxygen Reduction. Technical Paper. Ionics Pure Water Solutions.
Greenovation. 2006. http://www.greenovation.com/Projects_Production.htm April 10th, 2006.Grisham RH, Grisham CM. Biochemistry. 2nd Edition. Forth Worth: Saunders. 1999.Harrison, Roger G., Paul Todd, Scott R. Rudge, and Demetri P. Petrides. Bioseparations Science
and Engineering. New York: Oxford University Press, 2003.Hetherington, P.J., Follows, M., Dunnill, P., and Lilly, M.D. (1971) Release of protein from
bakers’ yeat (Saccharomyces cerevisiae) by disruption in an industrial homogenizer. Biotech Bioeng. 13(4):549-560
Hu, Jim. The Price of Life. Blogs for Industry. February 20th, 2006.http://dimer.tamu.edu/simplog/archive.php?blogid=3&pid=3265 April 9th, 2006.
Hu, Wei-Shu. Overview of Cell Culture Technology. University of Minnesota. 2004. HEADING 1 April 9th, 2006.
Ion Exchange. Copyright 2003. <http://www.remco.com/ix.htm> May 12, 2006Janssen M, Janssen M, Winter M, Tramper J, Mur LR, Snel J, Wijffels RH. Efficiency of light
utilization of Chlamydomonas reinhardtii under medium duration light/dark cycles. J Biotech. 78: 123-137.
Kargi, Fiket and Michael L. Shuler. Bioprocess Engineering: Basic Concepts, 2nd Edition. New Jersey: Prentice-Hall, Inc., 2002.
Kwon SJ, Choi EY, Choi YJ, Ahn JH, Park OK. Proteomic studies of post-translational modifications in plants. J. Exp. Bio. 57:7:1547-1551. 2002.
Lewin, Daniel R., J. D. Seader, and Warren D. Seider. Product and Process Design Principles: Synthesis, Analysis, and Evaluation, 2nd Edition. New York: Wiley, 2004.
LHS Company. CIP Cleaning Systems. Copyright 2005 http://www.l-h-s.co.uk/cip.htm. April 1, 2005
Liszewski, Kathy. Exploiting Post Translational Modifications. Genetic Engineering News. Volume 25, No. 1. January 1st, 2005. http://www.genengnews.com/current/article.aspx?id=862 April 8th, 2006.
Longo presentation notes. Powerpoint slides given in lecture for ECH 161B. Winter 2006.Maffei, K. KMPT Process Technology. Free of contamination: CIP cleaning in a GMP
centrifuge. http://www.kmpt.com/index.htmMerchuk JC, Ronen M, Giris S Arad (Malis). Light/dark cycles in the growth of the red
microalga Porphyridium sp. J. Chem Technol Biotechnol. 59: 705-713.Microfluidizer Corporation. http://www.microfluidicscorp.com/equipment/610.htmlMitsubishi Kakoki Kaisha, LTD. GMP-Compatible Horizontal Peeler Centrifuge.
http://www.kakoki.co.jp/english/products/m/m-004.html Morgan, Andrew. Barnum Mechanical Inc. presentation. Thursday, May 4, 2006.MorkUSA. Mobile CIP Units. Copyright 2003 http://www.morkusa.com/Default.asp?
PageId=159. April 1, 2005.Mullikin RK, Rorrer GL. A tubular recycle photobioreactor for macroalgal suspension cultures:
biohydrogen. New York: Plenum Press, 1998.Nest Group, The. PolyLC Ion Exchange Column Care and Cleaning.
http://www.nestgrp.com/protocols/polylc/iex_clean.shtml
72

Pearson, Sue. Genetic Engineering News vol. 26, no. 6. Bioprocessing: Multiproduct Manufacturing Facilities. 2006.
Quig A, and Beardall J. Protein turnover in relation to maintenance metabolism at low photon flux in two marine microalgae. Plant cell and environment. 26: 693-703.
Rubio FC, Acien FG, Sanchez JA, Camacho FG, Grima EM. Prediction of disolved oxygen and carbon dioxide concentration profiles in tubular photobioreactors for microalgal culture. Biotech & Bioeng: 62:1:71-86, John Wiley & Sons, Inc.
Ryu, Dewey, Kyung Kang, William N. Drohan, and Carolyn L. Orthner. “Effect of Matrices on Affinity Purification of Protein C.” Biotechnology and Bioengineering 39: 1086-1096. New York: Wiley, 1992.
Sepharose Flow Rate.Copyright 2006. <http://www.sigmaaldrich.com/catalog/search/ProductDetail?ProdNo=Q1126&Brand=SIGMA>. May 11, 2006
Sepharose Base Ion exchange Media Information Sheet. Copyright 2005. <http://www.sigmaaldrich.com/sigma/product%20information%20sheet/q1126pis.pdf >. May 12, 2006.
Sigma-Aldrich Website. https://www.sigmaaldrich.com/catalog/search/ProductDetail/SIAL/S1804
Stark, D. Talks at UC Davis. Genentech. 2006.Steiner, Dr. U. Presentation on MAb Market. Bayer . 2005.
Production of recombinant proteins by plants April 10th, 2006.Subramanian, G. Antibodies, vol. 1: Production and Purification. New York: Kluwer
Academic/ Plenum Publishers, 2004.Subramanian, G. Antibodies, vol. 2: Novel Technologies and Therapeutic Use. New York:
Kluwer Academic/ Plenum Publishers, 2004Wu XiaoXi, Merchuck JC. 2002. Simulation of algae growth in a bench-scale bubble column
reactor. Wiley Periodicals, Inc. 2002.
Appendix
Calculations for Process Capacity, Bioreactor Design, Media Requirements, and Flow Rates will be in the Final Report.
Upstream Media Sterilization Heat Exchanger Calculationsassume a volume of 10,000 Liters of media needs to be sterilizedsterilization of 10 m3Time for sterilization 2 hrFlow rate 1.389 L/s 0.001389 m3/s
specific heat of water 4.186KJ/(Kg*K)
specific heat of sea water 3.93KJ/(Kg*K)
73

Regen. Heat Exchanger
T hot in 130 CT hot out 50 CT cold in 30 CT cold out 120 C
choose plate datawidth, w 40 cm 0.4 mheight, h 30 cm 0.3 mspacing 0.4 cm 0.004 mnumber of plates 16 platesport size 30 cmThickness of the plates, a 0.00117 m
delta T ln 358.0519delta T 373.15 KQ 2169.453 KWQ delta T ln 2081.674
A 1.68 m2U 3460.648 W/(m2*K)
thermal conductivityk (hot stream) 0.016 W/(m*K)k(cold stream) 0.58 W/(m*K)k (SS) 17 W/(m*K)
Pr=Cp*u/kPr (hot stream) 196.5Pr (cold stream) 6.775862
Re 2320.719
Nu=0.023*Re^(.8)*Pr^(1/3)Nu(hot stream) 718.4363Nu(cold stream) 233.8419
hydraulic diameter
74
Dh 0.002333
h=Nu*k/Dhh(hot) 4926.754 W/(m2*K)h(cold) 58130.34 W/(m2*K)
1/U 0.000289 (m2*K)/W
U 3460.212 W/(m2*K)assume diameter of pipe is 3 inches 0.0762 mcross sectional area of pipe 0.00456 m2velocity = 0.304556 m/s
Steam Heat Exchanger
T hot in 140 CT hot out 120 CT cold in 120 CT cold out 130 C
choose plate datawidth, w 40 cm 0.4 mheight, h 30 cm 0.3 mspacing 0.4 cm 0.004 mnumber of plates 24 platesport size 30 cmThickness of the plates, a 0.00117 m
delta T ln 287.577delta T 293.15 KQ 1704.342 KWQ delta T ln
A 2.64 m2U 2202.231 W/(m2*K)
thermal conductivityk (hot stream) 0.016 W/(m*K)k(cold stream) 0.016 W/(m*K)
75

k (SS) 17 W/(m*K)
Pr (hot stream) 209.3Pr (cold stream) 245.625
Re 2320.719
Nu(hot stream) 733.709Nu(cold stream) 773.9121
hydraulic diameterDh 0.002333
h(hot) 5031.488 W/(m2*K)h(cold) 5307.185 W/(m2*K)
1/U 0.000456 (m2*K)/W
U 2193.003 W/(m2*K)how much steam is needed
length of holding tube = v* 5 mins Q = 1704.342 kW
diameter of holding tube 3 inches0.0762
m m dot = 5.813889 L/scross sectional area of tube 0.00456 m2 for .5 hrs,
velocity in tube 0.304556 m/s m = 10465
Liters of steam per heat sterilized batch
length of tube 91.36691 mUpstream CIP Calculations
CIP Appendix
Reynolds number = (d*v*p)/muVelocity= ,408 Q/d^2
where Q is the flow rate and d is the diameter
d inner diameter 2 inchv fluid velocity 6.51 ft/s or 122.9609 m/minp fluid density 60.6 lb/ft^3
mu viscosity 0.35 cP Line size d inside Reflow rate
1.5 1.37 24301330 L/min or 38gpm
76

For steam
30 gpm or 14434.62 lb/hr Re 192000 for inner diameter 1.37
Cost Analysis water(L) sodium hydroxide1liter= .264 gal 760 49.6 gal
684 Sodium hydrochlorite570 49.6 gal
steam380 58400 lb684380
380380
380total water 4598 L or 1213.872 gal of water
flow rate of sodium hydrochlorite and sodium hydroxideRe= 6.31 *W/ d * mu where W is lb/hrRe 4000W 303.962flow rate 0.625481 gpm
Centrifugation Calculations: Cell Removal
First Centrifuge: Remove Cells from Broth
Cell Density Calculations
cell D (um) dry cell (g) water/cell mass (g)Vcell (um3) Vcell(cm3) cell density (g/cm3)=p
10 1.15E-10 0.8 5.75E-10 523.3333 5.23E-101.10E+0
0
Disc-Type Centrifugation Equation: Maximum Feed Rate
77
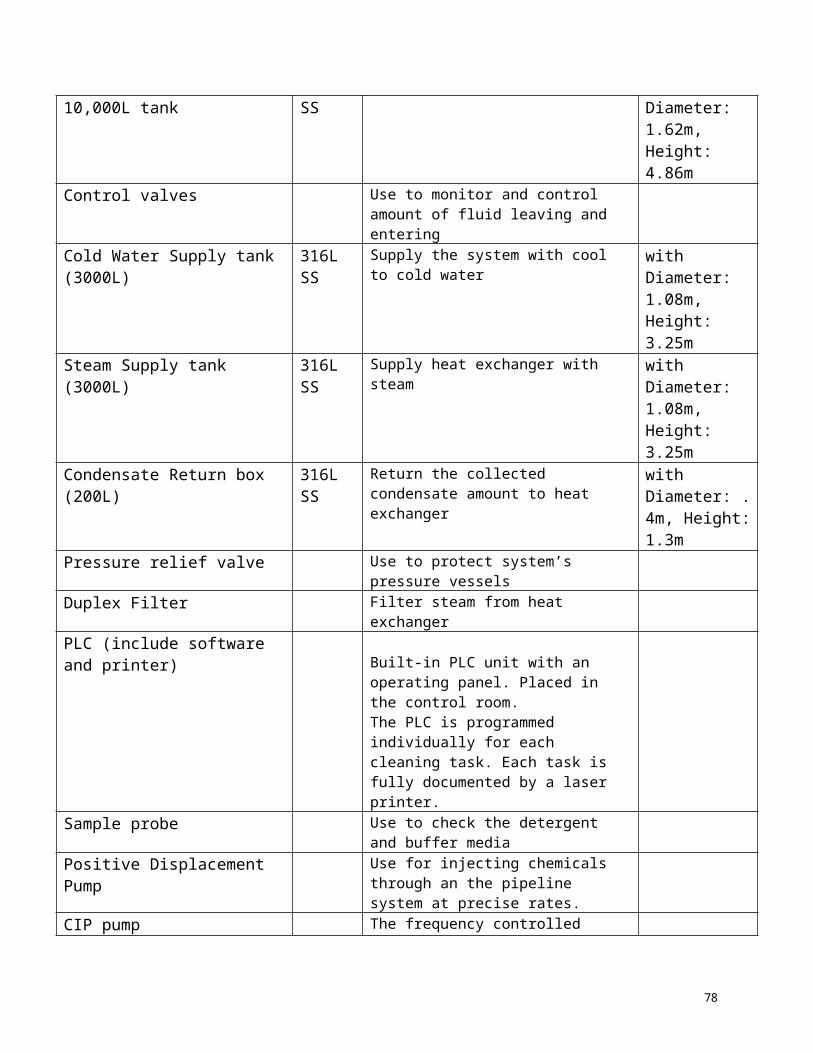
thetabowl radius (cm)
42 30
a (cm) p(g/cm3) po(g/cm3) g (cm/s2)u g/(cm*s) n w(rad/s)
Ro (cm)
Ri (cm)
0.0005 1.10E+00 1 980 0.798 100 628 25 8
Q (l/min) Q (m3/min) Feed Rate From Fermentation70 0.07
Q (cm3/s) vg sigma3742.539 6.7357E-06 5.56E+080.224552 Maximum Feed Rate Allowed to Achieve Seperation (m3/min)
Therefore, our process flow rate is acceptable to achieve desired separation in the chosen centrifuge.
Time Required to Achieve Seperation
Generalized Gt for Algae Cells3.00E+05
w(rad/s) Ro g t(seconds)
628 25 98029.81865
39
Centrifuge Capacity Centrifuge Height
78

Volume(L) Q(L/min) time to separate (s) Volume Cone = 1/3*pi*r2*H (m3) r(m) h(m) h(cm)34.78843 70 29.81865 0.034788 0.25 0.53 53.18
Centrifuge Time For Total Process Batch Volume of 100,000L
Q(L/min)Batch Volume per Reactor Total Batch Volume Total time (min) Time (hours)
70 10,000 100000 1428.57123.80
952
Second Centrifuge: Remove Cell Debris from Protein Broth Cell Density Calculations
cell D (um) dry cell (g) water/cell mass (g)Vcell (um3) Vcell(cm3) cell density (g/cm3)=p
10 1.15E-10 0.8 5.75E-10 523.3333 5.23333E-10 1.10E+00debris mass debris V cell debris density
7.48E-11 6.54167E-11 1.14E+00Disc-Type Centrifugation Equation: Maximum Feed Rate
theta bowl radius (cm)42 40
a (cm) p(g/cm3) po(g/cm3) g (cm/s2)u g/(cm*s) n w(rad/s) Ro (cm) Ri (cm)
0.00025 1.14E+00 1.07 980 0.798 100 837.3333 35 8
Q (l/min) Q (m3/min) Feed Rate From Fermentation70 0.07
Q (cm3/s) vg sigma3432.21 1.24E-06 2.769E+09
0.205933 Maximum Feed Rate Allowed to Achieve Separation (m3/min) Therefore, our process flow rate is acceptable to achieve desired separation in the chosen centrifuge. The maximum throughput of the centrifuge will allow for fluctuations of up to 75% more of the expected process flow rate.Time Required to Achieve Seperation
Generalized Gt for Algae Cells2.00E+06
w(rad/s) Ro g t(seconds)837.3333 35 980 79.87139
79
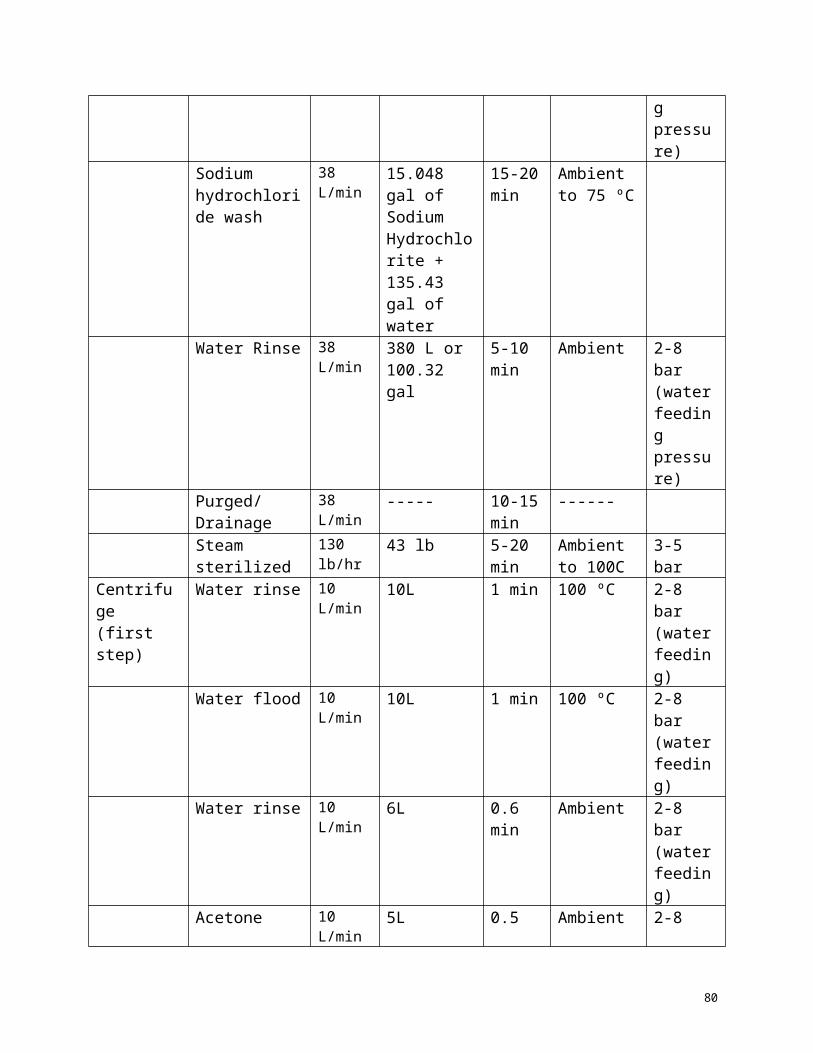
Centrifuge Capacity Centrifuge Height
Volume(L) Q(L/min) time to separate (s) Volume Cone = 1/3*pi*r2*H (m3) r(m) h(m) h(cm)93.18329 70 79.871394 0.093183 0.35 0.726764 72.67643
Centrifuge Time For Total Process Batch Volume of 100,000L
Q(L/min)Batch Volume per Reactor Total Batch Volume Total time (min) Time (hours)
70 10,000 100000 1428.571429 23.80952
Lysis by microfluidizer
ln(1-R) = -kNbPa
b = 0.3k = 0.3 MPa-a
a = 0.6p = 20,000 psi = 137 MPaR = Extent of disruptionN = Number of pass
Ln(1-R) = -5.741-R = exp (-5.74)R = 0.996899.68%
Heating~0.33 Kg ice/L required to cool microfluidizer
(0.33 Kg ice /L )(334 KJ / KJ ice) ( 35 L/min) = heat generated= 3857.7 KJ/min=923 Kcal/min or 6.86 Kcal/L
Cooling923 Kcal/min means 923 Kg change 1ºC every minuteAssuming heat transfer coefficient to be limited by water (and not by resistance of metal)
= 250 BTU / ft2 hºF = 1420 W / m2KAssume 1 m2 surface area.6.86 Kcal/L corresponds to 6.86 º C increase since 1L ~ 1 Kg∆Tln = (15- 6.85) / (15 / 6.86)
= 10.4 ºK
80
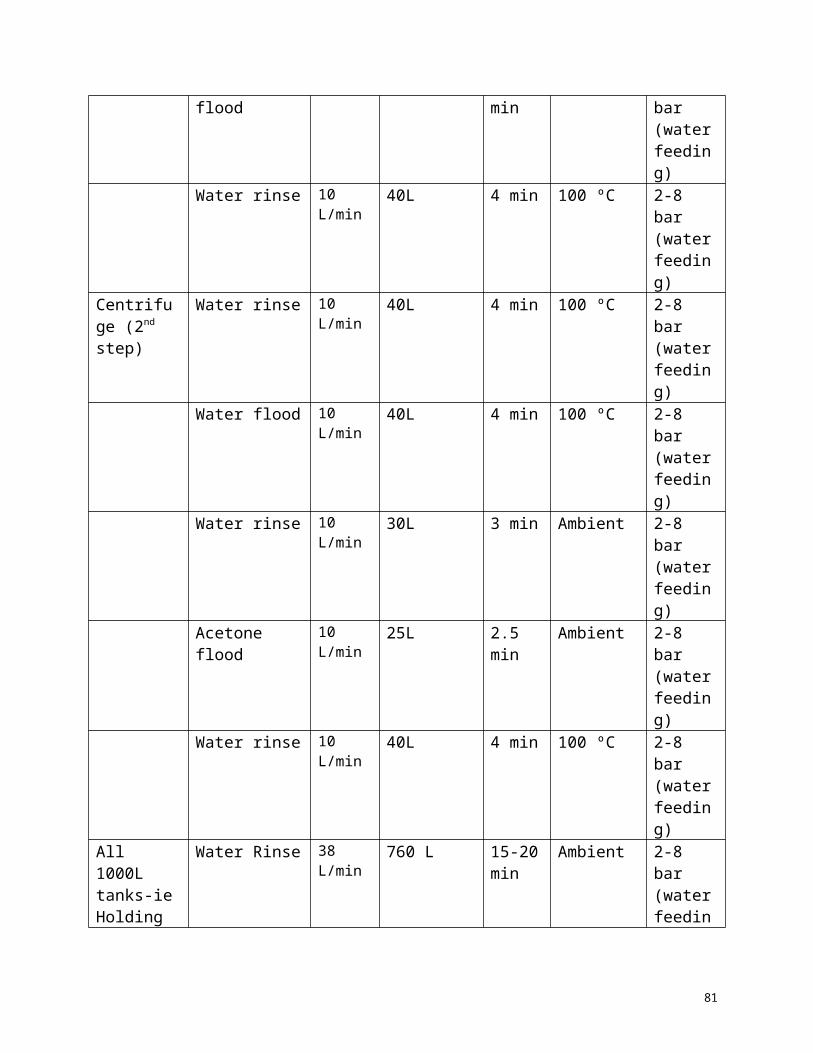
q = UA∆Tln= (1420 W / m2K)(1 m2)(10.4 ºK)= 886 KJ/mim
(3857.7 KJ/min) / (886 KJ/min) = 4.35 min
Calculations for Protein A Affinity Column
Determining mass flow rates and volumetric flow rates for Affinity Columns.conc of mAb coming out of 2nd centrifuge:
0.006mg/mLwant flow rate of 22mass in per cycle 15829.04number of cycles 36mass out of end ion exchange column
16.66667kg/cyclemass in of end ion exchange column
0.9595% separation17.54386kg/cycle
mass out of affinity column17.54386kg/cycle
0.9595% separationmass in to affinity column
18.46722kg/cyclemass in 18467.22mg/cyclevol in 3077870mL/cyclevol in 3077.87L/cycletime 140minflow rate 21.98479L/min
assume time is 140min
Now find area using flow rate assume 3:1 diameter to height ratioBut the height should not be much larger than 2 feet.
So we will have 2 protein A affinity columns in series D = 1.792257m 5.880037feet H = 0.61m 2.001288feet V = 1.538935m^3 A(cs) = 2.522844m^2
Determining amount of resin needed, container size, and flow rate
81

resin needed resin container12 mg protein/mL resin V= 2000Lmass in 9.71959kg/cycle V = 2m^3mass in 9719590mg/cycle H = 3Dresin capacity 12mg protein/mL D= 0.921318mresin vol 809965.8mL H= 2.763953mresin vol 809.9658L per columnresin load time 60minresin flow rate 13.49943L/min
Determining amount of elutant needed and flow ratemass out 17.54386kg/cyclemass out 17543860mg/cycleelute volume 2500Lelute volume 2500000mLconc out: 7.017544mg/mL
Determining pressure drop down column. From Bio-Rad website, the maximum pressure drop the beads can withstand is 1,000 psi. http://www.bio-rad.com/B2B/BioRad/product/br_category.jsp?BV_SessionID=@@@@1869198434.1147637990@@@@&BV_EngineID=ccccaddhkifekmkcfngcfkmdhkkdflm.0&categoryPath=%2fCatalogs%2fLife+Science+Research%2fChromatography+%7c+Protein+Purification%2fChromatography+Media%2fAffinity&catLevel=5&divName=Process+Separations&loggedIn=true&lang=English&country=US&catOID=-31129&isPA=false&serviceLevel=Lit+Request
maximum L allowablemax. del p 6896552N/m^2
L= 1.983478mThe height of the column cannot exceed 2 meters
dp= 45umdp= 0.000045massume void fraction is .1e= 0.1k= 1.66667E-14m^2
100feetL = 0.61m 30.48037massume u is that of wateru= 0.000798kg/m*sv=Q/AQ= 0.010992393m^3/minQ = 0.000183207m^3/s
82
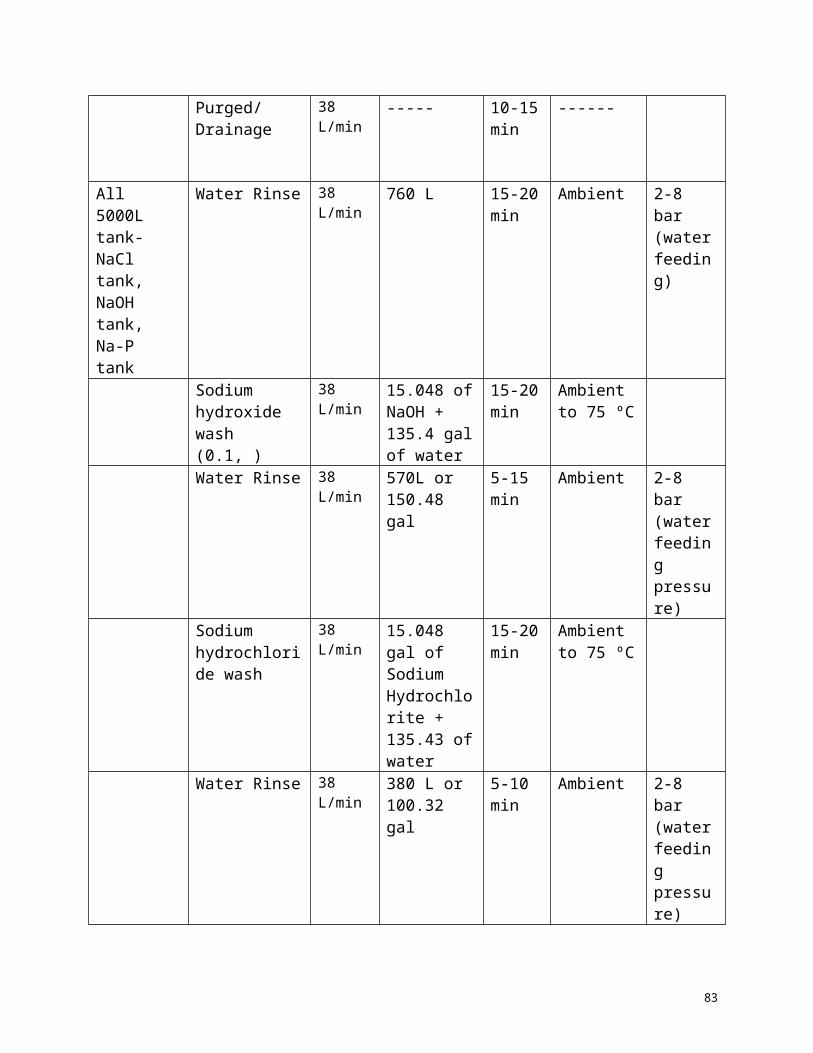
A= 2.522844356m^2v= 7.2619E-05m/s
delta p = 2120970kg/(m*(s^2))2120970N/(m^2)
307.54065psi
Cost Calculations
Tris-HCl buffer needed180000L per year
from bio-rad1 L = $22 for 1.5Mso dilute 1.5M to .1M by 15 dilutions to get 1L of .1M = $1.47cost of 180000 L $ 264,000.00 1 L = $1.47Sodium Citrate elutant needed
180000L per year
5 kg = 214british poundsAssume density of 1 kg/m^35 m^3 = 403.9464US Dollars5 m^3= 5000L
price 0.0807893$/L
cost of 180000 L $14,542.07
Cost of 2,000 L protein A containerV (in gallons)Cost =375*V^.51from page 556 in Seider
V = 2000LV = 528.40159gallonscost $9,177.89
cost of affinity column shellV = 1540LV = 406.86922gallons
cost $8,032.55 per column
Anion Exchange Column Calculations
Anion Exchange ColumnTotal Mab 600kg Mab
83

total cycle 36cyclesmab/cycle 16.66666667mass mout% recovery 0.95mass in 17.54385965kg MabFind flow rates and bed volumn dimensionsFor two columntimeassume mAb conc in 7.018mg/mLmass in 8.771929825kg/cyclemass in 8771929.825mg/cycleVolume in 1249918.755mL/cycleVolume in 1249.918755L/cycletime 55minflow rate 22.72579555L/min
For two column
Volume per column 624.9593776LAssume 3:1 diameter to height 0.624959378m^3Diameter 1.336475661m OR 4.276722ftHeight 0.445491887m OR 1.425574ftFlow rate per column 11.36289778L/min
Pressure drop - Use Darcy Law k 44.03pressure drop 687.15psi
mass out 8.333333333kgelution vol 3CV 1874.878133L
1874878.133mLconc. Out 4.444733333mg/mL
Find resin volumneUse binding capacity 30mgAb/mlknow need 16.67kg of Abso calculated ml of resin needed 555666.67mL
84