table of contents - social security administration€¦ · web viewcomparison group 1 appeared to...
TRANSCRIPT

Evaluation of Homeless Outreach Projects and Evaluation (HOPE)
Task 6: Final Evaluation Report
Authors: Marion L. McCoy, Ph.D., Cynthia S. Robins, Ph.D., James Bethel, Ph.D., Carina Tornow, and William D. Frey, Ph.D.
The findings and conclusions in this report are those of the authors and do not necessarily represent the views of the funding agency.
October, 2007
Prepared for:
Thomas W. Hale, Ph.D.SSA-HOPE Evaluation Project OfficerSocial Security Administration 6401 Security BoulevardBaltimore, MD
Prepared by:
WESTAT1650 Research BoulevardRockville, Maryland


TABLE OF CONTENTS
Section Page
EXECUTIVE SUMMARY: PROJECT HOPE FINAL EVALUATION REPORT........................................................................................................... vii
1 INTRODUCTION............................................................................................ 1-1
1.1 Homelessness emerges as a national issue.......................................... 1-21.2 Social Security Administration and the Homeless Outreach Projects
and Evaluation (HOPE) demonstration program................................. 1-61.3 Overview of Project HOPE and Evaluation Plans............................... 1-81.4 Evaluation Tasks and the Data Collection Overview.......................... 1-121.5 Organization of the Report.................................................................. 1-13
2 METHODS....................................................................................................... 2-1
2.1 Project HOPE Evaluation Data System Components.......................... 2-5
2.1.1 SSA-HOPE Web Site........................................................... 2-5
2.1.2 Comparison Groups............................................................. 2-9
2.1.3 SSA 831 Disability Master File Data................................... 2-122.1.4 Focus Group Data................................................................ 2-162.1.5 Qualitative and Documentary Data...................................... 2-182.1.6 Process Evaluation Data from In-depth Site Visits.............. 2-20
3 FINDINGS........................................................................................................ 3-1
3.1 Final Sample Composition................................................................... 3-13.2 HOPE Programs and Comparison Group Outcomes........................... 3-63.3 Web Site Collection Summaries.......................................................... 3-133.4 Qualitative Process Evaluation Summaries......................................... 3-19
3.4.1 Focus Groups Summary Analyses....................................... 3-193.4.2 In-depth Site Visits............................................................... 3-25
3.5 Urban Contexts and Persistent Homelessness..................................... 3-41
4 CONCLUSIONS AND RECOMMENDATIONS........................................... 4-1
5 REFERENCES................................................................................................. 3-1
iii

TABLE OF CONTENTS (continued)
Lists of Appendixes
Appendix
A Acronym Reference List
B DDS (Disability Determination Services) Geographic Regions for The Project Hope Evaluation
Lists of Figures
Figure Page
1-3a Open Systems Model ........................................................................................ 1- 9
1-3b Open Systems Model Framework for Project HOPE evaluation ...................... 1- 11
2-1 Project HOPE Data Collection and Analysis System ....................................... 2- 3
3-2a Comparison groups (C1, C2) vs. matching HOPE programs ........................... 3- 9
3-2b Combined comparison groups vs. matching HOPE programs ......................... 3- 10
3-2c. Combined comparison groups vs. all HOPE programs .................................... 3- 11
3-4 Process evaluation findings ............................................................................... 3-27
Lists of Tables
Table Page
2-1-1 Web site data entry variables ............................................................................ 2- 7
2-1-2 Priority variables for comparison agency matches ........................................... 2- 10
3-1 Selected demographic characteristics for final sample ..................................... 3- 5
3-1-2 Final sample primary disability listing ............................................................. 3- 7
3-2a Evaluation of time to determination ................................................................. 3- 12
iv

3-2b Final sample agency group by determination result ......................................... 3- 12
v

TABLE OF CONTENTS (continued)
Lists of Tables (continued)
Table Page
3-2c Comparison of allowance rates ......................................................................... 3- 13
3-3 Intake and Followup Living Situations ............................................................. 3- 16
3-4 Reasons for Contacting SSA and Resolution of Issues .................................... 3- 20
3-5 Factors and trends associated with homelessness 2000-2006 for HOPE programs receiving site visits ............................................................................ 3- 44
vi

vii

EXECUTIVE SUMMARY: PROJECT HOPE FINAL EVALUATION REPORT
Congress appropriated funds for the Social Security Administration (SSA) to conduct
outreach and application assistance to people who were homeless and to other under-served populations.
SSA used these funds to develop and implement the Homeless Outreach Projects and Evaluation (HOPE)
demonstration initiative in 2003. The Project HOPE demonstration provides funding for 41 HOPE
programs1 across the nation that conduct outreach to people who are chronically homeless and have a
disability. HOPE programs assist eligible individuals with filing SSA disability benefit applications and
accessing mainstream treatment and services (e.g., housing, mental health care). SSA provides
information about the disability application process and ongoing technical assistance to HOPE programs.
SSA intends that the programs will effectively reach and identify people who are chronically homeless so
they can receive the assistance and care they need. SSA also intends that the information and technical
assistance provided to HOPE programs will increase the efficiency of the disability application process
for those clients, and thus reduce disability case processing time at SSA and reduce denials for initial
claims from individuals who are eligible for disability entitlements under SSA rules.
Westat, an employee-owned private research firm in the Washington, DC, area, was hired in
2004 to provide an independent evaluation of Project HOPE for SSA. Westat has analyzed processes and
outcomes of the funded HOPE programs. The key research questions Westat examined are whether
Project HOPE and the HOPE programs it funded have been efficient and effective in accomplishing the
intended outcomes of the project. We have used a mixed methods approach to the collection and analysis
of data (i.e., quantitative and qualitative methodologies inform our findings). The timeframe for the
quantitative data collection and analyses presented here is June, 2005 through April, 2007. The qualitative
data collection and analyses timeframe is from January, 2005 through April, 2007. The conclusions of the
evaluation reflect a synthesis of all data collected and analyzed.
Drawing on an array of compiled information about what often characterized people who
experienced chronic homelessness, about their unmet needs in physical, social, and economic areas, and
in light of lessons learned about best practices when engaging with the target group, SSA developed the
Homeless Outreach Projects and Evaluation (HOPE) demonstration initiative. The objectives of Project
HOPE are informed by the acquired knowledge about people who are/have been homeless for long
periods of time or have repeated episodes of homelessness. The information about the disability
1 In this report, “Project HOPE” is used to refer to the collective, Federal, or SSA-level activities or events (e.g., the Project HOPE evaluation, the annual conference for Project HOPE). In contrast, “HOPE programs” are used to describe community or awardee-level activities and events (e.g., HOPE programs deliver specific core services).
viii

processing system, coupled with technical assistance provided by SSA for HOPE grantees, are designed
to help HOPE programs confront and surmount the characteristic experiences and barriers which are
known to frustrate attempts to resolve chronic homelessness (e.g., lack of family support or social
networks, untreated medical, psychiatric, and substance or alcohol use disorders, circumscribed daily
living skills, attenuated or interrupted formal education, limited job training, persistent unemployment,
limited job skills, and broken ties to local social service systems).
Evaluation Framework
Westat used an “open systems” model (French & Bell, 1984; Katz; 1978; Miles, 1980) as a
framework for the Project HOPE evaluation. The open systems model allows a thorough examination of
key components in an operating system that affect the efficiency and effectiveness of programs. The
model posits specific relationships between four integral components in an operating system: inputs,
processes, outputs, and outcomes.
Effectiveness in the open systems model is defined as the relationship between the outcomes
achieved and the processes used to attain them. If the processes of the Project HOPE ‘system’ (i.e., the
liaison-grantee and grantee-grantee networking; SSA’s provision of technical assistance; and SSA’s
dissemination of information about best practices and the disability processing system) result in the
intended outcomes (i.e., the submission of high quality disability applications which reduce the time SSA
and DDS need to determine that disability entitlements should be allowed), then the operations of Project
HOPE are effective. Efficiency within the model is assessed through a comparison of inputs and outputs.
If Project HOPE operations are efficient, then its inputs (e.g., Federal funding; the accuracy and
comprehensiveness of the information prepared for grantees) facilitate the work –or outputs--of HOPE
program staff. Expected outputs of staff efforts include successful outreach, engagement, and nurturance
of relationships with enrollees that lead to enrollees’ acceptance of help with filing for disability
entitlements and to their acceptance of services and housing. Efficiency outputs also suggested by the
model include relatively higher disability allowance rates for HOPE programs when contrasted to rates
for comparison agencies which were not funded by HOPE or involved in the demonstration initiative.
Methods
The overarching goal of Project HOPE and of the 41 HOPE programs which received HOPE
funding is to identify individuals who are chronically homeless and have a disability who are eligible for
ix

benefits under a Social Security Administration disability program and to provide disability application
assistance to them. The methodological approach to the collection and analysis of data for the Project
HOPE evaluation sought to determine the effectiveness and efficiency of the demonstration program and
the degree to which HOPE programs accomplished their objectives. The key research questions which
guided the evaluation are:
Do the outcomes demonstrate that the SSA intervention (i.e., the provision of information, technical assistance, and structured networking opportunities) led HOPE programs to use processes that helped them effectively produce high quality disability applications and ensure that program enrollees had access to needed services?
Do the outcomes demonstrate that the outputs of HOPE awardees were an efficient use of the inputs (i.e., the investment of Federal funds and SSA labor-time) that helped to reduce SSA’s disability processing costs (by allowing disability benefits determined from initial applications)?
Data were collected in the primary theoretical categories (i.e., inputs, processes, outputs,
outcomes) needed to determine the effectiveness and efficiency of Project HOPE operations and the
extent to which its intended results were achieved. Collected data include the original grantee proposals,
SSA administrative (831 Disability Master2) files for grantee clients, grantee quarterly reports, program
materials, and transcripts from focus groups conducted in 2005 and 2006 with HOPE program staff, with
SSA local field office (FO) or regional office (RO) staff, and with staff from Disability Determination
Services (DDS) offices. An interactive web site was developed that allowed HOPE programs to enter
enrollee and program information that provided data for both process and outcome analyses. Ongoing
process information was also collected during a special process evaluation qualitative component which
allowed Westat to conduct 5 in-depth site visits to HOPE programs in 2006. Outcomes data from the 831s
were collected for each HOPE participant if the HOPE program in which they enrolled submitted a valid
consent form from the individual that permitted the release of that data to Westat.
SSA administrative data were analyzed to compare HOPE program outcomes to two groups
of agencies that provide similar services to people who are chronically homeless and have a disability in
the same areas but do not receive HOPE funding. Westat identified and recruited 32 comparison agencies
and collected the SSA file data from clients of the agencies. Comparison agencies were randomly divided
into two groups. Comparison group 1 agencies received the same SSA HOPE Program Orientation
Manual that HOPE programs did, but did not receive any other support beyond what is routinely received
in community settings. Comparison group 2 agencies did not receive a manual or training from SSA.
When staff at comparison agencies submitted a valid consent form for the release of the 831 file
2 “SSA Disability Master” file is the formal name of these administrative records. However, that title is rarely used. Throughout this document, we will refer to these data by their numeric title (“the 831s”). The numeric title is widely used and recognized
x

information for their clients to Westat, administrative outcomes data could be requested for them from
SSA. SSA administrative data were available from 19 comparison agencies for outcome analyses.
Final analyses used quantitative and qualitative approaches. Quantitative data analysis is
focused first on the comparison of outcome variables between HOPE programs and the comparison
agencies to which they are matched. Analysis also focused on the outcomes of HOPE programs as a
group. Quantitative analyses control for specific intervening variables (e.g., primary type of disability)
and potential confounders (e.g., difference in the total number of records available for analysis from
HOPE programs in contrast to those available from comparison agencies). The quantitative approaches
included: (1) descriptive analyses which examined frequencies and measures of central tendency
(e.g., means and medians), (2) calculation of chi-square and t-test statistics for simple comparisons,
(3) multivariate analyses (e.g., multiple regression analysis and multiple covariate analysis), and
(4) survival analyses (to compute differences across and between HOPE awardees and comparison groups
for time to determination of benefits and allowance of benefit rates).
The compiled qualitative data (non-numerical texts, focus group transcripts, in-depth site
visit observation notes and interview transcripts) have been analyzed according to the conventions of
established qualitative methodologies (e.g., grounded theory and situational analysis). They are
synthesized and integrated with reports on final outcomes for this report.
Final Sample Composition
The final sample for outcome analyses of 831 records is comprised of data for clients from
any of the agency groups (i.e., HOPE programs, comparison agencies in group 1 and in group 2) that
submitted a valid consent form releasing these data and had records which contained time to
determination decision and allowance data. The number of records meeting inclusion criteria totaled
3,253. Of that total, 3,055 administrative records were received for HOPE program enrollees, 116 records
were received for group 1 comparison agency clients, and 98 records were received for group 2
comparison agency clients. The quantity of data collected for outcomes evaluation analyses of SSA
administrative data is far less than what was intended or expected from either HOPE programs or
comparison agencies. The collection of SSA-HOPE outcome and process evaluation data from the web
site was also far below what was expected.
No significant demographic differences were found among the people served by the
comparison agencies and the people served by either the HOPE programs matched to the comparison
xi

agencies or among all comparison agencies clientele and the enrollees served by all HOPE programs
combined. The mean age for comparison group clients was 44.96 years, and those served by HOPE
programs was 42.8 years. Although there were many unrecorded gender attributions in the 831 records,
the amount of missing information for this variable was about the same for the comparison groups and for
HOPE programs. This resulted in differences that weren’t significant. As is found in studies of the
homeless population in general, more men than women are identified as chronically homeless. Substantial
amounts of race data were unavailable for either comparison or HOPE clients. Thus, the indications of
race/ethnicity in the 831 data collection cannot be assumed as representative of all clientele participating
in the evaluation. However, available data suggest that there were more white participants across all
programs, followed by African-Americans and Hispanics, for all but Comparison Group 1 (C1) agencies.
In C1, more Hispanic than African-American participants are reflected in available data. Asians and
North American Indians represented about 1% of the total sample of available 831 data. Years of
education for participants in the evaluation groups were also not significantly different.
Findings: HOPE Programs and Comparison Agencies Groups 1 and 2
The time to determination analysis calculates the comparative SSA disability processing
time for submitted applications. Analyses are based on the computed time between the date a disability
application is filed and the date that SSA reached a decision about whether to allow or deny benefits to
the claimant. Time to determination calculations are made for each individual and aggregated by the
agency group with which the individual is affiliated—a HOPE program, or a comparison agency in
group 1 (that received the HOPE Program Orientation Manual), or a comparison agency in group 2 (that
did not receive a manual). With respect to the time to determination calculations, the following points can
be made:
1. Applicants sponsored by the HOPE programs received determinations about a month earlier than those in either comparison agency groups who received the HOPE Program Orientation Manual (C1) or agencies that did not receive the manual (C2).
2. There is no significant difference in determination times between comparison agencies that received the manual (C1) and agencies that received no support (C2).
3. There is little difference between determination times in HOPE programs that were matched to comparison agencies and in HOPE programs for which comparison agency records were unavailable. Thus, the results—i.e., that HOPE programs experienced shorter determination times than comparison agencies to which they were matched for analysis—is applicable to all HOPE programs.
xii

The allowance rate analyses are based on the percentage of individuals within each of the
agency groups (HOPE, C1, or C2) that received disability benefits based on their initial filing, or on a
reconsideration of an initial filing. The decision made for each individual is then aggregated by the
agency group. Analyses are conducted at an agency level. With respect to the comparison of allowance
rate findings, the following points can be made:
1. There is no significant difference between the HOPE programs and the comparison agencies (C1, C2) with respect to allowance rates.
2. There is no significant difference in allowance rates between the agencies that received the manual (C1) and those that did not receive the manual (C2).
3. There is little difference in allowance rates between the matching HOPE programs and the HOPE programs without data from matching comparison agencies. Thus, the results of the matched comparison—i.e., that there is little difference in allowance rates between HOPE programs and their matching agencies—is applicable to all HOPE programs.
Overall, the effectiveness of HOPE programs in achieving a quicker time to determination
for enrollees than for comparison agency clients was demonstrated. However, the efficiency of HOPE
programs to achieve higher disability allowance rates for their enrollees than for comparison agency
clients was not demonstrated. Qualitative analyses (highlighted below) revealed that numerous factors
(within an agency, or in a community or city, or within a State, or national trends in policies and resource
allocations) affected the number of individuals that were allowed disability benefits based on an initial or
reconsidered claim.
Analysis of the changes in living situation over 12 months indicate significant differences in
HOPE enrollees’ situations between the day they enrolled in the HOPE program and a year later.
Available data strongly suggest that improvements in housing situations for HOPE enrollees have
occurred. Smaller percentages of individuals are living on the streets, or outdoors, or in places not meant
for human habitation, or in emergency or transitional shelters than when they first enrolled in a HOPE
program. One year later, higher percentages of enrollees are living in subsidized public housing and other
unsubsidized settings, smaller percentages of enrollees are living in doubled up situations and smaller
percentages of enrollees are in institutions or correctional facilities. Changes in living status findings
support the idea that the HOPE programs have been effective in attaining a short-term outcome of
improvement in living situation.
xiii

Findings: Focus Groups Summary Analyses
In 2005, focus group data provided information about the ways in which the SSA
interventions and materials were used and understood by the staff in the 3 groups that participated in the
focus group sessions. The analytical themes reflected processes occurring during the first year of HOPE
programs’ operations. The analytical theme for each of the topic categories are presented below.
With respect to SSA-HOPE Program Orientation conference and materials, focus
groups participants reported that they:
Acquired or refreshed their knowledge about the SSA benefits application process through conference sessions and use of the Program Orientation Manual;
Valued networking opportunities with DDS, RO/FO liaisons and other grantees afforded by conference participation;
Articulated different interpretations of the “take home” message about expedited case processing and criteria for HOPE enrollment; and
Asserted the utility of adding material about completing application forms, DDS file reviews, and authorized representative practices to conference activities.
When asked to reflect on relationships between HOPE awardees’ staffs and DDS and RO/FO liaisons, focus group participants reported that they:
Acquired pragmatic and valuable information about necessary materials to complete DDS applications and
Were commonly afforded the chance to have in-service training sessions about practices and application processes that were initiated by RO or FO or DDS staff.
Another emergent theme highlighted the potential effects of regional contexts on implementation activities. Some of the conditions observed by participants included:
Disparities in fiscal or human capital resources available to grantees or liaisons which affect e.g., training opportunities, coordination efforts, and grantees’ or liaisons’ capacity to hire more experienced staff and
Grantees’ and liaisons’ prior or ongoing experiences with Federally-funded collaborative or coalition efforts in their region, State, or community (e.g., HUD Continuum of Care initiatives) had a positive effect on HOPE programs’ work processes.
xiv

Analyses also revealed thematic patterns in the perceived barriers to HOPE project implementation and the disability application process. Participants attributed obstacles in the
application process to:
Complexities involved in providing outreach, maintaining contact, and acquiring longitudinal histories from members in the target populations;
Bureaucratic impediments on local or regional levels that increase processing times; and
Operational criteria for client enrollment in HOPE projects.
Another theme emerging as significant for the evaluation of the HOPE project concerns the
strategies that HOPE staff, DDS staff, and SSA staff in Regional and Field Offices develop to surmount barriers they encounter. Specific strategies included:
Establishing routine contacts between program staff, and field office or DDS staff (e.g., monthly meetings, scheduled training);
Providing community providers and administrators with ongoing information about the HOPE project and grantees’ program objectives;
Participating in community provider or coalition meetings;
Using participation in provider or coalition meetings to build relationships and “network” with other providers in local or regional settings;
Initiating practices which improve outreach efforts (e.g., hiring formerly homeless individuals as “peer navigators” to assist other homeless individuals);
Developing HOPE services to help staff maintain contacts with enrollees (e.g., employment, meals, housing);
Hiring “proactive” staff with comprehensive knowledge of, and experience with, the SSA disability system for RO/FO, DDS, and HOPE staff positions; and
“Co-locating services” that make it easier for SSA applicants to receive medical and psychological exams needed for the SSA disability application (e.g., situating Consultative Examiners or psychologists in or near SSA field offices, State social service centers, shelters, or similar facilities).
Analyses also indicate that some unexpected developments occurred during the first year of
implementation. Some of these developments included:
Concerns that initial misapplication of enrollment criteria will result in fewer enrollees than is required of HOPE grantees;
xv

Concerns that non-expedited case processing for enrollee applications in the SSA system may result in lower or undisclosed allowance rates and missed opportunities to provide needed services to individuals in the target population; and
Concerns that people in target populations may be excluded from outreach efforts since they are not eligible (due to an apparent lack of a medically disabling condition).
Focus group data analyses in 2006 shed additional light on process evaluation themes that
were salient in 2005. Further, these data reveal heightened concerns about the ways in which HOPE
programs, specifically, or Project HOPE, in general, might have a positive impact on people who were
chronically homeless. Findings also reveal greater attention to (and frustration with) the SSA bureaucracy
and local homeless resources systems.
Focus group findings from 2006 reveal that the impact of the SSA interventions on HOPE
programs may be necessary, but not sufficient, to affect conditions that cause or perpetuate chronic
homelessness in certain situations. In some situations (i.e., specific DDS regions or specific
communities), the SSA interventions have had significant and positive impacts on the work of HOPE
programs. And yet, the SSA interventions have not uniformly had this reported affect on either the work
processes or apparent outcomes of HOPE awardees across the board.
Findings from focus groups in 2006 also revealed participants perceived that the impact of
SSA interventions in Project HOPE and changes in conditions which affect chronic homelessness is not
direct. Contexts are platforms from which the actors in HOPE programs operate, because contexts exert
particular effects on conditions that restrain or facilitate strategic actions and interactions. Data showed
that intervening conditions in specific regions where conditions are improving for the target population
have certain contextual elements (i.e., advocacy organizations serving the same population, low turn-over
rates among HOPE program staff, HOPE staff and FO or DDS liaisons that established cross-training
routines early in the project and have regular and on-going contacts). Focus group participants also
reported that some contexts are quite similar to those where conditions have started to change for the
population being served by Project HOPE but where positive changes are not (yet) in evidence.
Focus group analyses offered strong support for the claim that the networking opportunities
afforded by attendance at yearly SSA-HOPE conferences are very important to the array of HOPE actors.
This finding was first identified in the 2005 focus groups, and reinforced by findings from 2006 focus
groups. The majority of conference attendees in both years perceived that the annual conference is
effective (i.e., the intended outputs of HOPE programs are advanced as conference materials positively
affect and improve processes in use the HOPE programs and liaisons). It is a venue that is both valued
and useful in their HOPE work.
xvi

The additional data collection provided by the in-depth site visits during the summer of 2006
allowed Westat to collect clarifying information on themes identified in focus group analyses (e.g., about
situated perspectives, the encountered barriers to HOPE program operations, and on the strategies that are
cultivated by HOPE actors).
Findings: In-depth Site Visits Process Evaluation
In-depth site visits occurring between June-August, 2006 allowed the collection of process
data from five HOPE programs. Each of the sites were in different DDS regions of the county: Region 2
(Partnership for the Homeless, New York City); Region 1 (Shelter for the Homeless, Stamford,
Connecticut); Region 9 (Interfaith, Escondido, California); Region 5 (Healthcare for the Homeless,
Milwaukee, Wisconsin), and Region 10 (White Bird Clinic, Eugene, Oregon).
Site visit data analyses found that salient features of the HOPE programs and their
communities are primarily captured by the dynamic interplay between four factors: (1) the components of
the SSA intervention (e.g., technical assistance, networking); (2) the Federal disability processing and
regulatory system; (3) specific contextual factors in a HOPE program’s locale (including political-
economic issues); and (4) the HOPE program’s operational characteristics and work processes.
SSA Intervention
All programs theoretically obtained identical “inputs” from SSA. Programs sent attendees to
the annual SSA-HOPE conferences where staff attended plenary sessions, workshops, and had the
opportunity to network with their program liaisons in SSA field offices or SSA State offices, and with
their DDS liaisons. Programs received the same written materials from SSA (e.g., the HOPE Program
Orientation Manual). However, analysis revealed that there were divergent interpretations of instructions
and of HOPE program directors’ “common sense” notion of how the process “should” work. This
resulted in implementation activities that varied markedly from one HOPE program to the next. In many
respects, programmatic outcomes cannot be attributed to a specific SSA input because that input may
have emerged as a “theme and variation” once in the field.
xvii

Federal Disability Processing System
From the HOPE staff members’ perspectives, acquiring and applying the technical
knowledge needed to fill out a benefits claim form was necessary, but not sufficient, to address the goals
of HOPE programs. The bureaucracy that is the disability claims and assessments system presents all
kinds of contingencies that the savvy HOPE team had to address (i.e., “finagle”) in order to obtain
favorable reviews or needed housing or services for their clients.
Contextual and Economic Factors
Site visit data analyses repeatedly documented interviewees’ assertions that gentrification
negatively affects efforts to find and maintain contact with street homeless by the HOPE outreach
worker(s). Shifts which were required in the location of homeless encampments as development and
construction moved forward only complicated outreach and engagement efforts. Comments also
suggested that the intersection of contemporary political and economic trends (e.g., intentional redesign
of urban structures to preclude their use by people who are homeless and increasing wealth for some
segments of the population) can conflate the vulnerable situation already experienced by a homeless
population.
Gentrification processes are but one aspect of the mix of national, regional, and local factors
that complicated efforts of HOPE program staff to achieve project objectives. Others factors included:
local efforts to shift the costs of care for people who are homeless, indigent or have disabilities from
county to State or State to Federal doles; variations across the States in the availability and amounts of
public financial support; years-long (or closed) waiting lists for Section 8 housing subsidies; and the
extent to which homelessness was criminalized. All program sites were dealing with this potent mix of
conditions. Through interviews or in unstructured conversations with staff and clients, it was also
apparent that there was substantial variation in the ways in which the HOPE program communities’
manifested social and political will to address, resolve, or deny problems associated with chronic
homelessness.
HOPE Program Work Processes
Site visit analyses identified work processes associated with the programs’ reported
xviii

reduction in processing time and increases in the number of allowances. These processes included:
The dedication of an exclusive staff position(s) for a HOPE Claim benefits specialist;
No or low staff turnover in the HOPE program and in the SSA and DDS offices or the capacity to accommodate turnover among key staff;
Program staffs’ acquisition and application of an increased knowledge about the demands of the SSA disability processing system and application requirements for documentation; and
The development, cultivation, and nurturance of ongoing relationships with HOPE collaborators and partners and with other providers in the HOPE communities.
Findings: Urban Contexts and Persistent Homelessness
Comments from key informants for the process evaluation about the socio-economic and
political arenas within which they implemented HOPE programs returned us to an examination of factors
first associated with the emergence of homelessness in the 1980s (see, e.g., Burt 1991). Factors analyzed
in 1991 (Burt, 1991) that predicted 1989 homelessness rates in large (over 100,000 population) U.S. cities
were examined for the five cities that received HOPE evaluation site visits. A table compiling contextual
features for these cities (e.g., housing rates, employment structures, cost of living) and when available, a
comparable finding for the U.S., as a whole, is explored in relation to qualitative findings and outcomes
analyses for the Project HOPE evaluation. Project HOPE actors noted the intersection of many or all of
these factors with the perpetuation of homelessness in their locales.
Conclusions
Analysis conducted with data available for the independent evaluation of Project HOPE
reveals that significant benchmarks for the demonstration were reached. Compared to similar agencies in
their areas which did not receive HOPE funding but served a similar population, HOPE programs were
more effective. The people who were chronically homeless and had a disability and whom HOPE
program staff helped file SSA disability benefit applications received SSA determination decisions about
those applications more quickly. This reduction in processing time was one of the objectives for Project
HOPE. Another indicator of HOPE programs’ effectiveness is suggested by changes in living situations
experienced by HOPE program enrollees 12 months after enrollment. Findings support the claim that
HOPE programs have been effective in assisting many individuals with histories of chronic homelessness
xix

who experience disabling conditions find more appropriate housing situations. That is, by adopting and
applying the practices recommended by SSA in their daily work (processes), the HOPE programs have
helped enrollees acquire better housing (outcomes). Qualitative analyses were especially important for
understanding why, and how, Project HOPE was able to operate effectively.
Qualitative methods were equally important for uncovering factors in local areas that
thwarted efforts to attain higher allowance rates than were anticipated for Project HOPE. The rates at
which HOPE programs attained disability benefits allowances from an initial (or reconsidered) claim
were not significantly different that the rates attained by comparison agencies in the HOPE locales during
the evaluation period. HOPE enrollees were no more likely than comparison agency clients to receive a
determination that resulted in an SSA award of SSI or SSDI based on their initial applications. Qualitative
findings, with conceptual and empirical support from contemporary research studies, illuminated how
contextual factors, such as employment structures, cost of living, or a dearth of low-income or subsidized
housing influence the outputs of a local system for which these elements are inputs. If outputs, such as
disability allowance rates, are being broadly influenced by strains in State or Federal resources allocated
or available for disability entitlements, it is plausible that the efficiency outputs that Project HOPE
intended to achieve could not be attained. Support for this finding is underscored by quantitative analyses
which reveal insignificant differences in disability allowance rates among HOPE programs and
comparison agencies in the same areas. Thus, HOPE programs and comparison agency groups both
achieved an allowance rate of approximately 41 percent from initial disability claims.
xx

1. INTRODUCTION
Congress appropriated funds for the Social Security Administration (SSA) to conduct
outreach and application assistance to people who were homeless and to other under-served populations.
SSA used these funds to develop and implement the Homeless Outreach Projects and Evaluation (HOPE)
demonstration in 2003. The project provides funding for 41 HOPE programs3 across the nation that
conduct outreach to people who are chronically homeless and have a disability. HOPE programs assist
eligible individuals with filing SSA disability benefit applications and accessing mainstream treatment
and services (e.g., housing, mental health care). SSA provides information about the disability application
process and ongoing technical assistance to HOPE programs. SSA intends that the programs will
effectively reach and identify people who are chronically homeless so they can receive the assistance and
care they need. SSA also intends that the information and technical assistance provided to HOPE
programs will increase the efficiency of the disability application process for those clients, and thus
reduce case processing time at SSA and reduce denials for initial claims from individuals who are eligible
for disability entitlements under SSA rules.
Westat, an employee-owned private research firm in the Washington, D.C. area, was
contracted in 2004 to provide an independent evaluation of Project HOPE for SSA. Westat has analyzed
processes and outcomes of the funded HOPE programs. This is the final evaluation report. The key
research questions Westat has examined are whether Project HOPE and the HOPE programs it funded
have been efficient and effective in accomplishing the intended outcomes of the project. We have used a
mixed methods approach to the collection and analysis of data (i.e., both quantitative and qualitative
methodologies inform our findings). The timeframe for the quantitative data collection and analyses
presented here is June, 2005 through April, 2007. The qualitative data collection and analyses timeframe
is a bit longer, from January, 2005 through April, 2007. The conclusions of the evaluation reflect a
synthesis of all data collected and analyzed.
In the next section of the report, we briefly review the larger context of homelessness in the
United States. The discussion of homelessness issues which gained national attention in the 1980s
highlights factors that recur in contemporary analyses of causes and proposed solutions for resolving
chronic homelessness. The discussion also highlights the ways in which SSA has sought to address issues
related to this phenomenon, culminating with its development of the Project HOPE demonstration project.
3 In this report, “Project HOPE” is used to refer to the collective, federal or SSA-level activities or events (e.g., the Project HOPE evaluation, the annual conference for Project HOPE). In contrast, “HOPE programs” are used to describe community or awardee-level activities and events (e.g., HOPE programs deliver specific core services).
1-1

Following this overview, we provide a summary map to the materials in this report and how it has been
organized.
1.1 Homelessness emerges as a national issue
Decades after the 1930s Great Depression in the United States, homelessness re-emerged as
a national concern during the 1980s (see, e.g., Hombs and Snyder, 1982; Burt and Cohen, 1988; Rossi,
1989). The economic recession of 1981-1982 has been cited by researchers (e.g., Burt, 1991, Jencks,
1994) as one important impetus for its reemergence. Other researchers connect significant increases in
homelessness to the acceleration of deinstitutionalization during the 1970s (e.g., Lamb, 1984; Hopper,
2003; Hombs and Snyder, 1982). During deinstitutionalization, many State mental hospitals around the
country closed and returned patients to their former communities of residence where treatment and other
supportive and community-based services were to be provided (Brown, 1985). Studies also document that
the emergence of significant homelessness during these years coincides with reductions in Federal
funding for housing subsidies to eligible low-income individuals or families (http://www.cbpp.org/2-1-
07hous.pdf, Burt, Aron, and Lee 2001). However, a causal link between Federal funding shortfalls for
housing subsidies and homelessness has also been a subject of controversy (e.g., Jencks, 1994).
Additional political and socio-economic analyses of homelessness and the trends in Federal
outlays from the 1970s into the early 21st century examine budget declines in other areas. During these
years, Congressional appropriations to fund an infrastructure of community-based treatment and support
services for people who were homeless or had disabilities or were living in poverty declined
(http://www.cbpp.org/2-1-07hous.pdf, Brown, 1985) or were not released (Brown, 1985; Moynihan,
1984). In an analysis of the factors that predicted 1989 homelessness rates in 189 large U.S. cities, Burt
(1991) acknowledges that declines in social service spending are positively associated with some of her
findings. In her conclusion, however, Burt notes that two of the “most intransigent of the factors
identified” in predicting urban homelessness rates were “employment structure and the increasing
mismatch between incomes and cost of living” (Burt, 1991, p. 931). That is, unemployment, under-
employment, and low wage rates experienced by the poor and near-poor in cities where the cost of living
is high and rental vacancy rates are low absorb “unacceptably high proportions of the income of poor
households” (ibid.). Burt’s summary and straightforward conclusion embodies the multi-faceted findings
about the causes of homelessness documented in research: “many societal changes converged during the
[1980s] to make it increasingly difficult for poor people to maintain themselves in housing” (ibid.).
1-2

Taken as a whole, the earlier studies about the causal and contributing antecedents of
homelessness are striking in their similarity to the contemporary understanding of homelessness and
assertions about its causes and factors associated with it. The excerpt below from a 2006 fact sheet on
Chronic Homelessness from the National Alliance to End Homelessness (NAEH) makes this clear:
There are now 5.2 million more low-income households that need housing than there are affordable housing units. Furthermore, communities did not develop nearly enough housing and services for people with mental illnesses to replace the institutions they were closing. At the same time, other forces were reshaping the landscape for low-income Americans. The economy was shifting from having an abundance of low-skilled jobs, to one in which those jobs were rare. New and powerful illegal drugs came onto the scene. Public resources to assist low-income people did not keep up with their growing needs. These forces combined to create widespread homelessness. Each year, as many as 3.5 million people will experience homelessness (NAEH, 2006).
The societal response to burgeoning homelessness in the 1980s was the passage of the
McKinney Act in 1987. Reauthorized by Congress in 2007, it has been and continues to be a critical
support for Federal efforts to address homelessness issues. The legislation funded a range of 15
emergency services (e.g., shelter, food, primary and mental health care) and nine Titles authorized the
provision of specific programs by Federal agencies (e.g., Title IV, shelter and transitional housing
programs to be administered by HUD; Title VI, health care services, including primary and mental health
care, to be administered by Department of Health and Human Services).
Title II of the McKinney Act established an Interagency Council on Homelessness (ICH).
Leaders from 15 Federal agencies that are charged with coordinating efforts to assist people who are
homeless sit on the ICH. Notable among its members is the Social Security Administration (SSA), which
was recognized has having “a long history of providing service to the American public that includes
access to [SSA] programs … by homeless populations.”4 Benefit programs such as retirement, survivor,
and disability insurances (RSDI) and Supplemental Security Income (SSI) programs were cited as
essential services for people without housing or other resources. Project HOPE exemplifies SSA’s
ongoing efforts to assist people who are homeless.
When Project HOPE was funded in 2003, the number of homeless people in the United
States was estimated to be 800,000 (U.S. Conference of Mayors, 2003; U.S. Interagency Council on
Homelessness, 2003). According to the most current data available (i.e., the U.S. Department of Housing
4 U.S. Interagency Council on Homelessness, 2003 Annual Report Social Security Administration, http://www.socialsecurity.gov/homelessness/) SSA Report to Congress, SSA ICH Report).
1-3

and Urban Development point-in-time count5) in January, 2005, 754,000 people were identified as
homeless. In this group, 415,000 were in emergency shelters or transitional housing, and 339,000 were
unsheltered (http://www.hud.gov/offices/cpd/homeless/library/homelessnessfactsheet.pdf). As the
President of the National Alliance to End Homelessness noted at its annual conference in July, 2007,
“There are places where the overall number of homeless people is down … [and] places where certain
subsets of the homeless population—chronically homeless people or homeless families – are down”
(NAEH, 2007). It is clear, however, that despite progress in a number of localities, and an apparent
reduction in the count of people without housing, homelessness continues to be a significant social issue.
Twenty years have passed since the enactment of the McKinney Homeless Assistance Act.
The Interagency Council on Homeless (ICH) has worked closely with the Social Security Administration
(SSA) during much of that time. In the last decade, SSA and other ICH member agencies have benefited
from Federally-funded evaluations of services and programs designed to serve people without housing.
Much has been learned about the causes of homelessness, about the characteristics of people who become
homeless, about the types of supports required by individuals who are homeless, and about the outcomes
of efforts to reduce or end homelessness (e.g., Burt et al., 1999; Metro Denver Homeless Initiative, 2006;
Multnomah County, 2006; NAEH, 2005; NAEH, 2007). Important data about people who are homeless
have been compiled, and evaluations of services have generated evidence about “best” or “promising
practices” well-suited to the target population (see, e.g., http://aspe.hhs.gov/homeless/symposium/6-
Outreach.htm, SAMHSA, 2003).
Special attention has also been devoted to identifying the duration of homelessness and
assessing the utilization of public resources (e.g., emergency shelters, emergency rooms, hospitals, VA
hospitals, jails, prisons, outpatient health care, emergency and outpatient mental health clinics) by people
who are homeless (e.g., Kuhn and Culhane, 1998). In part, these findings have helped inspire policy
initiatives (e.g., U.S. Department of Housing and Urban Development’s, Continuum of Care
(http://www.thecontinuumofcare.org/default.asp?page=home)) and programs (e.g., Housing First
(http://www.housingfirst.net/about.html)) which posit the provision of housing and services to chronically
homeless individuals as a pragmatic, cost-savings approach (see, e.g., Mitka, 2006). Highlights of these
trends are reflected in the findings reported below:
The majority of people who experience homelessness in a year are single adults who enter
and exit the homeless system fairly quickly … 80% of these adults use the system once or twice, stay just
5 The Department of Housing and Urban Development (HUD) requires communities competing for its homeless assistance dollars under the Continuum of Care (CoC) planning process to conduct biannual point-in-time counts of sheltered and unsheltered people who are homeless. The funding application requires CoCs to produce “statistically reliable, unduplicated counts or estimates of homeless persons in sheltered and unsheltered locations at a one-day point in time” (http://www.hud.gov/offices/cpd/homeless/library/webcast101006/point_in_time_slides.pdf ).
1-4

over a month, and do not return. Approximately 9% enter the system 5 times a year, stay about two
months each time, and utilize 18 percent of the system’s resources. About 10% of the individuals who are
homeless “enter the system just over twice a year and spend an average of 280 days per stay—virtually
living in the system and utilizing nearly half of its resources” (Kuhn and Culhane 1998 in NAEH, 2007).
These summary trends are not static, however.6 Moreover, policy implications associated
with conclusions linked to the reportedly disproportionate use of homeless system resources by
chronically homeless people have also been contested (see, e.g., National Policy and Advocacy Council
on Homelessness at http://www.npach.org/chronicq.html).
Nonetheless, there is widespread consensus about the significant coincidence of disabling
conditions and persistent homelessness. People in this latter cohort are defined as “chronically homeless,”
and hallmark criteria have been identified for use of this label by the Department of Housing and Urban
Development (HUD). The operational definition used by HUD is the basis from which eligibility for
specific types of housing vouchers, certificates, or subsidies is made. Individuals must document that they
are chronically homelessness according to the definition stated below.
A person who is chronically homeless is an unaccompanied homeless individual with a disabling condition who has either been continuously homeless for a year or more, or has at least 4 episodes of homelessness in the past 3 years and must have been sleeping in a place not meant for human habitation and/or living in a homeless shelter. A disabling condition is defined as a diagnosable substance abuse disorder, serious mental illness, and/or a developmental disability including the co-occurrence of 2 or more of these conditions. A disabling condition limits an individual’s ability to work or perform 1 or more activities of daily living (Federal Register, 2003).7
SSA became involved in issues focusing specifically on chronic homelessness early in the
21st century. In support of a 10-year plan to end chronic homelessness initiated by President Bush in 2001,
SSA developed an agency-wide plan to address homeless plans and activities. The objectives of the plan
(SSA, 2003) are to identify and remove barriers for people without housing who wish to access SSA
programs, identify areas of improvement in current activities and recommend improvements, develop and
expand SSI/SSDI (or other entitlements) outreach and application assistance to individuals who are
homeless, identify persons applying for SSI/SSDI who would likely benefit from having a representative
payee, and address service delivery issues through collaborative initiatives.
6 In its 2006 annual report, the U.S. Conference of Mayors’ Hunger and Homelessness Survey reported that “people remain homeless an average of eight months in the [23 large] survey cities. Thirty-two percent of the cities said that the length of time people were homeless increased during [2006]” (U.S. Conference of Mayors, 2006).
7 This definition is shared by the U.S. Department of Housing and Urban Development, the U.S. Department of Health and Human Services, and the U.S. Department of Veterans Affairs.
1-5

Drawing on an array of compiled information about what often characterized people who
experienced chronic homelessness; about their unmet needs in physical, social, and economic areas, and
in light of lessons learned about best practices when engaging with the target group, SSA created the
Homeless Outreach Projects and Evaluation (HOPE) demonstration project. The objectives of Project
HOPE are informed by the acquired knowledge about people who are/have been homeless for long
periods of time, or have repeated episodes of homelessness. The information about the disability
processing system, coupled with technical assistance provided by SSA for HOPE grantees, are designed
to help HOPE programs confront and surmount the characteristic experiences and barriers which are
known to frustrate attempts to resolve chronic homelessness (e.g., lack of family support or social
networks, untreated medical, psychiatric, and substance or alcohol use disorders, circumscribed daily
living skills, attenuated or interrupted formal education, limited job training, persistent unemployment,
limited job skills, and broken ties to local social service systems). The scope of the demonstration project
and its operational assumptions are described in the next discussion section.
1.2 Social Security Administration and the Homeless Outreach Projects and Evaluation (HOPE) demonstration program
In 2003, SSA announced the availability of the HOPE cooperative agreement funding to
support projects that “provide targeted outreach, supportive services, and benefit application assistance to
individuals who are chronically homeless.” In May, 2004, 34 public or private organizations received
HOPE funds to serve this target population. In November, 2004, 7 additional agencies received HOPE
funding.
The SSA published the primary objectives for these projects in a Federal Register program
announcement. Relevant passages from the announcement are excerpted below:
SSA is making cooperative agreement funding available to demonstrate methods to improve the quality of assistance that medical and social service providers give to homeless individuals who file claims for Social Security benefits. …
SSA will train staff of organizations that are awarded funding under this announcement. The focus of the training will be to improve participant knowledge about SSA’s requirements for disability case processing. SSA will conduct an evaluation of projects, with a focus on the impact that training has on the quality of assistance provided to disability claimants by the grantee (Federal Register, 2003, p. 55698)
1-6

Several critical assumptions for Project HOPE are articulated in these passages. First are the
expected effects of the SSA intervention for HOPE awardees. If SSA provides information needed to
undertake HOPE work, offers competent technical assistance, and structures networking opportunities
among and between grantees and their SSA Field Office (FO) and DDS (Disability Determination
Services) contacts, then grantees will increase their knowledge about both the disability processing
system and best practices. For purposes of the evaluation, this bundle of SSA activities –information-
sharing, technical assistance, and provision of structured networking opportunities with other grantees
and identified liaisons in the processing system— is defined as the SSA “intervention” for Project HOPE.
These inputs, the components in the intervention bundle, are expected to expand grantees’ capacity to
outreach and engage individuals who are homeless and have a disability, and result in grantees submitting
better quality disability benefit applications for claimants.
Another important assumption embodied in the Project HOPE design is that these processes
will efficiently lead to intended outcomes. That is, these focal activities will reduce the time required by
SSA to process initial claims, will result in higher benefit allowance rates for clients enrolled in HOPE
programs, and will justify the costs of Project HOPE. The anticipated long term outcomes for Project
HOPE include bringing increased numbers of the target population into the SSA disability system,
connecting them to mainstream resources, and thereby bring an eventual end to chronic homelessness.
Such changes will also ultimately improve the quality of daily life for people enrolled in HOPE awardees’
programs as participants become more fully integrated into productive and satisfying lives in their
communities of residence.
To qualify for HOPE funding, HOPE programs have to address three requirements. First,
grantees are to provide outreach, supportive services, and help people who are chronically homeless file
their applications to SSA for benefit assistance (e.g., SSI, SSDI). Second, grantees are expected to target
service delivery to homeless individuals in under-served groups (i.e., veterans, children with disabilities,
and people with a disabling impairment, mental illness or other cognitive disorder, limited English
proficiency, in jail and institutions, multiple impairments and co-occurring disorders, and symptomatic
HIV infections). Third, grantees agree to cooperate and participate in evaluation activities. Developing
other services and capacities are encouraged and permitted with HOPE funding. They are described as
optional, rather than core, activities. Programs can use HOPE funding to establish disability screening
procedures, to increase capacity to provide representative payee (RP) services to beneficiaries, to
strengthen staff abilities to assist in filing electronic disability applications, or to develop an employment
intervention.
1-7

The demonstration project was designed so that awardees could rely on the information,
ongoing technical assistance, and liaison relationships with SSA Field Office (FO) staff and Disability
Determination Services (DDS) staff that SSA established for HOPE awardees to accomplish their
objectives. That is, by enhancing HOPE program staffs’ ability to use best practices in their outreach to
the target population and by increasing staffs’ knowledge about disability case processing at SSA, HOPE
programs would identify and serve people who were chronically homeless and had a disability. By
helping these individuals file successful claims, HOPE enrollees would quickly receive SSA disability
entitlements and income and be able to access essential services and treatments from community-based
resources.
When SSA contracted with Westat to evaluate the effectiveness and efficiency of Project
HOPE in 2004, we used a particular theoretical approach to guide a comprehensive examination of the
inputs, processes, outputs, and outcomes involved in achieving the project’s objectives. This report
evaluates the final outcomes of those efforts8. The theoretical framework used to structure the
independent evaluation work tasks is presented in the next discussion section.
1.3 Overview of Project HOPE and Evaluation Plans
Westat used an “open systems” model (French & Bell, 1984; Katz; 1978; Miles, 1980) as a
framework for the Project HOPE evaluation. The open systems model allows a thorough examination of
key components in an operating system that affect the efficiency and effectiveness of programs. As
shown in Figure 1-3, the model posits specific relationships between four integral components in an
operating system: inputs, processes, outputs, and outcomes.
8 The task order also asked that the contractor assess HOPE programs’ sustainability and the replicability of the evaluation design. The evaluation design cannot be replicated as implemented due to the use of comparison agencies, rather than statistical control groups. Data about HOPE programs’ plans to sustain activities were unavailable when the evaluation data period ended (April 30, 2007). The third HOPE conference, usually held in April, was scheduled in October, 2007. Thus, the collection of focus group data on these issues did not occur. The quarterly report data that were available for the evaluation largely indicated that sustainability planning was deferred for many programs due to an extension of HOPE programs’ funding for an additional contract year.
1-8

INPUT PROCESS OUTPUT OUTCOME
Efficiency
Effectiveness
Figure 1-3a. Open Systems Model
Inputs are resources that are needed to set processes in motion and keep them running. Some
examples of inputs are staff, policies, resource networks, facilities, and funding. Within a working open
systems model, specific program inputs must be in place before proposed processes can function
properly. Processes are the event sequences and arrangements of staff, services, and resources needed to
achieve the intended results. When inputs are in place and processes are functioning as intended, then
outputs and outcomes are produced. Outputs, often referred to as products, are the “units” produced by
processes and supported by given inputs. Examples of HOPE awardees’ outputs include giving informed
assistance to people filing initial disability claims with SSA as well as the delivery of –or successfully
linkage to--services for people who are chronically homeless. Outcomes refer to the intended results of
creating certain outputs/products. For Project HOPE, intended outputs include high quality disability
applications which contain complete and verifiable medical and other needed information. One intended
outcome from high quality disability applications is a reduction in SSA administrative costs. Costs are
reduced when the information needed to make a determination about benefits is complete and available to
the SSA and DDS reviewers. Another intended outcome from the submission of better SSA applications
is that more claimants will be allowed benefits when they file their first claim. Since disability
entitlements provide income and greater access to mainstream social services such as housing or medical
care, etc., another intended outcome is an improvement in the claimants’ quality of life. The paramount
intended outcome would be an end to chronic homelessness.
Effectiveness in the open systems model is defined as the relationship between the outcomes
achieved and the processes used to attain them. If the processes of the Project HOPE ‘system’ (i.e., the
liaison-grantee and grantee-grantee networking; SSA’s provision of technical assistance; and SSA’s
dissemination of information about best practices and the disability processing system) result in the
1-9

intended outcomes (i.e., the submission of high quality disability applications which reduce the time SSA
and DDS need to determine whether disability entitlements should be allowed), then the operations of
Project HOPE are effective. Since some outcomes are more readily achieved than others, it is useful to
conceptualize outcomes in the model as short-term and long-term. (For instance, one finding from the
analysis of in-depth site visit data to five HOPE programs suggested that certain influences can retard or
advance processes that result in eligible individuals getting disability entitlements soon after their initial
application is filed. Examples include the effect of the criminalization of homelessness, which may hinder
outreach to chronically homeless people. In contrast, the presence of community-funded supportive
services in some HOPE program locales hastened the engagement of enrollees in activities related to
filing SSA disability applications.)
Efficiency within the model is assessed through a comparison of inputs and outputs. If
Project HOPE operations are efficient, then its inputs (e.g., Federal funding; the accuracy and
comprehensiveness of the information prepared for grantees) facilitate the work—or outputs—of HOPE
program staff. Expected outputs of staff efforts include successful outreach, engagement, and nurturance
of relationships with enrollees that lead to enrollees’ acceptance of help with filing for disability
entitlements and to their acceptance of services and housing. Intended outputs include the production of
disability applications that result in the allowance of benefits upon the initial or first reconsideration for
(eligible) HOPE enrollees. Seen through the lens of this model, if the inputs are adequate to produce the
outputs, and the recommended processes are relied on to produce those outputs, then Project HOPE
operations are efficient.
In Figure 1-3b, the components of Project HOPE that were used to conceptualize the
demonstration project as a model “open system” are shown. The salient variables within each of the
component categories (inputs, processes, outputs, and outcomes) are identified. The variables which were
examined and analyzed for the final evaluation of Project HOPE are shown. (Variables which were not
explored or for which data were unavailable for the evaluation appear in italics within the table.)
1-10

Inputs Processes Outputs Short-term outcomes
Long-term outcomes
Federal funds for Project HOPE
SSA program orientation (information, time, materials)
SSA technical assistance in best practices
SSA Field Office and Disability Determination Services’ liaisons for each HOPE awardee
HOPE staff gain knowledge about SSA disability processing system requirements and best practices for outreach, engagement, etc.
HOPE staff network with SSA liaisons and other grantees
HOPE staff develop, provide, or refer enrollees to core and optional services (rep. payee, presumptive disability, pre-release filing)
HOPE staff collaborate with providers in their locale
People who are chronically homeless and have a disability apply for SSA disability entitlements
HOPE programs submit high quality disability applications (e.g., information is verifiable and complete)
HOPE enrollees receive core and optional services (housing, medical, and mental health care, support services, employment assistance, etc.)
HOPE staff use best practices and apply knowledge acquired
Time to initial determination of SSA disability entitlements award is reduced
More disability benefits are allowed at initial filing
SSA administrative costs are reduced
People who are chronically homeless and have a disability receive SSA disability entitlements
The quality of life for beneficiaries improves
High quality benefit application assistance continues
HOPE programs sustain activities without additional funding (e.g., by braiding/blending community funds)
Other programs replicate core HOPE program activities
More people who are chronically homeless receive SSA benefits
The quality of life for beneficiaries improves
Develop an infrastructure to address unmet needs
Chronic homelessness ends
*Italics indicate areas for which quantitative data were not available and could not be assessed for the evaluation. When possible, qualitative data were collected in these areas.
Figure 1-3b. Open Systems Model Framework for Project HOPE evaluation*
The open systems model is particularly useful for evaluating the operations and
implementation activities of a demonstration project. It facilitates the articulation of the mixed-
methodologies approach Westat used in its evaluation. The knowledge gained through an in-depth,
qualitative process evaluation component conducted in 2006 enlarges the understanding of quantitative
data analyses of the SSA administrative data (i.e., the 831 files), especially when statistical findings are
less robust than expected. By collecting information about each of the model’s components, the
framework provides a way to clarify interrelationships between the elements and how they are integrated
into the operations of Project HOPE as an “open system.”
1-11

1.4 Evaluation Tasks and the Data Collection Overview
To determine whether Project HOPE operations were efficient, the relationship between the
outputs that result from the HOPE programs’ cooperative agreements (e.g., the number of applications
submitted, the completeness of evidence submitted with applications) and the SSA-provided inputs to the
program (e.g., the accessibility of information about the disability processing system or the usefulness of
technical assistance) were assessed. To determine effectiveness, the relationship between the desired
outcomes of Project HOPE and the SSA provision of focused information and technical assistance were
assessed using a control (comparison) case design. The desired outcomes are reduced case processing
time and higher disability benefits allowance rates for eligible people, as facilitated by higher quality
applications. The comparison case design allowed the assessment of SSA’s assistance to HOPE awardees
in contrast to the limited assistance typically given to community support programs.
To implement the control case design, outcomes data were collected for HOPE programs
and also for community agencies conducting similar work with a similar population. Using administrative
data acquired from SSA for participants in the evaluation, final analyses assess differences between
outcomes for HOPE programs and for matching comparison agencies in the same areas using two key
indicators: time to determination and allowance rates. Time to determination comparisons calculate the
time between the date a disability benefit application is filed and the date that a decision about whether to
allow or deny benefits to the claimant is recorded in the SSA file. Allowance rate comparisons compile
the administrative data about the determination results (to grant or deny disability benefits) for each
individual in each of the HOPE programs or a comparison agency to compute an allowance rate (at an
agency level) for each HOPE program or comparison agency. Statistical procedures are used to analyze
whether there are significant differences in allowance rates for HOPE programs in contrast to comparison
agencies’ allowance rates. (Chapter 2 provides additional detail about this aspect of the design.)
Westat designed the HOPE evaluation to answer key evaluation questions posed by SSA:
Do the outcomes demonstrate that the SSA intervention led Project HOPE awardees to use processes that helped them effectively produce high quality disability applications and ensure that program enrollees had access to needed services?
More specifically, did SSA’s provision of information, technical assistance, and structured networking opportunities result in higher quality applications and so shorten the time needed to determine approval of entitlements?
Do the outcomes demonstrate that the outputs of HOPE awardees were an efficient use of the inputs dedicated to Project HOPE?
1-12

More specifically, do outcomes demonstrate that the investment of Federal funds and SSA labor-time helped to reduce SSA’s disability application processing costs by allowing entitlement benefits based upon an initial disability claim?
Westat devised a system for data collection which detailed how various qualitative and
quantitative sources would be collected and synthesized for final analyses. The Methods Chapter (2),
which follows, presents details about these approaches and how they were applied. We conclude this
introductory discussion by detailing how the rest of this report is organized and the content in each of the
following Chapters.
1.5 Organization of the Report
The evaluation report for the Social Security Administration Homeless Outreach Projects
and Evaluation (HOPE) task order has been organized in chapters which address topical areas that are
germane to the context, design, and implementation of the evaluation strategies and to the identification
of data needed to address the evaluation questions and the collection and analysis of those data. The final
chapters of the report present the findings of analyses and a discussion of their importance. The document
concludes by offering recommendations to SSA based on the evaluation findings. The implications for
other demonstration projects SSA that may wish to pursue which develop interventions for individuals
who are chronically homeless are also considered.
In the preceding introduction, we reviewed the emergence of homelessness as a national
issue. Research conducted during the 1980s identified certain social factors and trends that contributed to
its emergence and may be implicated in its persistence. The review included attention to contemporary
studies which informed the design of Project HOPE. That is, recent studies have documented that while
most people are homeless for relatively short periods, there is a significant association between chronic
homelessness and the experience of significant disability (or multiple disabilities). In this chronological
view, we noted the advent of the McKinney Act legislation and Federal agency responses to its
emergence, and located the Project HOPE demonstration project in this context. We also reviewed the
theoretical (“Open Systems”) model which structured Westat’s approach to the design and evaluation of
Project HOPE processes and final outcomes. The key research questions for the evaluation were also
highlighted in the discussion.
In Chapter 2, the methodologies which were used to identify relevant data sources and
design a system to collect, articulate, and synthesize data from these sources are presented. The types of
quantitative and qualitative data collected for the evaluation are highlighted in the discussion. A detailed
1-13

description of the comparison case design and how data were selected for final, outcome analyses are
discussed. The methods used to analyze collected data are discussed, and the software platforms for
analyses (e.g., Atlas.ti, SAS) are noted. The discussion highlights Westat’s approach to outcome analyses,
such as survival analysis (i.e., the LIFETEST procedure in SAS) used in the “time to determination”
calculations which assesses the strength of differences between outcomes achieved by HOPE programs
versus comparison agencies.
In Chapter 3, the findings for the evaluation of Project HOPE are presented. We begin with a
broad perspective by examining what HOPE programs accomplished in contrast to similar agencies in
their areas using quantitative data and methodologies. Then, we focus on the kinds of processes and
strategies that HOPE programs relied on to accomplish what they did, drawing on qualitative data
collection and analyses. The chapter begins with a discussion of data collection issues that presented
particular challenges to process and outcomes analyses. Demographics of the final sample are reviewed.
Results from the comparative analyses of the SSA administrative data (i.e., the SSA 831 file) collected for
HOPE program enrollees and for clients in designated control group agencies are presented next.
Outcome analyses were conducted only for HOPE enrollees and comparison agency clients
for whom a valid consent form was received and whose administrative record contained an application
filing date; a date when a determination decision was made; and the result of that decision. The major
findings here are time calculations (i.e., months between the filing date and the decision date) and
allowance rates (i.e., whether disability entitlements were granted or denied). Individual-level data are
aggregated for reporting at an agency level (i.e., HOPE or comparison), and the analyses address key
questions about the efficiency and the effectiveness of Project HOPE operations. Results of additional
non-parametric statistical procedures used to explore other outcome data (e.g., changes in HOPE
enrollees’ living situation between their intake and a followup point 12 months later) are also presented.
Qualitative process evaluation analyses are also provided in the chapter. These results situate
the HOPE programs in their particular contexts. In the review of process evaluation findings, we include
highlights from the analyses of six focus groups conducted with HOPE program staff, SSA field office
and region office personnel, and Disability Determination Services staff that were held during the 2005
and 2006 SSA-HOPE conferences in Baltimore (one session was held with each of the groups at each
conference). Process evaluation information was also obtained from ongoing qualitative analyses of
HOPE awardees’ quarterly reports from 2004-2007. A significant source of data for the process
evaluation was a “qualitative component” which was added through a contract modification in 2006. This
modification allowed the collection of data from five HOPE programs during in-depth site visits.
1-14

Qualitative analyses, primarily informed by grounded theory and cultural anthropology methodologies,
were undertaken with these data. Highlights of that report are provided in the discussion.
Chapter 3 concludes by noting how the results of quantitative and qualitative analyses used
for the Project HOPE evaluation illuminate the significance of context. In the final discussion section of
the chapter, key findings from qualitative and quantitative analyses are presented in a broad, comparative
context that underscores how the results from the Project HOPE evaluation reflect enduring issues which
affect the phenomenon of persistent homelessness in urban setting.
In Chapter 4, the significance of the findings is discussed within the context of Project
HOPE and the work accomplished by HOPE programs. The document concludes by offering
recommendations based on the evaluation findings. The concluding discussion emphasizes how the
impact of specific contextual elements (e.g., employment structures, cost of living) in HOPE program
locales—whose influence was primarily revealed during the qualitative examination of Project HOPE
processes—inform the interpretation of the final outcomes. We conclude by suggesting factors that may
be particularly important for planning a future demonstration project which targets this same population
by the Social Security Administration.
Following the concluding chapter and a reference list, there two appendices. Appendix A
provides an reference list for the acronyms used in this document. Appendix B provides a breakdown of
the DDS (Disability Determination Services) geographic regions designated in the evaluation.
1-15

1-16

2. METHODS
The overarching goal of Project HOPE and of the 41 HOPE programs which received HOPE
funding is to identify individuals who are chronically homeless and have a disability that are eligible for
benefits under an SSA disability program and provide knowledgeable disability application assistance to
them. The methodological approach to the collection and analysis of data for the Project HOPE
evaluation sought to determine the effectiveness and efficiency of the demonstration program and the
degree to which HOPE programs accomplished their objectives. The key research questions which guided
the evaluation are:
Do the outcomes demonstrate that the SSA intervention (i.e., the provision of information, technical assistance, and structured networking opportunities to awardees) led Project HOPE awardees to use processes that helped them effectively produce high quality disability applications and ensure that program enrollees had access to needed services?
Do the outcomes demonstrate that the outputs of HOPE awardees were an efficient use of the inputs (i.e., the investment of Federal funds and SSA labor-time) that helped to reduce SSA’s disability application processing costs by allowing benefits based on the initial disability claims?
Arrays of data were collected in the primary theoretical categories (i.e., inputs, processes,
outputs, outcomes) needed to determine the effectiveness and efficiency of Project HOPE operations and
the extent to which its intended results were achieved. Information about the SSA intervention inputs to
HOPE awardees (e.g., about the written materials, the technical assistance provided by the HOPE
liaisons, and the content of annual conference seminars and workshops) were collected. Background
information about the HOPE awardees were also collected from SSA, represented by their HOPE
proposal narratives, which provided data about the types of processes program sites had used in the past
and expected to use in the HOPE programs. Ongoing process information was collected from the
quarterly reports HOPE awardees submitted to SSA, but also through a special process evaluation
qualitative component which allowed Westat to conduct 5 in-depth site visits to HOPE programs in 2006
(Westat, 2006).
Additional information about process and about outputs—the work “products” of HOPE
awardees—were gathered during focus groups conducted with separate cohorts of HOPE program staff,
and with liaisons from SSA Field or Regional Office staff, and Disability Determination Services staff
during two annual SSA-HOPE conferences in 2005 and 2006. Output data (e.g., establishing procedures
for Representative Payee services (RP) or assisting in changing RP arrangements) were also collected
2-1
from data entered by HOPE program staff on the HOPE evaluation web site created by Westat. The web
site also provided information about processes (e.g., staff time spent delivering medical records assistance
to enrollees) as and outcomes (e.g., about changes in enrollees’ living situation after 12 months).
Outcomes data from SSA’s administrative records (i.e., 831 files) were also collected for
each HOPE enrollee if the HOPE program they participated in submitted a duly executed consent form
covering the release of that information to Westat. Another source of SSA administrative (“831”)
outcomes data for Project HOPE were collected that offered a comparative vantage point for assessing
HOPE programs’ outcomes. Thirty-two comparison agencies, located in the same locales as HOPE
programs, which did not receive HOPE funding or SSA support but worked with chronically homeless
people and helped them apply for disability entitlements, were recruited to participate in the evaluation.
When staff at comparison agencies submitted a valid consent form for the release of the 831 file
information for their clients to Westat, administrative outcomes data were obtained for them as well.
Data collection of SSA written materials (inputs data) and HOPE program’s proposals to
SSA for HOPE funding (primarily processes data) began as soon as the evaluation contract was awarded
to Westat, but the centerpiece of the outcomes data collection, the SSA 831 records, occurred between
May 1, 2005 and April 30, 2007 for HOPE programs and comparison agencies. The process, output, and
outcome data from the HOPE web site for HOPE programs were collected from the date of OMB
approval, June 14, 2005, through April 30, 2007.
The Project HOPE evaluation required special attention to data security issues due to the
collection of individuals’ identifying information (i.e., name, date of birth, social security number) for
HOPE enrollees and comparison group clients, both on the web site (for HOPE enrollees) and on the
paper copies of consent forms which HOPE programs and comparison agencies submitted. For these
reasons, the security protections in place at the beginning of the contract (which were deemed acceptable
and adequate by SSA) were enhanced when another SSA contract was awarded to Westat. At this point,
the security apparatus for both projects were merged. Final approval for the security system was granted
by SSA in 2006 (see Westat 2006a, Automated Information Systems Security Plan (AISSP) for Westat
Applications, for additional details).
Given the security needs and the variety of data sources involved, a system that integrated
the collection and analysis of the myriad sources and types of data (i.e., quantitative and qualitative) was
developed. This system is depicted in Figure 2-1, Project HOPE Data Collection and Analysis System,
below.
2-2

Figure 2-1. Project HOPE Data Collection and Analysis System
2-3
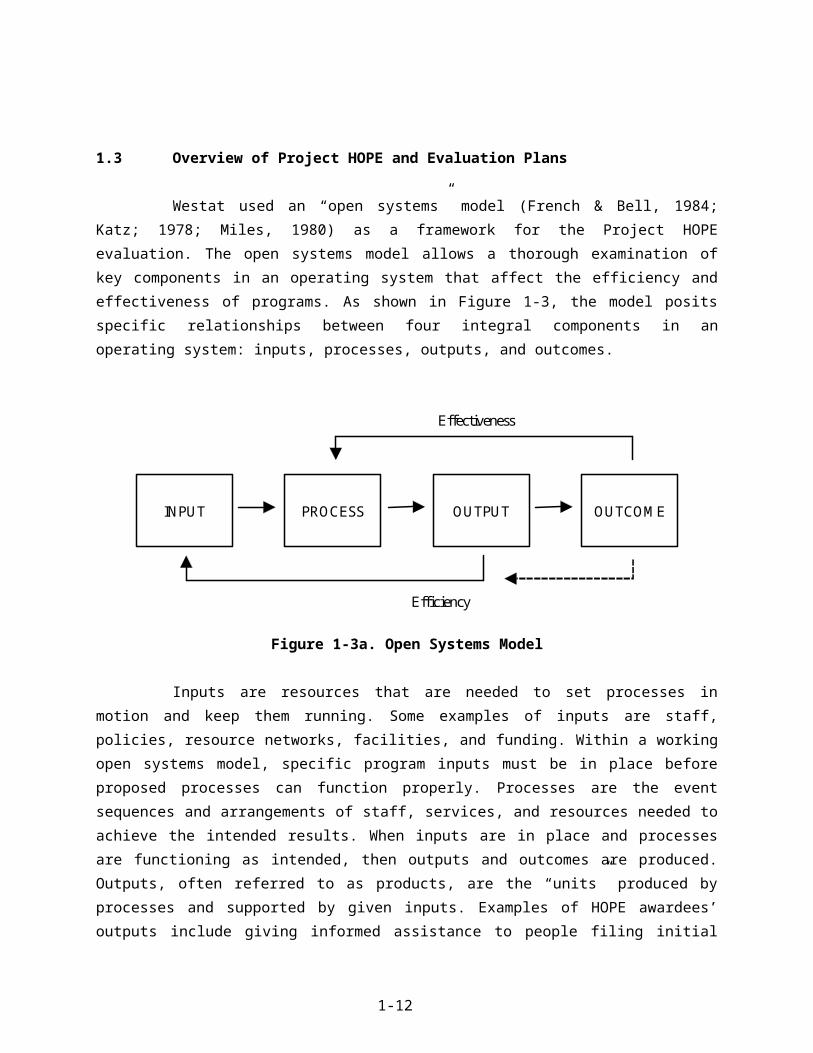
As indicated in Figure 2-1, collected data drew on qualitative and quantitative sources. The
sources included: numerical and text data compiled on a secure and interactive web site developed for
HOPE awardees; the text of narratives from the awardees’ HOPE proposals; numerical and text data from
HOPE awardees’ quarterly reports to SSA; text transcriptions from annual focus groups in 2005 and 2006
conducted with HOPE program directors, SSA field or regional office staff, and staff from Disability
Determination Services offices; and categorical information from SSA administrative 831 files for HOPE
program enrollees (i.e., data pertaining to the initial medical determination for individuals applying for
disability benefits under SSI or SSDI programs). A qualitative process evaluation component funded in
2006 enlarged Westat’s access to information about formative activities occurring at some HOPE
program sites and allowed the collection of observational and interview data during in-depth site visits to
5 HOPE programs in the summer of 2006.
The SSA administrative data (the “831s”) were also collected for clients in comparison
(Group I and II) agencies. Comparison group agencies are located in the same (or comparable)
communities as the HOPE programs and do work that is similar to HOPE programs’ staff (i.e., the
organizations assist people who are homeless apply for SSA disability benefits and access services and
housing). However, the comparison agencies received neither HOPE funding nor structured support from
SSA. Westat identified appropriate local organizations and recruited them to participate in the HOPE
evaluation. Comparison group 1 agencies received the same SSA-HOPE Program Orientation
informational manual that the awardees did, and Comparison group 2 agencies did not. (Comparison
agencies received nominal compensation for their participation.)
Final analyses rely on both quantitative and qualitative approaches. Quantitative data
analysis is focused first on the comparison of outcome variables between HOPE programs and the
comparison agencies to which they are matched and also focused on the outcomes of HOPE programs as
a group. Quantitative analyses control for specific intervening variables (e.g., primary type of disability)
and potential confounders (e.g., difference in the total number of records available for analysis from
HOPE programs in contrast to those available from comparison agencies). The quantitative approaches
include: (1) descriptive analyses which examine frequencies and measures of central tendency (e.g.,
means and medians), (2) calculation of chi-square and t-test statistics for simple comparisons,
(3) multivariate analyses (e.g., multiple regression analysis and multiple covariate analysis), and
(4) survival analyses (to compute differences across and between HOPE awardees and comparison groups
for time to determination of benefits and allowance of benefit rates).
The compiled qualitative data (non-numerical texts, focus group transcripts, in-depth site
visit observation notes and interview transcripts) have been analyzed according to the conventions of
2-4

established qualitative methodologies (e.g., grounded theory and situational analysis). They are
synthesized and integrated with reports on final outcomes for this report.
Additional details about each of the primary data system components and how each were
used to collect data needed for analysis are reviewed in the following discussion sections.
2.1 Project HOPE Evaluation Data System Components
In this section, we provide a description of each of the data elements in the data collection
system established for the Project HOPE evaluation. In the discussions, we also note how each of the
elements were used to inform the findings presented in Chapter 3.
2.1.1 SSA-HOPE Web Site
A secure, interactive web site, Rehabilitation Act-Section 508 compliant, was developed by
Westat for HOPE programs. Each HOPE program received two login names and two passwords from
Westat when the web site was launched. At login, the data entry system accessed only data owned by the
HOPE awardee that was assigned to the specific login and password. The database system enforced this
constraint. Further controls by the database system limited access to SSA HOPE data by any but the
intended user. (For additional details about web site security, see Appendix A.)
The HOPE web site allowed HOPE programs to enter data about individual enrollees at the
staffs’ convenience. The web site was available 24 hours each day of the week during its operation. (Two
minor exceptions to its continual operation occurred when the web site power source was unexpectedly
interrupted and rendered the site inaccessible to programs for 2 hours in 2006 and 1 hour in 2007.) When
OMB approval was secured9 for the collection of data from the web site on June 14, 2005, it was opened
to HOPE staff. It was scheduled to close on April 30, 2007, but Westat agreed to extend the data entry
period for HOPE staff until May 15, 2007. Data entered by HOPE program staff were sent to a secure
server for storage at Westat and were used to build an analytic (SAS) database.
On the web site, HOPE programs entered data for individuals involved in their programs that
had provided informed consent for their participation. All sites were expected to secure enrollees’ consent
9 OMB Control Number: 0960-0704, Expiration Date: 09/30/2007
2-5

prior to any web-based data entry. HOPE sites were also required to have enrollees complete and sign a
second consent form (i.e., SSA-3288 form) that permitted the release of the administrative data contained
in an “831” file to Westat for the evaluation (see Section 2.1.3 for additional details about 831 files). The
release forms were to be sent to Westat for each enrollee whose information was entered on the HOPE
web site. To facilitate rapid and unfettered data entry, SSA permitted HOPE programs to enter enrollee
data on the web site as they became available and send Westat the required consent forms at their
convenience (e.g., at the end of every month). (Westat provided awardees with pre-paid Fed Ex mailers to
ensure that data would be secure during transit.)
The web site provided an efficient and secure data capture mechanism10 to obtain process
evaluation data which were not available from other sources (e.g., staff hours spent providing application-
related assistance) for each enrollee in each of the funded HOPE programs. The web site also collected
outcome data about enrollees’ living situations at the start of their HOPE program involvement and 12
months later. As shown below in Table 2-2-1, most of the data points collected from the web site related
to the processes connected to application assistance (e.g., time spent collecting medical evidence).
Additional information about the specific elements of an enrollee’s disability application (e.g., whether
the awardee sought presumptive disability entitlements or made representative payee arrangements for the
claimant) was also collected from this medium.
10 Additional details about the specific design and secure operations of the SSA-HOPE web site are available in the Systems Manual (Westat, 2005a) and the HOPE Web Site User Guide (Westat, 2005b).
2-6

Table 2-1-1. Web site data entry variablesEnrollee variables Determination variables Living situation (at
enrollment & 12-months)Other benefits-related process variables
-Enrollee name
-Birth date
-Social Security Number
-Enrollment date
-Enrollee status (active, withdrawn, ineligible)
-Time to develop medical evidence (in hours)
-Time spent providing other application assistance (in hours)
-Date enrollee received determination notice
-Whether awardee recommended Presumptive Disability
-Whether presumptive disability decision was upheld by SSA
-On street (in doorways, sidewalks, etc.)
-Other outdoor location
-Other place not meant for human habitation
-With friends or relatives
-Foster care
-Halfway house or group home
-Correctional facility
-Institution
-Emergency or transitional shelters
-Housing units containing people living doubled up with other families or friends
-Other
-Unknown
-Whether Representative Payee (RP) was required when application was submitted
If yes, request date
-Representative payee status at time benefits start
-Was awardee RP (Y/N)
-Was another RP assigned (Y/N)
-Changes to RP after benefits begin:
RP was added
RP was changed
RP arrangements ended
-Reasons for awardee contacts with SSA (including date, issue category, whether issue was resolved)
The web site’s primary function was data collection, but it also contained areas where SSA
could post information for awardees (e.g., the HOPE all program roster with contact information and a
Fact Sheet about what qualifies an individual for enrollment into a HOPE program).
HOPE awardees, SSA-HOPE administrators, and Westat project personnel also had 24/7
access to an internet portal for the generation of data reports, the Westat Automated Reporting Portal
(WARP). This portal was incorporated into the data entry system and its infrastructure provided
customizable output options such as HTML, PDF files, and Excel data sets. The outputs facilitated further
analysis using desktop application if the HOPE web site users, SSA administrators, or Westat staff
desired to pursue this.
The web site-based reports available to HOPE programs included an enrollee listing
(displaying all data entered for an individual on the web site for the program); an enrollee summary
(listing all enrollees for whom records were created in the database); an enrollment date summary
(providing the number and percent of enrollees entered in database records, by month and year); an
hourly analysis (listing the mean staff hours spent providing support to enrollees developing medical
2-7
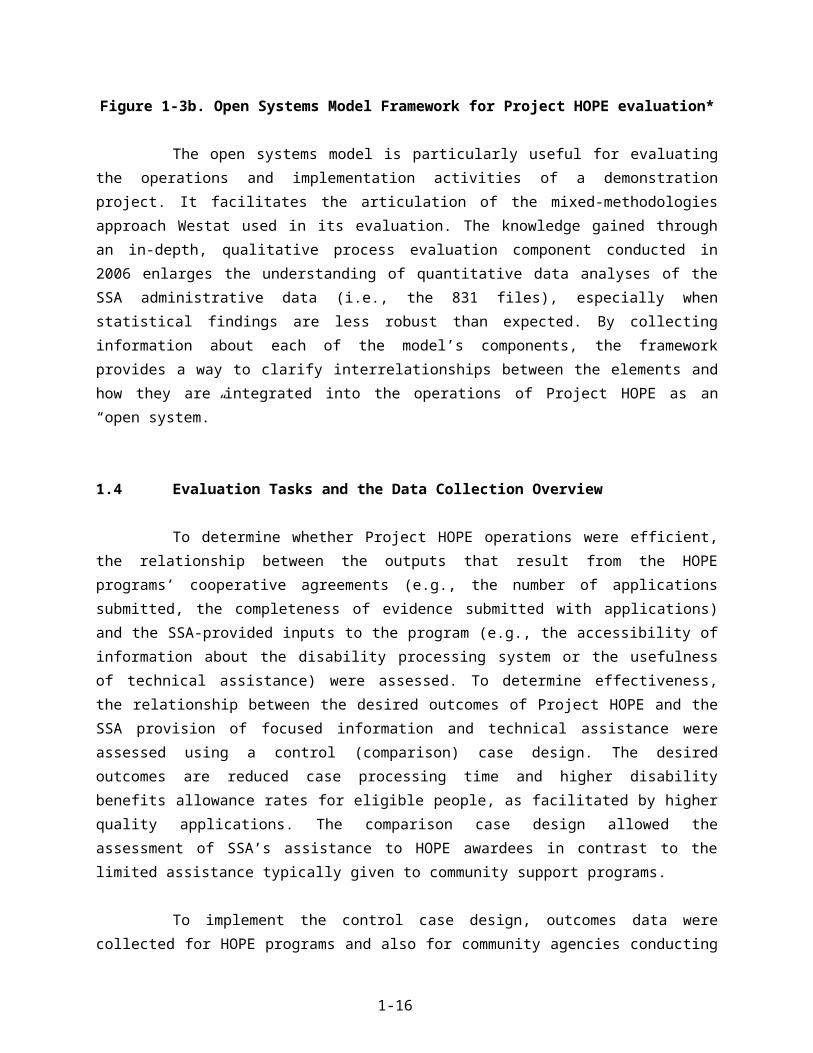
evidence or providing other application assistance); a potential duplicates (which listed any social security
numbers entered for a specific HOPE program that matched a social security number entered for another
enrollee in the program).
A few months after the web site was launched, Westat also developed a summary
“evaluation statistics” report for SSA Project Officers and for our internal use. The evaluation report
could be generated in either a “detailed” or “totals” format, and presented values for each of the collected
variables by a specific HOPE site or for all sites combined. Only Westat or SSA administrators had
access to these aggregate or individual site statistics.
The web collection system provided Westat project staff with instant access to all data
entered into the web system. This feature allowed the collection of ongoing process evaluation
information and was an important tool for discovering –and addressing-- data collection issues that were
surfacing for HOPE programs (e.g., program staff entered follow-up living situation data for enrollees
that had not been in the program for 12 months).
Westat provided an in-person demonstration and overview training in use of the web site to
the HOPE programs staff that attended the 2005 SSA-HOPE annual conference in Baltimore. A HOPE
web site users’ guide (see Appendix B) was prepared and delivered to all HOPE programs. The manual
described the role of the web site in the evaluation of Project HOPE, noted the beginning and end dates
for data collection, provided screen-by-screen specifications for entering data, described how to perform
major functions on the web site, provided a brief overview of basic navigation tools, and prior to the first
use, required that users read two documents about the reporting burden for data entry (required as part of
the OMB clearance) and information about the privacy and data protection of information entered online.
Westat also maintained an e-mail “help” mailbox and a toll-free “help” line at Westat
throughout the data collection period. Shortly after HOPE programs began using the web site Westat staff
personally contacted each program to find out how web users were faring and whether they were
experiencing any problems that were not reaching us through the help lines. No significant difficulties
were reported over the 24 months data collection period.
In addition to the required data entry variables, the system automatically captured system
function variables such as date and time of entry. Such features allowed data to be sorted chronologically
during analysis if more than one entry had been mad in order to identify the most recent entries. Error-
checking and validation procedures were also incorporated into the data collection system where
2-8

appropriate (e.g., double entry for social security number verification was required and the system
prevented the entry of dates beyond parameters expected for date of birth data).
Summary results for the process and outcome data collected from the HOPE web site are
reported in the Findings chapter (3).
2.1.2 Comparison Groups
For the Project HOPE evaluation, SSA requested that Westat establish comparison groups
against which the primary outcomes, “time to determination decision” and “allowance rate,” for HOPE
programs and non-HOPE funded programs conducting similar work with a similar population, could be
assessed. The time to determination decision captured the amount of time between the filing date of a
disability benefits application with SSA and the date on which information about the decision, to approve
or decline disability entitlements to the claimant, was made.
To identify matching comparison agencies, descriptive information about each of the 34
HOPE awardees was needed.11 For this, Westat identified a number of variables that could typify
individual awardees (e.g., location, budget size, organization type) and aspects of awardees’ practices that
were likely to affect the adequacy of potential comparison group matches (e.g., provision of medical
services, housing, and target population type). Communications with SSA staff alerted Westat to the
importance of location as a matching variable. In light of this, the first priority variable sought for a
matching comparison agency was its location in the same disability determination services (DDS)
catchment area as its prospective HOPE program match, then within the same State, and finally within the
same urban area, whenever possible. (See Appendix B for the DDS regions identified by SSA.)
Our approach to selecting comparison agencies was based on evaluating common
characteristics, scoring similarities between awardees and comparison agencies, determining the most
appropriate matches, and ranking the matches from highest to lowest. (Formal and informal collaborators
with or subcontractors for HOPE programs were excluded as potential matches.) Information was
collected about prospective comparison agencies located in proximity to HOPE awardees. After a
potential agency was identified, the quality of the match was determined according to priority matching
variables.
11 When Westat’s evaluation proposal was accepted by SSA, there were only 34 HOPE awardees. Seven additional HOPE sites were funded after the proposal was accepted. SSA decided that a sample of 34 comparison agencies was acceptable to meet the requirements of this contract task.
2-9

The list of priority variables used for the comparison agency selection process is shown,
below, in Table 2-1-2. The variables identified were compiled in a database for all HOPE awardees and
potential comparison agencies. A weighting scheme was devised to capture differences in importance
among collected data. The variables were selected for their centrality to the work of the HOPE awardee
and the likelihood that similar features, when found in a comparison organization, would indicate that
both agencies were striving to reach the same goals, serve the same population, operate within similar
organizational structures, and access roughly equivalent resources to support their work. Information
about whether the agencies offered medical services or provided housing was also collected.
A differential weighting scheme was applied to the collected information and a score for
each comparison agency was calculated; higher scores indicated appropriate matches on the variables of
interest. (Other priority variables were also explored for possible inclusion in the scoring algorithm
designed for this task. For additional details about this aspect and other procedures involved in
establishing comparison agencies for the evaluation, see “Comparison Group Report” (Westat, 2005c).)
Table 2-1-2. Priority variables for comparison agency matchesVariable Criteria Weight CodesProximity DDS region 10 1-10
State 2 1-50Primary Target Group Served by Agency
3 1 = Ex-offenders2 = Mental illness3 = Homeless, not further specified4 = Women with children, domestic violence
victims5 = AIDS/HIV
Agency Size 1 1 = Small ($250,000-$499,000)2 = Medium ($500,000- $1,000,000)3 = Large (over $1 million)
Organization Type PublicPrivate
1 1 = Public2 = Private3 = Mixed
Medical services 1 1 = Yes (provides or subcontracts with provider)
2 = No (no direct or subcontracted medical care)
Provides housing 1 1 = Provides temporary, transitional, permanent, or treatment housing
2 = No direct or subcontracted housing
The rationale for differential weighting of variables reflected the information from SSA
about the importance of matching to location (i.e., as defined by DDS region and State), and the likely
2-10

contexts within which the work of the HOPE programs and comparison agencies were operating. The
weighting scheme was applied so that effects of certain variables, such as size or population served,
would be unlikely to introduce dissonance into the prospective HOPE-comparison agency match.
After matching the awardees to comparison agencies, Westat undertook extensive
recruitment efforts to secure cooperation from prospective matches. A Westat project staff member acted
as a liaison to the comparison agencies and oversaw the recruitment and consent processes. The
recruitment process included sending the selected agencies an advance letter introducing the study,
telephoning each agency to answer questions and to request cooperation, and offering modest monetary
incentives.
Agencies that agreed to be a comparison site were asked to sign a letter of agreement which
outlined the expectations for their participation (i.e., submission of up to 40 signed SSA-3288 consent
forms from eligible individuals between May, 2004 and the end of April, 2007). The letter also stipulated
the assistance Westat was able and ready to provide (i.e., help with preparation of IRB materials, if
required; an ongoing supply of pre-paid mailers to submit the forms; contact information for help or
advice), and the monetary incentives it would receive for participating. Upon receipt of a duly executed
“agreement to participate” letter, the comparison agency received its first payment of $500. For each valid
consent form submitted, comparison agencies were paid $25. All tolled, comparison agencies could
receive a maximum of $1,500 for their participation, largely to offset the likely staff-labor involved in
procuring the signed forms from clients.
Consent forms received from comparison agencies were receipted by a Westat field room
where forms were checked for acceptability and the consent information was keyed into a Project HOPE
database. (HOPE programs’ submitted consent forms were also receipted in this manner and entered into
the same tracking database.) All of the SSA-3288 consent forms received will be delivered to SSA at the
end of the evaluation contract (i.e., October 30, 2007).
For the evaluation, SSA was also interested in analyzing any association between the
comparative effectiveness of HOPE programs versus comparison agencies related to the use of the SSA
HOPE Program Orientation Manual. The manual, which was distributed to all HOPE awardees, provided
significant detail about the disability application process and requirements for entitlements through the
SSI or SSDI programs. To facilitate these comparisons, SSA asked that the comparison agencies be
subdivided into two groups. One group would receive the HOPE Program Orientation Manual and
agencies in the other group would only receive the kind of support normally provided by SSA to
community-based providers. Thus, after comparison agency-HOPE awardee matches had been made and
the participation agreements were received from the comparison agencies, the comparison agencies were
2-11

randomly assigned to “manual only” or “no intervention” groups. Each group was to consist of 17
agencies. Agencies which were assigned to comparison group 1 were sent an electronic and a paper copy
of the SSA HOPE Program Orientation Manual. Agencies assigned to comparison group 2 received no
special support or materials.
The effectiveness of the Program Orientation Manual as an aid to agency staff who are
assisting homeless people submit applications for SSA disability benefits was assessed by comparing the
application experience of eligible clients in both comparison groups and contrasting those findings to the
application experience for HOPE enrollees. These results are presented below, in Chapter 3, Findings.
2.1.3 SSA 831 Disability Master File Data
SSA 831 file data are the centerpiece of the quantitative outcome analyses for Project HOPE.
The SSA 831 files12 contain administrative data that SSA transmits to the Disability
Determination Services (DDS) so that DDS can make a determination about whether disability benefits
can be allowed for a claimant. The 831 records are used by DDS to make a medical decision about the
eligibility of individuals who apply for disability benefits under Title II (Social Security, including Social
Security Disability Insurance (SSDI)) or Title XVI (Supplemental Security Income—SSI). The DDS
offices also make decisions about the first level of appeal for medical denials, or reconsideration
decisions. All data used to render these decisions are contained in the 831 files. There are additional data
contained in the 831 files that indicate whether adjudicative hearings were requested or pending, but SSA
asked Westat to restrict outcome analyses only to initial claims for disability benefits or to reconsidered
decisions about an initial application filing.
Every HOPE enrollee was expected to provide informed consent for the release of data in
his/her SSA 831 file for the Project HOPE evaluation. Westat requested the release of 831 data from SSA
for each enrollee for whom a valid consent form was submitted. Each consent form was checked for
validity before the information was entered to the consent form database (i.e., fields for the individual’s
name, date of birth, social security number, signature, and date signed were completed and legible and
affixed to the SSA-3288 form). Invalid or partially completed forms were returned to the agencies for
replacement whenever possible and if time allowed. All invalid forms were excluded from the data set.
No requests for SSA data based on the receipt of invalid consent forms were made.
12 “SSA Disability Master” file is the formal name of these administrative records. However, that title is rarely used. Throughout this document, we will refer to these data by their numeric title (“the 831s”). The numeric title is widely used and recognized
2-12
In addition to requests for the administrative data for HOPE enrollees, 831 data were
requested from SSA for clients in comparison agencies for whose duly executed consent forms had been
submitted to Westat. SSA advised us to provide a minimum wait period of 2 months before asking for
data for any individual to allow adequate time for the records to be posted into the SSA records system.
The transfer of data from SSA administrative files required Westat to make a formal data
transfer request using SSA’s secure eData electronic messaging system. Data request files from Westat
contained an individual’s date of birth, name, Social Security number and any “decision date”
information available. That is, for HOPE enrollees, programs could enter data for the “determination
decision” date on the web site. For clients of comparison agencies, the date the client signed the consent
form was used instead, since it was likely to be close to or the same as the date the claimant filed his or
her disability application with SSA. The decision-date information was provided for each individual in
the data request files sent to SSA.
All tolled, four data requests were made and four transfers of data from SSA to Westat were
completed. Available 831 file data were returned by SSA on the secure eData messaging system. They
were extracted into a secure13, electronic database upon receipt at Westat. The analytic database created
for 831 data used SAS software (version 9.1).
Westat sought to analyze as many of the 831 file variables as possible during final analyses.
However, due to missing data fields in many records, the variables that figured most prominently in the
outcomes analyses for the evaluation are listed below with a brief description of their meaning. (A
complete listing of variables in the 831 file can be found in the Systems Manual for the evaluation
(Westat, 2005b).) Control variables, which were examined for any significant effect on the final outcomes
concerning time to determination and the allowance rates, are noted in the descriptions.
AL – adjudication level – identifies the level in the adjudication process for a decision.
- AL codes “A” through “F” denote the sequence of ever-higher levels of decisions in the adjudicative process; identify initial decisions.
- A, G, I codes = initial cases; B and C = reconsidered decisions
DAA – drug and alcohol addiction – indicates the role of alcohol and drugs in the case (whether or not a factor or material to the finding) used as a control variable.
13 See “Automated Information Systems Security Plan (AISSP) for Westat Applications” (Westat, 2006a) for additional information about data security protections in place for the Project HOPE evaluation.
2-13

DODEC – date of DDS or SSA decision – identifies the date the decision on an application was made; used with FLD to determine the length of time from application to initial decision.
ED – education years –indicates the number of years of schooling completed; used as a control variable.
FLD – filing date – identifies the date that the application for Title II or XVI disability was filed. This variable was used with DODEC to determine the length of time from application to initial decision.
PD – presumptive disability decision – indicates that a presumptive disability has been awarded before the DDS has made a final determination. This variable was used to identify PD cases to determine how many of the presumptive disability decisions were reversed, as a measure of the quality of PD recommendations by awardees and non-awardees.
PDX – primary impairment code – identifies the primary impairment code used in the medical determination. This was used as a control variable.
RDT – result of determination – allowance, denial, or closed period. This variable was used to indicate the result of initial determinations for a comparison between the outcomes for clients served by awardees and non-awardees.
RID – record identification – identifies the program (Title II or XVI) with which the record is associated. This was used as a control variable.
SSN – social security number – provides the account number under which this disability award may be determined. This variable serves as an identifier for the individual and would allow us to identify awardee clients.
ST – state of claimant residence. This was used as a control variable.
TOC – type of claim – identifies the type of disability for which the applicant is claiming benefits. This was used as a control variable.
ZIP – zip code of claimant -- This was used as a control variable.
OY—occupation years. This was used as a control variable.
RACE-Asian, Black/Negro, Hispanic, North Am. Indian or Eskimo, Other, Not determined/unknown, white, not avail “U”=not updated. This was used as a control variable.
SEX- This was used as a control variable.
CER-Consultative Exam requested (yes or no). This was used as a control variable.
The analysis of 831 data first required that a primary record be established for an individual.
Although date parameters sent with 831 data requests were set to the data collection period (i.e., June 14,
2-14

2004 through April 30, 2007), several 831 records were often returned for an individual Social Security
Number (SSN). (In total, Westat received 10,588 records, a sum greater than the number of participants
due to a number of duplicate records for many individuals.) The context of each 831 record varied, so a
procedure to automatically select a primary record was created. Using the variables contained in the file,
all the 831 records were sorted by SSN; by the date of the determination decision (DODEC) in
descending order; by the determination result variable (RDT) which contained information about whether
disability benefits had been allowed or denied; and by a designed variable for sorting purposes
(“NewVsOld”), which arrayed dates for each of the 831 records in descending order. The first and most
recent record in the group was listed as the primary record14. A subset of 831 records (n= 4,446) was thus
created that contained one 831 record per SSN. These were designated as primary records and were
selected for inclusion in the analytical database.
In order to discern the time to determination decision (to allow or deny disability benefits),
records used for outcome analyses also had to be restricted to records which were “complete,” for either
HOPE enrollees or for clients in either of the comparison agency groups. Complete records met these
inclusion criteria:
A valid consent form had been received for the individual claimant; and
The primary 831 records contained filing date (FLD) data, which indicated when the application was received and the review process started, contained data in the (DODEC) field indicating the date on which a final determination was made, and (RDT) data, which indicated the result for the initial (or a reconsidered initial) filing to allow or deny the claimant disability entitlements.
The statistical procedures used for outcomes analysis addressed the two primary questions in
the Project HOPE evaluation that involved the effectiveness and efficiency of the HOPE programs when
contrasted to outcomes for Comparison Group 1 agencies, which had received the HOPE Program
Orientation Manual, and to outcomes achieved by Comparison Group 2 agencies, who received neither
the manual nor any other programmatic support from SSA. Analyses addressed these research questions:
Were HOPE programs more effective? That is, did applicants sponsored by the HOPE programs submit higher quality applications that led to quicker disability determinations than applicants sponsored by the comparison agencies?
Were HOPE programs more efficient? That is, were allowance rates for initial or reconsidered claims higher among applicants sponsored by HOPE programs than for applicants sponsored by the comparison agencies?
14 Time and budget constraints precluded culling information for each of the 10,588 files into one file for each individual SSN. This cleaning procedure may have removed valid records related to a second application submitted to SSA for a particular SSN. However, since the 831 records do not contain an application number it is impossible to determine whether information is about one or more applications.
2-15
Survival analysis was used to compare the time from application filing to the determination
of the decision to allow or deny benefits. The dependent variable in these analyses was the time from
application to determination, regardless of the type of determination (i.e., allowed or denied). We used the
Kaplan-Meier to calculate the survival distribution for HOPE grantees and comparison agencies and then
used log-rank and Wilcoxon tests to test for statistical differences between curves. All these approaches
were implemented using the SAS LIFETEST Procedure (SAS Institute, 2007).
The analysis to compare allowance rates used both linear regression and two-sample t-tests.
In both cases, the dependent variable consisted of allowance rates within agencies; the allowance rate for
an agency was calculated as (number allowed) (number allowed + number denied). The regression
analysis was implemented using the SAS GLM Procedure, while the t-tests were done using the SAS
TTEST Procedure (SAS Institute 2007). While the results are presented in un-transformed, un-weighted
form for ease of interpretation, we also performed the analysis using the standard arcsine transformation
and a weighted analysis to adjust for (1) the dependence between the allowance rate outcome variable and
its variance and (2) heterogeneity of variances due to unequal numbers of applicants per agency. The
transformation and weighting did not change the results and the conclusions drawn from them. We also
repeated these analyses using individual allowed/denied outcomes as the dependent variable instead of
allowance rates and still obtained similar results. These findings are reported in Chapter 3.
2.1.4 Focus Group Data
Focus group data were an important resource for the Project HOPE process evaluation. They
were collected during the 2005 and 2006 annual SSA conferences for HOPE awardees. Focus groups
were conducted with three separate groups of Project HOPE actors at each of the conferences, i.e., with
HOPE Project Directors, with SSA Field Office (FO) and Regional Office (RO) staff, and with Disability
Determination Services (DDS) staff.
Westat developed focus group protocols for each year and each focus group (see Appendix
G for additional details). The protocols were tailored to issues and knowledge areas that were most
germane to the different personnel in the sessions. The groups were led in a semi-structured discussion of
selected topics by a Westat moderator. Audio recordings were made and transcribed for each focus group
session. Transcripts and transcript coding files (i.e., the first step in qualitative analysis) were stored in a
secure, electronic directory. Westat analyzed the data and reported a synopsis of findings to SSA each
year that the focus groups were conducted (Westat 2005c; Westat 2006b).
2-16

For each annual SSA-HOPE conference, SSA administrators invited HOPE awardee
program staff, SSA staff liaisons from field offices (FO) and regional offices (RO), and Disability
Determination Services (DDS) liaisons to participate. In addition to the project director and one other key
staff person from each of the HOPE programs, SSA asked one FO or RO staff and one DDS staff for each
of the eighteen states with HOPE awardees in their area to attend the conference.
Each year, Westat randomly selected 8 individuals from the list of conference attendees for
each of the staff groups and asked them to participate in a focus group for their respective cohort (i.e.,
DDS staff, FO and RO staff, and HOPE awardee project directors). After the random selections had been
made but before the conference convened, the prospective participants in each staff group were notified to
confirm their intent to attend the conference and their willingness to participate in the focus group. Each
participant received a brief memorandum outlining the purpose, the proposed structure, the general
discussion topics, and the intended use of the information generated during focus group sessions. Focus
groups were limited to 8 participants. The moderated, semi-structured discussions were scheduled for 1
hour. Permission to make audio recordings of the sessions was obtained from all participants.
The primary approach to the analysis of focus group data employed Grounded Theory
procedures (Strauss, 1987). Transcriptions of focus group data were coded manually and with a
qualitative software package (e.g., Atlas/Ti). Qualitative coding determined categories, relationships, and
assumptions in the data that informed respective actors’ understanding of the SSA program orientation
intervention from the perspective of the HOPE staff, SSA Field Office staff, and Disability Determination
Services staff. Transcripts were analyzed to generate types of substantive codes (e.g., “program
orientation materials,” “issues addressed” in SSA program orientation, “implementation activities”). From
these concrete codes a set of categories and properties related to them (e.g., duration, frequency, and
intensity) emerged which enlarged an understanding of the categories identified.
Overall, focus group data collection enabled comprehensive analysis of similarities and
differences in perspectives, of implementation activities, and of problem-solving activities. Analyses also
offered additional, context-specific information about processes involved in achieving certain outputs and
outcomes. These data also highlighted issues which needed to be explored more fully (e.g., about ways in
which various HOPE programs conducted outreach or selected enrollees) in order to accurately interpret
the final outcomes for Project HOPE.
Summary findings from each year that the focus groups were conducted are presented in the
Findings Chapter (3), which follows.
2-17

2.1.5 Qualitative and Documentary Data
Additional qualitative data were collected and analyzed for Project HOPE. Other significant
sources included the HOPE proposal application narratives and HOPE awardee quarterly reports. (A
substantial portion of the qualitative data collected for the evaluation occurred when a special contract
modification was awarded that enabled Westat to conduct 5 in-depth site visits to HOPE programs.
Details about that collection and the approach used for those analyses are outlined in the concluding
discussion section of this chapter.)
Proposal narratives from the awardees’ submitted HOPE applications were culled for
descriptive information about the awardee organization, its collaborators, and the services it had in place
before the HOPE funds were granted. A brief summary profile of each awardee was prepared that
contained information about individual awardee’s geographic setting (e.g., city, State and DDS region),
its organizational type (e.g., public, private, non-profit, or faith-based), its primary partners or
collaborators in HOPE activities, and its intended target population, including any available description of
the special sub-population it intended to serve during the evaluation period.
All awardees were charged with providing outreach to people who were chronically
homeless and delivering (or referring them to) core services such as housing, medical care, and other
needed supports. But some awardees were already delivering specialized services (e.g., housing, medical
care, mental health services) for people with specific disabilities (e.g., mental illness or co-occurring
mental illness and substance use disorders). Other awardee proposals declared intentions to serve people
with specific demographic attributes (e.g., people for whom English was a second language) or focus on
the development of some of the optional activities for Project HOPE (e.g., developing bi-lingual services,
or establishing pre-release and enrollment procedures for people who were chronically homeless prior to
their incarceration in a State hospital or correctional institution).
Quarterly reports contain data which address both process and outcome evaluation questions.
Implementation and development activities are included in awardees’ reports, as are descriptions of
problems or special situations occurring at specific sites or within certain regions. The reports also
provided summary data on the number of people who have been enrolled in the program during the
quarter and the number of people who were deemed appropriate for enrollment but refused to enroll. Such
data illuminated process evaluation issues (program activities and approaches), contributed to the
identification of problems that may have been unintended consequences of the project, and enlarged an
understanding of the progress each HOPE awardee made toward enrolling participants, providing
2-18

services, and resolving barriers encountered in that process. In addition, areas identified as problematic by
HOPE programs in these reports highlighted important topics which were explored during the annual
focus group discussions and during the in-depth site visits to selected programs in 2006.
Quarterly reports were reviewed to determine what services were routinely delivered to
enrollees and whether developing “optional” services was intended (e.g., return to work interventions,
pre-release projects, presumptive disability screening). The reports were content analyzed to discern
recurring mentions of problem areas in implementing HOPE program outreach or core services and to
identify issues which were disproportionately affecting the work of HOPE awardees in certain geographic
or administrative areas (e.g., snow storms in the Northeast, hurricanes in the South, or staff turnover rates
in specific DDS regions).
However, the quantitative data concerning program’s enrollment and allowance rates
provided by HOPE programs in their quarterly reports for SSA were not incorporated into data collected
or analyzed for Westat’s evaluation. The time frame used by the HOPE programs for these data differed
from the time frame for the evaluation contract, and did not match data being entered on the SSA-HOPE
website for the evaluation. Nonetheless, Westat did routinely collect quarterly reports and summary
reports from the SSA Project Officer for HOPE awardees. The summary reports illuminated notable
trends in the collected data (e.g., a steadily increasing number of HOPE program enrollments). The
summaries also highlighted substantive issues that might affect the evaluation or the interpretation of its
results but were beyond the scope of the evaluation contract (e.g., issues connected to the multi-year wait
times for adjudicative hearings for HOPE program enrollees in Oregon).
Findings related to the ongoing analysis of quarterly reports largely inform and enrich other
qualitative data collection plans and analyses. The results of these analyses are synthesized in the
discussions of findings related to the focus groups and the in-depth site visits in Chapter 3.
The final discussion for this chapter addresses the centerpiece of the qualitative data
collection and analysis for Project HOPE. A significant “qualitative process evaluation component” was
added to Westat’s evaluation contract in 2006. The component provided the means to collect and analyze
data from in-depth site visits to HOPE programs in five different DDS regions for the evaluation.
2-19

2.1.6 Process Evaluation Data from In-depth Site Visits
The purpose of the process evaluation was to enlarge the knowledge available about the
HOPE program’s formative activities. Site visits were designed to expand the knowledge of program
implementation which was attainable only through quarterly report and focus group data collections. The
expanded data collection was made possible by conducting key informant interviews, making
observations, and negotiating informal, ad hoc interviewing opportunities with HOPE staff and clients at
program sites. Identifying information was only collected from key informants, and analyses of those data
were made in the aggregate (whenever possible) to protect confidences of individuals participating in the
structured interviews.
Westat prepared and submitted a work plan to govern this task to SSA, for its approval. On
the basis of primary data, including the DDS region of the site, the number of enrollees in the program,
and the percentage of individuals who had applied for SSA disability coverage and received
determination decisions—as indicated in awardees’ quarterly reports to SSA-- Westat recommended five
sites for visits and received SSA approval to proceed. (Additional details about this selection process are
documented in the final work plan for this task (Westat, 2006c).) The HOPE programs were located in
New York City, DDS region 2; Escondido, California, DDS region 9; Stamford, Connecticut, DDS region
1; Milwaukee, Wisconsin, DDS region 5; and Eugene, Oregon, DDS region 10.
During 2-day site visits, semi-structured interviews were conducted with Program Directors,
Claims Benefits Specialists, and Case Managers at each site, as well as with any other staff who assisted
in the disability application process (e.g., psychiatrist, primary care physician, outreach worker). HOPE
personnel interviews were recorded (with interviewee permission) and transcribed for later analysis
HOPE enrollees at each site were also interviewed to obtain their perspective on the process of applying
for disability assistance. They were also asked to characterize their experiences with the HOPE program.
The analysis of enrollee perspectives derived from notes taken (with permission only) during discussions
with HOPE enrollees. (No identifying information was collected from participants in the programs.)
In addition to data generated in semi-structured interviews with the staff and the enrollees,
there were opportunities on each site visit to engage staff or clients in other, less focused, discussions.
These contacts gave Westat staff the chance to follow up on themes that might have been raised – or
alluded to – in prior conversations, and also offered the opportunity to observe some of the unexpected
activities that staff had to confront in their work days. Several of these participatory or observed
exchanges provided new insights into how the program handled the contingencies of daily operations.
2-20

The research questions focused on acquiring information about what specific services and
best practices were established, the extent to which HOPE staff members gained knowledge about the
disability application process, and how HOPE programs used materials obtained from SSA (e.g.,
technical assistance, training materials, and via staff contacts with DDS or local SSA liaisons). Site visits
also allowed information to be collected on local community contexts, providing insights into salient
contextual variables that affected HOPE program implementation.
The methodological approach to extraction and analysis of all qualitative data collected for
the evaluation (i.e., from quarterly reports, from focus groups, or from in-depth site visits) did not differ
by source of data. Westat approached the analyses of collected qualitative data by:
Anticipating and identifying likely key categories or themes prior to data analysis,
Coding text materials to identify key and emergent categories, properties of categories, and dominant themes or patterns in the data,
Organizing data according to key themes relevant to process or other evaluation questions (e.g., general implementation trends, problematic issues in specific DDS regions, success of new outreach practices), and
Synthesizing, focusing, and integrating key and emergent themes in interim and final evaluation reports.
The dominant approaches used to analyze collected data incorporate established conventions
of cultural anthropology, grounded theory, and situational analysis. These methods informed all data
analysis and enabled a comprehensive analysis of similarities and differences in perspectives, of
implementation activities, of the processes involved in achieving certain outputs and outcomes, and of
unintended consequences or unanticipated outcomes.
In the next chapter, the results of the data analyses undertaken with both qualitative and
quantitative methods are presented.
2-21
2-22
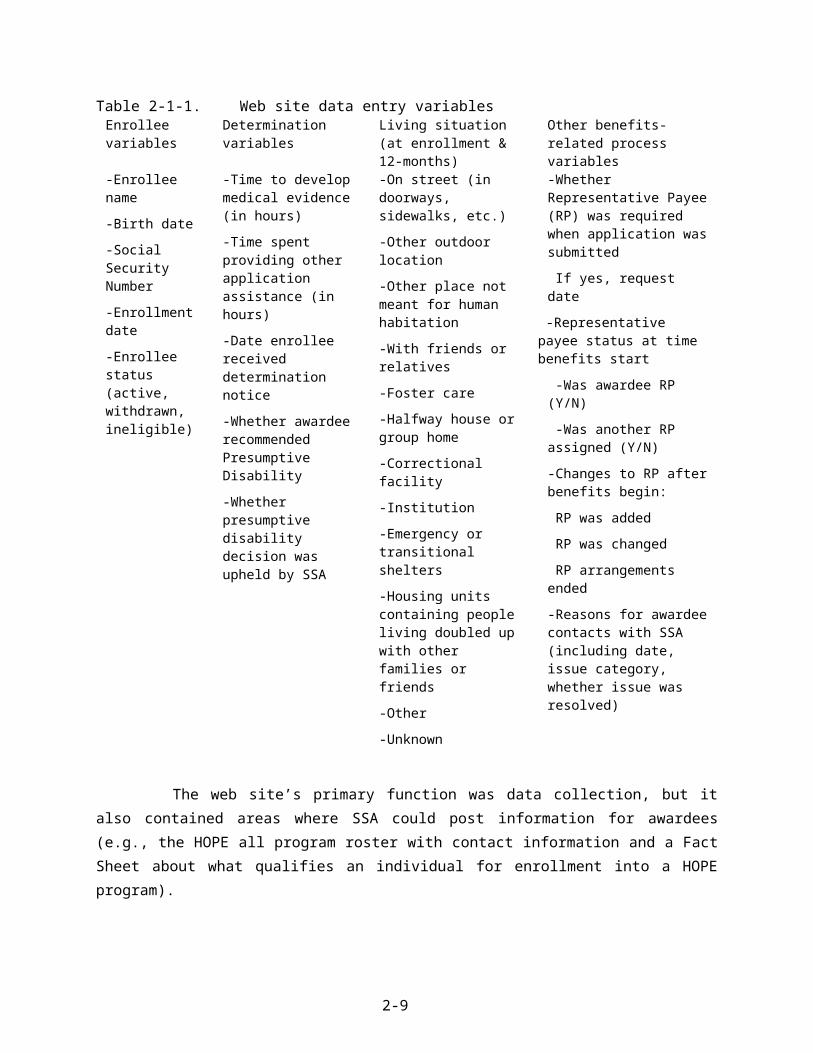
3. FINDINGS
Following a brief review of data collection issues affecting the final sample for the Project
HOPE evaluation, the results of statistical analyses for outcome data and qualitative analysis of process
evaluation data are presented in this chapter. Outcome analyses for time calculations (i.e., the time
between a filing date and the date a decision was made about whether to allow or deny SSA disability
benefits to the claimant) attained by HOPE programs and comparison agencies are reviewed. These
analyses document the comparative efficiency of HOPE programs in developing the capacity to submit a
disability benefit application that can be fully processed within the SSA system upon delivery. Other
outcome calculations are presented that document results of the allowance rates for HOPE programs and
comparison agencies. Allowance rates refer to the percentage of submitted disability applications that
result in a determination to allow the claimant to receive SSA disability entitlements. These analyses
document the comparative effectiveness of HOPE programs to help chronically homeless individuals
attain SSA disability benefits. For both outcome calculations, findings for differences between the
outcomes for comparison agencies in group 1 that received the HOPE Program Orientation Manual, and
agencies in group 2 which did not receive the manual, are included in the reported results.
Summary results from the SSA-HOPE web site data collection and analyses are also
reviewed in this chapter. Descriptive statistics are used to analyze data entered to the Project HOPE web
site by HOPE programs. These data reflect both outcomes, such as change in living status for HOPE
enrollees, and process findings, such as time spent by HOPE programs to develop medical evidence or to
deliver other support assistance to participants in their programs.
The perspectives of key actors in the Project HOPE arena are articulated with outcome
findings in the presentation of process evaluation data in section 3.4. Key actors surveyed include HOPE
program staff, SSA Field Office (FO) and Disability Determination Services (DDS) staff working as
liaisons to HOPE programs, and participants in HOPE programs. The contexts within which the actors
operated—and which exert substantial influence on the achievement of the HOPE programs --- are
documented in the results from the qualitative data collection and analyses. A synopsis of the findings
concludes the chapter. A discussion of the significance of the results is presented in the final chapter.
3-1

3.1 Final Sample Composition
The final sample for outcome analyses of 831 records is comprised of data for clients from
any of the agency groups (i.e., HOPE programs, comparison agencies in group 1 and in group 2) that
submitted a valid consent form releasing these data and had records which contained time to
determination decision and allowance data. In the event that multiple records were received, the most
recent record was designated as primary. The number of records meeting inclusion criteria totaled 3,253.
Of that total, 3,055 administrative records were received for HOPE program enrollees, 116 records were
received for group 1 comparison agency clients, and 98 records were received for group 2 comparison
agency clients.
The quantity of data collected for outcomes evaluation analyses of SSA administrative data
is far less than what was intended or expected from either HOPE programs or comparison agencies. The
collection of SSA-HOPE outcome and process evaluation data from the web site was also far below what
was expected.
With respect to comparison agency data, Westat obtained 32 signed letters of agreement
stating the agencies willingness to participate in the study and to obtain and submit up to 40 signed
consent forms from their clients during the study period. Each agency that submitted a letter of agreement
received an initial incentive check for their participation ($500). Despite monthly contacts (and many
other problem-solving—and encouragement—calls to several comparison agencies) during the data
collection period, only 22 of 32 agencies submitted valid consent forms for the release of SSA
administrative data for their clients. When the final 831 data set for the evaluation was received from SSA
on July 27, 2007, just 19 of the 22 comparison agencies matched to HOPE programs had 831 data for
their clients available in the SSA system. In the final sample, there are 11 comparison agencies in group
1, which received the Program Orientation Manual and 8 agencies in comparison group 2, which did not
receive the manual.
A number of factors affected the collection of consent forms from comparison agencies. The
most significant factor appeared to be the high rates of staff turn over in a number of the agencies. When
staff leave that had been helping with data collection for Project HOPE, the knowledge of the study and
the requirements they needed to meet, often left with them. Several times, despite the agreements in
place, Westat had to reacquaint staff in comparison agencies with the purpose and the data collection
expectations for the project. In other instances, comparison agencies agreed to participate but could not
identify any—or very few—clients willing to sign the consents. Some agencies agreed to participate, and
3-2

sent in forms that were invalid. Other agencies sent in valid signed consent forms but when data requests
were submitted to SSA for corresponding 831 records, no data were available.
With respect to HOPE awardees, the cooperative agreements for HOPE funding mandated
their participation in evaluation activities. Each HOPE program was expected to enroll no fewer than 150
participants during the evaluation. Enrollment, process, and any available outcome data were to be
entered for each participant on the SSA-HOPE web site. For each enrollee with data on the web site,
programs were to submit a valid SSA-3288 consent form to Westat so that corresponding administrative
data contained in the 831 record for that individual could be collected from SSA. On this basis, a
collection of 6,500 web site records and corresponding consent forms was expected across 41 HOPE
programs. Of those, 5,100 records were expected from the 34 HOPE programs matched to comparison
agencies. The actual number of enrollee records entered on the web site for which valid consent forms
were submitted was over 4,500, but SSA administrative data were available for only 3,055 of those
enrollees. Of that number, 1,262 were from the 19 HOPE programs matched to comparison agencies with
data available for outcome analyses.
Extensive efforts were made to collect the data needed from HOPE programs. Westat
regularly sent HOPE programs data entry reminders during the study. We sent notices to all programs as
the end of the data collection period approached. We notified all grantees that the final data collection
period would be extended for 15 days (i.e., from April 30, 2007 to May 15, 2007). Many programs were
also contracted during the course of the evaluation to alert them to the need to send in consent forms for
their enrollees or to resolve issues connected to the consent forms they had recently submitted (e.g., a
submission of 2 forms for the same individual with different social security numbers). On a few
occasions, Westat notified SSA about HOPE programs that had very low enrollment data and about
programs that had not yet submitted consent forms for enrollees with web site data. Programs were also
notified directly about low receipts of consent forms.
The SSA administrative data are used in outcome analyses for the time to determination
decision and disability allowance rates for the agencies, and the use of 831 data had to be restricted to
records containing that information (see Section 2.1.2, above). However, files with complete date and
determination information were often missing other bits of demographic information. Regulations
governing the study (i.e., Office of Management and Budget requirements and the Paperwork Reduction
Act) prevented collecting the same data from two sources to avoid redundancy and burden to HOPE
program staffs. When information was missing in 831 records, it could not be procured elsewhere. As a
result, demographic information for the final sample is less robust than desired. Albeit, the data that are
available reflect a population of people who are chronically homeless and have a disability that is similar
3-3

to general characterizations of this cohort in current literature (e.g., U.S. Conference of Mayors, 2006;
NAEH, 2006). The available final sample demographics are presented in Table 3-1, below.
3-4

Table 3-1. Selected demographic characteristics for final sampleCharacteristics
(selected categories)Comparison Group 1 Comparison Group 2 HOPE Programs Total
Number of records 116 98** 1,460(with match)
3,055(All HOPE)
3,253
Age Groups18 years or younger 1.52% 1.94%19 to 39 years 27.27% 30.37%40 to 64 years 70.20% 67.37%65 years or more 1.01% 0.33%Mean age Comparison groups 1 and 2: 44.96 years All HOPE:42.80 years P values Comparison groups (1 and 2) vs. HOPE (all)
Pearson chi2(3) = 3.3207 T-test DF3242 t=1.4017
0.345 (NS)0.1611 (NS)
Gender (%)Male 26.72 25.61 26.78 30.64Female 12.93 12.20 13.87 12.90Not recorded 60.34 62.20 59.35 56.46P values* Chi-square results by agency groups
C1, C2, and HOPE programs with CG matchesC1, C2, and all HOPE programs
0.985 (NS)0.743 (NS)
Race/Ethnicity (%)Asian 0.86 1.22 0.48 0.95Black or African-American
6.90 15.95 16.80 14.04
Hispanic 9.48 3.66 3.25 3.76North American Indian or Eskimo
0.0 0.0 1.74 0.95
White 22.41 17.07 17.12 22.72All others 0.00 0.00 1.26 1.12Not recorded 60.34 62.20 59.35 56.46P values* Chi-square results by agency groups
C1, C2, and HOPE programs with CG matchesC1, C2, and all HOPE programs
0.0238 (NS)0.1423 (NS)
Education Years (%)0-7 years 7.34 5.20 4.86 5.128-11 years 34.05 22.07 22.87 22.6312 years 35.78 42.86 44.27 44.1913-16 years or more 22.94 20.78 28.09 28.06Not recorded 238
missingP values* Chi-square results by agency groups
C1, C2, and HOPE programs with CG matchesC1, C2, and all HOPE programs
0.2872 (NS)0.144 (NS)
*Chi-Square results are shown; other tests used include: Likelihood Ratio Chi-Square, and Mantel-Haenszel Chi-Square (unless noted, results with other tests were insignificant).
**C2 had 98 records but some records did not contain all the demographic information presented.
3-5

Overall, there were no significant demographic differences between the people served by the
comparison agencies and the people served by either the HOPE programs matched to the comparison
agencies or between comparison agencies clientele and the enrollees served by all HOPE programs
combined. The mean age for comparison group clients was 44.96 years, and those served by HOPE
programs was 42.8 years. Although there were many unrecorded gender attributions in the 831 records,
the amount of missing information for this variable was about the same for the comparison groups and for
HOPE programs. This resulted in differences that weren’t significant. As is found in studies of the
homeless population in general, more men than women are identified as chronically homeless.
Like gender data, substantial amounts of race data were unavailable for either comparison or
HOPE clients. Thus, the indications of race/ethnicity in the 831 data collection cannot be assumed as
representative of all clientele participating in the evaluation. However, available data suggest some trends
(e.g., concentrations of certain categories in specific U.S. regions). None of the race categories analyzed
for comparison groups versus all HOPE programs differed significantly. The data suggest that there were
more white participants across all programs, followed by African-Americans and Hispanics, for all but
Comparison Group 1. In C1, more Hispanic than African-American participants are reflected in available
data. Asians and North American Indians represented about 1 percent of the sample in the 831 data
available for outcome analyses.
The years of education for participants in the evaluation were also not significantly different.
Most participants attained 12 years of education, with the second highest attainment in the 8-11 years
category. Comparison group 1 appeared to have more participants with educational attainment in the 0-7
years grouping (7.3%) that either comparison group2 agencies (5.2%) or the HOPE programs, either
match (4.86%) or as a whole (5.12%). Between 21-28% of the final sample participants had acquired
education beyond high school. Missing data records and non-significant findings for this variable across
the groups suggest that these data do not likely have an impact on the findings.
Another important characterization of the final sample examines the primary disability
category which is identified in the participant’s SSA disability benefits application. There are over 100
different disabling conditions which can be documented in this data field. The SSA system further
categories the primary disability variable (PDX) in the 831 record according to 12 body systems which
are primarily affected by the condition. Codes include a variable for conditions which were cited in the
application, but to which no pre-existing medical listing applies. The table below presents the 5 highest
categories within which the primary disability for 3,253 individual evaluation participants was recorded.
3-6

Table 3-1-2. Final sample primary disability listingPrimary Disability of
Record(PDX variable)
Five highestBody system
categories
Comparison Group 1 Comparison Group 2 All HOPE Programs Total
Number of records 116 82 3,055 3,253Mental health disorders
53.45% 59.75% 52.37% 1,711
Musculoskeletal system
8.62% 12.2% 12.34% 397
Immune deficiency disorder
6.90% 6.10% 6.51% 212
No current disability listing for thecondition indicated
8.62% 2.44% 5.14% 169
Cardiovascular system 6.90% 8.54% 4.12% 141P values* Chi-square results reported at the level of the agency groups (C1, C2, and all
HOPE programs) for analysis of PDX for each individual within each agency group, using individual disability codes
0.8656(NS)
The primary disability categories were not significantly different across the comparison
agencies and the HOPE programs. It is clear, however, that mental health disorders dominated the
primary disabilities listed on the SSA benefit applications during the evaluation period.
In the next section, outcomes for the comparative time to determination required to act of the
SSA disability application received, and the disability benefit allowance rates for comparison agency and
HOPE program clients are presented.
3.2 HOPE Programs and Comparison Group Outcomes
This section describes the results of the analysis of outcomes for the two key questions about
effectiveness and efficiency in the Project HOPE evaluation:
Effectiveness: Did applicants sponsored by the HOPE programs submit higher quality
applications and thus obtain disability determinations more quickly than applicants sponsored by the
comparison agencies?
3-7

Efficiency: Were allowance rates for initial or reconsidered claims (due to higher quality
applications and applied best practices for outreach and engagement) higher among applicants sponsored
by the HOPE programs than among applicants sponsored by the comparison agencies?
In each case, the analysis consists of three stages. First, the two types of comparison
agencies (with [C1] and without manual [C2]) are compared to their matching HOPE agencies. (Note that
due to attrition and lack of cooperation of comparison agencies, data were available only for 19 of the 32
matching comparison agencies established for the study.) Next, the comparison agencies are combined
and compared with their matching HOPE agencies. Finally, the combined comparison agencies are
compared to all HOPE agencies.
Time to Determination
The survival curves for the three types of agencies are shown in Figure 3-2a, 3-2b, and 3-2c).
The outcome here is time to determination, so that the more rapidly the survival function drops, the
shorter the determination times. The survival curve for the HOPE programs is lower than the survival
curves for both comparison agencies with the manual (C1) and those without (C2) the manual.
3-8

Figure 3-2a. Comparison groups (C1, C2) vs. matching HOPE programs
3-9
Figure 3-2b. Combined comparison groups vs. matching HOPE programs
3-10

Figure 3-2c. Combined comparison groups vs. all HOPE programs
Table 3-2a summarizes the results of this analysis. When the matching HOPE programs are
compared with the two groups of comparison agencies, the HOPE programs had the shortest mean time to
determination at 4.80 months. Comparison agencies (C1) that received the HOPE Program Orientation
Manual had the next shortest time (5.56 months). Comparison agencies that did not receive the manual
(C2) had the longest time (5.78 months). The difference between agencies is highly significant (p =
0.0019). However, the difference in average determination times between the two types of comparison
agencies is 0.22 months, which is small relative to the standard errors of the estimates (0.32), indicating
that the HOPE agencies are significantly different from both groups of comparison agencies. When
comparison agencies are combined in the analysis, the difference between HOPE programs and the
comparison agencies is even more strongly significant (p = 0.0004), further supporting the suggestion that
outcomes for the HOPE agencies are significantly different than outcomes for comparison agencies.
3-11

Table 3-2a. Evaluation of time to determinationAverage months to determination (std.
error)P-value*
Comparison Group 1 5.56 (0.32)0.0019Comparison Group 2 5.78 (0.32)
Matching HOPE programs 4.80 (0.08)
All comparison agencies 5.65 (0.23) 0.0004Matching HOPE grantees 4.80 (0.08)
All comparison agencies 5.65 (0.23) 0.0008All HOPE programs 4.88 (0.05)*P-values are given for the log-rank test for comparing survival curves of the groups shown at left. Wilcoxon values were also reviewed, but
showed similar results.
When the comparison agencies are compared with all HOPE programs, the results are
similar. The average determination time for all HOPE programs is 4.88 months, only slightly greater than
the 4.80 months for the HOPE programs for which matching comparison agency data were available.
Comparison of Allowance Rates
The result of the decisions to allow or deny the claimant SSA disability benefits is recorded
in the 831 record as a determination result. Determination results are the foundation of the allowance rate
calculations. Table 3-2b shows the simple frequencies of the determination results in the 831 records for
the final sample. As noted in Chapter 2, Westat was only to include the results of initial claims, or
reconsidered initial claims, in outcome analyses.
Table 3-2b. Final sample agency group by determination result
Agency Group
Determination Result
TotalDenied Initial Allowed Reconsider AllowedComparison Group 1 81 34 1 116
Comparison Group 2 43 38 1 82
HOPE Programs (All) 1812 1212 31 3055Total 1936 1284 33 3253
As a whole, it is clear that the final sample 831 records contain few reconsideration of initial
claim decisions.
Below, Table 3-2c shows the results of allowance rates analyses. The first analysis compared
the HOPE grantees with matching comparison agencies to the two groups of comparison agencies.
3-12

Table 3-2c. Comparison of allowance ratesAverage allowance rate (standard
error)P-value
Comparison agencieswith manual (C1)
0.39 (0.08)
0.2229Comparison agenciesWithout manual (C2)
0.58 (0.13)
HOPE programs(matched to comparison agencies)
0.41 (0.04)
All comparison agencies (C1, C2) 0.47 (0.08) 0.4709Matching HOPE programs 0.41 (0.04)
All comparison agencies (C1, C2) 0.47 (0.08) 0.3277All HOPE programs 0.39 (0.03)
The average allowance rate for HOPE programs was 0.41. That is, for a typical program,
about 41 percent of applicants were allowed benefits. Comparison agencies (C1) receiving manuals had a
slightly smaller average allowance rate (0.39), while agencies receiving no support (C2) had the largest
average allowance rate (0.57). However, none of these differences is statistically significant (p = 0.2229).
In a weighted analysis (not shown), which statistically adjusted the sample groups to
accommodate the size differences between comparison agencies and HOPE programs, allowance rates
were somewhat different: HOPE programs continued to show an average allowance rate of 0.41, while
comparison agencies receiving manuals had an allowance rate of 0.30 and comparison agencies with no
support had an allowance rate of 0.48; however, these differences were still not statistically significant.
The next step in the analysis considers the combined comparison groups versus the HOPE
programs which were matched to a comparison agency. The results of this analysis are similar: there is no
significant difference between the HOPE programs and the comparison agencies. In addition, the final
analysis shown in Table 3-2c, which includes all HOPE programs, further supports the conclusion that
there is no meaningful difference in allowance rates attained for HOPE program enrollees when
compared to allowance rates attained for comparison agency clients.
Summary of the Comparison Outcome Findings
With respect to the time to determination calculations, the following points can be made:
3-13

1. Applicants sponsored by the HOPE programs received determinations about a month earlier than those in either comparison agency groups who received the manual (C1) or comparison agencies that did not receive the manual (C2).
2. There is no significant difference in determination times between comparison agencies that received the manual (C1) and comparison agencies that did not receive the manual (C2).
3. There is little difference between determination times in HOPE programs that were matched to comparison agencies and in HOPE programs for which comparison agency records were unavailable. Thus, the results—i.e., that HOPE programs experienced shorter determination times than comparison agencies to which they were matched for analysis—is applicable to all HOPE programs.
With respect to the comparison of allowance rate findings, the following points can be made:
1. There is no significant difference between the HOPE programs and the comparison agencies (C1, C2) with respect to allowance rates.
2. There is no significant difference in allowance rates between the agencies that received the manual (C1) and those that did not receive the manual (C2).
3. There is little difference in allowance rates between the matching HOPE programs and the HOPE programs without data from matching comparison agencies. Thus, the results of the matched comparison—i.e., that there is little difference in allowance rates between HOPE programs and their matching agencies—is applicable to all HOPE programs.
Overall, the effectiveness of HOPE programs in submitting applications which resulted in a
quicker time to determination for enrollees than for comparison agency clients was demonstrated. The
efficiency of HOPE programs to achieve higher disability allowance rates from an initial or reconsidered
initial claim for their enrollees than for comparison agency clients was not demonstrated.
Other outcome analyses are presented in the next section, HOPE web site findings. The
discussion of web site findings also present descriptive results associated with process evaluation
analyses.
3.3 Web Site Collection Summaries
In this section, summary information about data collected for Project HOPE from the web
site created for the HOPE programs participating in the evaluation are reported. As was true for each of
the data collection components in the Project HOPE evaluation design, data collected in this medium
3-14

were not collected elsewhere. When a HOPE program entered data for a new participant on the web site
but did not update or complete the entire question array for that enrollee, that information was unavailable
for evaluation analyses. Thus, web site findings reported vary greatly by the number of missing records
for particular variables. Only web site data findings collected for HOPE enrollees with corresponding 831
data, i.e., those included in the final sample, are reported.
Given the target population for the evaluation, an important variable on the HOPE web site
asked HOPE staff to provide data about an enrollee’s living situation at time of enrollment and again at a
followup point, 12 months after enrollment. The results of those findings are shown below, in Table 3-3.
Analysis of the changes in living situation over 12 months indicate significant differences in
HOPE enrollees’ situations between the day they enrolled in the HOPE program and a year later.
However, the strength of the conclusion is tempered by the vast amount of missing data. Of the 3,055
HOPE enrollees included in the final sample, just 655 data entries were made for both living situation at
enrollment and at followup. Nonetheless, available data strongly suggest that improvements in housing
situations for HOPE enrollees have occurred. Smaller percentages of individuals are living on the streets,
or outdoors, or in places not meant for human habitation, or in emergency or transitional shelters than
when they first enrolled in a HOPE program. One year later, higher percentages of enrollees are living in
subsidized public housing and other unsubsidized settings, smaller percentages of enrollees are living in
doubled up situations and smaller percentages of enrollees are in institutions or correctional facilities.
Overall, the changes in living status findings support the idea that the HOPE programs have
been effective. HOPE staff members have apparently used the processes incorporated in the Project
HOPE demonstration initiative to achieve a short-term outcome of improvement in living situation.
3-15
Table 3-3. Intake and Followup Living SituationsIntake Living Situation Frequency Percent Cumulative Cumulative
Frequency PercentOn street (in doorways, sidewalks, etc.) 410 14.84 410 14.84Other outdoor location 94 3.4 504 18.24Other place not meant for human habitation 44 1.59 548 19.83With friends or relatives 381 13.79 929 33.62Halfway house or group home 146 5.28 1075 38.91Correctional facility 264 9.55 1339 48.46Institution 69 2.5 1408 50.96Emergency or transitional shelters 946 34.24 2354 85.2Housing units containing people living doubled up with other families or friends
51 1.85 2405 87.04
In subsidized or public housing 73 2.64 2478 89.69In unsubsidized housing 46 1.66 2524 91.35Other 87 3.15 2611 94.5Unknown 152 5.5 2763 100 Frequency Missing = 490 Follow-up Living Situation Frequency Percent Cumulative Cumulative
Frequency PercentOn street (in doorways, sidewalks, etc.) 23 3.43 23 3.43Other outdoor location 15 2.24 38 5.66Other place not meant for human habitation 2 0.3 40 5.96With friends or relatives 117 17.44 157 23.4Foster care 3 0.45 160 23.85Halfway house or group home 32 4.77 192 28.61Correctional facility 27 4.02 219 32.64Institution 17 2.53 236 35.17Emergency or transitional shelters 48 7.15 284 42.32Housing units containing people living doubled up with other families or friends
16 2.38 300 44.71
In subsidized or public housing 136 20.27 436 64.98In unsubsidized housing 64 9.54 500 74.52Other 58 8.64 558 83.16Unknown 113 16.84 671 100 Frequency Missing = 2582
Statistics for Table of Intake Living Situation by Followup Living SituationStatistic DF Value ProbChi-Square 156 663.84 <.0001Likelihood Ratio Chi-Square 156 511.37 <.0001Mantel-Haenszel Chi-Square 1 26.753 <.0001Sample Size = 655
3-16

Analyses of other web site variables have also been greatly affected by the dearth of
information entered for enrollees included in the final sample (n=3,055). The summary findings reported
for the following web site variables are presented for information only, and cannot be assumed to
accurately represent work undertaken by HOPE staff members in these areas. For each highlighted item,
the variable involved is briefly defined, and the data available for final analyses are presented. Missing
data for each item are also indicated.
The average time (in hours) spent to develop medical evidence. This variable asks staff in HOPE programs to provide the number of staff hours spent developing medical evidence for an enrollee. Examples of developing medical evidence include carrying out requests from the disability examiner, contacting or visiting health care providers, other agencies, the enrollee’s friends and relatives, etc. to locate enrollee medical records. It does not include time spent by the enrollee at visits to his/her health provider.
Results: 1,972 responses were received for this variable. The mean time spent was 2.378 hours (SD=4.0872). The range reported was from 0 hours to a maximum of 123 hours. Data responses were missing for 60 percent of the enrollees in the final sample.
The average time (in hours) spent providing other application assistance. Other application assistance includes staff time in activities such as assisting enrollees to locate the necessary documentation including proof of identify and financial and work records, developing representative payee information, and assisting enrollees with filing reconsiderations or appeals.
Results: 2,077 responses were received for this variable. The mean time spent was 4.487 hours (SD=6.4938). The range reported was from 0 hours to a maximum of 85.75 hours. Data responses were not entered for 64% of the enrollees in the final sample.
Recommendations that Presumptive Disability15 (PD) be awarded to the enrollee, and whether that decision was adopted when disability benefits were awarded. Staff users were to select yes or no to indicate whether the HOPE grantee recommended presumptive disability status. If yes, they were asked to enter the month, day and year the recommendation was made, and whether the recommendation was upheld by SSA.
Results: HOPE programs indicated that 17 recommendations for PD had been made and 173 times the recommendation had not been made at the time of the enrollee’s application to SSA. Data responses were not entered for 2,865 of the enrollees represented in the final sample records.
Whether a Representative Payee (RP) was required for an enrollee, and whether the HOPE program served as the RP or made changes to the RP arrangement during the evaluation. Representative payees are required if DDS determines that a claimant is unable to responsibly
15 If an applicant is filing for SSI benefits on the basis of disability or blindness, SSA may make payments to the applicant before making a formal finding of disability or blindness. In order to receive these payments, SSA must find the applicant presumptively disabled or presumptively blind. The applicant must also meet all other eligibility requirements for SSI. SSA may make presumptive disability (PD) or presumptive blindness (PB) payments for a period of not longer than 6 months. SSA may make a finding of presumptive disability or presumptive blindness if the available evidence (which is short of that needed for a formal determination) reflects a high degree of probability that an applicant will be found disabled or blind when complete evidence is obtained. These payments will not be considered overpayments if SSA later finds the applicant not disabled or blind. (Excerpt from HOPE Program Orientation Manual, p.54).
3-17

handle personal finances in order to provide for his or her basic needs16. If HOPE programs indicated that an RP was required when a determination about benefits was received for an individual, staff were to record information about that arrangement on the HOPE web site record for that enrollee. If an RP was needed, HOPE programs were to indicate whether the HOPE program was providing RP services or if another person or organization was acting as the individual’s RP. If or when changes occurred to the RP arrangements, the information on the web site was to be updated by the HOPE program.
Results: HOPE program staff did not provide information about RP arrangements for 3,000 enrollees included in the final sample. Information collected on the web site was contradictory and unclear, and suggests that information which was entered at the beginning of the evaluation period was not updated. (The results from the web site collection only demonstrate the type of information that was sought and what might have been available for RP analyses if additional data were available.) Thus, meaningful conclusions cannot be drawn from the following information provided by HOPE programs: 82 requests for an RP were documented at the time of the disability benefit award; an RP was not required for 102 enrollees; RP arrangements changed for 29 enrollees; and HOPE programs served as the RP for 9 enrollees.
The last summary finding to be reported from the web site presents a table of the reasons that
HOPE program staff contacted SSA or DDS during the data collection period. To indicate the purpose of
a HOPE program’s contact with SSA or DDS, a drop-down list of categories was offered on the contact
reason web screen. Definitions for each reason were also provided in the web site user manual distributed
by Westat to all grantees and also available by hyperlinks to this information from the web page itself.
(For example, for the category “Changes in enrollee status,” the definition provided was “changes during
application period that may affect disability benefits [employment, symptoms, health, hospitalization,
housing, incarceration, death].”.)
This information is arrayed in Table 3-4, below. The table includes frequencies for whether
or not the issue that prompted the contact with SSA or DDS was resolved. (Within each category shown
in the table, the number of contacts and whether the staff indicated the issue was resolved or not appear in
the upper portion of each cell. The frequency for the use of each category and the frequency of whether
staff indicated ‘no’ or ‘yes’ for the issue resolution in that category appear in italics in the lower portion
of each cell within each category.)
It is apparent that certain reasons for contacting SSA or DDS recurred regularly, and that
most (88.65%) of the issues for which staff were contacted had been resolved. The highest recurring issue
(14.08% of all contacts recorded) concerned “interactions” between SSA staff and an enrollee. (Such
concerns were also mentioned in quarterly report narratives and during focus groups or interviews with
16 SSA provides this definition for a representative payee: “A representative payee is an individual or organization that receives Social Security and/or SSI payments for someone who cannot manage or direct the management of his/her money. (http://www.ssa.gov/payee/faqrep.htm).
3-18
HOPE staff members during site visits.) Interpersonal exchanges between enrollees and field office staff
or “claim reps” [representatives] were sometimes perceived as conflicts when HOPE staff reported that
SSA staff had verbally or non-verbally communicated disrespect to enrollees. Considering other data
available that illustrate this issue, it is plausible that the problematic communications between SSA staff
and enrollees noted by HOPE staff in web site records most often occurred when people who were
chronically homeless and had a disability needed to submit applications in person in an SSA field office17.
17 Informants on the site visits also offered information that illustrated the nature of some of these problematic exchanges. The informants at three of the sites noted that when some enrollees were at the point of submitting an application, they were often still “street” homeless or had not yet received housing or treatment that they needed. As a result, enrollees sometimes went to field offices for their application interviews in dirty clothing or exhibited neglect of personal hygiene in other ways. Enrollees, particularly those with significant and untreated psychiatric disorders, also sometimes manifested disorganization or incoherence or suspiciousness in their verbal communications with SSA staff members.
3-19

Table 3-4. Reasons for Contacting SSA and Resolution of Issues* Contact Issue Category Issue Resolved Total
Yes NoCitizenship 58 15 73
0.79 0.2 0.99Consultative Exams 668 98 766
9.06 1.33 10.39Determination Decision 847 163 1010
11.49 2.21 13.7Employment 129 15 144
1.75 0.2 1.95Enrollee changes in situation 288 24 312
3.91 0.33 4.23Forms 935 68 1003
12.68 0.92 13.6Identity Documents 129 10 139
1.75 0.14 1.89Medical Records 873 88 961
11.84 1.19 13.03Non-disability claims 11 0 11
0.15 0 0.15Other 697 247 944
9.45 3.35 12.8Prerelease issues 149 20 169
2.02 0.27 2.29Presumptive Disability 47 7 54
0.64 0.09 0.73Prior Entitlement 33 4 37
0.45 0.05 0.5Protective Filing Date 488 10 498
6.62 0.14 6.75Representative Payee 116 21 137
1.57 0.28 1.86SSA staff/enrollee interactions 1038 44 1082
14.08 0.6 14.68Social Security Number 30 3 33
0.41 0.04 0.45Total 6536
88.6583711.35
7373100
*Item frequencies are shown in italics.
3-20

As shown in Table 3-4, more than 99 percent of these situations were resolved when HOPE staff
members contacted the SSA representative and had the chance to raise the issue and clear up any
miscommunications between enrollees and field office staff.
The other three highest categories of issues for which contacts were made included “medical
records,” “forms” (which referred to staff concerns about which form was required for an application and
to questions about how forms were to be completed), and “determination decisions.” Augmenting this
finding with data contained in quarterly reports and with in-depth site visit data, it is likely that most of
these latter contacts were made about the status of the determination and when it might be forthcoming.
Findings for this item revealed that while most of the determination decision issues were resolved through
the contact, it is also the category with the highest “not resolved” indicator in the table. Overall, the
summary data collection of reasons for which HOPE programs contacted SSA or DDS on behalf of
individual enrollees seems to appropriately represent the categories of concerns that were most relevant to
the daily work of HOPE program staff.
In the next section, summary analyses of the qualitative process evaluation data collection
present a broader, more developed picture of the issues that were involved in carrying out the daily work
in HOPE programs than quantitative analyses alone can reveal. Qualitative findings highlight the
substantial impact that particular contexts had on the outcomes for Project HOPE as a whole.
3.4 Qualitative Process Evaluation Summaries
In this discussion section, findings from the focus groups held at the SSA-HOPE conference
in Baltimore during 2005 and 2006 are summarized, as are the findings from the in-depth site visit
qualitative component for the process evaluation. The summary presentation of the focus groups reflects
early concerns with specific implementation activities in 2005 to deeper concerns in 2006 about the
potential for Project HOPE to ‘make a difference’ in the lives of enrollees or to address issues connected
to chronic homelessness. The key findings from the in-depth site visits to five HOPE programs illuminate
and expand some of the issues raised in focus group discussions.
3.4.1 Focus Groups Summary Analyses
In 2005, focus group data provided information about some of the ways in which the SSA
interventions and materials were used and understood by the staff in the 3 groups that participated in the
3-21

focus group sessions. The emerging themes identified during analysis are best understood as patterns that
emerged which reflected processes occurring during the first year of HOPE programs’ operations. The
analytical theme for each of the topic categories are presented below.
With respect to SSA-HOPE Program Orientation conference and materials, focus groups
participants reported that they:
Acquired or refreshed their knowledge about the SSA benefits application process through conference sessions and use of the Program Orientation Manual,
Valued networking opportunities with DDS, RO/FO liaisons and other grantees afforded by conference participation,
Articulated different interpretations of the “take home” message about expedited case processing and criteria for HOPE enrollment, and
Asserted the utility of adding material about completing application forms, about DDS file reviews, and about authorized representative practices to the conference agenda.
When asked to reflect on relationships between HOPE awardees’ staffs and DDS and
RO/FO liaisons, focus group participants reported that they:
Acquired pragmatic and valuable information about necessary materials to complete DDS applications, and
Were commonly afforded the chance to have in-service training sessions about practices and application processes that were initiated by RO or FO or DDS staff.
Another emergent theme highlighted the potential effects of regional contexts on
implementation activities. Some of the conditions observed by participants included:
Disparities in fiscal or human capital resources available to grantees or liaisons which affect, e.g., training opportunities, coordination efforts, and grantees’ or liaisons’ capacity to hire more experienced staff; and
Grantees’ and liaisons’ prior or ongoing experiences with Federally-funded collaborative or coalition efforts in their region, State, or community (e.g., HUD Continuum of Care initiatives) had a positive effect on HOPE programs’ work processes.
Analyses also revealed thematic patterns in the perceived barriers to HOPE project
implementation and the disability application process. Participants attributed obstacles in the application
process to:
3-22

Complexities involved in providing outreach, maintaining contact, and acquiring longitudinal histories from members in the target populations;
Bureaucratic impediments on local or regional levels that increase processing times; and
Operational criteria for client enrollment in HOPE programs.
Another theme emerging as significant for the evaluation of the HOPE project concerns the
strategies that HOPE staff, DDS staff, and SSA staff in Regional and Field Offices develop to surmount
barriers they encounter. Specific strategies included:
Establishing routine contacts between program staff, and field office or and DDS staff (e.g., monthly meetings, scheduled training);
Providing community providers and administrators with ongoing information about Project HOPE and the goals of the HOPE programs;
Participating in community provider or coalition meetings;
Using participation in provider or coalition meetings to build relationships and “network” with other providers in local or regional settings;
Initiating practices which improve outreach efforts (e.g., hiring formerly homeless individuals as “peer navigators” to assist other homeless individuals);
Developing HOPE services to help staff maintain contacts with enrollees (e.g., employment, meals, housing);
Hiring “proactive” staff with comprehensive knowledge of, and experience with, the SSA disability system for RO/FO, DDS, and HOPE staff positions; and
“Co-locating services” that make it easier for SSA applicants to receive medical and psychological exams needed for the SSA disability application (e.g., situating Consultative Examiners or psychologists in or near SSA field offices, State social service centers, shelters, or similar facilities).
Analyses also indicate that some unexpected issues were raised during the first year of
implementation. Some of these developments included:
Concerns that initial misapplication of enrollment criteria will result in fewer enrollees than is required of HOPE grantees,
Concerns that non-expedited case processing for enrollee applications in the SSA system may result in lower or undisclosed allowance rates and missed opportunities to provide needed services to individuals in the target population, and
3-23

Concerns that people in target populations may be excluded from outreach efforts since they are not eligible (due to an apparent lack of a medically disabling condition).
The collection of focus group data in 2006 shed additional light on process evaluation
themes that were salient in 2005. Further, these data reveal heightened concerns about the ways in which
HOPE programs, specifically, or Project HOPE, in general, might have a positive impact on people who
were chronically homeless. Findings in the second year reveal greater attention to (and frustration with)
the SSA bureaucracy and local homeless resources systems than those voiced during 2005.
2006: Summary of Findings
Situated perspectives. Key themes emerged in 2006 focus group data from the “situated
perspectives” analyses for the three different focus groups held with HOPE program staff, SSA field
office (FO) or regional office (RO) staff, and staff from Disability Determination Services (DDS) offices.
The findings support the idea that situated perspectives have an effect on the vantage point that certain
actors develop, or at least communicate, from their various organizational positions. These perspectives
inform the activities and the strategies for accomplishing HOPE work that develop during the course of
Project HOPE. Summary highlights of situated perspectives, below, are drawn from responses to the
question “From your perspective, what factors are implicated in chronic homelessness?”
HOPE program staff identified factors that propelled people into homelessness, kept them homeless, and thwarted or undermined efforts to leave homelessness. The factors identified by HOPE program staff addressed societal or national-level conditions, community organizational or institutional conditions, and individual or family-level conditions.
Beyond their substantial attention to the scarcity of housing resources, HOPE program staff predominantly offered responses that looked to micro-level explanations that led to chronic homelessness for individuals. They often observed that many people who were chronically homeless had similar disabilities. Every speaker mentioned the prominence of disabilities related to mental illnesses and drug or alcohol (or both drug and alcohol) addiction disorders.
Comments often referred to how the rhythms, and delays, in the SSA disability application process or the award of benefits contributed to persistent homelessness.
Unlike participants in the other two groups, HOPE program staff offered comments about developmental attributes that subsequently contributed to the major medical and psychiatric disorders and to the chronically homeless status that they observed in the population their programs served.
3-24

In contrast, SSA RO/FO staff liaisons offered responses that were more broadly
conceptualized as they offered their views on the factors that contributed to chronic homelessness.
All SSA RO/FO participants cited major mental illness, alcoholism, and substance use or addiction as the dominant factors which accounted for an estimated 50-85% of the incidence of chronic homelessness in the areas where they lived or where they did their HOPE-related work.
The primary factors that were implicated in chronic homelessness that were identified in the group were connected to the observed disorders, medical conditions, and community situations of the people who are persistently homeless. (For example, an individual exhibiting psychotic symptoms might ignore serious medical conditions and also be excluded from temporary shelters, and so remain “street homeless.”)
Compared to the perspectives offered in the other 2 focus groups, SSA RO/FO liaisons offered more comments about the intersection of medical disability with other social conditions, such as illiteracy and lack of job skills, as prominent features in chronic homelessness.
In a comparative sense, DDS liaisons’ perspectives about the range of causal conditions
contributing to chronic homelessness primarily reflected present-day understandings noted in current
literature and the media. Some participants also referred to contemporary dynamics which extended, or
exacerbated, some of the negative institutional effects which contribute to persistent homelessness for
some individuals. Highlights of these perspectives are listed below.
Deinstitutionalization from mental hospitals, and now, from correctional and military institutions, create or extend the conditions for homelessness which are insufficiently addressed in local communities.
A majority of the people who are chronically homeless also have disabling psychiatric disabilities.
Persistent homelessness results from inadequate or insufficiently coordinated efforts among organizations and agencies serving the target population.
Compared to the other focus groups, the DDS liaisons were more conscious of the proportion of people who are chronically homeless that also have disabling medical conditions.
Barriers to implementation. Analyses of data which addressed “barriers to implementation”
during the focus groups revealed substantial variations across the DDS regions and HOPE programs in
the obstacles encountered in specific areas and in the outcomes reported by specific programs.
The most prominent theme in discussions about barriers to achieving the goals of Project HOPE—regardless of the staff role one held in relation to it—was that the absence or presence of resources, coupled with the responses from community
3-25

institutions (e.g., schools, police, social service providers), had an impact on all implementation activities and processes.
Successful implementation processes. The findings for this analytic division in the data
revealed that the majority of the successful strategic actions and interactions operated as intended when
two conditions were met:
Collaborative efforts among HOPE program staff, DDS liaisons, and SSA RO/FO liaisons were clearly structured and scheduled (e.g., with respect to training sessions), and
Communications were open and ongoing, and conducive to problem-solving on an as-needed basis.
Critiques of Project HOPE. Findings from the “SSA-HOPE intervention critiques” focus
group data revealed collective interest, voiced in each of the focus groups, about several categories that
warranted further development. Many suggestions were conveyed as requests for specific activities that
SSA could or should undertake on behalf of Project HOPE. Two features of these requests predominated,
a desire for SSA to establish certain standards and for SSA to increase the immediate relevance of
conference-based or written materials used for the project. Summaries of these views are highlighted
below.
Participants expressed desires for the establishment of standards to govern some of the activities and relationships among HOPE-related actors in HOPE programs, DDS offices, and SSA RO/FO sites. In particular, several SSA regional office and DDS liaisons reported that early work on HOPE had been slow or inconsistent due to their lack of clarity about their HOPE-related duties. While nearly all liaisons went on to forge effective working relationships with HOPE program staff and their liaison counterparts, the desire for additional clarity, earlier in the project, was clearly communicated.
Participants also wanted SSA to increase the relevance of the intervention by adding topical materials (e.g., developing a conference workshop about working with local police departments), or by linking grantees to more Federal agency representatives (e.g., HUD, BLM18), or by developing materials and liaison contacts that would address specific needs within specific contexts (e.g., certain States or DDS regions).
Focus group findings reveal that the impact of the SSA interventions on HOPE programs
may be necessary, but not sufficient, to affect conditions that cause or perpetuate chronic homelessness in
certain situations. In some situations (i.e., specific DDS regions or specific communities), the SSA
18 This reference is to the Bureau of Land Management (BLM). Helping grantees establish ties to this Federal agency may be especially useful for programs in rural or urban-rural settings. The idea was broached by a grantee in a small city with rural fringe areas who said that on 2 occasions a Federal park ranger helped individuals who were chronically homeless and living outside in a Federal forest come to the attention of a local SSA field office. After the ranger took the individuals to an SSA field office in the city, they were referred to the area HOPE program.
3-26

interventions have had significant and positive impacts on the work of HOPE programs. And yet, the SSA
interventions have not uniformly had this reported affect on either the work processes or apparent
outcomes of HOPE awardees across the board.
The impact of SSA interventions in Project HOPE and changes in conditions which affect
chronic homelessness is not direct. Contexts are platforms from which the actors in HOPE programs
operate, because contexts exert particular effects on conditions that restrain or facilitate strategic actions
and interactions. Data reveal that intervening conditions in specific regions where conditions are
improving for the target population have certain contextual elements: advocacy organizations serving the
same population, low turn over rates among HOPE program staff, HOPE staff and FO or DDS liaisons
that established cross-training routines early in the project and have regular and on-going contacts. Focus
group participants also reported that some contexts are quite similar to those where conditions have
started to change for the population being served by Project HOPE but where positive changes were not
(yet) in evidence.
Focus group findings strongly grounded the idea that the networking opportunities afforded
by attendance at yearly SSA-HOPE conferences were very important to the array of HOPE actors. This
finding was first identified in the 2005 focus groups, and reinforced by findings of 2006 focus group data.
The majority of conference attendees in both years perceived that the annual conference is effective (i.e.,
the intended outputs of HOPE programs are advanced as conference materials positively affect and
improve processes in use the HOPE programs and liaisons). It is a venue that is both valued and useful in
their HOPE work.
The additional data collection allowed by the in-depth site visits during the summer of 2006
allowed Westat to collect clarifying information on themes identified in focus group analyses (e.g., about
situated perspectives, the encountered barriers to HOPE program operations, and on the strategies that are
cultivated by HOPE actors). The following section provides the summary findings from that qualitative
component of the process evaluation.
3.4.2 In-depth Site Visits
Findings from the analysis of in-depth site visits occurring between June-August, 2006, are
drawn from data collected on visits to five HOPE programs. Each of the sites were in different DDS
regions of the county: Region 2 (Partnership for the Homeless, New York City); Region 1 (Shelter for the
3-27

Homeless, Stamford, Connecticut); Region 9 (Interfaith, Escondido, California); Region 5 (Healthcare for
the Homeless, Milwaukee, Wisconsin), and Region 10 (White Bird Clinic, Eugene, Oregon).
Analysis of collected data reveal that salient features of the HOPE programs and their
communities are largely captured by the dynamic interplay between four factors: (1) the components of
the SSA intervention (e.g., technical assistance, networking); (2) the Federal disability processing and
regulatory system; (3) specific contextual factors in a HOPE program’s locale (including political-
economic issues); and (4) the HOPE program’s operational characteristics and work processes.
The diagram on the next page Figure 3-4 depicts the process evaluation analysis of Project
HOPE, based on both the explicit SSA inputs (conferences, training, etc.) as well as on the interviews and
observations made during the site visits. The red sections of the diagram (labeled SSA-HOPE premise,
SSA inputs, and Grantee outputs) reflect SSA perspectives on Project HOPE, while the blue sections
(labeled HOPE grantee premise, system inputs, and “finagling the system”) indicate what our analyses
yielded in terms of identified critical processes (labeled grantee processes) which culminate in the
intended outcomes (labeled HOPE outcomes).
Summary analyses which explicate the major findings depicted in Figure 3-4 are offered in
discussion sections which appear below the diagram.
3-28

Figure 3-4. Process Evaluation Findings
3-29
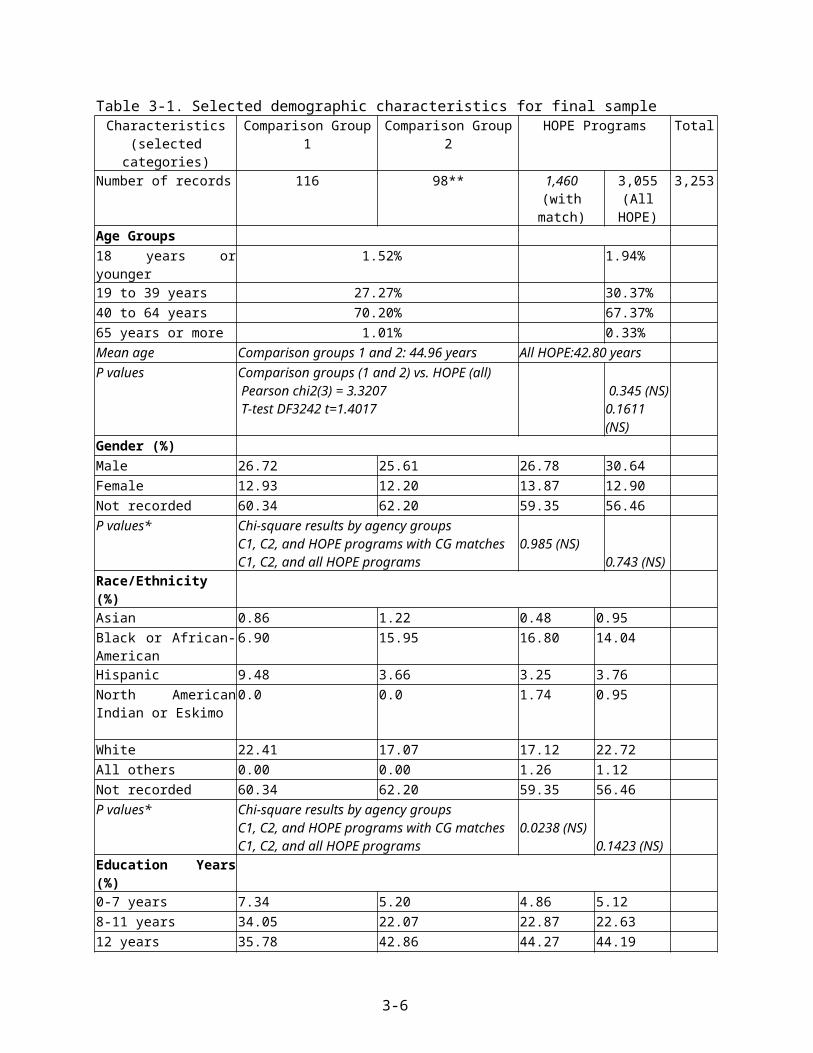
SSA Intervention
Applicants who accepted the HOPE cooperative funding agreement all received the same
core intervention, a primary component of which was the technical training provided at HOPE
conferences. Two staff members from each HOPE-funded program were required to attend these two-day
conferences: orientations for the initial 34 grantees were held in August 2004 and for the additional 7
awardees in January 2005; two mandated conferences were held in April, 2005 and again in April, 2006 19.
At each of these two-day meetings, attendees participated in sessions that described the overall HOPE
demonstration grant and aspects of the evaluation; heard plenary presentations from Federal partner
agencies (e.g., U.S. Department of Housing and Urban Development, U.S. Department of Health and
Human Services, U.S. Department of Labor, Veterans’ Employment and Training Services, U.S.
Department of Veterans Affairs, U.S. Interagency Council on Homelessness) regarding national
initiatives to end homelessness or to serve individuals who are or were homeless; engaged in workshops
about the disability determination process and how grantees could use the Blue Book to document an
applicant’s claims; and took part in “regional meetings” with HOPE program staff and their liaisons from
both SSA and DDS. The conferences provided attendees with general information, technical training, as
well as networking opportunities.
A common feature of interviewees’ descriptions of these annual conferences was that they
served as a catalyst, getting program staff to conduct outreach with hard-to-engage clients and to
complete applications that would result in these individuals receiving not simply a monthly income, but
also medical coverage. Said one interviewee:
You know, it was like… [SSA Staff] instilled this energy so when you came back, what you wanted to do was like, ‘Get your staff up first thing in the morning! Get those people signed up!’, you know? It’s just how you felt about it and you felt so good about yourself in that whatever it was you were going to do with this project was truly going to make a difference in people’s lives.
The catalysis effect of the HOPE project was a key finding, for the project’s premise—
getting individuals who are chronically homeless and have a disability signed up for benefits to which
they were entitled—struck many respondents as both a new and important idea. Their energy and
enthusiasm to initiate the process back home was fueled by the initial excitement that SSA generated
around the project.
19 Another SSA-HOPE conference was planned for October, 2007.
3-30

The shared excitement notwithstanding, assessing the effectiveness of the SSA inputs –
specifically, the technical assistance and training – required that HOPE programs implement their HOPE
work in the same manner. Yet site visits revealed rather uneven implementation patterns. Some of this
resulted from conference participants genuinely taking away different key points from the same trainings.
For example, programs varied in how each established criteria for enrollment in HOPE. Three of the five
grantees reported enrolling anyone who met the definition of ‘chronically homeless’ and who claimed to
have a disabling condition. Said staff at one program,
…We hate to discourage anyone from applying and we certainly don’t – we don’t think it’s right to say, ‘Well we’re not going to take them because we think they don’t have a good claim, because you just never know. So anybody that wants our help, we will help them.
This “all-comers” approach, however, was not adopted by all grantees. Some programs were
concerned about assisting individuals whom they believed to be ‘trying to scam the system’ and so
established quite strict criteria by which an individual could be enrolled as a HOPE client.
…If I have a sense that somebody’s scamming, then I ‘m going to make them come back for at least one more interview. And there have been two or three homeless people, it’s clear they’re looking for a way to not have to work. And other people, it’s not so much they’re scamming, as it really is unclear…And so once an assessment’s done and it’s agreed that they are, they look like a good claim, then the next thing I do is give them the disability report [portion of the SSA application] to fill out, and oftentimes people eliminate themselves at that point because they aren’t willing to fill out the paperwork.
Such divergences in program processes are important for understanding both the impact of
the SSA intervention on how grantees operate, as well as the relative efficiency of grantees in getting
higher allowance rates from initial claims. Although there are numerous factors that might lead even a
“good claim” to be denied by DDS, it stands to reason that submitting claims only for individuals with an
‘obvious’ disability would lead to higher allowance rates.
Other divergences from the conference trainings were not the result of differing
interpretations, but rather emerged from Project Directors’ own understandings of “what makes sense.”
For example, one concept critical to understanding the effectiveness of the HOPE grants is that of
“flagging” cases. Under the original implementation design developed by SSA, HOPE grantees would
differ from their homeless service counterparts by receiving specific training on how to complete and
submit SSI applications. All applications at an SSA office would undergo an identical review process.
The hypothesis was that a statistical comparison of HOPE grantees against the comparison group would
show HOPE awardees obtaining quicker determinations and higher allowance rates from initial claims, on
3-31

the assumption that their applications would be of better quality than those submitted by comparison
agencies.
Many grantees, however, did not see the logic of this approach (“How would DDS know to
give us feedback?”), and so collaborated with their SSA or DDS representatives to develop a way to
“flag” their cases. In Milwaukee, for example, the Director of the local SSA Field Office identified two
field staff to be the homeless liaisons at the office. Benefits claim specialists from the HOPE program
were supposed to contact one of these two individuals for every HOPE applicant to make sure their “t”s
were crossed…and “i”s dotted” before the application moved on to DDS. Indeed, HOPE program staff
shared their insights with workers in other agencies around the city:
I was asking the Director of the SSA Field Office about it and she basically was like, “You have no problem because the application asks, ‘Are you applying on behalf of someone’” and we should type in there, HOPE Project…[so it]..is flagged homeless. I told other workers in the system in [the city shelters]…’Use us to do your applications.’
In Oregon:
…There was a little bit of flack and controversy at the first HOPE conference because they weren’t supposed to – DDS was not supposed to flag homeless cases, but we got around that by routing HOPE cases. So all HOPE cases for Oregon from both programs…have a route slip, and they go directly to [a dedicated homeless] unit…
And in New York City:
…What the field office did for us, and continues to do for us, is kind of allow us to expedite the thing. I mean, we know – and I hope you guys know by this point – that all these cases are marked. There’s no such things as an unmarked case, a HOPE case, because I told [my Claims Benefits specialist]…[and] all the case managers in these agencies, I want you to put the disclosure [release form used by HOPE grantees] on top when you submit the application. So once it goes to the field office, they automatically know it’s a HOPE case …
Thus, while all programs theoretically obtained identical “inputs” from SSA, divergent
interpretation of instructions and Directors’ “common sense” notion of how the process “should” work,
meant that the implementation of Project HOPE varied markedly from one site to the next. In many
respects, then, programmatic outcomes cannot be attributed solely to a specific SSA input because that
input may have emerged as a “theme and variation” once in the field.
3-32

Federal Disability Processing System
The premise of the HOPE Project from SSA’s perspective was that the barrier to obtaining
benefits for people who are chronically homeless and have a disability was a technical one: provide
program staff with appropriate training and know-how, and allowance rates would improve. From the
staff members’ perspectives, there was agreement at all five sites that the technical training was vital;
however, the barrier was not simply a lack of knowledge and skill, but rather – and more importantly –
the bureaucracy that prevents clients from getting the services and supports that they need:
From a long-term perspective as a human service agency, we’re dealing with [SSA] a very large organization, which in many ways has set up a lot of barriers for our clientele...So to suddenly be in a position –which we’re not rejecting, we’re always open to it – of [SSA] saying [with Project HOPE], ‘Can you help these people navigate our minefield?’ … My answer is well, you could achieve a lot more by changing your minefield than you can do by hiring us to help people navigate it, you know. …We’ve built a monster bureaucracy that in many ways causes grief to the very people we should be targeting…and now we’re going to set up a marginal, small little [HOPE] project to see if we can sort of ameliorate some of the problems that have developed in our system. It’s something, you know, when we deal with our clients, we’re not only dealing with their personal issues and problems, we’re also dealing with the fact that the society is not well designed for them. …however you want to look at it, and the expectations is that … in order for you to get around the Catch-22 which says, you know, ‘We want you to be so disabled that you can’t handle our process, and if you can’t handle our process, then we can’t help you.’ That’s a Catch-22. It’s always been a problem.
The notion of the SSA disability processing system as a minefield encapsulates the
complexities and paradoxes faced by claimants who approached the system to apply for enrollment in
SSA disability programs. To navigate the disability processing system requires concentrated and focused
attention to numerous regulations and rules, which require extensive documentation and verification, and
high-level cognitive functioning. But even documentation of a person’s identity could prove problematic:
I had one guy tell me that now in order to get your Social Security card you have to have an ID. In order to get an ID you have to have a Social Security card.
Interviewees noted other aspects of SSA disability application processes that seemed
especially difficult for people who not only had a disability but were also chronically homeless:
…Getting to the untreated person, the person that’s never had a diagnosis before, it’s like you’re never going to get [disability benefits awarded] the first time around even though [the claimant] displays all these behaviors and things
3-33
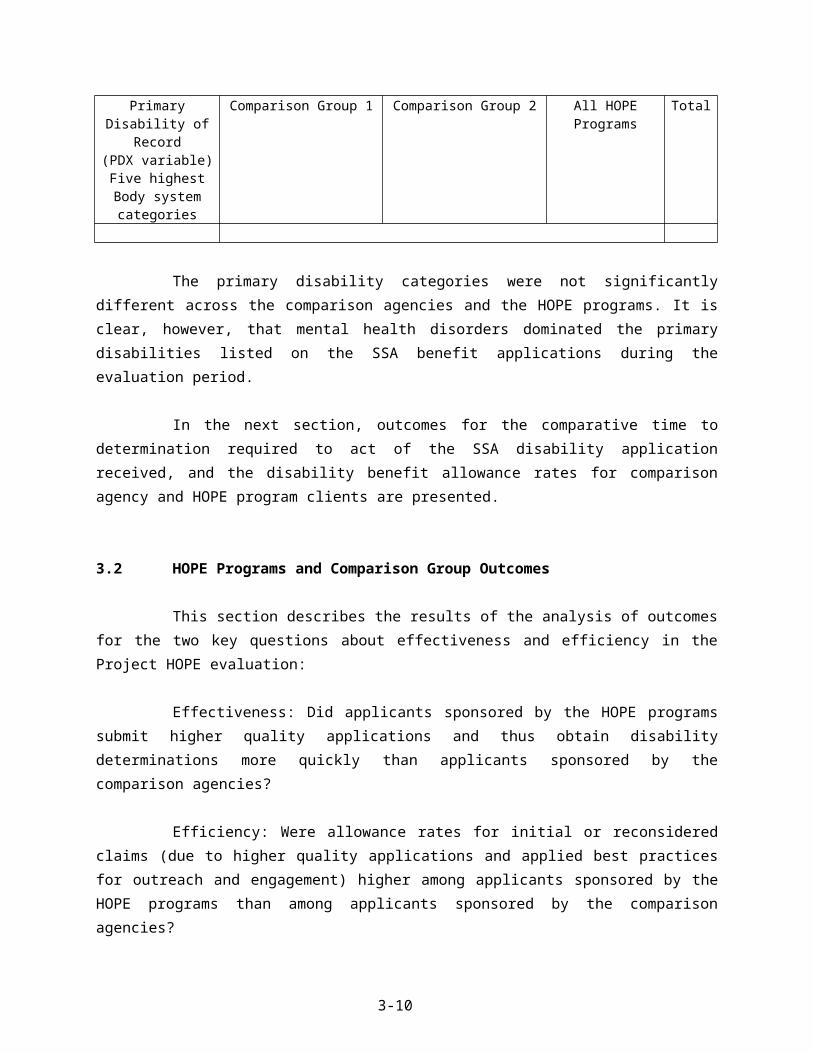
like that and you can talk to people [who know the claimant], but [the claimant wasn’t ever] treated. So a first time application [award] is … not going to happen. This is what it amounts to.
The issue of missing medical documentation for a mental health (or other medical) disorder,
when that is the disability for which the initial application is being filed, lengthens the time frame needed
to collect records, to help the enrollee get to a consultative exam (CE), and then to collect the records
from the CE to submit with the application to SSA. As the speaker below observed, it was clearly
understood that documentation is a need for the system, but the idea of a Catch-22—and the special issues
confronting HOPE staff who were working with chronically homeless individuals-- are echoed in her
reflections about the process.
Just [claimants’] getting letters saying ‘you’ve got to come to this CE’ [consultative exam]... is just … there’s no way. These people are disabled that’s why they are applying for disability and their disabilities might get in the way of them completing the disability application process. I don’t know what the best answer is for that. Obviously they [SSA and DDS] have to have something to look at.
Beyond the social costs of interacting with the SSA disability processing system that were
reported by interviewees and clients, the minefield metaphor continued to have salience as a descriptive
concept when grantees responded to questions about the types of barriers they experienced in the
application process. Interview transcripts were filled with descriptions of bureaucratic logjams,
inexplicable variations in procedures across SSA or DDS personnel in the same office or community,
exigencies linked to the scale of problems associated with serving an enormous homeless population (as
in New York City), and issues connected to addressing the problems experienced by people who were
chronically homeless in locales that were experiencing serious deficits in resources.
… DDS is supposed to send us copies of all correspondence which usually happens and then when they get sent over a CE [report], the clinic, certain clinics will send us copies of the letters or the appointments and certain clinics will not. I guess some clinics don’t do it by practice and some clinics do so if we don’t know [if the HOPE enrollees’ we work with] have been [seen or if a report was filed] – and sometimes the analyst calls to let us know, sometimes they don’t.
Bureaucratic logjams intersected with changes in the technology in use. This dynamic
extracted a toll on HOPE enrollees and affected the pace and accuracy of the review of their applications
by DDS. In New York City, electronic applications submitted by HOPE workers were re-entered, by
hand, into the computer system at DDS, leading to data entry errors that negatively affected the
processing of the applications.
3-34

What she learned is that [in the new process] they redo the Internet 3368 [electronic disability application], it’s printed out and then there’s somebody who types it in again to social security system or DDS system or something...they weren’t clear as to why but [it’s] something about their computer system … [A]couple of times … we would be talking to an analyst and say oh well you know what about this doctor, do you have stuff from him and they will say well that doctor isn’t even on my list [when it’s on ours] and … an address will be changed or…something… I mean it could happen … more often than we realize. Then people [miss]their CE because their address was not even close to what we’ve entered as their mailing address …And the plan is to get that taken care of. I don’t know what the timeline … is but that’s a problem, definitely.
Thus, from the staff members’ perspectives, having the technical knowledge to fill out a
benefits claim form was necessary, but not sufficient. The bureaucracy that is the disability claims and
assessments system presents all kinds of contingencies that the savvy HOPE team had to address in order
to obtain favorable reviews for their clients.
Contextual and Economic Factors
The analyses of site visit data revealed that there are conditions, labeled “the system inputs”
in Figure 3-4, which are likely to affect processes and outcomes for HOPE programs across the country
(e.g., a shortage of affordable housing stock). At the same time, contextual factors in specific regions or
communities exacerbate the effect of those conditions (e.g., high Fair Market Rents20 for apartments when
few rentals are available). In other instances, contextual factors in specific locales (e.g., housing subsidies
for veterans or people with HIV) dilute the negative impact of some of the national trends or serve to
advance the work of HOPE programs (e.g., braiding HOPE and SAMHSA funding facilitates dual
diagnosis treatment for HOPE enrollees).
When HOPE staff members were asked to identify barriers they encounter in their daily
work, program administrators and claim benefits specialists, in particular, observed that the status of the
local or regional economy greatly affected how or whether HOPE enrollees could access needed services
20 In 1974, the Housing and Urban Development Federal agency established “Fair Market Rent” (FMR) thresholds as a vehicle to help low-income households obtain better rental housing and “reduce the share of their income that goes toward rent through a program that relies on the private rental market” (http://www.huduser.org/periodicals/USHMC/winter98/summary-2.html). FMR set limits for HUD Section 8 certificate and voucher programs. Households with Section 8 vouchers receive HUD subsidies equal to the difference between their gross rent and 30 percent of their incomes. Voucher households can choose to rent above FMR, but if so, they must pay the difference between the gross rent and the FMR plus 30 percent of their income. Households with certificates cannot rent units with gross rent exceeding the FMR. In 1995, the current definition of FMR was established. Four elements are taken into account when FMR are calculated each year. The FMR is to reflect an amount equal to the 40th percentile of gross rents for typical, non-standard rental units occupied by recent movers in a local housing market.
3-35

and supports. Securing housing for people who were chronically homeless and had a disability was
usually the first issue broached.
The Program Director at the Stamford, Connecticut site articulated the effects of the local
and regional economy on housing placements in that community:
… What we found out is that yeah, [getting disability benefits] has the potential to help end chronic homelessness, but [not] with the benefits level being what they are, and the Fair Market Rents … The 2000 Fair Market Rent in Fairfield County for a two bedroom is about $1600 … State [rental] supplement is like $250, and then with the DI … it doesn’t go over $1,000 … In total, getting the [rent supplement and] SSI along with the SSDI ... you almost make it to $1100. So, rents being what they are in this area, and benefits being what they are in this area, people still remain homeless … There is no such thing as affordable housing in Stamford … Here the median income is $117,000, so if you’re under $87,000 you’re low income … and you’re eligible for affordable housing … if there was any.
The Stamford Program Director also observed how changes over time in the local and
regional economy and infrastructure contributed to the tight housing situation the HOPE program
struggled to confront. His observations were specific to Stamford, but the cycles that affected his area
(e.g., loss of manufacturing jobs with a concomitant rise of skilled service positions; high construction
costs) were starkly similar to conditions noted by the other HOPE programs, in other DDS regions (e.g.,
in Milwaukee and Escondido). These structural changes pervade most U.S. urban areas.
Stamford was … a manufacturing … town [for] a long time – … Stamford, Norwalk, and Bridgeport, because of their closeness to the water. So it was manufacturing. That has all changed. Now it’s all corporate … the home of Fortune 500 companies. I mean, we have a UBS, United Swiss Bank, we have the World Bank of Scotland coming in [and] GE, [and] Playtex. So … the employment is [now] … basically it’s computer generated, and having skills, business skills [is required]. Most of any jobs that our … people would be eligible for, is the entry level mailroom clerk kind of thing. … But it doesn’t pay a living wage… where they can afford to live here … [The] living wage … in [lower Fairfield County] is $28 an hour. In Connecticut, I think it’s $19. It’s about $28 to live in this area. … We had great difficulty getting any low income housing tax credit money, or any other kind of [housing development] money down here because our [construction] cost per unit is over $300,000.
One element related to the status of the regional economy affecting Stamford was not
mentioned by other HOPE programs that were visited. However, the collection of information about this
aspect is included here, as this same condition may well affect other HOPE programs in urban areas and
should be kept in mind during the final analyses of Project HOPE outcomes.
3-36

… A lot of [the homeless people we serve] do work, and what happens, they become bottlenecked at the shelter. So the shelter becomes either zero income or low income housing for a lot of our people because there is just no [affordable housing] out there …
This unanticipated finding suggests that in some communities, the national shortage of
affordable housing stock may be compounded by construction costs that make it prohibitive for
developers to construct new units and also by competition among community subpopulations that need
access to the same low-cost housing.
There may be several communities—and some where other HOPE programs operate—
where the homeless and indigent local populations “compete” with homeless or disability populations for
the only low or no-cost housing in the area. This is especially true in areas where funds or other resources
for identified constituencies are contained in budget “silos,” which designate community resources for
some populations (e.g., senior citizens living in poverty) that cannot be accessed by other populations
(e.g., people who are not seniors but are chronically homeless and have disabilities). Or, local resources
may be restricted for the use of participants in certain funded initiatives (e.g., HUD-subsidized housing
for veterans) who meet enrollment criteria (e.g., they are veterans who are homeless) but cannot be
accessed by participants who are ineligible for inclusion due to other reasons (e.g., they are veterans, and
homeless, but did not receive an honorable discharge from the military). In such situations, the attainment
of SSA disability entitlements by HOPE enrollees would not necessarily generate outcomes that include
positive changes in housing situations for program participants.
Gentrification of urban areas also has an impact on housing availability for people being
served by HOPE programs. In Milwaukee, the impact of gentrification in several parts of the city was
increasingly affecting the work of the HOPE awardee, Health Care for the Homeless of Milwaukee. One
staff member served as an outreach and claims benefit specialist worker for HOPE. He offered his
perspective by giving a concrete example of how such changes affected people who were chronically
homeless that he provided outreach to for the HOPE program.
Almost every one of [6-7 bridges in Milwaukee] had a [homeless] population [encampment] but they can’t live there anymore ... On the east side, there was a very popular one [for homeless campers]… They reconstructed that and put a light in … [Now] it’s a long walk bridge [that connects] one side [with] $250,000 [condo] units to the other side [with] $350,000 units. So they … tore out a bridge where [homeless] used to sleep under, especially in the winter time … … There’s [talk] about it … They’re building new bridges. ‘Wow, that’s a good thing. I can get from cross town and back really nice.’ [But] I never thought they’re tearing down somebody’s house, you know, until I started to look at it. And I’m talking to the guy [who lived under the bridge for years] and
3-37
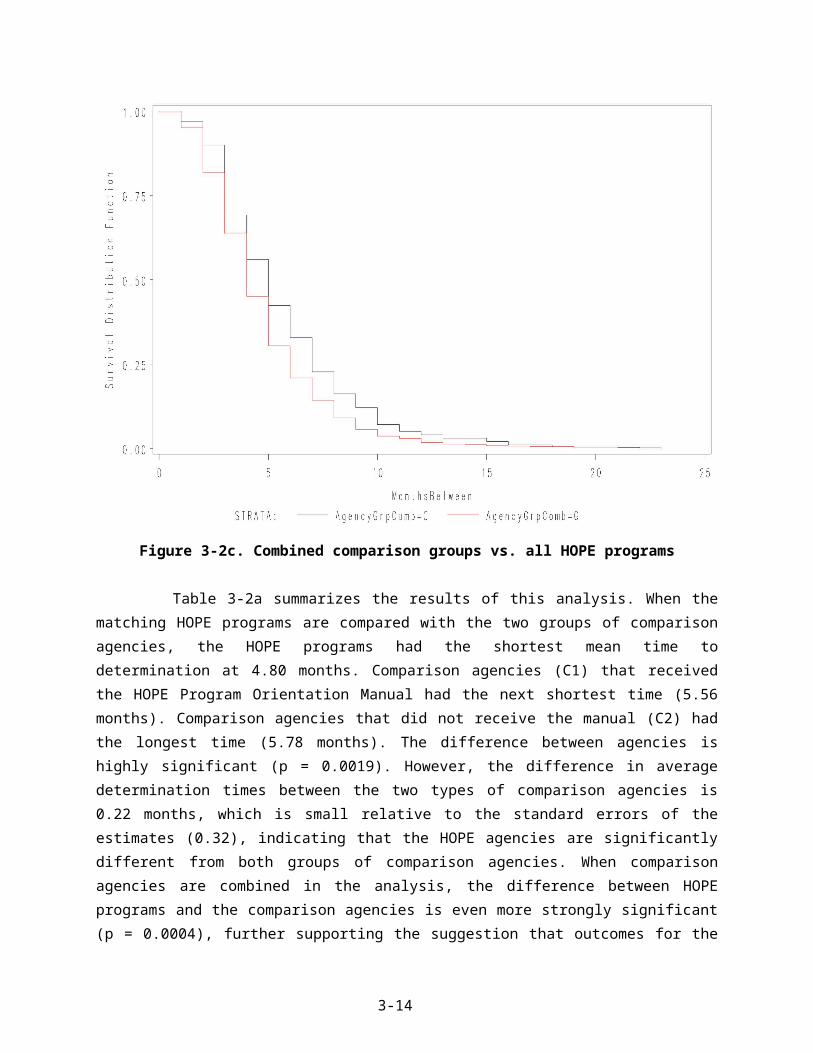
… I say, “Well, where you staying now?” “Well, we go – we wander here.” … *Q: Do you think the redesign kind of matches the attitudes toward the homeless around here? A: Oh, I’m sure.
The preceding comments reveal that gentrification negatively affects efforts to find and
maintain contact with the street homeless by the HOPE outreach worker. Shifts which were required in
the location of homeless encampments as development and construction moved forward only complicated
outreach and engagement efforts. The comments also suggest that the intersection of contemporary
political and economic trends (e.g., intentional redesign of urban structures to preclude their use by
people who are homeless and to increase wealth for some segments of the population) can conflate the
vulnerable situations already experienced by a homeless population.
Gentrification processes are but one aspect of the mix of national, regional, and local factors
that complicated efforts of HOPE program staff to achieve project objectives. Others included: efforts to
shift the costs of care for indigent and homeless disability populations from county to State or State to
Federal doles; variations across the States in the availability and amounts of public financial support;
years-long (or closed) waiting lists for Section 8 housing subsidies; and the extent to which homelessness
was criminalized. All HOPE program sites which were visited were dealing with this potent mix of
conditions. Through interviews or in unstructured conversations with staff and clients, it was also
apparent that there was substantial variation in the ways in which the HOPE program communities’
manifested social and political will to address, resolve, or deny problems associated with chronic
homelessness.
HOPE Work Processes
The work processes associated with reduced processing time of initial disability application
review and increasing the number of positive determination allowances include:
The dedication of an exclusive staff position(s) for a HOPE Claim benefits specialist;
No or low staff turnover in the HOPE program and in the SSA and DDS offices with which HOPE staffs interact or the capacity to accommodate turnover among key staff;
The acquisition and application of an increased knowledge about the demands of the SSA disability processing system and application requirements for documentation; and
The development, cultivation, and nurturance of ongoing relationships with HOPE collaborators and partners and with other providers in the HOPE communities that
3-38
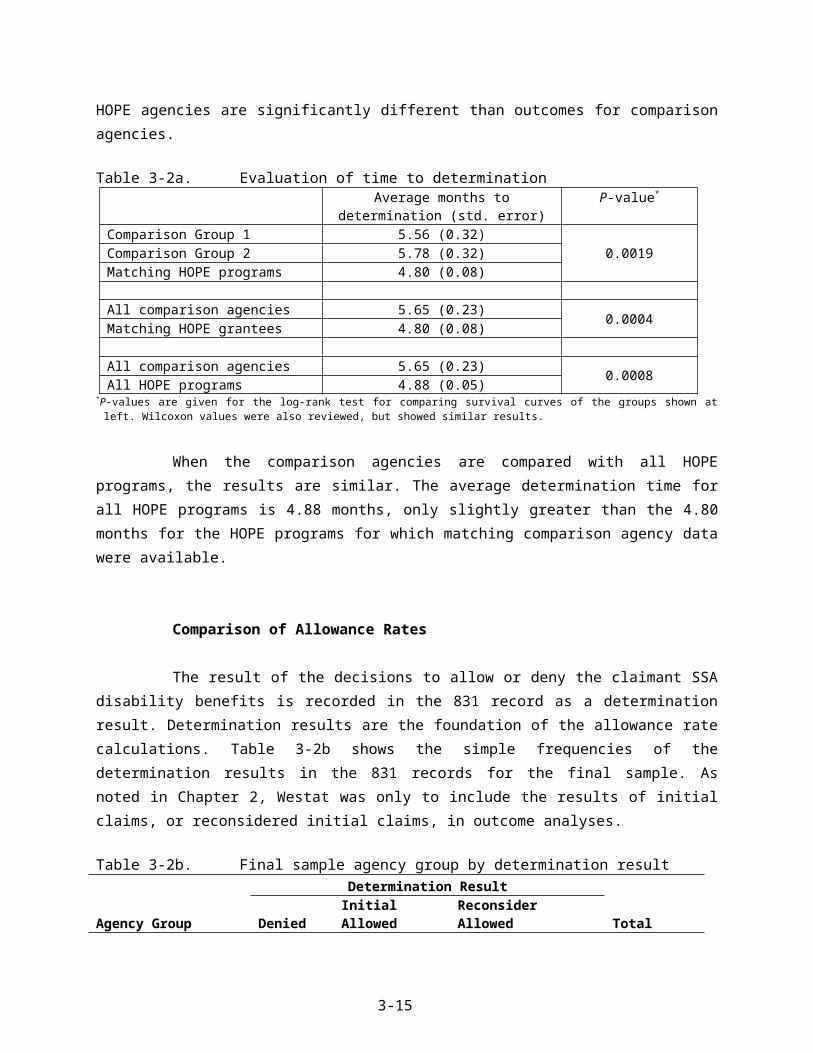
serve the same target population or individuals as HOPE enrollees or prospective enrollees.
While some aspects of the community context significantly impeded HOPE projects’ ability
to meet their objectives, other local contextual features served to advance the work of HOPE programs
and facilitate the attainment of desired outcomes. Examples of these features included the presence of
staff and funding streams supporting HOPE work, such as grants from other Federal, State, or county
sources that compliment the outreach and application assistance being provided through HOPE programs.
One example of State resources that were cited by HOPE grantees as facilitators included the Projects for
Assistance in Transition from Homelessness (PATH) grants which are available to all U.S. States and
several U.S. territories. They are funded through the Substance Abuse and Mental Health Services
Administration (SAMHSA) Federal agency. Three of the HOPE sites which were visited had access to
housing for which HOPE enrollees were eligible, too: “Housing Opportunity for People with AIDS”
(HOPWA). These and other funds could be braided with HOPE awards to increase the breadth of HOPE
program work.
In other areas, Veteran Administration housing or medical care resources both
complemented and extended the capacity of HOPE programs to serve the target population. An outreach
worker-case manager in Escondido described how a housing grant for HOPE enrollees became possible
with VA funding:
I’ve got to tell you about Merle’s Place, when we wrote the grant application to the VA, we focused on the HOPE project, because obviously … those people are going to need a place to live. And so in the grant itself we said the focus is going to be on–the VA calls it special populations, for elderly, dual diagnosed, terminally ill, and so on so forth—and it’s not going to be exclusively that because – well we’d like it not to be exclusively that, but that was the focus, to have a place for the HOPE project people.
The Program Director in Escondido also mentioned how VA housing and resources were
often combined to the benefit of HOPE clients:
… [Interfaith] housing is VA. As long as [HOPE clients] are done with our program then we transfer to their [HOPE] case manager who would monitor [them] ... We have housing all over Escondido. We have housing for mentally ill so the people who are veterans they can and do go into our other housing programs where [HOPE staff] will continue to follow them.
Data about another system input with a positive influence on HOPE program efforts
suggested that some community-specific initiatives may have been operating beneath the radar screen
3-39

developed to collect data for the final evaluation of all the Project HOPE awardees. This possibility
became apparent during the site visit to White Bird Clinic in Eugene.
[Eugene] developed a program about ten years ago which was called IMPACT. It’s an acronym …for Interagency Management-Planned Approach to Community Treatment, or if you want another version, Interagency Management-People Always Causing Trouble, and it was meant to identify the core group of people in this town who consistently are still seeking help over and over again. Like the Emergency Room gave us lists of people who showed up at the ER 50 or more times in a six month period. … It wasn’t one or two people. It was a list. I was shocked myself. I didn’t realize that was happening, and what it is, is all the major agencies in town come in together. … So what this is, is case management, community case management, with all of the agencies together case managing. … We’ll appoint the case manager if there’s no one else available to do it. Sometimes there’s another agency that’s going to lead, and as a group the agencies put together a plan, share it with each other, and at least wherever they’re going, (1) they get the same story, not ten different messages, and (2) everyone can refer back to the central manager or whatever. And that brought to White Bird, all the people that nobody wants to see… And a lot of the HOPE people are on this IMPACT list.
The preceding comments suggest that the influence of a system input such as inter-agency
case management coordination can be substantial, and beneficial, for HOPE enrollees and prospective
enrollees.
Finagling the System
Despite these local variations in work processes or the availability of additional funds, one
common theme across sites was the importance of staff members being “creative” and being willing to
adapt to an ever-changing clientele and local environment. One housing manager who collaborated with
the HOPE program in Stamford, Connecticut described the need for individuals that worked with HOPE
enrollees to creatively adapt their approaches to resolving barriers in the application processing system:
You know you have to have someone who knows how to finagle the system. …You need someone that knows how to – it’s a maze. It’s almost an intentional maze that drives people crazy and if we can’t get it for them. ‘Oh my goodness the people who are not really homeless and [are] trying to get services’-- it’s a joke. Across the board and not just – I have a brother who is 10 years younger than I am and is blind from diabetes and all of the chains and ropes I had to swing on just to get – he’s blind what do you want. Oh goodness. It took forever. I was there to do it and just happened to be in social services. So all the people that don’t have that same connection with an organization are just out there trying and people give up.
3-40
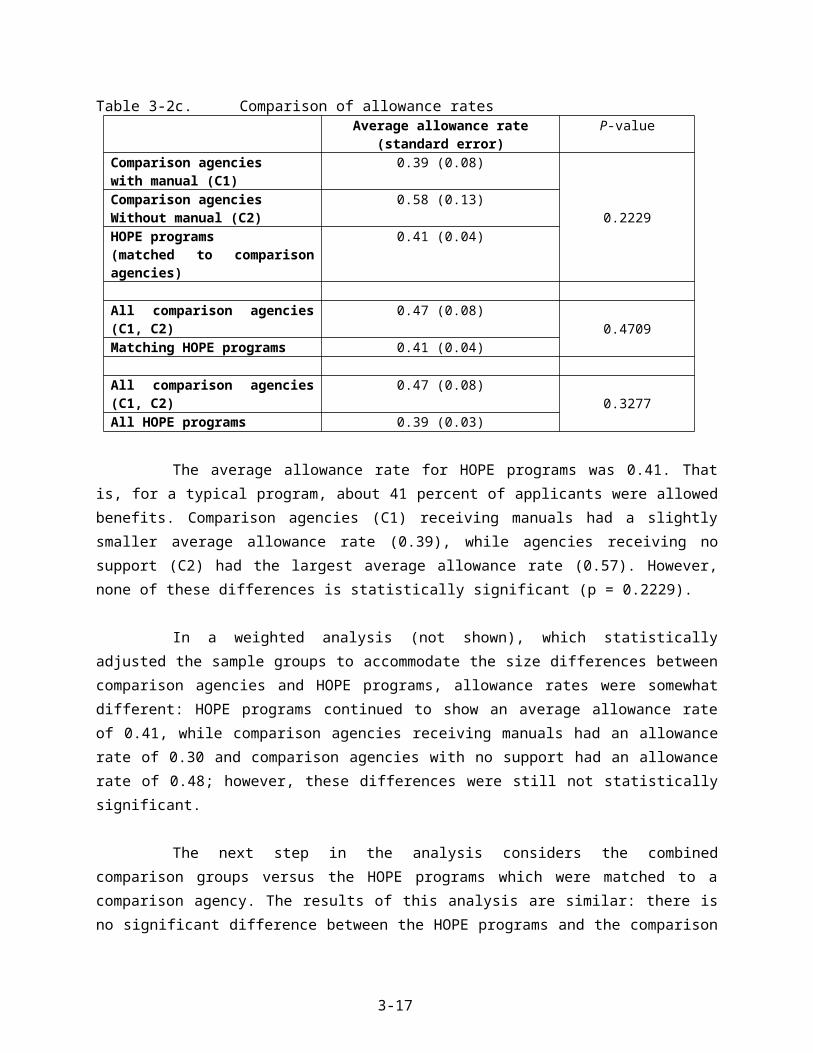
A claim benefits specialist in New York City communicated a similar notion in her
comments about negotiating with DDS staff to keep a case open –in lieu of rejecting it due to lack of
documentation for the initial application.
… A lot of the [DDS] analysts, you know, I mean it sounds like begging, but it’s just asking them, ‘Can you wait longer?’ like ‘This is coming this day,’ and just sort of promising them, ‘If you wait one more week we’ll have these records for you.’”… Some of them are really good about it … But some of them are getting this heat from their supervisor like, ‘You’ve requested [the records] twice. …you’ve got to keep these cases moving along.’ So you know that they’re hearing it and that they’ve got a reason to want to close the case.
Similar insights into the need to engage in interpersonal negotiations to facilitate entrée to
the SSA system was supported by another outreach worker/ HOPE case manager in Milwaukee:
I always deal with the [same] SSA office… over the years… I’ve got to know all these people …especially the front line, first person you see, and kind of a developed a good reason and logic with them for them to at least get them to “step to” … [Once,] this [homeless person] had – and they do it all the time - they lose their ID or it is stolen and with[out] that ID and their Social Security card … they don’t have mailing address…. It’s just, you know, these are three criteria you need to get these other things and then … you got to convince [SSA staff] say, ‘Well, we need to start somewhere and you know it as well as I do that this is not going to happen unless somebody breaks down for it. Now who’s it going to be?’ And then somebody will look around and say, ‘I’m not going to do – I’m going to lose my job for helping you’ But this is the person I take my word for, you know? And they’ll know that they had this here and I say …’He had an ID five years ago. Can’t you look on the system? Don’t this look like him? It looks pretty much like him, doesn’t it?’ … [then] they say, ‘Well, we’re not supposed to do that.’ ‘I know but this looks like him. Come on. So come on, let’s – is this him?’ You know, and they’ll relent.
It is apparent that finagling the system and the grantee work processes not only overlap
conceptually, but constitute the daily work processes for many HOPE program staff. In data collected for
the evaluation (e.g., grantees’ quarterly reports and focus group analyses from annual HOPE conferences
in 2005 and 2006), there were several sources of information about grantees’ work processes for Project
HOPE. The site visits, however, allowed the identification of a core set of processes that were associated
with not only successful enrollment, but also increases in the number and pace of disability benefit
allowances for HOPE enrollees.
3-41

An Unexpected Finding and Analytic Caveat
The advent of another federally-funded project during the Project HOPE evaluation period
confounds the evaluation findings about the effectiveness of the SSA-HOPE training or program
orientation materials. The project, administered by the Substance Abuse and Mental Health Services
Administration (SAMHSA), is the “SSI/SSDI Outreach, Access, and Recovery for People who are
Homeless” (SOAR) initiative. SOAR is a technical assistance and training initiative designed to help
increase access to SSA disability benefits for people who are experiencing homelessness (see
http://www.prainc.com/soar/)21. The SOAR initiative is in 14 States or communities at this writing:
Arizona, Florida, Georgia, Hawaii, Kentucky, California (Los Angeles area), Montana, Nevada, Ohio,
Oklahoma, Oregon, Utah, Virginia, and Washington. It was implemented after Project HOPE distributed
its cooperative funding awards in 2004, and is ongoing.
A key intent of the SSA intervention developed for Project HOPE relied on the HOPE
programs’ staff’s acquisition of—and application of—comprehensive knowledge about the SSA disability
system. HOPE programs were to learn more about the system and use the SSA-recommended processes
—the best practices for outreach, the best ways to complete applications and meet medical listing
requirements for SSA disability application processing—to achieve Project HOPE objectives. The
knowledge gained by staff in HOPE programs by virtue of their attendance at HOPE conferences and
training sessions with liaisons in SSA field offices and with DDS liaisons is not easily demarcated from
the increased knowledge that some program staff have gained through their participation in SOAR. Two
of the programs that we visited were integrally involved with SOAR, the White Bird Clinic (WBC) site in
Eugene, Oregon and the Health Care for the Homeless in Milwaukee (HCHM) site. In Oregon, WBC
staffs are involved in co-hosting training sessions using a SOAR curriculum. The HCHM also uses SOAR
materials, but not in an officially recognized capacity. The last quarterly reports for HOPE programs
available for the evaluation (for the period ending April, 2007) include additional comments about
HOPE-SOAR cross training, and presentations in several other community venues.
Many of the materials in the SOAR curriculum are similar to materials that SSA developed
for Project HOPE. Moreover, SOAR trainers were also invited by SSA to be featured speakers at the 2006
SSA HOPE annual conference in Baltimore. These findings reveal how intertwined SOAR training is
with some of the HOPE programs. The forum provided for SOAR during the HOPE conference also
indicates that attempts to analytically unravel the unilateral effectiveness of SSA technical assistance
provided under the Project HOPE rubric for HOPE grantees is not possible. Since the advent of SOAR
21 SSA does not fund SOAR, but did review, for accuracy, the training curriculum developed by SAMHSA’s subcontractor, PRA Inc., which developed SOAR materials.
3-42

was unanticipated when the Project HOPE design was developed, no vehicles exist to survey the extent to
which other HOPE programs in SOAR-funded States may have incorporated those training materials in
their own programs or in internal and community-based provider training sessions.
We conclude the presentation of the quantitative and qualitative process and outcome
evaluation findings with a discussion of contextual issues that exerted strong effects on the operations of
HOPE programs that received in-depth site visits for the evaluation. While the findings below highlight
issues in these specific contexts, their relevance to HOPE programs’ work in other urban environments is
clear. The findings also flag elements in any program’s locale that continue to affect HOPE work and
impact the possibility of achieving the ultimate Project HOPE objective, an end to chronic homelessness.
3.5 Urban Contexts and Persistent Homelessness
Key informants for the process evaluation offered comments about the socio-economic and
political arenas within which they implemented (and seek to sustain) HOPE programs returned us to an
examination of factors first associated with the emergence of homelessness in the 1980s (see, e.g., Burt
1991). The following chart presents factors implicated in persistent homeless that emerged during
conversations with focus group participants, HOPE program directors, participants in the programs and a
few unsheltered volunteer interviewees on city streets. It also presents some of the factual information
about the employment and housing attributes for the five HOPE programs’ where in-depth site visits were
conducted. The final column in the table presents information for the U.S. as a whole relative to that
factor when applicable and available.
All but one of the variables arrayed in the following table are factors examined by Martha
Burt (1991) in her analysis of factors that predicted 1989 homelessness rates in large (over 100,000
population) U.S. cities. She analyzed relative effects of factors hypothesized to cause homelessness,
including city housing and income conditions, employment conditions, household resources, employment
structure, available public benefits, and cost of living (ibid., p. 903). A variable not included in Burt’s
1991 analysis but which is included in Table 3-5, below, is the “criminalization of homelessness.” Project
HOPE actors noted the intersection of this factor with the perpetuation of homelessness in their
communities.
3-43

Table 3-5. Factors and trends associated with homelessness 2000-2006 for HOPE programs receiving site visits
City Factors Escondido, CA Eugene, OR Milwaukee, WI New York City, NY Stamford, CTU.S. Median, Mean or Data
City size (2005) 133,017 142,716 556,948 7,956,113 118,568 N/ACost of Living/Housing Index (2005)22
131/162
105/108
83/50
165/203
181/276
100/100
Per capita city income23
Per capita State income (2005)
$21,851($37,036 in CA)
$21,685($32,103 in OR)
$17,696($33,565 in WI)
$27,233($40,507 in NY)
$44,040($47,819 in CT)
$34,586
Percentage in poverty (2005)24
9.5% 19.3% 24.9% 19.1% 8.7% 12.6%
Rental vacancy rate (2004) 2.6% 5.5% 7.2% 4.9% 4.1% N/APercentage of 1-Person households (2005)
6.3% 15.2% 15.0% 12.6% 12.7% 26%
Manufacturing jobs trend(loss, no change, gain)
Loss No change (but loss of timber jobs)
Loss Loss Loss Loss
HUD Section 8 housing subsidy availability for tenants with low-income, or disabilities, or elderly (2006)
San Diego Co. rental assistance program wait list=37,000 + people.(Est. 7-10 yr. wait)
Sect. 8 wait list closed on October 3, 2005, until further notice.(Est. 3 yr. wait)
Sect. 8 wait list is opened once every 5 years for 48 hours, by phone
Only domestic violence victims; intimidated witnesses; referrals from NYC Administration of Children Services
Sect. 8 wait list closed in 2003; 5-6 vouchers/month in 2006 (500+ on list; est. 1 yr. wait)
In 2006 ( in constant dollars) the budget authority for HUD was 49% of what it was in 197825
2006 estimated homeless population (unless noted, shelter counts only)
7,500 San Diego Co.(2,000 in Escondido & Oceanside)
1,200 people 15,000-20,000 people (Milwaukee County)
31,000 singles26
8,000 families746 individuals 86 families27
Estimated at 754,000(HUD, 2005)
2006 Fair Market Rents Studio and 1 Bedroom $836/$954 $462/$561 $496/$591 $940/$1003 $987/$1,202 N/A2006 Monthly SSI amount single person
$812 (Jan-Mar);$836 (Apr-Dec) $603 $603 $690 $603 $603 (Federal Rate)
Criminalization of homelessness (2006)
Yes Yes Yes (and violent crimes against28)
No (Not significant) No (Not significant)
Rising trend, last 25 years29
22 The 2000 data are from the U.S. Census Bureau; 2005 data are from American Community Survey (http://factfinder.census.gov/home/saff/main.html?_lang=en) 23 Source: U.S. Department of Commerce, Bureau of Economic Analysis, Survey of Current Business. Web: www.bea.doc.gov/bea/regional/spi/ .24 2005 poverty data are from American Community Survey (http://factfinder.census.gov/home/saff/main.html?_lang=en).25 Source: http://mckinney20th.org/consensusstatement.html. Resolution HR581 accompanying reauthorization of McKinney-Vento Act.26 These figures are not static (http://www.nytimes.com/2007/09/04/nyregion/04homeless.html?pagewanted=2&ei=5070&en=a956aebe44e3a2ec&ex=1189569600&emc=eta1). 27 Figures shown are HUD rates. Estimates of the 2005 homeless population from this site’s proposal for HUD funding estimated higher numbers: “3,200+ people in Southwest Connecticut were homeless, with
more than 324 disabled and chronically homeless” (cited in Westat, 2006b).28 Data are from informants on site visits.
3-44

The findings presented in Table 3-5 are strikingly similar across the cities despite the
considerable differences in the size of their urban populations. The indices shown for the city’s cost of
living and housing are offered in comparison to the median rate of 100 for each index in the U.S. as a
whole. Four of the cities visited far exceeded the median cost of living and housing indices. Only
Milwaukee has cost of living and housing indexes below the U.S. median, but the unparalleled poverty
rate in the city is a clear departure from poverty rates in the other HOPE program cities which were
visited and to the poverty rate for the U.S. Of the cities profiled, Milwaukee also shows the highest rental
vacancy rate. Higher vacancy rates are generally associated with lower homeless populations (e.g., Burt,
1991) but in Milwaukee—and elsewhere-- interviewees noted that when housing is available, it is beyond
the financial reach of people they assist through the HOPE program. As the information about the SSI
payment in the table shows, the cost of unsubsidized housing in these cities is often higher than the total
amount of the benefit check.
Low vacancy rates and high percentages of 1-person households in urban areas are identified
features of cities with high homeless populations in the 1980s (Burt, 1991). The shrinking size of the
average U.S. household has been recorded by the Bureau of Census (U.S. Census Bureau, 2005) for many
years, but the confluence of low vacancy rates and increased demand for single person dwellings is
hypothesized as one predictor of high homeless populations. (Loss of housing stock may magnify the
twin effects of tight rental markets and demand for single-person living spaces. In Connecticut, an
interviewee made this connection in his comments about the high cost of housing construction in that
area.)
It is also significant that the general loss of manufacturing jobs, historically noteworthy for
their high wages, has occurred across the country and in all the cities visited except Eugene, Oregon. In
Eugene, the loss in high wage jobs is connected to job losses in the timber industry. Like many
manufacturing jobs, highly paid positions in the timber industry are not exclusively connected to the
attainment of professional degrees or long years of formal education. So even that element of context
which represents an exception to the general findings, loss of manufacturing jobs, points to a similar
effect in a different industry.
Findings about the unavailability of HUD subsidies in the site visit cities and the overall
decline in the HUD budget documented during the past few decades, were invariably—and passionately
—asserted as factors in persistent homelessness. These assertions were voiced by interviewees and
program participants during site visits, but they echoed a refrain of comments made by focus group
29 See e.g., http://www.nationalhomeless.org/publications/crimreport/trends.html
3-45

participants, too, whether they served as liaisons to HOPE programs or worked as staff of a HOPE
program.
3-46

Another finding that was equally emotionally charged was associated with interviewee
observations about the criminalization of homelessness occurring in their locales. Reports asserted that
people who were chronically homeless and had a disability bore the brunt of negative effects of
contemporary economic trends and housing policies. These assertions were usually linked to comments
about why homelessness persisted in their areas. Interviewees observed that making it a crime to be
homeless contributed to a revolving door syndrome between unsheltered domicile on city streets and
inmate status in correctional institutions. These observations were frequently connected to interviewees’
observations about an intractable stigma associated with people who are homeless and have disabilities.
Moreover, in Milwaukee and Eugene, key informants also noted that individuals who were so stigmatized
were frequently victims of violent crimes.
The high homeless population counts in the site-visit cities, and in the U.S., which are shown
in the preceding table, were never assumed by any of the interviewees to be a temporary feature of the
area. The idea that homeless in the U.S. is, itself, a chronic condition was unchallenged by any of the
qualitative findings for the Project HOPE evaluation.
In the concluding chapter of the report, which follows, we present the ways in which the
findings from the process evaluation inform the results of outcome analyses for the evaluation. We
discuss the ways in which the Project HOPE evaluation has contributed to a deeper understanding of
chronic homelessness issues and contextual elements which contribute to the persistence of the
phenomenon. In the final sections of the last chapter, we suggest design and content options that SSA
may wish to consider if other demonstration projects with an SSA intervention component are planned.
3-47

4. CONCLUSIONS AND RECOMMENDATIONS
Analysis conducted with data available for the independent evaluation of Project HOPE
between January, 2005 and July, 2007 reveals that significant benchmarks for the demonstration were
reached. Compared to similar agencies in their areas which did not receive HOPE funding but served a
similar population, HOPE programs were more effective. The people who were chronically homeless and
had a disability and whom HOPE program staff helped file SSA disability benefit applications received
SSA determination decisions about those applications more quickly. This reduction in processing time
was one of the objectives for Project HOPE.
Another indicator of HOPE programs’ effectiveness is suggested by changes in living
situations experienced by HOPE program enrollees 12 months after enrollment. Findings support the
claim that HOPE programs have been effective in assisting many individuals with histories of chronic
homelessness and have disabilities find more appropriate housing situations. That is, by adopting and
applying the practices recommended by SSA in their daily work (processes), the HOPE programs have
helped enrollees acquire better housing (outcomes).
Process evaluation analyses of interviews with program participants increase the strength of
HOPE programs’ effectiveness and expand our knowledge about the ways in which processes were
developed and used in the day-to-day work of HOPE programs. During in-depth site visits, HOPE
program staff revealed how important “finagling the system” (process) was to getting the resources that
enrollees needed. HOPE program enrollees said that safe and secure housing dramatically improved the
quality of life they experienced. Participants also affirmed that the connection to housing allowed by their
affiliation with Project HOPE facilitated their access to other needed resources (e.g., clothing, medical or
mental health care, employment services, or transportation help). Process evaluation findings thus
strengthen the claim of effectiveness. These findings illuminate another way in which processes used by
HOPE staff as they worked with program enrollees resulted in the attainment of intended outcomes. The
positive changes in living situation reported for HOPE enrollees and the increased quality of life reported
by program participants document that other core objectives of Project HOPE were attained.
Analyses also reveal that some of the key objectives for Project HOPE were not attained
during the evaluation period. Outcome analyses of the allowance rates for HOPE programs and
comparison agencies revealed that HOPE program enrollees were no more likely than clients in
comparison agencies to receive disability benefits based on the determination decisions made from an
initial (or reconsidered initial) claim. Myriad factors influenced the outcomes associated with the
4-1
respective allowance rates attained by HOPE enrollees and comparison agency clients. Thus, during the
evaluation period, the comparative efficiency of HOPE programs was not demonstrated. In this regard, it
is noteworthy that a key aspect of the independent evaluation was its exclusive focus on findings for
initial and reconsidered initial claims which were represented by the 831 data. SSA intends to continue
the analysis of HOPE programs’ outcomes through the additional contract year for which they were
funded. Thus, SSA can tap into additional data that were not available to Westat before the evaluation
contract expired (i.e., October, 2007). SSA may also wish to extend the analysis of 831 outcomes and
include analyses of cases for which hearings or additional case reviews were required before final
determinations were made. Given the effectiveness of the processes demonstrated during this evaluation
period, it is plausible that additional analyses may ultimately show that HOPE enrollees attained higher
allowance rates than those documented for comparison agency clients in this report.
Moreover, a preponderance of qualitative data findings offer strong support for the
substantial impact exerted by particular elements in a HOPE program community on the attainment of
Project HOPE goals. Analyses of urban contexts, similar to those in which most of the HOPE programs
are located, suggest that some elements of context have far-reaching effects on the persistence of
homelessness in the U.S. Other contextual elements exert specific influences that tend to help or hinder
the achievement of HOPE programs in certain areas.
In terms of the open systems model which provided the conceptual frame work for the
evaluation, final outcomes reveal significant differences between HOPE programs and comparison
agencies in their locales. HOPE programs have been more effective than comparison agencies in
submitting high quality applications (e.g., with complete and verifiable information) that subsequently
reduce the application processing time for SSA. This finding suggests that an indirect effect of Project
HOPE may be a reduction in the backlog of pending disability applications, which is another important
objective for the SSA (see, e.g., (http://www.ssa.gov/legislation/testimony_050107.htm). HOPE programs
receive determination decisions for enrollees whom they assist with filing SSA disability applications
nearly a month earlier than their comparison agency counterparts. This finding supports the theorized
positive relationships between the use of the processes recommended by SSA and the attainment of
desired outcomes.
HOPE program staff that were interviewed during in-depth site visits or participated in focus
groups, and others who wrote quarterly report narratives, communicated that they learned more about the
SSA system and what was required when disability claim applications were filed through their
involvement with Project HOPE. Staff workers credited SSA-HOPE conferences and workshops and the
networking opportunities they afforded as important sources of new information about the SSA system.
4-2
They also credited their development of strategies for navigating the system to acquire needed
information for the disability applications to some of their network contacts. Staff applied the knowledge
they gained to their HOPE work. The final outcome which reveals that HOPE programs are more
effective also validates the process evaluation findings about the acquisition of knowledge gained by
HOPE program staff. The processes used by staff facilitated the production of SSA disability applications
that could be immediately acted upon when they were submitted for processing. The end result was that
HOPE programs received determination results for their enrollees more quickly than similar agencies in
their area which did not participate in Project HOPE or receive HOPE funding.
In contrast, the results of efficiency analyses showed insignificant differences between the
allowance rates for disability benefits from initial claims in HOPE programs and the rates attained by
comparison agencies in their locale. HOPE enrollees were no more likely than comparison agency clients
to receive a determination that resulted in an SSA award of SSI or SSDI based on an initial filing or on a
reconsidered initial filing of a disability claim. Statistical examination of factors which might plausibly
affect allowance rate comparisons between HOPE programs and their non-HOPE-funded counterparts in
local communities did not reveal significant differences in the attributes of their respective clientele.
Similar demographics profiles were documented for comparison agency clients and HOPE program
enrollees. The final sample of people who were chronically homeless and had a disability in this
evaluation were predominantly male, reported disabling mental health disorders, and most were between
46-50 years old. Across the country, the differences in age and race-ethnicity concentrations varied, but
the differences between HOPE programs and matching comparison agencies for these variables were
unremarkable. There were no significant differences found between HOPE programs and comparison
agencies for another disability processing variable that might also be a factor in allowance rates, such as a
DDS request for a consultative exam (CE) for the claimant.
However, the findings from qualitative analyses reveal that allowance rates, conceptualized
as outputs in open system model framework, are strongly influenced by a number of factors. The model
holds that processes are necessary to the production of outputs, and effectiveness is indicated when
expected outcomes are achieved. The model suggests that efficiency is realized when a system produces
intended outputs—such as high disability benefit allowance rates—given the presence of adequate inputs
to the system. The evaluation of the demonstration project conceptualized the SSA intervention as central
inputs for the system—in terms of the resources that were distributed to HOPE programs (i.e., funding,
technical assistance, and networking opportunities). But the qualitative findings for the evaluation show
that the processes which are relied upon to effectively produce intended outcomes sometimes achieve
those outcomes without creating the expected outputs. Sometimes chronically homeless people have been
4-3
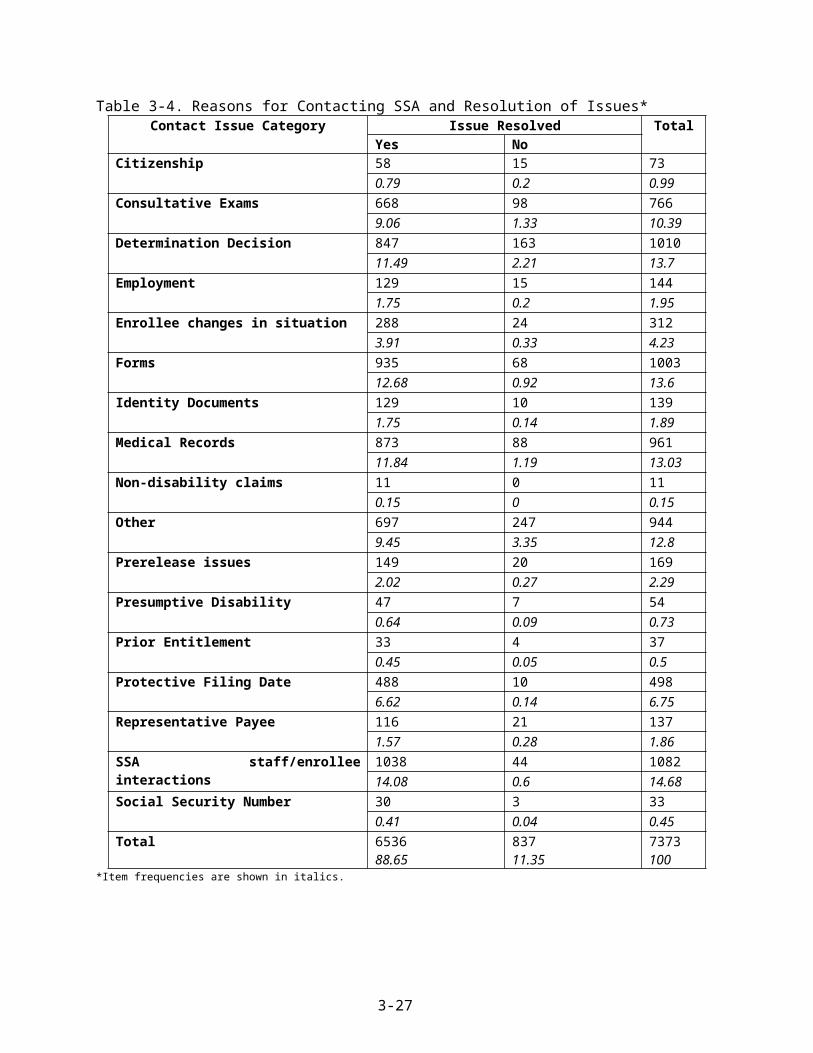
effectively assisted by HOPE programs, and gain access to housing or medical care (etc.), even if their
disability benefit claim has been denied.
A key finding of the in-depth site visit component for the evaluation revealed the centrality
of process to the achievement of outputs and outcomes. Several processes were identified as critical to
achieving HOPE program objectives and producing outs that led to intended outcomes (e.g., regularizing
contacts and keeping opening communication channels between programs and liaisons in SSA and DDS
effectively shortened the time needed for claim determinations). The centrality of the “finagling the
system” finding from the site visit evaluation component revealed that finagling is a feat of individual-
system negotiation which has a direct impact on (primarily short-term) outcomes. But even the success of
the finagling process can be undermined or enhanced by factors in local communities. These elements
emerged in analyses as strong influences which affected allowance rates for HOPE programs and
comparison agencies alike.
The findings presented in the urban context and persistent homelessness discussion section
highlighted ways in which contextual elements (e.g., employment structures, cost of living, or the
availability of low-income or subsidized housing) are inputs that can affect the outcomes of a system,
such as the rate at which disability benefits are allowed. Even effective processes, such as successful
system finagling, or the use of ‘best practices’ for outreach and engagement, may be inadequate to broach
the divide created by these elements in urban areas. The exact ways in which contextual inputs affect
outcomes such as allowance rates were rarely articulated, but the reality of those effects were widely
understood. HOPE staff and program participants in Wisconsin, Oregon, New York, Connecticut, and
California all voiced their understanding that “no one” gets benefits based on an initial filing. In some
regions, informants also learned that certain local realities could not be surmounted (e.g., a psychiatric
practitioner and a formerly homeless program staff member for the HOPE program in California both
stated that a Post Traumatic Stress Disorder shouldn’t be used as the primary condition for a disability
claim because it was so often declined).
Efficient processes may be undercut by other inputs to the setting which are often omitted in
program evaluation designs. Based on the process and outcome analyses for Project HOPE, it can be
argued that the contextual inputs to the Project HOPE system –represented by the specific conditions in
certain urban areas or in certain regions of the country— have exerted an influence on allowance rates
that were not entirely captured by the original design for the Project HOPE evaluation. Qualitative
findings have highlighted the ways in which local, State, Federal and national conditions or policies
influenced the attainment of HOPE program goals. Qualitative data collection and analyses also revealed
ways in which agency conditions and practices affected the outputs of HOPE programs and the outcomes
4-4
associated with HOPE enrollees’ disability claims. Interviews with HOPE staff members and HOPE
enrollees shed light on some of the ways in which individual attributes, decisions, or actions by enrollees
or by staff members also affected outputs and outcomes. An analysis of several urban contexts suggested
that many of these economic, political and social factors have a collective influence on the results of the
efficiency analyses for the evaluation (i.e., as captured by the lack of distinction between disability
allowance rates for HOPE program enrollees relative to those for comparison agency clients).
As SSA conducts its extended analysis of Project HOPE outcomes, and captures data in the
processing system for enrollees and comparison agency clients that were not available during the
independent evaluation period, such factors may continue to exert an influence in the attainment of
allowance rates from initial filings. HOPE programs’ comparative efficiency in attainment of disability
benefits from initial claims may not be demonstrable. However, if the demonstrated effectiveness of the
HOPE programs in attaining determination results from initial claims more quickly (and thereby help
enrollees improve living situations, enjoy higher quality of life, and access needed mainstream resources
and care) is maintained, these positive outcomes may lessen the impact of such contextual elements for
program enrollees. Given the enduring nature of these contextual influences on persistent homelessness, it
is unlikely that comparison agency clients will experience substantial improvements in their situations
without a local enrichment of inputs, similar to those represented by the SSA inputs for Project HOPE.
Recommendations
In the final section of the report, Westat offers two global recommendations that SSA may
wish to consider when undertaking evaluations of future national demonstration initiatives. The
recommendations offered are associated with the findings of the evaluation.
The importance of context in the evaluation of demonstration programs is likely to exert a
significant effect on the outcomes for future program evaluations, particularly those conducted on a
national basis. SSA may wish to consider the possibility of designing projects or designing plans for the
evaluation of projects that incorporate attention to context.
For instance, research studies over the last two decades have identified how certain
economic and social structures in urban areas may be implicated in the persistence of homelessness.
Designs for projects which ask prospective grantees to enumerate some of the specific contextual
elements in their proposal for funding may help inform and tailor an evaluation design that fits
metropolitan areas with these features.
4-5

In contrast to the wealth of research conducted in large urban areas, less attention has been
devoted to rural homelessness or to homeless occurring in smaller cities or in cities in remote locations.
(These issues were raised by some of the focus group participants in Project HOPE.) SSA may wish to
consider funding a demonstration project that reveals the importance of contextual elements in resolving
persistent homelessness in areas where the homeless are less visible. The evaluation plan for
demonstration projects in areas such as these would be modified accordingly.
National studies often benefit from the establishment of comparison entities to which the
funded programs can be compared. In order to avoid some of the expenses and loss of evaluation data that
were experienced during the Project HOPE evaluation, SSA might consider providing smaller awards to
organizations that proposed studies for competitive awards, but which could not be fully funded (e.g., due
to budget constraints). When the need for comparison agencies are anticipated in an evaluation for a
demonstration project in the future, SSA might consider identifying a set number of applicants that could
be designated as potential comparison agencies for the evaluation. Such agencies could be offered
reduced amounts of funding in exchange for their agreement to produce data required for an evaluation.
4-6

5. REFERENCES
Barbour, R. S. (1999) The case for combining qualitative and quantitative approaches in health services research, Journal of Health Services Research Policy 4(1): 39-43.
Bogdan, R.C., and S.K. Biklen. (1992) Qualitative research for education: An introduction to theory and methods (2nd ed.). Boston: Allyn and Bacon.
Brown, P. (1985) The transfer of care: Psychiatric deinstitutionalization and its aftermath. London: Routledge & Kegan Paul.
Bryman, A. (1988) Quantity and quality in social research. London: Routledge.
Burt, M. (1991) Causes of the growth of homelessness during the 1980s, Housing Policy Debate 2 (3): 903-936.
Burt, M. and B.E. Cohen. (1988) America’s homeless: Numbers, characteristics, and the programs that serve them (Washington, DC: The Urban Institute Press).
Burt, M., Aron, L., Douglas, T., Valente, J., Lee, E. and B. Iwen. (1999) Homelessness: Programs and the people they serve: Summary findings of the national survey of homeless assistance providers and clients (Washington, DC: The Urban Institute).
Burt, M., L. Aron, and E. Lee. (2001). Helping America’s homeless: Emergency shelter or affordable housing? Washington, DC: Urban Institute Press.
Burt, M. et al. (2002) Evaluation of Continuums of Care for homeless people. Washington, D.C.: U.S. Department of Housing and Urban Development.
Caracelli, V.J., and J. Greene. (1997) Advances in mixed-method evaluation: The challenges and benefits of integrating diverse paradigm. New directions for evaluation, No. 74. San Francisco, CA: Jossey-Bass.
Center for Budget and Policy Priorities. (2007) Cuts in Federal housing assistance are undermining community plans to end homelessness (http://www.cbpp.org/2-1-07hous.pdf).
Coffey, A., and P. Atkinson, (1996) Making sense of qualitative data. Thousand Oaks, CA: Sage.
Cresswell, John. (1998) Qualitative inquiry and research design. Thousand Oaks, CA: Sage Publications.
Culhane, D., and R. Kuhn. (1997). Patterns and determinants of shelter utilization among single homeless adults in New York City and Philadelphia: A longitudinal analysis of homelessness. Journal of Policy Analysis and Management, 17 (1) 23-43.
Eisner, E.W. (1991) The enlightened eye: Qualitative inquiry and the enhancement of educational practice. New York: Macmillan.
Erickson, S. and J. Page. (1998) To dance with grace: Outreach and engagement to persons on the street. In Practical lessons: The 1998 National Symposium on Homelessness Research. Washington,
5-1

D.C.: HUD and HHS, pp. 6-1 to 6-24 (http://aspe.hhs.gov/progsys/homeless/symposium/6-Outreach.htm).
Federal Register. (2003a). Notice of Funding Availability for the Collaborative Initiative to Help End Chronic Homelessness. January 27, 2003, 68 (17): 4019.
Federal Register. (2003b). Notification of Funding Availability for Continuum of Care Homeless Assistance Programs, Office of Community Planning and Development, U.S. Department of Housing and Urban Development. April 25, 2003, 68 (80).
Federal Register. (2003c) Social Security Administration program: Cooperative agreements for Homeless Outreach Projects and Evaluation (HOPE). Program Announcement No. SSA-OPDR-03-02, Vol. 68 (187): 55698-55709.
Feldman, M. (1997) Strategies for interpreting qualitative data. Newbury Park, CA: Sage Publications.
French, W., and C. Bell, Jr. (1984). Organization development: behavior science interventions for organization improvement. Englewood, NJ: Prentice-Hall, Inc.
Greene, J., and N. Britten. (1998) Qualitative research and evidenced based medicine. British Medical Journal Vol. 316: 1230-1232.
Hombs, M.E. and M. Snyder (1982) Homelessness in America: Forced march to nowhere. Washington, D.C.: Creative Center for Non-Violence.
Hopper, K. (2003) Reckoning with homelessness. Ithaca, NY: Cornell University Press.
Jencks, C. (1994) The homeless. Cambridge, MA: Harvard University Press.
Katz, D. (1978). The social psychology of organizations. New York: John Wiley & Sons.
Kuhn, R. and D. Culhane (1998) Applying cluster analysis to test of a typology of homelessness: Results from the analysis of administrative data. American Journal of Community Psychology, 17 (1), 23-43.
Lamb, R. (1984) Ed. Deinstitutionalization and the homeless mentally ill. In The homeless mentally ill: A task force report of the American Psychiatric Association. Washington, D.C.: American Psychiatric Association.
Levitas, Mitchel. (1990) Homeless in American. New York Times Archives (Opinion section, June 10, 1990, Lead editorial).
Lofland, J., and L. Lofland. (1984) Analyzing social settings. Belmont, CA: Wadsworth, Inc.
Maxwell, C., and G.B. Rossman. (1989) Designing qualitative research. Newbury Park, CA: Sage.
Maxwell, J.A. (1996) Qualitative research design: An interactive approach. Thousand Oaks, CA: Sage Publications.
McCauley, Maura. (2004). Lack of health care: A root cause of homelessness. Chicago Coalition for the Homeless, CCH Fact Sheet. (http://www.chicagohomeless.org/).
5-2

Metro Denver Homeless Initiative (2006) Homelessness in metropolitan Denver: Seventh annual point-in-time study, 2006.
Miles, M. and A. Huberman. (1994) Qualitative data analysis: an expanded sourcebook. Thousand Oaks, CA: Sage Publications.
Miles, R. (1980). Macro organizational behavior. Glenview, Illinois: Scott Foresman and Company.
Mitka, M. (2006) Chronic homeless in intervention spotlight. Journal of the American Medical Association 295 (20): 2344-2345 (http://jama.ama-assn.org/cgi/content/full/295/20/2344).
Moran-Ellis, J. and V. D. Alexander, et al. (2006) Triangulation and integration: Processes, claims and implications. Qualitative Research. London: Sage Publications.
Moynihan, P. (1984) Desperate homeless need Federal attention. New York Times archives. (Opinion section, March 6, 1984).
Multnomah County (2006) Home again 2005 status report cited in National Alliance to End Homelessness (2007) Fact checker: Chronic homelessness.
National Alliance to End Homelessness (2005) Community snapshot. Washington, D.C.: National Alliance to End Homelessness. Access: http://www.naeh.org/.
National Alliance to End Homelessness (2006) Chronic homelessness. Washington, D.C.: National Alliance to End Homelessness. Access: http://www.naeh.org/.
National Alliance to End Homelessness (2007) Homelessness counts. Washington, D.C.: National Alliance to End Homelessness. Access: http://www.naeh.org/.
National Alliance to End Homelessness (2007) Nan Roman’s Keynote Address—Annual Conference, 2007. Washington, D.C.: National Alliance to End Homelessness. Access: http://www.naeh.org/.
National Policy and Advocacy Council on Homelessness (NPACH) (2007) Questions and answers about the chronic homelessness initiative (http://www.npach.org/chronicq.html).
Rossi, P. (1989) Down and out in America: The origins of homelessness. Chicago, IL: The University of Chicago Press.
SAMHSA (Substance Abuse and Mental Health Services Administration). Blueprint for change: Ending chronic homelessness for persons with serious mental illnesses and co-occurring substance use disorders. DHHS Pub. No. SMA-04-3870, Rockville, MD: Center for Mental Health Services, Substance Abuse and Mental Health Services Administration.
SAS Institute (2007). SAS/STAT User’s guide. SAS Institute, Cary, NC.
SSA (2003) Report to Congress, 2003, http://www.socialsecurity.gov/homeless/.
SSA (2007) Social Security testimony before Congress, Statement of Michael J. Astrue, May 1, 2007. (http://www.ssa.gov/legislation/testimony_050107.htm).
Strauss, A., and J. Corbin. (1990) Basics of qualitative research. Thousand Oaks, CA: Sage Publication.
5-3
Strauss, A.L. (1987) Qualitative analysis for social scientists. New York, NY: Cambridge University Press.
U.S. Census Bureau (2005) Families and Living Arrangements: 2005 (http://www.census.gov/Press-Release/www/releases/archives/families_households/006840.html).
U.S. Conference of Mayors, (2003) Homelessness and hunger: A status report on hunger and homelessness in America’s cities (http://usmayors.org).
U.S. Conference of Mayors, (2005) Homelessness and hunger: A status report on hunger and homelessness in America’s cities (http://usmayors.org).
U.S. Conference of Mayors, (2006) Homelessness and hunger: A status report on hunger and homelessness in America’s cities (http://usmayors.org).
U.S. Department of Housing and Urban Development (2001). Guide to Continuum of Care planning and implementation (http://www.hud.gov/offices/cpd/homeless/library/coc/cocguide/).
U.S. Department of Housing and Urban Development (2006) Strategic Plan, FY 2006-2011 (http://www.hud.gov/offices/cfo/stratplan.cfm).
U.S. Department of Housing and Urban Development (2007) The annual homeless assessment report to Congress, February, 2007. Washington, D.C.: U.S. Department of Housing and Urban Development.
U.S. Department of Housing and Urban Development (2007) The applicability of the Housing First models to homeless persons with severe mental illness, July, 2007 (http://www.huduser.org/publications/homeless/hsgfirst.html).
U.S. Interagency Council on Homelessness (2003) 2003 Annual report of the Social Security Administration, (http://www.socialsecurity.gov/homelessness/) SSA Report to Congress, SSA ICH Report).
U.S. Interagency Council on Homelessness (2005) 2005 Annual report of the Social Security Administration, (http://www.socialsecurity.gov/homelessness/) SSA Report to Congress, SSA ICH Report).
Westat (2005a) Task , Subtask 2: HOPE web site user manual. Rockville, MD: Westat.
Westat (2005b) Task 3: Systems manual. Rockville, MD: Westat.
Westat (2005c) Task 4: 2005 focus group report. Rockville, MD: Westat.
Westat (2005d) Task 5: Comparison group report. Rockville, MD: Westat.
Westat (2006a) Automated information systems security plan (AISSP) for Westat applications. Rockville, MD: Westat.
Westat (2006b) Task 4: 2006 Focus group report. Rockville, MD: Westat.
Westat (2006c) Task 8, Subtask 1: Final work plan for the qualitative process evaluation component for the HOPE Evaluation. Rockville, MD: Westat.
5-4

Westat (2006d) Task 8: Qualitative process evaluation component report for the HOPE evaluation. Rockville, MD: Westat.
5-5

5-6
APPENDIX A
ACRONYM REFERENCE LIST

The following list identifies the complete name reference for acronyms used in the text of
this document (including items mentioned in footnotes).
831s SSA administrative data contained in 831 “Disability Master” records
AISSP Automated Information Systems Security Plan
BLM U.S. Bureau of Land Management
C1 Comparison agency group 1 (i.e., received the HOPE Program Orientation Manual).
C2 Comparison agency group 2 (i.e., did not receive the Program Orientation Manual).
CBPP Center for Budget and Policy Priorities
CE Consultative Exam
DDS Disability Determination Services
FMR Fair Market Rate
FO SSA field office
HOPWA Housing Opportunity for People with AIDS
HUD U.S. Department of Housing and Urban Development
ICH U.S. Interagency Council on Homelessness
NAEH National Alliance to End Homelessness
NPACH National Protection and Advocacy Council on Homelessness
PATH Projects for Assistance in Transition from Homelessness
RO SSA regional office
RP Representative payee
SAMHSA Substance Abuse and Mental Health Services Administration
SOAR SSI/SSDI Outreach, Access and Recovery
SSA Social Security Administration
SSDI Social Security Disability Insurance
SSI Supplemental Security Income
VA U.S. Department of Veterans Affairs
A-1

APPENDIX B
DDS (DISABILITY DETERMINATION SERVICES) GEOGRAPHIC REGIONS FOR THE PROJECT
HOPE EVALUATION

The following list shows which States were included in each DDS region for Project HOPE.
Region 1, Boston (BOS): Connecticut, Maine, Massachusetts, New Hampshire, Rhode Island, Vermont
Region 2, New York (NY): New Jersey, New York
Region 3, Philadelphia (PHI): Delaware, District of Columbia, Maryland, Pennsylvania, Virginia, West Virginia
Region 4, Atlanta (ATL): Alabama, Florida, Georgia, Kentucky, Mississippi, North Carolina, South Carolina, Tennessee
Region 5, Chicago (CHI): Illinois, Indiana, Michigan, Minnesota, Ohio, Wisconsin
Region 6, Dallas (DAL): Arkansas, Louisiana, New Mexico, Oklahoma, Texas
Region 7, Kansas City: Iowa, Nebraska, Kansas, Missouri
Region 8, Denver (DEN): Colorado, Montana, North Dakota, South Dakota, Utah, Wyoming
Region 9, San Francisco (SF): Arizona, California, Hawaii, Nevada
Region 10, Seattle (SEA): Alaska, Idaho, Oregon, Washington
B-1