table of contents - universities uk · · 2016-07-27table of contents table of figures ... 3
TRANSCRIPT


2
TABLE OF CONTENTS
Table of Figures ............................................................................................................................................. 4
Executive Summary ....................................................................................................................................... 5
Policy Context ................................................................................................................................................ 6
Contemporary Indian Higher Education Policy ........................................................................................ 6
New Education Policy ............................................................................................................................ 6
Educate in India...................................................................................................................................... 7
GIAN ....................................................................................................................................................... 8
National Institutional Rankings Framework (NIRF) ............................................................................. 9
Qualifications recognition ...................................................................................................................... 9
Key Bilateral Initiatives ............................................................................................................................ 11
Newton Bhabha Fund .......................................................................................................................... 11
UK India Education & Research Initiative (UKIERI) .......................................................................... 12
Data Analysis ............................................................................................................................................... 13
UK and India – Summary statistics......................................................................................................... 13
Extant sources ...................................................................................................................................... 13
Survey data........................................................................................................................................... 13
Extant Data Analysis................................................................................................................................ 14
Indian student enrolment at UK institutions........................................................................................ 14
Transnational education enrolment .................................................................................................... 20
Student satisfaction .............................................................................................................................. 21
Funding sources ................................................................................................................................... 23
Outward mobility to India ......................................................................................................................... 24
Indian staff employment at UK universities ............................................................................................ 25
Research collaboration ............................................................................................................................ 25
Survey data analysis................................................................................................................................ 31
Institutional strategies & geographic engagement with India............................................................ 31
International student recruitment in India ........................................................................................... 34

3
Research collaborations: enablers and challenges ........................................................................... 38
UK higher education commitment to India ......................................................................................... 40
Summary ...................................................................................................................................................... 42
Policy environment ............................................................................................................................... 42
Institutional engagement in India ........................................................................................................ 42
Research collaboration ........................................................................................................................ 42
Student recruitment .............................................................................................................................. 42
Acknowledgements ..................................................................................................................................... 43
Annexes........................................................................................................................................................ 44
Annex A1 - Overview of Indian Higher Education ................................................................................. 44
Annex A2 – Indian students by subject area and level of study, 2013–14 .......................................... 46
Annex A3 – Major source of tuition fees ................................................................................................ 48
Annex A4 - Indian nationals employed as academic staff by cost centre, 2013–14 ........................... 51

4
TABLE OF FIGURES
Figure 1- Indian students enrolled in UK higher education, 2007–2014 ............................................ 14
Figure 2 - Geographic distribution of Indian students, 2013–14 ........................................................ 15
Figure 3 - Indian students enrolled by level of study, 2007–2014 ...................................................... 16
Figure 4 - Trends in new entrants from the top 10 non-EU source countries ..................................... 17
Figure 5 - Indian student enrolments by subject type ........................................................................ 18
Figure 6 - Indian student enrolment in computer science, engineering & technology, and business &
administrative studies, 2007–2014 ................................................................................................... 19
Figure 7 - Indian student enrolment in law, biological science, creative arts & design, social studies &
subjects allied to medicine, 2007–2014 ............................................................................................ 19
Figure 8 - Indian student enrolment in agriculture & related subjects, veterinary science, historical &
philosophical studies, mathematical sciences, languages, mass communications & documentation,
education, physical sciences, medicine & dentistry, 2007–2014 ....................................................... 20
Figure 9 - Instances of student mobility to India by provider, 2013–14 .............................................. 24
Figure 10 - Indian nationals employed as academic staff, by function, 2013–14 .............................. 25
Figure 11 - Research output from India, 1955 - 2015 ....................................................................... 26
Figure 12 - International collaborations with India by country, 2014 .................................................. 27
Figure 13 - Research publications from UK: Countries of co-authorship, 1994–2014 ........................ 27
Figure 14 - Subject area of UK research publications with international co-authors (all countries)
1994–2014 ...................................................................................................................................... 28
Figure 15 - UK-India collaboration third country partners, 1994–2014............................................... 28
Figure 16 - Components of India strategy rated as very important and important .............................. 31
Figure 17 - UK institutions' offices within India .................................................................................. 32
Figure 18 - Key responsibilities of UK university offices in India ........................................................ 33
Figure 19 - Student recruitment activities rated by importance.......................................................... 35
Figure 20 - Changes in the level of student recruitment by method................................................... 36
Figure 21 - TNE programmes contributing to student recruitment from India..................................... 37
Figure 22 - The most efficient use of funds to support student recruitment in India ........................... 38
Figure 23 - Research partnerships between the UK & India ............................................................. 39
Figure 24 - Key enablers for institutional engagement with India ...................................................... 39
Figure 25 - Main challenges to implementation of India strategy ....................................................... 40
Figure 26 - Average spend by HEIs by type of activity ...................................................................... 41

5
EXECUTIVE SUMMARY
This report, produced following a visit to the UK by Indian Prime Minister Narendra Modi and
in advance of a UK delegation to India led by the Rt Hon Sajid Javid MP, Secretary of State
for Business, Innovation and Skills and Jo Johnson MP, Minister of State for Universities and
Science, sets out the level of engagement between the two sectors. It includes a concise
policy overview and analysis of available data drawn from extant sources and a survey of the
sector conducted for this report.
There are currently over 700 Indian universities. They range from a hundred and fifty year
old comprehensive institutions to new subject-specialist centres. These higher education
institutions are governed by a range of central departments, regulatory bodies and councils.
New legislation could add to this diversity by enabling foreign providers to operate within
India. The Government of India’s GIAN initiative is providing opportunities for UK academics
to teach at Indian institutions. Whilst the bilateral initiatives UKIERI and the Newton Bhabha
Fund are facilitating the exchange of university staff between the two countries and providing
direct funding for collaborative research in areas such as clean energy and maternal health.
A survey of the UK higher education sector demonstrates that the work taking place under
Government initiatives is further complemented by individual institutional activity.
The UK sector survey received responses from 101 institutions covering at least 75% of the
Indian students in the UK. Many institutions noted the impact of visa policy upon the UK’s
ability to attract India students relative to its international competitors, evident in the
recruitment statistics. Indeed, 98% of the surveyed HEIs (89 HEIs out of 91) rated a
competitive student visa package and employment opportunities for international students as
the most important enabler for engagement with India. Nonetheless, universities continue to
invest heavily in the relationship with India. For example, the average stated spend on
scholarships is approximately £100,000 per university. Additionally, those Indian students
that are studying in the UK are typically very positive about their choice: 86% saying that
they would recommend their experience to others and 92% expressing overall satisfaction.
Further data analysis demonstrates the impact performance of UK-India research, with a
field-weighted citation impact 1 of 2.23 for collaborative publications, higher than that of
collaborations between India and the US, France and Germany. In terms of number, over
2000 collaborative outputs were produced in 2014 which represents a marked rise in scale
though a slight decline as a percentage of the total.
UK and Indian universities enjoy a strong relationship. For the UK to be competitively placed
in future, continued enhancement of the research relationship, increased student recruitment
and positive regulatory change will be necessary.
1 FWCI is a post-publication impact measure. It is normalised to allow for comparison. The global
average FWCI is 1.0, scores of 1.5 and above are generally considered well above average.

6
POLICY CONTEXT
CONTEMPORARY INDIAN HIGHER EDUCATION POLICY
The eighteen months since Prime Minister Modi’s official swearing into office in May 2014
have seen the announcement of new higher education initiatives. A brief review of some is
set out below.
For context, an overview of the Indian Higher Education sector is included at Annex A1.
NEW EDUCATION POLICY
The overarching policy architecture for education in India, including higher education, is set
out in the National Education Policy. First implemented in 1968, a successor was then
implemented in 1986, and then modified in 1992.2 This remains the latest version of the
policy to be implemented.
The 1992 version of the bill included ambitions to:
Increase the capacity of higher education from the 150 universities and 500 colleges
Encourage greater autonomy on a selective basis
Develop increased coordination between the University Grants Commission and
sector councils
Improve the technological capacity
Enhance support for research in STEM subjects and the social sciences
The New Education Policy will be comprehensive and as such the consultation covers all
levels of education and includes a number of themes. The consultation is composed of a
number of relatively open questions rather than a draft policy for review with defined
questions upon best approach and feasibility of implementation as one may typically find in
the UK for example. A list of themes for consultation on higher education is included below:
1. Governance reforms for quality
2. Ranking of institutions and accreditations
3. Improving the quality of regulation
4. Pace setting roles of central institutions
5. Improving State public universities
6. Integrating skill development in higher education
7. Promoting open and distance learning and online courses
8. Opportunities for technology enabled learning
9. Addressing regional disparity
10. Bridging gender and social gaps
11. Linking higher education to society
12. Developing the best teachers
13. Sustaining student support systems
2 http://mhrd.gov.in/sites/upload_files/mhrd/files/document-reports/NPE86-mod92.pdf

7
14. Promote cultural integration through language
15. Meaningful partnership with the private sector
16. Financing higher education
17. Internationalization of higher education
18. Engagement with industry to link education to employability
19. Promoting research and innovation
20. New knowledge
Of particular relevance to the UK is theme 17, Internationalization of higher education. Within
this section of the consultation questions focus upon strategies for cross border higher
education, methods to encourage foreign education providers, the role of domestic
infrastructure in attracting international students, identifying universities to act as leaders in
internationalisation, and the role of the GIAN initiative in supporting broader
internationalisation of the sector.
The consultation process for the New Education Policy was set out in March 2015.3 The
process sets out a ‘grass roots’ first approach which was manifest in an open informal
consultation through the citizen engagement platform, MyGov.in. Subsequent stages of the
consultation have increasingly brought in district and national level stakeholders including,
EDUCATE IN INDIA
‘Educate in India’ is a high-profile scheme still in its nascence. It promises to enable
international institutions to operate within India and can be seen as a successor to the the
Foreign Educational Institutions Bill, generally known as the Foreign Provider’s Bill. The
Foreign Educational Institutions Bill was first introduced to parliament in 2007 where it then
lapsed. A successor Foreign Educational Institutions Bill was then introduced into parliament
in 2010, but this too lapsed.
In brief the 2010 bill4 would have provided the policy framework to:
to regulate entry and operation of foreign educational institutions imparting or intending to
impart higher education (including technical education and medical education and award of
degree, diploma and equivalent qualifications by such institutions) and for matters connected
therewith or incidental thereto.
Articles within the bill covered the regulatory and financial operating environment for foreign
providers as well as detail upon the admission and selection of students, salaries and
minimum standards for employers. This would have created the permission and guidance for
international education providers, such as UK universities, to operate within India
independently.
In May 2015 Prime Minister Modi announced a new policy initiative known as ‘Educate in
India’. Details have not been made public but it is suggested that ‘Educate in India’ will focus
3 http://mhrd.gov.in/sites/upload_files/mhrd/files/upload_document/NEP_MHRD_21-03-2015.pdf
4 Full text available here: http://www.aiuweb.org/notifications/Foreign%20Education%20Providers%20Bill.pdf

8
on improving the quality and capacity of Indian higher education and enable foreign
providers to operate in India.
A high-level meeting was held to discuss the proposal in May. In September 2015, Niti
Aayog,5 the central Government policy planning institute / think tank setup to replace the
Planning Commission, was tasked to prepare a framework to enable the implementation of
the ‘Educate in India’ programme through the development of the relevant regulatory
architecture. This activity is ongoing with further information expected in late 2015 / early
2016.
GIAN
The Global Initiative for Academic Networks (GIAN) Scheme was initially proposed during a
‘Retreat’ of Indian Institutes of Technology (IITs) in June 2014 with Human Resource
Development Minister Smriti Irani.
GIAN is an Indian Government funded scheme to bring international staff of repute to teach
in Indian institutions.
A worked-up proposal for the scheme, setting out its aims, process and criteria, was shared
with the UK sector in February 2015. Key features of the proposal included:
30 lectures of 1 hour each to take place within 10 working days during the Winter or
Summer breaks
A minimum of 50 participants per course
Delivery of additional lectures to other colleges and audiences
The UK HE International Unit conducted a consultation of the sector via the Asia Community
of Practice. The key messages of the consultation were that the scheme, though a welcome
initiative set out restrictive requirements for the participating foreign academics in terms of
contact hours, and should allow for greater flexibility in terms of level of participation as well
as times at which the mobility could take place. Additionally, greater clarity was sought upon
funding and intellectual property arrangements. This information was shared with the
Ministry of Human Resource Development (MHRD).
Summer 2015 saw the launch of the GIAN Portal,6 operated and administered by lead
institution, IIT Kharagpur. The portal includes details of participating Indian universities,
course areas, and provides a form for foreign academics to submit proposals.
The portal also includes the revised guidelines for participation. Reflecting the feedback of
the UK sector, the operational guidelines set out a reduced requirement in terms of contact
hours (12 – 14, and 20 – 28) and a broader range of participation is invited. Additionally,
there is clarity on funding and ownership of the course materials. The preference remains for
courses to take place during the Indian academic summer and winter breaks, though the list
of approved courses span December 2015 to July 2016, so in this too there is greater
flexibility.
5 http://niti.gov.in/content/
6 http://www.gian.iitkgp.ac.in/

9
The stated ambition for the scheme is for 500 participating academics for 2015/167 from a
range of countries, including the UK. At the time of writing 164 courses have been approved,
14 of these from the UK. There is an ambition to send 100 UK academics to India to
participate in the scheme.
NATIONAL INSTITUTIONAL RANKINGS FRAMEWORK (NIRF)
Indian higher educations have historically performed poorly in international rankings. The
inclusion of Indian Institute of Science Bangalore in the Times Higher World University
Rankings in November 20158 is notable as it is the first time an Indian institute has been
included in the top 100 institutions.
The National Institutional Rankings Framework (NIRF) 9 is a newly developed MHRD
framework that sets out a methodology for ranking the performance of Indian institutions.
Individual framework methodologies are set out for institutions specializing in architecture,
engineering, management and pharmacy, with additional methodologies for further subject
areas expected soon. The results of the first ranking exercise are scheduled to be published
in April 2016.
QUALIFICATIONS RECOGNITION
Mutual qualifications recognition is a long-running theme of discussion between India and
the UK. Further detail is provided below on issues surrounding the recognition of the Indian
Standard XII qualification and UK one year Masters.
INDIAN STANDARD XII QUALIFICATION
The Standard XII qualification is taken by Indian high-school students in their twelfth year of
study. Performance in the exams is one determinant of a students’ eligibility for a particular
university in India or overseas.
The Indian Government expressed concerns over the degree to which the Standard XII was
recognised by UK universities as sufficient for entrance. Consequently, in 2014 the UK India
Education and Research Initiative (UKIERI) Qualifications Recognition Taskforce asked the
UK HE International Unit (IU) to clarify the extent to which UK universities accept the Central
Board of Secondary Education (CBSE) Standard XII qualification for the purposes of direct
admission to undergraduate programmes of study.
To inform this discussion, the IU conducted a survey of UK universities. The survey received
47 individual institution responses, none of which said that their institution did not accept
CBSE Standard XII for at least some subjects. This information was presented to the UKIERI
Board and latterly Smt. Smriti Irani, Minister for Human Resource Development during UK
Ministerial delegation in November 2014, resulting in public recognition by the Indian
Government.
7 https://iitkgp.org/content/iit-kharagpur-lead-mhrd-programme-gian-bring-international-faculty-india
8 https://www.timeshighereducation.com/news/world-university-rankings-2015-2016-by-subject-engineering-and-technology-
results-announced 9 https://www.nirfindia.org/Home

10
Later desk research of the admissions’ policies of those universities that did not respond to
the survey indicated that 4 only offer postgraduate courses, 23 do not list the information on
their website (this includes all the performing arts universities), and the remaining 69
universities do accept the qualification (at least in some instances). In sum, no university in
the UK that offers undergraduate courses has publicly stated that it will not accept the CBSE
Standard XII at least in some instances.
Where additional requirements for students are specified these typically relate to English
language score and / or particular subject requirements not additional periods of study.
UK ONE YEAR MASTERS
In India two year Masters programmes are the norm. The Association of Indian Universities,
which since 1995, has had the formal power of equivalence “for the purpose of higher
education as well as employment in the country”, does not as a matter of policy, recognised
Master’s programmes of less than two years:
“Master Degree programs which are less than 2 years in duration of foreign universities have
also not been accorded equivalence by AIU. AIU do not issue ECs in such cases.”10
As a consequence, tens of thousands of Indian students that have completed one year
Masters at institutions in the UK will not have their qualification recognised for the purpose of
public sector employment or admission into further postgraduate study at Indian higher
education institutions. These qualifications are typically recognised by private sector
employers, and universities in other countries.
The UK-India Education and Research Initiative began in 2006 with the ambition to enhance
links in education between the United Kingdom and India. An India-UK Qualification
Taskforce was established within the governance of UKIERI in 2011. A proposal of
supplementary bridging courses was put forward but not implemented. The view being that
such courses would impart little added academic value, represent a potential waste of
resource and undermine the notion of equivalence. Consequently, UK one year Masters
programmes are not officially recognised within India. A Government to Government MoU
has been proposed as a possible high-level solution.
10
http://www.aiuweb.org/Evaluation/IB%202009.pdf

11
KEY BILATERAL INITIATIVES
NEWTON BHABHA FUND
India is the second biggest recipient of Newton Fund funding, originally receiving £10 million
per year from the UK Government (of the Fund’s total annual amount of £75 million). The
Newton Bhabha Fund focuses upon three broad categories of activity:11
people: improving science and innovation expertise (known as ‘capacity building’),
student and researcher fellowships, mobility schemes, and joint centres
research: research collaborations on development topics
translation: innovation partnerships and challenge funds to develop innovative
solutions on development topics.
Within India,12 the fund has a set of thematic areas reflecting the Government of India’s
priority research areas:
Societal Challenge Areas:
Sustainable Cities and Rapid Urbanisation
Public Health and Well being
Energy Water Food Nexus
Cross-cutting Capabilities:
High Value Manufacturing
Big Data
Achievement s during the first year of the Newton Bhabha Fund are listed below by area
of activity:
People: PhD exchanges; fellowships for post-doctoral researchers in the areas of
physical sciences, natural sciences and clinical sciences; entrepreneurship training
and linking higher education institutions through the Innovation Leadership
Programme to create a cadre of entrepreneurial Indian researchers who are linked
to UK and international peer and mentorship networks.
Research: joint collaborations addressing important challenges around
antimicrobial resistance (AMR), care for the elderly, mental well-being, the effects
of atmospheric pollutants on human health, wheat yield, renewable energy, cultural
heritage and rapid urbanisation, and maternal and child health.
Translation: two successful calls in UK-India joint industrial R&D projects.
11
https://www.gov.uk/government/publications/newton-fund-building-science-and-innovation-capacity-in-developing-countries/newton-fund-building-science-and-innovation-capacity-in-developing-countries 12
https://www.britishcouncil.in/newton

12
UK INDIA EDUCATION & RESEARCH INITIATIVE (UKIERI)
UKIERI is a bilateral initiative designed to encourage greater collaboration between India
and the UK in primary, secondary and tertiary education. It began in 2006 with Phase I which
ran until 2011. Phase II, which ran from 2011 to 2016 focused upon the themes leadership,
innovation, skills development and mobility. Phase III will run from 2016 to 2021 and focus
upon the following themes: leadership and faculty development, integration of skills in
education system, e-Partnership and Research Incubation and enhancing mobility.
In higher education, UKIERI’s achievements include:13
103 Research Partnerships involving 206 institutions in India and UK
17 PhD Scholarships given to Indian students with excellent academic background to
carry out research in various UK universities
35 Research Fellowships awarded to facilitate working attachments by relatively
experienced research staff
393 opportunities British undergraduate students to visit India under the Study India
Programme
208 higher education partnerships involving over 400 institutions to undertake joint
research, curriculum development and programme delivery
13
http://www.ukieri.org/

13
DATA ANALYSIS
UK AND INDIA – SUMMARY STATISTICS
EXTANT SOURCES
From 2010-11 to 2013-14 Indian student enrolment at UK universities has fallen from
39,090 to 19,750
o Approximately 75% of this fall has been in business & administrative studies,
computer science and engineering technology
According to 2014 data, 86% of Indian students would recommend their experience
to others and 92% expressed satisfaction with their UK student experience overall
In 2013-14, 79% of Indian students in the UK received ‘no award or financial backing’
275 UK students had a period of mobility in India in 2013-14. The majority of these
were studying medicine and dentistry courses
2040 staff with Indian nationality were employed by UK Higher Education Institutions
on an academic contract in 2013-14
The field-weighted citation impact for collaborations between the UK and India was
2.23 between 2008 and 2012, compared to1.99 for UK-International collaborations
on average and 1.31 for India-International collaborations on average
In 2014 2,292 documents were produced in collaboration between UK and Indian
academics
504 Research Excellence Framework case studies were submitted for research with
an impact in India
SURVEY DATA
101 institutions hosting over 75% of Indian students in the UK provided information upon
their engagement, ambitions and concerns for India:
80% of respondent universities have an India engagement strategy
o Student recruitment and partnership developments are central elements of
these strategies
There is an equal split between those institutions with an office in India and those
without
48% of respondent higher education institutions stated that national scholarships and
bursaries are the most efficient means of support for student recruitment in India
79% of respondent institutions view the lack of post-study work opportunities for
Indian students as the most important challenge to engagement with India
On average respondent universities spend nearly £100,000 per annum on university
scholarships and bursaries for Indian students

14
EXTANT DATA ANALYSIS
Included below is an analysis of a range of extant data upon UK higher education
engagement with India based upon available quantitative data sources such as the Higher
Education Statistics Agency and Elsevier Scopus.
INDIAN STUDENT ENROLMENT AT UK INSTITUTIONS
TOTAL NUMBER OF STUDENTS
The total number of Indian students enrolled in UK higher education increased by 51%
between 2007–08 and 2010–11. However, enrolments then decreased by 49% between
2010–11 and 2013–14, from 39,090 to 19,750. Within these totals, the number of students
starting a course has decreased by 53%, after increasing by 48% between 2007–08 and
2010–11.
Figure 1- Indian students enrolled in UK higher education, 2007–2014
Comparing recent trends in Indian student recruitment in the UK to that of its leading
competitors, during the period 2007 to 2010, enrolments in Australia fell by 46% before more
recently returning to growth, with a rise in the number of student visa applications from
Indian students to study in Australia of 209% in September 2013.
STUDENTS BY INSTITUTION
The University of Bedfordshire enrolled the highest number – 6% of all Indian students in
2013–14. The University of West London enrolled the second-highest number of Indian
students, followed by the University of Manchester.

15
INDIAN STUDENTS ENROLLED IN 2013–14 BY CAMPUS LOCATION
Indian students are enrolled across the UK. Figure 2 shows the geographic distribution of
Indian students in 2013–14, with a higher concentration enrolled across London and the
surrounding regions, but also within cities in northern England, Wales, Scotland and
Northern Ireland.
Figure 2 - Geographic distribution of Indian students, 2013–14
STUDENTS BY LEVEL OF STUDY
Consistently, more than half the Indian students enrolled each year since 2007–08 have
been studying for postgraduate taught (PGT) qualifications, predominantly Masters,
including MBAs.
However, this is also the level of study which has seen the largest numerical shifts.
Enrolments increased by 61% between 2007–08 and 2009–10, before decreasing by 62%
between 2009–10 and 2013–14.

16
Figure 3 - Indian students enrolled by level of study, 2007–2014

17
Figure 4 sets out the trends in new entrants from the top 10 non-EU source countries, with
exposition upon the number of new entrants from India relative to China.
Figure 4 - Trends in new entrants from the top 10 non-EU source countries
LOOKING AT OTHER LEVELS OF STUDY
The number of undergraduate students studying for a first degree peaked in 2010–11,
although the total was 35% higher at the end of this period than at the beginning.
The number of students enrolled onto ‘other undergraduate’ courses, e.g. for foundation
degrees or institutional credits, has fallen over the period from 1,335 students in 2007–08 to
835 students in 2013–14
The number of postgraduate research students, almost all of whom were studying for a
doctorate degree in 2013–14, has remained broadly flat.

18
STUDENTS BY SUBJECT AND LEVEL
Around 40% of Indian students were enrolled onto courses in business and administration in
2013–14. The next three most popular subject areas were engineering (15.2%); computer
sciences (8.7%) and subjects allied to medicine (6.9%).
At postgraduate research level, the most popular subject area was engineering (305
students), followed by biological sciences (195 students).
In total, 43.8% of Indian students were enrolled in STEM subjects. A breakdown of Indian
students by subject area and level of study from 2013 to 14 is available in Annex A2.
INDIAN STUDENTS BY SUBJECT AREA, 2007 TO 2014
In each year since 2007, the most popular subject for Indian students has been business
and administrative studies. This has been followed by engineering and technology, and
computer science.
Figure 5 - Indian student enrolments by subject type
Enrolment trends within the three most popular subject areas are detailed below. Student
numbers within each have fallen over the period.

19
Figure 6 - Indian student enrolment in computer science, engineering & technology, and business & administrative studies, 2007–2014
Trends within the next most popular subjects are detailed in the next two figures.
Figure 7 - Indian student enrolment in law, biological science, creative arts & design, social studies & subjects allied to medicine, 20 07–
2014

20
Figure 8 - Indian student enrolment in agriculture & related subjects, veterinary science, historical & philosophical studies,
mathematical sciences, languages, mass communications & documentation, education, physical sciences, medicine & dentistry, 2007–
2014
The decline in demand from Indian students for traditional STEM areas of study has had an
impact upon the overall demand for STEM subjects.
TRANSNATIONAL EDUCATION ENROLMENT
India is ranked 16th in terms of UK transnational education (TNE) activity, with 12,750
students studying for a UK higher education qualification in 2013–14. Around one in four
students were studying for an award with Oxford Brookes University (26.5%), the majority of
whom were registered with an overseas partner on Association of Chartered Certified
Accountants (ACCA) programmes14,.
There were 2,055 students recorded for distance/flexible learning, 41% of whom were
registered at the University of London, with a further 21% registered at Coventry University.
INDIAN TNE STUDENTS BY LEVEL OF STUDY, 2013–14
Around three quarters (73.4%) of TNE students in India are studying for first degree-level
qualifications. A further 23.8% are studying for a PGT-level qualification.
Further analysis of UK-India engagement in transnational education is available in
December 2015 report, Transnational Education: A Guide for Creating Partnerships in India.
14
Oxford Brookes University has an arrangement with ACCA (the Association of Chartered Certified Accountants) whereby all
students who register on the ACCA programme are also registered with Oxford Brookes. These students are returned in the HESA AOR for all the years that they are enrolled, although are only active with Oxford Brookes for a short per iod of that
programme. They are therefore often excluded from analysis of total numbers of TNE students.

21
STUDENT SATISFACTION
INTERNATIONAL STUDENT BAROMETER SURVEY DATA – OVERALL
MEASURES OF INDIAN STUDENTS’ UK INTERNAT IONAL STUDENT
EXPERIENCE BY LEVEL OF STUDY, 2008 TO 2014
Data on student satisfaction from 2014 shows that, overall, 86% of students from India would
recommend their UK experience to others, and 92% expressed satisfaction with their UK
student experience overall.
Table 1- Indian student satisfaction indicators, 2014
2014
Respondents: 2733 300 1655 755 1013 1478
Overall Indicators UK PGR PGT UG Female Male
Recommendation 86% 87% 86% 88% 90% 84%
Overall satisfaction 92% 93% 91% 94% 94% 91%
Arrival overall 91% 97% 90% 91% 93% 89%
Learning overall 90% 91% 89% 90% 92% 88%
Living overall 89% 88% 89% 88% 89% 88%
Support overall 91% 90% 91% 90% 94% 89%
Comparing responses to the 2014 survey with 2008, this recommendation rate is up by 4.6
percentage points, and overall satisfaction is up by 3.1 percentage points.
Table 2 - Indian student satisfaction indicators, 2014 versus 2008
2014 v 2008
Combined total
respondents: 6772 594 4407 1480 2093 4422
Overall indicators UK PGR PGT UG Female Male
Recommendation 4.6% 0.6% 5.1% 3.9% 5.6% 3.2%
Overall satisfaction 3.1% -1.9% 3.0% 2.7% 3.4% 2.7%
Arrival overall 3.3% 5.1% 3.2% 3.2% 4.3% 1.7%
Learning overall 1.8% -1.8% 1.6% 3.2% 3.2% 1.1%
Living overall -1.7% -4.7% -0.6% -3.9% -1.1% -2.1%
Support overall -0.3% -1.7% 0.0% -0.3% 2.1% -2.1%

22
Comparing responses to the 2014 survey with 2012, the recommendation rate is up by 2.7
percentage points, and overall satisfaction is up by 2.2 percentage points.
Table 3 - Indian student satisfaction indicators, 2014 versus 2012
2014 v 2012
Combined total
respondents: 6003 362 2037 789 1201 2061
Overall indicators UK PGR PGT UG Female Male
Recommendation 2.7% 3.0% 2.8% 2.3% 4.7% 1.2%
Overall satisfaction 2.2% 2.9% 0.9% 5.1% 3.4% 1.4%
Arrival overall 0.7% 9.4% 0.3% 0.9% 1.5% -0.5%
Learning overall 0.1% -1.3% 0.0% 1.1% 2.6% -1.1%
Living overall -1.3% -1.1% -1.6% -0.6% -0.9% -1.7%
Support overall -1.9% -0.1% -1.6% -3.3% 0.5% -3.8%
In 2014, 95% expressed satisfaction in terms of safety, and 95% were satisfied with the
campus environment.
Table 4 - Indian student satisfaction indicators (living), 2014
2014
Living – Satisfaction UK PGR PGT UG Female Male
Accommodation quality 89% 91% 88% 89% 90% 88%
Accommodation cost 64% 70% 63% 65% 68% 62%
Eco-friendly attitude 95% 93% 95% 96% 96% 95%
Earning money 58% 65% 55% 60% 54% 59%
Financial support 57% 65% 58% 51% 53% 59%
Good contacts 80% 84% 80% 78% 80% 80%
Good place to be 94% 94% 94% 93% 95% 94%
Host culture 85% 89% 84% 86% 87% 84%
Host friends 77% 84% 74% 80% 78% 76%
Internet access 87% 91% 87% 85% 87% 87%
Living cost 67% 73% 67% 64% 68% 67%
Other friends 91% 92% 91% 91% 91% 91%

23
Campus buildings 94% 93% 95% 93% 95% 94%
Campus environment 95% 94% 95% 95% 96% 94%
Social activities 85% 87% 84% 86% 88% 82%
Safety 95% 97% 94% 95% 96% 94%
FUNDING SOURCES
In 2013–14, around 4 in 5 Indian students (79%) received no award or financial backing to
support to support their tuition fee costs. Around 1 in 12 (8%) were in receipt of a scholarship
or a fee waiver from their university.
A complete breakdown of the major sources of tuition fees for Indian students in 2013–14 is
available at Annex A3.

24
OUTWARD MOBILITY TO INDIA
In 2013–14, 275 students studying at UK higher education institutions were reported as
having had a period of mobility in India. Of the total, University College London sent the most
students (30), followed by the University of Liverpool (20) and the School of Oriental and
African Studies (20).
Figure 9 - Instances of student mobility to India by provider, 2013–14
Around 45% of students who had a period of mobility in India were studying medicine and
dentistry courses (100 studying clinical medicine, and 20 studying pre-clinical medicine).
Table 5 - Students with a period of mobility in India, by subject area, 2013–14

25
INDIAN STAFF EMPLOYMENT AT UK UNIVERSITIES
There were 2,040 staff with Indian nationality employed on an academic contract by UK
higher education institutions in 2013–14. Half of these staff were employed on a research-
only contract. Around one third (35%) were employed to both teach and carry out research.
Figure 10 - Indian nationals employed as academic staff, by function, 2013–14
Across the UK sector, there were 22,140 non-EU nationals employed as academic staff in
2013–14. Indian nationals therefore accounted for 9% of this total. Taking into account UK
and EU nationals as well, there were 194,245 academic staff employed across the UK in
2013–14, of which Indian nationals represent around 1%.
In 2013–14, the highest number of academic staff who were Indian nationals were working in
clinical medicine (345 people), followed by biosciences (220 people).
Full details of Indian nationals employed as academic staff by cost centre is included in
Annex A4.
RESEARCH COLLABORATION
RESEARCH COLLABORATIONS AND FIELD-WEIGHTED CITATION IMPACT
(FWCI)
India was the UK’s 23rd most important collaborator in research between 2008 and 2012,
during which period there were 6,478 collaborative publications between the two countries.
The field-weighted citation impact (FWCI) of UK-India collaboration was 2.23 during this
period.
This is lower than the FWCI for collaborations between the UK and the United States (2.75),
Australia (2.73) and Canada (3.25), but higher than Pakistan (2.04), China (2.00) and Saudi
Arabia (1.73).
Comparing the FWCI of UK-India collaborations in this period with those of India and UK
competitor nations, UK-India collaborations at 2.23 scored higher that India-France (2.18),
India-Germany (2.01), India-Japan (1.94), India-South Korea (1.90) and India-US (1.69).
However, UK-India collaborations scored lower than India-Australia (2.36), India-Canada
(2.51) and India-China (3.07)

26
INDIA DATA FROM ELSEVIER SCOPUS
In 2004, the UK collaborated on 702 out of 34,724 documents (2.0%). In 2004, the
UK was the third largest collaborator behind USA and Germany.
In 2009, the UK collaborated on 1,280 out of 67,039 documents produced by India
(1.9%).
India produced 124,306 academic documents in 2014. 2,292 (1.8%) of these were
produced in collaboration with the UK. In 2014, the UK was India’s second largest
collaborator (behind USA) in terms of scale.
So, ostensibly it appears that the proportion of Indian research output produced in
collaboration between the UK and India has declined slowly over 10 years (2.0% to 1.8%),
but the UK has risen from third- to second- most important collaborating partner in terms of
scale. Also:
Research output increased by 258% in India between 2004 and 2014.
Documents produced in collaboration with the UK have increased by 226% in the
same period.
By comparison, documents produced in collaboration with the USA have increased
by 169% in the same period and documents produced in collaboration with Germany
increased by 128%.
In addition to the UK moving up (from 3rd to 2nd) in the list of top 10 collaborating
countries, Korea (7th to 4th), Australia (9th to 6th) and China (10th to 8th) have gained
places over the last 10 years (with Canada, Germany, Japan and Italy losing places).
Figure 11 - Research output from India, 1955 - 2015

27
Figure 12 - International collaborations with India by country, 2014
Figure 13 - Research publications from UK: Countries of co-authorship, 1994–2014

28
Figure 14 - Subject area of UK research publications with international co-authors (all countries) 1994–2014
Of the 20,000 jointly co-authored UK-India research publications (1994–2014), many
involved other international partners.
Figure 15 - UK-India collaboration third country partners, 1994–2014

29
RESEARCH EXCELLENCE FRAMEWORK (REF) CASE STUDIES
In total, 504 REF case studies were submitted detailing research which has had an impact in
India. Of these 473 are available for analysis (the remainder being likely to include sensitive
information not suitable for public distribution). The available case studies can be
disaggregated into the following units of assessment:
Main Panel A 109
Main Panel B 119
Main Panel C 120
Main Panel D 125
Within these totals, the most common unit of assessment was English language and
literature (36 case studies), followed by clinical medicine (32 case studies).
Table 6 - Research Excellence Framework case studies with an impact in India by unit of assessment
Main panel and unit of assessment Number of case studies
A 109
Agriculture, veterinary and food science 8
Allied health professions, dentistry, nursing and pharmacy 18
Biological sciences 21
Clinical medicine 32
Psychology, psychiatry and neuroscience 14
Public health, health services and primary care 16
B 119
Aeronautical, mechanical, chemical and manufacturing engineering 8
Chemistry 12
Civil and construction engineering 4
Computer science and informatics 22
Earth systems and environmental sciences 9 Electrical and electronic engineering, metallurgy and materials 14
General engineering 18
Mathematical sciences 17
Physics 15
C 120
Anthropology and development studies 9
Architecture, built environment and planning 7
Business and management studies 27
Economics and econometrics 1
Education 19
Geography, environmental studies and archaeology 13
Law 11
Politics and international studies 13
Social work and social policy 6

30
Sociology 8
Sport and exercise sciences, leisure and tourism 6
D 125
Area studies 8
Art and design: history, practice and theory 16
Classics 1 Communication, cultural and media studies, library and information management 7
English language and literature 36
History 20
Modern languages and linguistics 8
Music, drama, dance and performing arts 13
Philosophy 3
Theology and religious studies 13
Grand Total 473

31
SURVEY DATA ANALYSIS
To better understand the engagement of the UK sector with India, a survey was
commissioned in October 2015. The survey received responses from 101 higher education
institutions across the UK. Collectively these institutions host at least 75% of all Indian
students studying in the UK. Survey questions were not compulsory for reporting; as such,
the survey base varied (i.e. the number of respondents varied from question to question).
For clarity, the number of respondents is specified for each analytical section of this survey.
INSTITUTIONAL STRATEGIES & GEOGRAPHIC ENGAGEMENT WITH INDIA
80% (78 HEIs) of the higher education institutions (n=98) stated they have a strategy in
place focused upon India.
Figure 16 - Components of India strategy rated as very important and important
Student recruitment plays an important role as part of the strategy. It was ranked as very
important by a majority of HEIs (67 out of 79 HEIs or 85%). This element of the strategy is
further supported by alumni relations for the purpose of recruiting students from India, rated
as very important by 32 HEIs. Partnership development (49 HEIs) and research
collaborations (33 HEIs) also scored highly with regard to their importance.
Figure 17 shows there is almost an equal split between the number of surveyed HEIs with
and without a physical presence in India (36 and 37 HEIs respectively) with a further 8 HEIs
using a third party agency in India.
0 10 20 30 40 50 60 70 80
Staff exchange
Supporting capacity
Engagement with Indian community/businesses in UK
Outward student mobility
Transnational education
Collaborations with businesses in India
Alumni business
Alumni student
Research collaboration
Partnership development
Student recruitment
No. of HEIs

32
Figure 17 - UK institutions' offices within India
Five HEIs stated their intentions to open offices soon. There are six HEIs, from among the
36 HEIs with established offices in India, which are considering an expansion of their
presence in India.
Our analysis of the free text information provided by HEIs in the “Other” category shows that
three HEIs have recently closed their operations in India due to declining student numbers;
another three HEIs are exploring the opportunities in India with view to opening an office;
and two HEIs have members of staff based in India.
With regards to the distribution of UK HEIs’ offices across India: 41 HEIs have 53 offices in
India, with the majority of these (31 offices) being based in Delhi, followed by Mumbai (8
offices) and smaller numbers in Bangalore and Chennai (three offices in each location).
Hyderabad and Kolkata are home to two offices each.
Figure 18 lists the key responsibilities of the respective offices in India. Student recruitment
and partnership activities were selected as the most significant among these.
No, but planning to open office(s), 5, 5%
Third party agency , 8, 8%
Other, 13, 13%
Yes, 36, 36%
No, 37, 38%
(n = 99)

33
Figure 18 - Key responsibilities of UK university offices in India
To gain a better understanding of other countries’ recruitment patterns at city level and their
relation (or otherwise) to office location, we looked into the most popular metropolitan areas
for Indian students studying in the United States of America. The US hosts the largest
number of Indian students at higher education level (132,888 students in the 2014/15
academic year15).
Table 7 summarises data collected from the Brookings Institute in the US which shows cities
of origin for international students in the US, based on the visa information they provided
when applying for F-1 visas. The data presented in Table 1 is based on granted visas only
over the period 2008–2012. The table shows the top Indian cities of origin for students
studying in the US are Hyderabad, Mumbai and Chennai, and their ranking order is
generated in relation to other cities of origin across the world, the largest ones being Seoul,
Beijing and Shanghai.
While students opting for the US may be different to those choosing the UK, the most
popular city of origin for Indian students studying in the US is Hyderabad, which also hosts
two offices for UK HEIs.
15
See IIE Open Doors data at: http://www.iie.org/Research-and-Publications/Open-Doors/Data/International-Students/All-
Places-of-Origin/2013-15
0 10 20 30 40
Student recruitment
Partnership and other engagement
Alumni relations
Transnational education
Business engagement
Other
Number of selections (more than 1 option was selected)
(n=41)

34
Table 7- City of origin of Indian students studying in the United States16
RANK CITY NUMBER OF STUDENTS SHARE
CITY SIZE
CITY INCOME TYPE
4 Hyderabad, India
26,220 2.30% Large Very Low Income
6 Mumbai, India 17,294 1.50% Megacity Low Income
12 Chennai, India 9,141 0.80% Large Very Low Income
14 Bangalore, India 8,835 0.80% Large Low Income
15 Delhi, India 8,728 0.80% Megacity Low Income
INTERNATIONAL STUDENT RECRUITMENT IN INDIA
The section of the survey detailed below studies in greater detail HEIs’ international student
recruitment practices in India. It aims to identify key recruitment channels that have been
most successful in the recruitment of Indian students over the past three years, which saw
student numbers plunge to half of their 2009 levels. Equally, an attempt is made to establish
which recruitment channels across the UK sector have experienced declines.
Figure 19 summarises HEIs’ methods of international student recruitment in India. The
following recruitment practices were rated as the most important in India:
education agents (54 HEIs)
scholarships and tuition fee discounts (45 HEIs)
education fairs in India (42 HEIs)
office(s) in India (32 HEIs)
working with schools in India (26 HEIs)
16
http://www.brookings.edu/research/interactives/2014/geography-of-foreign-students#/M10420

35
Figure 19 - Student recruitment activities rated by importance
HEIs were then asked whether the recruitment practices used in India resulted in an
increase, decrease or no change in the number of Indian enrolments over the past three
years. While the majority of HEIs were using education agents and fairs (more than 80 HEIs
reported to have used each of these channels), agents and fairs were also the recruitment
channels where almost half the HEIs experienced declines (48%, 46 HEIs in each category;
see the red bars in Figure 20 for further details).
The channel which experienced the most growth in student recruitment was the use of local
schools in India. 25 HEIs reported this channel to have contributed to an increase in their
student numbers; another 25 HEIs did not note any significant change in recruitment, and 13
HEIs experienced declines.
While 19 HEIs reported increase in recruitment through education agents, a significantly
higher proportion of HEIs (46 HEIs using) reported declines and 15 did not note any
difference.
There was almost an equal split among those with physical presence in India: 18 HEIs
reported increases in their student numbers through their offices in India and 14 experienced
declines. Most of the declines in student numbers appear to have been concentrated in
offices located in Delhi, where eight HEIs reported decreased student numbers and 13 HEIs
reported increases in recruited students over the past three years. Most of the HEIs active in
Mumbai reported increases in their student recruitment.
Partnership arrangements with local HEIs were another area with an equal split in growth
and decline in numbers of students coming to the UK (15 HEIs in each category). Increases
0 10 20 30 40 50 60 70 80
Education agents in India
Scholarships & tuition fee discounts
Education fairs in India
Office in India
Using local schools
Articulation or progression arrangements
Other forms of recognition of prior learning
Transnational education (PG)
Transnational education (UG)
A for-profit pathway provider in the UK
Student exchange
No. of responding HEIs Very Important Important

36
in student recruitment through the for-profit pathway sector in the UK were only reported by
five HEIs.
Figure 20 - Changes in the level of student recruitment by method
This following section of the survey explores in greater detail the contribution of transnational
education (TNE) delivered in India and its contribution to student recruitment. Unlike direct
recruitment to the UK, which is heavily focused on postgraduate taught programmes, 74% of
the TNE in India is delivery of first degree programmes (analysis of the Higher Education
Statistics Agency (HESA) aggregate offshore record). The HESA aggregate offshore record
(AOR) suggests there are 53 HEIs engaged in TNE in India; however, 15 HEIs account for
92% of the programmes delivered offshore.
This survey found that from all the survey participants, 32 HEIs were involved in TNE in
India. We tried to establish which of the TNE programmes in India led to students
transferring into the UK as part of their programme. Figure 21 below summarises the survey
findings on types of TNE programmes contributing to undergraduate and postgraduate
student recruitment in the UK.
HEIs reported nine joint venture programmes with local providers in India, of which seven
programmes contributed to undergraduate and three programmes led to postgraduate
recruitment.
0 10 20 30 40 50 60 70 80 90 100
Using a for-profit pathway provider
Recognition of prior learning
Using TNE delivered by my institution
Education fairs in India
Partnership arrangements with local providers
Office in India
Education agents in India
Using local schools
No. of responding HEIs
Which of the following have seen an increase, decrease, or no change with regard to bringing students to your institution over the past 3 years
Increase Decrease No change Not Applicable

37
Joint and double degrees are another TNE contributor to onshore recruitment of Indian
students: HEIs reported six joint/double degree programmes, of which three programmes led
to undergraduate recruitment and five programmes contributed to postgraduate recruitment.
There were four validation agreements, all of which led to undergraduate enrolment of
students and half of which resulted in postgraduate enrolments of Indian students in the UK.
Figure 21 - TNE programmes contributing to student recruitment from India
A study published by the Higher Education Funding Council of England (HEFCE) on
transnational pathways to higher education in England established that 16% (325 students)
of the Indian entrants to first degree programmes commenced their course offshore.17 This is
a decline compared to an earlier HEFCE report in 2014, which showed that 20% of the
Indian entrants (390 students) commenced their study in England through an offshore
programme.18
HEIs were also invited to comment on how they see the future of TNE with India, to which 91
HEIs responded. The majority of the HEIs predicted the importance of TNE in India would
grow (63 HEIs) and only one HEI thought the importance of TNE would diminish. 21 HEIs
17
HEFCE (2015, p.6), Transnational pathways to higher education in England, http://www.hefce.ac.uk/pubs/year/2015/201508/
18 HEFCE (2014, p.14), Directions of travel: Transnational pathways into English higher education,
http://www.hefce.ac.uk/pubs/year/2014/201429/
0
1
2
3
4
5
6
7
8
9
10
TNE programmes contributing to student recruitment
TNE programmes contributing to UG recruitment
TNE programmes contributing to PG recruitment

38
thought it would not change significantly. About three HEIs commented that the future of
TNE depends on the outcome of the Foreign Providers’ Bill (and its successor) in the
country. A very small number HEIs commented that they may be forced to increase their
provision of TNE if there is no change in the current student visa regime.
HEIs were asked to comment on what is the most efficient use of funds to support
international student recruitment in India. Almost half of them (48%, 46 HEIs) stated that
national scholarships and bursaries are perceived to be the most efficient means of support
for student recruitment in India, followed by support for university-level partnerships and
promotion of the UK as a study destination in India (17 HEIs in each of the categories). The
majority of free text responses in the “Other” category (13 HEIs out of 16) wrote that a more
friendly immigration regime and reinstating the post-study work visa would be the most
efficient way to recruit students in India.
Figure 22 - The most efficient use of funds to support student recruitment in India
RESEARCH COLLABORATIONS: ENABLERS AND CHALLENGES
The majority of research engagement in India is at an institutional level, with 55 HEIs stating
they had initiated the partnerships with Indian institutions. Development of research-led
partnerships through UKIERI and the Newton Bhabha Fund was found to be common, with
49 and 37 HEIs highlighting that their institutions had participated in these programmes (see
Figure 23).
While links with business and bilateral Research Council initiatives were not as high (27
HEIs and 21 HEIs respectively), their importance and usage is likely to increase in the future.
0 10 20 30 40 50
Other (please specify)
Increased promotion in India of the UK as a studydestination
Increased support for university-level partnerships
National scholarships, grants and bursaries for Indianstudents
No. of responding HEIs (n=96)
39
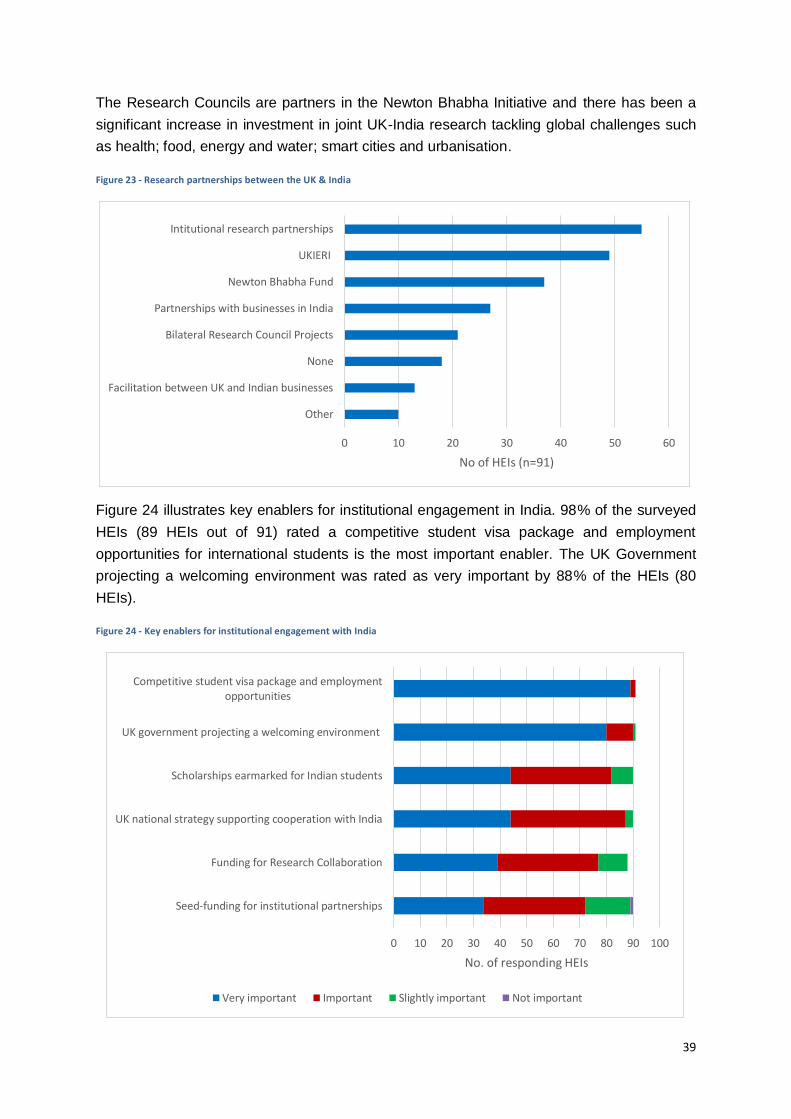
The Research Councils are partners in the Newton Bhabha Initiative and there has been a
significant increase in investment in joint UK-India research tackling global challenges such
as health; food, energy and water; smart cities and urbanisation.
Figure 23 - Research partnerships between the UK & India
Figure 24 illustrates key enablers for institutional engagement in India. 98% of the surveyed
HEIs (89 HEIs out of 91) rated a competitive student visa package and employment
opportunities for international students is the most important enabler. The UK Government
projecting a welcoming environment was rated as very important by 88% of the HEIs (80
HEIs).
Figure 24 - Key enablers for institutional engagement with India
0 10 20 30 40 50 60
Other
Facilitation between UK and Indian businesses
None
Bilateral Research Council Projects
Partnerships with businesses in India
Newton Bhabha Fund
UKIERI
Intitutional research partnerships
No of HEIs (n=91)
0 10 20 30 40 50 60 70 80 90 100
Seed-funding for institutional partnerships
Funding for Research Collaboration
UK national strategy supporting cooperation with India
Scholarships earmarked for Indian students
UK government projecting a welcoming environment
Competitive student visa package and employmentopportunities
No. of responding HEIs
Very important Important Slightly important Not important

40
Figure 10 shows the major challenges UK HEIs are facing when implementing their India
strategy. Lack of post-study work opportunities and the current student visa requirements
were stated as the most important challenges by HEIs (70 and 64 HEIs respectively, out of
89 HEIs answering this questions). Most of the free text comments elaborated on these two
challenges that HEIs are faced with, with the perception that this has also led to loss of
international competitiveness.
Figure 25 - Main challenges to implementation of India strategy
UK HIGHER EDUCATION COMMITMENT TO INDIA
Strong commitment to working with India was demonstrated across all levels of the HEIs ’
management structures. Over the past 12 months, the vice-chancellors of 30 HEIs (30% of
all HEIs that responded) had visited India, and nine of them did so on more than one
occasion. Pro-vice chancellors and members of the senior leadership teams of more than
half the participating HEIs (52 HEIs) visited India over the past year. Senior figures from 23
of these HEIs had more frequent visits to India.
Members of staff with partnership development and student recruitment responsibilities from
83 (out of 100) HEIs made the most frequent trips to India over the past 12 months.
An attempt was made to gain an understanding about the financial resources HEIs are
committing to their work in India. Given the high sensitivity of the requested information, not
all HEIs responded. A few HEIs commented that they had to withdraw from India because of
the current immigration regime and its negative impact on students from India. In addition,
0 10 20 30 40 50 60 70 80 90 100
Competition from other UK HEIs
TNE regulatory environment in India
Lack of coordinated UK Govenrment approach
Competition from other countries' HEIs
Student visa requirements
Lack of post-study work opportunities
No. of HEIs
Very important Important Slightly important Not important

41
the tight timeframe of this work was another reason for a small number of HEIs not being
able to collect the necessary detail in time to respond fully.
The highest costs are centred around student recruitment, with the spending on education
agents and bursaries and tuition fee discounts. This mirrors the findings presented in Figure
25 which show that these are the two most used activities in India by HEIs.
Figure 26 - Average spend by HEIs by type of activity
We have looked for a relationship between HEIs’ financial commitment to India and
performance of the student recruitment channels, as reported by the HEIs which took part in
this survey.
The pattern that emerged from our analysis shows that except for three HEIs, the best-
performing student recruitment channels tend to be concentrated in HEIs with a strong
financial commitment and frequent visits (more than 1 visit over the past 12 months) to India
by the HEI’s vice-chancellor, the senior leadership team and/or members of staff from the
international/partnership development office. Several HEIs with missing financial data,
however, showed a similar pattern, with visits to India being linked to better performance of
the student recruitment channels.
Conversely, some of the HEIs with the largest spend on activities in India which were not
backed by a show of commitment, as measured by trips of senior university leaders and
professional members of staff, experienced declines across most of their student recruitment
channels.
Given the wide range of HEIs’ activities in India, it is difficult to arrive at a model of
successful student recruitment that works for all. However, HEIs that had comparatively
better-performing student recruitment channels appear to have an office presence in India,
work with schools in the country, and their vice-chancellors, members of the senior
leadership team and international office/partnership development professionals regularly visit
the country.
£0.00 £20,000.00 £40,000.00 £60,000.00 £80,000.00 £100,000.00
Supporting outward mobility to India
Other
Promotion and marketing specific to India
Agents
Supporting office in India
University scholarships/bursaries/tuitionreductions

42
SUMMARY
POLICY ENVIRONMENT
The UK-India Education & Research initiative (UKIERI) and the Newton Bhabha Fund
provide a framework and funding opportunities to support collaboration between the UK and
India. The results of these initiatives are already evident in increased academic mobility and
the creation of new research partnerships. The continuance of both UKIERI and the Newton
Bhabha Fund will create further opportunities for academics and institutions to build lasting
partnerships based on shared research interests.
The detail of the proposed Educate in India legislation has not yet been made public, but it is
understood that it may enable foreign education providers to operate in India. If passed, this
could enable greater university engagement.
However, the lack of recognition of UK one year masters in by the India public sector and
state universities remains an obstacle in the bilateral relationship.
INSTITUTIONAL ENGAGEMENT IN INDIA
UK higher education institutions invest considerable time and resource into their relationship
with India. A significant number of universities have dedicated engagement strategies
supported by institutional funds, principally to support the recruitment of Indian students
through the provision of dedicated bursaries and scholarships.
A large number of UK universities also have formal agreements and partnerships with Indian
universities and business. These partnerships cover a broad range of activity including
research, student exchange and the delivery of transnational education.
RESEARCH COLLABORATION
Indian research output increased dramatically between 2004 and 2014. In this period, in
which UKIERI and Newton Bhabha have been launched, the UK moved from third to second
in the list of top collaborating countries, and the number of collaborative documents more
than tripled, though as the number of UK-India collaboratively produced documents fell
slightly as a percentage of the total Indian research output.
The field-weighted citation impact of UK-India collaborative output produced between 2008
and 2012 was much higher than the global average impact and higher than that of
collaborative output produced by India with competitor nations the US, France and Germany.
However, it was lower than that of Indian collaboration with Australia, Canada and China.
STUDENT RECRUITMENT
The recruitment of Indian students by UK universities has fallen dramatically between 2010
and 2014. The majority of this decline has been in the study of Business and STEM
subjects. In the same period recruitment by Australia, Canada and the US has risen.

43
ACKNOWLEDGEMENTS

44
ANNEXES
ANNEX A1 - OVERVIEW OF INDIAN HIGHER EDUCATION
Higher education within India falls within the political remit of the Department of Higher
Education, of the Ministry of Human Resource Development. This department is tasked with
setting vision, mission, objectives and functions. Current objectives include expanding the
institutional base of higher education, improving research facilities and promoting
collaboration with the international community.19 Within the Department of Higher Education,
international collaboration activities are the responsibility of the International Cooperation
Cell.
The higher education sector within India is massive and expanding rapidly, with the number
of universities doubling in the past ten years. There are currently approximately 736
universities in India.20
In India, "University" means a University established or incorporated by or under a Central
Act, a Provincial Act or a State Act and includes any such institution as may, in consultation
with the University concerned, be recognised by the University Grants Commission (UGC) in
accordance with the regulations made in this regard under the UGC Act, 1956
This includes both publicly and privately funded higher education institutions. Institutions are
grouped within a number of categories. For example, the Indian Institutes of Technology
(IITs) fall within the category of Institution of National Importance whereas the Jawaharlal
Nehru University in New Delhi is a Central University. A list of universities by category is
available from the University Grants Commission website.21 An overview of these categories
is provided below, drawn from the Ministry of Human Resource Development website.22
Central University: A university established or incorporated by a Central Act.
State University: A university established or incorporated by a Provincial Act or by a
State Act.
Private University: A university established through a State/Central Act by a
sponsoring body viz. a Society registered under the Societies Registration Act 1860,
or any other corresponding law for the time being in force in a State or a Public Trust
or a Company registered under Section 25 of the Companies Act, 1956.
Deemed-To-Be University: An Institution Deemed to be University, commonly known
as Deemed University, refers to a high-performing institution, which has been so
declared by Central Government under Section 3 of the University Grants
Commission (UGC) Act, 1956.
Institution of National Importance: An Institution established by Act of Parliament and
declared as an Institution of National Importance.
19
http://mhrd.gov.in/overview 20
http://www.ugc.ac.in/oldpdf/alluniversity.pdf 21
http://www.ugc.ac.in/oldpdf/alluniversity.pdf 22
http://mhrd.gov.in/university-and-higher-education

45
Institution Under State Legislature Act: An Institution established or incorporated by a
State Legislature Act.
SECTOR BODIES
A number of sector bodies operate within the Indian Higher Education system. The
information below is drawn from the Ministry of Human Resource Development.23
All India Council for Technical Education (AICTE)24: Established in 1945 as an
advisory body, the AICTE has a role in providing validation of technical institutions
and courses at diploma, undergraduate and postgraduate level. It is also promotes
policies to encourage social inclusion.25
Association of Indian Universities (AIU) 26 : Established as the Inter-University
Board of India in 1925, the AIU is a membership organisation for Indian Universities.
Its membership includes both publicly and privately funded universities. Its
membership includes in excess of 500 universities, including associate member
universities from Nepal, Mauritius and Bhutan. The organisation is primarily funded
by member subscription though it receives some government funding. The
organisation also has a role in the granting of equivalence for international
qualifications.
Council of Architecture (COA) 27: Established in 1972, the COA maintains the
register of qualified architects and has an advisory and oversight capacity.
University Grants Commission (UGC)28: Established by an Act of Parliament in
1956, the UGC is a statutory body responsible for the setting and maintenance of
standards. Additionally, it has a role in the allocation and distribution of grants.
Additionally there exist a number of discipline-specific councils. They have a range of
functions, but are principally tasked with the coordination and promotion of research at a
national level.
Indian Council of Social Science Research (ICSSR)29
Indian Council of Philosophical Research (ICPR)30
Project of History of Indian Science, Philosophy & Culture (PHISPC)31
Indian Council of Historical Research (ICHR)32
National Council of Rural Institutes (NCRI)33
23
http://mhrd.gov.in/university-and-higher-education 24
http://www.aicte-india.org/ 25
http://www.aicte-india.org/ 26
http://www.aiuweb.org/index.asp 27
http://www.coa.gov.in/ 28
http://www.ugc.ac.in/ 29
http://www.icssr.org/ 30
http://www.icpr.in/ 31
www.csc-india.in/phispc.html 32
http://ichr.ac.in/ 33
http://www.ncri.in/

46
ANNEX A2 – INDIAN STUDENTS BY SUBJECT AREA AND LEVEL OF STUDY, 2013–14
Subject group Grand Total
Other undergraduate
First degree
Postgraduate taught
Postgraduate research
# %
Grand Total 19,750 100.0% 835 6,030 11,320 1,565
Business and Administrative studies 7,820 39.6% 120 2,145 5,425 125
Engineering 3,010 15.2% 15 1,255 1,435 305
Computer sciences 1,710 8.7% 5 410 1,205 90
Subjects allied to medicine 1,370 6.9% 210 435 585 140
Social studies 1,045 5.3% 25 465 445 110
Creative Arts and Design 700 3.5% 75 270 330 25
Biological Sciences 685 3.5% 10 210 275 195
Law 550 2.8% 5 210 300 30
Medicine and dentistry 460 2.3%
55 280 130
Architecture, Building and Planning 445 2.3% 0 130 295 25
Technologies 385 1.9% 200 55 100 35
Physical sciences 350 1.8% 5 90 100 160
Mass Communications and Documentation 275 1.4% 5 90 170 10

47
Education 275 1.4% 30 5 205 35
Linguistics, Classics and related subjects 175 0.9% 55 45 40 35
Mathematics 160 0.8% 5 70 50 40
Historical and Philosophical studies 145 0.7% 5 60 35 45
Veterinary Sciences, Agriculture and related subjects
75 0.4%
15 40 20
Combined studies 45 0.2% 35 5 5
European Languages, Literature and related subjects
40 0.2% 30 5 5 0
Non-European Languages, Literature and related subjects
30 0.2% 0 5 5 20

48
ANNEX A3 – MAJOR SOURCE OF TUITION FEES
Major source of tuition fees Number of students
% of total
No award or financial backing No award or financial backing 15,700 79%
Scholarship or fee waiver from the university
Provider waiver of support costs 1,540 8%
Not known / other Not known 100 1%
Other 645 3%
Absent / No fees
Absent for year 5 0%
No fees 575 3%
Other overseas sources
Other overseas - repayable loan 120 1%
Other overseas funding 180 1%
Overseas government 55 0%
Overseas industry or commerce 20 0%
Overseas provider 35 0%
Overseas student award from HM government/British Council
45 0%
UK industry/commerce and students employer
Students employer 220 1%
UK industry/commerce 45 0%
UK central government bodies and local authorities
Department for International Development
5 0%
Departments of Health/NHS/Social Care
140 1%
Fees paid under part-time graduate apprentice study programme
0 0%
ORSAS 10 0%

49
Other HM government departments/public bodies
60 0%
UK LEA mandatory/discretionary awards
Award assessed by English or Welsh LEA and paid in full by LA or by the SLC (includes EU students assessed by SLC)
70 0%
Mix of student and SLC (following assessment by English or Welsh LA, or SLC for EU students studying in England and Wales)
20 0%
Paid in full by DELNI/Northern Ireland Education and Library Boards (via Student Loans Company) (includes EU students in NI)
0 0%
Paid in full by Student Awards Agency for Scotland/Student Loans Company (SAAS/SLC); includes where fee is paid directly to provider
5 0%
Research Councils
Arts and Humanities Research Council (AHRC)
0 0%
Biotechnology and Biological Sciences Research Council (BBSRC)
5 0%
British Academy 0 0%
Economic and Social Research Council (ESRC)
5 0%
Engineering and Physical Sciences Research Council (EPSRC)
40 0%
Medical Research Council (MRC) 5 0%
Natural Environment Research Council (NERC)
0 0%
Research council - not specified 10 0%

50
Charities and international agencies
Cancer Research UK 5 0%
International agency 10 0%
Other Association of Medical Research Charities (AMRC) charity
5 0%
Other charitable foundation 45 0%
Wellcome Trust 5 0%
EU Commission (EC) EU Commission (EC) 5 0%
Grand total 19,750 100%

51
ANNEX A4 - INDIAN NATIONALS EMPLOYED AS ACADEMIC STAFF BY
COST CENTRE, 2013–14