table of - missouri office of equal opportunity 2016 report · minority and women skilled crafts...
TRANSCRIPT


TABLE OF CONTENTS
Interim Director’s Letter to the Governor………………………………..……………………………..…..................................7
Executive Summary………………………………………………………………………………………………………………………….................9-11
Purpose of Annual Report…………………………………………………………………..…………………………………………………………………..12
Mission and Vision Statement ...................................................................................................13
Partnership Engagement and Development………..…………………………………………………………………………………………...14-17
STATE CERTIFICATION SUMMARY………………………………….……………………………………………………………………………..……….19
MBE/WBE Certification Summary .................................................................................20-24
STATE PROCUREMENT ANALYSIS…….......................................................................………….….….....27
FY16 State Procurement Summary .........................................................................................29-32
Office of Administration...................................................................................33-35
Facilities, Management, Design and Construction M/WBE Participation Analysis……….….….......36
Department of Agriculture ..............................................................................37-38
Department of Conservation.............................................................................39-40
Department of Corrections ..............................................................................41-42
Department of Economic Development................................................................43-44
Department of Elementary & Secondary Education..................................................45-46
Department of Health & Senior Services ..............................................................47-48
Department of Higher Education .......................................................................49-50
Department of Insurance, Financial Institutions & Professional Registration....................51-52
Department of Labor & Industrial Relations ..........................................................53-54
Department of Mental Health ...........................................................................55-56
Department of Natural Resources.......................................................................57-58
Department of Public Safety ............................................................................59-60
Missouri State Highway Patrol....................................................................61-62
Department of Revenue..................................................................................63-64
Missouri Lottery...................................................................................65-66
State Tax Commission................................................................................67
Department of Social Services ………....................................................................69-70
Missouri Department of Transportation ...............................................................71-72

WORKFORCE DIVERSITY ANALYSIS...........................................................................................73 FY16 Statewide Workforce Diversity Analysis Summary…………………………………………………………………………………...75-76 State of Missouri Workforce Summary…………..…………………………………………………………………………………………….……..…77
Office of Administration....................................................................................80-81
Department of Agriculture.................................................................................82-83
Department of Conservation ..............................................................................84-85
Department of Corrections ................................................................................86-87
Department of Economic Development..................................................................88-89
Department of Elementary & Secondary Education …………….........................................91-91
Department of Health & Senior Services................................................................92-93
Department of Higher Education….......................................................................94-95
Department of Insurance, Financial Institutions & Professional Registration.....................96-97
Department of Labor & Industrial Relations............................................................98-99
Department of Mental Health..........................................................................100-101
Department of Natural Resources.....................................................................102-103
Department of Revenue.................................................................................104-105
Missouri Lottery……………………………………………………………………………….…………….…..... 106-107
State Tax Commission ........................................................................108-109
Department of Public Safety ...........................................................................110-111
Missouri State Highway........................................................................112-113
Department of Social Services ………….................................................................114-115
Missouri Department of Transportation...............................................................116-117
Appendix A: Workforce Diversity Council Committee Recommendations…….……………..……..………………......120-121
Appendix B: Contract Compliance Council – Best Practices Committee- Recommendations…………………....122-124
Appendix C: Contract Compliance Council – Training Committee- Recommendations.……………...................125


7
State of Missouri
OFFICE OF ADMINISTRATION
Office of equal Opportunity
301 W. High Street, Room 630
Post office Box 809
Jefferson City, Missouri 65102-0630
(573) 751-8130 FAX: (573) 522-8078
http://oeo.mo.gov/
Jeremiah W. (Jay) Nixon Governor
Douglas Nelson Commissioner Walter Pearson
Interim Director
December 2016
The Honorable Jeremiah W. (Jay) Nixon Capitol Building Room 216 Jefferson City, Missouri 65101
Dear Governor Nixon:
On behalf of the Office of Administration (OA), the Office of Equal Opportunity (OEO) is proud to submit the
enclosed 2016 State of Missouri Annual Report on inclusion and participation within state agencies. Over the past
eight years of OA’s administration we have overcome many obstacles and challenges to accomplish our vision,
goals and mission.
The implementation of the eGovernment OEO Online Application has not only streamlined the application
process but also improved its efficiency. It is our continued journey to streamline processes and procedures
associated with diversity procurement and workforce data collection, modifying and updating our resources to
better assist our constituents. OEO will continue to embrace the richness that is the diversity of the State of
Missouri, making government more efficient and improving services for Missouri taxpayers. It is with honor that
we are able to accomplish our goals while working in the Office of Administration.
Although we have achieved much success, we know that much work is still needed to help the State of Missouri
reach a level of parity and equality in regards to contracting and employment opportunities for M/WBEs. OEO
recognizes that diversification is an objective we cannot achieve alone. To that end, we strongly encourage,
welcome and solicit ideas from other state agencies, our partners, as well as internal and external stakeholders
as we strive to move this common state agenda forward. There is no question that the past four fiscal years have
proven to be illuminating for OA and the OEO to lead a state of economic stability for all Missourians to prosper.
As we complete this journey of a shared vision to improve the conditions of our underserved constituents,
stakeholders and communities in a public private partnership, I want to thank Commissioner Douglas Nelson for
his leadership, Mark Long and Kristen Paulsmeyer for their legal assistance with the OEO program. I also want to
thank the OEO team for a job well done and continuously striving to monitor, improve and implement new ideas
and strategies to better serve the citizens of the great State of Missouri.
In closing, I thank you once again for your leadership, guidance and support of OEO’s efforts.
Sincerely,
Walter Pearson
OEO Interim Director

8

9
EXECUTIVE SUMMARY The Office of Equal Opportunity (OEO) exists to promote a diversified workforce within state government and to
assist women and minorities in developing opportunities to contract with the state, economically empowering
traditionally underserved communities and improving the overall fiscal vitality of the State of Missouri. OEO
strives to serve as a resource for promoting diversity within the state workforce and improving the opportunities
for women and minorities, to access state employment opportunities and contracts, through excellent service
and efficient use of resources. OEO works toward this goal by completing the following primary functions:
Certification and Advocacy of Minority/Women Business Enterprises (M/WBE), Education and Outreach, Data
Gathering, Matchmaking Activities and Reporting.
All great ideas have humble beginnings: whether it’s a spark, an idea, or a movement, and it takes a true leader
to bring an idea from conception to realization. The Office of Equal Opportunity (OEO) was shaped by history and
by great men and women who took on the challenge to be trailblazers. The current OEO staff humbly dedicates
this annual report to the following individuals who left their footprint in state government as they worked
towards inclusion, diversity and equal opportunity.
The Historic Perspective of Missouri’s Office of Equal Opportunity –
a program within the Office of Administration (OA)
1985 -1993 Mark Miller was appointed the first Executive Director of the Governor’s Commission on Minority
Business Development for the State of Missouri, Office of Administration. He was responsible for the
development and administration of programs providing technical assistance to minority- and majority-owned
businesses. Among the many initiatives and programs that were created, the following were Miller’s highlights:
Performed as the OA chief negotiator with Highway and General Contractors Unions for inclusion of
minority and women skilled crafts persons related to the $300 million Third State Building Fund.
Along with a team of other state employees, drafted legislation that funded the state’s Minority Business
Disparity Study. (The Study set forth state purchasing policy recommendations on contracting with
minority firms.)
Assisted hundreds of minority- and women-owned businesses in receiving over $30 million in state
contracts.
Provided technical assistance to state agencies, universities, and local municipalities in the development
of minority business purchasing and certification policies.
Developed and spearheaded in the Code of State Regulations (CSRs) the standards and methodology for
certification of minority- and women-owned firms for OA’s Division of Design and Construction.
1991-1992 Jacqueline Lester served as Human Relations Officer at OA.
1993-1994 Kelvin Simmons served as Human Relations Officer at OA.
January 1994 Executive Order 94-03 was signed and stated that the Governor shall designate a State
Equal Employment Opportunity (EEO) Officer.
1995-1996 Carla Owens-Combs served as the Equal Employment Opportunity Officer.
First Disparity Study was conducted by Mason Tillman & Associates under the leadership of Walter
Pearson, Assistant Director of Missouri Department of Economic Development.

10
1997-2000 Alisa Warren served as the first OEO Director, and OEO is mentioned for the first time in the State
of Missouri Official Manual (Blue Book).
November 1998 Executive Order 98-21 was signed mandating all state agencies to make every feasible
effort to increase the percentage of goods and services procured from certified minority- and women-
owned businesses (MBEs and WBEs) to 10% and 5%, respectively, and the Office of Contract Compliance
was created.
2001-2004 Marvin Eason served as the second OEO Director.
2005 -2006 Donna White served as the third OEO Director.
September 2005 Executive Order 05-30 was signed and the OEO’s name was changed to Office of
Supplier and Workforce Diversity (OSWD).
2007-2008 Angel McCormick Franks served as Office of Supplier and Workforce Diversity Director.
2009 -2010 Alan Green served as Office of Supplier and Workforce Diversity Director.
July 2010 Executive Order 10-24 was signed. The executive order states that the Governor shall
designate a State Equal Employment Opportunity (EEO) Officer.
2011-2015 Celeste Metcalf served as the OEO Director.
Appropriations from the Missouri General Assembly funded the State of Missouri Disparity Study.
2014 Disparity Study was conducted by Colette Holt & Associates under the leadership of Doug Nelson,
Commissioner of Administration.
Executive Order 14-07 Established the Disparity Study Oversight Review Committee (ORC).
2015 – Present Walter Pearson (Assistant Commissioner of OA) was appointed to serve as OEO Interim Director.
October 2015 Executive Order 15-06 was signed by Gov. Nixon to help eliminate the lingering effects of
discrimination and ensure a level playing field for all Missouri business owners. Executive Order 15-06
also implements one of the key recommendations of the Ferguson Commission, which called for the
establishment of a statewide program for M/WBEs with outcome measures that incorporate capacity
building, mentoring, and education with respect to the state and local procurement system.
April 2016 The Office of Administration proposed new rules to increase efforts to promote diversity,
provide greater opportunities for minority and women-owned businesses, and encourage the creation of
small businesses. The new rules include:
Efforts to streamline the application process to become M/WBE certified with the Office of Equal
Opportunity (OEO), thereby reducing the burden on businesses seeking certification.
Upon certification, additional information about available M/WBEs will be obtainable in the
state’s online M/WBE directory, which should increase the utilization of M/WBEs in the
procurement process.
Amendments to existing rules within the Office of Administration’s Purchasing and Facilities
Management, Design and Construction divisions were also put forth to carry out the provisions of
Executive Order 15-06 including setting the overall participation goal for M/WBEs at 10 percent,
respectively.
Implementation of the eGovernment OEO Online Application system.
Spearheading two successful statewide Outreach events – Small Business Symposium and Reverse Vendor
Fair – May 27 in St. Louis, MO & June 3 in Kansas City, MO; Capital Connection Small Business Expo –
June1, 2016.
Solidifying the OEO infrastructure.

11
Since the initial post disparity study implementation initiatives, OEO has made some changes to the overall
operations of the OEO. The Interim OEO Director and current staff have taken the directive and challenge to
move the marker forward by working on implementing some of the recommendations to improve and streamline
the certification application process by 50 percent. OEO’s director and staff also have chosen this 2016 Annual
Report to recognize the men and women who impacted this program since its inception in 1985.
Special thanks to the Contract Compliance Council, the Missouri Department of Transportation, Workforce Diversity Council,
Office of Administration Commissioners Office Staff, Division of Purchasing, Division of Facilities Management Design &
Construction, State Agencies and the current Administration.
Special acknowledgement to: OEO staff: Edith Kamara, Christine Chapman, Janet Carter, Dawn Abbott, Seth Bauman and W.T.
Edmonson; Roxy Antonio, Carmela Thornton, Allan Forbis, Wanda Seeney, Sherrece Smith, Barb Shimmens, Sara
VanderFeltz, and Renee Slusher, former Deputy Commissioner & General Counsel.
Our commitment to diversity starts at the top “Nothing is more vital to the long-term growth of Missouri’s small businesses than
our ability to educate, attract and retain certified M/WBEs and talented and dedicated employees.”
As Assistant Commissioner of the Office of Administration and Interim Director of the Office of Equal Opportunity, I, Walter
Pearson, approve this annual report.

12
As the chief diversity office for the state of Missouri, OEO submits this annual report to the Governor to
summarize the progress made toward the achievement of the state’s diversification goals. This report analyzes
procurement and workforce diversity data, department by department, and gives a summary of state agency
activities. The report also tells the Governor the number of minority and women businesses involved in contracts
along with the percentage of M/WBE utilization in procurement activities. It also provides information on the
number of minorities and women employed within the Executive Branch in state government.
OEO is often referred to as “the face of OA” because of its aggressive community engagement program
advocating diversity and inclusion for all Missouri citizens. Several ideas for improvement and feedback, from
entities with a desire to express and share their experiences with the state, come from this constant contact and
community involvement. As a result, OEO is the “internal” voice for these “external” concerns and is empowered
to offer suggestions to departments and decision-makers regarding how the state can achieve desired objectives.
Throughout the year, OEO meets with the Contract Compliance Council and the Workforce Diversity Council to
discuss utilization goals and objectives as well as to develop strategies to increase utilization in underutilized
areas.
Recommendations from the Contract Compliance Council Best Practices and Training Committees, as well as
recommendations from the Workforce Diversity Council Best Practices and Training Committees, are provided at
the conclusion of this report for departments to consider as they prepare their plans and reports for FY2017. The
recommendations for FY2017 are designed to be a framework for the departments to develop action plans that
will enable the achievement of each department’s internal initiatives and OEO’s comprehensive goals. The
ultimate objective is the attainment of a workforce and, at the same time, annual contract awards that are
reflective of Missouri’s diverse population and demographic: a team effort that requires teamwork.
PURPOSE OF ANNUAL REPORT

13
OEO’s Vision and Mission Statements
Vision Statement
The Office of Equal Opportunity strives toward participation in employment and contracts commensurate with
and reflective of the state’s current demographics, with the ultimate objective of improving and enhancing the
long-term economic viability of the State of Missouri.
Mission Statement
The Office of Equal Opportunity (OEO) strives to serve as the State of Missouri’s Chief Advocate for Minorities
and Women in the areas of employment and procurement, while upholding the commitment of the governing
body to create a climate of inclusion that mirrors the demographics of Missouri.
OEO believes in working collaboratively with public and private industries to proactively pursue workforce and
supplier diversity by promoting diversity and inclusion in regards to opportunities in the state’s employment and
procurement processes for minorities and women.
It is our goal to Move Missouri Forward to rebuild the foundation of diversity inclusion while facilitating
developmental programs that foster and empower the economic growth of traditionally underserved
communities, improving the overall fiscal vitality of the State of Missouri.

14
CAPITAL CONNECTION BUSINESS EXPO
Collaborating efforts with federal, state and local governments, and state agencies, maximizes OEO’s outreach
activities and reserves appropriated funds to be used for additional educational and developmental programs.
The Office of Administration - Office of Equal Opportunity under the leadership of Doug Nelson and Walter
Pearson, hosted a Capital Connection Small Business Expo/Reverse Vendor Fair on Wednesday, June 1, 2016, at
the Holiday Inn Executive Center-Columbia, Missouri. This event allowed the public sectors and the private
sectors to network, promote and grow Missouri’s businesses.
At the expo participants were able to:
Make Strategic State Agency Connections – participants were able to make connections with state agency
representatives and learn about future procurement needs.
Participate in “Prime Time” Networking - Prime and Sub-contractors were able to meet to discuss future
subcontracting and/or joint venture opportunities.
Get “MissouriBUYS” Savvy – participants were able to attend the Expo’s computer lab to begin the
registration process for MissouriBUYS, the State of Missouri’s new e-procurement system, and receive
hands-on help with related technical questions.
Promotion - many businesses were given the opportunity to promote their own products and services to
other Expo attendees.
At the Capital Connection Small Business Expo, awards were presented to awardees for their contributions,
efforts, and progress in diversifying contracting opportunities in Missouri state government. The following is a
list of nominees and award winners:
Pioneer Award
Mr. Mark Miller - Winner
This award was presented to an individual from the public sector for demonstrating support, beyond mere
requirements, for diversity issues in procurement and/or employment. The recipient of the Pioneer Award has
implemented efforts emphasizing adherence to a comprehensive diversity program are initiated to actively
promote diversity. The recipient has encouraged training, development, and outreach efforts, and regularly
made these opportunities available to employees as a means of promoting the state’s diversity goals. In
addition, this individual has demonstrated a commitment to promoting diversity in purchasing and employment.
Excellence in Procurement Diversity
Department of Social Services - Winner
This award was presented to a state agency for its progress in diversifying the contracting opportunities in
Missouri state government. A statistical analysis is performed on the MBE and WBE expenditures of agency and
contract transactions in fiscal year 2009-15. Positive growth and change are also evaluated to correspond with
the goals set forth in Executive Orders 15-04 and 10-24. The state agency has further distinguished itself through
documented efforts in obtaining bids from historically underutilized firms and progressive use of outreach and
training for employees on MBE and WBE procurement issues.
Nominees included:
Department of Corrections
Department of Elementary and Secondary Education
Department of Social Services
PARTNERSHIP ENGAGEMENT AND DEVELOPMENT

15
Minority Business Enterprise (MBE) of the Year Award
Metro Office Solutions and Coleman & Associates – Winners
The Minority Business Enterprise (MBE) Award was presented to a firm that demonstrates a commitment to the
following goals and objectives:
Is or has become familiar with an agency’s purchasing needs.
Routinely responds to bid opportunities resulting in two or more contractual or business commitments
with the State.
Established a record of statistically fulfilling State obligations.
Provided outstanding customer service in fulfilling contractual obligations.
Nominees included:
Cable-Dahmer
Rose International
World Wide Technology
Metro Office Solutions
Coleman & Associates
Woman-Owned Business Enterprise (WBE) of the Year Award
Schriefer’s Office Equipment and Huber & Associates – Winners
The Woman-Owned Business Enterprise (WBE) Award recognizes a firm that demonstrates a commitment to the
following goals and objectives:
Is or has become familiar with an agency’s purchasing needs.
Routinely responds to bid opportunities resulting in two or more contractual or business commitments
with the State.
Established a record of statistically fulfilling State obligations.
Provided outstanding customer service in fulfilling contractual obligations.
Nominees included:
Schriefer’s Office Equipment
Samco Business Products
Above All Personnel
Huber & Associates
Jackie Coleman (Coleman &
Associates) accepting MBE of Year
Award

16
Highlights from the 2016 Capital Connection Business Expo
Representatives from Departments of Correction, Elementary & Secondary
Education, and Social Services nominated for Excellence in Procurement
Diversity Award. To the far right are Allan Forbis and Roxy Antonio. To the
left is Walter Pearson.
Elizabeth Huber (Huber & Associates) –
WBE of the Year award winner and Walter
Pearson.
MBE & WBE of the Year Award Recipients

17
Highlights from the 2016 Capital Connection Business Expo
A great turnout at the 2016 Capital Connection Business Expo in Columbia, Missouri.
(R to L)Commissioner of Administration Doug Nelson, Missouri State Rep. Kip Kendrick and Assistant
Commissioner of Administration Walter Pearson at the 2016 Capital Connection Business Expo.

18
19
MINORITY AND WOMAN-OWNED
BUSINESS ENTERPRISE
CERTIFICATION SUMMARY

20
The Office of Equal Opportunity (OEO) Minority and Women Owned Business Enterprise (M/WBE) Certification
Program is a tool that may help a minority or woman-owned business improve its competitiveness. Once
certified, the M/WBE can connect with buyers from state agencies and enhance its exposure to prime vendors
and contractors.
OEO certified M/WBEs are listed in the online OEO Certified M/WBE Directory. OEO M/WBE certification allows
businesses to meet “home state certification” for other states as well as validating the M/WBEs ownership,
management, and control of their business.
In January 2016, the Office of Equal Opportunity instituted a new online application system for minority and
women-owned business enterprises that will reduce the amount of time it currently takes to submit the
necessary documentation to obtain M/WBE certification. The new system also reduces the time the Office of
Equal Opportunity (OEO) spends reviewing and tracking information. This is a significant improvement from
applications that were previously, typically submitted on paper and reviewed manually by OEO staff. The
streamlined certification process makes it easier for M/WBEs to do business with the state and to have more
immediate access to state contracts which, in turn, promotes diversity and greater inclusion in state
government.
To become M/WBE certified with the State of Missouri, a business must meet the following requirements:
Be at least 51 percent owned by a minority and/or a woman;
The minority and/or woman owner must be a U.S. citizen or lawfully admitted permanent resident of the
U.S.;
The minority and/or woman owner must hold the highest position in the company and be capable of
exercising direct control over the daily, as well as long-term decisions regarding the management,
policies and operations of the firm; and
The business must be organized as a for-profit business.
If the firm meets the requirements above, then the firm will be eligible to participate in the State of Missouri
M/WBE program.
A MINORITY BUSINESS ENTERPRISE (MBE) as defined by OEO is a firm that is at least 51% owned, managed and
controlled by one or more minority individuals. A racial minority is, for the purposes of the State of Missouri’s
MBE program, defined as an individual who is a citizen or a lawfully admitted permanent resident of the United
States and who is a member of one of the following groups: Black American, Hispanic American, Native American
including Alaskan Native, Pacific Islander and Aleut, Asian-Pacific American, and Asian-Indian American, as well
as any other similar racial minority groups identified in Chapter 37 of the Missouri Revised Statutes as listed in
Section 37.013.
A WOMAN BUSINESS ENTERPRISE (WBE) as defined by OEO is a business that is at least 51% owned, managed and
controlled by one or more women.
Certification as an MBE and/or WBE provides greater opportunities for the certified business to bid on state
contracts.
OEO accepts applications that it has reciprocity for M/WBE certification from (16) other states through
reciprocity: Delaware, Kentucky, New York, Tennessee, Illinois, Maryland, Oregon, Virginia, Indiana,
Massachusetts, Rhode Island, Washington (State), Kansas, New Jersey, South Carolina, and Wisconsin.
The Office of Equal Opportunity
M/WBE Certification Program

21
The Office of Equal Opportunity certifies M/WBE vendors for the State of Missouri to participate in the
procurement process. According to OEO rules and regulations, each Missouri applicant must be visited at their
business location as part of the MBE/WBE certification process. The State is divided into the following regions
indicated on the map below.
The following table compares the number of on-site visits conducted in FY15 and FY16 by region. The results
indicate that the largest increase of on-site visits conducted was in the St. Louis region. The tracking of this data
allows the OEO program to identify areas that will require future plans for additional outreach efforts.
FISCAL YEAR 2016 CERTIFICATION ANALYSIS
FY5-FY16 ON-SITE VISITS COMPARISON
REGION FY15 FY16 % CHANGE
Northwest 4 2 -50.00%
Northeast 2 2 0.00%
Kansas City 25 16 -36.00%
Central 19 10 -47.37%
St. Louis 59 68 15.25%
Southwest 12 14 16.67%
Southeast 9 6 -33.33%
Total 130 118 -9.23%

22
Types of Certification
Standard Certification
The Standard Certification process only applies to applicants whose principal place of business is in Missouri. The
following is the certification process for a Standard Certification: An applicant must complete the M/WBE
Certification Application and submit the required documentation. The applicant must sign and notarize an
affidavit, then scan and submit it to OEO to complete the application process. The applicant is required to retain
the original in their records. An on-site visit to the applicant’s business must be conducted before certification
can be granted or denied.
Rapid Certification
The Rapid Certification process applies only to applicants whose principal place of business is in Missouri and they
have been certified as an M/WBE by one of the following approved certifying entities: Kansas City – Human
Relations Department, Kansas City – MRCC, St. Louis Lambert International Airport Authority, City of St.
Louis – MRCC, Mid-States Minority Supplier Development Council, MoDOT/MRCC – (DBE Program), Mountain
Plains Minority Supplier Development Council, St. Louis Minority Business Council, and National Woman’s
Business Owners Corporation (NWBOC).
Applicants must still meet the qualifications of the Missouri M/WBE program and certification by one of the
programs listed above does not guarantee acceptance by OEO. A Rapid certified firm’s expiration date with OEO
is based upon the firm’s parent certification’s next required Annual Update or the expiration date of the parent
certification, whichever occurs first. An applicant must complete the M/WBE Certification Application and submit
the required documentation including a copy of the applicant’s current certificate that has at least 90 days
before its expiration date. The applicant must sign and notarize an affidavit, then scan and submit it to OEO to
complete the application process. The applicant is required to retain the original in their records.
Out-of-State Certification
The Out-of-State Certification process applies only to Out-of-State applicants whose principal place of business is
located outside of Missouri. OEO may certify out-of-state minority and women-owned business applicants under
the following conditions: The applicant must be certified by their home state whose certification process is
similar to Missouri’s process and the certification must include an on-site inspection. OEO will not conduct on-site
inspections outside the State of Missouri. The certification determinations will be made based upon a desk audit
of the application and all submitted documentation. The applicant’s home state must allow Missouri-based
M/WBEs to become certified under their respective program.
Note: OEO may certify applicants from other states if the applicants are certified by another certifying entity
within the State of Missouri as an M/WBE or a DBE.
The following is a list of States that OEO has reciprocity and accepts M/WBE applicants from:
Delaware New York
Illinois Oregon
Indiana Rhode Island
Kansas South Carolina
Kentucky Tennessee
Maryland Virginia
Massachusetts Washington (State)
New Jersey Wisconsin
CERTIFICATION PROCESS

23
The following tables and corresponding pie charts summarize the FY16 OEO Minority and Woman-owned Business
Enterprise Certification data.
Applications Received By Certification Type
Total
MBE 64
WBE 88
Both 63
Total 215
Applications Received By Application Type
Total
Out of State 35
Rapid 27
Standard 153
Total 215
Applications Received – Annual Updates and Recertifications
Total
Annual Updates 62
Recertifications 120
Total 182
Certifications Completed By Certification Type
Total
Minority 459
Women 912
Both 244
Total 1,615
Certifications Completed By Application Type
Total
Out of State 227
Rapid 312
Standard 1076
Total 1,615
29.77%
40.93%
29.30%
Application by Certification Type
MBE
WBE
BOTH
16.28%
12.56%
71.16%
Applications by Application Type
Out of State
Rapid
Standard
34.07%
65.93%
Annual Updates and Recertifications
Annual Updates
Recertifications
28.42%
56.47%
15.11%
Certifications Completed by Certification Type
Minority
Women
Both
14.06%
19.32%
66.63%
Certifications Completed by Application Type
Out of State
Rapid
Standard

24
The table and chart below represents the total number of OEO certified vendors by region:
TOTAL CERTIFIED VENDORS BY REGION
REGION WBE MBE MBE/WBE Total
1-Northwest 16 9 1 26
2-Northeast 14 2 3 19
3-Kansas City 170 80 49 299
4-Central 123 39 24 186
5-St. Louis 419 176 130 725
6-Southwest 76 17 9 102
7-Southeast 46 3 2 51
8-Out-of-State 109 68 30 207
TOTAL 973 394 248 1615
0
100
200
300
400
500
NU
MB
ER
OF
MB
E/W
BE
&
M/W
BE
REGIONS
TOTAL CERTIFIED VENDORS BY REGION
WBE
MBE
MBE/WBE
1.61% 1.18%
18.51%
11.52%
44.89%
6.32%
3.16% 12.82%
PERCENT OF CERTIFIED VENDORS BY REGION
1-Northwest
2-Northeast
3-Kansas City
4-Central
5-St. Louis
6-Southwest
7-Southeast
8-Out-of-State

25

26

27
STATE OF MISSOURI
PROCUREMENT ANALYSIS

28
A cross-section of members of OEO’s Workforce Diversity Council
at one of the Workforce Diversity Council meetings.

29
Procurement can be a potentially powerful tool for governments to promote level economic opportunities and to
counteract discrimination in the marketplace. Over the last several decades, federal, state and local
governments throughout the nation including Missouri have developed programs with the express intent of
increasing the number and value of government contracts awarded to minority-owned business enterprises
(MBEs) and woman-owned business enterprises (WBEs).
In the State of Missouri, each state agency plays a different role in addressing and supporting the needs of the
State which dictates the nature and type of expenditure that is required in each situation. Some state agencies
have a routine portfolio of contracts that provide a more predictable level of participation from year to year.
Other agencies have major contracts that are awarded in one year and not in another as a result of variations in
funding, inventory draw downs, or other unplanned circumstances. Some major contracts may provide an
opportunity to involve additional participation.
The Department of Corrections, for example, may have multiple correctional and supervision centers throughout
the entire state. Most of these facilities are located in small towns or rural communities where the department is
committed to supporting the local economy. It is quite typical for a facility in the rural areas to support local
vendors for expenditures under the $3,000 bid threshold.
Similarly, the Department of Conservation may rely on local or rural retail outlets to supply grounds maintenance
or feed supply products. These types of goods dictate the necessity for short-term, non-contractual relationships.
The Department of Social Services may spend the bulk of its expenditures in partnership with non-profit
agencies; while the Department of Elementary and Secondary Education may employ an abundance of
independent contractors and service providers.
The uniqueness of each agency’s service offering, combined with the dynamics of each agency’s contractual vs.
discretionary expenditure needs, will determine what combination of expenditure transactions satisfy each
unique situation. In an effort to provide an analysis that neutralizes these agency differences and makes the
information more consistent and comparable among agencies, a variety of factors must be taken into
consideration.
Agencies sometimes require specialized procurements and a sole source contract in which only one vendor can
provide the requisite goods or services may offer limited minority or women opportunities.
This could be due to the size of the contract, the region of the state in which the contract is located, or the
specific industry involved. For contractual situations such as these, agencies may utilize a Single Feasible Source
(SFS). As defined in Section 34.044, RSMo, (SFS) procurement exists when:
Supplies are proprietary and only available from the manufacturer or a single distributor; or
Based on past procurement experience, it is determined that only one distributor services the region in
which the supplies are needed; or
Supplies are available at a discount from a single distributor for a limited period of time.
When agencies are required to use a specified vendor as a result of a statewide contract, the respective agency
has limited control over the minority or woman participation on that contract. As a final example, contracts
with not-for-profits cannot be counted towards minority and woman participation goals.
Only OEO certified vendors can be counted toward MBE and WBE targets and OEO only certifies “for profit”
businesses.
FY16 PROCUREMENT SUMMARY

30
FY16 PROCUREMENT SUMMARY Executive Order 05-30 states that “All agencies shall continue to make every feasible effort to target the
percentage of goods and services procured from certified MBEs and WBEs to 10% and 5%, respectively”.
The table below gives an overview of expenditures incurred by each executive department. Although the
legislature, judicial and elected officials are not subject to this executive order, their M/WBE utilization is also
included.
FY16 State Procurement Summary Table
Legislative, Elected Officials & Judicial Branches*
MBE WBE NON-MBE TOTAL TOTAL NET MBE %
WBE % EXPENDITURES EXPENDITURES EXPENDITURES EXPENDITURES EXCLUDABLES EXPENDITURES
$9,148,647.37 $1,844,715.32 $29,626,427.18 $40,619,789.87 $0.00 $40,619,789.87 22.52 4.54
EXECUTIVE DEPARTMENTS
OA $35,999,089.34 $6,140,256.43 $69,900,868.04 $112,040,213.81 $82,738.10 $111,957,475.71 32.15 5.48
MDA $62,736.23 $115,103.60 $5,072,283.42 $5,250,123.25 $2,099,640.18 $3,150,483.07 1.99 3.65
MDC $5,388,056.59 $1,591,465.47 $39,935,189.72 $46,914,711.78 $9,518,748.83 $37,395,962.95 14.41 4.26
DOC $23,945,258.90 $9,258,212.94 $190,622,052.61 $223,825,524.45 $147,095,607.98 $76,729,916.47 31.21 12.07
DED $2,951,535.19 $1,724,386.92 $19,306,768.23 $23,982,690.34 $4,146,916.33 $19,835,774.01 14.88 8.69
DESE $963,019.10 $3,339,349.68 $48,394,978.72 $52,697,347.50 $1,214,971.87 $51,482,375.63 1.87 6.49
DHE $5,000.00 $45,687.33 $7,233,185.10 $7,283,872.43 $7,085,621.00 $198,251.43 2.52 23.05
DHSS $267,234.24 $503,786.06 $16,098,365.26 $16,869,385.56 $8,366,589.72 $8,502,795.84 3.14 5.92
DIFP $72,727.39 $117,425.96 $2,353,017.79 $2,543,171.14 $901,415.10 $1,641,756.04 4.43 7.15
DOLIR $382,284.47 $664,286.18 $2,481,010.63 $3,527,581.28 $318,053.63 $3,209,527.65 11.91 20.70
DMH $540,622.60 $277,884.61 $41,020,121.25 $41,838,628.46 $16,215,462.90 $25,623,165.56 2.11 1.08
DNR $1,033,933.10 $1,827,228.54 $16,895,267.12 $19,756,428.76 $8,877,512.05 $10,878,916.71 9.50 16.80
DPS $2,525,723.03 $1,388,981.64 $29,671,634.12 $33,586,338.79 $12,888,952.57 $20,697,386.22 12.20 6.71
THE PATROL $8,906,419.43 $352,264.39 $40,587,926.40 $49,846,610.22 $16,512,226.76 $33,334,383.46 26.72 1.06
DOR $1,122,759.09 $422,873.02 $12,769,689.89 $14,315,322.00 $0.00 $14,315,322.00 7.84 2.95
THE LOTTERY $21,192,667.39 $7,611,029.37 $106,033,082.24 $134,836,779.00 $901,415.10 $133,935,363.90 15.82 5.68
STC $2,519.62 $1,932.95 $87,231.43 $91,684.00 $0.00 $91,684.00 2.75 2.11
DSS $10,364,791.23 $10,552,437.50 $177,648,731.91 $198,565,960.64 $11,539,509.10 $187,026,451.54 5.54 5.64
MoDOT $13,206,886.74 $5,864,580.26 $221,117,929.59 $240,189,396.59 $15,064,605.22 $225,124,791.37 5.87 2.61
SUB-TOTAL OF EXECUTIVE DEPT. $128,933,263.68 $51,799,172.85 $1,047,229,333.47 $1,227,961,770.00 $262,829,986.07 $965,131,783.93 13.36 5.37
STATEWIDE TOTALS $138,081,911.05 $53,643,888.17 $1,076,855,760.65 $1,268,581,559.87 $262,829,986.07 $1,005,751,573.80 13.73 5.33
The following key lists the Executive Departments’ acronyms along with their names:
OA Office of Administration MDA Dept. of Agriculture MDC MO Dept. of Conservation
DOC Dept. of Corrections DED Dept of Economic Development DESE
Dept. of Elementary & Secondary Education
DHSS Dept. of Health & Senior Services DHE
MO Dept. of Higher Education DIFP
Dept. of Insurance, Financial Institutions & Professional Reg.
DOLIR Dept. of Labor & Industrial Relations DMH Dept. of Mental Health DNR Dept. of Natural Resources
DPS Dept. of Public Safety THE PATROL MO State Highway Patrol DOR Dept. of Revenue
THE LOTTERY MO State Lottery STC State Tax Commission DSS Dept. of Social Services
MoDOT MO Dept. of Transportation

31
M/WBE Utilization in the State of Missouri
The Office of Equal Opportunity (OEO) understands that the participation of Minority and Woman-owned Business
Enterprises (M/WBEs) in the State of Missouri’s procurement process is essential to the economic stability of our
communities. Executive Order 05-30 states that the desirable M/WBE Utilization Percentages (UP) is 10% MBE
and 5% WBE.
The OEO has a responsibility to explain to its constituents and stakeholders how the M/WBE Utilization
Percentage is calculated at the end of each fiscal year. It is generally believed that M/WBE percentages should
be applied to the total expenditures that the State of Missouri incurred during a particular fiscal year. However,
this is not always the case.
Below are the steps used to arrive at the M/WBE utilization calculations:
Step 1: Total all the payments made to all vendors with includable object codes;
Step 2: Total the payments made to certified M/WBE vendors that provided goods and services; and
Step 3: Divide the payments made to certified M/WBE vendors by total payments made to all vendors to
obtain a utilization percentage.
For Purchasing Contract Purchases and Agency Purchases, the State of Missouri calculates the UP based on
payments that all departments make on a list of codes, known as “includable object codes”. This list can
include, but is not limited to, office supplies; laboratory supplies; professional services or IT services. Some of
the items or services that are excluded are lodging, natural gas, and utilities. Expenditures presented in this
report include total expenses on “includable object codes”. The UP is calculated in the following manner:
If an M/WBE vendor is participating as a subcontractor in a contract, the participation is calculated
based on reports submitted by the prime contractors to Division of Purchasing. A percentage of the
total payments to the prime contractor should equal the percentage specified in the contract. These
expenditures are combined and the utilization percentages for M/WBE vendors are calculated.
The following are definitions of some key terms utilized throughout this report:
Purchasing Contracts– when an agency makes a purchase with the use of a contract set up by the
Division of Purchasing.
Agency (Discretionary) Purchases– when an agency purchases directly from a vendor without the
use of a contract.
FY16 PROCUREMENT SUMMARY

32
The table and graphs below represent a summary of M/WBE Utilization in the State of Missouri Procurement
from FY2008 to FY2016:
The M/WBE Utilization graph below shows the percentages of M/WBE participation in State Procurement from
FY08 to FY16.
1 Expenditures include only those goods and services that are available for purchase from vendors. Colleges and universities are excluded. Leasing expenditures are excluded. Journal vouchers are not captured in the MBE/WBE report. 2 Contracts are set up by the OA-Division of Purchasing on behalf of a particular agency or to be used statewide contract by all state agencies. 3 Discretionary expenditures are created when an agency purchases directly from a vendor without the use of a contract. These
expenditures are below the $24,999 threshold.
Fiscal MBE WBE Non M/WBE Total
Year Expenditures Expenditures Expenditures Expenditures MBE % WBE %
FY08 $93,345,444.37 $26,050,399.45 $1,071,558,672.24 $1,197,665,142.72 7.79% 2.18%
FY09 $93,451,065.77 $26,480,467.24 $1,148,611,830.22 $1,268,543,363.23 7.37% 2.09%
FY10 $77,502,335.96 $23,639,682.37 $1,055,859,652.18 $1,157,001,670.51 6.70% 2.04%
FY11 $83,572,567.89 $29,935,849.94 $818,744,077.24 $932,612,455.07 8.96% 3.21%
FY12 $82,581,945.33 $37,460,849.32 $843,988,566.80 $964,031,361.45 8.57% 3.89%
FY13 $118,016,625.83 $35,640,536.44 $781,729,416.51 $935,386,578.78 12.62% 3.81%
FY14 $110,191,770.00 $47,379,004.00 $1,013,907,727.00 $1,171,478,501.00 9.41% 4.04%
FY15 $129,086,788.46 $52,932,642.49 $1,033,723,624.50 $1,215,743,055.45 10.62% 4.35%
FY16 $138,081,911.05 $53,643,888.17 $1,076,855,760.65 $1,268,581,559.87 10.88% 4.23%
0.00%
2.00%
4.00%
6.00%
8.00%
10.00%
12.00%
14.00%
16.00%
18.00%
FY08
FY09
FY10
FY11
FY12
FY13
FY14
FY15
FY16
M/WBE Utilization
MBE % WBE %

33
Office of Administration Commissioner: Douglas Nelson
The Office of Administration (OA) is the state’s service and administrative control agency. Created by the
General Assembly on January 15, 1973, OA oversees and coordinates the central management functions of state
government. OA's responsibilities were clarified and amended by the Omnibus State Reorganization Act of 1974.
The Commissioner of Administration appoints the Deputy Commissioner, Assistant Commissioner and the
Directors of the following divisions:
Accounting Budget & Planning General Services
Information Technology Services Personnel Purchasing
Facilities Management, Design & Construction
Programs assigned to OA include:
Administrative Hearing Commission Children’s Trust Fund Governor’s Council on Disability
Human Resources Office of Equal Opportunity
All purchases over $3,000 are subject to competitive procurement requirements. For all purchases of $25,000 or more, a formal, sealed, and advertised procurement method is required. The Division of Purchasing uses three (3) basic types of procurement methods. Other methods may be used as deemed in the best interest of the State of Missouri. The three procurement methods are:
An Invitation for Bid (IFB) is a formal request for sealed bids. The document will contain standard technical specifications of a specific nature and a formal bid opening date and time with which the bidder must comply in order to be considered for award. Subjective evaluation criteria may be used in an IFB.
A Request for Proposal (RFP) is used for complex requirements that preclude the use of specific specifications or requirements. An RFP will contain functional specifications for which the offeror must respond with a sealed proposal. A formal proposal opening date and time will be specified. Subjective evaluation criteria may be used to select a contractor. Negotiations may be conducted with those offerors’ who submit potentially acceptable proposals.
A Single Feasible Source is used when the goods or services are proprietary and only available from the manufacturer or a single distributor. This method may also be used to take advantage of special, limited-time discounts from a single distributor and, based on past procurement experience, it is determined that only one distributor services the region in which the supplies are needed.
An analysis of the department’s expenditures reveals the following expenses incurred during FY16 on the table
below. “Net Expenditures” represent OA’s “Total Expenditures” of $112,040,213.81 minus “Excludable
Expenditures” of $82,738.10.
MBE EXPENDITURES
WBE EXPENDITURES
NON-M/WBE EXPENDITURES
NET EXPENDITURES MBE % WBE %
$35,999,089.34 $6,140,256.43 $69,900,868.04 $111,957,475.71 32.15% 5.48%
OA’s PROCUREMENT PROCESS
OA’s MBE/WBE EXPENDITURES

34
The table and pie charts below represent the breakdown of OA’s “Total Expenditures” into “PURCHASING
CONTRACTS” and “AGENCY PURCHASES”.
PURCHASING CONTRACTS AGENCY PURCHASES
MBE WBE NON M/WBE MBE WBE NON M/WBE
$35,687,511.91 $5,530,618.40 $59,822,554.43 $311,577.43 $609,638.03 $10,078,313.61
$101,040,684.74 $10,999,529.07
The table below details OA’s Top Five (5) Expenditure areas along with the level of MBE/WBE participation
achieved in each category:
State statutes require bids to be awarded to the lowest and best bidder which may not always include
MBE/WBE participation either as the prime or as a subcontractor.
There is limited availability of OEO-certified MBE/WBEs for some of the products/services needed by
agencies.
The length of time it takes to become certified makes it difficult for an MBE/WBE to be newly certified
by the closing date of a newly issued IFB/RFP.
Trying to balance the time when an award must be made to meet the delivery requirements of the
agencies for the product/services needed while giving enough time for the primes to locate MBE/WBEs
and, if necessary, for OEO to certify MBE/WBEs before IFB/RFP closing date.
35.32%
5.47%
59.21%
PURCHASING CONTRACTS
MBE
WBE
NON M/WBE
2.83%
5.54%
91.62%
AGENCY PURCHASES
MBE
WBE
NON M/WBE
OA Division of Purchasing’s Challenges to obtaining M/WBE Participation
Object Code/Description Expenditure
Total % of Grand Total
Expenditures MBE % WBE %
2583 Comp Soft Maint Lic & Subsc $29,328,516.43 26.18% 39.00% 3.90%
2541 Info Technology Consult & Srvs $13,576,814.79 12.12% 26.00% 1.54%
2705 Non Mnfrm Sftware Consult&Dev $12,446,581.78 11.11% 10.00% 0.44%
2904 Other Equipment Leases Capital $5,641,023.45 5.03% 0.00% 0.00%
2700 Non-Mnfrm Comp Eq Leases Capi $3,833,112.73 3.40% 0.00% 0.00%

35
OA's TOP FIVE AREAS OF WBE PARTICIPATION
Object Code/Description Contracts Discretionary Object Code Total Spend WBE%
2418 Audio/Video Charges $5,000.00 $0.00 $5,000.00 100.00%
2454 Mailing Services $11,019.45 $0.00 $11,019.45 100.00%
2505 Professional Court Services $1,913.70 $0.00 $1,913.70 100.00%
2769 Office Furniture $0.00 $1,095.57 $1,095.57 100.00%
2469 Temporary Personnel Services $14,731.70 $1,807.30 $18,662.14 88.62%
To increase MBE/WBE utilization, OA will continue to do the following:
When possible, OA Purchasing will allow more time for bidders to respond to the bid solicitations. This
will provide prime vendors adequate time to propose meaningful subcontracts with the MBE/WBEs they
identify to partner with.
OA Purchasing will provide annually to OEO a listing of anticipated bid solicitations for the upcoming
fiscal year with the proposed commodity codes or product/service areas that will be used. This will
allow OEO to identify and certify MBE/WBEs in those areas in anticipation of the bid opportunity.
OA Purchasing has added two columns to the current “Upcoming MBE/WBE and SDVE Subcontracting Bid
Opportunity” page which will list the proposed commodity codes. Vendors wanting to receive email
notifications can register for those codes prior to bid issuance. The previous bid number and current
contract number, if applicable, will also be provided so that vendors can educate themselves on the
prior procurement.
OA's TOP FIVE AREAS OF MBE PARTICIPATION
Object Code/Description Contracts Discretionary Object Code Total Spend MBE%
2730 Communications Equip $1,165.65 $0.00 $1,165.65 100.00%
3085 Rebill Under Thresh Computer Equip $1,191,012.02 $5,554.64 $1,200,123.08 99.70%
2685 Under Thresh Computer Equip $2,715,482.00 $84,917.60 $2,816,912.57 99.41%
3101 Rebill Over Thresh IT Net/Comm Equip $292,749.15 $0.00 $307,070.65 95.33%
2686 Under Thresh Non Mnframe Comp Sftw $2,733,346.17 $4,024.17 $2,942,889.81 93.01%
Listed on the tables below are OA’s Top Five Areas of MBE and WBE participation respectively.

36
OA – Facilities Management, Design and Construction (FMDC) Director: Cathy Brown
The mission of OA’s Division of Facilities Management, Design and Construction (FMDC) is to provide superior
workplace environments for state occupants and their visitors and to protect the State’s investments in property
assets. This mission is carried out by the various units that make up FMDC. These include:
The Operations Unit which maintains and manages state-owned office buildings and other structures in the
Capitol complex and other locations within the state. They also maintain buildings for the Department of
Elementary and Secondary Education, Mental Health, Division of Youth Services and the Missouri State
Highway Patrol. The unit also operates state office buildings in St. Joseph, Kansas City, Springfield and St.
Louis.
The Administrative/Legal Unit consists of the following sections: Legal, Contracts and Fiscal/Accounting.
This unit has oversight of the division’s overall administrative and fiscal issues.
The Energy Unit is responsible for monitoring energy consumption in state-owned buildings and continues to
develop and implement programs to help departments comply with the governor’s Executive Order 09-18,
mandating a reduction of energy consumption in state-owned buildings.
The Real Estate Services Unit coordinates real estate transactions on behalf of the state to include
conveyance of state-owned property, purchase of property and granting easements.
The Capital Improvement Planning/Asset Management Unit is responsible for the CI budget, which includes
the maintenance and repair budget, new construction budget and the re-appropriation budget. In addition,
it maintains the condition of all assets in a comprehensive database. Review of all requests for
appropriations for capital improvements also falls under the responsibilities of this unit.
M/WBE Participation Analysis
A review of the participation of M/WBE members in FMDC capital improvement projects reveals the following for
FY16:
MBE members participating as general contractors in capital improvement projects received payments of
$1,011,949.00.
WBE members participating as general contractors in capital improvement projects received payments of
$4,886,150.00.
MBE members participating as subcontractors in capital improvement projects received payments of
$10,740,010.00.
WBE members participating as subcontractors in capital improvement projects received payments of
$17,615,699.00.
Executive Order 05-30 stated that FMDC should reach 10% MBE participation and 5% WBE participation in capital improvement projects.
The FY16 aggregate payments to MBE and WBE members amounted to the following:
MBE - $11,751,959.00 (8.55%)
WBE - $22,501,849.00 (16.37%)
FMDC reports that fewer MBE companies bid on FMDC’s construction projects and non M/WBE general contractors that bid on Capital Improvement projects are having a hard time locating and receiving competitive bids from M/WBE contractors. The OEO will continue working with FMDC to certify M/WBE members that can participate in capital improvement projects and will also promote outreach events where general contractors and certified M/WBE members can come together.

37
Department of Agriculture Director: Richard Fordyce
Established in 1933 by the General Assembly, the Department of Agriculture (MDA) promotes and protects
Missouri’s nearly $6 billion agriculture industry by enforcing state laws that regulate and market the agricultural
industry across the state. Through its divisions, the Department of Agriculture administers programs that protect
Missouri's producers, processors, distributors and consumers of food, fuel and fiber, while marketing Missouri
agricultural products in the state, nation and abroad. The department’s divisions include:
Office of the Director Animal Health Agriculture Business Development
Grain Inspection & Warehousing Plant Industries Weights & Measures & Consumer Protection
MDA’s boards and commissions include:
MO State Milk Board Wine and Grape Board MO Agricultural & Small Business Development Authority
Missouri State Fair Commission
MDA’s PROCUREMENT PROCESS
MDA’s internal policy for purchasing reflects that “for purchases of more than $2,999.99, the Division must
contact the Fiscal Office for a purchase order number prior to ordering. All divisions shall make a good faith
effort to increase spending with minority and women. Any single feasible source item(s) over $3,000.00 must be
submitted with documentation to the Fiscal Office for determination that the item/supply is a single feasible
source. Minority or women owned businesses must be provided a fair and equitable opportunity to submit bids
and proposals”.
MDA’S MBE/WBE EXPENDITURES
An analysis of the department’s expenditures reveals the following expenses incurred during FY16 on the table
below. “Net Expenditures” represent MDA’s “Total Expenditures” of $5,250,123.25 minus “Excludable
Expenditures” of $2,099,640.18.
MBE EXPENDITURES
WBE EXPENDITURES
NON-M/WBE EXPENDITURES
NET EXPENDITURES MBE % WBE %
$62,736.23 $115,103.60 $5,072,283.42 $3,150,483.07 1.99% 3.65%
The table and pie charts below represent the breakdown of MDA’s “Total Expenditures” into “PURCHASING
CONTRACTS” and “AGENCY PURCHASES”.
PURCHASING CONTRACTS AGENCY PURCHASES
MBE WBE NON M/WBE MBE WBE NON M/WBE
$45,307.56 $15,915.35 $2,231,292.55 $17,428.67 $99,188.25 $2,840,990.87
$2,292,515.46 $2,957,607.79
1.98%
0.69%
97.33%
PURCHASING CONTRACTS
MBE
WBE
NON M/WBE
0.59%
3.35%
96.06%
AGENCY PURCHASES
MBE
WBE
NON M/WBE

38
The table below details MDA’s Top Five (5) Expenditure areas during FY16 along with the level of MBE/WBE
participation achieved in each category:
Object Code / Description Expenditure
Total % of Grand Total
Expenditures MBE % WBE %
2280 Laboratory Supplies $ 1,152,439.01 21.95% 0.00% 2.00%
2544 Other Professional Services $ 475,397.52 0.91% 0.00% 0.93%
2328 Motor Fuel $ 443,144.51 0.84% 0.00% 0.00%
2466 Advertising Services $ 363,657.90 0.07% 0.00% 0.00%
2736 Laboratory Equipment $ 325,367.78 0.62% 0.00% 0.00%
The lack of MBE/WBE participation in MDA’s top five object codes can be attributed to the following:
2280 - MDA has four divisions that have laboratories that buy large volumes of laboratory kits. The kits
for each division are unique to the specific laboratory depending on what is being tested. The kits must
meet the standards of the governing body for testing. Some of these kits are single source, while the
remainder of the kits can only be purchased from large corporations.
2328 – MDA utilizes the state’s mandatory “Wex Bank” contract for state agencies with a Non-M/WBE
vendor. MDA has a small discretionary spending budget and fuel purchases are one of the expenditures
for MDA. The department cannot find M/WBE vendors to provide this commodity.
2466 – MDA uses contracts bid by OA for 89 percent of all advertising expenditures, but will continue to
find M/WBE vendors for expenditures that bid under its delegated authority.
2736 – MDA uses contracts bid by OA for 85 percent of all laboratory equipment expenditures with a
Non-M/WBE vendor. More MBE/WBE vendors will be sought for expenditures bid under its delegated
authority.
Listed on the tables below are MDA’s Top Five Areas of MBE and WBE participation, respectively.
MDA's TOP FIVE AREAS OF MBE PARTICIPATION
Object Code / Description Contracts Discretionary Object Code Total Spend MBE%
2700 Non Mnframe Comp Equip over thresh $6,286.18 $0.00 $6,286.18 100.00%
2598 Office Furn & Equip Repair & Maint $6,334.67 $0.00 $19,233.85 32.93%
2694 Under threshold-other Equip $3,017.27 $0.00 $17,049.57 17.69%
2250 Office Supplies $4,159.30 $8,958.96 $111,199.45 11.79%
2373 Other Specific Use Supplies $7,327.31 $325.13 $146,998.39 5.20%
MDA's TOP FIVE AREAS OF WBE PARTICIPATION
Object Code / Description Contracts Discretionary Object Code Total Spend WBE%
2250 Office Supplies $0.00 $63,778.30 $111,199.45 57.35%
2118 Commercial Transportation $0.00 $13,534.01 $34,986.83 38.68%
2460 Printing and Binding Services $0.00 $8,871.57 $30,014.04 29.55%
2373 Other Specific Use Supplies $0.00 $2,976.94 $146,998.39 2.02%
2544 Other Professional Services $0.00 $4,438.29 $475,397.52 0.93%
The Department of Agriculture’s current policy promotes purchasing from M/WBE vendors for products/services.
The AgriMissouri program has started reaching out to their members and encouraging them to register as M/WBE
vendors. Additionally, MDA will continue to utilize OEO’s and Division of Purchasing resources for more
MBE/WBE participation. The department will also continue to reach out to other state agencies with similar
purchases for their advice and assistance.

39
Department of Conservation Interim Director: Tom Draper
The Missouri Department of Conservation’s (MDC) mission, vision, and goals communicate our never ending
pledge to serve Missourians and to meet the requirements of the Missouri Constitution (Article IV, Section 40(a)
through 46). The Department’s mission is to protect and manage the fish, forest, and wildlife resources of the
state; to facilitate and provide opportunities for all citizens to use, enjoy, and learn about these resources. The
Department is a forward looking agency, implementing solid core values ensuring integrity and trust, using
adaptive learning and creative thinking, embracing technology and providing superior public service to be the
national leader in fish, forest, and wildlife management proactively advancing our mission through understanding
natural resource and social landscapes.
Administrative Services Design and Development Fisheries Forestry
Human Resources Outreach and Education Private Land Services Protection
Resource Science Wildlife
MDC’S PROCUREMENT PROCESS
The Missouri Department of Conservation has employees all across the state located in one of our eight (8)
Regional Offices or 100+ field offices, most of which are in rural communities. Due to the large number of field
offices and employees that work out of these locations, the Department utilizes a decentralized purchasing
process. The Department has two Purchasing Analysts located in Central Office that assist and guide the
employees on procedures as defined in our Purchasing, Bidding, and Contracting Policy, which is derived from 1
CSR 40-1 and the Office of Administrations, Division of Purchasing’s Procurement Manual. Purchasing Analysts
remind field staff to seek bids from M/WBE vendors. The link to the M/WBE directory is also located within our
Purchasing, Bidding, and Contracting Policy.
MDC’S MBE/WBE EXPENDITURES
An analysis of the department’s expenditures reveals the following expenses incurred during FY16 on the table
below. “Net Expenditures” represent MDC’s “Total Expenditures” of $46,914,711.78 minus “Excludable
Expenditures” of $9,518,748.83.
MBE EXPENDITURES
WBE EXPENDITURES
NON-M/WBE EXPENDITURES
NET EXPENDITURES MBE % WBE %
$5,388,056.59 $1,591,465.47 $39,935,189.72 $37,395,962.95 14.41% 4.26%
The table and pie charts below represent the breakdown of MDC’s “Total Expenditures” into “PURCHASING
CONTRACTS” and “AGENCY PURCHASES”.
PURCHASING CONTRACTS AGENCY PURCHASES
MBE WBE NON M/WBE MBE WBE NON M/WBE
$4,593,425.35 $868,568.05 $18,079,091.90 $794,631.24 $722,897.42 $21,856,097.82
$23,541,085.30 $23,373,626.48
19.51%
3.69%
76.80%
PURCHASING CONTRACTS
MBE
WBE
NON M/WBE
3.40%
3.09%
93.51%
AGENCY PURCHASES
MBE
WBE
NON M/WBE
40
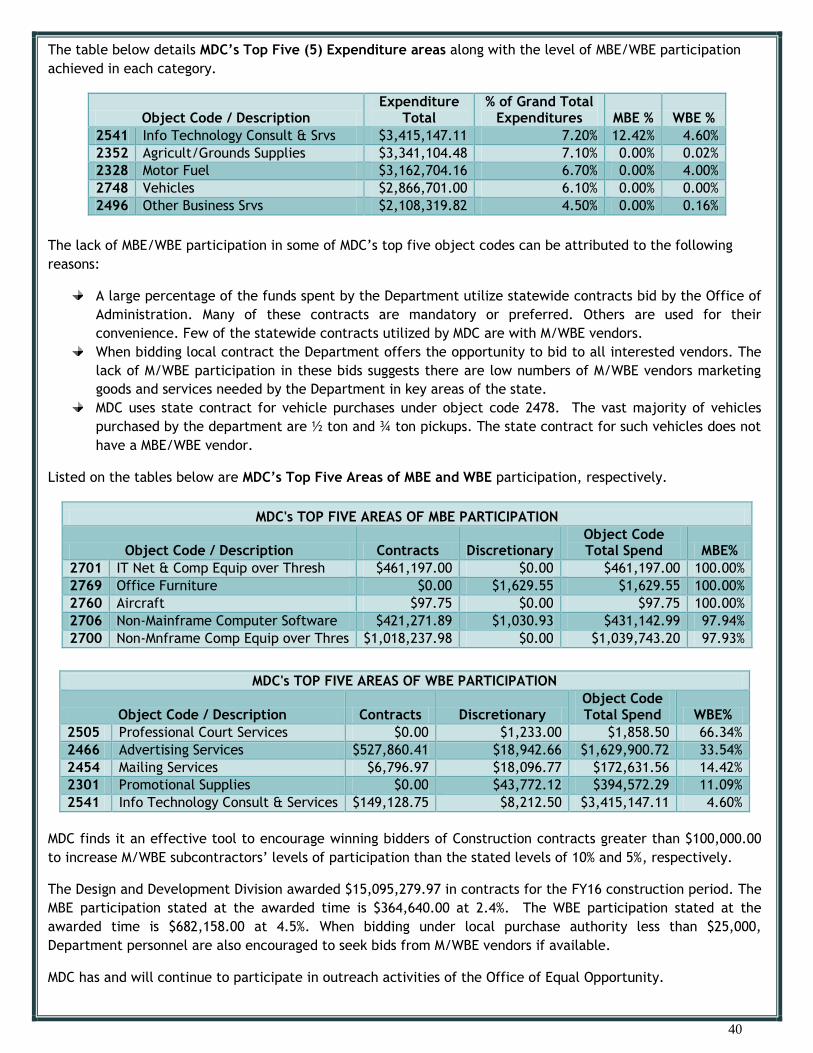
The table below details MDC’s Top Five (5) Expenditure areas along with the level of MBE/WBE participation
achieved in each category.
Object Code / Description Expenditure
Total % of Grand Total
Expenditures MBE % WBE %
2541 Info Technology Consult & Srvs $3,415,147.11 7.20% 12.42% 4.60%
2352 Agricult/Grounds Supplies $3,341,104.48 7.10% 0.00% 0.02%
2328 Motor Fuel $3,162,704.16 6.70% 0.00% 4.00%
2748 Vehicles $2,866,701.00 6.10% 0.00% 0.00%
2496 Other Business Srvs $2,108,319.82 4.50% 0.00% 0.16%
The lack of MBE/WBE participation in some of MDC’s top five object codes can be attributed to the following
reasons:
A large percentage of the funds spent by the Department utilize statewide contracts bid by the Office of
Administration. Many of these contracts are mandatory or preferred. Others are used for their
convenience. Few of the statewide contracts utilized by MDC are with M/WBE vendors.
When bidding local contract the Department offers the opportunity to bid to all interested vendors. The
lack of M/WBE participation in these bids suggests there are low numbers of M/WBE vendors marketing
goods and services needed by the Department in key areas of the state.
MDC uses state contract for vehicle purchases under object code 2478. The vast majority of vehicles
purchased by the department are ½ ton and ¾ ton pickups. The state contract for such vehicles does not
have a MBE/WBE vendor.
Listed on the tables below are MDC’s Top Five Areas of MBE and WBE participation, respectively.
MDC's TOP FIVE AREAS OF MBE PARTICIPATION
Object Code / Description Contracts Discretionary Object Code Total Spend MBE%
2701 IT Net & Comp Equip over Thresh $461,197.00 $0.00 $461,197.00 100.00%
2769 Office Furniture $0.00 $1,629.55 $1,629.55 100.00%
2760 Aircraft $97.75 $0.00 $97.75 100.00%
2706 Non-Mainframe Computer Software $421,271.89 $1,030.93 $431,142.99 97.94%
2700 Non-Mnframe Comp Equip over Thres $1,018,237.98 $0.00 $1,039,743.20 97.93%
MDC's TOP FIVE AREAS OF WBE PARTICIPATION
Object Code / Description Contracts Discretionary Object Code Total Spend WBE%
2505 Professional Court Services $0.00 $1,233.00 $1,858.50 66.34%
2466 Advertising Services $527,860.41 $18,942.66 $1,629,900.72 33.54%
2454 Mailing Services $6,796.97 $18,096.77 $172,631.56 14.42%
2301 Promotional Supplies $0.00 $43,772.12 $394,572.29 11.09%
2541 Info Technology Consult & Services $149,128.75 $8,212.50 $3,415,147.11 4.60%
MDC finds it an effective tool to encourage winning bidders of Construction contracts greater than $100,000.00
to increase M/WBE subcontractors’ levels of participation than the stated levels of 10% and 5%, respectively.
The Design and Development Division awarded $15,095,279.97 in contracts for the FY16 construction period. The
MBE participation stated at the awarded time is $364,640.00 at 2.4%. The WBE participation stated at the
awarded time is $682,158.00 at 4.5%. When bidding under local purchase authority less than $25,000,
Department personnel are also encouraged to seek bids from M/WBE vendors if available.
MDC has and will continue to participate in outreach activities of the Office of Equal Opportunity.

41
Department of Corrections Director: George Lombardi
The Missouri Department of Corrections (DOC) supervises and provides rehabilitative services to adult offenders
in correctional institutions and Missouri communities to enhance public safety. The goal of the DOC has always
been to enhance public safety through efficient supervision and effective rehabilitative services that are
provided to adult offenders. Programs offered to offenders by the Division of Probation and Parole, Missouri
Reentry Process, and Restorative Justice are intended to reduce recidivism while teaching offenders about
compassion and altruistic behavior. Organized as a separate department of state government by an act of the
legislature in 1981 and reorganized July 1, 1993, it is comprised of the Office of the Director and four divisions:
Adult Institutions Human Services
Probation and Parole Offender Rehabilitative Services
DOC’S PROCUREMENT PROCESS
The DOC’s procurement process is partly centralized and partly decentralized. Institutional and divisional
business managers have the authority to issue purchase orders or conduct p-card transactions for
expenditures utilizing OA-Division of Purchasing established contracts, for expenditures utilizing DOC contracts
established under local authority, and for expenditures which do not exceed the $3000 annual bid threshold,
either individually or cumulatively. All non-contract expenditures which are $24,999 and under annual
thresholds, either individually or cumulatively, are bid by the DOC purchasing office, unless the purchasing office
delegates the authority to conduct the bids back to the institution/division business manager. The purchasing
office will only delegate authority back to the business managers for one-time commodity purchases. Any
expenditure that is ongoing or that includes installation or a service will be bid by the purchasing office.
Department policy also requires that all bids, whether formal or informal, be written bids, with the exception of
bulk fuel and emergency purchases. Bulk fuel and emergency purchases may utilize telephone quotes.
DOC’S MBE/WBE EXPENDITURES
An analysis of the department’s expenditures reveals the following expenses incurred during FY16 on the table
below. “Net Expenditures” represent DOC’s “Total Expenditures” of $223,825,524.45 minus “Excludable
Expenditures” of $147,095,607.98.
MBE EXPENDITURES
WBE EXPENDITURES
NON-M/WBE EXPENDITURES
NET EXPENDITURES MBE % WBE %
$23,945,258.90 $9,258,212.94 $190,622,052.61 $76,729,916.47 31.21% 12.07%
The table and pie charts below represent the breakdown of DOC’s “Total Expenditures” into “PURCHASING
CONTRACTS” and “AGENCY PURCHASES”.
PURCHASING CONTRACTS AGENCY PURCHASES
MBE WBE NON M/WBE MBE WBE NON M/WBE
$23,680,956.69 $8,929,645.86 $160,573,592.27 $264,302.21 $328,567.08 $30,048,460.34
$193,184,194.82 $30,641,329.63
12.26%
4.62%
83.12%
PURCHASING CONTRACTS
MBE
WBE
NON M/WBE
0.86%
1.07%
98.07%
AGENCY PURCHASES
MBE
WBE
NON M/WBE

42
The table below details DOC’s Top Five (5) Expenditure areas during FY16 along with the level of MBE/WBE
participation achieved in each category:
Object Code/Description Expenditure Total % of Grand Total
Expenditures MBE % WBE %
2433 Medical & Dental Services $146,138,239.72 65.30% 0.00% 0.00%
2337 Food & Dietary Supplies $28,367,823.52 12.67% 0.00% 1.90%
2544 Other Professional Serv $12,729,102.71 5.69% 11.00% 0.21%
2298 Manufacturing Supplies $11,348,974.37 5.07% 31.00% 0.15%
2373 Other Specific Use Supplies $2,874,982.10 1.28% 3.72% 1.28%
The primary impediment for DOC’s low M/WBE participation rates is a lack of certified vendors in the
appropriate commodities and services that have the capability to service statewide or in the geographic areas
where DOC facilities are located. A search of the Office of Equal Opportunity Certified M/WBE Directory shows
that there are no certified MBE wholesale food distributors and only one certified WBE wholesale food
distributor, which is currently being utilized. The category of other professional services is broad, however,
checking some of the services that fall within this category, there are no certified MBE and only one certified
WBE pest control services vendor. This vendor is located in the extreme southwest part of the state where the
DOC has no facilities. There are no certified M/WBE vendors to provide sex offender treatment services or
substance abuse treatment services.
Listed on the tables below are DOC’s Top Five Areas of MBE and WBE participation, respectively.
DOC's TOP FIVE AREAS OF MBE PARTICIPATION
Object Code / Description Contracts Discretionary Object Code Total Spend MBE%
2256 Printing and Binding Supp $7,992.96 $0.00 $9,060.52 88.21%
2583 Comp Sfw Maint, Lic & Subsc $71,773.97 $0.00 $83,922.53 85.52%
2805 Other Specific Use Equip $95,644.20 $0.00 $329,264.65 29.04%
2250 Office Supplies $294,139.42 $1,248,877.00 $1,543,016.42 19.06%
2259 Photographic Supplies $3,002.24 $0.00 $19,541.14 15.36%
DOC's TOP FIVE AREAS OF WBE PARTICIPATION
Object Code / Description Contracts Discretionary Object Code Total Spend WBE%
2574 Electrical rep & Maint Serv $0.00 $4,482.88 $25,541.67 17.55%
2433 Medical and Dental Services $0.00 $7,564,171.07 $146,138,239.72 5.18%
2373 Other Specific Use Supplies $28,282.75 $8,694.24 $2,874,982.10 1.28%
2337 Food & Dietary Supplies $540,644.14 $182.60 $28,367,467.66 1.90%
2544 Other Professional Services $12,008.56 $15,798.26 $12,729,102.71 0.21%
The DOC will continue to utilize Office of Equal Opportunity’s M/WBE Directory in preparing a bidders list for
all solicitations. As certified M/WBE vendors are found that can provide commodities or services to the DOC,
this information will be communicated to the institution/division business managers for possible utilization for
local, under threshold purchases.
The DOC has been using the MissouriBUYS vendor list to obtain bidder’s lists for all solicitations, even if the
solicitation is not posted on MissouriBUYS. Since this practice has begun, there has been a dramatic increase in
the number of potential bidders to whom the DOC is sending bid opportunity notices. In one recent solicitation
for a repair service, the notice of bid opportunity was sent to fifty potential bidders.

43
Department of Economic Development Director: Mike Downing
The Department of Economic Development (DED) administers a wide array of programs designed to enhance
Missouri's economy in the 21st Century. It is comprised of agencies that execute statutory requirements and
department policy in the areas of community, economic and workforce development. DED’s divisions include:
Administrative Services Business & Community Services Energy
MO Arts Council Mo Housing Development Commission Public Service Commission
Tourism Workforce Development
DED’S PROCUREMENT PROCESS
Authority to procure goods or services costing less than $3,000 is delegated to the Department by the Office of
Administration - Division of Purchasing. Procurement of goods or services from a single vendor, costing $3,000 or
more but less than $25,000 in aggregate in any one fiscal year will generally require acquisition by informal bid.
Authority to procure goods or services costing more than $3,000 but less than $25,000 is delegated to the
department by the Office of Administration - Division of Purchasing. Exceptions include goods or services that are
already on statewide contract such as computers, copiers, fax and other equipment. Some services must be
acquired through statewide contract or may be acquired from governmental entities. Printing must be acquired
from OA. Printing and some items must be acquired through Missouri Vocational Enterprises (MVE). Procurement
of goods or services from a single vendor, costing $25,000 or more in aggregate in any one fiscal year requires a
formal bid. A formal bid will generally be conducted by the Office of Administration’s Division of Purchasing.
DED’S MBE/WBE EXPENDITURES
An analysis of the department’s expenditures reveals the following expenses incurred during FY16 on the table
below. “Net Expenditures” represent DED’s “Total Expenditures” of $23,982,690.34 minus “Excludable
Expenditures” of $4,146,916.33.
MBE EXPENDITURES
WBE EXPENDITURES
NON-M/WBE EXPENDITURES
NET EXPENDITURES MBE % WBE %
$2,951,535.19 $1,724,386.92 $19,306,768.23 $19,835,774.01 14.88% 8.69%
The table and pie charts below represent the breakdown of DED’s “Total Expenditures” into “PURCHASING
CONTRACTS” and “AGENCY PURCHASES”.
PURCHASING CONTRACTS AGENCY PURCHASES
MBE WBE NON M/WBE MBE WBE NON M/WBE
$2,865,860.65 $1,640,862.71 $15,284,572.71 $85,674.54 $83,524.21 $4,022,195.52
$19,791,296.07 $4,191,394.27
14.48%
8.29%
77.23%
PURCHASING CONTRACTS
MBE
WBE
NON M/WBE
2.04%
1.99% 95.96%
AGENCY PURCHASES
MBE
WBE
NON M/WBE

44
The table below details DED’s Top Five (5) Expenditures areas during FY16 along with the level of MBE/WBE
participation achieved in each category:
Object Code / Description Expenditure Total % of Grand Total
Expenditures MBE % WBE % 2466 Advertising Services $14,923,788.94 62.00% 0% 1.91%
2544 Other Professional Serv $4,532,063.36 18.80% 0% 2.00%
3412 Program Reimbursements $1,532,042.61 6.40% 0% 0.00%
2496 Other Business Services $603,243.71 2.50% 0% 0.63%
2583 Comp Software Maint, Lic, & Subsc $458,313.33 1.90% 2.99% 0.00%
Some possible impediments for low M /WBE participation rates can be attributed to the following:
Contracts under the Division of Workforce Development deal with job development and career readiness
activities and may have little or no M/WBE participation.
Contracts relating to the provision of services such as analysis for rate cases and for analyzing
participants coming through the MO Career Center system have very low M/WBE participation rates.
Listed on the tables below are DED’s Top Five Areas of MBE and WBE participation, respectively.
DED's TOP FIVE AREAS OF MBE PARTICIPATION
Object Code / Description Contracts Discretionary Object Code Total Spend MBE%
2700 Non Mnframe Comp Equip Over Thresh $184,219.52 $0.00 $184,219.52 100.00%
2580 Computer Hardware Repair & Maint $30,338.32 $0.00 $30,338.32 100.00%
2686 Under Thresh Non MT Comp Sfw $7,959.96 $0.00 $7,959.96 100.00%
2701 IT Net & Com Equip Over Thresh $2,217.30 $0.00 $2,217.30 100.00%
2685 Under Thresh Comp Equip $9,412.02 $0.00 $9,591.98 98.12%
DED's TOP FIVE AREAS OF WBE PARTICIPATION
Object Code / Description Contracts Discretionary Object Code Total Spend WBE%
2724 Photographic Equipment $0.00 $6,831.00 $6,831.00 100.00%
2421 Answering Charges $0.00 $166.20 $181.20 91.72%
2253 Recognition Awards $0.00 $1,598.03 $2,642.00 60.48%
2301 Promotional Supplies $0.00 $2,934.26 $21,536.01 13.62%
2505 Professional Court Services $796.35 $6,105.95 $54,877.90 12.57%
DED currently sends out emails to Procurement staff with official procurement guidelines bi-annually and
provides training for staff authorized to use P-cards. DED's M/WBE utilization is higher through the use of
Contracts and Purchases set up by OA Purchasing. Approximately 87 percent of DED's purchases are acquired
through Purchasing Contracts. Less than 14 percent of DED's expenditures are discretionary expenditures. DED
utilizes and will continue to utilize the OEO Directory when searching for vendors for discretionary expenditures.

45
Department of Elementary & Secondary Education Commissioner: Dr. Margie Vandeven
The Department of Elementary and Secondary Education (DESE) is the administrative arm of the State Board of
Education. It is primarily a department that works with educators, legislators, government agencies, community
leaders and citizens to maintain a strong public education system. Through its statewide school-improvement
activities and regulatory functions, the Department strives to assure that all citizens have access to high-quality
public education. The Department’s responsibilities range from early childhood to adult education services, and is
carried out under Financial and Administrative Services and Learning Services, which include:
Adult Learning & Rehab Services College & Career Readiness Educator Quality Quality Schools
Data System Management
DESE’S PROCUREMENT PROCESS
The Department has a hybrid procurement process. There is a centralized procurement section that processes all
procurement requests and manages the Department’s contracting system. The Department has decentralized
purchasing with Vocational Rehabilitation/Disability Determinations, the Missouri School for the Deaf, and the
Missouri Assistive Technology. Formal bids are not required for purchases under $3,000. Statewide contracts are
utilized when available for such purchases; otherwise, buyers search the OEO directory for vendors who can
provide the goods or services. For purchases between $3,000 and $25,000 formal bids are sent out to three
vendors. Statewide contracts are also utilized in these instances.
DESE’S MBE/WBE EXPENDITURES
An analysis of the department’s expenditures reveals the following expenses incurred during FY16 on the table
below. “Net Expenditures” represent DESE’s “Total Expenditures” of $52,697,347.50 minus “Excludable
Expenditures” of $1,214,971.87.
MBE EXPENDITURES
WBE EXPENDITURES
NON-M/WBE EXPENDITURES
NET EXPENDITURES MBE % WBE %
$963,019.10 $3,339,349.68 $48,394,978.72 $51,482,375.63 1.87% 6.49%
The table and pie charts below represent the breakdown of DESE’s “Total Expenditures” into “PURCHASING
CONTRACTS” and “AGENCY PURCHASES”.
PURCHASING CONTRACTS AGENCY PURCHASES
MBE WBE NON M/WBE MBE WBE NON M/WBE
$938,453.29 $2,404,704.26 $39,596,030.73 $24,565.81 $934,645.42 $8,798,947.99
$42,939,188.28 $9,758,159.22
2.19%
5.60% 92.21%
PURCHASING CONTRACTS
MBE
WBE
0.25%
9.58%
90.17%
AGENCY PURCHASES
MBE
WBE
NON M/WBE

46
The table below details DESE’s Top Five (5) Expenditure areas along with the level of MBE/WBE participation
achieved in each category.
Object Code / Description Expenditure Total % of Grand Total
Expenditures MBE % WBE %
2514 Program Consultant Services $17,803,997.29 33.80% 0.00% 0.00%
2520 Educational Services $16,299,249.06 31.00% 0.00% 18.28%
2544 Other Professional Services $13,295,021.82 25.00% 0.00% 31.00%
2991 Agency Provided Food $583,347.45 1.10% 000% 0.00%
2250 Office Supplies $522,330.16 1.00% 4.43% 2.48%
The following impediments can be attributed to DESE’s low M/WBE participation rates in the top five expenditures:
2514-The majority of the expenditures in this group are bid through OA Purchasing contracts for the
Assessment, First Steps, and Virtual Schools programs, and for the review of our school districts school
food and nutrition programs. These bids have low percentages for M/WBE.
2520-The majority of these services are bid through a Special delegating Authority (SPA) that is received
from OA for Occupational Therapy, Physical Therapy, Speech Therapy, Nursing Services, etc.
$2,415,512.73 of these expenditures are with individuals not certified through the OEO M/WBE program.
2544-The majority of expenditures in this area are bid through OA. These include transportation for our
School for the Severely Disabled, Deaf, and Blind children. In addition, we use the statewide contracts
for interpreter services.
2991-Of the total expenditures, $405,192.39 was made using OA Purchasing hotels statewide contract
for food associated with conferences provided for school personnel. Other purchases were for smaller
workshops or committee meetings that we have organized with school personnel for either mandated
federal or state meetings or for work groups. One of the challenges is that OEO’s M/WBE directory has
very few certified vendors that provide this service.
Listed on the tables below are DESE’s Top Five Areas of MBE and WBE participation respectively.
DESE's TOP FIVE AREAS OF MBE PARTICIPATION
Object Code / Description Contracts Discretionary Object Code Total Spend MBE%
2277 Other Admin Supplies $279.55 $0.00 $279.55 100.00%
2583 Computer Software Maint, Lic $1,456.00 $0.00 $2,126.00 68.48%
2724 Photographic Equipment $15,873.69 $0.00 $33,127.84 47.91%
2712 Educational Equipment $10,076.56 $0.00 $53,552.06 18.81%
2691 Under Threshold Office Equipment $665.82 $0.00 $13,180.26 5.05%
DESE's TOP FIVE AREAS OF WBE PARTICIPATION
Object Code / Description Contracts Discretionary Object Code Total Spend WBE%
2469 Temporary Personnel $51,101.51 $8,436.85 $89,025.54 66.87%
2445 Rehabilitative Services $12,787.50 $0.00 $39,086.00 32.71%
2592 Communications Equipment $360.00 $1,066.95 $4,852.25 29.40%
2691 Under Threshold Office Equip $3,845.00 $0.00 $13,180.26 29.17%
2454 Mailing Services $5,000.00 $0.00 $21,713.49 23.02%
Some measures in place to increase or improve on DESE’s M/WBE participation rates include:
Continuing with its efforts to promote M/WBE certification with OT/PT/Speech vendors.
Work with OEO to find possible ways to certify individuals into the MissouriBUYS system.
Continuing to encourage the use of the OEO directory with DESE staff.

47
Department of Health and Senior Services Acting Director: Peter Lyskowski
The Department of Health and Senior Services (DHSS) works to improve the health and quality of life for
Missourians of all ages. The Department is the state public health agency and is also charged with the oversight
of programs for seniors and adults with disabilities. In carrying out this critical and expansive mission, DHSS
personnel operate throughout the state on a 24/7 basis. Principal responsibilities of the department include:
Preparing for and responding to health-related emergencies; preventing and reducing the burden of chronic
disease; preventing and controlling communicable and genetic diseases; protecting seniors and adults with
disabilities by investigating and intervening in cases of abuse, neglect and financial exploitation; providing an
array of long-term care options that enable seniors and persons with disabilities to live in the least restrictive
care setting; and protecting citizens through regulation and inspection of health care and child care facilities.
DHSS houses the following divisions:
Community & Public Health
Regulation & Licensure
Senior & Disability Services
Departmental Support Services
DHSS’s PROCUREMENT PROCESS
The Department of Health and Senior Services utilizes a centralized purchasing system while complying with
Chapter 34, RSMo. Any purchases less than $3,000 within a 12-month period can be directly purchased from a
vendor without completing the competitive bid process. All other purchases exceeding $3,000 up to $24,999.99
must be established by one of the following processes: competitively bid, single feasible source, direct contract,
or under a special delegation of authority granted by the Office of Administration, Division of Purchasing to the
Department.
DHSS’s MBE/WBE EXPENDITURES
An analysis of the Department’s expenditures reveals the following expenses incurred during FY16 on the table
below. “Net Expenditures” represent DHSS’s “Total Expenditures” of $16,869,385.56 minus “Excludable
Expenditures” of $8,366,589.72.
MBE EXPENDITURES
WBE EXPENDITURES
NON-M/WBE EXPENDITURES
NET EXPENDITURES MBE % WBE %
$267,234.24 $503,786.06 $16,098,365.26 $8,502,795.84 3.14% 5.92%
The table and pie charts below represent the breakdown of DHSS’s “Total Expenditures” into “PURCHASING
CONTRACTS” and “AGENCY PURCHASES”.
PURCHASING CONTRACTS AGENCY PURCHASES
MBE WBE NON M/WBE MBE WBE NON M/WBE
$228,405.23 $333,269.84 $11,266,164.21 $38,829.01 $170,516.22 $4,832,201.05
$11,827,839.28 $5,041,546.28
1.93%
2.82% 95.25%
PURCHASING CONTRACTS
MBE
WBE
NON M/WBE
0.77%
3.38%
95.85%
AGENCY PURCHASES
MBE
WBE
NON M/WBE

48
The table below details DHSS’s Top Five (5) Expenditure areas along with the level of MBE/WBE participation
achieved in each category.
Object Code / Description Expenditure Total % of Grand Total
Expenditures MBE % WBE %
2280 Laboratory Supplies $4,891,214.34 28.90% 0.00% 0.00%
2466 Advertising Services $2,146,307.22 12.70% 0.29% 0.62%
2451 Other Health Services $1,526,408.96 9.00% 0.00% 0.00%
2457 Express & Freight Services $894,658.14 5.30% 0.00% 17.92%
3452 Home & Community Based Srvcs $847,868.70 5.00% 0.00% 15.00%
The following impediments can be attributed to DHSS’s low M/WBE participation rates in the top five expenditures:
2280 – Laboratory supplies are specialized items that are procured through the competitive bid process
or single feasible source process. There are a limited number of M/WBE vendors available to provide the
supplies.
2466 – Advertising services are procured through the statewide contracts established by the Office of
Administration, Division of Purchasing.
2451 – Other Health Services are specialized services procured through the competitive bid process or
single feasible source process. There are a limited number of M/WBE vendors available to provide these
services.
2457 – Express & Freight Services are procured through the competitive bid process and through the
statewide contract.
3452 – Home & Community Based Services are open to all providers that meet the requirements of the
program to provide the services. The contracts are established under the Expenditure Registration
System (ERS).
Listed on the tables below are DHSS’s Top Five Areas of MBE and WBE participation, respectively.
DHSS's TOP FIVE AREAS OF MBE PARTICIPATION
Object Code / Description Contracts Discretionary Object Code Total Spend MBE%
2721 Electronic Equipment $3,182.64 $0.00 $3,182.64 100.00%
2724 Photographic Equipment $4,280.32 $0.00 $6,120.31 69.93%
2376 Information Technology Supplies $14,615.52 $21.05 $25,042.48 58.27%
2250 Office Supplies $193,812.23 $1,889.12 $648,858.68 30.16%
2466 Advertising Services $0.00 $6,400.00 $2,146,307.22 0.29%
DHSS's TOP FIVE AREAS OF WBE PARTICIPATION
Object Code / Description Contracts Discretionary Object Code Total Spend WBE%
2469 Temporary Personnel Services $30,417.76 $0.00 $38,038.25 79.96%
2457 Express & Freight Services $160,833.50 $425.25 $894,658.14 17.92%
3452 Home & Community Based Services $0.00 $127,193.19 $847,868.70 15.00%
2544 Other Professional Services $27,050.92 $283.40 $615,674.35 4.43%
2466 Advertising Services $12,331.54 $1,000.00 $2,146,307.22 0.62%
Some measures in place to increase or improve on DESE’s M/WBE participation rates include:
Continuing to ensure procurement staff is utilizing the OEO M/WBE directory to identify vendors for
goods/services less than $3,000 that do not require a competitive bid process.
Making every feasible effort to increase the percentage of goods and services procured from M/WBE
vendors by providing training opportunities for procurement staff.

49
Department of Higher Education Commissioner: Zora Mulligan
The Missouri Department of Higher Education (MDHE) serves as the administrative arm of the Coordinating Board
for Higher Education (CBHE). The CBHE appoints the Commissioner of Higher Education to head the MDHE and
carry out administrative responsibilities to achieve the CBHE’s desired goals for the state system of higher
education. This higher education system serves more than 387,000 students through 13 public four-year
universities, 20 public two-year colleges, one public two-year technical college, 25 independent colleges and
universities, and 159 proprietary and private career schools. MDHE carries out its mission through six different
divisions which include:
Coordination Administration Academic Affairs Fiscal Affairs & Operations
Missouri Student Loan Group Student Financial Assistance & Outreach Proprietary Certification
MDHE’S PROCUREMENT PROCESS
The Department of Higher Education follows state purchasing guidelines when procuring goods and services. All
purchases require an approved purchase requisition prior to purchase; there are spending limits where additional
approvals are required. MBE/WBE vendors are offered opportunities to provide quotes or bids, when such vendors
are certified with the Office of Equal Opportunity. The Department’s local purchase authority allows for goods
and service under $3,000 to be purchased without contracts in place, although price quotes are obtained
informally for the best price. Goods and services between $3,000 and $24,999 require a price agreement entered
by the Department and $25,000 or higher are submitted to the Division of Purchasing for bidding. Exempt object
codes do not require use of a competitive bid process. Agency staff is encouraged to utilize the M/WBE directory
when considering their purchasing needs. However, many of the off-contract items purchased by the agency are
particularly specialized to the agency’s needs and there are no M/WBE vendors available for these goods/services.
MDHE’S MBE/WBE EXPENDITURES
An analysis of the department’s expenditures reveals the following expenses incurred during FY16 on the table
below. “Net Expenditures” represent MDHE’s Total Expenditures of $7,283,872.43 minus Excludable
Expenditures of $ $7,085,621.00.
MBE EXPENDITURES
WBE EXPENDITURES
NON-M/WBE EXPENDITURES
NET EXPENDITURES MBE % WBE %
$5,000.00 $45,687.33 $7,233,185.10 $198,251.43 2.52% 23.05%
The table and pie charts below represent the breakdown of MDHE’s “Total Expenditures” into “PURCHASING
CONTRACTS” and “AGENCY PURCHASES”.
PURCHASING CONTRACTS AGENCY PURCHASES
MBE WBE NON M/WBE MBE WBE NON M/WBE
$0.00 $1,562.04 $7,1162,007.89 $211.01 $45,638.34 $74,453.15
$7,163,569.93 $120,302.50
0.02%
0.00%
99.98%
PURCHASING CONTRACTS
MBE WBE NON M/WBE
0.18%
37.94%
61.89%
AGENCY PURCHASES
MBE
WBE
NON M/WBE

50
The table below details MDHE’s Top Five (5) Expenditure areas along with the level of MBE/WBE participation
achieved in each category.
Object Code/ Description Expenditures Total % of Grand Total
Expenditures MBE% WBE%
2544 Other Professional Srvs $7,051,588.77 96.81% 0.00% 0.00%
2460 Printing & Binding Srvs $89,765.00 1.23% 0.00% 3.98%
2499 Account & Auditing Srvs $43,000.00 0.59% 11.63% 0.00%
2301 Promotional Supplies $33,480.45 0.45% 0.00% 98.45%
2991 Agency Provided Food $18,802.63 0.25% 0.00% 0.00%
The following impediments can be attributed to MDHE’s low M/WBE participation rates in the top five expenditures:
Contracts and Purchases set up by OA Purchasing for the MDHE are usually for very specific products and
services for the Student Loan Program in which there are limited M/WBE vendors available. This is
particularly true with the loan servicing contract which is 96% of all dollars spent by MDHE for goods and
services.
2544 & 2991 – Limited number of certified M/WBEs that provide the services needed particularly in
Student Loans Administration. This is an OA Purchasing bid item. No certified M/WBEs were found in
OEO’s database for local catering services. Both Accounting and Auditing Services and Promotional
Supplies exceeded the department’s goals for M/WBE participation.
Listed on the tables below are MDHE’s Top Areas of MBE and WBE participation, respectively.
MDHE's TOP AREA OF MBE PARTICIPATION
Object Code / Description Contracts Discretionary Object Code Total Spend MBE%
2499 Account & Auditing Services $5,000.00 $0.00 $43,000.00 11.63%
MDHE's TOP FIVE AREAS OF WBE PARTICIPATION
Object Code / Description Contracts Discretionary Object Code Total Spend WBE%
2301 Promotional Supplies $0.00 $32,962.00 $33,480.45 98.45%
2496 Other Business Services $180.00 $0.00 $287.75 62.55%
2250 Office Supplies $8,653.84 $0.00 $16,130.54 53.64%
2691 Under Threshold-Office Furn $241.49 0.00 $2,124.87 11.36%
2460 Printing & Binding Services $3,570.00 $0.00 $89,765.00 3.97%
MDHE will continue to make the following improvements in its efforts to increase MBE and WBE participation
expenditures:
A link to the OEO’s M/WBE Certified Vendors database will be added to the purchase requisition template
used by MDHE staff as encouragement to seek out M/WBE vendors when purchasing goods and services.
We will also add a check box to the requisition for the staff to indicate that there is either no acceptable
vendor in the M/WBE database that they can use or that the non-M/WBE vendor they have chosen must
be used to meet their specific needs. Specific language will be added to procedures that require review
and use of qualified Missouri certified vendors in all bid and quote requests.
Verification will be monitored by maintaining a record of quotes obtained for applicable purchase
opportunities.
In addition, MDHE will implement annual staff procurement training. The most attention will be targeted
towards the largest expenditure areas; however all purchases will be targeted no matter how small the
amount.
MDHE will continue to work with the OEO to recruit more MBEs and WBEs to become certified by the OEO
Certification Program that could provide some of the services and products the Department procures.
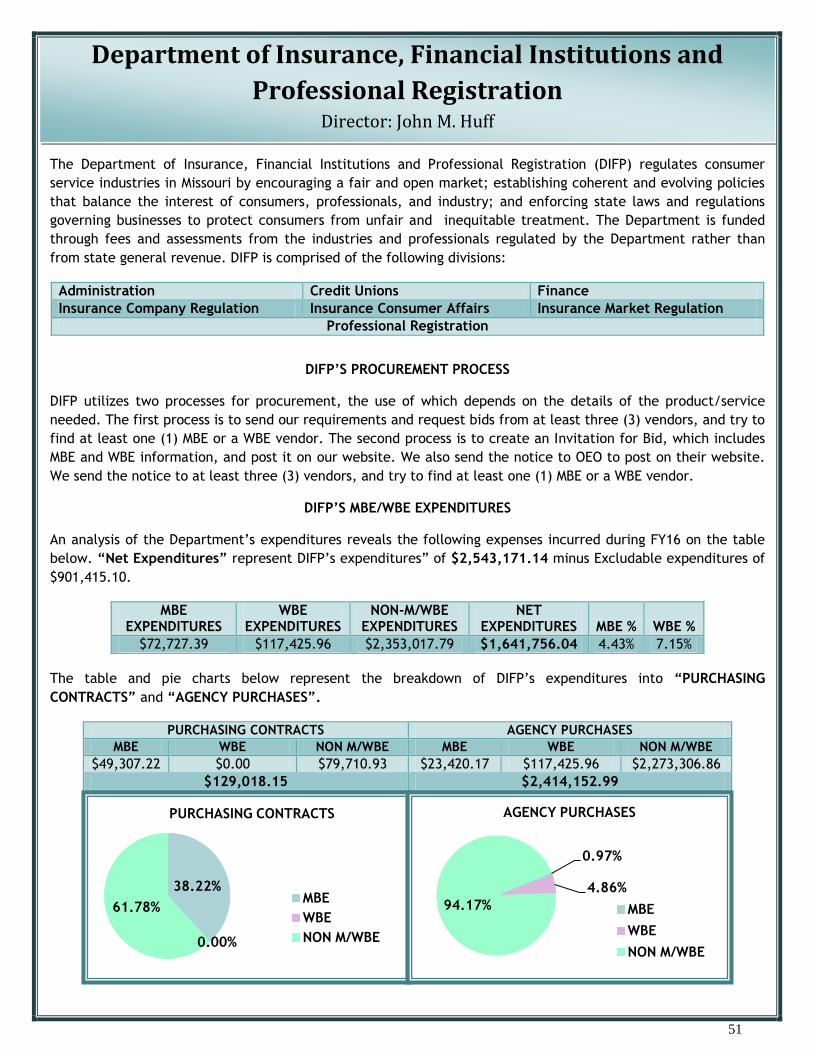
51
Department of Insurance, Financial Institutions and
Professional Registration Director: John M. Huff
The Department of Insurance, Financial Institutions and Professional Registration (DIFP) regulates consumer
service industries in Missouri by encouraging a fair and open market; establishing coherent and evolving policies
that balance the interest of consumers, professionals, and industry; and enforcing state laws and regulations
governing businesses to protect consumers from unfair and inequitable treatment. The Department is funded
through fees and assessments from the industries and professionals regulated by the Department rather than
from state general revenue. DIFP is comprised of the following divisions:
Administration Credit Unions Finance
Insurance Company Regulation Insurance Consumer Affairs Insurance Market Regulation
Professional Registration
DIFP’S PROCUREMENT PROCESS
DIFP utilizes two processes for procurement, the use of which depends on the details of the product/service
needed. The first process is to send our requirements and request bids from at least three (3) vendors, and try to
find at least one (1) MBE or a WBE vendor. The second process is to create an Invitation for Bid, which includes
MBE and WBE information, and post it on our website. We also send the notice to OEO to post on their website.
We send the notice to at least three (3) vendors, and try to find at least one (1) MBE or a WBE vendor.
DIFP’S MBE/WBE EXPENDITURES
An analysis of the Department’s expenditures reveals the following expenses incurred during FY16 on the table
below. “Net Expenditures” represent DIFP’s expenditures” of $2,543,171.14 minus Excludable expenditures of
$901,415.10.
MBE EXPENDITURES
WBE EXPENDITURES
NON-M/WBE EXPENDITURES
NET EXPENDITURES MBE % WBE %
$72,727.39 $117,425.96 $2,353,017.79 $1,641,756.04 4.43% 7.15%
The table and pie charts below represent the breakdown of DIFP’s expenditures into “PURCHASING
CONTRACTS” and “AGENCY PURCHASES”.
PURCHASING CONTRACTS AGENCY PURCHASES
MBE WBE NON M/WBE MBE WBE NON M/WBE
$49,307.22 $0.00 $79,710.93 $23,420.17 $117,425.96 $2,273,306.86
$129,018.15 $2,414,152.99
38.22%
0.00%
61.78%
PURCHASING CONTRACTS
MBE
WBE
NON M/WBE
0.97%
4.86%
94.17%
AGENCY PURCHASES
MBE
WBE
NON M/WBE

52
The table below details DIFP’s Top Five (5) Expenditure areas along with the level of MBE/WBE participation
achieved in each category.
Object Code / Description Expenditure Total % of Grand Total
Expenditures MBE % WBE %
2502 Attorney Services $728,471.45 28.60% 0.00% 0.00%
2544 Other Professional Services $584,976.19 23.00% 0.02% 0.24%
2250 Office Supplies $151,938.88 5.90% 10.76% 8.90%
2505 Professional Court Services $140,999.40 5.50% 0.00% 49.82%
2748 Vehicles $113,553.30 4.50% 12.93% 0.00%
The following impediments can be attributed to DIFP’s low M/WBE participation rates in the top five expenditures:
2502 – DIFP could not find any certified MBE/WBE vendors capable of providing the specific expertise in
administrative law needed for this type of work.
2544 – DIFP utilized mandatory state contracts with no certified professionals available.
2505 – DIFP utilized mandatory state contracts with no MBE certified professionals available.
Listed on the tables below are DIFP’s Top Five Areas of MBE and WBE participation, respectively.
DIFP's TOP FIVE AREAS OF MBE PARTICIPATION
Object Code / Description Contracts Discretionary Object Code Total Spend MBE%
2748 Vehicles $14,687.87 $0.00 $113,553.30 12.93%
2313 Custodial Supplies $0.00 $111.72 $976.95 11.43%
2250 Office Supplies $1,296.15 $15,053.99 $151,938.88 10.76%
2376 Information Technology Supplies $156.41 $764.66 $10,051.74 9.16%
2691 Under Thresh-Office Equip & Furn $0.00 $1,965.50 $42,959.46 4.57%
DIFP's TOP FIVE AREAS OF WBE PARTICIPATION
Object Code / Description Contracts Discretionary Object Code Total Spend WBE%
2469 Temporary Personnel Services $6,438.45 $0.00 $6,619.16 97.26%
2118 Out-of-State Comm Tran-Travel Agy $0.00 $10,539.11 $18,172.20 57.99%
2772 Office Equipment $0.00 $4,190.00 $7,414.00 56.51%
2505 Professional Court Services $0.00 $70,254.65 $140,999.40 49.82%
2400 Telecommunications Supplies $0.00 $1,230.62 $3,361.12 36.61%
DIFP will continue to make the following improvements in its efforts to increase MBE and WBE participation
expenditures:
Work with OA-Purchasing to identify and utilize MBE/WBE vendors on statewide contracts. Frequently check OEO’s website to solicit bid responses from vendors that are OEO MBE or WBE certified. Solicit bids from vendors that have submitted bids or obtained contracts in the past and are known MBE
or WBE vendors. Post bids on the department’s webpage, send notices of bid opportunity to OEO to post on webpage,
advertise in newspapers when needed, and send notices of bid opportunity to applicable vendors. Work with OEO to certify MBE/WBE vendors DIFP contracts with that are certified in other states but not
with OEO.
Participate in OEO’s outreach activities.

53
Department of Labor and Industrial Relations Director: Ryan McKenna
The Department of Labor & Industrial Relations (DOLIR) promotes economic security and a safe and healthy
workplace. The DOLIR protects wage earners and individuals against discrimination by improving working
conditions, enforcing labor and anti-discrimination laws and helping those unemployed or injured on the job.
Director & Staff Administration Employment Security Labor Standards
MO Commission on Human Rights State Board of Mediation Labor & Industrial Relations Commission
Workers’ Compensation
DOLIR’S PROCUREMENT PROCESS
The DOLIR utilizes a centralized purchasing system. Procurement staff utilizes established OA Purchasing
contracts, DOLIR contracts, State Printing, and Missouri Vocational Enterprise for approved services/commodities
requested by department staff. The DOLIR has been given local procurement authority by the Department
Procurement Authority Delegation (DPAD) pursuant to section 34.100, RSMo, to establish department contracts
for cumulative cost, in a 12 month period, greater than $3,000.00 and less than $25,000.00 for
services/commodities.
Purchases may be made by procurement staff if cumulative cost is less than $3,000.00. Procurement staff
research OEO’s website for potential vendors to include for all DOLIR bid documentation when establishing
department contracts. Prior to making a purchase, procurement staff research OEO’s website for potential
vendors to include in a price quotation for purchases under $3,000.00.
DOLIR’S MBE/WBE EXPENDITURES
An analysis of the department’s expenditures reveals the following expenses incurred during FY16 on the table
below. “Net Expenditures” represent DOLIR’s “Total Expenditures” of $3,527,581.28 minus “Excludable
Expenditures” of $318,053.63.
MBE EXPENDITURES
WBE EXPENDITURES
NON-M/WBE EXPENDITURES
NET EXPENDITURES MBE % WBE %
$382,284.47 $664,286.18 $2,481,010.63 $3,209,527.65 11.91% 20.70%
The table and pie charts below represent the breakdown of DOLIR’s “Total Expenditures” into “PURCHASING
CONTRACTS” and “AGENCY PURCHASES”.
PURCHASING CONTRACTS AGENCY PURCHASES
MBE WBE NON M/WBE MBE WBE NON M/WBE
$239,016.13 $591,264.54 $2,159,406.81 $143,268.34 $73,021.64 $321,603.82
$2,989,687.48 $537,893.80
7.99%
19.78%
72.23%
PURCHASING CONTRACTS
MBE
WBE
NON M/WBE
26.64%
13.58% 59.79%
AGENCY PURCHASES
MBE
WBE
NON M/WBE

54
The table below details DOLIR’s Top Five (5) Expenditure areas along with the level of MBE/WBE participation
achieved in each category.
Object Code / Description Expenditure Total
% of Grand Total Expenditures MBE % WBE %
2705 Non Mnfrm Sftware Consult&Dev $992,719.96 28.10% 5.03% 4.14%
2541 Info Technology Consult & Srvs $488,838.47 13.85% 5.03% 4.15%
2544 Other Professional Serv $358,620.45 10.17% 0.00% 42.09%
2250 Office Supplies $212,978.39 6.00% 69.94% 12.58%
2514 Program Consultant Serv $202,500.00 5.74% 0.00% 0.00%
A possible impediment that could be attributed to the low MBE/WBE participation rates in Object Code 2514 –
Program Consultant Services is that a hundred percent was paid to the Center for Employment Security. This is a
Single Feasible Source Contract (SFS); therefore, the Department is restricted from looking for MBE/WBE vendors
to perform this service.
Listed on the tables below are DOLIR’s Top Five Areas of MBE and WBE participation, respectively.
DOLIR's TOP FIVE AREAS OF MBE PARTICIPATION
Object Code / Description Contracts Discretionary Object Code Total Spend MBE%
2313 Custodial Supplies $0.00 $501.41 $501.41 100.00%
2685 Under Threshold-Computer Equip $23,961.20 $0.00 $23,961.20 100.00%
2686 Under Thresh-Non Mnframe Computer Sftw $98,417.60 $0.00 $98,613.54 99.80%
2733 Other Electronic & Photographic Equip $4,484.48 $35.12 $4,519.60 99.22%
2691 Under Threshold-Office Equip & Furn $0.00 $5,066.49 $5,635.21 89.90%
DOLIR's TOP FIVE AREAS OF WBE PARTICIPATION
Object Code / Description Contracts Discretionary Object Code Total Spend WBE%
2700 Non Mnframe Comp Equip Over Thresh $167,326.45 $0.00 $167,326.45 100.00%
2706 Non Mnframe Computer Sftw $14,170.83 $0.00 $14,170.83 100.00%
2301 Promotional Supplies $0.00 $14,182.69 $14,191.77 99.93%
2583 Comp Sftw Maint, Lic, & Subscip Fees $184,002.23 $0.00 $188,502.23 97.61%
2580 Comp Hardware Rep and Maint $17,007.04 $0.00 $17,465.45 97.37%
DOLIR will continue to make the following improvements in its efforts to increase MBE and WBE participation
expenditures:
Seek more certified vendors in the following areas: transcription services, shredding services, actuarial
services and data entry services.
Request that OA Purchasing include MBE/WBE participation language/criteria in all bid
documents/contracts that OA Purchasing completes for the DOLIR.
Reach out to potential MBE/WBE vendors that the DOLIR encounters when purchasing
services/commodities that are not available on contract to help them become certified with OEO.
Participate in vendor fairs to promote OEO certification.

55
Department of Mental Health Director: Mark Stringer
The Department of Mental Health (DMH) was established as a cabinet-level state agency in 1974. The principal
missions for DMH include: (1) the prevention of mental disorders, developmental disabilities, substance abuse,
and compulsive gambling; (2) the treatment, habilitation, and rehabilitation of Missourians who have those
conditions; and (3) the improvement of public understanding and attitudes about mental disorders,
developmental disabilities, substance abuse, and compulsive gambling.
The seven-member Missouri Mental Health Commission serves as the principal policy advisory body to the
Department Director. DMH serves approximately 170,000 Missourians annually through state-operated facilities
and contracts with private organizations and individuals. DMH is comprised of the following divisions:
Division of Administrative Services Division of Behavioral Health
Division of Development Disabilities
DMH’S PROCUREMENT PROCESS
The Department of Mental Health uses a competitive bid process as prescribed by Chapter 34 RSMo and the
Office of Administration. Formal competitive bids are advertised in local publications and posted on the
agency’s Internet site. Under delegated authority from the Office of Administration, Division of Purchasing some
consumer services contracts are established via a noncompetitive process, which allows for consumer choice of
provider. Each Mental Health facility has the delegated authority to manage procurements up to a value of
$25,000. Approximately 90 percent of DMH expenditures occur at the facility level, with Central Office staff
providing direction, oversight and support. Facility procurements with a value of $25,000 or greater are
processed via the Office of Administration, Division of Purchasing.
DMH’S MBE/WBE EXPENDITURES
An analysis of the department’s expenditures reveals the following expenses incurred during FY16 on the table
below. “Net Expenditures” represent DMH’s “Total Expenditures” of $41,838,628.46 minus “Excludable
Expenditures” of $16,215,462.90.
MBE EXPENDITURES
WBE EXPENDITURES
NON-M/WBE EXPENDITURES
NET EXPENDITURES MBE % WBE %
$540,622.60 $277,884.61 $41,020,121.25 $25,623,165.56 2.11% 1.08%
The table and pie charts below represent the breakdown of DMH’s “Total Expenditures” into “PURCHASING
CONTRACTS” and “AGENCY PURCHASES”.
PURCHASING CONTRACTS AGENCY PURCHASES
MBE WBE NON M/WBE MBE WBE NON M/WBE
$413,556.30 $138,519.20 $28,064,498.90 $127,066.30 $139,365.41 $12,955,622.35
$28,616,574.40 $13,222,054.06
1.45%
0.48%
98.07%
PURCHASING CONTRACTS
MBE
WBE
NON M/WBE
0.96%
1.05%
97.98%
AGENCY PURCHASES
MBE
WBE
NON M/WBE

56
The table below details DMH’s Top Five (5) Expenditure areas along with the level of MBE/WBE participation
achieved in each category.
Object Code / Description Expenditure Total % of Grand Total
Expenditures MBE % WBE %
2289 Pharmaceutical Drugs $7,661,723.89 18.30% 0.00% 0.00%
2433 Medical & Dental Services $6,307,304.40 15.07% 0.00% 0.00%
2337 Food & Dietary Supplies $5,795,872.45 13.85% 0.00% 0.00%
2544 Other Professional Serv $2,998,504.53 7.20% 0.00% 1.72%
2706 Non-Mainframe Comp Sftw $2,228,098.00 5.30% 0.00% 0.00%
The top five areas listed above represent 60 percent of the total expenditures used for the MBE and WBE
utilization calculations. The bulk of these purchases are made from statewide contracts or are expenditures
related to direct services for DMH clients. DMH is faced with limited availability of MBE/WBE vendors for specific
types of human services and/or mental health services. Two of the largest expenditure areas include medical
and dental services and other professional services where the availability of MBE/WBE vendors is very
limited. Additionally, services provided by not-for-profit organizations account for a significant percentage of
DMH’s program expenditures.
Listed on the tables below are DMH’s Top Five Areas of MBE and WBE participation, respectively.
DMH's TOP FIVE AREAS OF MBE PARTICIPATION
Object Code / Description Contracts Discretionary
Object Code Total Spend MBE%
2685 Under Threshold Computer Equipment $92,580.53 $154.00 $92,580.53 100.00%
2686 Under Threshold Non MF Com SFW $92,751.75 $0.00 $93,351.75 99.35%
2547 Housekeep & Janitor Services $0.00 $33,745.73 $149,771.54 22.53%
2748 Vehicles $88,750.00 $53,290.00 $1,023,106.67 13.88%
2250 Office Supplies $38,820.40 $4,314.90 $1,027,155.06 4.19%
DMH's TOP FIVE AREAS OF WBE PARTICIPATION
Object Code / Description Contracts Discretionary Object Code Total Spend WBE%
2481 Food Services $0.00 $10,699.41 $29,625.66 36.11%
2784 Food Service Equipment $52,781.00 $41,366.80 $308,589.50 30.50%
2547 Housekeep & Janitor Services $0.00 $11,809.00 $149,771.54 7.88%
2250 Office Supplies $4,183.25 $29,747.70 $1,027,155.06 3.30%
2544 Other Professional Services $1,209.75 $600.90 $2,998,504.53 1.72%
DMH will deploy a variety of strategies in continuing efforts to improve MBE/WBE participation rates. Such
strategies will include, but are not limited to, the list below:
Regular, ongoing discussion with DMH Leadership regarding progress towards MBE/WBE goals.
Regular, ongoing interaction with facility staff to identify opportunities for MBE/WBE growth.
Ongoing analysis of expenditures to identify additional opportunities for MBE/WBE vendors.
Quarterly MBE/WBE expenditure reports available for leadership and facility staff.
Identifying and soliciting MBE/WBE vendors for specific procurement opportunities.
Regular review of procurement policies and procedures to ensure current practices align with Executive
Order 05-30 and Executive Order 15-06 (once implemented) compliance efforts.
Encourage continued use of the OEO MBE/WBE vendor database.
Promoting the use of MBE/WBE vendors for discretionary purchases that do not require a bid.
Outreach to certified MBE/WBE vendors to encourage their participation in DMH and other state
procurement opportunities.

57
Department of Natural Resources Director: Harry D. Bozoian
The Missouri Department of Natural Resources (DNR) protects our air, land and water; preserves our unique
natural and historic places; and provides recreational and learning opportunities for everyone. The department
accomplishes this mission through the following divisions:
Office of the Director Administrative Support Environmental Quality Missouri Geological Survey
Missouri State Parks
DNR’S PROCUREMENT PROCESS
DNR follows the OA/Purchasing Department Procurement Delegation Authority, OA/Purchasing Procurement
Manual, Policies, Code of State Regulations, state statutes and department policies and procedures. DNR’s
procurement is decentralized where purchasing authority has been passed down to divisions, programs, sections,
parks and historic sites. The purchasing authorities follow the standard bidding thresholds to include: $0 - $3,000
no bidding is required, $3,000.01-$24,999.99 at least three bids are required and $25,000 or more,
OA/Purchasing procures on our behalf, unless procurement delegations from OA exist. DNR utilizes contracts
procured by OA/Purchasing as often as possible. Mandatory contracts are used as required by OA/Purchasing.
Non-mandatory or preferred contracts are used when it is in the best interest of the state. Purchasing authorities
try to use these types of contracts before pursuing other alternatives. Purchasing authorities typically utilize a
non-contract source when the contract does not meet the Department’s needs, cannot supply it in the timeframe
needed or we find the product for a lower cost. In FY16, OA/Purchasing contracts were used for 44.98 percent of
DNR’s Agency Purchases.
DNR’S MBE/WBE EXPENDITURES
An analysis of the department’s expenditures reveals the following expenses incurred during FY16 on the table
below. “Net Expenditures” represent DNR’s “Total Expenditures” of $19,756,428.76 minus “Excludable
Expenditures” of $8,877,512.05.
MBE EXPENDITURES
WBE EXPENDITURES
NON-M/WBE EXPENDITURES
NET EXPENDITURES MBE % WBE %
$1,033,933.10 $1,827,228.54 $16,895,267.12 $10,878,916.71 9.50% 16.80%
The table and pie charts below represent the breakdown of DNR’s “Total Expenditures” into “PURCHASING
CONTRACTS” and “LOCAL AGENCY PURCHASES”.
PURCHASING CONTRACTS AGENCY PURCHASES
MBE WBE NON M/WBE MBE WBE NON M/WBE
$740,845.13 $439,945.27 $7,705,765.05 $293,087.97 $1,387,283.27 $9,189,502.07
$8,886,555.45 $10,869,873.31
8.34%
4.95%
86.71%
PURCHASING CONTRACTS
MBE
WBE
NON M/WBE
2.70%
12.76%
84.54%
AGENCY PURCHASES
MBE
WBE
NON M/WBE

58
The table below details DNR’s Top Five (5) Expenditure areas along with the level of MBE/WBE participation
achieved in each category.
Object Code / Description Expenditure Total
% of Grand Total Expenditures MBE % WBE %
2544 Other Professional Services $8,025,362.85 40.60% 1.55% 14.44%
2748 Vehicles $1,452,520.00 7.30% 1.85% 0.00%
2304 Resale Merchandise $1,078,449.91 5.46% 0.20% 0.07%
2541 Info Technology Consult & Srvs $968,177.69 4.90% 0.00% 0.00%
2328 Motor Fuel $886,043.88 4.48% 0.00% 0.00%
Some possible impediments that could be attributed to DNR’s low MBE/WBE participation rates are the following:
2748 - MBE and WBE participation in this category will always vary based on the vendors selected on
contract and the vehicle needs of the department.
2304 - Items purchased as resale merchandise are typically items that are purchased by the
Missouri State Parks for subsequent sale to the general public or resold to other parks through our
Central Warehouse. The merchandise selected is specific to the audience they are selling to and
also specific to the site selling the item.
2541 – 100 percent of all transactions were purchased using an OA/Purchasing contract. The
department does not have control over the selection of these vendors.
2328 - The department continues to have zero MBE and WBE participation. OA/Purchasing has
established a contract for the state fuel card for use by state agencies. There are very few certified
M/WBE vendors to deliver bulk fuel.
Listed on the tables below are DNR’s Top Five Areas of MBE and WBE participation, respectively.
DNR's TOP FIVE AREAS OF MBE PARTICIPATION
Object Code / Description Contracts Discretionary
Object Code Total Spend MBE%
2700 Non Mnframe Comp Sfw $63,166.68 $0.00 $63,166.68 100.00%
2592 Communication Equip $32,187.98 $0.00 $49,108.97 65.54%
2544 Other Professional Services $124,834.42 $0.00 $8,025,362.85 1.55%
2748 Vehicles $26,930.00 $0.00 $1,452,520.00 1.85%
2304 Resale Merchandise $0.00 $2,161.80 $1,078,449.91 0.20%
DNR's TOP FIVE AREAS OF WBE PARTICIPATION
Object Code / Description Contracts Discretionary
Object Code Total Spend WBE%
2469 Temporary Personnel $10,819.93 $14,716.51 $33,145.04 77.04%
2301 Promotional Supplies $0.00 $1,241.00 $4,227.18 29.35%
2772 Office Equipment $0.00 $2,540.00 $8,876.64 28.61%
2544 Other Professional Services $41,669.50 $1,117,713.11 $8,025,362.85 14.44%
2373 Other Specific Use Supplies $0.00 $8,872.03 $707,473.72 1.25%
DNR will continue to make the following improvements in its efforts to increase MBE and WBE participation
expenditures:
Work with OEO to figure out methods to certify M/WBEs based strictly on ethnicity and gender.
Identify M/WBEs to provide equipment and services for specialized environmental needs.
Educate M/WBE vendors on how to do business with the State of Missouri.
Create a better awareness of certified M/WBE vendors, educate staff on the M/WBE certification process
and use of the OEO directory to locate vendors in areas of high spend but low participation rates.

59
Department of Public Safety Director: Lane Roberts
The Department of Public Safety (DPS) coordinates statewide law enforcement, criminal justice and public safety
efforts to ensure a safe environment for Missourians. The department's mission is to provide a safe and secure
environment for all individuals through efficient and effective law enforcement, national defense, disaster
preparedness, service to veterans, services to crime victims, and education. DPS is comprised of the following
divisions:
Office of the Director Alcohol & Tobacco Capitol Police
Fire Safety MO Gaming Commission MO State Highway Patrol
MO National Guard SEMA MO Veterans Commission
DPS’S PROCUREMENT PROCESS
DPS is comprised of nine divisions. The department is de-centralized regarding financial and procurement
functions. Each division is responsible for helping the DPS meet its MBE/WBE goals. DPS mainly utilizes contract
set up by the Division of Purchasing. For every purchase the procurement staff will utilize a statewide contract if
available. Local purchases are approved in the absence of a statewide contract. Three bids are solicited for
purchases exceeding $3,000. DPS makes the effort to use vendor contracts and MBE/WBEs if available.
In response to this decentralized nature, this FY16 Department of Public Safety M/WBE procurement analysis does
not reflect the M/WBE procurement efforts and/or statistics of the Missouri State Highway Patrol. The Missouri
State Highway Patrol completes a procurement analysis at the divisional level for submission to the Office of
Equal Opportunity.
DPS’s MBE/WBE EXPENDITURES
An analysis of the department’s expenditures reveals the following expenses incurred during FY16 on the table
below. “Net Expenditures” represent DPS’s “Total Expenditures” of $33,586,338.79 minus “Excludable
Expenditures” of $12,888,952.57.
MBE EXPENDITURES
WBE EXPENDITURES
NON-M/WBE EXPENDITURES
NET EXPENDITURES MBE % WBE %
$2,525,723.03 $1,388,981.64 $29,671,634.12 $20,697,386.22 12.20% 6.71%
The table and pie charts below represent the breakdown of DPS’s “Total Expenditures” into “PURCHASING
CONTRACTS” and “AGENCY PURCHASES”.
PURCHASING CONTRACTS AGENCY PURCHASES
MBE WBE NON M/WBE MBE WBE NON M/WBE
$1,547,608.58 $1,123,677.41 $12,457,734.84 $978,114.45 $265,304.23 $17,213,899.28
$15,129,020.83 $18,457,317.96
10.23%
7.43%
82.34%
PURCHASING CONTRACTS
MBE
WBE
NON M/WBE
5.30%
1.44%
93.26%
AGENCY PURCHASES
MBE
WBE
NON M/WBE

60
The table below details DPS’s Top Five (5) Expenditure areas along with the level of MBE/WBE participation
achieved in each category.
Object Code / Description Expenditure Total % of Grand Total
Expenditures MBE % WBE %
2548 Vehicles $12,900,619.38 15.00% 0.41% 0.13%
2583 Comp Soft Maint Lic & Subsc $7,755,241.39 9.00% 29.33% 9.00%
2544 Other Professional Srvs $7,185,336.33 8.40% 7.00% 1.64%
2289 Pharmaceutical Drugs $7,046,319.85 8.20% 0.00% 0.00%
2337 Food & Dietary Supplies $4,884,695.39 5.70% 0.00% 3.00%
The following impediments can be attributed to DPS’s low M/WBE participation rates in some of the top five
expenditures:
2748 – Vehicles are purchased through a state contract and there are no available M/WBEs certified to
provide law enforcement vehicles.
2289 – Contracts set up by OA Purchasing that do not include M/WBE participation as part of the
awarded contract.
2544 –Expenditures under this category are for specialized law enforcement and other professional
services to the Veteran Service Organizations.
2337 - Contracts set up by OA Purchasing that have low M/WBE participation as part of the awarded
contract.
Listed on the tables below are DPS’s Top Five Areas of MBE and WBE participation, respectively.
DPS's TOP FIVE AREAS OF MBE PARTICIPATION
Object Code / Description Contracts Discretionary Object Code Total Spend MBE%
2721 Electronic Equipment $647,639.92 $25,371.44 $680,959.03 98.83%
2700 Non Mnf Comp Equip Over Thresh $2,316,323.64 $114,309.60 $2,562,487.30 94.85%
2701 IT Net & Comp Equip Over Thresh $989,687.98 $46,512.00 $1,132,779.01 91.47%
2686 Under Thresh Non MF Comp Sfw $356,803.35 $6,957.84 $405,364.74 88.02%
2685 Under Thresh Comp Equip $686,199.45 $208,939.58 $1,018,599.92 87.87%
DPS's TOP FIVE AREAS OF WBE PARTICIPATION
Object Code / Description Contracts Discretionary
Object Code Total Spend WBE%
2481 Food Services $166,197.88 $11,502.01 $178,260.39 99.68%
2505 Professional Court Services $0.00 $7,540.75 $8,904.25 84.68%
2118 Out of State Comm Trans-Trav $0.00 $24,906.89 $55,175.99 45.14%
2574 Electrical Repair & Maint $31,651.62 $15,017.41 $171,041.48 18.50%
2250 Office Supplies $31.90 $85,373.73 $555,528.27 15.37%
DPS will continue to make the following improvements in its efforts to increase MBE and WBE participation
expenditures:
Continue to encourage M/WBEs to participate in the State of Missouri’s purchasing program.
Encourage field staff to seek and utilize M/WBEs for the various products and services it procures.
Continue to seek M/WBE vendors that offer goods and services that are competitive with OA Purchasing
contracts.
Continue to use current M/WBE vendors for goods and services procured.
Internally track M/WBE expenditures and ensure procurement staffs continue to validate prospective
bidders/vendors with the OEO M/WBE directory.
Refer any potential candidates for MBE/WBE certification to OEO.

61
Missouri State Highway Patrol Superintendent: Col. J. Bret Johnson
The Missouri State Highway Patrol (The Patrol) is a state law enforcement agency with a primary mission to
reduce traffic and boating crashes and the injuries and deaths that result. As near as practicable all personnel of
the Patrol shall be used for carrying out these purposes and The Patrol shall be utilized in carrying the provisions
of Sections 43.350 to 43.380 RSMo. The Missouri State Highway Patrol does not have a commission. The Patrol has
23 divisions and nine troops.
THE PATROL’S PROCUREMENT PROCESS
The Procurement Unit solicits bids, awards contracts, and initiates purchase orders in accordance with applicable
statutes, policies and guidelines. It promotes competitive procurement and encourages the participation and
expansion of minority and women owned business enterprises in the procurement process. Interested vendors
must be registered with MissouriBUYS. Questions concerning bids must be directed to the Buyer of Record
indicated on the front page of the bid document. All bid responses are subject to Terms and Conditions set forth
by the State of Missouri. The Purchasing Section serves as the division liaison with the Office of Administration
(OA), Division of Purchasing for purchases valued annually at $25,000 or greater. In accordance with Executive
Order 05-30, contractors are encouraged to utilize certified minority and women-owned businesses in selecting
subcontractors.
THE PATROL’S MBE/WBE EXPENDITURES
An analysis of the agency’s expenditures reveals the following expenses incurred during FY16 on the table below.
“Net Expenditures” represent MSHP’s “Total Expenditures” of $49,846,610.22 minus “Excludable
Expenditures” of $16,512,226.76.
MBE EXPENDITURES
WBE EXPENDITURES
NON-M/WBE EXPENDITURES
NET EXPENDITURES MBE % WBE %
$8,906,419.43 $352,264.39 $40,587,926.40 $33,334,383.46 26.72% 1.06%
The table and pie charts below represent the breakdown of MSHP’s “Total Expenditures” into “PURCHASING
CONTRACTS” and “AGENCY PURCHASES”.
PURCHASING CONTRACTS AGENCY PURCHASES
MBE WBE NON M/WBE MBE WBE NON M/WBE
$8,872,473.71 $80,872.01 $26,550,719.42 $33,945.72 $271,392.38 $14,037,206.98
$35,504,065.14 $14,342,545.08
24.99% 0.23%
74.78%
PURCHASING CONTRACTS
MBE
WBE
NON M/WBE
0.24%
1.89%
97.87%
AGENCY PURCHASES
MBE
WBE
NON M/WBE

62
The table below details The Patrol’s Top Five (5) Expenditure areas along with the level of MBE/WBE
participation achieved in each category.
Object Code / Description Expenditure Total % of Grand Total
Expenditures MBE % WBE %
2748 Vehicles $12,517,232.76 25.11% 0.00% 0.00%
2583 Comp Software Maint, Lic, & Subsc $6,237,541.02 12.51% 32.53% 0.12%
2675 Other Fixed Assets $3,475,718.05 6.97% 1.62% 0.00%
2544 Other Professional Serv $2,560,646.75 5.14% 0.00% 0.00%
2700 Non Mnfrm Comp Equ Over Thres $2,189,770.16 4.39% 94.23% 0.00%
Object Codes 2748 & 2544 lack overall participation by M/ WBE vendors due to circumstances outside of the
Patrol’s control. The Patrol utilizes state contracts and other agreements with specialized entities (FBI, APCO,
LEXIS NEXIS, Accudata Credit Systems, and Equifax) for performing background and credit checks within the
agency's purchasing authority. With the uniqueness of these purchases, the Patrol has limited opportunities to
include participation by M/WBE certified vendors.
Listed on the tables below are The Patrol’s Top Five Areas of MBE and WBE participation, respectively.
THE PATROL’S TOP FIVE AREAS OF MBE PARTICIPATION
Object Code / Description Contracts Discretionary Object Code Total Spend MBE%
2721 Electronic Equipment $500,233.46 $0.00 $508,181.13 98.43%
2700 Non Mnframe Comp Equip Over Thresh $2,063,527.06 $0.00 $2,189,770.16 94.23%
2701 IT Net & Com Equip over Thresh $989,687.98 $0.00 $1,086,267.01 91.10%
2686 Under Thresh Non Mnframe Com Sftw $356,803.35 $0.00 $404,975.74 88.10%
2409 Internet Charges $56,229.30 $0.00 $65,900.85 85.32%
THE PATROL'S TOP FIVE AREAS OF WBE PARTICIPATION
Object Code / Description Contracts Discretionary Object Code Total Spend WBE%
2505 Professional Court Services $0.00 $856.90 $1,281.90 66.84%
2541 Info Technology Consult & Services $19,230.30 $862.50 $32,771.87 61.31%
2310 Building Repair Supplies $0.00 $8,079.62 $24,283.13 33.27%
2298 Manufacturing Supplies $0.00 $2,419.32 $8,136.06 29.73%
2250 Office Supplies $0.00 $66,807.19 $229,514.02 29.10%
To increase MBE/WBE participation in all expenditures, The Patrol will make every effort to utilize M/WBE
vendors in all local purchasing authority when feasible. In addition, the Patrol will continue to seek out qualified
M/WBE vendors that can be included in the quote process. The Patrol continues to evaluate purchasing
documentation to assure that M/WBE vendors are utilized in procurements.

63
Department of Revenue Acting Director: John Mollenkamp
The Department of Revenue (DOR) is the central collection agency for all state and non-state revenues. In
addition to collecting taxes and fees, DOR titles and registers vehicles, and licenses drivers and investigates
suspected violations of the tax, vehicle and driver licensing laws. The State Tax Commission and State Lottery
Commission are Type III transfer agencies as defined in Appendix B of the Reorganization Act of 1974, and
therefore these agencies are administered separately but share an agency code and reporting with the
Department. DOR consists of the following four divisions:
Administration Legal Services Motor Vehicle & Driver’s Licensing Taxation
DOR’S PROCUREMENT PROCESS
All procurements comply with the rules and regulations pursuant to Chapter 34, RSMo. In order to comply with
Executive Order 05-30, Department buyers strive to place orders with minority and woman-owned businesses, if:
The good/service is on an established contract or can be provided by Missouri Vocational Enterprises
(MVE), the buyer prepares the applicable SAMII purchase order document referencing the applicable
information. Print requisitions are sent to State Printing for goods or services it can provide.
The good/service is not on an established contract or available from MVE/State Printing, and the total
cost is less than $3,000, the buyer procures the requested good/service from a vendor. M/WBE vendors are
the first line of contact if the vendor can provide.
The good/service is not on an established contract or available from MVE, and the total cost is greater
than $3,000 and less than $25,000, the buyer solicits a minimum of three bids (telephone and/or written).
After evaluating the bid responses and making an award, the buyer prepares the applicable SAM11
purchase order.
DOR’S MBE/WBE EXPENDITURES
An analysis of the agency’s expenditures reveals the following expenses incurred during FY16 on the table below.
“Net Expenditures” represent DOR’s “Total Expenditures” of $14,315,322.00 minus “Excludable Expenditures”
of $0.00.
MBE EXPENDITURES
WBE EXPENDITURES
NON-M/WBE EXPENDITURES
NET EXPENDITURES MBE % WBE %
$1,122,759.09 $434,223.02 $12,758,339.89 $14,315,322.00 7.84% 3.03%
The table and pie charts below represent the breakdown of DOR’s “Total Expenditures” into “PURCHASING
CONTRACTS” and “AGENCY PURCHASES”.
PURCHASING CONTRACTS AGENCY PURCHASES
MBE WBE NON M/WBE MBE WBE NON M/WBE
$1,117,516.00 $422,050.00 $12,379,093.00 $5,243.09 $12,173.02 $379,246.89
$13,918,659.00 $396,663.00
8.03%
3.03% 88.94%
PURCHASING CONTRACTS
MBE
WBE
NON M/WBE
1.32%
3.07% 95.61%
AGENCY PURCHASES
MBE
WBE
NON M/WBE

64
The table below details DOR’s Top Five (5) Expenditure areas along with the level of MBE/WBE participation
achieved in each category:
Object Code / Description Expenditure Total
% of Grand Total Expenditures MBE % WBE %
2544 Other Professional Services $7,700,919.00 53.79% 0.00% 4.00%
2475 Collection Services $4,201,025.04 19.10% 0.00% 0.00%
2460 Printing and Binding Services $693,943.00 14.40% 0.00% 4.00%
2466 Advertising Services $347,749.00 11.50% 0.00% 0.00%
2250 Office Supplies $296,843.00 10.16% 6.12% 9.77%
Lack of overall participation by M/WBE vendors in DOR’s Top five Expenditures could be attributed to the
following reasons:
2544 - Expenditures for Other Professional Services and Collection Services include costs associated with
an integrated tax system and collection services for delinquent taxes. The technical requirements of
these contracts limit the number of qualified vendors that can provide these services.
2475 – DOR contracts with two collection agencies to pursue delinquent tax collections. MBE/WBE
vendors are unable to provide the collection services necessary to fulfill the contract requirements.
2460 – DOR struggles to find MBE/WBE vendors that can provide the Department’s printing needs.
Listed on the tables below are DOR’s Top Five Areas of MBE and WBE participation respectively.
DOR's TOP FIVE AREAS OF MBE PARTICIPATION
Object Code / Description Contracts Discretionary Object Code Total Spend MBE%
2700 Non-Mnf Comp Hdw Under Thresh $1,061,223.84 $0.00 $1,094,403.35 96.96%
2686 Non-Mnf Comp Sfw Under Thresh $52,210.00 $0.00 $54,960.00 94.99%
2685 Computer Equip Under Thresh $49,139.17 $975.48 $68,128.60 73.55%
2706 Non-Mnf Comp Sfw $172,389.69 $0.00 $258,889.69 66.58%
2583 Computer Sfw Maintenance $264,853.17 $1,580.80 $481,555.80 55.32%
DOR's TOP FIVE AREAS OF WBE PARTICIPATION
Object Code / Description Contracts Discretionary Object Code Total Spend WBE%
2505 Professional Court Services $0.00 $3,106.10 $3,340.19 92.99%
2691 Office Equipm/Furn Under Thresh $3,370.00 $3,975.00 $16,322.53 44.99%
2400 Telecommunications Supplies $0.00 $1,483.69 $3,061.65 48.46%
2250 Office Supplies $21,869.00 $23,575.44 $341,538.08 13.30%
2370 Notary Supplies $0.00 $37.90 $796.78 4.75%
The Department of Revenue’s Purchasing Section is cognizant of their responsibility to promote and increase
M/WBE participation in the procurement process. Staff buyers primarily use the OEO's M/WBE Directory and
other sources in the Kansas City and St. Louis area. DOR hopes that MissouriBUYS will identify and contact more
M/WBE vendors on DOR’s procurement opportunities.

65
Missouri Lottery Executive Director: May Scheve Reardon
The Missouri Lottery (The Lottery) is a revenue source for Missouri public education. The Lottery’s mission is to
help fund educational opportunities for Missouri students, support Missouri businesses, and entertain millions.
The Lottery is made up of the following divisions:
Executive Office Risk Management
Sales, Marketing & Communications
THE LOTTERY’S PROCUREMENT PROCESS
The Lottery is exempt from Chapter 34 and therefore has authority to procure over $25,000 procurements
without going through OA-Purchasing. We do, however, utilize Purchasing on our three largest procurements -
Computer Gaming System & Related Services, Lottery Scratchers Games/Services, and Advertising and Marketing
Services. For procurements for over $25,000 procurements that do not go through OA Purchasing, the following
procedures are utilized unless the item is available under a current Lottery contract, a statewide contract or
Missouri Vocational Enterprises: 10% and 5% are included as a preference in all Lottery procurements over
$25,000 and included as evaluation criteria; Advertise over $25,000 procurements in minority publications - KC
Call, St. Louis American; Posting of bids to Missouri Office of Equal Opportunity (OEO) website and
MOLottery.com. In addition, the Lottery requires at least three informal bids for purchases between $3,000 and
$10,000, and at last three written bids for purchases between $10,000 and $25,000, unless the item is
available under a current Lottery contract, a statewide contract or MVE.
THE LOTTERY’S MBE/WBE EXPENDITURES
An analysis of the agency’s expenditures reveals the following expenses incurred during FY16 on the table below.
“Net Expenditures” represent the Lottery’s “Total Expenditures” of $134,836,779.00 minus “Excludable
Expenditures” of $901,415.10.
MBE EXPENDITURES
WBE EXPENDITURES
NON-M/WBE EXPENDITURES
NET EXPENDITURES MBE % WBE %
$21,192,667.39 $7,611,029.37 $106,033,082.24 $133,935,363.90 15.82% 5.68%
The table and pie charts below represent the breakdown of The Lottery’s “Total Expenditures” into
“PURCHASING CONTRACTS” and “AGENCY PURCHASES”.
PURCHASING CONTRACTS AGENCY PURCHASES
MBE WBE NON M/WBE MBE WBE NON M/WBE
$8,799,645.00 $3,383,089.00 $50,208,103.33 $12,393,022.39 $4,227,940.37 $55,824,978.91
$62,390,837.33 $72,445,941.67
14.10%
5.42%
80.47%
PURCHASING CONTRACTS
MBE WBE NON M/WBE
17.11%
5.84%
77.06%
AGENCY PURCHASES
MBE
WBE
NON M/WBE

66
The table below details The Lottery’s Top Expenditure areas along with the level of MBE/WBE participation
achieved in each category.
Object Code / Description Expenditure Total
% of Grand Total Expenditures MBE % WBE %
N/A ** Retailer Commissions & Incentives $77,000,000.00 57.11% 15.52% 5.37%
2496 Other Business Services $19,600,000.00 14.54% 23.71% 9.15%
2466 Advertising Services $13,500,000.00 10.01% 9.14% 4.98%
2460 Printing & Binding Services $7,800,000.00 5.78% 15.83% 10.48% **Retailer commissions and incentives are predominantly retained by retailers from ticket sales and are not paid through SAM II.
Other top expenditures by the Lottery that are not reported in MOBIUS SAMII include the following:
Prizes - total prizes paid by Lottery retailers and Lottery offices totaled $883.3 million. MBE/WBE
percentages do not apply to prizes.
Transfers to Education - $309 million. MBE/WBE percentages do not apply to transfers to education.
Listed on the tables below are The Lottery’s Top Five Areas of MBE and WBE participation, respectively.
THE LOTTERY's TOP FIVE AREAS OF MBE PARTICIPATION
Object Code / Description Contracts Discretionary
Object Code Total Spend MBE%
2700 Non Mnfr Comp Equip Over Thresh $1,027,085.70 $0.00 $1,060,265.21 96.87%
2376 Information Technology Supplies $22,336.65 $0.00 $23,305.95 95.84%
2541 Info Technology Consult & Srvs $55,230.62 $0.00 $68,604.00 80.50%
2580 Computer Hrdw Rep & Maint $157,448.62 $0.00 $252,121.95 62.44%
2685 Under Thresh-Comp Equip $29,336.17 $0.00 $47,350.12 61.95%
THE LOTTERY's TOP FIVE AREAS OF WBE PARTICIPATION
Object Code / Description Contracts Discretionary
Object Code Total Spend WBE%
2469 Temporary Personnel Services $85,596.25 $0.00 $85,596.25 100.00%
2505 Professional Court Services $207.25 $0.00 $207.25 100.00%
2691 Under Threshold-Other Equipment $3,975.00 $0.00 $5,270.06 75.42%
2400 Telecommunication Supplies $1,046.60 $0.00 $1,398.55 74.83%
2271 Uniforms & Clothing $0.00 $4,199.59 $5,742.51 73.13%
To increase MBE/WBE participation in all expenditures, the Lottery will continue to incorporate the following:
Quarterly reporting to the Missouri Lottery Commission of M/WBE expenditures and percentages.
Regular performance monitoring and reporting systems to ensure contractor compliance.
Regular updating of established vendor lists to include minority and woman owned businesses. Lists are
shared with Lottery vendors who subcontract with minority and women-owned businesses.

67
State Tax Commission Chairman: Bruce E. Davis
The State Tax Commission (STC) is an administrative agency under the direction of three commissioners who are
appointed by the Governor and confirmed by the Senate. The Commission is given the responsibility of ensuring
the uniform and equitable assessment of all taxable tangible property in the state. The Commission measures the
accuracy of assessments in each county and works with assessors to promote an accurate and fair assessment
program. It conducts seminars and training sessions for assessors and their staffs. The Commission also hears
taxpayers’ appeals from the local Boards of Equalization, and is responsible for the statewide assessment of the
property of railroads, airlines, pipelines, electric and telecommunication companies. The administrative
structure is:
Administration Legal
Local Assistance Original Assessment
STC’S PROCUREMENT PROCESS
STC utilizes the State of Missouri’s Purchasing Card (P-Card) program for the majority of its expenditures and will
utilize state established contracts when the need arises.
STC’S MBE/WBE EXPENDITURES
An analysis of the agency’s expenditures reveals the following expenses incurred during FY16 on the table below.
“Net Expenditures” represent STC’s “Total Expenditures” of $91,684.00 minus “Excludable Expenditures” of
$0.00.
MBE EXPENDITURES
WBE EXPENDITURES
NON-M/WBE EXPENDITURES
NET EXPENDITURES
MBE % WBE %
$2,519.62 $1,932.95 $87,231.43 $91,684.00 2.75% 2.11%
The table below details STC’s Top Five (5) Expenditure areas along with the level of MBE/WBE participation
achieved in each category.
Object Code / Description Expenditure Total
% of Grand Total Expenditures MBE % WBE %
2250 Office Supplies $12,327.80 13.45% 0.00% 1.69%
2610 Vehicle Repair & Maint $1,848.09 2.02% 0.00% 0.00%
2328 Motor Fuel $322.51 0.35% 0.00% 0.00%
2598 Office Furn & Equp R&M $67.32 0.07% 0.00% 0.00%
2277 Other Admin Supplies $30.95 0.03% 0.00% 0.00%
The lack of MBE/WBE participation in STC’s top five object codes can be attributed to the following:
A majority of STC’s expenditures for services provided are through contract bids by the Division of
Purchasing. The department has no control over the regulations and policies used by Purchasing to award
a contract.
The STC utilizes the State of Missouri's Purchasing Card (P-Card) program for the majority of its
expenditures. Of the top five expenditure areas listed above, only 9 percent of those were not through
the PCard program or interagency billing.
STC will continue to participate actively in M/WBE vendor fairs with the hopes of reaching certified M/WBEs in
the rural areas.


69
Department of Social Services Director: Brian Kinkade
The Department of Social Services (DSS) is responsible for coordinating programs to provide public assistance to
children and their parents, access to health care, child support assistance and to provide specialized assistance
to troubled youth. While many programs give needed financial assistance and services, other units work toward
reducing financial dependency of the citizens on government. DSS accomplishes these functions through the
following divisions.
Office of the Director Children’s Division Family Support Division MO Health Net Division
Division of Legal Services Division of Youth Services Division of Finance and Administrative Services
DSS’s PROCUREMENT PROCESS
DSS uses e-mail notification and the DSS website to notify bidders, including MBE/WBE vendors, when
procurement opportunities are let. DSS bids through the Division of Purchasing are posted on the Internet and
DSS provides suggested potential bidders, including MBE/WBE vendors to the Division of Purchasing to include in
their bidder notification process. Over two-thirds of DSS expenditures are attributed to Division of Purchasing
contracts. The DSS procurement function is centralized through the Division of Finance and Administrative
Services (DFAS), with centralized purchasing unit staff providing direction and assistance to out-based staff
regarding access to existing contracts. The centralized purchasing unit is also responsible for coordinating the
contracting activities for the entire department.
DSS MBE/WBE EXPENDITURES
An analysis of the department’s expenditures reveals the following expenses incurred during FY16 as listed in the
table below. “Net Expenditures” represent DSS’s “Total Expenditures” of $198,565,960.64 minus “Excludable
Expenditures” of $11,539,509.10.
MBE EXPENDITURES
WBE EXPENDITURES
NON-M/WBE EXPENDITURES
NET EXPENDITURES MBE % WBE %
$10,364,791.23 $10,552,437.50 $177,648,731.91 $187,026,451.54 5.54% 5.64%
The table and pie charts below represent the breakdown of DSS’s “Total Expenditures” into “PURCHASING
CONTRACTS” and “AGENCY PURCHASES”.
PURCHASING CONTRACTS AGENCY PURCHASES
MBE WBE NON M/WBE MBE WBE NON M/WBE
$9,638,768.81 $7,555,360.09 $154,590,413.68 $726,022.42 $2,997,077.41 $23,058,318.23
$171,784,542.58 $26,781,418.06
5.61%
4.40%
89.99%
PURCHASING CONTRACTS
MBE
WBE
NON M/WBE
2.71%
11.19% 86.10%
AGENCY PURCHASES
MBE
WBE
NON M/WBE

70
The table below details DSS’s Top Five (5) Expenditure areas during FY16 with the level of MBE/WBE
participation achieved in each category.
Object Code / Description Expenditure Total
% of Grand Total Expenditures MBE % WBE %
2544 Other Professional Srvs $100,087,548.20 50.00% 0.33% 0.85%
2541 Info Technology Consult & Srvs $27,727,288.20 13.96% 15.56% 0.81%
2514 Program Consultant Srvs $23,661,707.27 11.92% 0.00% 0.00%
2583 Comp Sftw Maint, Lic, & Subsc $15,896,087.33 8.00% 1.97% 0.00%
2469 Temporary Personnel Srvs $5,723,167.45 2.88% 7.39% 26.44%
MBE/WBE participation in some of DSS’s top five object codes did not achieve target goals due to some of the
following reasons:
2544 and 2514 - Nearly three (3) dollars out of every four (4) are spent on Other Professional Services
(2544) and Program Consulting Services (2514) and are related to services provided to/for clients.
Availability of MBE/WBE vendors for specific types of human services and social services programming can
be very limited, if available at all. Additionally, many DSS service providers are not-for-profit
organizations.
2583 - Software licenses and maintenance afford little opportunity, if any, for MBE/WBE participation.
Software maintenance is usually only available from the original software manufacturer and original
software may also be proprietary.
Listed on the tables below are DSS’s Top Five Areas of MBE and WBE participation, respectively.
DSS's TOP FIVE AREAS OF MBE PARTICIPATION
Object Code / Description Contracts Discretionary
Object Code Total Spend MBE%
2706 Non Mnfrm Computer Sftw $357,536.67 $0.00 $357,536.67 100.00%
2685 Under Thresh Comp Equip $93,323.08 $1,738.75 $95,061.83 100.00%
2694 Under Thresh-Other Equip $78,534.59 $15,608.69 $258,648.77 36.39%
2686 Under Thresh Non MF Comp Sftw $648,567.05 $0.00 $2,005,691.43 32.33%
2541 Info Technology Consult & Srvs $4,317,049.00 $0.00 $27,727,288.00 15.57%
DSS's TOP FIVE AREAS OF WBE PARTICIPATION
Object Code / Description Contracts Discretionary Object Code Total Spend WBE%
2469 Temporary Personnel Services $1,423,622.53 $2,627,837.87 $4,051,460.40 93.59%
2427 Laboratory Services $307,811.00 $19,812.00 $435,060.15 75.30%
2686 Under Threshold Non MF Com Sfw $1,345,082.08 $0.00 $2,005,691.43 67.06%
2583 Comp Software Maint Lic & Subsc $1,513,506.49 $0.00 $5,723,167.45 26.44%
2544 Other Professional Srvs $745,330.00 $106,518.00 $100,087,548.00 1.00%
DSS will continue to strive to increase its MBE/WBE participation rates through a variety of initiatives. Such
initiatives include:
Detailed analysis of expenditures to identify additional opportunities for MBE/WBE vendors;
Identifying and soliciting MBE/WBE vendors for specific procurement opportunities;
Promoting the use of MBE/WBE vendors for discretionary purchases that do not require a bid; and
Outreach to certified M/WBE vendors to encourage their participation in DSS and other state
procurement opportunities.

71
Department of Transportation Director: Patrick McKenna
The Missouri Department of Transportation (MoDOT), under the guidance of the Missouri Highways and
Transportation Commission, is committed to providing the public with a safe and modern transportation system.
MoDOT is responsible for maintaining 33,873 miles of highways and 10,394 bridges throughout the state. In
addition to designing, building and maintaining roads and bridges, MoDOT works to improve airports, river ports,
railroads, public transit systems and pedestrian and bicycle travel. The agency also administers motor carrier and
highway safety programs. MoDOT has seven districts statewide and a Central Office in Jefferson City which
houses the following divisions:
Office of Director Audits & Investigations Bridge Chief Counsel
Commission Secretary Construction & Materials Customer Relations Equal Opportunity & Diversity
External Civil Rights Financial Services General Services Governmental Relations
Human Resources Motor Carrier Services Multimodal Operations Risk & Benefit Management
Traffic & Highway Safety Transportation Planning
MODOT’S PROCUREMENT PROCESS
Presently a more formal approach is utilized. Procurement staff is directed to solicit a minimum of one M/WBE
response when available. A more informal process is recommended that would allow procurement staff the
ability to call or email a minimum of three vendors with an emphasis on contacting M/WBE vendors. Email
notification is most effective as a majority of respondents are registered in MoDOT’s vendor database and
receive the email notification. All competitive bid and proposal solicitations are posted to MoDOT’s website.
MoDOT, in addition, advertises facilities related bids in county newspapers.
MODOT’S MBE/WBE EXPENDITURES
An analysis of the department’s expenditures reveals the following expenses incurred during FY16 on the table
below. “Net Expenditures” represent MODOT’s “Total Expenditures” of $240,189,396.59 minus “Excludable
Expenditures” of $15,064,605.22.
MBE EXPENDITURES
WBE EXPENDITURES
NON-M/WBE EXPENDITURES
NET EXPENDITURES MBE % WBE %
$13,206,886.74 $5,864,580.26 $221,117,929.59 $225,124,791.37 5.87% 2.61%
The table and pie charts below represent the breakdown of MODOT’s “Total Expenditures” into “PURCHASING
CONTRACTS” and “AGENCY PURCHASES”.
PURCHASING CONTRACTS AGENCY PURCHASES
MBE WBE NON M/WBE MBE WBE NON M/WBE
$9,709,320.26 $487,915.02 $7,246,278.28 $3,497,566.48 $5,376,665.24 $213,871,651.31
$17,443,513.56 $222,745,883.03
55.66%
2.80%
41.54%
PURCHASING CONTRACTS
MBE
WBE
NON M/WBE
1.57%
2.41%
96.02%
AGENCY PURCHASES
MBE
WBE
NON M/WBE

72
The table below details MoDOT’s Top Five (5) Expenditure areas during FY16 with the level of MBE/WBE
participation achieved in each category.
Object Code / Description Expenditure Total % of Grand Total
Expenditures MBE % WBE %
2331 Other Repair & Maint Supplies $84,889,385.14 35.30% 0.00% 4.00%
2748 Vehicles $23,124,509.63 9.60% 0.00% 0.00%
2544 Other Professional Services $22,695,501.15 9.50% 0.64% 1.22%
2328 Motor Fuel $13,931,896.74 5.80% 0.00% 0.00%
2325 Vehicle Repair Supplies $11,957,349.50 5.00% 0.00% 0.00%
The above Top 5 Expenditure Object Codes lack overall participation by M/WBE vendors due to circumstances
outside of the MoDOT’s control. There is a lack of known M/WBE vendors in the goods and services procured.
There is also very low response rate from M/WBEs identified for solicitation requests. MoDOT’s Tracker for FY16
indicates a 2.05 percent decrease in the percentage of M/WBE respondents’ compared to FY15.
Listed on the tables below are MoDOT’s Top Five Areas of MBE and WBE participation, respectively.
MODOT's TOP FIVE AREAS OF MBE PARTICIPATION
Object Code / Description Contracts Discretionary
Object Code Total Spend MBE%
2540 Information Technology Outsourcing $99,252.38 $0.00 $100,314.18 98.94%
2685 Under Threshold Computer Equip $458,503.96 $0.00 $496,178.23 92.40%
2580 Computer Hardware Rep & Maint $895,964.97 $10,161.00 $974,129.23 90.93%
2700 Non Mnf Comp Equip Over Thresh $2,691,796.16 $0.00 $3,204,226.45 84.00%
2541 Info Technology Consult & Services $279,610.23 $1,705,890.84 $2,462,933.65 80.61%
MODOT's TOP FIVE AREAS OF WBE PARTICIPATION
Object Code / Description Contracts Discretionary
Object Code Total Spend WBE%
2466 Advertising Services $0.00 $2,498,442.10 $3,650,200.47 68.44%
2301 Promotional Supplies $0.00 $88,309.98 $168,195.42 52.50%
2517 Public Relations Services $0.00 $18,000.00 $59,320.92 30.34%
2616 Boats & Motors RM $0.00 $13,750.00 $60,578.00 22.69%
2469 Temporary Personnel Services $0.00 $29,548.49 $143,459.03 20.59%
MoDOT has the following measures established to increase M/WBE participation in its expenditures:
Tracker Measures – On a quarterly basis, MoDOT reviews progress towards utilization of M/W/DBE firms in
relation to Office of Administration, Office of Equal Opportunity (OA-OEO) and Missouri Regional
Certification Committee (MRCC) certified vendors. The divisional Tracker is discussed and shared with
our statewide procurement staff. The statewide Tracker is shared with executive management, senior
management and multiple statewide stakeholders during the quarterly meetings. Because we are held
accountable for our results, we work very hard to ensure progress can be noted in each measure. Items
reviewed include the following:
Number of M/W/DBE vendors included in our vendor database,
Number of M/W/DBE vendors notified of competitive bidding opportunities,
Number of M/W/DBE vendors who respond to our competitive bidding opportunities, and
Expenditures utilizing M/W/DBE vendors.
Community Outreach and Education – Throughout the year, MoDOT participates or hosts opportunities to
connect with M/W/DBE vendors. Examples in FY16 include but are not limited to, participation in the
OA- OEO Capital Connection Business Expo in Columbia, Missouri. MoDOT also participated in the MRCC
supportive services meetings in Kansas City, St. Louis and Springfield, Mo.

73
STATE OF MISSOURI
WORKFORCE DIVERSITY PLAN

74

75
FY16 STATEWIDE WORKFORCE DIVERSITY ANALYSIS SUMMARY
The State of Missouri serves as a model for all Missourians. It is important that its workforce reflects the
demographics found in the state. The information provided in this section compares the population in the state of
Missouri and the breakdown of its workforce by gender, race and ethnicity. According to the 2015 Census
Population Estimates, the population in the State of Missouri is represented by 6,083,672 individuals. 83.32% of
the population is white and 16.68% represent minority groups, including those of Hispanic origin and individuals
that have been identified to belong to two or more races. The State of Missouri employs 45,483 individuals,
roughly .75 percent of the current population in Missouri. The Executive Departments follow the directive of
Executive Order 10-24 that each department shall submit a revised Workforce Diversity Plan of Implementation to
the state EEO.
The table and pie charts below represent the US Census Bureau, 2015 Missouri Population Estimates.
Male Female
Total by Race
Total by Ethnicity
% by Race
% by Ethnicity
White 2,497,853 2,571,257 5,069,110
83.32% Black 342,338 376,180 718,518
11.81%
Hispanic 127,850 119,717
247,567
4.10%
American Indian/ Alaskan Native 17,051 16,448 33,499
0.55%
Asian 57,738 63,668 121,406
2.00% Native Hawaiian/Other
Pacific Islander 4,410 4,447 8,857
0.15% Two or More Races 65,655 66,627 132,282
2.17%
Total Population
6,083,672 100.00% Total by Gender 2,985,045 3,098,627
Percent by Gender 49% 51% *SOURCE: US CENSUS BUREAU, 2015 POPULATION ESTIMATES
83%
12%
1%
2% 0%
2%
Minority Breakdown
White
Black
Hispanic
American Indian/ Alaskan Native
Asian
Native Hawaiian/Other Pacific Islander
Two or More Races
49%
51%
Male / Female Comparison
Male
Female

76
STATE OF MISSOURI WORKFORCE SUMMARY
The information on the workforce composition provided in these reports is the basis for the following table,
which depicts the workforce at each executive department.
This information was developed through the use of the Berkshire Affirmative Action Software implemented by
OEO and all State Departments / Agencies during FY16.
The comparison between the composition of the workforce at the Executive Departments of the State of Missouri
and the percentages found in the 2015 census yields the following facts: the Executive Departments at the State
of Missouri are comprised of 85.50% Caucasian employees. Minority employees and those of Hispanic ethnicity
make up the remaining 14.50%. Female employees make up 53.03% of the workforce at the Executive
Departments at the State of Missouri and Male employees represent 46.97%.
Diversity is defined as the unique strengths, talents, opinions and perspectives that each individual brings to the
workplace based on his/her background and experiences. When incorporated to achieve a common goal, these
differences strengthen the organization by taking into account multiple views and perspectives. Diversity allows
the organization to see the “big picture” and be innovative and creative, because others’ varying ideas are
considered. The workforce at the State of Missouri works together to build Missouri’s future!
Total
Employees Male Female White Black Hispanic Asian Indian Pacific
Unknown / 2 or more
Office of Administration 1,755 1,127 628 1,589 114 10 33 9 0 0
Agriculture 333 190 143 321 8 1 2 1 0 0
Conservation 1,385 1,043 342 1,327 34 8 10 6 0 0
Corrections 10,846 6,404 4,442 9,961 684 129 48 24 0 0
Economic Development 795 316 479 638 127 8 15 7 0 0
Elementary & Second. Ed 1,686 320 1,366 1,472 180 14 16 4 0 0
Higher Education 54 9 45 52 2 0 0 0 0 0
Health & Senior Services 1,704 321 1,383 1,478 174 22 25 5 0 0
Insurance 523 210 313 491 25 1 5 1 0 0
Labor 752 512 240 673 65 3 6 5 0 0
Mental Health 6,403 1,852 4,551 4,147 2,060 65 118 13 0 0
Natural Resources 1,420 815 605 1,351 39 8 19 3 0 0
Public Safety 2,277 737 1,540 1,860 345 27 37 8 0 0
The Patrol 2,414 1,728 686 2,267 85 35 11 16 0 Revenue 1,065 254 811 977 54 8 22 4 0 0
State Tax Commission 37 19 18 37 0 0 0 0 0 0
The Lottery 153 80 73 134 15 1 3 0 0 0
Social Services 6,802 1,264 5,538 5,507 1151 73 30 41 0 0
Transportation 5,079 4,161 918 4,610 294 59 29 65 0 22
Total 45,483 21,362 24,121 38,889 5,456 472 429 212 0 22
Executive Branch Percentages (%) 46.97 53.03 85.50 12.00 1.04 0.94 0.47 0.00 0.05
State of Missouri 2015 Estimate
White 85.50% 80.06%
Black 12.00% 11.35%
Hispanic 1.04% 3.91%
Asian 0.94% 1.92%
Indian 0.47% 0.53%
Pacific 0.00% 0.14%
Two/More 0.05% 2.09%

77
STATE OF MISSOURI WORKFORCE SUMMARY
The executive branch departments/agencies of the State of Missouri comprise 50,331 employees. The
composition of this workforce has been summarized on the previous pages. A more detailed breakdown by
gender and ethnicity is reflected on the agency pages.
For consistency and conformity, each agency workforce page lists job groups and the corresponding job
descriptions that are required on the State and Local Government EEO-4 report. The EEO-4 report requires that
employees be separated into one of the following job groups:
GROUP HEADER GROUP DESCRIPTION
Group A Officials & Administrators
Group B Professionals
Group C Technicians
Group D Protective Service Workers
Group E Paraprofessionals
Group F Office & Clerical
Group G Skilled Craft Workers
Group H Service Maintenance
The total number of employees that fall within each group is shown in the cell under “Total Employed” directly
under the respective group header. The combined total of all job groups, or total number of employees that
make up an agency’s workforce, can be found in the narrative at the bottom of each agency page.
If a particular group header, as identified above, is not present on any of the agency pages that follow, it means
the agency had no employees that were classified under this job group.
Each job group category shows a more detailed breakdown of the gender and ethnicity of the employees within
that group. The classifications that follow reflect the status of each agency’s workforce:
GROUP BREAKDOWN # Employed # Available Persons Required
The amounts reflected on the “number (#) employed” row represent the actual number of employees identified
in that job group. The amounts reflected on the “number (#) available” row represent the number of
individuals identified by the 2010 Census available in the state population. The amounts reflected on the
“persons required” row represent the number of employees available to be hired based on a comparison
between the “number (#) employed” and the “number (#) available”. This amount provides a benchmark that
can guide future recruitments efforts and is based on the four-fifths or 80% rule. With the 80% rule,
utilization exists if the percentage of females and/or minorities in a particular job group is less than 80% of
the final availability percentage.
The amount reflected in the “persons required” row may be “O” or it may be an amount greater than “O.”
Where there are amounts greater than “O,” this indicates a need to review the composition of the current
workforce to ensure the state’s workforce is demographically reflective of the state’s population of available
workforce candidates. Where the amount is “O,” this is an indication that the respective agency’s current
employee composition is consistent with the availability of talent in the state’s population. No additional
recruitment efforts are necessary where the “persons required” field equals “O.”

78
A cross section of members of OEO’s Workforce Diversity Council at one of the council meetings.

79

80
OFFICE OF ADMINISTRATION Mission
“To perform central administrative functions for state government and to provide essential support services in partnership with state
agencies, our primary customers, helping them fulfill their missions. These services will be provided in the most efficient and effective way
earning the trust and respect of all our customers and citizens of Missouri.”
The Office of Administration (OA) was established in 1974 as a complete reorganization of Missouri’s Executive
Branch. The role of OA is to provide efficient administration of the executive branch of state government.
Charged with directing the operations of the OA is the Commissioner, appointed by the Governor and confirmed
by the Senate, and the Division Directors who are appointed. As of July 1, 2014, the OA is organized into seven
divisions: Accounting; Budget and Planning; Facilities Management, Design and Construction; General Services;
Information Technology Services; Personnel; and Purchasing. Programs assigned to the Commissioner’s Office
include the Office of Equal Opportunity, Children’s Trust Fund, Governor’s Council on Disability, Human
Resources, and the Administrative Hearing Commission.
The core functions provided by OA include:
Administering the state budget and accounting activities for the State;
Administering the human resources system and providing HR services;
Coordinating information technology services and telecommunications for state agencies;
Providing and maintaining office and other space for governmental operations and protecting the State’s
investments in property assets;
Procuring supplies, materials, equipment and services for state agencies; and
Managing the state transportation fleet, vehicle maintenance, state printing, risk management and
central mail services.
As of June 30, 2016, the Office of Administration’s workforce was composed of 1,755 employees including 168
minorities (9.57%) and 628 females (35.78%).
The following table and charts show the composition of the workforce at the OA by gender and race/ethnicity as
of June 30, 2016.
OA’s FY16 Workforce Demographics
FY16 Workforce
Total Employees 1,755
Female 628 35.78%
Male 1,127 64.22%
Minority 168 9.57%
OA conducted an availability analysis by job group, taking into account both external and internal availability,
and has compared incumbency to estimated availability to determine placement goals. Of the 65 organizational
units at OA, 38 or 58.46% include minorities, and 56 or 86.15% include females. This analysis by organizational
unit reveals that minorities and women are not significantly underrepresented or concentrated in any particular
organizational unit. It also suggests that there is no policy or practice excluding minorities or women from any
unit, nor is there any racial or sexual discrimination in the selection process. There were 87 new employees hired
during the period from July 01, 2015 to June 30, 2016, including 19 minorities at 22% and 16 women at 18%.
35.78%
64.22%
Workforce Gender Percentages
Female
Male
9.57%
90.43%
Workforce Minority Percentages
Minority
White

81
The following table determines the number of people needed for full representation of the protected class based
on the 80% rule.
In an effort to address underutilization and achieve parity in all job groups, OA has taken the following steps:
Continue to work closely with hiring managers and staff regarding the value of diversity. OA has increased outreach and cooperative efforts with local historically black colleges and universities, primarily through a revamped and rededicated internship program.
OA has analyzed and will continue to analyze all positions and prepare written descriptions to accurately reflect position functions for consistency from one organizational unit to another.
On-the-job training is provided to all qualified employees to assist them in developing the necessary knowledge and skills for promotion to higher level jobs. In addition, a tuition reimbursement benefit is also available to all qualified employees.
Continue to make opportunities for advancement into more stimulating positions widely known through our career development process and by encouraging minorities and women to take advantage of these opportunities.
As part of this program, OA has attended numerous college and community career fairs to network with potential
applicants and increase visibility, while simultaneously gaining an expanded portfolio of applicants.
The Office of Administration strives to provide equal employment opportunity to all interested applicants, and
works on improving hiring practices to create a process that is efficient and successful in hiring the most qualified
applicant for each vacant position.
A-OFFICIALS AND ADMINISTRATORS Total Employees - 163
Min Fem Asi Blk His Ind Pac Two Wht Mal
# Employed 9 67 0 6 3 0 0 0 154 96
# Available 11.6 78.4 3.2 6.6 1.1 0.2 0.0 0.5 147.9 81.1
Persons Required 1 0 3 0 0 1 1 1 0 0
B-PROFESSIONALS Total Employees - 930
Min Fem Asi Blk His Ind Pac Two Wht Mal
# Employed 96 415 29 56 4 7 0 0 834 515
# Available 48.2 371.7 15.5 19.1 5.1 0.5 0.0 7.5 838.9 515.3
Persons Required 0 0 0 0 1 0 0 7 0 0
C-TECHNICIANS Total Employees - 160
Min Fem Asi Blk His Ind Pac Two Wht Mal
# Employed 16 39 4 10 1 1 0 0 144 121
# Available 12.8 79.6 0.6 8.9 0.8 0.9 0.0 1.6 133.7 66.9
Persons Required 0 25 0 0 0 0 1 2 0 0
E-PARAPROFESSIONALS Total Employees - 18
Min Fem Asi Blk His Ind Pac Two Wht Mal
# Employed 0 17 0 0 0 0 0 0 18 1
# Available 1.3 7.4 0.3 0.6 0.3 0.1 0.0 0.0 16.7 10.6
Persons Required 2 0 1 1 1 1 0 1 0 8
F-OFFICE AND CLERICAL Total Employees - 117
Min Fem Asi Blk His Ind Pac Two Wht Mal
# Employed 7 79 0 7 0 0 0 0 110 38
# Available 8.3 87.2 0.7 4.8 1.5 0.1 0.2 1.1 106.6 27.6
Persons Required 0 0 1 0 2 1 1 1 0 0
G-SKILLED CRAFT WORKERS Total Employees - 145
Min Fem Asi Blk His Ind Pac Two Wht Mal
# Employed 5 3 0 4 0 1 0 0 140 142
# Available 9.0 8.4 0.6 2.6 2.6 1.4 0.0 1.8 106.4 107.0
Persons Required 3 4 1 0 3 1 1 2 0 0
H-SERVICE MAINTENANCE Total Employees - 222
Min Fem Asi Blk His Ind Pac Two Wht Mal
# Employed 33 8 0 31 2 0 0 0 189 214
# Available 16.0 26.7 1.3 7.5 6.0 0.2 0.0 1.1 198.8 188.1
Persons Required 0 14 2 0 3 1 0 1 0 0

82
DEPARTMENT OF AGRICULTURE Mission
To serve, promote, and protect the agricultural producers, processors, and consumers of Missouri’s food, fuel, and fiber products.
The Missouri Department of Agriculture (MDA), located in Jefferson City, Mo., is dedicated to the promotion and
protection of the state’s agriculture industry. With nearly 100,000 farms located on more than 28 million acres of
farmland, the state’s Department of Agriculture works to connect farmers with consumers.
MDA sets agriculture policy and provides assistance to farmers throughout the state. While the department
maintains its regulatory functions, its expanded duties include consumer protection, public health roles,
environmental advocacy, agricultural marketing, public information and awareness, and promoting new
technology and new uses for Missouri’s agricultural goods.
The Department of Agriculture houses five divisions including Agriculture Business Development, Animal
Health, Grain Inspection & Warehousing, Plant Industries and Weights, Measures & Consumer Protection.
These divisions work each day to promote and protect the backbone of the state’s economy.
As of June 30, 2016, the Missouri Department of Agriculture’s workforce was composed of 333 employees
including 12 minorities (3.60%) and 143 females (42.94%).
The following table and charts show the composition of the workforce at the MDA by gender and race/ethnicity
as of June 30, 2016:
MDA’s FY16 Workforce Demographics
FY16 Workforce
Total Employees 333
Female 143 42.94%
Male 190 57.06%
Minority 12 3.60%
MDA conducted an availability analysis by job group, taking into account both external and internal availability,
and has compared incumbency to estimated availability to determine placement goals.
Of the 33 organizational units at MDA, 7 or 21.21% include minorities, and 31 or 93.94% include females. This
analysis by organizational unit reveals that minorities and women are not significantly underrepresented or
concentrated in any particular organizational unit. It also suggests that there is no policy or practice excluding
minorities or women from any unit, nor is there any racial or sexual discrimination in the selection process.
There were 22 new employees hired during the period from July 01, 2015 to June 30, 2016, including 1 minority
at 5% and 10 women at 45%.
42.94%
57.06%
Workforce Gender Percentages
Female
Male
3.60%
96.40%
Workforce Minority Percentages
Minority
White

83
The following table determines the number of people needed for full representation of the protected class based
on the 80% rule.
In an effort to address underutilization and achieve parity in all job groups, MDA has taken the following steps:
The current MDA leadership has taken steps to increase awareness by visiting elementary schools
throughout the state to promote the importance of the agriculture industry in Missouri.
MDA’s team began a stronger consumer outreach approach taking a part of rural life to urban
communities during events like FarmScape, the Missouri State Fair, and participating in youth
development programs such as FFA, 4-H and the Agriculture Future of America (AFA) Leaders Conference,
representing more than 600 college students.
Continued involvement in programs such as LifeQuest at the University of Missouri and other youth
initiatives at Northwest Missouri State University, Missouri State University and Southeast Missouri State
University, and, open employment positions are advertised at all universities with emphasis on Harris
Stowe, Lincoln University and other diverse colleges and universities throughout the state.
A-OFFICIALS AND ADMINISTRATORS Total Employees - 65
Min Fem Asi Blk His Ind Pac Two Wht Mal
# Employed 0 25 0 0 0 0 0 0 65 40
# Available 7.0 24.7 1.4 2.5 2.5 0.2 0.0 0.4 57.9 40.3
Persons Required 6 0 2 3 2 1 1 1 0 0
B-PROFESSIONALS Total Employees - 131
Min Fem Asi Blk His Ind Pac Two Wht Mal
# Employed 6 69 2 3 0 1 0 0 125 62
# Available 13.6 54.1 4.4 4.3 3.9 0.2 0.1 0.8 114.0 73.5
Persons Required 5 0 2 1 4 0 1 1 0 0
C-TECHNICIANS Total Employees - 79
Min Fem Asi Blk His Ind Pac Two Wht Mal
# Employed 3 12 0 3 0 0 0 0 76 67
# Available 9.4 39.5 0.2 4.6 4.5 0.0 0.0 0.1 69.6 39.5
Persons Required 5 20 1 1 4 1 1 1 0 0
D-PROTECTIVE SERVICE WORKERS Total Employees - 1
Min Fem Asi Blk His Ind Pac Two Wht Mal
# Employed 0 0 0 0 0 0 0 0 1 1
# Available 0.2 0.3 0.0 0.1 0.1 0.0 0.0 0.0 0.8 0.7
Persons Required 1 1 1 1 1 1 1 1 0 0
E-PARAPROFESSIONALS Total Employees - 15
Min Fem Asi Blk His Ind Pac Two Wht Mal
# Employed 2 6 0 1 1 0 0 0 13 9
# Available 3.3 6.7 0.9 1.1 1.0 0.1 0.0 0.2 11.7 8.4
Persons Required 1 0 1 0 0 1 1 1 0 0
F-OFFICE AND CLERICAL Total Employees - 31
Min Fem Asi Blk His Ind Pac Two Wht Mal
# Employed 1 30 0 1 0 0 0 0 30 1
# Available 1.3 29.9 0.1 0.8 0.3 0.0 0.0 0.0 29.7 1.1
Persons Required 1 0 1 0 1 1 1 1 0 0
G-SKILLED CRAFT WORKERS Total Employees - 4
Min Fem Asi Blk His Ind Pac Two Wht Mal
# Employed 0 0 0 0 0 0 0 0 4 4
# Available 0.1 1.0 0.0 0.0 0.0 0.0 0.0 0.0 3.9 3.0
Persons Required 1 1 1 1 1 1 1 1 0 0
H-SERVICE MAINTENANCE Total Employees - 7
Min Fem Asi Blk His Ind Pac Two Wht Mal
# Employed 0 1 0 0 0 0 0 0 7 6
# Available 2.2 1.8 0.2 0.8 1.0 0.1 0.0 0.1 4.8 5.3
Persons Required 2 1 1 1 1 1 1 1 0 0

84
DEPARTMENT OF CONSERVATION Mission
“To protect and manage the fish, forestry, and wildlife resources of the state; to facilitate and provide opportunity for all citizens to use,
enjoy, and learn about these resources.”
The Missouri Department of Conservation (MDC) and the Missouri Conservation Commission were created by
Article IV Sections 40-42 of the Missouri Constitution, which were adopted by the voters of the state in 1936 as
Amendment 4 to the constitution. The Commission is vested with control, management, restoration,
conservation, and regulation of fish, forest, and wildlife resources of the state. The Department of Conservation
owns and oversees hatcheries, sanctuaries, refuges, and reservations, and enforces the state wildlife code. The
Commission consists of four individuals appointed by the governor of the state to serve unpaid six-year terms. No
more than two of the individuals may be from the same political party.
As of June 30, 2016, MDC’s workforce was composed of 1,384 employees including 57 (4.12%) minorities and 342
(24.71%) women.
The following table and charts show the composition of the workforce at MDC by gender and race/ethnicity as of
June 30, 2016.
MDC’s FY16 Workforce Demographics
FY16 Workforce
Total Employees 1,384 Female 342 24.71%
Male 1,042 75.29%
Minority 57 4.12%
The Department of Conservation conducted in-depth analyses of its total employment process. The analysis
included the workforce by organization unit and job group, personnel activity, compensation and other
personnel procedures to determine whether and where impediments to equal employment opportunity exists.
Of the 11 divisions at MDC, 10 or 90.91% include minorities, and 11 or 100% include females. This analysis by
organizational unit reveals that minorities and women are not significantly underrepresented or concentrated in
any particular organizational unit. It also suggests that there is no policy or practice excluding minorities or
women from any departments, nor is there any racial or sexual discrimination in the selection process.
MDC hired 129 new employees during the period from July 01, 2015 to June 30, 2016 including 7 minorities at 5%
and 34 women at 26%.
24.71%
75.29%
Workforce Gender Percentages
Female
Male
4.12%
95.88%
Workforce Minority Percentages
Minority
White

85
The following table determines the number of people needed for full representation of the protected class
based on the 80% rule.
To further address underutilization and to achieve parity, MDC expects to continue its successful outreach
efforts and to ensure all applicants and employees are treated fairly, based on job-related criteria and without
regard to race, color, religion, sexual orientation, national origin, sex, ancestry, age, veteran status, disability,
or any other characteristic protected by applicable law. It is expected that continued efforts will help the
Department reach mutual goals of public service and efficiency, resulting in both service and personal growth.
Equal opportunity is and must be part of the fabric of all personnel decisions. Successful performance on MDC
goals to achieve parity will provide benefits by full utilization and development of previously underutilized
human resources.
A-OFFICIALS AND ADMINISTRATORS Total Employees -272
Min Fem Asi Blk His Ind Pac Two Wht Mal
# Employed 11 80 2 7 2 0 0 0 261 192
# Available 21.8 97.8 2.9 12.3 2.9 0.7 0.0 0.5 230.6 152.8
Persons Required 7 1 2 7 3 2 2 2 0 2
B-PROFESSIONALS Total Employees - 482
Min Fem Asi Blk His Ind Pac Two Wht Mal
# Employed 20 136 6 8 2 3 0 0 462 346
# Available 57.5 207.3 18.0 29.2 5.1 1.5 0.0 1.9 418.8 268.9
Persons Required 26 54 8 15 1 1 0 0 0 0
C- TECHNICIANS Total Employees - 109
Min Fem Asi Blk His Ind Pac Two Wht Mal
# Employed 2 8 1 1 0 0 0 0 107 101
# Available 13.5 48.7 5.7 5.4 1.0 0.0 0.0 1.5 93.6 58.4
Persons Required 7 31 3 2 0 0 0 1 0 0
D-PROTECTIVE SERVICE Total Employees - 162
Min Fem Asi Blk His Ind Pac Two Wht Mal
# Employed 6 15 0 5 1 0 0 0 156 147
# Available 54.6 16.6 0.0 16.3 0.0 0.0 0.0 38.3 106.1 144.1
Persons Required 38 0 0 9 0 0 0 30 0 0
E-PARAPROFESSIONALS Total Employees - 12
Min Fem Asi Blk His Ind Pac Two Wht Mal
# Employed 0 7 0 0 0 0 0 0 12 5
# Available 1.3 7.9 0.0 1.0 0.2 0.0 0.0 0.1 10.7 4.1
Persons Required 1 0 0 0 0 0 0 0 0 0
F-OFFICE & CLERICAL Total Employees - 73
Min Fem Asi Blk His Ind Pac Two Wht Mal
# Employed 5 70 0 4 1 0 0 0 68 3
# Available 8.7 67.0 0.3 6.4 1.2 0.2 0.0 0.7 63.8 5.5
Persons Required 2 0 0 1 0 0 0 0 0 2
G-SKILLED CRAFT WORKERS Total Employees - 97
Min Fem Asi Blk His Ind Pac Two Wht Mal
# Employed 2 3 0 1 1 0 0 0 95 94
# Available 9.7 2.4 0.1 6.0 2.8 0.2 0.0 0.6 87.3 94.6
Persons Required 5 0 0 3 1 0 0 0 0 0
H-SERVICE/MAINTENANCE Total Employees - 177
Min Fem Asi Blk His Ind Pac Two Wht Mal
# Employed 11 23 1 6 1 3 0 0 166 154
# Available 28.9 19.4 0.1 14.4 10.1 0.1 0.1 4.3 142.2 151.8
Persons Required 11 0 0 4 8 0 0 3 0 0

86
DEPARTMENT OF CORRECTIONS
Mission
“The Missouri Department of Corrections supervises and provides rehabilitative services to adult offenders in correctional institutions and
Missouri communities to enhance public safety.”
The Department of Corrections (DOC) was organized as a separate department of state government by an act of
legislation in 1981. The Department is comprised of the Office of the Director and four divisions: Human Services,
Adult Institutions, Offender Rehabilitative Services and Probation and Parole. The executive staff includes the
Department director, deputy director and four division directors.
The Department and its four divisions are staffed by approximately 11,000 employees who are responsible for
providing various levels of supervision for approximately 100,000 convicted felons and misdemeanants.
Our vision, mission and value statements reflect the Department's belief that all persons have value, dignity,
worth and the ability to be productive citizens when given the opportunity.
As of June 30, 2016, DOC’s workforce was composed of 10,846 employees including 885 (8%) minorities and 4,442
(41%) women.
The following table and charts show the composition of the workforce at DOC by gender and race/ethnicity as of
June 30, 2016.
DOC’s FY16 Workforce Demographics
FY16 Workforce
Total Employees 10,846 Female 4,442 40.93%
Male 6,404 59.07%
Minority 885 8.16%
At DOC the selection of employees is made in accordance with procedures established through the State Merit
System and in compliance with state statutes to ensure selections are made on an equitable basis. An analysis of
composition of the workforce by job group indicated no underutilization of females in job groups A-Officials and
Administrators, B-Professionals, E-Paraprofessionals and F-Office and Clerical. Female incumbency was less than
availability in job group C-Technicians, while a much larger difference was noted in job group D-Protective-
Service Workers. Overall minority incumbency shows no underutilization in job groups A-Officials and
Administrators, B-Professionals, C-Technicians, D-Protective Service Workers, E-Paraprofessionals and F-Office
and Clerical. However, overall minority incumbency is less than availability in job groups G-Skilled Craft Workers
and H-Service Maintenance.
DOC hired 1,874 employees from July 1, 2015 to June 30, 2016, including 194 minorities (10%) and 793 females at
(42%).
40.93%
59.04%
Workforce Gender Percentages
Female
Male
8.16%
91.84%
Workforce Minority Percentages
Minority
White

87
The following table determines the number of people needed for full representation of the protected class
based on the 80% rule.
To further address underutilization and to achieve parity, it is the policy of the Department of Corrections to
select, develop and promote employees based on their individual ability and job performance. It has been, and
shall continue to be, the policy of DOC to provide equal employment opportunities to all people in all aspects of
employer and employee relations without discrimination. This affects decisions including, but not limited to,
compensation, benefits, terms and conditions of employment, opportunities for promotion, training and
development, transfers, discipline, evaluations and other privileges of employment. It has been and shall
continue to be DOC’s policy to maintain a working environment free of harassment, discrimination and
intimidation. It is further the policy of the Department of Corrections to comply with the letter and spirit of
applicable local, state and federal statutes concerning equal employment opportunity.
A-OFFICIALS AND ADMINISTRATORS Total Employees: 278
Min Fem Asi Blk His Ind Pac Two Wht Mal
# Employed 19 128 0 18 1 0 0 0 259 150
# Available 13.9 98.0 1.5 8.3 2.3 0.4 0.0 1.1 228.8 144.7
Persons Required 0 0 2 0 1 1 0 1 0 0
B-PROFESSIONALS Total Employees: 2,616
Min Fem Asi Blk His Ind Pac Two Wht Mal
# Employed 270 1501 11 224 32 2 0 0 2346 1115
# Available 193.6 965.0 34.3 105.9 25.9 4.4 0.5 22.0 1733.4 962.2
Persons Required 0 0 17 0 0 2 1 18 0 0
C-TECHNICIANS Total Employees: 92
Min Fem Asi Blk His Ind Pac Two Wht Mal
# Employed 6 31 1 4 1 0 0 0 86 61
# Available 6.1 39.7 0.4 4.4 0.7 0.3 0.0 0.5 66.4 32.8
Persons Required 0 1 0 0 0 1 1 1 0 0
D-PROTECTIVE SERVICE WORKERS Total Employees: 5,594
Min Fem Asi Blk His Ind Pac Two Wht Mal
# Employed 410 1412 28 277 81 21 0 0 5184 4182
# Available 393.8 2566.5 52.6 192.4 75.5 21.8 0.6 50.9 3900.1 1728.0
Persons Required 0 642 15 0 0 0 1 41 0 0
E-PARAPROFESSIONALS Total Employees:251
Min Fem Asi Blk His Ind Pac Two Wht Mal
# Employed 72 122 2 68 2 0 0 0 179 129
# Available 29.9 97.9 4.2 19.2 3.6 0.4 0.1 2.5 163.6 95.6
Persons Required 0 0 2 0 1 1 1 3 0 0
F-OFFICE AND CLERICAL Total Employees: 1,116
Min Fem Asi Blk His Ind Pac Two Wht Mal
# Employed 79 1003 5 65 9 0 0 0 1037 113
# Available 82.7 915.3 6.9 51.4 12.2 1.8 1.6 8.6 1023.0 190.3
Persons Required 0 0 1 0 1 2 2 7 0 40
G-SKILLED CRAFT WORKERS Total Employees: 255
Min Fem Asi Blk His Ind Pac Two Wht Mal
# Employed 2 16 1 0 0 1 0 0 253 239
# Available 9.2 13.5 0.3 2.4 2.4 1.0 0.0 3.0 170.7 166.4
Persons Required 6 0 0 2 2 0 0 3 0 0
H-SERVICE MAINTENANCE Total Employees: 644
Min Fem Asi Blk His Ind Pac Two Wht Mal
# Employed 27 229 0 23 3 0 0 0 617 415
# Available 45.1 199.5 5.0 24.3 10.1 1.7 0.1 3.9 497.6 343.1
Persons Required 10 0 4 0 6 2 1 4 0 0

88
DEPARTMENT OF ECONOMIC DEVELOPMENT Mission
To create solid, high- paying jobs and to boost economic development across the state to help local communities grow and prosper.
The Missouri Department of Economic Development (DED) administers a wide array of services and programs
designed to enhance Missouri's economic growth in the 21st century. These essential services focus on workers,
businesses and communities. The department is composed of agencies that administer statutory requirements
and department policy in the areas of community, economic and workforce development. Helping the
department with its mission are a number of divisions, boards, commissions and councils working together to
ensure the state meets the Governor's vision of making Missouri the best possible location to live, work, raise a
family and visit.
The Business and Community Services Division, Division of Workforce Development, Division of Energy, Division of
Tourism, Missouri Development Finance Board, Missouri Housing Development Commission, Missouri Arts Council,
Missouri Women’s Council, and the Missouri Community Service Commission are all housed within DED, as are the
Missouri Public Council Commission and the Office of Public Counsel.
As of June 30, 2016, DED’s workforce was composed of 795 employees including 157 (19.75%) minorities and 479
(60.25%) women.
The following table and charts show the composition of the workforce at DED by gender and race/ethnicity as of
June 30, 2016.
DED’s FY16 Workforce Demographics
FY16 Workforce
Total Employees 795 Female 479 60.25%
Male 316 39.75%
Minority 157 19.75%
An analysis was conducted on DED’s total employment process, including evaluating the workforce by
organizational unit and job group, personnel activity, compensation systems, and other personnel procedures to
determine whether and where impediments to equal employment opportunity exist. Of the 87 organizational
units, 46 or 52.87% include minorities, and 81 or 93.1% include females. This analysis by organizational unit
reveals that minorities and women are not significantly underrepresented or concentrated in any particular
organizational unit. It also suggests that there is no policy or practice excluding minorities or women from any
departments, nor is there any racial or sexual discrimination in the selection process.
DED hired 60 new employees during the period from July 01, 2015 to June 30, 2016, including 11 minorities at
18% and 35 women at 58%.
60.25%
39.75%
Workforce Gender Percentages
Female
Male
19.75%
80.25%
Workforce Minority Percentages
Minority
White
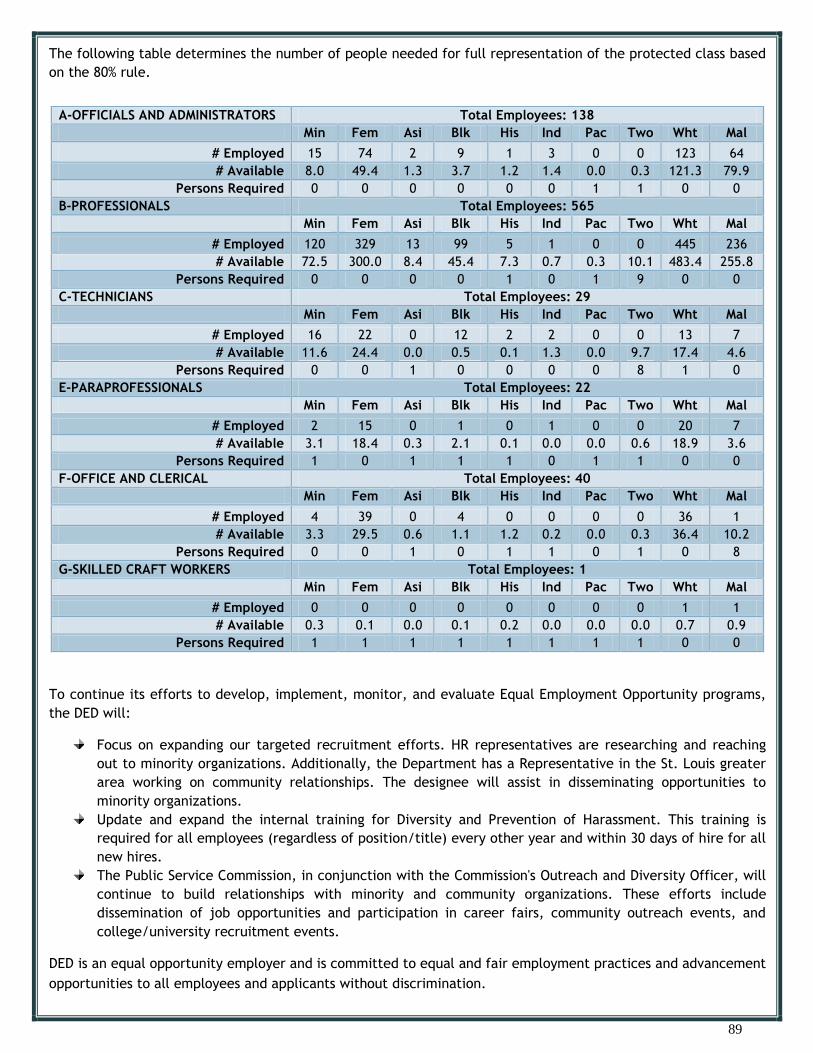
89
The following table determines the number of people needed for full representation of the protected class based
on the 80% rule.
To continue its efforts to develop, implement, monitor, and evaluate Equal Employment Opportunity programs,
the DED will:
Focus on expanding our targeted recruitment efforts. HR representatives are researching and reaching
out to minority organizations. Additionally, the Department has a Representative in the St. Louis greater
area working on community relationships. The designee will assist in disseminating opportunities to
minority organizations.
Update and expand the internal training for Diversity and Prevention of Harassment. This training is
required for all employees (regardless of position/title) every other year and within 30 days of hire for all
new hires.
The Public Service Commission, in conjunction with the Commission's Outreach and Diversity Officer, will
continue to build relationships with minority and community organizations. These efforts include
dissemination of job opportunities and participation in career fairs, community outreach events, and
college/university recruitment events.
DED is an equal opportunity employer and is committed to equal and fair employment practices and advancement
opportunities to all employees and applicants without discrimination.
A-OFFICIALS AND ADMINISTRATORS Total Employees: 138
Min Fem Asi Blk His Ind Pac Two Wht Mal
# Employed 15 74 2 9 1 3 0 0 123 64
# Available 8.0 49.4 1.3 3.7 1.2 1.4 0.0 0.3 121.3 79.9
Persons Required 0 0 0 0 0 0 1 1 0 0
B-PROFESSIONALS Total Employees: 565
Min Fem Asi Blk His Ind Pac Two Wht Mal
# Employed 120 329 13 99 5 1 0 0 445 236
# Available 72.5 300.0 8.4 45.4 7.3 0.7 0.3 10.1 483.4 255.8
Persons Required 0 0 0 0 1 0 1 9 0 0
C-TECHNICIANS Total Employees: 29
Min Fem Asi Blk His Ind Pac Two Wht Mal
# Employed 16 22 0 12 2 2 0 0 13 7
# Available 11.6 24.4 0.0 0.5 0.1 1.3 0.0 9.7 17.4 4.6
Persons Required 0 0 1 0 0 0 0 8 1 0
E-PARAPROFESSIONALS Total Employees: 22
Min Fem Asi Blk His Ind Pac Two Wht Mal
# Employed 2 15 0 1 0 1 0 0 20 7
# Available 3.1 18.4 0.3 2.1 0.1 0.0 0.0 0.6 18.9 3.6
Persons Required 1 0 1 1 1 0 1 1 0 0
F-OFFICE AND CLERICAL Total Employees: 40
Min Fem Asi Blk His Ind Pac Two Wht Mal
# Employed 4 39 0 4 0 0 0 0 36 1
# Available 3.3 29.5 0.6 1.1 1.2 0.2 0.0 0.3 36.4 10.2
Persons Required 0 0 1 0 1 1 0 1 0 8
G-SKILLED CRAFT WORKERS Total Employees: 1
Min Fem Asi Blk His Ind Pac Two Wht Mal
# Employed 0 0 0 0 0 0 0 0 1 1
# Available 0.3 0.1 0.0 0.1 0.2 0.0 0.0 0.0 0.7 0.9
Persons Required 1 1 1 1 1 1 1 1 0 0

90
DEPARTMENT OF ELEMENTARY AND SECONDARY
EDUCATION Mission
“To guarantee the superior preparation and performance of every child in school and in life.”
The Commissioner of Education directs the Department of Elementary and Secondary Education (DESE) and fulfills
other duties as prescribed by law (Section 161.122, RSMo). The law states that the Commissioner shall “seek in
every way to elevate the standards and efficiency of the instruction given in the public schools of the state."
Under the Commissioner of Education the Department organization reflects functions under two divisions,
Financial and Administrative Services and Learning Services. Within the Division of Learning Services we have six
Offices: Office of Educator Quality, Office of Special Education, Office of College and Career Readiness, Office
of Data Systems Management, Office of Quality Schools, and the Office of Vocational and Rehabilitation Services.
As of June 30, 2016, DESE’s workforce was composed of 1,686 employees including 215 (12.75%) minorities and
1,366 (81.02%) women.
The following table and charts show the composition of the workforce at DESE by gender and race/ethnicity as of
June 30, 2016.
DESE’s Workforce Demographics
FY16 Workforce
Total Employees 1,686 Female 1,366 81.02%
Male 320 18.98%
Minority 215 12.75%
DESE has conducted analyses of its total employment process, including evaluating the workforce by
organizational unit and job group, personnel activity, compensation systems, and other personnel procedures to
determine whether and where impediments to equal employment opportunity exist.
Of the 116 organizational units at DESE, 59 or 50.86% include minorities, and 115 or 99.14% include females. This
analysis by organizational unit reveals that minorities and women are not significantly underrepresented or
concentrated in any particular organizational unit. It also suggests that there is no policy or practice excluding
minorities or women from any departments, nor is there any racial or sexual discrimination in the selection
process.
DESE hired 385 new employees during the period from July 01, 2015 to June 30, 2016, including 66 minorities at
17.21% and 311 women at 80.8%.
81.02% 18.98%
Workforce Gender Percentages
Female
Male
12.75% 87.25%
Workforce Minority Percentages
Minority
White

91
The following table determines the number of people needed for full representation of the protected class based
on the 80% rule.
To further address underutilization and to achieve parity, DESE will continue to advertise vacant positions in a
variety of themes to include newspapers, websites set specifically for recruitment purposes (CareerBuilder.com)
for example. When possible, job announcements will be advertised in certain business journals or career group
pamphlets and WebPages when specific attributes or certifications may be a required component of the position.
DESE will be implementing the “ApplicantPro”, competitive hiring software that will assist with DESE’s hiring
process. With the planned implementation of “ApplicantPro” to other areas in the Department other than the
Office of Vocational Rehabilitation, DESE is expecting a substantial increase in the qualified applicant pool for all
vacant positions across the state.
The Department will continue to attend career fairs held in areas where it has vacant positions; this will allow
the hiring staff to be present and available to answer specific questions regarding the duties and responsibilities
of the vacant positions. DESE will continue to work with the Office of Administration's Center for Management
and Development on providing diversity training to our employees.
A-0FFICIALS AND ADMINISTRATORS Total Employees - 270
Min Fem Asi Blk His Ind Pac Two Wht Mal
# Employed 17 178 1 13 2 1 0 0 253 92
# Available 23.5 149.8 0.3 21.9 0.7 0.2 0.0 0.2 238.9 112.5
Persons Required 2 0 0 5 0 0 1 1 0 0
B-PROFESSIONALS Total Employees - 726
Min Fem Asi Blk His Ind Pac Two Wht Mal
# Employed 77 586 9 57 8 2 0 0 649 140
# Available 54.2 410.8 14.3 30.8 5.3 1.6 0.1 2.1 559.2 202.5
Persons Required 0 0 3 0 0 0 1 2 0 22
C-TECHNICIANS Total Employees - 2
Min Fem Asi Blk His Ind Pac Two Wht Mal
# Employed 0 2 0 0 0 0 0 0 2 0
# Available 0.1 1.3 0.0 0.1 0.0 0.0 0.0 0.0 1.7 0.5
Persons Required 1 0 1 1 1 1 0 1 0 1
D-PROTECTIVE SERVICE WORKERS Total Employees -1
Min Fem Asi Blk His Ind Pac Two Wht Mal
# Employed 0 0 0 0 0 0 0 0 1 1
# Available 0.1 0.3 0.0 0.0 0.0 0.0 0.0 0.0 0.7 0.5
Persons Required 1 1 1 1 1 1 0 1 0 0
E-PARAPROFESSIONALS Total Employees - 375
Min Fem Asi Blk His Ind Pac Two Wht Mal
# Employed 73 327 2 67 3 1 0 0 302 48
# Available 32.7 203.3 5.0 21.3 3.9 0.9 0.0 1.5 278.9 108.2
Persons Required 0 0 3 0 1 0 1 2 0 39
F-OFFICE AND CLERICAL Total Employees - 235
Min Fem Asi Blk His Ind Pac Two Wht Mal
# Employed 30 231 4 25 1 0 0 0 205 4
# Available 17.3 175.1 1.2 10.8 2.2 0.2 0.3 2.6 197.1 39.4
Persons Required 0 0 0 0 1 1 1 3 0 28
H-SERVICE MAINTENANCE Total Employees - 77
Min Fem Asi Blk His Ind Pac Two Wht Mal
# Employed 18 42 0 18 0 0 0 0 59 35
# Available 10.1 31.2 1.6 5.0 1.9 0.1 0.0 1.4 48.5 27.4
Persons Required 0 0 2 0 2 1 1 2 0 0

92
DEPARTMENT OF HEALTH AND SENIOR SERVICES Mission
“To be the leader in promoting, protecting and partnering for health.”
Senate Bill 25 created the Department of Health in 1985. The Bill elevated the "Division" of Health within the
Department of Social Services to a separate cabinet level "Department" to become the Department of Health.
This enhanced Missouri's ability to respond to the ever-increasing challenges of protecting the public's health. The
Department grew once again to meet the public's needs when the Division of Aging (within the Department of
Social Services) was transferred to the Department of Health creating the present-day Department of Health and
Senior Services. This change was effective Aug. 28, 2001.
The Department of Health and Senior Services (DHSS) serves the citizens of Missouri by working to improve the
health and quality of life for Missourians of all ages. Combining senior and public health issues into one system
has allowed the departments to more effectively focus on prevention and quality of life for all Missourians. The
department is organized into the Division of Administration and three programmatic divisions: Division of
Community & Public Health, Division of Regulation & Licensure, and the Division of Senior & Disability
Services.
As of June 30, 2016, DHSS’s workforce was composed of 1,704 employees including 226 (13.26%) minorities and
1,383 (81.16%) women.
The following table and charts show the composition of the workforce at DHSS by gender and race/ethnicity as of
June 30, 2016.
DHSS’s FY16 Demographics
FY16 Workforce
Total Employees 1,704 Female 1,383 81.16%
Male 321 18.83%
Minority 226 11.68%
DHSS conducted analyses of its total employment process, including evaluating the workforce by organizational
unit and job group, personnel activity, compensation systems, and other personnel procedures to determine
whether and where impediments to equal employment opportunity exist.
Of the 99 organizational units at DHSS, 54 or 54.55% include minorities, and 96 or 96.97% include females. This
analysis by organizational unit reveals that minorities and women are not significantly underrepresented or
concentrated in any particular organizational unit. It also suggests that there is no policy or practice excluding
minorities or women from any departments, nor is there any racial or sexual discrimination in the selection
process.
DHSS hired 317 new employees during the period from July 01, 2015 to June 30, 2016, including 51 minorities at
16% and 257 women at 81%.
81.17%
18.83%
Workforce Gender Percentages
Female
Male
13.26%
86.74%
Workforce Minority Percentages
Minority
White

93
The following table determines the number of people needed for full representation of the protected class based
on the 80% rule.
To continue its efforts to develop, implement, monitor, and evaluate Equal Employment Opportunity programs,
the DHSS plans to:
Continue on with its Diversity and Cultural Awareness training;
Continue to support and evolve the Cultural Competence and Diversity Awareness Work Group;
Increase recruiting efforts at universities, colleges, and career fairs, etc., and while at these sessions-
inform prospective employees of our non-discrimination policy;
Increase recognition and awareness through surveys and recognition of diversity and will do this in order
to create an atmosphere of inclusion and education to help retain its current diverse workforce.
DHSS has also recently developed a Cultural Competency and Diversity Awareness Workgroup, whose purpose is
to educate DHSS staff on the importance of diversity, cultural competency, and inclusion in the workforce. The
workgroup determined this is needed in order to build strong working relationships within and outside DHSS;
deliver meaningful and impactful services; and recruit and retain a diverse workforce. Department Director
Peter Lyskowski developed the idea for the workgroup and is also a member of the group.
DHSS conducted special recruitment activities at the following schools and universities: Lincoln University,
University of Missouri, University of Central Missouri, Avila University, and Fontbonne University.
A-OFFICIALS AND ADMINISTRATORS Total Employees-243
Min Fem Asi Blk His Ind Pac Two Wht Mal
# Employed 29 172 9 18 2 0 0 0 214 71
# Available 21.9 152.7 4.3 13.2 3.2 0.2 0.0 0.9 213.9 83.2
Persons Required 0 0 0 0 1 1 1 1 0 0
B-PROFESSIONALS Total Employees - 1181
Min Fem Asi Blk His Ind Pac Two Wht Mal
# Employed 164 963 13 131 15 5 0 0 1017 218
# Available 196.9 801.8 22.1 152.3 15.9 2.6 0.2 3.7 984.1 379.5
Persons Required 0 0 5 0 0 0 1 3 0 86
C-TECHNICIANS Total Employees - 23
Min Fem Asi Blk His Ind Pac Two Wht Mal
# Employed 4 20 0 3 1 0 0 0 19 3
# Available 2.7 10.7 0.0 2.5 0.2 0.0 0.0 0.0 20.3 12.3
Persons Required 0 0 1 0 0 0 0 1 0 7
E-PARAPROFESSIONALS Total Employees - 7
Min Fem Asi Blk His Ind Pac Two Wht Mal
# Employed 0 6 0 0 0 0 0 0 7 1
# Available 0.6 3.3 0.1 0.4 0.1 0.0 0.0 0.1 6.4 3.7
Persons Required 1 0 1 1 1 1 0 1 0 2
F-OFFICE AND CLERICAL Total Employees - 247
Min Fem Asi Blk His Ind Pac Two Wht Mal
# Employed 29 221 3 22 4 0 0 0 218 26
# Available 23.4 179.3 1.3 16.7 3.1 0.5 0.1 1.5 223.3 67.3
Persons Required 0 0 0 0 0 1 1 2 0 28
H-SERVICE MAINTENANCE Total Employees - 3
Min Fem Asi Blk His Ind Pac Two Wht Mal
# Employed 0 1 0 0 0 0 0 0 3 2
# Available 0.2 0.9 0.0 0.1 0.0 0.0 0.0 0.0 2.8 2.1
Persons Required 1 0 1 1 1 1 0 1 0 0

94
DEPARTMENT OF HIGHER EDUCATION
Mission
“The Coordinating Board for Higher Education, the Missouri Department of Higher Education, and the state’s institutions of
higher education will work collaboratively to support a diverse system of affordable, accessible, high-quality educational
institutions that demonstrate student learning and development, encourage and support innovation, foster civic
engagement, enhance the cultural life of Missourians, and contribute to economic growth.”
At the direction of the Coordinating Board for Higher Education (CBHE), the Missouri Department of Higher
Education (MDHE) strives to coordinate higher education policy that fosters a quality postsecondary system, as
well as to increase participation in Missouri’s public institutions. The state system of higher education serves
more than 417,000 students through 13 public four-year universities, 19 public two-year colleges, 25 independent
colleges, 10 specialized/technical colleges, 17 theological institutions, and more than 150 proprietary and
private career schools.
In addition to its primary responsibilities, the MDHE has served as a guaranty agency within the Federal Family
Education Loan Program since 1979 and is one of 32 guarantors operating nationwide. As part of its responsibility
as a FFELP student loan guarantor, the MDHE provides numerous programs to help Missouri student’s access and
succeed in postsecondary education.
As of June 30, 2016, MDHE’s workforce was composed of 54 employees including 2 (3.7%) minorities and 45
(83.33%) women.
The following table and charts show the composition of the workforce at MDHE by gender and race/ethnicity as
of June 30, 2016.
MDHE’s FY16 Demographics
FY16 Workforce
Total Employees 54 Female 45 83.33%
Male 9 16.67%
Minority 2 3.70%
MDHE conducted analyses of its total employment process, including evaluating the workforce by organizational
unit and job group, personnel activity, compensation systems, and other personnel procedures to determine
whether and where impediments to equal employment opportunity exist.
Of the 13 organizational units in MDHE, 2 or 15.38% include minorities, and 12 or 92.31% include females. This
analysis by organizational unit reveals that minorities and women are not significantly underrepresented or
concentrated in any particular organizational unit. It also suggests that there is no policy or practice excluding
minorities or women from any departments, nor is there any racial or sexual discrimination in the selection
process.
MDHE hired 3 new employees during the period from July 01, 2015 to June 30, 2016, including 2 women at 67%.
83.33%
16.67%
Workforce Gender Percentages
Female
Male
3.70% 96.30%
Workforce Minority Percentages
Minority
White

95
The following table determines the number of people needed for full representation of the protected class
based on the 80% rule.
In an effort to address underutilization and achieve parity in all job groups, the MDHE will continue to do the
following:
Analyze additional personnel activities to determine whether and where impediments to equal
employment opportunity exist and whether there are significant selection disparities by race/ethnicity
or gender. These activities include applicant flow, hires, promotions, terminations, and other personnel
actions.
Minority and women, as well as non-minority and male, employees are actively encouraged to refer
applicants to our organization.
Provide an orientation program to inform new employees of their equal employment responsibilities,
promotional opportunities, MDHE rules, ways to alleviate any problems that might arise, and any other
issues related to affirmative action compliance.
Utilize the Internet to identify targeted recruitment sites for qualified minority and female applicants.
Contact universities and two- and four-year local colleges, vocational technical schools, high schools,
local business schools, and state and community organizations which attract qualified minority and
female students. MDHE will advise these institutions that we are an equal opportunity employer and
that the department welcomes minority and female applicants.
On-the-job training is provided to all qualified employees to assist them in developing the necessary
knowledge and skills for promotion to higher level jobs.
Participate in job fair and career day activities and also consider relevant work experience programs.
A-OFFICIALS AND ADMINISTRATORS Total Employees - 10
Min Fem Asi Blk His Ind Pac Two Wht Mal
# Employed 0 6 0 0 0 0 0 0 10 4
# Available 0.3 4.6 0.0 0.2 0.0 0.0 0.0 0.0 8.9 4.6
Persons Required 1 0 1 1 1 1 1 1 0 0
B-PROFESSIONALS Total Employees - 28
Min Fem Asi Blk His Ind Pac Two Wht Mal
# Employed 2 23 0 2 0 0 0 0 26 5
# Available 1.6 14.8 0.4 0.7 0.2 0.1 0.0 0.2 22.0 8.8
Persons Required 0 0 1 0 1 1 1 1 0 3
E-PARAPROFESSIONALS Total Employees - 12
Min Fem Asi Blk His Ind Pac Two Wht Mal
# Employed 0 12 0 0 0 0 0 0 12 0
# Available 0.5 7.6 0.1 0.2 0.1 0.0 0.0 0.1 8.9 1.7
Persons Required 1 0 1 1 1 1 1 1 0 2
F-OFFICE AND CLERICAL Total Employees -4
Min Fem Asi Blk His Ind Pac Two Wht Mal
# Employed 0 4 0 0 0 0 0 0 4 0
# Available 0.3 0.2 0.0 0.1 0.1 0.0 0.0 0.0 2.7 2.8
Persons Required 1 0 1 1 1 1 0 1 0 3

96
DEPARTMENT OF INSURANCE, FINANCIAL
INSTITUTIONS AND PROFESSIONAL REGISTRATION
Mission
“To efficiently and effectively encourage a fair and open market for consumer service industries.”
The Missouri Department of Insurance was created by the Missouri Legislature on Mar. 4, 1869, to regulate the
insurance industry. The Department was a division within the Missouri Department of Economic Development
before Jun. 30, 1991. The Department then became a Cabinet-level agency based on a constitutional amendment
passed by voters on Aug. 7, 1990. Executive Order 6-04 which became effective Aug. 28, 2006 restructured the
Department to include the divisions of: Finance, Credit Unions, and Professional Registration.
The new Department of Insurance, Financial Institutions and Professional Registration (DIFP) consists of seven
divisions: Resource Administration, Consumer Affairs, Insurance Solvency and Company Regulation, Insurance
Market Regulation, Finance, Credit Unions and Professional Registration. The Department’s organizational
structure also includes the Director’s Office. DIFP protects consumers through the oversight and regulation of
the insurance, financial and professional services industries.
As of June 30, 2016, DIFP’s workforce was composed of 523 employees including 32 (6.12%) minorities and 313
(59.85%) women.
The following table and charts show the composition of the workforce at DIFP by gender and race/ethnicity as of
June 30, 2016.
DIFP’s FY16 Demographics
FY16 Workforce
Total Employees 523 Female 313 59.85%
Male 210 40.15%
Minority 32 6.12%
DIFP conducted analyses of its total employment process, including evaluating the workforce by organizational
unit and job group, personnel activity, compensation systems, and other personnel procedures to determine
whether and where impediments to equal employment opportunity exist.
Of the 42 departments at DIFP, 19 or 45.24% include minorities, and 41 or 97.62% include females. This analysis
by organizational unit reveals that minorities and women are not significantly underrepresented or concentrated
in any particular organizational unit. It also suggests that there is no policy or practice excluding minorities or
women from any departments, nor is there any racial or sexual discrimination in the selection process.
DIFP hired 30 new employees during the period from July 01, 2015 to June 30, 2016, including 3 minorities at 10%
and 18 women at 60%.
59.85%
40.15%
Workforce Gender Percentages
Female
Male
6.12%
93.88%
Workforce Minority Percentages
Minority
White

97
The following table determines the number of people needed for full representation of the protected class
based on the 80% rule.
In an effort to address underutilization and achieve parity in all job groups, DIFP recognizes that developing a
diverse pool of applicants is an important step in bringing historically under-utilized individuals into the
department's labor force. Recruitment is an important tool to assist in generating a greater number of under-
represented individuals to compete in the selection process. The Department advertises job openings on our
website, through announcements sent to higher education institutions and newspaper advertisements. DIFP also
may advertise on the web through LinkedIn, CareerBuilder.com and monster.com which reaches applicants
worldwide. The Department utilizes the resources of the Office of Equal Opportunity, and other professional
organizations such as the Missouri Bar, CPA associations, and Actuarial Societies to recruit for openings. As
budget permits and opportunities exist, the department participates in campus career days, job fairs, and
similar programs to provide general job information.
DIFP provides training and professional development programs to help employees achieve and maintain a high
level of work performance and to enhance opportunities for career growth. Training related to improving and
enhancing management and supervisory skills is required for all managers and supervisors according to the
state’s Management Training Rule and is overseen by the departments Leadership Development Coordinator.
Training is available and encouraged for all employees regardless of protected category status. The Department
provides sexual harassment prevention and diversity training to department staff on an annual basis. The sexual
harassment and diversity training is a required component of new employee orientation. DIFP will continue to
encourage staff to participate in the numerous training opportunities available through the Office of
Administration and other outside trainings as appropriate.
A-OFFICIALS AND ADMINISTRATORS Total Employed - 93
Min Fem Asi Blk His Ind Pac Two Wht Mal
# Employed 6 57 1 5 0 0 0 0 87 36
# Available 7.5 36.2 1.0 4.4 1.2 0.2 0.0 0.7 85.6 56.9
Persons Required 0 0 0 0 1 1 1 1 0 10
B-PROFESSIONALS Total Employed - 296
Min Fem Asi Blk His Ind Pac Two Wht Mal
# Employed 20 136 4 14 1 1 0 0 276 160
# Available 23.0 136.6 4.2 14.3 2.7 0.3 0.1 1.4 262.6 149.0
Persons Required 0 0 0 0 2 0 1 2 0 0
C-TECHNICIANS Total Employed - 92
Min Fem Asi Blk His Ind Pac Two Wht Mal
# Employed 4 82 0 4 0 0 0 0 88 10
# Available 8.1 42.4 0.1 5.6 0.1 1.4 0.0 0.9 69.8 35.5
Persons Required 3 0 1 1 1 2 0 1 0 19
E-PARAPROFESSIONALS Total Employed - 13
Min Fem Asi Blk His Ind Pac Two Wht Mal
# Employed 0 12 0 0 0 0 0 0 13 1
# Available 0.9 9.4 0.0 0.4 0.0 0.4 0.0 0.0 12.1 3.6
Persons Required 1 0 1 1 1 1 0 1 0 2
F-OFFICE AND CLERICAL Total Employed - 29
Min Fem Asi Blk His Ind Pac Two Wht Mal
# Employed 2 26 0 2 0 0 0 0 27 3
# Available 1.1 20.3 0.0 0.7 0.1 0.0 0.0 0.2 23.2 4.1
Persons Required 0 0 1 0 1 1 1 1 0 1

98
DEPARTMENT OF LABOR AND INDUSTRIAL
RELATIONS Mission
“To promote industry and labor and protect the rights and safety of Missouri's workforce."
The Missouri Department of Labor and Industrial Relations (DOLIR) was created by Article IV, Section 49 of the
Missouri Constitution. The Department is responsible for the administration and enforcement of state laws
related to employment. DOLIR promotes economic security, safe and healthy workplaces, as well as protects
wage earners and individuals against discrimination by improving working conditions, enforcing labor and anti-
discrimination laws, and helping those who are unemployed or injured on the job.
Agencies operating within the Department are: the Labor and Industrial Relations Commission, the State Board of
Mediation, the Division of Labor Standards, the Division of Workers’ Compensation, the Division of Employment
Security, the Missouri Commission on Human Rights, and the Director and Staff Administration.
As of June 30, 2016, DOLIR’s workforce was composed 752 employees including 79 (10.51%) minorities and 512
(68.09%) women.
The following table and charts show the composition of the workforce at DOLIR by gender and race/ethnicity as
of June 30, 2016.
DOLIR’s FY16 Workforce Demographics
FY16 Workforce
Total Employees 752 Female 512 68.09%
Male 240 31.91%
Minority 79 10.51%
DOLIR conducted analyses of its total employment process, including evaluating the workforce by organizational
unit and job group, personnel activity, compensation systems, and other personnel procedures to determine
whether and where impediments to equal employment opportunity exist.
Of the 79 organizational units at DOLIR, 34 or 43.04% include minorities, and 71 or 89.87% include females. This
analysis by organizational unit reveals that minorities and women are not significantly underrepresented or
concentrated in any particular organizational unit. It also suggests that there is no policy or practice excluding
minorities or women from any departments, nor is there any racial or sexual discrimination in the selection
process.
DOLIR hired 87 new employees during the period from July 01, 2015 to June 30, 2016, including 8 minorities at 9%
and 60 women at 69%.
68.09%
31.91%
Workforce Gender Percentages
Female
Male
10.51%
89.49%
Workforce Minority Percentages
Minority
White

99
The following table determines the number of people needed for full representation of the protected class
based on the 80% rule.
In an effort to address underutilization and achieve parity in all job groups, the DOLIR is doing the following:
Continue to send Recruitment announcements to various colleges and universities, professional
organizations such as Missouri Bar and the Court Reporters Association, to attract a more diversified pool
of applicants. DOLIR’s internet and intranet job opportunities page has been expanded and redesigned.
DOLIR quarterly places information on the Internet at MOCareers for all merit classifications used by our
agency that are currently open for recruitment. This allows applicants to get on the merit registers
before a vacancy occurs. When needed, DOLIR advertises in newspapers, and/or notifies college career
services to assist with recruitment by posting our vacancies.
Post job opportunities on the internet on the DOLIR website with vacancies and merit classifications that
are open for recruitment. Internally, DOLIR posts Job Announcements on our daily Employee News on the
intranet.
Human Resources and Human Relations will also look for training opportunities for career advancement.
In addition, strategies will be developed to continue to enhance DOLIR’s diverse workforce.
HR is regularly a part of all interview panels for positions with a pay grade of 13 and above. All
employees who regularly participate in interview panels attended the interview class provided by the
Department's Training Unit.
DOLIR’s new employee orientation was redesigned and is now conducted immediately for new hires. Also
implemented is a 90 day follow-up training for the new hires to explain career opportunities and to
further acquaint them with the Department. These efforts should have a positive result towards
retention of those hired.
The Department of Labor and Industrial Relations is committed to workforce diversity, and believes that the
State of Missouri works best, if all of its citizens and employees are provided an opportunity to work and
participate in an environment free from prejudice on account of race, color, religion, national origin, sex,
ancestry, age, sexual orientation, veteran status, or disability.
A-OFFICIALS AND ADMINISTRATORS Total Employees - 97
Min Fem Asi Blk His Ind Pac Two Wht Mal
# Employed 8 47 2 6 0 0 0 0 89 50
# Available 5.1 36.9 0.6 2.9 1.0 0.2 0.0 0.3 89.8 58.0
Persons Required 0 0 0 0 1 1 1 1 0 0
B-PROFESSIONALS Total Employees - 466
Min Fem Asi Blk His Ind Pac Two Wht Mal
# Employed 59 300 1 49 5 4 0 0 407 166
# Available 39.4 214.0 6.1 22.4 5.5 0.5 0.2 4.5 383.3 208.6
Persons Required 0 0 4 0 0 0 1 4 0 1
C-TECHNICIANS Total Employees - 4
Min Fem Asi Blk His Ind Pac Two Wht Mal
# Employed 0 2 0 0 0 0 0 0 4 2
# Available 0.4 2.0 0.0 0.3 0.0 0.0 0.0 0.0 3.4 1.7
Persons Required 1 0 1 1 1 1 1 1 0 0
E-PARAPROFESSIONALS Total Employees - 37
Min Fem Asi Blk His Ind Pac Two Wht Mal
# Employed 2 28 0 1 0 1 0 0 35 9
# Available 3.1 16.3 0.5 1.6 0.5 0.1 0.0 0.4 30.5 17.3
Persons Required 1 0 1 1 1 0 1 1 0 5
F-OFFICE AND CLERICAL Total Employees - 148
Min Fem Asi Blk His Ind Pac Two Wht Mal
# Employed 10 135 0 9 1 0 0 0 138 13
# Available 13.0 110.6 0.7 8.0 2.0 0.4 0.1 1.7 130.4 32.8
Persons Required 1 0 1 0 1 1 1 2 0 14

100
DEPARTMENT OF MENTAL HEALTH Mission
“Prevention, treatment, and promotion of public understanding for Missourians with mental illnesses, developmental disabilities, and
addictions."
The Missouri Department of Mental Health (DMH) was established on July 1, 1974. DMH serves approximately
170,000 Missourians annually through state-operated facilities and contracts with private organizations and
individuals. The seven state-operated psychiatric facilities include inpatient psychiatric care for adults and
children, as well as sex offender rehabilitation and treatment services. In addition, five habilitation centers and
6 regional offices serve individuals with developmental disabilities. Other services are provided from a variety of
privately operated programs statewide through approximately 2,000 contracts managed annually by DMH.
The seven-member Missouri Mental Health Commission serves as the principal policy advisory body to the
department director. The department is composed of three divisions: the Division of Behavioral Health, the
Division of Developmental Disabilities and the Division of Administrative Services, as well as seven support
offices.
As of June 30, 2016, DMH’s workforce was composed of 6,403 employees including 2,256 (35.23%) minorities and
4,551 (71.08%) females.
The following table and charts show the composition of the workforce at DMH by gender and race/ethnicity as of
June 30, 2016.
DMH’s FY16 Workforce Demographics
FY16 Workforce
Total Employees 6,403 Female 4,551 71.08%
Male 1,852 28.92%
Minority 2,256 35.23%
DMH conducted analyses of its total employment process, including evaluating the workforce by organizational
unit and job group, personnel activity, compensation systems, and other personnel procedures to determine
whether and where impediments to equal employment opportunity exist.
Of the 25 organizational units at DMH, 20 or 80% include minorities, and 25 or 100% include females. This analysis
by organizational unit reveals that minorities and women are not significantly underrepresented or concentrated
in any particular organizational unit. It also suggests that there is no policy or practice excluding minorities or
women from any departments, nor is there any racial or sexual discrimination in the selection process.
DMH hired 915 new employees during the period from July 01, 2015 to June 30, 2016, including 337 minorities at
37% and 651 women at 71%.
71.08%
28.92%
Workforce Gender Percentages
Female
Male
35.23%
64.77%
Workforce Minority Percentages
Minority
White

101
The following table determines the number of people needed for full representation of the protected class based
on the 80% rule.
In an effort to address underutilization and achieve parity in all job groups, DMH is doing the following:
Continue to monitor records of applicant flow, referrals, placements, rejected offers, training, transfers,
promotions, terminations, and any layoffs or recalls to ensure that the DMH’s non-discriminatory policy is
carried out. Procedures are reviewed and revised as problems are identified.
Top management is and will continue to be informed of any problems that arise in their respective areas
so that immediate and appropriate steps can be taken to resolve any issues.
The Central Office Human Resources Division has started offering diversity related training to employees.
DMH will continue to improve recruitment and employee engagement.
A-OFFICIALS AND ADMINISTRATORS Total Employees - 360
Min Fem Asi Blk His Ind Pac Two Wht Mal
# Employed 43 270 4 36 2 1 0 0 317 90
# Available 46.1 199.6 8.1 31.4 3.2 0.6 0.0 2.7 303.6 150.2
Persons Required 0 0 3 0 1 0 1 3 0 31
B-PROFESSIONALS Total Employees - 1547
Min Fem Asi Blk His Ind Pac Two Wht Mal
# Employed 329 1187 46 266 13 4 0 0 1218 360
# Available 262.5 1088.3 34.8 188.9 20.9 3.9 0.6 13.8 1267.8 441.8
Persons Required 0 0 0 0 4 0 1 12 0 0
C-TECHNICIANS Total Employees - 239
Min Fem Asi Blk His Ind Pac Two Wht Mal
# Employed 67 195 2 61 4 0 0 0 172 44
# Available 48.8 208.6 1.2 39.9 3.8 0.4 0.0 3.3 189.5 29.7
Persons Required 0 0 0 0 0 1 1 3 0 0
D-PROTECTIVE SERVICE WORKERS Total Employees - 103
Min Fem Asi Blk His Ind Pac Two Wht Mal
# Employed 47 24 0 47 0 0 0 0 56 79
# Available 30.6 24.0 0.1 24.6 2.4 0.5 0.2 2.8 72.4 79.0
Persons Required 0 0 1 0 2 1 1 3 2 0
E-PARAPROFESSIONALS Total Employees - 3154
Min Fem Asi Blk His Ind Pac Two Wht Mal
# Employed 1436 2094 50 1344 38 4 0 0 1718 1060
# Available 1039.2 2758.8 23.3 883.1 53.3 16.1 7.3 54.2 2114.8 395.2
Persons Required 0 114 0 0 5 9 6 44 0 0
F-OFFICE AND CLERICAL Total Employees - 541
Min Fem Asi Blk His Ind Pac Two Wht Mal
# Employed 143 495 4 137 1 1 0 0 398 46
# Available 59.0 491.1 3.3 40.4 8.7 1.3 0.4 5.0 482.0 49.9
Persons Required 0 0 0 0 6 1 1 5 0 0
G-SKILLED CRAFT WORKERS Total Employees - 20
Min Fem Asi Blk His Ind Pac Two Wht Mal
# Employed 6 4 0 6 0 0 0 0 14 16
# Available 2.0 2.5 0.2 1.1 0.5 0.0 0.0 0.1 18.0 17.5
Persons Required 0 0 1 0 1 1 1 1 1 0
H-SERVICE MAINTENANCE Total Employees - 439
Min Fem Asi Blk His Ind Pac Two Wht Mal
# Employed 185 282 12 163 7 3 0 0 254 157
# Available 116.2 176.3 7.8 76.1 23.8 1.7 0.2 6.4 322.8 262.7
Persons Required 0 0 0 0 13 0 1 6 5 54

102
DEPARTMENT OF NATURAL RESOURCES Mission
“To protect our air, land and water; preserve our unique natural and historic places; and provide recreational
and learning opportunities for everyone.”
Missouri’s air, land and water resources play an important role in our quality of life and health and are essential
to the environmental and economic vitality of our state. The Missouri Department of Natural Resources (DNR) was
created on July 1 under the Omnibus State Reorganization Act of 1974. DNR helps develop mineral, oil and gas
resources in an environmentally safe manner; it protects the quality of water Missourians drink and the air they
breathe, as well as Missouri’s land resources. DNR provides outreach and education, technical and financial
assistance to the state’s citizens, communities and businesses to protect public health and improve quality of
life. Finally, DNR preserves the state's natural landscapes and cultural features through an outstanding network
of state parks and historic sites, along with the efforts of the state historic preservation office.
DNR is organized into the Office of the Director and four programmatic divisions: Administrative Support,
Environmental Quality, Missouri Geological Survey and Missouri State Parks.
As of June 30, 2016, DNR’s workforce was composed of 1,420 employees including 69 (4.86%) minorities and 605
(42.61%) females.
The following table and charts show the composition of the workforce at DNR by gender and race/ethnicity as of
June 30, 2016.
DNR’s FY16 Workforce Demographics
FY16 Workforce
Total Employees 1,420 Female 605 42.61%
Male 815 57.39%
Minority 69 4.86%
DNR conducted analyses of its total employment process, including evaluating the workforce by organizational
unit and job group, personnel activity, compensation systems, and other personnel procedures to determine
whether and where impediments to equal employment opportunity exist.
Of the 126 programs and facilities at DNR, 33 or 26.19% include minorities, and 102 or 80.95% include females.
This analysis by organizational unit reveals that minorities and women are not significantly underrepresented or
concentrated in any particular organizational unit. It also suggests that there is no policy or practice excluding
minorities or women from any departments, nor is there any racial or sexual discrimination in the selection
process.
DNR hired 154 new full time employees during the period from July 01, 2015 to June 30, 2016, including 4
minorities at 2.60% and 76 women at 49.35%.
42.61%
57.39%
Workforce Gender Percentages
Females
Males
4.86% 95.14%
Workforce Minority Percentages
Minority
White

103
The following table determines the number of people needed for full representation of the protected class based
on the 80% rule.
In an effort to address underutilization and achieve parity in all job groups, DNR has developed and executed
action oriented programs designed to correct any problem areas that may exist. Civil Rights and Diversity
training is presented every two years.
DNR’s Diversity Awareness and Recruitment Team (DART) continue to strive to "produce a workforce as diverse
as the communities we serve." DART is currently focused on the DNR Ambassadors project, that provides
resources for DNR Ambassadors who speak with community and university groups regarding employment with the
Department.
The Multi-Cultural Affairs Committee at DNR held its annual Diversity Conference in March 2016. The conference
theme focused on ways to put the concept of diversity in the workplace into perspective. DNR maintains a full-
time recruiter, who is responsible for recruitment efforts across the state. Special recruitment activities were
conducted in various colleges and universities across Missouri during the period July 01, 2015 to June 30, 2016.
A-OFFICIALS AND ADMINISTRATORS Total Employees - 210
Min Fem Asi Blk His Ind Pac Two Wht Mal
# Employed 5 85 2 3 0 0 0 0 205 125
# Available 13.2 79.5 2.1 8.4 1.8 0.2 0.0 0.8 184.4 118.2
Persons Required 6 0 0 4 2 1 0 1 0 0
B-PROFESSIONALS Total Employees - 764
Min Fem Asi Blk His Ind Pac Two Wht Mal
# Employed 49 322 13 25 7 2 0 0 715 442
# Available 96.0 330.6 14.4 66.1 10.1 0.8 0.1 4.1 645.2 410.8
Persons Required 28 0 0 28 2 0 1 4 0 0
C-TECHNICIANS Total Employees -44
Min Fem Asi Blk His Ind Pac Two Wht Mal
# Employed 2 16 0 2 0 0 0 0 42 28
# Available 2.9 14.2 0.3 2.1 0.3 0.0 0.0 0.2 32.8 21.6
Persons Required 1 0 1 0 1 1 1 1 0 0
D-PROTECTIVE SERVICE WORKERS Total Employees -34
Min Fem Asi Blk His Ind Pac Two Wht Mal
# Employed 1 1 0 0 1 0 0 0 33 33
# Available 5.6 13.8 0.5 3.5 0.9 0.1 0.0 0.5 28.4 20.2
Persons Required 4 11 1 3 0 1 1 1 0 0
E-PARAPROFESSIONALS Total Employees - 15
Min Fem Asi Blk His Ind Pac Two Wht Mal
# Employed 2 11 1 1 0 0 0 0 13 4
# Available 1.3 8.2 0.5 0.7 0.1 0.0 0.0 0.1 13.7 6.8
Persons Required 0 0 0 0 1 1 0 1 0 2
F-OFFICE AND CLERICAL Total Employees - 174
Min Fem Asi Blk His Ind Pac Two Wht Mal
# Employed 6 162 3 3 0 0 0 0 168 12
# Available 15.1 144.2 1.0 10.2 2.3 0.5 0.1 1.2 155.1 26.1
Persons Required 7 0 0 6 2 1 1 1 0 9
G-SKILLED CRAFT WORKERS Total Employees -38
Min Fem Asi Blk His Ind Pac Two Wht Mal
# Employed 2 0 0 0 0 1 0 0 36 38
# Available 4.5 2.6 0.2 1.4 1.1 1.5 0.0 0.3 33.5 35.4
Persons Required 2 3 1 2 1 1 1 1 0 0
H-SERVICE MAINTENANCE Total Employees - 141
Min Fem Asi Blk His Ind Pac Two Wht Mal
# Employed 2 8 0 2 0 0 0 0 139 133
# Available 28.4 67.8 2.6 19.2 3.7 0.5 0.1 2.3 112.6 73.2
Persons Required 21 47 3 14 3 1 1 2 0 0

104
Mission
“To facilitate the proper functioning of state and local government by accurately and efficiently collecting and distributing state and local revenues,
and to support public safety by effectively administering the laws related to motor vehicle sale and registration, and driver licensing.”
The Missouri Department of Revenue (DOR) was created in 1945 by the Missouri Constitution to serve as the central
collection agency for all state revenue. The primary duties of the Department are to collect taxes, title and
register motor vehicles, and license drivers. In 2009, the Department began the process of offering for bid all
license offices, eliminating the era of license office patronage in Missouri. The Department also improved the
functionality of the online vehicle registration system. The Department of Revenue consists of the office of the
Director and four divisions: Administration, Legal Services, Motor Vehicle and Driver Licensing, Taxation.
In response to this decentralized nature, this FY16 Department of Revenue’s Workforce Diversity report does not
reflect the workforce diversity efforts and/or statistics of the Missouri Lottery Commission and the State Tax
Commission. The Missouri Lottery Commission and the State Tax Commission complete their department’s
workforce diversity plan at the divisional level, separate from the Workforce Diversity Plan for the Missouri
Department of Revenue, for submission to the Office of Administration, Office of Equal Opportunity.
As of June 30, 2016, DOR’s workforce was composed 1,065 employees including 88 (8.26%) minorities and 811
(76.15%) females.
The following table and charts show the composition of the workforce at DOR by gender and race/ethnicity as of
June 30, 2016.
DOR’s FY16 Workforce Demographics
FY16 Workforce
Total Employees 1,065 Female 811 76.15%
Male 254 23.85%
Minority 88 8.26%
DOR conducted analyses of its total employment process, including evaluating the workforce by organizational unit
and job group, personnel activity, compensation systems, and other personnel procedures to determine whether
and where impediments to equal employment opportunity exist.
Of the 98 organizational units at DOR, 46 or 46.94% include minorities, and 91 or 92.86% include females. This
analysis by organizational unit reveals that minorities and women are not significantly underrepresented or
concentrated in any particular organizational unit. It also suggests that there is no policy or practice excluding
minorities or women from any departments, nor is there any racial or sexual discrimination in the selection
process.
DOR hired 138 new employees during the period from July 01, 2015 to June 30, 2016, including 8 minorities at 6%
and 104 women at 75%.
DEPARTMENT OF REVENUE
76.15%
23.85%
Workforce Gender Percentages
Females
Males
8.26%
91.74%
Workforce Minority Percentages
Minority
White

105
The following table determines the number of people needed for full representation of the protected class based
on the 80% rule.
To further ensure that DOR continues to achieve parity in its workforce, the Department will continue:
To contact universities and two- and four-year local colleges, vocational technical schools, high schools,
local business schools, and state and community organizations which attract qualified minority and female
students. DOR will advise these institutions of its desire to fill job openings in these classifications with
minority and female employees. When possible, DOR will continue to participate in job fair and career day
activities and we will consider relevant work experience programs.
Continue to be committed to recruiting, retaining, and promoting well-qualified individuals on the basis of
qualifications without regard to race, creed, color, religion, sex, national origin, disability, age, genetics,
sexual orientation, or veteran status.
In an effort to ensure all interview processes are free from bias in regard to race, creed, color, religion, sex,
national origin, disability, age, genetics, sexual orientation, or veteran status, a Personnel representative
will continue to serve on interview panels for positions with supervisory responsibilities.
Participate in targeted external training programs that cover objectives such as diversity and inclusion,
cultural sensitivity, discrimination and harassment, and hostile environment.
A-OFFICIALS AND ADMINISTRATORS Total Employees - 68
Min Fem Asi Blk His Ind Pac Two Wht Mal
# Employed 5 42 0 4 0 1 0 0 63 26
# Available 1.8 22.3 0.3 0.6 0.6 0.2 0.0 0.1 49.2 28.7
Persons Required 0 0 1 0 1 0 1 1 0 0
B-PROFESSIONALS Total Employees - 305
Min Fem Asi Blk His Ind Pac Two Wht Mal
# Employed 38 194 14 18 5 1 0 0 267 111
# Available 25.7 137.8 2.0 18.1 1.7 0.4 0.2 3.2 227.7 115.6
Persons Required 0 0 0 0 0 0 1 3 0 0
C-TECHNICIANS Total Employees - 6
Min Fem Asi Blk His Ind Pac Two Wht Mal
# Employed 0 6 0 0 0 0 0 0 6 0
# Available 1.6 3.0 0.3 0.6 0.6 0.0 0.0 0.1 4.4 3.0
Persons Required 2 0 1 1 1 1 1 1 0 3
E-PARAPROFESSIONALS Total Employees - 561
Min Fem Asi Blk His Ind Pac Two Wht Mal
# Employed 39 480 8 26 3 2 0 0 522 81
# Available 0.1 259.5 0.0 0.1 0.0 0.1 0.0 0.0 541.6 282.3
Persons Required 0 0 0 0 0 0 0 0 0 145
F-OFFICE AND CLERICAL Total Employees - 121
Min Fem Asi Blk His Ind Pac Two Wht Mal
# Employed 5 89 0 5 0 0 0 0 116 32
# Available 4.5 80.1 0.2 1.5 2.2 0.2 0.1 0.2 90.2 14.6
Persons Required 0 0 1 0 2 1 1 1 0 0
G-SKILLED CRAFT WORKERS Total Employees - 1
Min Fem Asi Blk His Ind Pac Two Wht Mal
# Employed 1 0 0 1 0 0 0 0 0 1
# Available 0.1 0.6 0.0 0.0 0.1 0.0 0.0 0.0 0.9 0.4
Persons Required 0 1 0 0 1 0 0 0 1 0
H-SERVICE MAINTENANCE Total Employees - 3
Min Fem Asi Blk His Ind Pac Two Wht Mal
# Employed 0 0 0 0 0 0 0 0 3 3
# Available 0.1 0.6 0.0 0.1 0.0 0.0 0.0 0.0 2.9 2.4
Persons Required 1 1 1 1 1 0 1 0 0 0

106
MISSOURI LOTTERY Mission
“The Missouri Lottery generates funds to provide educational opportunities for Missouri students, support Missouri businesses and entertain
millions.”
On Nov. 6, 1984, 70 percent of Missouri voters approved an amendment to establish a state Lottery. Missouri
Lottery ticket sales began over 29 years ago in January 20, 1986, and since that time, the Lottery has provided
the state, including public education, with more than $5.4 billion in proceeds. In addition, players have won
more than $12.1 billion in Lottery prizes, and retailers have earned more than $1.2 billion in combined
commissions and incentives. The Missouri Lottery (The Lottery) currently offers more than forty (40) Scratchers
games and eight (8) Draw Games for purchase at nearly 4,700 retail locations.
The Missouri Lottery (The Lottery) is organized into three divisions: Executive Division which includes Financial
and Game Accounting, Retail Operations, Events and Human Resources; Division of Sales, Marketing and
Communications which includes Lottery Sales Reps, Regional Offices, Research, Product Managers and Customer
Care Unit; and Division of Risk Management which includes IT, Security, Distribution and Facilities.
As of June 30, 2016, the Lottery’s workforce was composed of 153 employees including 19 (12.42%) minorities
and 73 (47.71%) females.
The following table and charts show the composition of the workforce at the Lottery by gender and
race/ethnicity as of June 30, 2016.
The Lottery’s FY16 Workforce Demographics
FY16 Workforce
Total Employees 153 Female 73 47.71%
Male 80 52.29%
Minority 19 12.42%
The Lottery conducted analyses of its total employment process, including evaluating the workforce by
organizational unit and job group, personnel activity, compensation systems, and other personnel procedures to
determine whether and where impediments to equal employment opportunity exist.
Of the 3 departments at the Lottery, 3 or 100% include minorities, and 3 or 100% include females. This analysis by
organizational unit reveals that minorities and women are not significantly underrepresented or concentrated in
any particular organizational unit. It also suggests that there is no policy or practice excluding minorities or
women from any departments, nor is there any racial or sexual discrimination in the selection process.
The Lottery hired 11 new employees during the period from July 01, 2015 to June 30, 2016 including 2 minorities
at 18% and 5 women at 45%.
47.71%
52.29%
Workforce Gender Percentages
Female
Male
12.42%
87.58%
Workforce Minority Percentages
Minority
White

107
The following table determines the number of people needed for full representation of the protected class
based on the 80% rule.
The Lottery measures and reports its workforce information on a quarterly basis and presents this information to
the Missouri Lottery Commission at each meeting. The Lottery monitors this information to ensure that
corrective action is taken to maintain a diverse workforce in serving our multicultural retailer customer base.
If, and when, The Lottery’s workforce is out of balance, every effort will be made to target recruiting in
respective areas in order to achieve parity.
The Missouri Lottery Commission's strategic plan includes four core values, one of which is “Diversity”. The
Lottery’s diversity statement is as follows:
"We welcome and encourage diversity in all we do - hiring, training, procurement, vendor relationships, events,
sponsorships and community relations. We recognize the benefits of a diverse workforce in serving a multi-
cultural customer base in today's global economy. We believe diversity is a critical part of our commitment to
provide superior customer service. We are committed to providing a professional work environment for all
employees, one that is respectful and free of any harassment or discriminatory practices."
One of the questions asked of all applicants interviewed is how they have or would contribute to each of our
core values. Management was also rated on whether they were living our core values. Additionally, current
employees considered for other positions within The Lottery are rated on their contribution to living each of the
values.
The Lottery will continue to participate in targeted external recruitment programs.
A-OFFICIALS AND ADMINISTRATORS Total Employed - 25
Min Fem Asi Blk His Ind Pac Two Wht Mal
# Employed 4 11 0 3 1 0 0 0 21 14
# Available 1.3 9.8 0.2 0.8 0.3 0.0 0.0 0.1 23.3 14.8
Persons Required 0 0 1 0 0 1 1 1 0 0
B- PROFESSIONALS Total Employed - 81
Min Fem Asi Blk His Ind Pac Two Wht Mal
# Employed 8 41 2 6 0 0 0 0 73 40
# Available 7.4 38.5 1.2 4.1 1.0 0.1 0.0 1.0 67.2 36.1
Persons Required 0 0 0 0 1 1 1 1 0 0
C-TECHNICIANS Total Employed - 6
Min Fem Asi Blk His Ind Pac Two Wht Mal
# Employed 2 0 0 2 0 0 0 0 4 6
# Available 0.6 3.1 0.0 0.4 0.1 0.0 0.0 0.1 5.0 2.6
Persons Required 0 3 1 0 1 1 1 1 1 0
E-PARAPROFESSIONALS Total Employed - 10
Min Fem Asi Blk His Ind Pac Two Wht Mal
# Employed 0 5 0 0 0 0 0 0 10 5
# Available 0.9 4.6 0.2 0.5 0.1 0.0 0.0 0.1 8.2 4.5
Persons Required 1 0 1 1 1 1 1 1 0 0
F-OFFICE AND CLERICAL Total Employed -30
Min Fem Asi Blk His Ind Pac Two Wht Mal
# Employed 5 16 1 4 0 0 0 0 25 14
# Available 3.3 23.1 0.2 2.1 0.5 0.0 0.0 0.4 25.6 5.8
Persons Required 0 3 0 0 1 1 1 1 0 0
H-SERVICE MAINTENANCE Total Employed -1
Min Fem Asi Blk His Ind Pac Two Wht Mal
# Employed 0 0 0 0 0 0 0 0 1 1
# Available 0.2 0.5 0.0 0.1 0.0 0.0 0.0 0.0 0.7 0.4
Persons Required 1 1 1 1 1 1 1 1 0 0

108
STATE TAX COMMISSION The Missouri Constitution of 1945 created the State Tax Commission (STC) of Missouri in its current form.
Article X, Section 14 of the constitution requires the General Assembly to create a tax commission for the
purpose of performing three (3) functions: Equalization of assessments as between counties; hear appeals from
local boards of equalization in individual assessment cases; and to perform such other duties as may be
prescribed by law.
The STC is constituted of three members, chosen from the two major political parties, appointed by the
Governor with the advice and consent of the Senate. The Commissioners hold staggered terms of six years.
(Section 138.190, RSMo). A majority of the commissioners must concur before the Commission can make a
decision on any matter before it. (Section 138.240, RSMo).
The staff of the Commission is divided into four sections: Administration, Legal, Original Assessment, and
Local Assistance.
As of June 30, 2016, STC’s workforce is composed of 37 employees including 18 (48.65%) females.
The following table and charts show the composition of the workforce at STC by gender and race/ethnicity as of
June 30, 2016.
STC’s FY16 Demographics
FY16 Workforce
Total Employees 37 Female 18 48.65%
Male 19 51.35%
Minority 0 0.00%
STC conducted analyses of its total employment process, including evaluating the workforce by organizational
unit and job group, personnel activity, compensation systems, and other personnel procedures to determine
whether and where impediments to equal employment opportunity exist.
Of the 4 organizational units at the STC, 4 or 100% include females. This analysis by organizational unit reveals
that minorities and women are not significantly underrepresented or concentrated in any particular
organizational unit. It also suggests that there is no policy or practice excluding minorities or women from any
departments, nor is there any racial or sexual discrimination in the selection process.
STC hired 4 new employees during the period from July 01, 2015 to June 30, 2016, including 3 females at 75%.
48.65%
51.35%
Workforce Gender Percentages
Female
Male
0.00%
100.00%
Workforce Minority Percentages
Minority
White

109
The following table determines the number of people needed for full representation of the protected class
based on the 80% rule.
The State Tax Commission is a small agency with budget authority for 40 FTEs – 60% of which work from their
homes throughout the State of Missouri.
The majority of STC’s vacancies, which are due to retirements, are in specialized job categories in rural
Missouri. Recruitment of minority and women applicants is difficult due to the rural regional areas and the
compensation that the agency offers.
Due to budget constraints, recruitment has become very limited and has become a shared responsibility
between Human Resources and the sections who are hiring. Job openings are listed on the agency’s website.
The State Tax Commission recognizes its responsibility to affirmative action and is committed to fulfilling this
responsibility by complying with all government regulations and laws pertaining to equal employment
opportunity.
A-OFFICIALS AND ADMINISTRATORS Total Employed: 10
Min Fem Asi Blk His Ind Pac Two Wht Mal
# Employed 0 3 0 0 0 0 0 0 10 7
# Available 2.1 4.0 0.5 0.7 0.7 0.1 0.0 0.1 7.9 6.0
Persons Required 2 1 1 1 1 1 1 1 0 0
B-PROFESSIONALS Total Employed: 6
Min Fem Asi Blk His Ind Pac Two Wht Mal
# Employed 0 3 0 0 0 0 0 0 6 3
# Available 1.5 2.8 0.4 0.5 0.4 0.0 0.0 0.1 4.6 3.3
Persons Required 2 0 1 1 1 1 1 1 0 0
C- TECHNICIANS Total Employed: 17
Min Fem Asi Blk His Ind Pac Two Wht Mal
# Employed 0 8 0 0 0 0 0 0 17 9
# Available 4.6 8.4 0.9 1.7 1.6 0.1 0.0 0.3 12.4 8.6
Persons Required 4 0 1 2 2 1 1 1 0 0
D- PARAPROFESSIONALS Total Employed: 1
Min Fem Asi Blk His Ind Pac Two Wht Mal
# Employed 0 1 0 0 0 0 0 0 1 0
# Available 0.2 0.5 0.1 0.1 0.1 0.0 0.0 0.0 0.8 0.5
Persons Required 1 0 1 1 1 1 1 1 0 1
E- OFFICE AND CLERICAL Total Employed: 3
Min Fem Asi Blk His Ind Pac Two Wht Mal
# Employed 0 3 0 0 0 0 0 0 3 0
# Available 0.8 2.8 0.1 0.3 0.3 0.0 0.0 0.0 2.2 0.2
Persons Required 1 0 1 1 1 1 1 1 0 1

110
DEPARTMENT OF PUBLIC SAFETY Mission
“To provide a safe and secure environment for all individuals through efficient and effective law enforcement,
national defense, disaster preparedness, service to veterans and education.”
Established in 1974, the Missouri Department of Public Safety (DPS) is responsible for coordinating statewide law
enforcement for the purpose of ensuring a safe environment for Missouri citizens. DPS is organized into nine
divisions/organizational units: Office of the Director, Alcohol & Tobacco Control, Fire Safety, Missouri
Gaming Commission, Missouri National Guard (Office of the Adjutant General), Missouri State Highway
Patrol, State Emergency Management Agency, and Veterans Commission.
The Director's Office serves as the Department's central management unit coordinating various administrative
functions and activities. As a whole, the organizational structure of the DPS is of a decentralized nature, with
each division/organizational unit functioning at varied levels of autonomy contingent upon the agency's
structure.
In response to this decentralized nature, this FY16 DPS’s Workforce Diversity Plan does not reflect the workforce
diversity efforts and/or statistics of the Missouri State Highway Patrol (The Patrol). The Patrol completes a
workforce diversity plan at the divisional level, separate from the Workforce Diversity Plan for DPS, for
submission to the Office of Administration, Office of Equal Opportunity, with a copy provided to the DPS’s Office
of the Director, Personnel Administrator.
As of June 30, 2016, DPS’s workforce was composed of 2,277 employees including 417 (18.31%) minorities and 1,540 (67.63%) women.
The following table and charts show the composition of the workforce at DPS by gender and race/ethnicity as of
June 30, 2016.
DPS’s FY16 Workforce Demographics
FY16 Workforce
Total Employees 2,277 Female 1,540 67.63%
Male 737 32.37%
Minority 417 18.31%
DPS conducted analyses of its total employment process, including evaluating the workforce by organizational
unit and job group, personnel activity, compensation systems, and other personnel procedures to determine
whether and where impediments to equal employment opportunity exist.
Of the 8 organizational units reflective in the Department of Public Safety’s FY16 Workforce Diversity Plan,
7 (88%) employ minorities and 8 (100%) employ females. This analysis by organizational unit reveals that
minorities and women are not significantly underrepresented or concentrated in any particular organizational
unit. It also suggests that there is no policy or practice excluding minorities or women from any departments,
nor is there any racial or sexual discrimination in the selection process.
67.63%
32.37%
Workforce Gender Percentages
Female
Male
18.31%
81.69%
Workforce Minority Percentages
Minority
White

111
The following table determines the number of people needed for full representation of the protected class
based on the 80% rule.
DPS has identified specific EEO categories/job groups of which they perceive warrant significant concern
for the agency and therefore must extensively focus on reaching parity within those areas. To achieve parity,
DPS plans to do the following:
Conduct exit interviews of terminating employees to ascertain whether it was perceived that artificial
barriers were a factor.
Ensure all personnel involved in the recruiting, screening, selection, promotion, disciplinary, and related
processes will be carefully selected and trained to ensure elimination of bias in all personnel actions of
female and/or minority applicants and/or employees and that all selection committees include female
and minority representation.
Increase sensitivity to cultural characteristics of employees by providing cultural diversity training to in
turn foster effective communications and team building.
A-OFFICIALS AND ADMINISTRATORS Total Employees - 95
Min Fem Asi Blk His Ind Pac Two Wht Mal
# Employed 5 41 0 4 1 0 0 0 90 54
# Available 7.8 32.8 1.1 4.4 1.2 0.2 0.0 0.9 87.2 62.2
Persons Required 2 0 1 0 0 1 1 1 0 0
B-PROFESSIONALS Total Employees - 489
Min Fem Asi Blk His Ind Pac Two Wht Mal
# Employed 47 313 9 36 0 2 0 0 442 176
# Available 63.4 309.1 12.0 39.0 5.8 1.4 0.2 4.7 424.7 179.1
Persons Required 4 0 1 0 5 0 1 4 0 0
C-TECHNICIANS Total Employees - 132
Min Fem Asi Blk His Ind Pac Two Wht Mal
# Employed 21 106 0 19 2 0 0 0 111 26
# Available 26.6 105.6 3.2 19.6 1.6 0.2 0.0 2.0 105.7 26.7
Persons Required 1 0 3 0 0 1 0 2 0 0
D-PROTECTIVE SERVICE WORKERS Total Employees - 119
Min Fem Asi Blk His Ind Pac Two Wht Mal
# Employed 1 10 0 0 0 0 0 0 118 109
# Available 24.2 14.4 0.3 16.4 2.2 0.4 0.1 4.8 94.8 104.6
Persons Required 19 2 1 14 2 1 1 4 0 0
E-PARAPROFESSIONALS Total Employees - 751
Min Fem Asi Blk His Ind Pac Two Wht Mal
# Employed 218 659 16 186 13 3 0 0 533 92
# Available 229.7 636.6 5.0 195.0 12.3 3.5 1.7 12.3 521.3 114.4
Persons Required 0 0 0 0 0 0 2 10 0 0
F-OFFICE AND CLERICAL Total Employees - 165
Min Fem Asi Blk His Ind Pac Two Wht Mal
# Employed 20 145 0 17 1 1 0 0 145 20
# Available 16.7 139.4 1.1 11.0 2.7 0.4 0.1 1.4 148.0 25.3
Persons Required 0 0 1 0 2 0 1 2 0 1
G-SKILLED CRAFT WORKERS Total Employees - 68
Min Fem Asi Blk His Ind Pac Two Wht Mal
# Employed 9 2 1 4 3 1 0 0 59 66
# Available 7.8 7.2 0.3 4.5 1.9 0.3 0.0 0.8 60.1 60.7
Persons Required 0 4 0 0 0 0 1 1 0 0
H-SERVICE MAINTENANCE Total Employees - 458
Min Fem Asi Blk His Ind Pac Two Wht Mal
# Employed 96 264 11 77 7 1 0 0 362 194
# Available 111.7 170.0 5.4 68.4 27.6 1.6 0.1 8.8 345.4 287.1
Persons Required 0 0 0 0 16 1 1 8 0 36

112
MISSOURI STATE HIGHWAY PATROL Mission
“The Missouri State Highway Patrol will serve and protect all people by enforcing laws and providing services
to ensure a safe and secure environment.”
The Missouri State Highway Patrol (The Patrol) is a state law enforcement agency created in 1931, with a main
purpose to reduce deaths and injury due to traffic crashes, and to protect and serve the citizens of Missouri.
To carry out this purpose, The Patrol comprises of the following divisions: Aircraft, Budget and Procurement,
Career Recruitment, Commercial Vehicle Enforcement, Crime Laboratory, Criminal Justice Information
Services, Driver Examination, Drug and Crime Control, Fleet and Facilities, Gaming, Governor Security,
Human Resources, Information and Communications Technology, Motor Vehicle Inspection, Patrol Records,
Professional Standards, Public Information and Education, Research and Development, Training, and the
Water Patrol.
As of June 30, 2016, The Patrol’s workforce was composed of 2,414 employees including 147 (6.09%) minorities
and 686 (28.42%) females.
The following table and charts show the composition of the workforce at The Patrol by gender and
race/ethnicity as of June 30, 2016.
The Patrol’s FY16 Demographics
FY16 Workforce
Total Employees 2,414 Female 686 28.42%
Male 1,728 71.58%
Minority 147 6.10%
The Patrol conducted analyses of its total employment process, including evaluating the workforce by
organizational unit and job group, personnel activity, compensation systems, and other personnel procedures to
determine whether and where impediments to equal employment opportunity exist.
Of the 102 organizational units at The Patrol, 37 or 36.27% include minorities, and 82 or 80.39% include females.
This analysis by organizational unit reveals that minorities and women are not significantly underrepresented or
concentrated in any particular organizational unit. It also suggests that there is no policy or practice excluding
minorities or women from any departments, nor is there any racial or sexual discrimination in the selection
process.
The Patrol hired 186 new employees during the period from July 01, 2015 to June 30, 2016, including 20
minorities at 11% and 68 women at 37%.
28.42%
71.58%
Workforce Gender Percentages
Female
Male
6.10%
93.90%
Workforce Minority Percentages
Minority
White
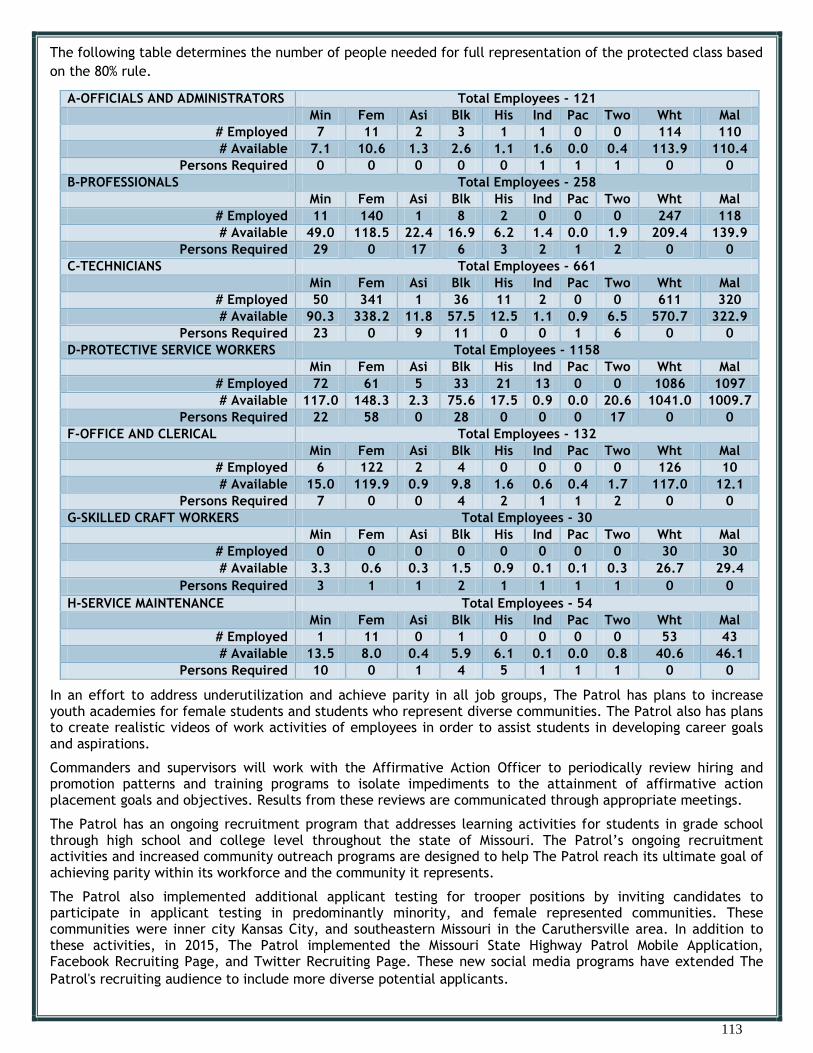
113
The following table determines the number of people needed for full representation of the protected class based
on the 80% rule.
In an effort to address underutilization and achieve parity in all job groups, The Patrol has plans to increase youth academies for female students and students who represent diverse communities. The Patrol also has plans to create realistic videos of work activities of employees in order to assist students in developing career goals and aspirations.
Commanders and supervisors will work with the Affirmative Action Officer to periodically review hiring and promotion patterns and training programs to isolate impediments to the attainment of affirmative action placement goals and objectives. Results from these reviews are communicated through appropriate meetings.
The Patrol has an ongoing recruitment program that addresses learning activities for students in grade school through high school and college level throughout the state of Missouri. The Patrol’s ongoing recruitment activities and increased community outreach programs are designed to help The Patrol reach its ultimate goal of achieving parity within its workforce and the community it represents.
The Patrol also implemented additional applicant testing for trooper positions by inviting candidates to participate in applicant testing in predominantly minority, and female represented communities. These communities were inner city Kansas City, and southeastern Missouri in the Caruthersville area. In addition to these activities, in 2015, The Patrol implemented the Missouri State Highway Patrol Mobile Application, Facebook Recruiting Page, and Twitter Recruiting Page. These new social media programs have extended The
Patrol's recruiting audience to include more diverse potential applicants.
A-OFFICIALS AND ADMINISTRATORS Total Employees - 121
Min Fem Asi Blk His Ind Pac Two Wht Mal
# Employed 7 11 2 3 1 1 0 0 114 110
# Available 7.1 10.6 1.3 2.6 1.1 1.6 0.0 0.4 113.9 110.4
Persons Required 0 0 0 0 0 1 1 1 0 0
B-PROFESSIONALS Total Employees - 258
Min Fem Asi Blk His Ind Pac Two Wht Mal
# Employed 11 140 1 8 2 0 0 0 247 118
# Available 49.0 118.5 22.4 16.9 6.2 1.4 0.0 1.9 209.4 139.9
Persons Required 29 0 17 6 3 2 1 2 0 0
C-TECHNICIANS Total Employees - 661
Min Fem Asi Blk His Ind Pac Two Wht Mal
# Employed 50 341 1 36 11 2 0 0 611 320
# Available 90.3 338.2 11.8 57.5 12.5 1.1 0.9 6.5 570.7 322.9
Persons Required 23 0 9 11 0 0 1 6 0 0
D-PROTECTIVE SERVICE WORKERS Total Employees - 1158
Min Fem Asi Blk His Ind Pac Two Wht Mal
# Employed 72 61 5 33 21 13 0 0 1086 1097
# Available 117.0 148.3 2.3 75.6 17.5 0.9 0.0 20.6 1041.0 1009.7
Persons Required 22 58 0 28 0 0 0 17 0 0
F-OFFICE AND CLERICAL Total Employees - 132
Min Fem Asi Blk His Ind Pac Two Wht Mal
# Employed 6 122 2 4 0 0 0 0 126 10
# Available 15.0 119.9 0.9 9.8 1.6 0.6 0.4 1.7 117.0 12.1
Persons Required 7 0 0 4 2 1 1 2 0 0
G-SKILLED CRAFT WORKERS Total Employees - 30
Min Fem Asi Blk His Ind Pac Two Wht Mal
# Employed 0 0 0 0 0 0 0 0 30 30
# Available 3.3 0.6 0.3 1.5 0.9 0.1 0.1 0.3 26.7 29.4
Persons Required 3 1 1 2 1 1 1 1 0 0
H-SERVICE MAINTENANCE Total Employees - 54
Min Fem Asi Blk His Ind Pac Two Wht Mal
# Employed 1 11 0 1 0 0 0 0 53 43
# Available 13.5 8.0 0.4 5.9 6.1 0.1 0.0 0.8 40.6 46.1
Persons Required 10 0 1 4 5 1 1 1 0 0

114
DEPARTMENT OF SOCIAL SERVICES Mission
“To maintain or improve the quality of life for Missouri citizens.”
A true measure of a society is the extent of its concern for those less fortunate - its intent of keeping families
together, preventing abuse and neglect, and encouraging self-sufficiency and independence. In Missouri,
programs dealing with these concerns are administered by the Department of Social Services (DSS), which was
created by the Omnibus State Reorganization Act of 1974.
DSS is charged with administering programs to promote, safeguard, and protect the general welfare of children;
to maintain and strengthen family life; and to aid people in need as they strive to achieve their highest level of
independence. DSS is responsible for coordinating programs to provide public assistance to children and their
parents, access to health care, and to provide specialized assistance to troubled youth. While many programs
give needed financial assistance and services, other units work toward reducing the financial dependency of the
citizens on government. DSS is composed of the director's office, four program divisions, and two support
divisions. All divisions work in cooperation to allow DSS to function effectively.
As of June 30, 2016, DSS’s workforce was composed of 6,802 employees including 1,297 (19.07%) minorities and
5,538 (81.42%) females.
The following table and charts show the composition of the workforce at DSS by gender and race/ethnicity as of
June 30, 2016.
DSS FY16 Demographics
FY16 Workforce
Total Employees 6,802 Female 5,538 81.42%
Male 1,264 18.58%
Minority 1,297 19.07%
DSS conducted analyses of its total employment process, including evaluating the workforce by organizational
unit and job group, personnel activity, compensation systems, and other personnel procedures to determine
whether and where impediments to equal employment opportunity exist.
Of the 375 organizational units at DSS, 178 or 47.47% include minorities, and 367 or 97.87% include females. This
analysis by organizational unit reveals that minorities and women are not significantly underrepresented or
concentrated in any particular organizational unit. It also suggests that there is no policy or practice excluding
minorities or women from any departments, nor is there any racial or sexual discrimination in the selection
process.
DSS hired 591 new employees during the period from July 01, 2015 to June 30, 2016, including 150 minorities at
25.4% and 383 women at 64.8%.
81.42% 18.58%
Workforce Gender Percentages
Female
Male
19.07%
80.93%
Workforce Minority Percentages
Minority
White

115
The following table determines the number of people needed for full representation of the protected class
based on the 80% rule.
To continue its efforts to develop, implement, monitor, and evaluate Equal Employment Opportunity programs,
the DSS will:
Continue to provide training to new and current employees on civil rights laws and the Department’s
nondiscrimination policies.
Research and implement the best practices that promote the hiring, retention and advancement of
women, minorities, and individuals with disabilities.
Continue to educate managers and supervisors on the ADA interactive process, workplace
accommodation issues, and diversity initiatives.
Continue to explore non-traditional ways of recruiting minorities.
Continue to provide employees the monthly Diversity Calendar via the DSS Intranet website.
The Workforce Diversity Advisory Group will continue to meet quarterly to discuss issues pertinent to
workforce diversity such as enhancing cultural diversity awareness, identifying problem areas, and
recommending strategies for resolving problems and barriers preventing the success of the Workforce
Diversity Plan.
Provide divisional underutilization reports to advisory group members to share with local managers to
assist in identifying problem areas.
A-OFFICIALS AND ADMINISTRATORS Total Employees - 338
Min Fem Asi Blk His Ind Wht Mal
# Employed 39 251 1 35 1 2 299 87
# Available 26.9 152.0 2.5 18.4 4.0 0.7 306.0 180.9
Persons Required 0 0 2 0 3 0 0 58
B-PROFESSIONALS Total Employees - 5402
Min Fem Asi Blk His Ind Wht Mal
# Employed 1038 4383 29 918 58 33 4364 1019
# Available 728.7 2823.1 138.3 430.0 97.2 13.5 4586.8 2492.5
Persons Required 0 0 82 0 20 0 0 975
C-TECHNICIANS Total Employees - 82
Min Fem Asi Blk His Ind Wht Mal
# Employed 12 66 0 9 2 1 70 16
# Available 6.7 45.9 0.1 5.1 0.4 0.5 68.7 29.5
Persons Required 0 0 1 0 0 0 0 8
E-PARAPROFESSIONALS Total Employees - 237
Min Fem Asi Blk His Ind Wht Mal
# Employed 69 144 0 63 5 1 168 93
# Available 31.4 127.7 5.7 18.9 3.9 0.5 198.7 102.3
Persons Required 0 0 5 0 0 0 0 0
F-OFFICE AND CLERICAL Total Employees - 696
Min Fem Asi Blk His Ind Wht Mal
# Employed 123 660 0 114 5 4 573 36
# Available 120.2 497.6 5.6 88.4 14.6 2.0 559.4 181.9
Persons Required 0 0 5 0 7 0 0 110
G-SKILLED CRAFT WORKERS Total Employees - 1
Min Fem Asi Blk His Ind Wht Mal
# Employed 1 1 0 1 0 0 0 0
# Available 0.1 0.2 0.0 0.1 0.0 0.0 0.9 0.8
Persons Required 0 0 1 0 1 1 1 1
H-SERVICE MAINTENANCE Total Employees - 46
Min Fem Asi Blk His Ind Wht Mal
# Employed 13 33 0 11 2 0 33 13
# Available 11.5 25.7 0.9 8.3 1.6 0.1 34.5 20.3
Persons Required 0 0 1 0 0 1 0 4

116
MISSOURI DEPARTMENT OF TRANSPORTATION
Mission
“To provide a world-class transportation experience that delights our customers and promotes a prosperous Missouri.”
The Missouri Department of Transportation (MoDOT) is responsible for maintaining five major transportation
systems: highways, aviation, waterways, transit and railroads. The bulk of MoDOT's responsibilities are focused
on the 33,895 miles of roadways and 10,376 bridges the department is charged with designing, constructing and
maintaining for the citizens of Missouri. The Department operates as a decentralized organization with a Central
Office located in Jefferson City and an additional seven districts throughout the state. MoDOT aims to provide
our citizens with a safe and reliable transportation system that promotes a prosperous Missouri.
The Central Office in Jefferson City houses the following divisions: Office of Director, Audits and
Investigations, Bridge, Chief Counsel, Commission Secretary, Construction and Materials, Customer
Relations, Equal Opportunity, External Civil Rights, Financial Services, General Services, Governmental
Relations, Human Resources, Motor Carrier Services, Multimodal Operations, Risk and Benefit Management,
Traffic and Highway Safety and Transportation Planning.
As of June 30, 2016, MoDOT’s workforce was composed of 5,079 employees including 469 (9.23%) minorities and
918 (18.07%) females.
The following table and charts show the composition of the workforce at MoDOT by gender and race/ethnicity as
of June 30, 2016.
MoDOT FY16 Demographics
FY16 Workforce
Total Employees 5,079 Female 918 81.07%
Male 4,161 81.93%
Minority 469 9.23%
MoDOT conducted analyses of its total employment process, including evaluating the workforce by
organizational unit and job group, personnel activity, compensation systems, and other personnel procedures to
determine whether and where impediments to equal employment opportunity exist.
Of the Central Office and 7 districts at MoDOT, 8 or 100% include minorities, and 8 or 100% include females. This
analysis by organizational unit reveals that minorities and women are not significantly underrepresented or
concentrated in any particular organizational unit. It also suggests that there is no policy or practice excluding
minorities or women from any departments, nor is there any racial or sexual discrimination in the selection
process.
MoDOT hired 570 new employees during the period from July 01, 2015 to June 30, 2016, including 78 minorities
at 13.68% and 77 women at 13.51%.
18.07%
81.93%
Workforce Gender Percentages
Female
Male
9.23%
90.77%
Workforce Minority Percentages
Minority
White

117
The following table determines the number of people needed for full representation of the protected class based
on the 80% rule.
The Missouri Department of Transportation will work toward parity by continuing to improve on the following:
Work with managers to identify high-performing minorities and women and encourage these employees to
participate in mentorships and other programs that will enhance their skills and improve their
promotional opportunities.
Continue to reach out to minority and female organizations and expand efforts to include new
organizations to partner with. MoDOT will focus on recruitment geared towards minorities and females at
colleges/universities.
Coordinate Diversity and Inclusion Conferences in all seven districts to continue the development of
inclusion in the workplace; Coordinate MoDOT’s district job fairs to educate potential employees about
MoDOT; Conduct “meet and greets” at colleges the department recruits at that will include diversity
organizations; Partner with high schools (partners in Education Program) to increase minority and female
interest in Transportation related careers; Develop a program to better prepare employees for
promotional opportunities; and, Ensure that MoDOT’s Civil engineer intern program is diversified in order
to increase the applicant pool of diverse candidates.
A-OFFICIALS AND ADMINISTRATORS Total Employees - 781
Min Fem Asi Blk His Ind Pac Two Wht Mal
# Employed 49 151 4 26 6 10 0 3 732 630
# Available 64.7 250.3 8.1 38.6 6.6 6.1 0.0 5.3 649.3 465.0
Persons Required 3 50 3 5 0 0 0 2 0 0
B-PROFESSIONALS Total Employees - 958
Min Fem Asi Blk His Ind Pac Two Wht Mal
# Employed 92 322 18 43 11 9 0 11 866 636
# Available 88.2 404.9 10.3 52.3 13.1 5.3 0.1 6.9 811.9 495.4
Persons Required 0 2 0 0 0 0 1 0 0 0
C-TECHNICIANS Total Employees - 260
Min Fem Asi Blk His Ind Pac Two Wht Mal
# Employed 22 67 0 14 4 4 0 0 238 193
# Available 27.3 64.5 1.2 19.1 4.1 1.2 0.0 1.8 217.1 180.0
Persons Required 0 0 1 2 0 0 0 2 0 0
E-PARAPROFESSIONALS Total Employees - 132
Min Fem Asi Blk His Ind Pac Two Wht Mal
# Employed 12 115 0 9 1 2 0 0 120 17
# Available 15.3 93.0 0.6 9.7 4.1 0.1 0.0 0.8 111.1 33.5
Persons Required 1 0 1 0 3 0 1 1 0 10
F-OFFICE AND CLERICAL Total Employees - 121
Min Fem Asi Blk His Ind Pac Two Wht Mal
# Employed 10 110 0 9 1 0 0 0 111 11
# Available 16.8 68.0 0.8 12.4 1.4 1.6 0.0 0.6 104.2 53.0
Persons Required 4 0 1 1 1 2 1 1 0 32
G-SKILLED CRAFT WORKERS Total Employees - 767
Min Fem Asi Blk His Ind Pac Two Wht Mal
# Employed 64 27 3 44 8 6 0 3 703 740
# Available 105.9 86.0 2.1 77.3 7.5 13.3 0.1 5.6 661.2 681.0
Persons Required 21 42 0 18 0 5 1 2 0 0
H-SERVICE MAINTENANCE Total Employees - 2060
Min Fem Asi Blk His Ind Pac Two Wht Mal
# Employed 220 126 4 149 28 34 0 5 1840 1934
# Available 261.2 101.8 0.0 194.5 17.9 5.8 0.0 43.5 1796.7 1956.2
Persons Required 0 0 0 7 0 0 0 30 0 0

118

119
APPENDIXES

120
APPENDIX A
WORKFORCE DIVERSITY COUNCIL COMMITTEE RECCOMMENDATIONS
Best Practices Committee: Chair: Captain Roger Whittler, MSHP Co-Chair: Mary Beckwith, DPS
Members: Contessa Poole-King, PSC Ida Mitchell, DMH Sandy Lewis, DHSS Velma Long, DOC Roxy Antonio, OA Tom Fast, OA Billie Wilson, DED Keith Dudenhoeffer, DIFP Anna Wise, DSS Dorothy Session, DOLIR
Training Committee:
Chair: Tom Fast, OA Co-Chair: Darlene Robinette, DOR
Members: Tiffany Martin, DNR Roxy Antonio, OA Bob Wieberg, DSS Dorothy Session, DOLIR Robert Boone, PSC Lisa Schuster, DIFP
IDENTIFIED BEST PRACTICES The Recruitment Committee was tasked with brainstorming ideas related to best practices in recruitment to present the State of Missouri as employer. In order for a best practice to be included in this report, it had to meet the following criteria: Outreach – It must involve OEO working with state agencies or other community entities. Education – It must educate the population about the State of Missouri and the opportunities available to job seekers or it must educate agency staff about the employment needs of a community group. Opportunity – It must create and/or present employment opportunities to our constituents. The committee has identified the following Best Practices to present the State of Missouri as an equal opportunity employer:
OEO can work with state agencies to develop a more effective way to present job opportunities to job seekers.
o OEO can promote the use of MOCareers to state agencies as the website of choice to promote state employment opportunities.
o OEO can partner with the division of personnel and ITSD to create recruiting videos and collaborate to place them in MOCareers:
What is the Merit System and the benefits of applying through it? Where do I start looking for State Employment? Are there any other employment opportunities besides Merit opportunities in State
government? What is a register and how does an applicant benefit from getting on a register? What benefits does a State Employee obtain? Applying for an internship?

121
OEO can collaborate with state agencies to attend career fairs or community events, collect resumes and do targeted recruitment via e-mail whenever positions become available.
OEO can collaborate with state agencies to coordinate focus groups around the state of Missouri at selected colleges and universities to identify how upcoming graduates view the State of Missouri as an employer.
OEO can collaborate with state agencies to identify and present to multicultural groups at various colleges. Some of these groups might include:
o Alliance of Black Collegians o Common Ground (LGBT) o Indian Student Association o International Student Association o Korean Student Association o Nepalese Student Association o Muslim Student Association o Minority Educators o Minority Men’s Organization o Spiritually Involved Sisters Together Achieving Harmony (SISTAH) o Asian American Association o Association of Latino American Students o Four Front Council
OEO can collaborate with state agencies to coordinate presentations around the state of Missouri at high schools to promote jobs in the Merit system that only need a high school diploma. Specifically in the central area of the state since a lot of state positions are located centrally.
OEO can collaborate with state agencies to coordinate a State and Local Government Career Fair in central Missouri.
OEO can collaborate with community groups that help disabled, veterans and others obtain employment and help these community groups connect with HR staff that can help their clients.
OEO can collaborate with Personnel to create trainings to be presented at job centers across the State similar to the ones created to be placed in MOCareers, with the advantage of having help for the applicants to complete the EASE application onsite.

122
APPENDIX B
CONTRACT COMPLIANCE COUNCIL COMMITTEE RECOMMENDATIONS
Best Practices Committee
Chair: Rebecca Jackson, MoDOT Co-Chair: Alan Clements, MDA
Members: Gary Stoll, DOC
Tammy Cavender, DOLIR Anna Duncan, DIFP Rachel Shelley, DNR Pamela Hodges, DOR Robert Boone, PSC Shalonda Graham, DHSS
IDENTIFIED BEST PRACTICES
Require notification to OEO certified MBE/WBE vendors of every bid opportunity.
Annually train staff with procurement authority on the OEO MBE/WBE directory and suggest use of these vendors when making purchases less than $3,000.
Identify the largest spend categories and partner with OEO to identify gaps in MBE/WBE vendor representation and focus on activities to increase availability for those spend categories.
Simplify or reduce bidding requirements (ex. Bonding and Insurance) to encourage more responses from MBE/WBE vendors.
Create guidelines and instructions to assist staff in searching the OEO certified vendor database for the products or services needed.
On a quarterly basis, review progress towards utilization of MBE/WBE firms. Report and discuss the results with individuals responsible for the purchasing decisions creating the results. Reporting categories may include number of certified firms contacted, number of firms who respond, total expenditures with certified and non-certified firms along with the percentage of spend. Discuss how it is being done well and what is not being done well. Involve senior management as well as stakeholders.
Post and/or communicate bidding opportunities to media outlets targeting MBE/WBE firms. This could include but not be limited to email notifications, newspapers, the internet and social media.
Issues/Challenges along with suggested solutions:
Lack of certified firms to select from: o Consider universal certification. If other certifying agencies are not providing what is necessary
to meet OEO standards, collaborate with them to obtain what is required. o Develop a program to grow MBE/WBE vendors in largest spend categories. o Determine the certification barriers and develop an action plan to eliminate those barriers. Why
aren’t firms owned by minorities and women seeking certification. o Develop a “Wanted Vendor” list on the OEO site identifying the commodities or services that
lack certified MBE/WBE firms. o What process is used to ensure OEO certified vendors are becoming registered in MissouriBUYS? o Train agency personnel on all aspects of the certification process. This will allow them to
understand the process and respond to vendor comments or questions when advocating for vendor certification.
o Identify and promote the benefits of certification to the vending community.
Lack of responses from certified MBE/WBE firms: o Determine the reasons why certified firms do not bid and eliminate those barriers if possible.

123
Training
o While most if not all utilize the OEO MBE/WBE certified vendor list to locate vendors, do they have the skills and tools to find the correct code and are they notifying all potential vendors? Would a list of commonly used NAICS codes with descriptions to help staff identify more potential vendors.
o Develop vendor availability list based upon the product or service offered versus commodity codes. Another option may be the ability to run reports from the certified vendor list based on key words.
Notification of contractors with certification gaps: Agencies expressed concern when utilizing an OA contract whereby a vendor is identified as a certified MBE/WBE at the time of contract letting but loses certification during the life of the contract. Unbeknownst to the agency of this certification loss, they continue to utilize this particular vendor only to find out at the end of the year they are not recording expenditures to a certified MBE/WBE contractor.
o Create a form of communication with OA as well as state agencies notifying them when a commonly used certified vendor is no longer certified. This will allow agencies to seek other certified firms. OA should also amend their contract to identify these contractors are no longer certified.
o OA Procurement utilizes a list serve to notify agencies when there are contract changes. Could OEO utilize the same list serve to notify agencies of certification status changes such as newly certified vendors or vendors who recently lost their certification status?
Data Collection and Reporting: Should be real time, accurate and understandable. o The MOBIUS tool is cumbersome and inaccurate according to some Agencies. Is there another
option to capture and report the data? o Consider progress reporting versus the end of the year when there is no time to make corrections
to improve results. o How does OA determine the vendor category on subcontracting when the vendor is both an MBE
and WBE? What category is used for utilization reporting and who determines this?
Lack of continuity, direction and guidance on the issue of MBE/WBE vendor utilization: o Develop clear desk procedures to assist all state government staff with delegated procurement
authority on how to achieve MBE/WBE vendor utilization. Providing a check list for steps to take may be advantageous.
o OEO commits an office resource to assist agencies in locating certified MBE/WBE vendors. o OA Procurement is allowed to include preference language when performing the procurement
function, however, when they provide agencies with a Special Delegation of Authority to perform the procurement themselves, they are told they do not have the authority to include preference language in their competitive documents. OEO and OA Procurement need to discuss this and formulate a solution.
Research Resources Shared: Excerpts may be modified to include key portions of the report(s) for application to our team. Neither an official reference nor a plagiarism attempt…just wanted to get the good ideas down somewhere. You will note we already perform a lot of the items listed.
2015 Economic Equity in Communities of color: The Effectiveness of Minority Contracting Initiatives (modified to include general references):
o The central recommendation is to implement a regional strategy to provide improved opportunities for minority contracts. This strategy should ideally:
1. Require active participation of all departments and agencies 2. Include clear goals and benchmarks 3. Provide assistance in navigating the certification process 4. Develop and employ standardized methods of data collection and reporting that are
clear, accountable, and accessible to the public in real time.

124
Economic Development in Diverse Communities – Inclusive Procurement by Cities and Counties (modified
to include general references): o Best practices in Policy
1. Require active participation of all departments and agencies, in order to ensure that policies are implemented effectively, For example:
Publish an annual report identifying performance to increase MBE/WBE opportunities.
Provide staff training and best practice information. Meet regularly with each department to improve results.
2. Create feedback loops that encourage program improvement and innovation through current disparity studies and, especially in race-neutral programs, strategic planning and ongoing policy and program review.
3. Require or encourage third parties to have inclusive business programs, in order to expand impact and reach. For example, require all non-profit organizations doing business with the state to have a supplier diversity plan.
4. Downsize large contracts in order to make them eligible for inclusive business programs that benefit MBE/WBE primes or subcontractors.
Best practices in Administration o Designate one reporting agency for the state. o Integrate the agency that deals with certification, contract compliance and reporting with
business development services. o Monitor and enforce goals throughout the project (including change orders, payment of sub-
contractors, etcetera. o Implement an electronic contract management and monitoring system that supports the program
objectives. Make it more difficult for primes to substitute MBE/WBEs without permission, pay sub-contractors slowly or fail to comply with goals and other program related contractual commitments.
Best practice in Reporting o Report overall outcomes by dollar amount, percentage of total procurement, attainment, and
activity for each agency or department with purchasing authority. The report should define total procurement and clarify what percent of total procurement was discretionary, if any.
o Measure MBE/WBE procurement as a percentage of all procurement or all discretionary improvement.
o Report on economic impact of programs. Quantify the economic impact of the MBE/WBE program. How many full time jobs result from the State of Missouri MBE/WBE spend. Or for every XX spent with an MBE/WBE results in XX in wages and salaries or XX in state and local tax receipts.
Best Practices in Feedback and Quality Control o Institute a process of continual improvement that includes community feedback. o Randomly audit a small percentage of contracts for compliance with policy.
Best Practices in Capacity Building o Development practices including start up and growth assistance, technical assistance to increase
industry content knowledge, and mentor-protégé programs to build a business beyond start-up and the initial growth stages
o Bonding, insurance and financing practices including low interest loan programs, assistance with market-rate loan applications, and information on bonding and insurance options – especially for businesses dealing with government contracting.
o Certification assistance and how to do business with assistance including help in navigating procurement processes.
o Vendor outreach and networking including efforts to bring vendors from various communities into the state procurement system as well as activities to establish relationships between businesses, agency purchasing agents, prime suppliers and contractors. It also includes awards events that give positive attention to the inclusion champions inside and outside of government.
o Unbundling contracts including downsizing larger contracts into smaller pieces that are more accessible to MBE/WBE businesses.

125
APPENDIX C
CONTRACT COMPLIANCE COMMITTEE RECOMMENDATIONS
Training Committee
Co-Chairs: LeighAnn Corrigan, DNR Lindsay Denny, DESE
Members:
Stacia Steinman, DPS
Corey Duemmel, MDC
Beth Lambert, DOC
Training for Four Different Areas:
OEO –
1. Contact small business affiliates such as MU Extension Center, Economic Development and banking institutions. These are entities that are in contact with businesses who can promote becoming MBE/WBE certified with the state. They need information that they can pass along to their clients.
2. Promote vendor fairs as learning opportunities. Many vendors didn’t realize the educational opportunities that were at the last vendor fair.
3. Promote the use of MBE/WBEs through MissouriBUYS and also the need for vendors to become certified. 4. Develop speaking points for agencies to use when talking to MBE/WBE vendors in order to encourage
them to become certified.
MissouriBUYS –
1. Promote certification and provide information to both vendors and state agencies.
Agencies –
1. Promote certification to MBE/WBE vendors through the use of speaking points developed by OEO. 2. Provide training regarding MBE/WBE participation to all staff doing any type of purchasing. 3. Provide reminders/refreshers to staff. 4. Be advocates for utilizing MBE/WBEs for local, small dollar purchases.
Vendors –
1. Provide information to vendors regarding doing business with the state and on certification process.
Other ideas for improvement that didn’t deal with training:
1. Look at what other states are doing for certification. 2. Send blast emails to vendors in SAM II and those we use via P-Card asking if they are an MBE/WBE; are
they certified; where are they certified at; their certification #; if not certified, would they want to become certified? Then follow up with those to get them certified by OEO.

126
