table of - townofmaynard-ma.gov · review of proposed zoning bylaw amendment & concept plan for...
TRANSCRIPT

TABLE OF CONTENTS
Introduction .................................................................................................................................................. 1
Overview ....................................................................................................................................................... 3
Maynard History, Population, and Land Use ............................................................................................ 3
Property Description ................................................................................................................................. 4
Description of NBOD and Industrial (I) Zoning .......................................................................................... 6
Description of 2006 Proposal .................................................................................................................... 7
Description of Proposed Concept Plan ..................................................................................................... 9
Description of Proposed Amendments to Zoning Bylaws ...................................................................... 11
Fiscal Impact Study ..................................................................................................................................... 15
Traffic Impact Peer Review ......................................................................................................................... 31
Review and Recommendations .................................................................................................................. 45
Consideration of Proposed Amendments to Zoning Bylaw .................................................................... 46
Existing Policy Framework .......................................................................................................... 46
Questions for Discussion ............................................................................................................. 47
Comments / Recommendations ................................................................................................. 50
Consideration of Proposed Concept Plan ............................................................................................... 51
Planning Principle / Best Practices .............................................................................................. 51
Review of Concept Plan .............................................................................................................. 52
Consideration of Development Agreement ............................................................................................ 58
Appendix A: The Nielsen Company, Opportunity Gap Report ................................................................. A-1
Appendix B: Detailed Comments on Bylaw Amendments (dated 2-28-13) .............................................. B-1

Review of Proposed Zoning Bylaw Amendment & Concept Plan for March 25, 2013
129 Parker Street, Maynard, MA Page 1
INTRODUCTION
The Edward J. Collins, Jr. Center for Public Management was hired by the Town of Maynard to analyze the proposed amendment to the Neighborhood Business Overlay District (NBOD) of the Maynard Zoning Bylaw and associated concept plan for the property located at 129 Parker Street in Maynard. The bylaw amendment and concept plan have been proposed by Capital Group Properties, LLC, the developer of the site. Specifically, the Center was tasked with preparing the following materials:
Task 1 – Economic Development and Impact Study; Task 2 – Traffic Peer Review and Analysis; and, Task 3 – Recommendations on proposed bylaw amendment, concept plan, and development
agreement.
Team Background The Collins Center has partnered with two highly qualified firms to undertake this effort, including Faye, Spofford, and Thorndike (FST) for the transportation analysis and Stantec for the economic analysis. The Edward J. Collins, Jr. Center for Public Management in the McCormack Graduate School of Policy and Global Studies at the University of Massachusetts Boston was established in 2008 by the Patrick Administration to improve the effectiveness, efficiency, accountability, and professionalism of all levels of government. The Center provides technical assistance to public entities to strengthen their management, structures, and operations. The Center has provided services to scores of the Commonwealth’s cities and towns, as well as to numerous state agencies. Services offered by the Center include: management and organizational studies; performance management system development, implementation, and evaluation; leadership and supervisory training; municipal charter reform assistance; classification and compensation studies, and personnel policy and employee handbook development; analysis and design of multijurisdictional service collaboration and facilitation of multi-agency agreements; and executive recruitment and interim management services among other services. The Real Estate Services group of Stantec Consulting (formerly GLC Development Resources LLC) provides integrated real estate services, with a particular focus on real estate financing and development, to private, public, institutional, and not-for-profit clients. The group provides clients with the highest level of development expertise and offers a full range of services from feasibility studies and project planning to permitting, comprehensive project management, and construction administration. The Principals have all worked for major developers in senior capacities and bring real-world, private development experience to government entities for project and fiscal analysis. Project financing and development management comprises a major portion of their practice, and they use this background to inform their consulting and advisory work. Stantec provides professional consulting services in planning, engineering, architecture, interior design, landscape architecture, surveying, environmental sciences, project management, and project economics for infrastructure and facilities projects. The company supports public and private sector clients in a diverse range of markets at every stage, from the initial conceptualization and financial feasibility study to project completion and beyond. Staff include approximately 12,000 employees operating out of more than 200 locations in North America and four locations internationally.

Review of Proposed Zoning Bylaw Amendment & Concept Plan for March 25, 2013
129 Parker Street, Maynard, MA Page 2
Founded in 1914, Fay, Spofford & Thorndike (FST) is a multi-disciplined consulting firm that provides the highest caliber of professional services over a broad spectrum of engineering projects. Areas of practice include complete streets, roadways, and bridge design; transportation planning, peer reviews, and traffic operations studies and design; transportation facility planning; accessibility design; transit systems; bike trails and recreational facilities; numerous other supporting services, including environmental impact documents and permits; storm drainage; and other elements of public works and private industry projects. Headquartered in Burlington, MA, FST also has office in Boston and Hyannis, MA, as well as offices throughout the Northeast. Their professional staff (over 230 employees) is multidisciplinary with structural, civil, traffic, electrical, environmental, mechanical, and marine engineers; along with planners and landscape architects. This depth of qualified staff allows the firm to be responsive to clients’ staffing and scheduling needs to meet any specific project requirements.
Application Materials Reviewed1 This report constitutes a review of the project as described in three documents found on the Town’s website which together constitute the development application before the Maynard Planning Board. These documents are labeled as:
129 Parker Concept Plan (13-Feb-2013, scanned version, 10MB, 35 pages);
Traffic Impact and Assessment Studies [Part 1 / Part 2] (26-Feb-2013, 624 pages); and,
April 6th Special Town Meeting Warrant (28-Feb-2013, from Town Meeting page)2.
1 Town of Maynard, 129 Parker Street project page (http://www.townofmaynard-ma.gov/projects/129-parker-
street/ retrieved through March 24, 2013) 2 The Collins Center understands that a revised copy of the proposed Bylaw amendment was provided to the Town
Manager on March 21, 2013, but that the February 28th
version is what is before the Planning Board for consideration.
Review of Proposed Zoning Bylaw Amendment & Concept Plan for March 25, 2013
129 Parker Street, Maynard, MA Page 3
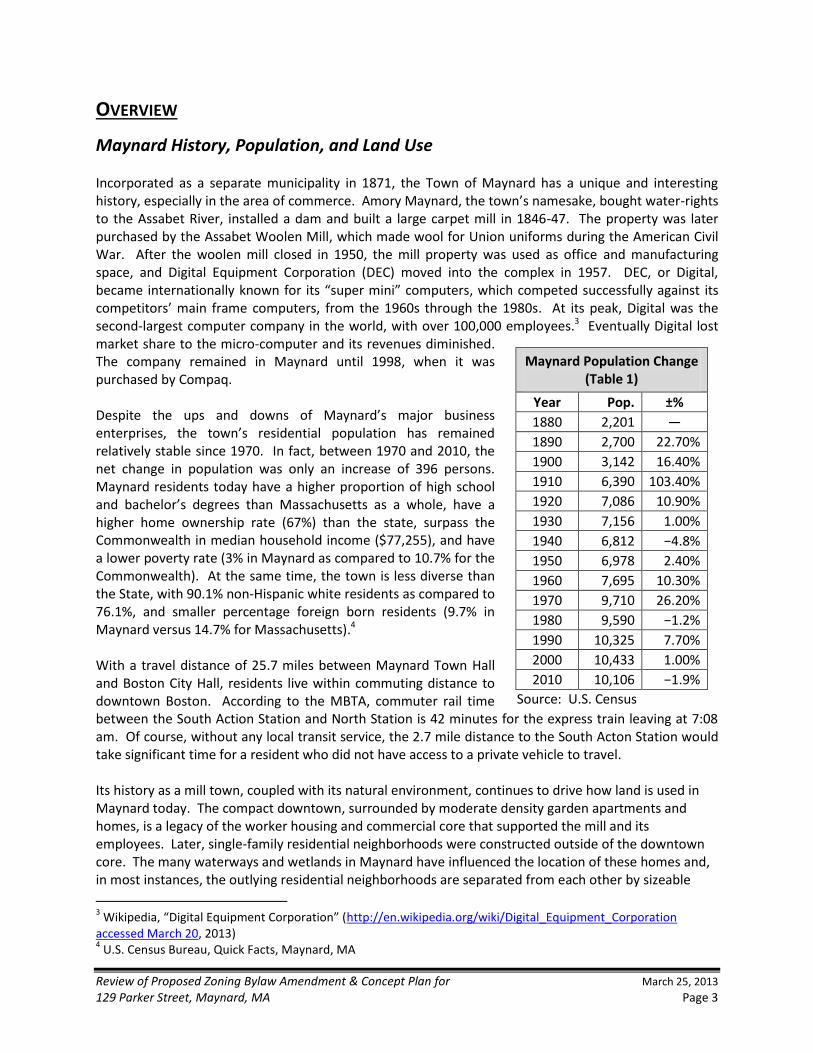
Maynard Population Change (Table 1)
Year Pop. ±%
1880 2,201 —
1890 2,700 22.70%
1900 3,142 16.40%
1910 6,390 103.40%
1920 7,086 10.90%
1930 7,156 1.00%
1940 6,812 −4.8%
1950 6,978 2.40%
1960 7,695 10.30%
1970 9,710 26.20%
1980 9,590 −1.2%
1990 10,325 7.70%
2000 10,433 1.00%
2010 10,106 −1.9%
Source: U.S. Census
OVERVIEW
Maynard History, Population, and Land Use Incorporated as a separate municipality in 1871, the Town of Maynard has a unique and interesting history, especially in the area of commerce. Amory Maynard, the town’s namesake, bought water-rights to the Assabet River, installed a dam and built a large carpet mill in 1846-47. The property was later purchased by the Assabet Woolen Mill, which made wool for Union uniforms during the American Civil War. After the woolen mill closed in 1950, the mill property was used as office and manufacturing space, and Digital Equipment Corporation (DEC) moved into the complex in 1957. DEC, or Digital, became internationally known for its “super mini” computers, which competed successfully against its competitors’ main frame computers, from the 1960s through the 1980s. At its peak, Digital was the second-largest computer company in the world, with over 100,000 employees.3 Eventually Digital lost market share to the micro-computer and its revenues diminished. The company remained in Maynard until 1998, when it was purchased by Compaq. Despite the ups and downs of Maynard’s major business enterprises, the town’s residential population has remained relatively stable since 1970. In fact, between 1970 and 2010, the net change in population was only an increase of 396 persons. Maynard residents today have a higher proportion of high school and bachelor’s degrees than Massachusetts as a whole, have a higher home ownership rate (67%) than the state, surpass the Commonwealth in median household income ($77,255), and have a lower poverty rate (3% in Maynard as compared to 10.7% for the Commonwealth). At the same time, the town is less diverse than the State, with 90.1% non-Hispanic white residents as compared to 76.1%, and smaller percentage foreign born residents (9.7% in Maynard versus 14.7% for Massachusetts).4 With a travel distance of 25.7 miles between Maynard Town Hall and Boston City Hall, residents live within commuting distance to downtown Boston. According to the MBTA, commuter rail time between the South Action Station and North Station is 42 minutes for the express train leaving at 7:08 am. Of course, without any local transit service, the 2.7 mile distance to the South Acton Station would take significant time for a resident who did not have access to a private vehicle to travel. Its history as a mill town, coupled with its natural environment, continues to drive how land is used in Maynard today. The compact downtown, surrounded by moderate density garden apartments and homes, is a legacy of the worker housing and commercial core that supported the mill and its employees. Later, single-family residential neighborhoods were constructed outside of the downtown core. The many waterways and wetlands in Maynard have influenced the location of these homes and, in most instances, the outlying residential neighborhoods are separated from each other by sizeable
3 Wikipedia, “Digital Equipment Corporation” (http://en.wikipedia.org/wiki/Digital_Equipment_Corporation
accessed March 20, 2013) 4 U.S. Census Bureau, Quick Facts, Maynard, MA

Review of Proposed Zoning Bylaw Amendment & Concept Plan for March 25, 2013
129 Parker Street, Maynard, MA Page 4
tracts of open space. Digital’s legacy on the built environment can be found in the light industrial complex on Route 62 at Sudbury Place, home to Stratus Technologies today, and the vacant property at 129 Parker Street. Commercial businesses can also be found scattered along the town’s connector roads, such as Great Road and Acton Street, but not in significant concentrations. Another significant feature of the town is what is now the Assabet River National Wildlife Refuge in the southwest quadrant of the town. “Formerly known as the Fort Devens Sudbury Training Annex, the refuge was established in 2000, when the Army transferred 2,230 acres to the (National Park) Service. This transfer was made under the Defense Base Closure and Realignment Act of 1990, for its “particular value in carrying out the national migratory bird management program.”5 A review of Planning Board agendas and Zoning Board of Appeals (ZBA) decisions reveals that the majority of permit activity over the past year or so has been modest in number and scale. Residential additions/modifications, sign permits, and some special permits for commercial uses have been among the cases that have been heard. The most significant exception was the Clock Tower Place reuse project, located at the former site of the Assabet Woolen Mill, American Woolen Company, and Digital headquarters in downtown Maynard. In 2011, the property owner requested approval of a rezoning proposal that would allow a portion of the building complex to be converted to up to 300 1-bedroom multi-family housing or extended-stay units. At the same time, a mix of uses would continue to be allowed on the property. To thoroughly understand the implications of this proposed rezoning, the Maynard community considered the bylaw amendment between Spring and October 2011, when it was ultimately approved by Town Meeting.
Property Description
Records regarding use of the property date back to 1683 when it was part of the John and Joseph Balcom estate. According to Dave Griffin of the Maynard Historical Society, “A descendent, Asa Balcom, was a town founder and one of the first Selectmen. In the early decades of the 20th century the property became the Salo-Simon Vegetable Farm. The farm closed in 1967 and in 1968 60-acre plot was sold to the Atkins & Merrill company which built what was later known the "PK1" building. (Among other things Atkins & Merrill built engineering models, including full scale models of the Apollo Moon Landers, which were seen on national television).”6 When Digital acquired the property in the 1970s, it occupied the building known as PK-1, a 110,000 square foot building built by Atkins & Merril (shown as the white roof in the aerial photo). This was
5 U.S. Fish and Wildlife Service, Assabet River National Wildlife Preserve Brochure,
(http://www.fws.gov/northeast/assabetriver/pdf/Assabet_general_brochure_2010.pdf retrieved March 24, 2013) 6 Emails from David Griffin to Monica Lamboy, March 20 and March 24, 2013.
Source: Bing Maps, retrieved March 17, 2013

Review of Proposed Zoning Bylaw Amendment & Concept Plan for March 25, 2013
129 Parker Street, Maynard, MA Page 5
Digital’s first expansion outside of the Mill building in downtown Maynard. Digital later built other two buildings: PK-3, a 400,000 s.f. two-story building (shown as the dark grey roof in lower portion of the aerial adjacent to the retention pond) and PK-2, a 50,000 square foot building built in the late 1970s as an education and training building (shown as a dark grey roof in the upper left hand corner of the site)7. Beginning in 1992 with the economic slowdown, Digital began laying off employees as it downsized. By 1999, the site was essentially vacant as it has been since8. The property at 129 Parker Street consists of total of 58.39 acres. The site has approximately 1,000 feet of road frontage along Parker Street. The northern property line, abutting residences on Field Street, is approximately 1,250 feet in length. In the southwest quadrant of the site, the property extends at its furthest point approximately 2,500 feet (nearly ½ mile) back from Parker Street, into an almost triangular configuration. As can be seen from the aerial photo, historically, the front portion of the site was occupied by Digital while rear portion remained undeveloped and is now tree covered. This area has been used for hiking purposes for quite some time, as was known to the immediately preceding property owner, John Wolters of 129 Parker Street, LLC. Until the current property owner undertook demolition, the developed portion of the site contained just under 453,000 gross square feet contained in three buildings,9 along with asphalt parking areas, a retention pond, and landscaping in the form of grassy areas and trees. Buffers of evergreen trees can be found along the northern property line, along the southern property lines abutting residences on Detting Road, and on a portion of the eastern property line adjacent to the office building located at 141 Parker Street. Areas of greenery presently line Parker Street and extend for a depth of between 150 to 300 feet from the street into the site. Adjacent properties consist of:
single family residences along Field Street, on Dettling Road, and on the opposite side of Parker Street;
municipal property in the form of the School Woods, home to the towns’ existing and new high schools, the Fowler Middle School and the Greenmeadow Elementary School and associated fields, and natural open space;
the 3-story office building at 141 Parker Street; and,
a tiny corner of the Assabet River Natural Wildlife Refuge.
The land and buildings were most recently sold in July 2011 for approximately $3.7 million. At the time of writing, only the PK-2 building remains in existence.
7 Email from Jack MacKeen to Dawn Capello, dated March 24, 2013.
8 Ibid.
9 Town of Maynard, Assessment Field Card, retrieved March 17, 2013.
Source: Maynard Conservation Commission

Review of Proposed Zoning Bylaw Amendment & Concept Plan for March 25, 2013
129 Parker Street, Maynard, MA Page 6
Description of NBOD and Industrial (I) Zoning Today, the zoning applicable to the property consists of the underlying Industrial (I) District, plus the Neighborhood Business Overly District (NBOD). The I District allows for a series of uses by right and others with approval of a special permit.
Uses in Industrial (I) District (Table 2)
By Right Uses (examples only) Special Permit Uses (examples only)
Garden Apartment Live Work Dwelling Unit Garden Center Business or professional office Bank or financial institution Car wash Supermarket Fitness Club Research laboratories w/incidental assembly or manufacturing Office Buildings Manufacturing, light manufacturing, development or engineering Warehousing Mini or self storage facility Wholesale use Overnight outdoors parking
Wireless telecom tower General or personal service establishment Veterinarian office or animal hospital Kennel, commercial Adult entertainment Body art establishment Kennel, private Drive-in or drive through facility
On top of the I District, the NBOD overlay was added with a purpose statement that reads as follows:
1. To encourage and authorize the mixed-use development of large land areas by means of authorizing and combining a variety of building types and uses with conditions and safeguards; and, 2. To prevent detrimental effects and impacts upon neighboring land uses and upon the Town of Maynard generally.
Among other provisions, the NBOD establishes a two-part approval process consisting of approval of a concept plan at Town Meeting followed by issuance of a Site Plan Approval by the Planning Board. This would allow the Town and the property owner to take a comprehensive look at all of the proposed buildings and uses proposed for the site via a single concept plan. In terms of uses, the NBOD increases the types of uses allowed in the underlying I District by adding by right uses such as restaurant, retail business, mixed use, and “multiple principal uses on a single lot or parcel” and two uses requiring a special permit including, multi-family dwelling and “mixed use with five (5) or more dwelling units.” Further, the NBOD allows housing to be built, but with a cap of no more than one hundred (100) units. The NBOD also establishes design criteria including, but not limited to, setbacks, buffers, and parking requirements for specified uses. In order to establish expectations relative to the size of the different uses on site, the NBOD also incorporated Table G, Dimensional Requirements, which is shown below.

Review of Proposed Zoning Bylaw Amendment & Concept Plan for March 25, 2013
129 Parker Street, Maynard, MA Page 7
“Table G: NBOD Dimensional Requirements” (Table 3)
Principal Use Maximum Gross Floor Area
Multi-Family Dwelling N/A
Healthcare Facility N/A
Health Club 30,000 s.f.
Restaurant 10,000 s.f.
Garden Center 25,000 s.f.
Personal Services Establishment 5,000 s.f.
Supermarket 75,000 s.f.
Retail Business 35,000 s.f.
Wholesale Business 35,000 s.f.
This table does not prevent more than one business from operating within each primary use category, but just limits the size of each individual business. For example, the site could have multiple restaurants, but no one restaurant could be greater than 10,000 square feet in size. Where the NBOD is silent, the Zoning Bylaw provisions for the I District apply.
Description of 2006 Proposal On June 12, 2006, Town Meeting approved the creation of the NBOD overlay district for the property at 129 Parker Street. On February 5, 2007, the concept plan for the site was approved, also by Town Meeting. In between those two dates, on December 20, 2006, the Board of Selectmen and 129 Parker Street LLC reached agreement and signed a development agreement for the property. As described in the development agreement, the project consisted of “Approximately 175,000 square feet of retail; and 100 residential units all as generally shown on the plan entitled ’Proposed Concept Plan, 129 Parker Street, Maynard, Mass., dated December 12, 2006 as revised through December 20, 2006….’”10 The development agreement included a series of mitigation requirements related to traffic and infrastructure, and several financial payments, including a $1 million gift to be paid as the phases of the project proceeded, $260,000 for specific traffic improvements, and additional funds for water and sewer infrastructure, $10,000 and $21,000, respectively. In addition, the development agreement secured for the Town an easement to continue use of the existing hiking trails on the site: “The Owner shall, by easement, allow the public use of the existing hiking trails which are partially located on the southwest corner of the Property. The Owner reserves the right to include all such land in the calculation of the land area of the Property in establishing zoning compliance (open space, lot size, density, etc.) and meeting other relevant regulatory requirements.”11 The 2006 Concept Plan map approved at Town Meeting shows:
stand-alone a grocery store that is slightly less than 200 feet by 400 feet in size;
10
129 Parker Street, Memorandum of Agreement, December 20, 2006, p 1. 11
Ibid., p 9.

Review of Proposed Zoning Bylaw Amendment & Concept Plan for March 25, 2013
129 Parker Street, Maynard, MA Page 8
an approximately 750 foot long building labeled Town Square that is drawn to show an intent to create multiple retail spaces;
a small stand-alone building called The Common that is labeled “food retail open space”;
two additional small stand-alone retail buildings; and,
four residential buildings shown in the southwest quadrant, backing up on open space. A note on the Proposed Concept Plan further refines the types of retail and services uses to be allowed in Town Square, beyond the requirements of the NBOD zoning. That note has been copied into the box below.
Two additional buildings are shown on the Concept Plan, labeled as:
Existing 1 Story Building, 50,000 s.f.; and,
Existing 2 Story Building, 400,000 s.f.
No use is identified for these two existing buildings. On September 8, 2009, the Planning Board issued a Site Plan and Parking Special Permit approval for Segment 1 of the project. According to the decision letter, the developer indicated that site plan approval of Segment 2 would be “sought at a later time”12 and Segment 3 was not part of the proposal before the Commission at the time. Authorized under the site plan approval was:
Demolition of existing Building 100 and construction of a new Building 100 for a supermarket (60,770 s.f.);
Construction of a new Building 400, called “Town Square,” for two or more retail units (56,600 s.f.);
Construction of three features called Town Square (aka Building 400), the Common (a gazebo/kiosk area adjacent to future Building 800), and Lagoon Court (“landing with benches and a gazebo”);
12
Decision of the Planning Board, Application for Site Plan Approval and Special Parking Permit, Maynard Lifestyle Center, 129 Parker Street, Maynard, MA, September 8, 2009, p. 3.
Note: With respect to the store spaces, all of which are labeled “Retail” in the center portion which runs parallel to Field Street, also noted on plan as Town Square, the following uses may also be included within such area: Possible Uses Use Category Daycare (up to 8,000 s.f.) Doctor’s Office (up to 2,400 s.f.) Barber Shop (up to 2,400 s.f.) Beauty Salon (up to 2,400 s.f.) Dry Cleaning pick up stores (up to 1,600 s.f.) Dental Office (up to 2,400 s.f.) Chiropractor’s Office (up to 2,400 s.f.) Restaurants (totaling an aggregate of 6,000 s.f.)
Day Care Center Business Office Health Care Personal Services Establishment Personal Services Establishment Personal Services Establishment Business Office Health Care Business Office Health Care Restaurant

Review of Proposed Zoning Bylaw Amendment & Concept Plan for March 25, 2013
129 Parker Street, Maynard, MA Page 9
Location of a footprint for a new 10,000 s.f building abutting the supermarket (building elevation and signage were specifically excluded from the permit as they would be subject of a future permit);
Associated parking and infrastructure improvements;
A sound barrier along north side of project; and,
Signage, including related waivers. To reach its decision on the Site Plan Approval, the Planning Board held seven (7) public hearings between June 2 and July 7, 2009. The Board then closed the public hearing and deliberated until September 1, 2009 before making a decision. The Site Plan Approval specifically indicates that the preservation of Building 200, and associated parking, is not being addressed in the site approval and may or may not be preserved in future applications.13
Description of Proposed Concept Plan The Concept Plan currently proposed by Capital Group Properties LLC14 consists of 724,000 square feet of development located in 15 different structures. One of these structures, “Existing Office Building” (aka PK-2) exists on site and is 50,000 square feet in size. The remaining buildings will be new construction. The buildings as labeled on the Concept Plan (SP-01) and their respective sizes can be found in Table 4 below.
Proposed Concept Plan (Table 4) Label Size (s.f.)
Anchor A 152,000
Anchor B 117,000
Jr Anchor A-C 50,000
Jr Anchor A 12,500 s.f.
Jr Anchor B 23,500 s.f.
Jr Anchor C 14,000 s.f.
Jr Anchor D 14,000
Pad A 6,500
Pad B 6,500
Pad C 3,000
Residential Bldg A (3 total), Bldg B (4 total), Bldg C (1 total), Clubhouse, and small unlabeled box
325,000
Existing Office Building 50,000
TOTAL 724,000
Eight (8) buildings in the southwest quadrant are clearly labeled as either residential or clubhouse, and two garden centers are indicated on the Concept Plan. However, the remaining structures depicted in
13
Ibid. 14
129 Parker Concept Plan (13-Feb-2013, scanned version, 10MB, 35 pages) accessed March 19, 2013. http://www.townofmaynard-ma.gov/projects/129-parker-street/

Review of Proposed Zoning Bylaw Amendment & Concept Plan for March 25, 2013
129 Parker Street, Maynard, MA Page 10
the Concept Plan, in whole or in part, do not have a specific land use(s) associated with them. The total building area that is not residential, nor is proposed for municipal use, is 349,000 square feet. The attributes of the buildings are somewhat difficult to ascertain given the scale of the drawings available. What can be seen is that:
Jr. Anchor D and Pad A show evidence of drive through lanes;
Anchor A and Anchor B show defined loading dock areas; and,
Anchor A and Anchor B include garden centers as part of their use. The loading facilities for the other buildings are unclear from the Concept Plan. In terms of the Concept Plan, aside from the major tenanted buildings, the property is proposed to contain:
Two retention ponds resulting from the bifurcation of the existing retention pond by an internal access road;
1,802 parking spaces for the non-residential uses and 502 spaces for the residences;
A clubhouse and pool which appear to be for use by residents; and,
Area for outdoor seating adjacent to Pads A, B, and C.
Although the actual type of plantings proposed cannot be read on the Overall Landscape Plan (L-1) due to its size, in general what can be seen includes a single rows of trees along the site entrance drive, at the end of parking aisles, along the Parker Street frontage, and some trees (and perhaps shrubs) along the north and southern perimeters. One to two rows of trees separate Anchor A’s loading dock from residences to be constructed. Additionally, it appears that the area of mature trees on the steep slope between the office building at 141 Parker Street and the site are to be removed and replaced with a single row of trees. A review of the drawing labeled “Proposed Development Overlay Program” (SP-02) shows that the proposed development will extend beyond the paving and building outlines used by Digital. The extensions include:
Three Residence Building As, one Residence Building C, and portions of three Building Bs extend into the existing undeveloped area at the southwest corner of the site. The westernmost corner of one of the Building As appears to encroach as much as 350 feet into this area;
Along the southern property line, three Residence Building As and one Residence Building B more closely abut the southern property line than prior building PK-3 and one Residence Building B more closely abuts the southern property line than the existing pavement;
The proposed parking behind the Existing Office Building (PK-2) extends into what is currently a treed area between the site and the residences on Field Street, as does the parking and associated
Source: Capital Group Properties concept plan application
Review of Proposed Zoning Bylaw Amendment & Concept Plan for March 25, 2013
129 Parker Street, Maynard, MA Page 11
access drive behind Anchor B; and,
Jr Anchor C and Pad C are fully within the existing green area along the Parker Street frontage while Pad A is partially within this area. The associated parking with all three of these buildings extends to within approximately 25-35 feet of the front property line.
Description of Proposed Amendments to Zoning Bylaws Zoning Bylaws in most jurisdictions typically cover a series of project attributes in order to provide clear expectations about what is and is not allowed on a property. They will most often include provisions relating to:
Purpose;
Applicability;
Submittal requirements;
Land use(s);
Dimensional requirements (height, setbacks, parking, open space, etc.);
Design requirements; and,
Procedural requirements, including required findings. Reading a zoning bylaw can be challenging because sometimes the provisions that apply to a property can be distributed throughout the code. In the case of the Maynard Bylaw, many of the requirements that apply to 129 Parker Street can be found in the NBOD Overlay District, while others reside within the main body of the code. Capital Group Properties LLC has proposed a series of modifications to the NBOD District that are generally described below. (A complete copy of the amendment can be found on the Town’s website. The summary below should not replace a thorough reading of the proposal.) Proposed changes include, but are not limited to:
9.3.2 Applicability – a sentence is to be added indicating that “where NBOD is different than any other provision elsewhere…NBOD shall control.”
9.3.3 Requirement for Approval of a Concept Plan at Town Meeting – a definition of concept plan is to be added; the submittal requirements for a concept plan are to be modified to eliminate building use as an element of the concept plan; the reference to Section 6.1 for buffer requirements15 is to be changed to the NBOD itself; execution of a Development Agreement between the Selectmen and the Developer is proposed to take place before Town Meeting approval of the concept plan; and signature of the Development Agreement by the Planning Board is to be added.
9.3.5 Permitted Principal Uses – the list of uses allowed by right (i.e., without a special permit) is to be increased by adding: Theatre, Club or Other Place of Entertainment; Multi-Family Dwelling; Fast Food Restaurant; Motor Vehicle Light Service; Printing Shop; Brewery with Ancillary Food Service; Emerging Energy Technology Establishment; Family, Adult and Child Daycare; Clinic and Medical, Dental and Psychiatric Office; Business or Professional or Other Office; and, General Service Establishment.
15
It should be noted that Section 6.1 actually encompasses parking and loading standards, including the size of spaces and allowable percentage of compact spaces. This appears to be a scrivener’s error within the existing code.

Review of Proposed Zoning Bylaw Amendment & Concept Plan for March 25, 2013
129 Parker Street, Maynard, MA Page 12
9.3.7 Uses Permitted by Special Permit of the Planning Board – the list of uses allowed with a special permit is to be modified to add Elderly Housing and Assisted Living and eliminate Multi-Family housing which is being proposed as a by-right use.
9.3.8 Dimensional Requirements – the table labeled “Dimensional Uses,” which identifies the maximum gross floor area of an individual principal use is to be replaced with a list of building sizes, with the exception that a maximum gross floor area is being established for residential uses in the aggregate and municipal facilities; the Planning Board is to be given authority to increase square footage of individual buildings by 5% via special permit, without Town Meeting approval, except that no special permit is required for an increase in square footage of up to 15% if one “use” is offset by an equivalent reduction in another “use.”
9.3.9 District Non-Residential Total – the existing 175,000 square foot cap on non-residential (and non-healthcare) development is to be eliminated and reference is to be made to table 9.3.8 above, which allows for 349,000 square feet in non-residential development and 50,000 in municipal use.
9.3.10 Housing Cap – the allowable number of units on site is to be increased from 100 to 250; the Board of Selectmen is to be given authority to increase this figure by 5% more by special permit without Town Meeting.
9.3.11.3 Setbacks/Buffers – required setbacks are to be modified as follows: o Side setback adjacent to residentially zoned or occupied property – reduced from 100
feet to 40 feet;16 o Setback adjacent to open space – 20 foot setback added;17 o Front and rear setbacks – (see foot notes 10 and 11 below); and, o Buffer area adjacent to residentially zoned or occupied property – reduced from 45 feet
to 20 feet;
9.3.11.4 Parking – required parking is to be modified as follows: o Retail, supermarket – reduced from one space per 250 square feet to one space per 300
square feet; o Residential – reduced from two per dwelling unit to 1.75 spaces per unit. o Restaurant - requirement of one space per 85 square feet of gross floor area being
added;18 o Warehouse uses – modified from one space per 2,000 square feet for first 20,000 and
one per each additional 10,000 square feet, plus employee parking to one space per 2,500 square feet of gross floor area; and,
o Office use and others not specified – requirement of one space per 300 square feet being added.
9.3.11.5 Dimensional Requirements – are to be added to: o Establish minimum parcel size of 15,000 square feet with 100 feet of frontage and 100
feet of width, whereas the existing minimum size in Industrial (I) District is 40,000 square feet with 150 feet of frontage and 120 feet of width;
16
The proposed amendment actually requires “…front and rear setback areas of at least fifty (50) feet…where it abuts…residentially zoned properties…”. However, since the front property line abuts the public right of way and the I District zoning extends beyond the rear parcel line into School Woods, neither of those setbacks apply at 129 Parker Street. 17
Setbacks in the I District include: front yard = 50 feet; side and rear yards =30 feet (Section 4.1.1. General, Table B) 18
No parking requirement for restaurants could be found elsewhere in the Bylaw.

Review of Proposed Zoning Bylaw Amendment & Concept Plan for March 25, 2013
129 Parker Street, Maynard, MA Page 13
o Establish maximum building coverage of 35% and maximum height of 52 feet for residential and 40 feet for other uses, where the existing coverage maximum for the Industrial (I) District is 35% and existing height limitation is 40 feet; and,
o Establish minimum landscape open area of 20% for the site and minimum landscape open area of 5% in the front yard, whereas the existing minimum open space in the Industrial (I) district is 30% and the minimum front yard is 10% landscaped.
9.3.12 Site Plan Approval – is intended to revise the finding of approval for a Site Plan from “The Planning Board may not” issue a site plan approval unless it “substantially conforms” to the approved Concept Plan to “The Planning Board may issue” unless it “substantially does not conform.”

Review of Proposed Zoning Bylaw Amendment & Concept Plan for March 25, 2013
129 Parker Street, Maynard, MA Page 14
THIS PAGE IS INTENTIONALLY BLANK

Review of Proposed Zoning Bylaw Amendment & Concept Plan for March 25, 2013
129 Parker Street, Maynard, MA Page 15
FISCAL IMPACT STUDY

Review of Proposed Zoning Bylaw Amendment & Concept Plan for March 25, 2013
129 Parker Street, Maynard, MA Page 16
THIS PAGE IS INTENTIONALLY BLANK

Memo
m c:\users\mlamboy\desktop\monica's files\maynard\draft report\stantec_fiscal_impact_study_(final) 3-25-13.docx
To: Monica Lamboy From: Drew Leff
UMB 141 Portland Street
File: Maynard Date: March 25, 2013
Reference: 129 Parker Street Fiscal Impact Study
We have reviewed the program and concept plan for Capital Group Properties Inc. (CGP)’s proposed development at 129 Parker Street in Maynard, MA and have assessed the likely fiscal impacts of the proposed development. We have also analyzed some of the economic impacts; in particular, direct employment and select characteristics of the retail center and their impact on Maynard.
Project Overview
The proposed project is located at 129 Parker Street on a 58.3 acre former Digital Equipment site. The site is proposed to be cleared of all but a 50,000 sf structure. In their place the developer proposes to construct a “big box” retail center of 349,000 sf and a 250 unit apartment complex. The site is bordered by residential on two sides with open space on the other sides. Its entrance is located 1 mile from Maynard’s central retail district.
The current property owner purchased the site in July 2011 for $3,695,627. The developer has indicated that they anticipate that the assessed value for the land will be $2,981,800 once they have demolished the buildings on site, excluding the one they expect to retain.
The study approach looked at net revenue and expenses for the mix-used development. The primary focus being on the real estate tax revenues generated against increase in annual expenses to the Town.
The following chart illustrates the proposed composition of the development by use:
Residential Units SF Units
One BR 79 One BR +Den 28 Two BR 125 Two BR +Den 18 Total Residential 325,000 250

25 March 2013
Monica Lamboy
Page 2 of 14
Reference: 129 Parker Street Fiscal Impact Study
m c:\users\mlamboy\desktop\monica's files\maynard\draft report\stantec_fiscal_impact_study_(final) 3-25-13.docx
Retail SF
Anchor A 152,000 Anchor B 117,000 Jr. Anchor 14,000 In-line (Jr. Anchors A-C) 50,000 Pad sites 16,000 Total Retail 349,000 Community Building 50,000 Total Plan SF 724,000
Summary of Project Findings
We have analyzed projected net revenue and expenses to the Town as a result of this development, both on an annual basis and during the development period. A more detailed analysis and discussion is provided later in this memorandum.
Projected Annual Town Revenues (Net of current taxes)
Real Estate Tax $2,280,926 CPA Surcharge $34,214
Excise Tax $88,425 Food & Beverage Tax $35,625
TOTAL REVENUE $2,439,190 Projected Annual Town Expenses
Education $305,617 Municipal Services $1,274,161 TOTAL EXPENSE $1,579,779
Projected Annual Net Town Revenues
Revenue $2,439,190 Expense $1,579,779 NET BENEFIT $859,411
Development Period Fiscal Impacts
Construction Permit Fees: $871,750
We have not projected any direct development period expenses related to the development of the project. However, to the extent the Town has insufficient

25 March 2013
Monica Lamboy
Page 3 of 14
Reference: 129 Parker Street Fiscal Impact Study
m c:\users\mlamboy\desktop\monica's files\maynard\draft report\stantec_fiscal_impact_study_(final) 3-25-13.docx
staff to review plans and inspect the site, they may have to spend some additional funds for consultants.
Community Building
Provision by the developer of a 50,000 SF building on-site restored to a modest level of renovation could be considered a benefit if the Town had pressing need for similar space. Otherwise it could be a fiscal drain requiring additional build-out initially beyond that provided by developer and ongoing annual operating expense. As Town explores options for use and agreement with the developer there will be a better understanding of the extent of the benefit and ongoing expense.
Economic Impacts:
a. Direct Employment
We project that the retail businesses will generate 426 full time equivalent jobs annually (A significant portion of these jobs will be part-time). However, the majority of these could be created elsewhere in the general vicinity of Maynard, as eventually other retail would likely be developed to satisfy demand that might exist.
We project that the project will generate 501 construction jobs.
b. Local vs. Regional Shopping Center
Specific questions had been raised regarding the nature of the retail center and the extent to which the apartments on-site would support the retail. We have projected that the 250 units would only minimally support the center. They would provide less than 2% of the purchasing power anticipated. Further, we project that the population needed to support the proposed retail development will extend well beyond the borders of Maynard. We project that a population of 90,000-180,000 would be needed.
(Derivation of these estimates is provided in the more detailed discussion, below.)

25 March 2013
Monica Lamboy
Page 4 of 14
Reference: 129 Parker Street Fiscal Impact Study
m c:\users\mlamboy\desktop\monica's files\maynard\draft report\stantec_fiscal_impact_study_(final) 3-25-13.docx
Town Revenues
Annual Revenues
Four components of annual revenue have been analyzed: Real Estate Tax, CPA Surcharge, Excise tax, and Food & Beverage (Meals) tax. The real estate tax is by far the biggest component.
Real Estate Tax
The three tables below illustrate different approaches to estimating property taxes; on by the developer and two alternatives that we have suggested. The alternative approaches have not yet been reviewed with the Board of Assessors.
The first table is CGP’s estimate of assessments and taxes. CGP based their estimate on select comparables for similar retail and residential in nearby communities. They then discounted these assessments. We see no reason to
Concept Plan & RE Tax Calculation
SF Units
PSF
Value
Improved
Value Tax Rate Re Tax Rev
One BR 79
One BR + Den 28
Two BR 125
Two BR+ Den 18
TOTAL RESIDENTIAL 325,000 250 58.00$ 18,850,000$ 20.05$ 377,943$
Anchor A 152,000 56.00 8,512,000 29.55 251,530
Anchor B 117,000 56.00 6,552,000 29.55 193,612
Jr. Anchor 14,000 86.00 1,204,000 29.55 35,578
In-line (Jr. Anchors A-C) 50,000 60.00 3,000,000 29.55 88,650
Pad sites (A-C) 16,000 124.00 1,984,000 29.55 58,627
TOTAL RETAIL 349,000 21,252,000$ 627,997$
50,000
724,000 40,102,000$ 1,005,939$
58.3 ac 2,981,800$ 29.55$ 88,112$
43,083,800$ 1,094,051$
CGI Projection
RESIDENTIAL UNITS
RETAIL
COMMUNITY BUILDING
LANDTOTAL LAND & BUILDINGS

25 March 2013
Monica Lamboy
Page 5 of 14
Reference: 129 Parker Street Fiscal Impact Study
m c:\users\mlamboy\desktop\monica's files\maynard\draft report\stantec_fiscal_impact_study_(final) 3-25-13.docx
discount these comparables. In fact, we are concerned that most of the comparables are for facilities built in the 1990s and early 2000s. New buildings that have not depreciated would be valued considerably higher. Further, CGP has indicated that the current site assessment should be $2,981,800, projecting that it will be reduced from the current assessment of $5,949,400 because they have demolished the major buildings on the site with the exception of the building that is to be retained. We would argue that the land value after demolition should be at least what they paid for the site plus the cost of demolition. The property has more value as a building site than with the rundown buildings in place.
The projected net tax revenue as they’ve estimated it is $1,094,051. After deducting the projected current taxes of $88,112, they project net new tax revenue of $1,005,939.
Concept Plan & RE Tax Calculation
SF Units
PSF
Value
Improved
Value Re Tax Rev
One BR 79
One BR + Den 28
Two BR 125
Two BR+ Den 18
TOTAL RESIDENTIAL 325,000 250 61.81$ 20,088,250$ 402,769$
Anchor A 152,000 90.31 13,727,120 405,636
Anchor B 117,000 106.97 12,515,490 369,833
Jr. Anchor 14,000 141.90 1,986,600 58,704
In-line (Jr. Anchors A-C) 50,000 142.47 7,123,500 210,499
Pad sites (A-C) 16,000 200.00 3,200,000 94,560
TOTAL RETAIL 349,000 38,552,710$ 1,139,233$
50,000
724,000 58,640,960$ 1,542,002$
58.3 ac
incorporated
in comps
58,640,960$ 1,542,002$
Stantec Projection Based on Comps
RESIDENTIAL UNITS
RETAIL
COMMUNITY BUILDING
LANDTOTAL LAND & BUILDINGS

25 March 2013
Monica Lamboy
Page 6 of 14
Reference: 129 Parker Street Fiscal Impact Study
m c:\users\mlamboy\desktop\monica's files\maynard\draft report\stantec_fiscal_impact_study_(final) 3-25-13.docx
The second table is based on the CGP comparables, and a few additional ones that we were able to identify, as assessed by the municipalities, without a discount. Land value is incorporated into these assessments. The projected net tax revenue on this basis would be $1,542,002. After deducting the projected current taxes of $88,112, the projected net new tax revenue would be $1,453,890.
The third table uses the estimated cost of development as a basis for estimating the assessment. We believe this is a more appropriate, yet still conservative, method to estimate value. A developer would not knowingly build a project that would be worth less than their development costs. The projected net tax revenue on this basis would be $2,369,038. After deducting the projected current taxes of $88,112, the projected net new tax revenue would be $2,280,926.
Concept Plan & RE Tax Calculation
SF Units
Estimated
PSF
Develop't
Costs
Improved
Value Re Tax Rev
One BR 79
One BR + Den 28
Two BR 125
Two BR+ Den 18
TOTAL RESIDENTIAL 325,000 250 138.00$ 44,850,000$ 899,242.50$
Anchor A 152,000 132.72 20,173,440 596,125
Anchor B 117,000 132.72 15,528,240 458,859
Jr. Anchor 14,000 180.72 2,530,080 74,764
In-line (Jr. Anchors A-C) 50,000 162.72 8,136,000 240,419
Pad sites (A-C) 16,000 210.72 3,371,520 99,628
TOTAL RETAIL 349,000 49,739,280$ 1,469,796$
50,000
724,000 94,589,280$ 2,369,038$
58.3 ac
incorporated
in retail
94,589,280$ 2,369,038$
Stantec Projection Based on
Development Cost
RESIDENTIAL UNITS
RETAIL
COMMUNITY BUILDING
LAND
TOTAL LAND & BUILDINGS

Memo
m c:\users\mlamboy\desktop\monica's files\maynard\draft report\stantec_fiscal_impact_study_(final) 3-25-13.docx
Other Revenue
In the table below we have shown calculations for all annual revenue, including real estate taxes:
o The Community Preservation Act (CPA) surcharge on the projected real estate tax, at 1.5% would add an additional $34,214/annum to Town revenue.
o Excise Tax: 129 Parker Street we have estimated that the new residents and retail establishments will generate 393 new vehicles. The excise tax
Town Revenues
ANNUAL
RE TAX Tax
Residential 899,243$
Retail 1,469,796$
Land incorporated above -$
TOTAL RE 2,369,038$
Current (after demolition) 88,112$
Net 2,280,926$
CPA SURCHARGE 1.5% 34,214$
EXCISE TAX units
cars /
unit cars
average
bill
Residential 250 1.5 375 225.00$ 84,375$
Retail 9 2 18 225.00$ 4,050$
TOTAL 88,425$
FOOD AND BEVERAGE SF Sales/SF Expenditures Rate Total
2 Restaurants 9,500 500$ 4,750,000$ 0.75% 35,625$
TOTAL NET ANNUAL REVENUE 2,439,190$

25 March 2013
Monica Lamboy
Page 8 of 14
Reference: 129 Parker Street Fiscal Impact Study
m c:\users\mlamboy\desktop\monica's files\maynard\draft report\stantec_fiscal_impact_study_(final) 3-25-13.docx
on these vehicles based on an average bill of $2251 per vehicle will total $88,425 in tax revenue/annum.
o Food & Beverage/Meals Tax: There are two new restaurants in the project plan with a total of 9,500 sf. At $500 per square foot, the total expenditures for food and beverage will be $4,750,000. At an excise of .75% the total generated by these two restaurants is $35,625.
o We estimate that 129 Parker Street will generate $2,439,190 of total annual revenues/annum for the Town of Maynard, beyond what would otherwise be expected to be generated by the property.
Development Period (One-Time Revenue): The construction of the project will generate revenues for the Town on a one-time basis. Construction permit fees are calculated in the table on the next page. Construction values have been estimated (following table) based on our knowledge and experience with similar development and construction on a $/SF basis. The community building renovation has been included as it is expected that the developer would undertake the base renovation. The total building permit fee for the development is estimated at $871,750.
1 Board of Assessors March 14, 2013 memo

25 March 2013
Monica Lamboy
Page 9 of 14
Reference: 129 Parker Street Fiscal Impact Study
m c:\users\mlamboy\desktop\monica's files\maynard\draft report\stantec_fiscal_impact_study_(final) 3-25-13.docx
SF Units
One BR 79
One BR + Den 28
Two BR 125
Two BR+ Den 18
TOTAL RESIDENTIAL 325,000 250 115$ 37,375,000$
Anchor A 152,000 100 15,200,000
Anchor B 117,000 100 11,700,000
Jr. Anchor 14,000 140 1,960,000
In-line (Jr. Anchors A-C) 50,000 125 6,250,000
Pad sites (A-C) 16,000 165 2,640,000
TOTAL RETAIL 349,000 37,750,000$
50,000 75 3,750,000
724,000 78,875,000$
RETAIL
COMMUNITY BUILDING
Stantec Projection
Est. Construction Cost
RESIDENTIAL UNITS
CONSTRUCTION PERIOD
CONSTRUCTION PERMIT
Construction
Value Rate Total
Residential 37,375,000$ 1.0% 373,750$
Commercial 41,500,000$ 1.2% 498,000$
TOTAL 871,750$

25 March 2013
Monica Lamboy
Page 10 of 14
Reference: 129 Parker Street Fiscal Impact Study
m c:\users\mlamboy\desktop\monica's files\maynard\draft report\stantec_fiscal_impact_study_(final) 3-25-13.docx
Town Expenses
Annual Expenses
The project will require annual services from the Town which are outlined in the Town Expenses table below. These expenses include both educational expenses as well as municipal service costs. The 250 residential housing units are distributed among one bedrooms, one bedroom plus, two bedrooms and two bedrooms plus. Based on data from other residential developments and other towns provided in the CHAPA study2 and the similar estimates in the Clock Tower Place fiscal analysis3 we estimated the likely number of school children that would be generated from different unit types, ranging from .03/unit for 1BR to .30/unit for the 2BR+den. On that basis we project that the proposed development would generate 35.57 school age children in the new residential units. The cost per child, on the basis of Maynard’s 2013 school budget adjusted for state aid is $8,592 per student. With a total of 36 students the total additional annual school cost would be $305,617. This is a conservative estimate. One could argue that those school costs that are fixed, such as administrative personnel, facilities cost, etc. would not increase with the addition of 36 children town-wide.
It is difficult to estimate the incremental cost of annual municipal services, such as police, fire, ambulance, DPW and a few other smaller departments that might be burdened because of the development. It would require extensive interviews with each department. This was beyond the scope of this study. To provide an approximation, we calculated the project’s real estate tax bill as a percentage of Maynard’s total tax revenue to get a “fair” share. That share is 8.96%. Applying that percentage against the town’s non-school expenditures, adjusted for capital costs (bond payments) and other clearly fixed costs that would not increase because of the addition of the development, we estimated the projects’ share of municipal service cost would be $1,269,525. This is in addition to the school costs above. Again, we believe this is a conservative estimate.
We also examined the issue of whether the project was likely to generate a requirement for new school construction. The 36 (rounded) projected additional school children represent a 2.7% increase in the entire school population and does not likely warrant any new school construction. This would represent only 2.5 additional school children per grade. This is especially true given a new high school is already under construction in Maynard.
2 Citizens Housing and Planning Association, Housing the Commonwealth’s School-Age
Children, Sept 2004) 3 Community Opportunities Group, Inc., Fiscal and Economic Impact Analysis Clock Tower Place

25 March 2013
Monica Lamboy
Page 11 of 14
Reference: 129 Parker Street Fiscal Impact Study
m c:\users\mlamboy\desktop\monica's files\maynard\draft report\stantec_fiscal_impact_study_(final) 3-25-13.docx
Net Annual Fiscal Benefit Total Annual Revenue $2,430,765
Total Annual Expense $1,575,142
Net Additional Annual Revenue $855,623
Development Period Fiscal Benefit
Construction Permit Fees $ 868,300
Other Potential Benefits and Impacts
Community Building
The community building has a value to the Town if it meets a programing and facility need within the town. Based on an estimated $75/sf construction estimate, the cost to the developer for the community building would be $3,750,000. Depending on programing needs and maintenance costs there may be additional cost to build-out the
Town Expenses
ANNUAL
SCHOOLS Units
School
children /
unit
School
age
children
Cost / child
adj. for State
Aid School Cost
One BR 79 0.03 2.37
One BR + Den 28 0.1 2.8
Two BR 125 0.2 25
Two BR+ Den 18 0.30 5.4
TOTAL 250 36 $8,592 305,617$
OTHER MUNICIPAL COSTS
Share of
total tax
base
Non-School
Expenditure
9.00% 14,160,897$ 1,274,161$
TOTAL ANNUAL COSTS 1,579,779$

25 March 2013
Monica Lamboy
Page 12 of 14
Reference: 129 Parker Street Fiscal Impact Study
m c:\users\mlamboy\desktop\monica's files\maynard\draft report\stantec_fiscal_impact_study_(final) 3-25-13.docx
building beyond what the developer has been willing to provide. At 50,000 sf the structure will have operating and maintenance expenses on an annual basis. These could easily exceed $3-5/sf or $150,000-250,000/annum exclusive of program costs, if any. The key question is does the municipality need the building; would it have sought such a facility if it wasn’t given it. If it does need it, the replacement value could be in the range of $150/sf for a total value of $7,500,000.
Economic Impacts
We have analyzed direct employment generated by the development during construction and by the retail uses annually, and have commented on the nature of the shopping center component and the size of the market area: Will it be a local center almost exclusively supported by residents of the development and nearby sections of Maynard or will it be more of a regional center supported by residents of a much larger area.
Retail employment is a mix of part-time as well as full-time workers. We have projected retail employment at 426 Full Time Equivalent (FTE) retail jobs based on factor of 1.22 employees per 1,000 sf of building4. These employees will likely spend a proportion of their income at other town retail establishments as well as on-site and elsewhere. We have projected 499 construction jobs based an estimated 50% labor share (industry rule-of-thumb) and an average wage rate fully-loaded of $75,000 (discussions with contractors).
Retail Market Support
It is our understanding that the developer has indicated in discussion of traffic generation that the retail component will generate less traffic than might otherwise be
4 (Ratio derived from Department of Energy website:
http://www.eia.gov/emeu/consumptionbriefs/cbecs/pbawebsite/retailserv/retserv_howmanyempl.htm).
Community Building 50,000 150.00$ 7,500,000$
EMPLOYMENT
Jobs/Annum SF Employees per 1000SF Jobs
Retail 349,000 1.22 426
Construction Jobs
Construction
Value Labor share Rate Jobs
75,125,000$ 37,562,500$ 75,000$ 501

25 March 2013
Monica Lamboy
Page 13 of 14
Reference: 129 Parker Street Fiscal Impact Study
m c:\users\mlamboy\desktop\monica's files\maynard\draft report\stantec_fiscal_impact_study_(final) 3-25-13.docx
the case because some of the business for the retailers would be derived from residents on-site. We have estimated the on-site residential population at 400 people. The average retail expenditure in MA is $13,5535/person/annum. Optimistically, the center might capture, at most, 30% of the annual retail expenditure of the residents. We reviewed articles in the financial press related to sales performance of major retailers to determine average square footage sales for the types of retailers anticipated to lease the facilities6. On average those sales are $357/sf. Therefore the potential retail expenditures from residents of the site would only support about 4,556 sf of the retail on site. Given that this is a small fraction of the total proposed retail component of the project, a much broader population will be required to make the retail viable. It will need to aim at a more regional market.
Further, we project that the population needed to support the proposed retail development will extend well beyond the borders of Maynard. To determine the likely market we multiplied potential sales/per SF by the Center’s retail square footage to derive estimated sales (expenditures) for the center ($124,699,000). If we assumed that population not in close proximity to the Center would spend between 5-10% of their retail expenditures at the Center, a population of 90,000-180,000 would be needed to support the Center.
We have reviewed a Neilsen retail leakage report7 to determine if demand for the types of retail proposed exceeded current supply. As stated above, almost $125,000,000 of retail sales (expenditures) is needed to support the Center. The limited gap of retail demand versus sales within the 1 and 5 mile radii are of concern for project feasibility. The project must draw almost a third of the excess demand that exists within a 5 mile radius of the site or almost 10 percent of the excess demand within 10 miles. We expect that in order to obtain financing significant pre-leasing of the anchors and possibly others will be needed.
5 US Census Quick Facts 2007
6 Examples of retailers obtained from developer’s submission of estimated property taxes based
on comparable facilities (Anchor A: Walmart, Anchor B: Lowes) 7 Neilsen, RMP Opportunity Gap for 129 Parker, Maynard, 1, 5, and 10 mile radii. Provided as
Appendix.

25 March 2013
Monica Lamboy
Page 14 of 14
Reference: 129 Parker Street Fiscal Impact Study
m c:\users\mlamboy\desktop\monica's files\maynard\draft report\stantec_fiscal_impact_study_(final) 3-25-13.docx
Drew M. Leff Principal, Program and Project Management Stantec Consulting [email protected]
Attachment: Nielsen RMP Opportunity Gap (Appendix A)
RETAIL SUPPORTED BY RESIDENTIAL COMPONENT
Projected residential population: 400
Average retail expenditure in MA per person $ 13,553
Share expended at 129 Parker 30% $ 4,066
Total Expendiure at 129 Parker $ 1,626,360
Average Sales/SF 357$
SF supported by on-site population 4,556
EXPENDITURE AT $/SF BY STORE TYPE $/SF SF
Expenditure
Needed
Discount / Warehouse Store 434 152,000 65,968,000$
Home Improvement Store 299 117,000 34,983,000
Pharmacy 282 14,000 3,948,000
Other 300 66,000 19,800,000
TOTAL 349,000 124,699,000$
General population needed to support remaining retail at capture ratio
10.0% 90,808
5.0% 181,617

Review of Proposed Zoning Bylaw Amendment & Concept Plan for March 25, 2013
129 Parker Street, Maynard, MA Page 31
TRAFFIC IMPACT PEER REVIEW

Review of Proposed Zoning Bylaw Amendment & Concept Plan for March 25, 2013
129 Parker Street, Maynard, MA Page 32
THIS PAGE IS INTENTIONALLY BLANK

MEMORANDUM
DATE: March 25, 2013
TO: Ms. Monica R. Lamboy, Senior Associate, Edward J. Collins, Jr. Center for
Public Management
FROM: Douglas C. Prentiss, P.E., PTOE
SUBJECT: Traffic Impact Peer Review of The Shoppes at Maynard Crossing
Maynard, Massachusetts
INTRODUCTION
Fay Spofford & Thorndike (FST) has been contracted by the Edward J. Collins Center for
Management at UMass-Boston to conduct a peer review of the traffic/transportation, pedestrian,
and circulation impacts related to the proposed mixed-use development named The Shoppes at
Maynard Crossing. The project is proposed to be located on the west side of Parker Street (Route
27), between Vose Hill Road to the south and Field Street to the north. The site is the former
DEC (Digital Equipment Corporation) office complex which is approximately 58.4 acres in size.
Two (2) site drives are proposed for the project, the most northerly being a right-in only drive
and located opposite South Street to the east. The primary drive is located approximately 550
feet to the south and diagonally opposite #130 Parker Street (Route 27). Route 27 is a Town-
owned and maintained roadway
As part of the review, FST has received and reviewed the following applicable documents:
1. Traffic Impact & Access Study Proposed The Shoppes at Maynard Crossing, 129
Parker Street Maynard, Massachusetts, prepared by Green International Affiliates,
Inc., dated February 2013; Report I and II;
2. Conceptual Site Plan – The Shoppes at Maynard Crossing; February 4 and 5, 2013; Ci-
designinc; and
3. PowerPoint Presentation for Planning Board; Capital Group; October 29, 2012.
In addition to the above, we are in receipt of the following historic documents to assist us with
our review:
Intersection Feasibility Study Presentation-Downtown Area; October 20, 2012; AECOM;
Intersection Feasibility Study; September 24, 2012 and march 21, 2013; AECOM;
Preliminary Traffic Impact and Access Study; VAI; August 2006;
Miscellaneous review letters, Judith Nitsch Engineering; October-November 2006
This traffic impact peer review was conducted within the context of State and local guidelines
and procedures outlined by the transportation industry regarding format for traffic impact and
access studies.
FST has the following comments on the Traffic Impact & Study (TIAS) and site plan:

Ms. Monica R. Lamboy, Senior Associate, Edward J. Collins, Jr. Center for Public Management
Page 2
Memorandum March 25, 2013
PROJECT PROPOSAL
As currently proposed, the project is to consist of nine (9) residential buildings totaling 250
apartment units and a clubhouse building, an existing 50,000 SF building that will be divided
evenly between Town community space and Town office space and retail use in seven (7)
buildings totaling 349,000 SF. In summary, there will be a total of 720,000 SF. A total of 2,304
parking spaces are to be provided on-site. The primary site drive is to be signalized while the
secondary drive is to be right-in only.
FIELD RECONNAISSANCE
FST conducted a field reconnaissance on March 8, 2013 to observe traffic operations and
control, measure roadway geometry, note area land uses, signing and pedestrian amenities such
as crosswalks and sidewalks, record speed limits, lane configurations, measure sight lines, and
identify general traffic signal operations. Key observations in the study area are as follows:
The Assabet River Bridge is under construction on Waltham Street, west of Powder Mill
Road restricting traffic flow from Powder Mill Road to Acton Street;
Traffic Study Area
The Traffic Impact and Access Study (TIAS) included the following study area intersections in
including the site drives:
Parker Street (Route 27) /Vose Hill Road
Parker Street(Route 27) /Old Marlboro North
Parker Street(Route 27) /South Street/Northern Site Drive
Parker Street(Route 27) /North Street/Field Street
Parker Street(Route 27) /Great Road (Route 117)
Parker Street(Route 27) /Walnut Street
Parker Street(Route 27) /Waltham Street/Powder Mill Road (Route 62)
Great Road (Route 117)/Sudbury Street
Great Road (Route 117)/Main Street (Route 62)
In review of historical studies conducted of the site, the intersections of Waltham Street/Acton
Street (Route 27)/Summer Street (Route 62)/Main Street and Summer Street (Route 62)/Nason
Street are often included in analysis. Based on the current construction activity of the Waltham
Street bridge replacement project (project # 603658) over the Assabet River, it is clear why these
two locations were not included in the traffic count program. Traffic flows on Waltham Street
are affected by the reduction of four lanes (2 in each direction) to one lane in each direction.
However, the intersection of Parker Street/Waltham Street/Powder Mill Road (Route 62) was
included in the study area analysis, even though it is directly affected by the construction
activity. Thus the two a-fore mentioned locations should have been included in analysis using
data assembled from historical studies to assess future project impacts at these locations. In

Ms. Monica R. Lamboy, Senior Associate, Edward J. Collins, Jr. Center for Public Management
Page 3
Memorandum March 25, 2013
addition, it is unclear why locations to the east of Parker Street along Great Road were not
included in the study area to potentially quantify cut-through and residential mix traffic.
Adequacy of TIAS Information Provided
FST has determined that the TIAS follows standard traffic engineering guidelines for traffic
impact assessments, as outlined by the Executive Office of Energy and Environmental Affairs
and MassDOT.
Adequacy of Traffic Volume Data and Adjustments
Traffic Data
Manual turning movement counts (TMC) were performed at the study area intersections from
November 10-17, 2012. Monday November 12, 2012 was a Federal holiday (Veterans Day
observance). Weekday data was collected on the 15th
which is far enough away from the long
weekend however the Saturday data was collected on the 10th
, the Saturday of a long weekend.
Besides Federal offices being closed on Monday the 12th, municipal offices and public schools
were also closed that day. Given the long weekend, the Saturday data is suspect. For the
weekday, the peak hours were generally determined to be 7:15-8:15AM and 5:00-6:00PM and on
the Saturday counted, the peak hour was recorded to be 11:15AM – 12:15PM. To properly
assess Saturday peak conditions, an alternate Saturday should be chosen to collect accurate
Saturday mid-day period traffic counts.
Besides reviewing the ‘2012 existing’ traffic counts information, FST also reviewed historical
traffic data collected for a previous proposal at the 129 Parker Street site and the studies
conducted for the downtown locations. By comparing ‘existing’ PM peak period traffic data for
the three (3) key signalized intersections in the study area – Parker Street (Route 27)/Great Road
(Route 117), Parker Street (Route 27)/Waltham Street/Powder Mill Road (Route 62) and Great
Road (Route 117)/Main Street (Route 62), the 2006 data was determined to be 9% - 30% higher
than the recently-collected November 2012 data. An alternate analysis should have been
conducted using the higher, more-conservative volumes to evaluate project impacts in the study
area.
Seasonal Adjustment
Review of the TIAS indicates that five (5) MassDOT permanent traffic counts count stations
were reviewed to determine if November data required seasonal adjustments. The TIAS indicates
that no seasonal adjustments were made as “November volumes tended to be less than one
percent below average monthly conditions”. In addition to the five count stations noted, we also
reviewed data from count station # 403 on Route 2 in Concord and found November data to be
3% lower than the average month. Count station # 5 on Route 12 in Sterling (referenced in the
TIAS) was found to have November data that was 4% lower than the average month of the year.
Based on published seasonal adjustment factors by MassDOT for the six count stations, the
TMCs should have been increased by 1-4 percent to reflect an estimated average-month

Ms. Monica R. Lamboy, Senior Associate, Edward J. Collins, Jr. Center for Public Management
Page 4
Memorandum March 25, 2013
condition.
Adequacy of Speed, Sight Distance, and Accident Data
Vehicle Speeds
The TIAS indicated the speed limit along Parker Street (Route 27), Great Road (Route 117) and
Main Street is 35 mph. In the area of the schools along Great Road the posted speed limit is 20
mph. During field reconnaissance FST conducted a speed study along Parker Street and found
average speeds to be in the range of 35-38 mph.
Stopping sight distance
Stopping sight distance (SSD) is a measure of safety along roadways and intersections. It is
comprised of perception–reaction distance (the distance traveled while detecting an object in the
road and the distance traveled while breaking for an object (breaking distance). This SSD is a
function of the running speed of the roadway. The TIAS did not provide any data related to
stopping sight distance measurements. FST conducted a SSD assessment at the proposed site
driveways and found sight distance to be greater than 500 feet in both directions. Upon review of
the American Association of State Highway and Transportation Officials (AASHTO)1
requirements, which is adopted by MassDOT, the SSD requirement for 35 mph is 250 feet
therefore the SSD requirement satisfies federal and MassDOT safety standards.
Accidents
Accident data was also provided in the TIAS. FST reviewed the database and analysis and we
concur with the results and summary. There is one high accident locations in the immediate
study area, that being the Parker Street (Route 27)/Waltham Street/Powder Mill Road (Route 62)
intersection (1.53 MEV) which is above both the State-wide and District 3 average crash rate of
0.81 MEV (million entering vehicles) and 0.90 MEV, respectively. Over the years, this location
has consistently been a high accident location and mitigation should be provided to minimize
accidents. It should be noted that a recent downtown study showed only 12 accidents using
Police Department data for the years 2009-2011. Historically this location has been a high-
accident location.
Future No-Build Condition
The TIAS noted the projection of traffic volumes for a future 5-year horizon (2018), which was
developed by considering annual background traffic growth and a review of any site-specific
traffic generated by any background projects. It was indicated in the study the MassDOT data
base was reviewed and a slight increase of 0.4% annually was determined. The approach in the
study was to increase traffic for the first three year at 0.5% per year and 1.0% for the following
there years. While this growth is overly conservative, we concur with this methodology.
1 A Policy on Geometric Design of Highway and Streets; AASHTO; 2011

Ms. Monica R. Lamboy, Senior Associate, Edward J. Collins, Jr. Center for Public Management
Page 5
Memorandum March 25, 2013
Also reference is made four (4) substantive development projects located in Maynard, Concord,
Stow and Sudbury. It was indicted that projected traffic from these projects was added in the No-
Build condition. Review of the technical appendix shows no background networks for these
projects, which would allow us to check data. The background traffic networks of these four (4)
development projects should be submitted for future review and evaluation.
Adequacy of Vehicle Trip Generation/Distribution Assumptions
Trip Estimation
Based on Institute of Transportation Engineers (ITE) Trip Generation2, the standard reference
for estimating vehicle site trips, data was presented for the proposed use of the site for the
various components of the project. These include residential (Land Use Code 220), community
center (Land Use Code 495), office (Land Use Code 710) and shopping center (Land Use Code
850). FST concurs with this methodology. Vehicle trip data is summarized below in Table 1.
Table 1 – Total Estimated Site Activity*
Time Period In Out Total
Weekday 9,034 9,034 18,068
AM Peak Period 301 252 553
PM Peak Period 804 839 1,643
Saturday Mid-day 1,108 1,106 2.124
Saturday 11,051 11,051 22,102
*Trip Generation ; Institute of Transportation Engineers
In addition to generating project total trips, internal, diverted link and pass-by trips were also
calculated. Pass-by trips are vehicle trips that are already on the roadway network but are
attracted to the site. They are not new trips to the area. MassDOT guidelines for traffic impact
assessments and Draft Environmental Impact Reports (DEIR) limit a 25% pass-by rate. National
studies have shown these pass-by rates to be higher, depending upon the type of land use. Gas
stations/convenient stores can have rates as high as 75%. Retail projects are generally 25%-40%.
Thus the 25% rate used is very conservative. In addition the internal rates utilized are also
conservative. Thus FST concurs with the methodology and the calculations presented in the
TIAS.
Trip Distribution and Assignment
US journey-to-work data and existing traffic patterns were utilized to determine the direction of
trips arriving/departing the site. The journey-to-work data showed activity as far away as
Nashua, NH and as local as the adjoining towns. Different distribution patterns were utilized for
each land use and data is shown in Figure 11 in the TIAS. FST concurs with this methodology.
Assigning the trips to the site driveways was based on traffic patterns and the distribution of
2 Trip Generation; Institute of Transportation Engineers; 2011; 9th Edition.

Ms. Monica R. Lamboy, Senior Associate, Edward J. Collins, Jr. Center for Public Management
Page 6
Memorandum March 25, 2013
specific land uses within the site. Using the No Build network and the site-generated traffic
networks (partially located in the Appendix), Build traffic networks were created and shown in
Figures 12-14 in the TIAS for the AM, PM and Saturday mid-day periods. FST concurs with this
trip distribution and assignment methodology. A single composite total vehicle trip site traffic
network should have been included for each peak condition in the TIAS.
Traffic Operational Analysis
The TIAS included traffic operational analysis results for the study area intersections for the
2013 Existing, 2018 No-Build, and the 2018 Build conditions. Analysis was performed using the
methodology outlined in the Highway Capacity Manual.3 The 2010 edition is the most recent
version. Using this methodology is standard engineering practice for studies along with Synchro
modeling techniques. Traffic operations are graded by Levels of Service (LOS). LOS A involves
traffic operations with little delay, while LOS E-F conditions are associated with congestion and
poor operations.
Review of the TIAS indicates the Level of Service analysis results are shown in Tables 9-13.
Many of the unsignalized side streets operate at LOS F for the left turns exiting onto the major
street. The Field Street intersection with Parker Street will drop to LOS F in the Build condition
with the project as compared to the No Build. While some of the other unsignalized side streets
were not counted or included in the study area, it is expected that long delays will occur for the
turns out of the side street with the project. All signalized intersections operate at overall
acceptable Level of Service today. With the project, the Parker Street (Route 27) /Great Road
(Route 117) intersection and the Parker Street (Route 27) /Waltham Street/Powder Mill Road
(Route 62) intersection drop to an overall LOS E during the PM peak hour with the project.
Some movements at these locations will drop to LOS F with the project. Typically mitigation is
proposed when an intersection drops to an unacceptable Level of Service (LOS E or LOS F)
from No Build to Build.
PARKING SUPPLY
Review of the Concept Plan dated February 4, 2013 and February 5, 2013 shows 2,304 parking
spaces, which are assumed to include handicap spaces, although handicap spaces are not
identified. Upon further development of project site plans, the parking supply and parking layout
will be checked with conformance to Town zoning ordinances.
3 Highway Capacity Manual ; Transportation Research Board ;2010

Ms. Monica R. Lamboy, Senior Associate, Edward J. Collins, Jr. Center for Public Management
Page 7
Memorandum March 25, 2013
SITE PLAN REVIEW
Since the TIAS does not critique or comment in detail on the site plan other than minor
references to adjusting the primary internal intersection by shifting the entering left turn to the
second internal intersection operation and making provisions for transit vehicles, FST has
reviewed the site plan and make the following comments, some of which will need to be
reviewed in detail once the site plan is more finalized. On-site geometry will need to be checked
with a to-scale site plan. We concur the primary site drive should be signalized. At this time the
following is noted:
We question the need for a 5-lane cross section, including the raised median at the first
internal intersection. It appears this is over-designed. Also it is unclear if two entering
lanes are required at the primary Parker Street entrance as traffic will not be entering
from the north and south direction at the same time;
Discussion should be held with the Town emergency services department to review the
site plan. The project proponent should secure written documentation of the emergency
services department providing their preliminary approval of the site plan if approval has
not occurred already;
There are some traffic conflicts at the Jr. Anchor Building ‘D’ (14,000SF) and Pad ‘A’
(6,500SF) that should be resolved;
The loading/unloading zones for each building should be identified;
What is to prevent the right-turn in-only secondary drive from being used as an exit?
Traffic control (Stop line and Stop signs should be shown on the key internal site drive
intersections;
Sidewalks and crosswalks are not shown on the site plan, in particular at the residential
component of the project. Handicap ramps should be shown on any updated site plans
and be part of the approval conditions;
How are school children being served on the residential component of the project? Are a
school bus shelter and a bus stop being considered? This should be clarified;
A truck routing plan should be developed to assure tractor trailers can safely make
deliveries and negotiate the site and provide for easy access/egress. A full-scale plan will
allow corner radii and turns to be evaluated so that no encroachment occurs. The Auto-
Turn program© should be run on the site plan to assure that all trucks can safely
maneuver around the site;
It is assumed that trash pick-up will occur on-site particularly at the residential
component. If this is the case, it should be demonstrated that a single unit, trash-type
truck or design vehicle could safely negotiate the corner radii and no encroachment will
occur by the turning truck into the opposing lane; and
There are no snow storage areas shown on the site plan. It should be clarified how snow
removal is to occur.

Ms. Monica R. Lamboy, Senior Associate, Edward J. Collins, Jr. Center for Public Management
Page 8
Memorandum March 25, 2013
CONCEPT PLAN REVIEW
FST reviewed the concept plan provided for improved access/egress at the site driveways and
offer the following comments:
We concur that signalization is warranted at the primary site drive. An additional
crosswalk should be considered south of the site drive, across Parker Street at the
proposed signal;
Improved geometrics should be provided at the secondary site drive to assure right turn
in-only activity occurs. Current design will not prohibit right-out or left-in activity;
All crosswalks should have ADA wheel chair ramps with detectable warning panels;
Narrower turn and travel lanes should be considered on Parker Street and the site
driveway. The current cross section is excessive;
With only 50 foot right-of-way (ROW) available, it is unclear how the number of travel
lanes and sidewalks will fit within the ROW without land acquisition. Clarification is
required;
Detailed geometric changes should be clearly depicted for Old Marlboro Road and other
locations where geometric changes are proposed;
It is unclear what type of traffic control exists for B Street, South Street and North Street;
MITIGATION
Mitigation measures (on-site and off-site) are included in the TIAS. Discussion with the
proponent’s traffic engineer indicted these are committed mitigation by the proponent. These
measures listed include:
Site Access/Internal Circulation Actions
Signalization of and lane additions at the primary site drive. A concept plan was provided
of this improvement;
Use of the secondary site drive to right-in only. A concept plan was provided of this
improvement;
New ADA compliant sidewalk on the west side of Parker Street from the primary site
drive to Great Road;
Placing bike racks on-site; and
Create a bicycle/pedestrian connection to the high school/ball fields.
Off-Site Actions
Increase the length of left turn lanes at Parker Street/Great Road;
Install guide signage;
Ensure optimum signal timing at Parker/Powder Mill/Waltham;
Install an ADA compliant sidewalk on the east side of Parker Street from Old Marlboro
Road to North Street or contribute to the sidewalk fund for this project;
A pedestrian crossing beacon is recommended for Parker Street at Field Street;
Join the local Transportation Management Association (TMA); and

Ms. Monica R. Lamboy, Senior Associate, Edward J. Collins, Jr. Center for Public Management
Page 9
Memorandum March 25, 2013
Monitor traffic in the neighborhood east of the project site.
CONCLUSION
Based on our review of the TIAS, FST has determined that the study was undertaken according
to standard traffic engineering practices and State guidelines. However, there is some additional
information and data that should be required to supplement this submission if the project moves
forward to accurately assess the impacts of this project and supply detailed information to the
Town. The following is noted:
Along with the mitigation by the project proponent, the following should be addressed:
The intersections of Waltham Street/Acton Street (Route 27)/Summer Street (Route
62)/Main Street and Summer Street (Route 62)/Nason Street should be included in the
study area analysis;
Locations east of Parker Street should be included in the study area analysis to quantify
cut-through and residential traffic;
Saturday mid-day traffic should be re-collected on a typical Saturday;
Conduct an alternate traffic analysis with the historical higher traffic data to determine if
this higher-more conservative data should have been utilized in the traffic analysis;
The November traffic data should have been adjusted by 1-4% to reflect average month
conditions;
The TIAS did not provide any data related to stopping sight distance and SSD
measurements. FST conducted a SSD assessment at the proposed site driveways and
found sight distance greater than 500 feet in both directions therefore sightlines are
adequate. No further action is required;
The background traffic networks of the four (4) development projects noted should be
submitted for future review and evaluation;
A single vehicle trip site traffic network should be included for each peak condition in the
TIAS;
Re-evaluate the need for a 5-lane cross section, including the raised median at the first
internal intersection of the site;
Discussion should be held with the Town emergency services department to review the
site plan;
Resolve the traffic conflicts at the Jr. Anchor Building ‘D’ and Pad ‘A’;
The loading/unloading zones for each building should be identified;
Determine how to regulate the right-turn in only secondary drive from being used as an
exit;
Traffic control (Stop line and Stop signs) should be shown on the key internal site drive
intersections;
Sidewalks and selected crosswalks are not shown on the site plan, in particular at the
residential component of the project. Handicap ramps should be shown on any updated
site plan and be part of the approval conditions of the site plan;
Identify how school children are being served on the residential component of the
project;

Ms. Monica R. Lamboy, Senior Associate, Edward J. Collins, Jr. Center for Public Management
Page 10
Memorandum March 25, 2013
A truck routing plan should be developed to assure tractor trailers can safely make
deliveries and negotiate the site and provide for easy access/egress;
Demonstrate that a single unit, trash-type truck or design vehicle could safely negotiate
the corner radii and no encroachment into the opposing lane;
Determine how trash pick-up will occur at the residential component of the site; and
Determine if snow storage areas are to be identified and how removal is to be handled.
ADDITIONAL MITIGATION RECOMMENDED
It is likely The Shoppes at Maynard Crossing will be constructed in phases. Therefore a phased
mitigation plan should be developed to support each constructed phase. This should be outlined
in a developer’s agreement with the Town. Whatever improvements are made in the area, they
should be developed as a Complete Street, i.e. a facility that accommodates all users. In addition
to providing clarification to the proponent’s mitigation noted in the TIAS and referenced above,
the following additional mitigation is recommended:
A shuttle should be considered between the site and nearby MBTA commuter rail lines.
Coordination should occur with the proponents of Clock Tower Place to provide an
efficient system within the Town and outline steps to involvement with a Transportation
Management Association and provide a system;
The project proponent should conduct a detailed feasibility study of the
pedestrian/bicycle connection referenced from the site so that it ultimately may connect
to the Assabet River Rail Trail and other locations;
Develop concept plans for the intersections of Parker Street with Great Road, North
Street/Field Street, South Street and Old Marlboro Road;
Upgrade the traffic signal system at Parker Street/Powdermill Road/Waltham Street and
coordinate the signal with the Main Street/Acton Street/Summer Street signal. A concept
plan should be presented showing project limits and proposed improvements. This
upgrade should be coordinated with previous proposed improvements and be required of
the project proponent;
Upgrade the traffic signal at Main Street/Acton Street/Summer Street and coordinate the
signal with the Parker Street/Powdermill Road/Waltham Street signal. A concept plan
should be presented showing project limits and proposed improvements. This upgrade
should be coordinated with previous proposed improvements and be required of the
project proponent;
At Great Road/Main Street, modify the signal timing and install a red left-turn arrow and
a green right-turn arrow for turns from Main Street onto Great Road. A concept plan
should be presented showing project limits and proposed improvements. This upgrade
should be coordinated with previous proposed improvements and be required of the
project proponent;
At Nason Street/Summer Street, replace the existing pedestrian signal heads with
countdown pedestrian signals and install a protected left turn arrow facing the westbound
Summer Street approach. A concept plan should be presented showing project limits and
proposed improvements. This upgrade should be coordinated with previous proposed
improvements and be required of the project proponent;

Ms. Monica R. Lamboy, Senior Associate, Edward J. Collins, Jr. Center for Public Management
Page 11
Memorandum March 25, 2013
For all signalized locations noted above, install emergency pre-emption equipment
(Opticom) to facilitate emergency response times;
To establish a base ‘existing condition’, conduct a neighborhood traffic study during the
peak periods for the intersections to the east of Parker Street and along Great Road to
quantify cut through traffic. Locations may include Marlboro Street/Old Marlboro Road,
Great Road/ Old Marlboro Road and Parker Street/ Old Marlboro Road as well as
intersections along Parker Street. Following one year after key phases are occupied,
conduct an ‘after’ study to assess the likely impacts to the surrounding neighborhoods of
the project. Measures may include geometric improvements and/or traffic calming
measures, pavement markings, directional changes, signing and minor geometric
modifications to make the intersections safe for all users, i.e. a Complete Street. A
concept plan should be presented showing project limits and proposed improvements at
all locations. This overall plan is identified as a traffic monitoring study. The study
should be presented to the Town and its consultant for review. As the project progress to
the approval, details of the plan can be identified.
In summary the TIAS was generally conducted following industry and State guidelines for traffic
impact assessments. Some supplemental materials are requested for follow-on review. The
estimated vehicle trip data presented in the TIAS utilized standard Institute of Transportation
Engineer’s estimates and we concur that the overall estimating procedures may be somewhat
conservative.
Our assessment of the existing, No Build (without the project) and Build (with the project) analysis
conditions indicates the roadway infrastructure network can support the project, provided that
phased mitigation is in place for each phased development component prior to project opening. If
mitigation is not in place, the roadway and intersection cannot support the development. A
memorandum of understanding should be created between the developer and the Town noting key
milestones, mitigation timeline, and extent of mitigation and schedule of completion as well as
maintenance responsibilities.
T:\PM-077-Maynard\Documents\Trfc Review Memo2.doc

Review of Proposed Zoning Bylaw Amendment & Concept Plan for March 25, 2013
129 Parker Street, Maynard, MA Page 44
THIS PAGE IS INTENTIONALLY BLANK

Review of Proposed Zoning Bylaw Amendment & Concept Plan for March 25, 2013
129 Parker Street, Maynard, MA Page 45
REVIEW AND RECOMMENDATIONS
During consideration of a typical permit application before a board, such as a planning board or a zoning board of appeals, the review will: (1) evaluate the potential impacts of a proposed project (positive and negative) and associated mitigation; and (2) ascertain compliance (or non-compliance) with applicable Laws or ordinances, such as a zoning bylaw. In the case of 129 Parker Street, however, the applicant is not only asking for approval of a concept plan for a specific project, Capital Group Properties is requesting amendment of the zoning bylaw that would otherwise be used to evaluate the concept plan at the same time. Another way to say this is that a measurement tool is being changed at the same time it is being used to measure something. As a result, there are two overarching questions to be asked and answered by the Maynard community:
1) Should the Zoning Bylaw be amended, as proposed by the applicant; and, 2) If the answer to question #1 above is affirmative, then should the Concept Plan, as proposed, be approved?

Review of Proposed Zoning Bylaw Amendment & Concept Plan for March 25, 2013
129 Parker Street, Maynard, MA Page 46
Consideration of Proposed Amendments to Zoning Bylaw A zoning bylaw is one tool to help a community’s vision become a reality, but it is not the only one. Plans and policy documents will break down a vision into smaller components such as goals and actions and lay out a strategy for achieving the vision. In partnership with other policies and plans, a zoning bylaw will define, in specific terms, what a particular property can be used for, what it should look like, and how approval can be secured.
Existing Policy Framework Perhaps the best way to start considering the merits of the proposed bylaw amendment is to reflect on the vision and policies that are already in place in Maynard. Several adopted documents paint a picture of the town’s vision of its future. A few of the provisions of those documents that relate to the proposed project are listed below. However, each document contains many more policies and actions than can be listed here. Maynard Master Plan (1991-2006)
Promote the acquisition of land adjacent to or part of existing resource areas to create continuous protected greenbelt zones (Policy, p. 2-7);
Encourage economic activities which have a net financial benefit (tax revenue and employment) to the town without adverse environmental or other impacts (Goal, p. 2-11);
Continue to improve the function and appearance of the town center so that its net tax benefit will increase. Encourage limited other industrial or commercial activities on current sites which are not labor intensive and will contribute to the tax base of the community. Recognize that limited amounts of high density housing will provide net tax income to the town. (Policies 1-3, p. 2-11); and,
Digital’s Parker Street Parcelty (sic) – Digital’s Parker Street Facility parcel abuts the High School and Green Meadow School, and is adjacent to Wells #3 and #4. The guideplan indicates that the western portion of this parcel should be reserved for passive recreation uses. (Narrative, p. 4-5).
Open Space & Recreation Plan (2004)
Develop or redevelop land that is already developed to maintain Maynard’s characteristically walkable downtown and residential neighborhoods (Objective 2-C).
Community Preservation Act (Interim Draft June 2007)
Create new, and preserve existing, community housing that is well designed and maintained, is of high quality, and is based on sound planning principles (Community Housing goal, page 28 of 37); and,
Create new and preserve existing community housing that will contribute to the State’s mandated target of having 10% of the Town’s housing stock affordable to households with incomes at or below 80% of the area’s median income (Community Housing goal, page 28 of 37).

Review of Proposed Zoning Bylaw Amendment & Concept Plan for March 25, 2013
129 Parker Street, Maynard, MA Page 47
Community Development Principles19 In 2009, the Board of Selectmen adopted a series of community development principles to implement a shared vision for the community. Those principles include:
1. Concentrate Development and Integrate Uses 2. Protect the Village Character of Downtown Maynard 3. Redevelop and Re-use 4. Use Natural Resources Wisely 5. Expand Housing Opportunities 6. Provide a Variety of Transportation Choices 7. Respect Cultural and Historic Resources 8. Protect Land and Ecosystems 9. Make Effective Decisions 10. Manage Infrastructure Effectively
Questions for Discussion The Collins Center has identified at least three broad policy questions to be asked and answered by the Maynard community as it contemplates amending the NBOD zoning applied to 129 Parker Street. 1. Should the site located at 129 Parker Street contain a mix of uses that are largely local-serving or
largely regional-serving? As currently crafted, it appears that the existing NBOD is designed to facilitate the creation of a commercial center that allows for a mix of uses that would be largely local serving in nature, although not exclusively. This perception is created by:
the purpose of the district, which uses terms such as “neighborhood,” “mixed-use,” “variety of building types”;
the gross floor area maximums that are established by use;
the fact that the single largest use is a supermarket at 75,000 square feet. (It should be noted that a market of that size is a substantial operation that would draw shoppers from around the area, although it would not be as large as a “Super Stop and Shop.” According to the Food Marketing Institute, the median grocery store in the U.S. in 2010 was 46,000 square feet in size20); and,
the overall limitation on commercial development of 175,000 square feet, including the allowed supermarket.
Based upon the methodology of the Stantec Fiscal Impact Study, the 175,000 square feet of retail and supermarket authorized by the NBOD would require a market area of that is smaller than that which would be required under the proposed bylaw amendment and concept plan. Using a 10% “capture rate” (i.e., the percentage of retail sales per household that would be spent, or “captured”, at the site), a population of 54,400 would be needed. (According to the Nielsen Company, the residential population within a one mile radius of the intersection of Parker Street and Great Road is 7,378 persons, within five
19
Maynard Community Development Principles (http://www.townofmaynard-ma.gov/resources/cdp/ retrieved March 20, 2013) 20
Food Management Institute (http://www.fmi.org/research-resources/supermarket-facts retrieved March 20, 2013)

Review of Proposed Zoning Bylaw Amendment & Concept Plan for March 25, 2013
129 Parker Street, Maynard, MA Page 48
miles is 67,383 persons, and within 10 miles is 277,354.21) A 5% capture rate would be 108,800 persons.
EXPENDITURE AT $SF/STORE TYPE (NBOD ZONING) (Table 5)
$/SF SF
Expenditure Needed
Supermarket 62122 75,000 46,575,000
Garden Center 225 25,000 5,625,000
Other 300 75,000 22,500,000
175,000 74,700,000
General population needed to support remaining retail at capture ratio
10% 54,397
5% 108,794
It should be noted that if a 60,900 square foot grocery were built, as proposed in 2006, and the equivalent square footage was converted to other types of retail, the population needed to support it would be reduced by 3,300 to 6,600 persons, depending on the capture rate used. As noted in the Stantec Fiscal Impact Study, the proposed Bylaw amendment and associated Concept Plan will require a customer base of between approximately 90,000 and 181,400 persons, a population area that extends between 5 and 10 miles of the intersection of Parker Street and Great Road. The proposed bylaw amendment primarily facilitates the shift to a regional orientation by:
a. eliminating the size thresholds currently established by single-use and replacing them with square foot maximums by building;
b. allowing for a potentially single-use structure of 152,000 square feet and a second potentially single-use structure of 117,000 square feet; and,
c. increasing the maximum allowable square footage of non-residential/non-health/non-municipal uses on the site from 175,000 square feet to 349,000 square feet.
2. What should the relationship be between Maynard’s existing downtown and the future
commercial center on Parker Street, either as anticipated in the existing NBOD or in the amended NBOD?
Given the size of the site, whatever is built at 129 Parker Street will have an impact on its surroundings, including the immediate residential neighborhoods and the downtown. In using the word “impact,” this does not inherently suggest that something negative will occur, but rather that a change will take place and that change will have ripples that extend beyond the property’s borders. No one can offer a definitive statement of how the downtown will be affected by development at 129 Parker Street, as studies that have evaluated the impacts of large format retail upon existing commercial districts make different findings and, how businesspersons and residents react – or do not react – to the
21
The Nielsen Company, Household Trend 2013, p. 1, 3, and 5, prepared February 6, 2013. 22
At $621 per square feet, the grocery store size has a significant influence on the size of the needed customer base.
Review of Proposed Zoning Bylaw Amendment & Concept Plan for March 25, 2013
129 Parker Street, Maynard, MA Page 49
introduction of large format retail makes a difference in the outcome. One of the most comprehensive studies on the topic prepared at the University of Nebraska, Lincoln, which categorized and summarized the findings of many other studies, offers four practical strategies for local businesses striving to compete with large format retailers:
a. Focus on service: provide service with a smile, know your customers; offer customers something the large retail cannot – such as workshops, expedient check outs, or classes;
b. Improve merchandising: carry what the large retail does not; focus on a narrow range of products; offer longer hours of operation, stay open on weekends; form a coalition of businesses to compete against the large retail, perhaps by forming buying cooperatives, purchasing group insurance, etc.;
c. Engage in marketing: market the business, especially through improved pricing and promotions, understand the local business climate (including patterns of foot traffic); lower prices on competitive items and raise them on niche items; and,
d. Use information to strategize - understand the industry and current trends; use inventory and business tracking to determine what sells23.
Perhaps the greatest cautionary note to be found in the University of Nebraska study was that the most common response of existing retailers to the introduction of large format retail was to “do nothing” - a strategy that was not found to be successful. It is possible that some of the lessons learned at the retailer level could also be applied to the entire downtown district and incorporated into an economic development strategy. Actions that have been successful in creating successful commercial districts include:
Develop a comprehensive vision and economic development plan for the district that is shared by residents and businesspersons;
Determine the district’s niche within the commercial market;
Engage in marketing and special events to bring people to the area;
Make physical upgrades to public infrastructure and private buildings to make the area attractive, comfortable, and safe;
Organize and engage the public; and,
Develop physical and marketing connections between locations that draw shoppers/visitors to a community to encourage them explore areas they are not yet familiar with.
Begun in 1980, the National Main Street Center, a program of the National Trust for Historic Preservation, has developed and implemented strategies to strengthen historic downtowns and commercial districts that could be helpful as Maynard engages in this discussion. A considerable amount of information can be found on their website. 3. What types of land use authorities should rest with the Planning Board? What types of land use
controls should be held by Town Meeting?
23 Sean Golden, Noel Jeutang, et al., Univ of Nebraska – Lincoln; “Big Box Stores: Their Impacts on the
Economy and Tips for Competing”, Bureau of Business Research Publications; June, 2006, p. 25-31.

Review of Proposed Zoning Bylaw Amendment & Concept Plan for March 25, 2013
129 Parker Street, Maynard, MA Page 50
Under the existing NBOD, participants at Town Meeting and members of the Planning Board have significant responsibilities. Town Meeting members are charged with evaluating the Concept Plan, including: the location, size, and shape of structures, the approximate size of each proposed principal use (with the final size to be determined during the site plan process); the general location and size of all required buffer areas; the general architectural design; the amenities and design features; the preliminary traffic analysis; and determining if the concept plan should be approved. Presently, the Planning Board is responsible for undertaking site plan review and issuing approval if the plan substantially conforms to the concept plan approved at Town Meeting. During site plan review, the Board would: determine compliance with dimensional requirements such as height and setbacks; review parking and open space requirements; evaluate the design relative to the concept plan and design criteria; review additional technical studies; and determine if the proposed mitigation package addresses the potential impacts of the project. In Massachusetts, Site Plan Approval is not considered a discretionary permit, i.e., it must eventually be approved so long as the plan complies with applicable regulations, including the concept plan in the case of the Maynard NBOD District. Under the current zoning, the Planning Board also has special permit authority over three specific uses: multi-family dwelling, parking structures, and mixed use with five or more dwelling units. Unlike site plans, special permits are discretionary and can be denied. As proposed in the amended NBOD, the mix and size of principal commercial uses would no longer be subject to review and approval by Town Meeting. At the same time, the list of principal uses would be expanded and the gross square foot maximums by principal use would be eliminated. (Maximums would remain in place for municipal use and housing.) The mix of commercial uses on site would therefore not be part of the site plan review performed by the Planning Board. Further, the by right uses included in the underlying Industrial District, such as self-storage and light manufacturing, would continue to be allowed by right, in addition to the Motor Vehicle Light Service, which is proposed in the amended NBOD. Over time, the developer would have the authority to shift the uses on the property significantly and, without a special permit approval process, the Town would have no authority to regulate this shift. Additionally, the Planning Board would no longer have discretionary authority over multi-family housing and would only have site plan authority. This means that once the total number of units and the building footprints were established as part of the Concept Plan, the Planning Board would not be able assess/influence the mix of unit sizes or their design. In contrast to the diminution of Planning Board authority described above, the developer is proposing to increase the Planning Board’s authority by making it a signatory to the development agreement, along with the Board of Selectmen. The proposed zoning also allows the Planning Board to increase the square footage of the principal uses by 5% without going to Town Meeting via special permit, allows the Board of Selectmen to increase the number of units by 5% via special permit, and indicates that 15% of the square footage by “use” can be shifted between buildings/uses without permit. Each of these actions would otherwise require an amended Concept Plan, unless the Planning Board could find that the site plan substantially conformed to the concept plan.
Comments / Recommendations
Review of Proposed Zoning Bylaw Amendment & Concept Plan for March 25, 2013
129 Parker Street, Maynard, MA Page 51
In addition to posing the three broad policy questions for consideration by the Maynard community, the Center would like to offer several technical comments about the proposed amendment to the Zoning Bylaw, which can be found in Appendix A.
Consideration of Proposed Concept Plan
As noted above, a review of a typical concept plan would include a comparison of the proposed plan to the applicable zoning. Since, in the case of 129 Parker Street, the zoning is being proposed for amendment at the same time, in addition to considering how the Town’s various existing plans and policies could be applied, one could also consider generally accepted planning principles and best practices as measures to use in evaluating the site plan.
Planning Principle / Best Practices
Two of the foremost organizations promoting sustainable, quality design are the U.S. Green Building Council (USGBC) and the Congress for New Urbanism. The USGBC, most commonly known for its LEED (Leadership in Energy and Environmental Design) rating system that applies to new building construction, was founded in 1993. The checklists and scoring systems developed by USGBC have been used for years to give buildings ratings of “silver,” “gold,” and “platinum,” based upon how well a building’s design and construction has minimized its impact on the environment, i.e., how “green” a building is. According to their website, “LEED is certifying 1.6 million square feet of building space each day in more than 130 countries.”24 The membership organization has expanded beyond individual building design into other areas, including the design of neighborhoods and has developed a rating system called LEED-ND. The USGBC has published A Citizen’s Guide to LEED for Neighborhood Development: How to Tell if Development is Smart and Green that offers a framework that can be used to evaluate a neighborhood or a development:
Smart location and Linkage: Where to build o Smart locations o Design with nature o Connected neighborhoods o Public transit
Neighborhood pattern and design: What to build o Neighborhoods that use land efficiently o Diverse and convenient neighborhoods o Walkable streets o Reduced parking and transportation demands o Bicycle-friendly design o Mixed uses and community space
Green infrastructure and buildings: How to manage environmental impacts o Green buildings
24
U.S. Green Building Council, About U.S Green Building Council (http://new.usgbc.org/about accessed March 21, 2013)

Review of Proposed Zoning Bylaw Amendment & Concept Plan for March 25, 2013
129 Parker Street, Maynard, MA Page 52
o Reusing older buildings o Reducing pollution o Keeping things cool o Neighborhood-wide energy
The Congress for New Urbanism (CNC), a membership organization which was also started in 1993, includes among its charter mission the “restoration of existing urban centers and towns.” Although the name of the organization includes the term “urbanism,” its work addresses more than city environments. In the organization’s own words, “New Urbanism recognizes walkable, human-scaled neighborhoods as the building blocks of sustainable communities and regions.” The CNC has established 27 principles to “guild public policy, development practice, urban planning, and design,” including among them the following:
6) The development and redevelopment of towns and cities should respect historical patterns, precedents, and boundaries. 7) Cities and towns should bring into proximity a broad spectrum of public and private uses to support a regional economy that benefits people of all incomes. Affordable housing should be distributed throughout the region to match job opportunities and to avoid concentrations of poverty. 11) Neighborhoods should be compact, pedestrian friendly, and mixed-use. 12) Many activities of daily living should occur within walking distance, allowing independence to those who do not drive, especially the elderly and the young. Interconnected networks of streets should be designed to encourage walking, reduce the number and length of automobile trips, and conserve energy 13) Within neighborhoods, a broad range of housing types and price levels can bring people of diverse ages, races, and incomes into daily interaction, strengthening the personal and civic bonds essential to an authentic community. 19) A primary task of all urban architecture and landscape design is the physical definition of streets and public spaces as places of shared use. 22) In the contemporary metropolis, development must adequately accommodate automobiles. It should do so in ways that respect the pedestrian and the form of public space. 25
Review of Concept Plan
The foundation for the LEED-ND and the Congress of New Urbanism principles is the efficient utilization of resources and the creation of places in which to live, work, and spend time that are safe, healthy, and enjoyable. Many developers across the country are embracing these precepts. The Center has blended together the various principles from both organizations into five areas of evaluation: efficient use of land; accommodations for multiple modes of transportation; range of housing types; sustainability/“green” design; and, designing with nature. Efficient Land Use The Center finds the use of land in the proposed Concept Plan to be inefficient. With a floor area ratio of less than .30 and 53.89 acres of land, considerable land area exists to provide for the developable
25
Center for New Urbanism, Charter, http://www.cnu.org/sites/www.cnu.org/files/charter_english1.pdf accessed March 21, 2013)

Review of Proposed Zoning Bylaw Amendment & Concept Plan for March 25, 2013
129 Parker Street, Maynard, MA Page 53
space desired by the developer26 while meeting the setback and buffer requirements of the existing NBOD zoning at the same time. (A floor area ratio is derived by dividing the square footage of building by the square footage of land and is used to show the intensity of use. For example, if the floor area ratio were 1, a property that was 10,000 square foot in size would have a 10,000 square foot of building on it. At 129 Parker Street, the calculation of floor area ratio is 724,000 square feet of building/2,543,468 square feet of land.) Design components that contribute to the less than efficient use of land include:
1. Parking
The developer is proposing to build 401 parking spaces in excess of what the zoning bylaw amendment the developer is proposing would require. According to the parking ratios proposed by developer, only 1,465 parking spaces are required for the commercial and municipal uses, even if it is assumed that Pads A-C are used for restaurant uses, yet 1,802 spaces are shown on the Concept Plan. In addition, only 438 spaces are required for the housing units, yet 502 spaces are shown.
COMPARISON OF PROPOSED AND REQUIRED PARKING (Table 6)
NON-RESIDENTIAL PARKING Area (s.f.)
Parking Ratio
Spaces Required
Spaces Provided
Excess Spaces
Municipal 50,000 1/300 s.f. 167
Retail, office, and other commercial (Anchors A-D) 333,000
1/300 s.f. 1,110
Food (Pads A-C) 16,000 1/85 s.f. 188 188
399,000 1,465 1,802 337
RESIDENTIAL PARKING Units
Parking Ratio
Spaces Required
Spaces Provided
Excess Spaces
Multi-family housing 250 1.75/unit 438 502 64
TOTAL 401
These excess spaces have significant implications for the use of land and cost of the project. Specifically, 1.39 acres of land area is being used just for parking spaces that are not required. This is calculated by applying the allowable ratios of regular and compact spaces, plus the dimensions of the spaces themselves. It should be noted that this land area calculation does not include the square footage that will no longer be needed for the driving lanes associated with these spaces, which will generate additional space savings.
26
The Center is not saying that the square footage desired by the developer should be allowed, as that is decision for Town Meeting, but rather that the site is large enough for the desired buildable space to fit.

Review of Proposed Zoning Bylaw Amendment & Concept Plan for March 25, 2013
129 Parker Street, Maynard, MA Page 54
CALCULATION OF LAND AREA LOST TO PARKING (Table 7)
Dimensions
Area per Space (s.f.) Number
Land Area (s.f)
Regular (60%) 9' x 18.5' 166.5 241 40,060
Compact (40%) 8.5' x 15' 127.5 160 20,451
Total 401 60,511
1.39 acres
Multiple sources place the cost of providing surface parking at between $3,500 and $5,000 per space. Using the mid-point of $4,250, the cost of providing these excess spaces is $1,704,000.
2. Surface level storm water retention
The developer is proposing to keep the existing surface level retention pond, but bifurcate it with an interior access drive. With dimensions of approximately 150 feet by 850 feet, the existing pond takes up 127,500 square feet of land area or nearly three acres (2.93 acres). This space could be used for other purposes if the storm water runoff was held in an underground cistern instead, as is done at Legacy Place in Dedham. Below-ground water retention would have an added benefit in that the water that was collected could be used to water on-site landscaping, instead of using potable water for this purpose. This would reduce water costs, reduce the cost of maintaining the ponds – including mowing and litter removal, reduce the cost of ensuring that no accidents or injuries happen in the ponds, provide the site with a guaranteed non-potable water source when the town engages in voluntary water rationing during the summer, and increase the sustainability rating of the site.27
3. Lack of vertically-mixed uses
Although not required under the NBOD zoning, considerable land area could be saved if all or some of the housing or parking was built above the retail. Vertically integrated mixed-use is the historic form found in many cities and towns in New England, including Maynard, and is a design type that even some larger format retailers are recognizing will work with their operations (examples include Whole Foods and Safeway grocery stores with parking or housing above). Vertically-mixed development would increase the efficient use of land, increase the sustainability of the project, and contribute to creation of a walkable community on the site.
27
Another option would be to build a state-of-the-art water filtration system that would allow the water to flow back into the wetlands after being filtered through natural material such as sand or gravel. Before making a final decision on this issue, the developer should determine whether the retention ponds meet current standards as they were built several decades ago.

Review of Proposed Zoning Bylaw Amendment & Concept Plan for March 25, 2013
129 Parker Street, Maynard, MA Page 55
Accommodations for multiple modes of transportation The concept plan, as proposed, addresses the needs of the automobile, as can be seen in the extensive fields of parking, access roads and asphalt. Because the proposed buildings are placed so far apart from each other, the potential for visitors or residents to walk between the different buildings seems limited and vehicles may be driven between the different uses on site. For example, the distance between entrances to Anchor A and Anchor B is approximately 800 feet; the distance between Jr. Anchor D and the first residential building is approximately 1,200 feet “as the crow flies” (not actual walking distance); and the distance between the proposed municipal building and Pad A or Pad B, where the closest restaurant is likely to be located, is around 1,000 – 1,200 feet. These significant distances are in contrast to the 2006 proposal which, although it had large fields of parking, did locate several of its buildings in proximity to each other and also planned to have multiple smaller scale uses in a single building. Given that studies have shown that people will walk longer and farther in an attractive environment, it would seem that retailers would benefit from walkability as a shopper who only intended to visit one store might instead find himself walking to another store and then another. Accommodations for pedestrians, cyclists, and transit riders are not as robust. FST notes in its traffic peer review that sidewalks and crosswalks are not shown on the concept plan. While these can be added, there actually appears to be an absence of space in which to place sidewalks along the central access drive – at least on the north side of the drive. This exacerbates concerns relative to future residents’ ability to reasonably walk out of their homes to visit other parts of Maynard. By placing the housing at the very far back corner of the site, residents will be isolated from Parker Street and
other neighborhoods. At night, the return home walking along the retention ponds and unoccupied buildings, and through the empty fields of parking may feel uncomfortable or even unsafe. In addition, if a path to the high school is to be provided as was indicated at the Planning Board hearing, it is likely that students and other residents will need to cross the site on foot and on bicycle. Attention should be paid to how they can safely to access the path. Although transit service is not currently available in Maynard, FST recommends that the developer join the local Transportation Management Association. Range of Housing Types Having a diverse mix of housing types in a community has been seen as a means to support population diversity – whether this be diversity in age, income, or household size. Maynard’s housing stock today contains considerable variety in the number of bedrooms per unit, the year built, whether units are
Source: Capital Group Properties concept plan application

Review of Proposed Zoning Bylaw Amendment & Concept Plan for March 25, 2013
129 Parker Street, Maynard, MA Page 56
detached or attached, and the cost per unit. An unscientific review of current rental listings shows a range of rental cost in Maynard including:
2 bedroom apartment - $1,100 per month
3 bedroom detached home - $1,100 per month
4 bedroom detached home - $1,900- $3,625 per month Maynard’s rather affordable rents contrast with the higher rents paid in more centrally located communities in the Boston metro region such as in Arlington:
1 bedroom apartment - $1,100 - $1,650 per month
2 bedroom apartment - $1,450 - $2,840 per month
3 bedroom apartment - $3,000+ per month28 As housing pressures in the Boston metro area continue to rise, renters and buyers are looking beyond their immediate surroundings to find a home that is affordable to their household. A significant contributor to the high cost of housing in Massachusetts is the failure to build enough inventory to meet demand. In fact, in recent months Governor Patrick has established a state-wide goal to build 10,000 new multi-family units each year in order to attempt to meet demand.29 The Governor recognizes that there are economic development arguments for ensuring housing affordability – employees are attracted to Massachusetts because of the high education and skill levels of our residents, but if residents cannot find housing that works for them, they may move elsewhere, or labor costs in the state may grow beyond what employers are willing to pay, so they will look elsewhere. The developer has proposed building 250 units between one bedroom and two bedroom plus den in size – units which will help the Commonwealth meet Governor Patrick’s goal. However, neither the proposed bylaw amendment nor the concept plan identify, in writing, the range of size of the units, nor the actual mix of units that will be built. As noted above, if multi-family housing becomes a by right use, as is proposed by the developer, no special permit will be required, and the Planning Board will not have the ability to influence the mix of different unit types and sizes on the site. Another aspect of maintaining housing diversity is the need for permanently affordable housing units and, at present, the proposed project at 129 Parker Street does not include an affordable component. Absent a commitment to having a portion of units permanently affordable, rents can increase rapidly from the $1,200 to $1,800 per month testified to by the developer at the Planning Board hearing. It should be mentioned that “affordability” thresholds in Massachusetts are quite high – a family of four earning $64,400 or less is considered “low income” while a similarly-sized family that earns $45,900 a year is considered “very low.” Households paying 1/3 of their income for rent would pay between $1,262 (very low income) and $1,771 per month (low income).
Boston.com, realestate rentals, (http://www.boston.com/realestate/renting/?p1=GNRO_RE_Rent retrieved March 22 and March 24, 2013). 29 MA DEPARTMENT OF HOUSING AND ECONOMIC DEVELOPMENT, “GOVERNOR PATRICK OUTLINES INITIATIVES DESIGNED TO INCREASE
HOUSING IN MASSACHUSETTS, SETS STATEWIDE GOAL OF 10,000 NEW MULTI-FAMILY UNITS PER YEAR”
(HTTP://WWW.MASS.GOV/HED/ECONOMIC/EOHED/DHCD/STATEWIDE-GOAL-OF-10K-NEW-MULTI-FAMILY-UNITS-PER-YEAR.HTML
ACCESSED MARCH 22, 2013)

Review of Proposed Zoning Bylaw Amendment & Concept Plan for March 25, 2013
129 Parker Street, Maynard, MA Page 57
By not requiring at least 10% of units to be affordable, 25 households will not have an opportunity to secure affordable rents, and the Town will move farther away the number of units it needs to meet the 10% 40B threshold. Additional concern exists relative to the proposed location of housing on the site. As mentioned above, by locating the housing so far back on the site, it is unlikely that the residents will venture out of the immediate area on foot or bicycle – as evidenced by the parking spaces surrounding the residential structures. Additionally, the housing is located close to the loading docks of Anchor A and the proposed landscape buffer is not particularly substantial. Further, because the area is hidden behind Anchor A, police will not be able to readily see into the neighborhood from a public way. Sustainability/“Green” Design Although the developer indicated at the Planning Board hearing that they would use low flow water features, there is no description of green design practices in the plans. Although there is no calculation of the extent of impervious surface, the fact that the developer has asked for a reduction in landscaping from 30% of the site (as is currently required in the I District) to 20% suggests that the amount of landscaping shown on the proposed Concept Plan is less than 30%. Further, the landscape plan depicts limited tree cover. The parking lots, particularly in front of the two large anchors, have large runs of parking with no trees except a single tree at the end of the aisle, and the depth of trees and grass currently along the Parker Street edge of the site will be significantly diminished. Also, as noted above, the evergreen trees that currently abut the office building on Parker Street appear to be removed. The limited greenery on this 58.3 acre site will likely make it quite hot during the summer. Also, at present, none of the amenities proposed by the developer in 2006, including a gazebo and on-site open space is included. The concept plan, as proposed, also extends considerably further into the undisturbed area at the rear of the property than the existing asphalt does today. As noted above, in the description of the project, several of the proposed residential buildings extend into this open area by perhaps as much as 350 feet. The Center is not aware if the current developer is planning to allow the trails at the rear of the property to continue to be accessed by the public, as was committed to by the 2006 developer, but, if so, review will need to be ascertain what are is still walkable as the concept plan appears to only provide a 25 foot buffer between the two rearmost buildings and the wetlands. Also, as mentioned above, a goal of the Maynard Master Plan is to increase the amount of open space in the vicinity of School Woods.

Review of Proposed Zoning Bylaw Amendment & Concept Plan for March 25, 2013
129 Parker Street, Maynard, MA Page 58
It should be noted that typically in planned unit developments (which is what the NBOD largely allows), effort is made to establish cluster uses and meet minimum requirements for publicly accessible open space to reduce stormwater runoff, reduce heat island effect, and create attractive green space that brings tenants and visitors to the site, among other reasons. Design with nature A portion of the comments related to designing with nature are captured in the “Sustainable – Green” section above, but designing with nature is more than green building design or sustainability. Designing with nature is identifying particular natural features on a site and using them to influence and enhance the design; embracing them as amenities that will bring residents, visitors, and investors to a site and encourage them to spend time there. Even where distinctive natural features do not already exist, greenery or other features can be introduced in ways that makes it appear that they have always been there. Even in a predominantly commercial setting, green respite areas allow families with small children an opportunity to decompress and offer shoppers, weary after hours of perusing stores, a place to sit and drink a beverage before getting up and shopping more. At present, the Concept Plan does not incorporate the significant natural features in its vicinity including the adjacent wetlands and parklands.
Consideration of Development Agreement
Part vision statement, part road map, and part contract, a development agreement is more than just a legal document, it is arguably the most important and complex relationship a municipality and a property owner can enter into. The word “relationship” reflects the long term nature of the agreement and working partnership that is to be developed through the agreement. A development agreement describes a vision for the future – vision of what a community and a developer have agreed upon through negotiations that take each party’s goals and needs into consideration. In the most agreements, the vision, represented through text, plans, and renderings, will be expressed in a manner
Source: Bing Maps, retrieved March 22, 2013

Review of Proposed Zoning Bylaw Amendment & Concept Plan for March 25, 2013
129 Parker Street, Maynard, MA Page 59
that provides an average community member with a clear understanding of what is about to be undertaken. A development agreement maps out the process by which the municipality and developer will realize their shared vision. It establishes a timeline when tasks are due and assigns responsibility for each task needed to achieve those deliverables. Ultimately, a development agreement is a contract that provides assurances to parties, commits resources, and establishes mechanisms to address either party’s failure to live up to their responsibilities. Although agreements will differ across communities, many cover the same topics, including:
Project Description
Timeline / Phasing
Infrastructure (on- and off-site)
Project Mitigation
Public Benefits
Financing Sources and Uses
Permitting Process
Roles and Responsibilities
Representations / Warrantees
Defaults / Remedies A few items to consider in the course of finalizing the development agreement are: Project Design
If the Zoning Bylaw is amended as proposed, perhaps the development agreement can be used to specify the size and mix of residential units and/or size maximums for specific types of uses. Ranges could be used to allow for flexibility while also providing a common understanding of what is expected.
Will the developer agree to adopt architectural design and material guidelines that create a unified sense of place and ensure creation of a visually appealing environment.
Infrastructure
Since water, sewer, and stormwater infrastructure is not addressed in the Concept Plan, the developer’s commitment will need to be defined before the Site Plan Approval.
Project Mitigation
Are all of the improvements required to mitigate traffic impacts included in the agreement?
Has the developer committed to a traffic mitigation fund that will be used after opening to address unforeseen circumstances?
Public Benefits
Has the developer committed funding to support and strengthen the downtown (ex., downtown mitigation fund, downtown improvement fund, downtown capital investment fund, funding for preparation of a downtown strategic plan, and physical improvements to be made between the project site and the downtown to encourage pedestrian and bicycle activity)

Review of Proposed Zoning Bylaw Amendment & Concept Plan for March 25, 2013
129 Parker Street, Maynard, MA Page 60
Has the developer committed to market downtown businesses (and events) as well as on-site businesses (ex. on-site kiosk, website marketing, such as directions to 129 Parker Street through downtown Maynard, signage, and/or print media)
Has the developer committed to providing publicly accessible open space on-site, particularly in the vicinity of School Woods?
Has the developer established goals for local, minority, and women hiring during construction? For purchasing of goods and supplies? Will the contractors to be hired agree to apprenticeship programs?
Has the developer committed to a recruitment approach that will assist local residents seeking to be hired by the new businesses? Have they made a financial contribution to a job training program?
Financial Security
In the event that proposed phases are delayed, has the developer committed to making minimum property tax payments at certain points in time, whether or not the buildings are built or occupied? Have they committed to similar payments for meals taxes, in the event that one of more of the restaurant openings is delayed? (If not, the Town’s projections for revenues may not be met.)
Is the developer willing to agree to not appeal property tax assessments prepared by the Board of Assessing, if not over the lifetime of the project, at least for the period prior full occupany?
Warrantees / Indemnification
Has the developer committed to either represent the municipality in court at its own cost or reimburse the municipality for its own legal representation in the event of litigation?
Have the Town and developer discussed what options the Town will have if the development does not proceed as planned? Will the Town have option to purchase the property and sell it to another entity if construction does not begin by a certain point in time, or if construction ceases for longer than a specified length of time?
Has an “Act of God” provision been included that requires the developer to rebuilt the property to its prior condition in event of destruction by fire, floor, or other type of catastrophe instead of allowing them to walk away from the site?

-A-1-
APPENDIX A: THE NIELSEN COMPANY, OPPORTUNITY GAP REPORT
(February 6, 2013)

-A-2-
THIS PAGE IS INTENTIONALLY BLANK

Area Map
GREAT RD AT PARKER ST
MAYNARD,MA 01754
Coord: 42.422739, -71.447915
Radius - See Appendix for Details
of
© 2006-2012 TomTom
Prepared By: Edward J. Collins Center - U
© 2013 The Nielsen Company. All rights reserved.
Nielsen Solution Center 1 800 866 651121PageWed Feb 06, 2013
Prepared For: Town of Maynard, Massachu
Project Code: Maynard
Prepared on:

Area Map
Appendix: Area Listing
Radius 1Type:
Area Name:
Radius Definition:
MAYNARD, MA 01754 0.00 1.00
42.422739 -71.447915GREAT RD AT PARKER ST
Circle/Band:
Center Point:
-
Radius 2Type:
Area Name:
Radius Definition:
MAYNARD, MA 01754 0.00 5.00
42.422739 -71.447915GREAT RD AT PARKER ST
Circle/Band:
Center Point:
-
Radius 3Type:
Area Name:
Radius Definition:
MAYNARD, MA 01754 0.00 10.00
42.422739 -71.447915GREAT RD AT PARKER ST
Circle/Band:
Center Point:
-
of
© 2006-2012 TomTom
Prepared By: Edward J. Collins Center - U
© 2013 The Nielsen Company. All rights reserved.
Nielsen Solution Center 1 800 866 651122PageWed Feb 06, 2013
Prepared For: Town of Maynard, Massachu
Project Code: Maynard
Prepared on:

RMP Opportunity Gap - Retail Stores
Radius 1: GREAT RD AT PARKER ST, MAYNARD, MA 01754, 0.00 - 1.00 Miles, Total
2013 Supply2013 Demand
Retail Stores Gap/Surplus(Retail Sales)
Opportunity
(Consumer Expenditures)
14,375,305Total Retail Sales Incl Eating and Drinking Places 133,923,360 119,548,055
3,319,924Motor Vehicle and Parts Dealers-441 24,023,957 20,704,033
2,409,951 Automotive Dealers-4411 20,732,392 18,322,441
142,987 Other Motor Vehicle Dealers-4412 1,279,487 1,136,500
766,987 Automotive Parts/Accsrs, Tire Stores-4413 2,012,078 1,245,091
577,660Furniture and Home Furnishings Stores-442 2,929,827 2,352,167
410,391 Furniture Stores-4421 1,586,595 1,176,204
167,270 Home Furnishing Stores-4422 1,343,232 1,175,962
1,021,343Electronics and Appliance Stores-443 2,780,698 1,759,355
702,425 Appliances, TVs, Electronics Stores-44311 2,060,495 1,358,070
68,792 Household Appliances Stores-443111 346,968 278,176
633,633 Radio, Television, Electronics Stores-443112 1,713,527 1,079,894
310,367 Computer and Software Stores-44312 637,386 327,019
8,551 Camera and Photographic Equipment Stores-44313 82,817 74,266
1,596,409Building Material, Garden Equip Stores -444 13,113,298 11,516,889
798,538 Building Material and Supply Dealers-4441 11,847,225 11,048,687
1,279,608 Home Centers-44411 4,821,753 3,542,145
(26,262) Paint and Wallpaper Stores-44412 196,719 222,981
171,933 Hardware Stores-44413 1,169,778 997,845
(626,741) Other Building Materials Dealers-44419 5,658,975 6,285,716
(222,112) Building Materials, Lumberyards-444191 2,235,602 2,457,714
797,870 Lawn, Garden Equipment, Supplies Stores-4442 1,266,072 468,202
19,926 Outdoor Power Equipment Stores-44421 140,856 120,930
777,945 Nursery and Garden Centers-44422 1,125,216 347,271
(2,982,847)Food and Beverage Stores-445 16,449,711 19,432,558
(2,530,416) Grocery Stores-4451 14,126,515 16,656,931
(1,985,020) Supermarkets, Grocery (Ex Conv) Stores-44511 13,430,570 15,415,590
(545,395) Convenience Stores-44512 695,945 1,241,340
454,384 Specialty Food Stores-4452 1,184,410 730,026
(906,816) Beer, Wine and Liquor Stores-4453 1,138,786 2,045,602
(1,238,374)Health and Personal Care Stores-446 6,784,502 8,022,876
(1,688,587) Pharmancies and Drug Stores-44611 5,359,509 7,048,096
144,646 Cosmetics, Beauty Supplies, Perfume Stores-44612 468,128 323,482
79,978 Optical Goods Stores-44613 350,986 271,008
225,588 Other Health and Personal Care Stores-44619 605,878 380,290
Prepared By: Edward J. Collins Center
© 2013 The Nielsen Company. All rights reserved.Prepared For: Town of Maynard, Massachusetts
Project Code: Maynard
101 OfPage
Nielsen Solution Center 1 800 866 6511
Wed Feb 06, 2013Prepared On:

RMP Opportunity Gap - Retail Stores
Radius 1: GREAT RD AT PARKER ST, MAYNARD, MA 01754, 0.00 - 1.00 Miles, Total
2013 Supply2013 Demand
Retail Stores Gap/Surplus(Retail Sales)
Opportunity
(Consumer Expenditures)
4,499,254Gasoline Stations-447 13,026,686 8,527,432
4,152,062 Gasoline Stations With Conv Stores-44711 9,461,211 5,309,149
347,193 Other Gasoline Stations-44719 3,565,476 3,218,283
682,857Clothing and Clothing Accessories Stores-448 6,740,587 6,057,730
453,120 Clothing Stores-4481 5,037,770 4,584,650
68,089 Men's Clothing Stores-44811 284,720 216,631
50,173 Women's Clothing Stores-44812 1,149,166 1,098,993
(39,977) Childrens, Infants Clothing Stores-44813 299,112 339,089
162,838 Family Clothing Stores-44814 2,630,059 2,467,221
76,783 Clothing Accessories Stores-44815 220,677 143,894
135,214 Other Clothing Stores-44819 454,035 318,821
59,156 Shoe Stores-4482 727,800 668,644
170,581 Jewelry, Luggage, Leather Goods Stores-4483 975,017 804,436
158,398 Jewelry Stores-44831 914,478 756,080
12,184 Luggage and Leather Goods Stores-44832 60,539 48,355
213,448Sporting Goods, Hobby, Book, Music Stores-451 2,734,337 2,520,889
257,717 Sportng Goods, Hobby, Musical Inst Stores-4511 1,991,927 1,734,210
134,925 Sporting Goods Stores-45111 1,068,535 933,610
96,891 Hobby, Toys and Games Stores-45112 577,052 480,161
5,099 Sew/Needlework/Piece Goods Stores-45113 144,853 139,754
20,803 Musical Instrument and Supplies Stores-45114 201,487 180,684
(44,269) Book, Periodical and Music Stores-4512 742,410 786,679
(34,371) Book Stores and News Dealers-45121 622,246 656,617
21,285 Book Stores-451211 578,039 556,754
(55,657) News Dealers and Newsstands-451212 44,206 99,863
(9,897) Prerecorded Tapes, CDs, Record Stores-45122 120,165 130,062
6,997,336General Merchandise Stores-452 17,020,884 10,023,548
462,842 Department Stores Excl Leased Depts-4521 7,065,010 6,602,168
6,534,493 Other General Merchandise Stores-4529 9,955,874 3,421,381
1,087,511Miscellaneous Store Retailers-453 3,614,566 2,527,055
(965) Florists-4531 176,714 177,679
207,386 Office Supplies, Stationery, Gift Stores-4532 1,228,016 1,020,630
203,125 Office Supplies and Stationery Stores-45321 686,620 483,495
4,263 Gift, Novelty and Souvenir Stores-45322 541,397 537,134
178,755 Used Merchandise Stores-4533 383,092 204,337
702,335 Other Miscellaneous Store Retailers-4539 1,826,744 1,124,409
(2,163,120)Non-Store Retailers-454 10,327,809 12,490,929
763,905Foodservice and Drinking Places-722 14,376,499 13,612,594
(19,460) Full-Service Restaurants-7221 6,716,247 6,735,707
Prepared By: Edward J. Collins Center
© 2013 The Nielsen Company. All rights reserved.Prepared For: Town of Maynard, Massachusetts
Project Code: Maynard
102 OfPage
Nielsen Solution Center 1 800 866 6511
Wed Feb 06, 2013Prepared On:

RMP Opportunity Gap - Retail Stores
Radius 1: GREAT RD AT PARKER ST, MAYNARD, MA 01754, 0.00 - 1.00 Miles, Total
2013 Supply2013 Demand
Retail Stores Gap/Surplus(Retail Sales)
Opportunity
(Consumer Expenditures)
1,180,737 Limited-Service Eating Places-7222 5,828,721 4,647,984
(471,670) Special Foodservices-7223 1,133,394 1,605,064
74,299 Drinking Places -Alcoholic Beverages-7224 698,137 623,838
9,700,031GAFO * 33,434,350 23,734,319
6,997,336 General Merchandise Stores-452 17,020,884 10,023,548
682,857 Clothing and Clothing Accessories Stores-448 6,740,587 6,057,730
577,660 Furniture and Home Furnishings Stores-442 2,929,827 2,352,167
1,021,343 Electronics and Appliance Stores-443 2,780,698 1,759,355
213,448 Sporting Goods, Hobby, Book, Music Stores-451 2,734,337 2,520,889
207,386 Office Supplies, Stationery, Gift Stores-4532 1,228,016 1,020,630
Prepared By: Edward J. Collins Center
© 2013 The Nielsen Company. All rights reserved.Prepared For: Town of Maynard, Massachusetts
Project Code: Maynard
103 OfPage
Nielsen Solution Center 1 800 866 6511
Wed Feb 06, 2013Prepared On:

RMP Opportunity Gap - Retail Stores
Radius 2: GREAT RD AT PARKER ST, MAYNARD, MA 01754, 0.00 - 5.00 Miles, Total
2013 Supply2013 Demand
Retail Stores Gap/Surplus(Retail Sales)
Opportunity
(Consumer Expenditures)
131,289,128Total Retail Sales Incl Eating and Drinking Places 1,223,117,077 1,091,827,949
30,320,739Motor Vehicle and Parts Dealers-441 219,409,903 189,089,164
22,009,990 Automotive Dealers-4411 189,348,163 167,338,173
1,305,892 Other Motor Vehicle Dealers-4412 11,685,509 10,379,617
7,004,856 Automotive Parts/Accsrs, Tire Stores-4413 18,376,230 11,371,374
5,275,750Furniture and Home Furnishings Stores-442 26,757,999 21,482,249
3,748,084 Furniture Stores-4421 14,490,315 10,742,231
1,527,665 Home Furnishing Stores-4422 12,267,684 10,740,019
9,327,888Electronics and Appliance Stores-443 25,396,011 16,068,123
6,415,225 Appliances, TVs, Electronics Stores-44311 18,818,424 12,403,199
628,272 Household Appliances Stores-443111 3,168,843 2,540,571
5,786,954 Radio, Television, Electronics Stores-443112 15,649,582 9,862,628
2,834,573 Computer and Software Stores-44312 5,821,225 2,986,652
78,091 Camera and Photographic Equipment Stores-44313 756,362 678,271
14,579,944Building Material, Garden Equip Stores -444 119,763,262 105,183,318
7,293,022 Building Material and Supply Dealers-4441 108,200,271 100,907,249
11,686,611 Home Centers-44411 44,036,891 32,350,280
(239,851) Paint and Wallpaper Stores-44412 1,796,625 2,036,476
1,570,260 Hardware Stores-44413 10,683,542 9,113,282
(5,723,999) Other Building Materials Dealers-44419 51,683,212 57,407,211
(2,028,544) Building Materials, Lumberyards-444191 20,417,667 22,446,211
7,286,921 Lawn, Garden Equipment, Supplies Stores-4442 11,562,991 4,276,070
181,982 Outdoor Power Equipment Stores-44421 1,286,434 1,104,452
7,104,939 Nursery and Garden Centers-44422 10,276,557 3,171,618
(27,242,237)Food and Beverage Stores-445 150,234,596 177,476,833
(23,110,187) Grocery Stores-4451 129,016,941 152,127,128
(18,129,118) Supermarkets, Grocery (Ex Conv) Stores-44511 122,660,897 140,790,015
(4,981,070) Convenience Stores-44512 6,356,044 11,337,114
4,149,870 Specialty Food Stores-4452 10,817,169 6,667,299
(8,281,919) Beer, Wine and Liquor Stores-4453 10,400,487 18,682,406
(11,310,029)Health and Personal Care Stores-446 61,962,601 73,272,630
(15,421,802) Pharmancies and Drug Stores-44611 48,948,201 64,370,003
1,321,043 Cosmetics, Beauty Supplies, Perfume Stores-44612 4,275,393 2,954,350
730,439 Optical Goods Stores-44613 3,205,541 2,475,102
2,060,290 Other Health and Personal Care Stores-44619 5,533,466 3,473,176
Prepared By: Edward J. Collins Center
© 2013 The Nielsen Company. All rights reserved.Prepared For: Town of Maynard, Massachusetts
Project Code: Maynard
104 OfPage
Nielsen Solution Center 1 800 866 6511
Wed Feb 06, 2013Prepared On:
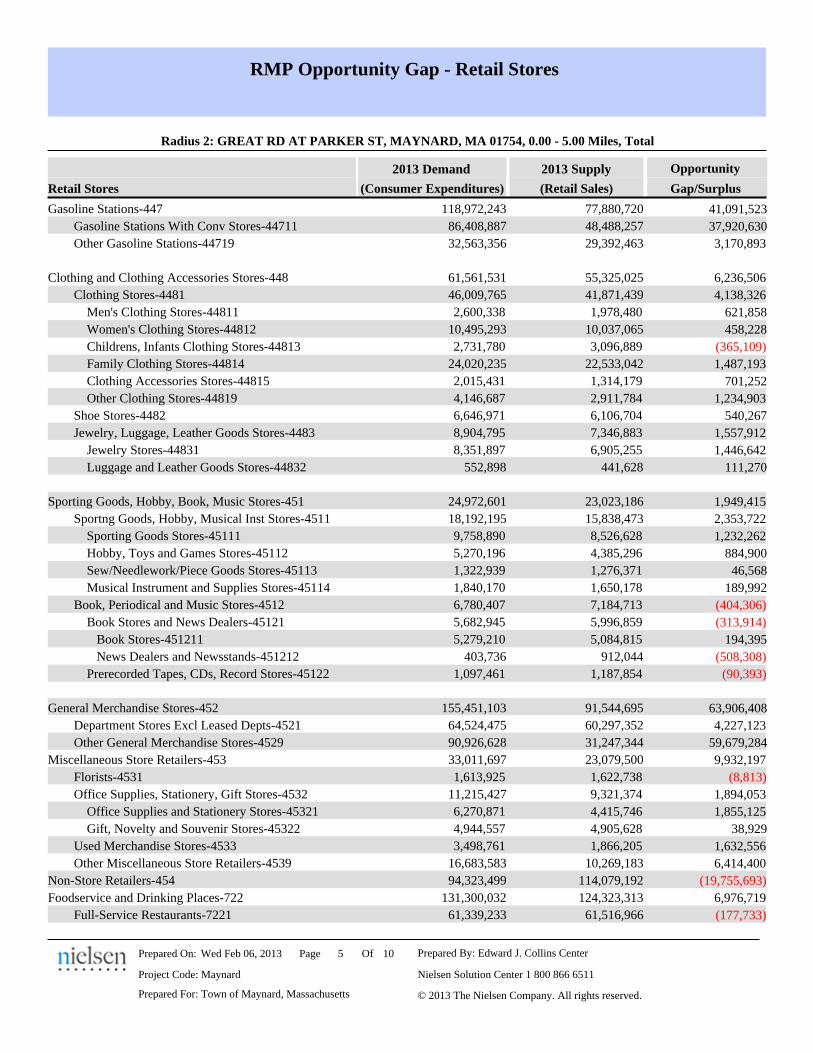
RMP Opportunity Gap - Retail Stores
Radius 2: GREAT RD AT PARKER ST, MAYNARD, MA 01754, 0.00 - 5.00 Miles, Total
2013 Supply2013 Demand
Retail Stores Gap/Surplus(Retail Sales)
Opportunity
(Consumer Expenditures)
41,091,523Gasoline Stations-447 118,972,243 77,880,720
37,920,630 Gasoline Stations With Conv Stores-44711 86,408,887 48,488,257
3,170,893 Other Gasoline Stations-44719 32,563,356 29,392,463
6,236,506Clothing and Clothing Accessories Stores-448 61,561,531 55,325,025
4,138,326 Clothing Stores-4481 46,009,765 41,871,439
621,858 Men's Clothing Stores-44811 2,600,338 1,978,480
458,228 Women's Clothing Stores-44812 10,495,293 10,037,065
(365,109) Childrens, Infants Clothing Stores-44813 2,731,780 3,096,889
1,487,193 Family Clothing Stores-44814 24,020,235 22,533,042
701,252 Clothing Accessories Stores-44815 2,015,431 1,314,179
1,234,903 Other Clothing Stores-44819 4,146,687 2,911,784
540,267 Shoe Stores-4482 6,646,971 6,106,704
1,557,912 Jewelry, Luggage, Leather Goods Stores-4483 8,904,795 7,346,883
1,446,642 Jewelry Stores-44831 8,351,897 6,905,255
111,270 Luggage and Leather Goods Stores-44832 552,898 441,628
1,949,415Sporting Goods, Hobby, Book, Music Stores-451 24,972,601 23,023,186
2,353,722 Sportng Goods, Hobby, Musical Inst Stores-4511 18,192,195 15,838,473
1,232,262 Sporting Goods Stores-45111 9,758,890 8,526,628
884,900 Hobby, Toys and Games Stores-45112 5,270,196 4,385,296
46,568 Sew/Needlework/Piece Goods Stores-45113 1,322,939 1,276,371
189,992 Musical Instrument and Supplies Stores-45114 1,840,170 1,650,178
(404,306) Book, Periodical and Music Stores-4512 6,780,407 7,184,713
(313,914) Book Stores and News Dealers-45121 5,682,945 5,996,859
194,395 Book Stores-451211 5,279,210 5,084,815
(508,308) News Dealers and Newsstands-451212 403,736 912,044
(90,393) Prerecorded Tapes, CDs, Record Stores-45122 1,097,461 1,187,854
63,906,408General Merchandise Stores-452 155,451,103 91,544,695
4,227,123 Department Stores Excl Leased Depts-4521 64,524,475 60,297,352
59,679,284 Other General Merchandise Stores-4529 90,926,628 31,247,344
9,932,197Miscellaneous Store Retailers-453 33,011,697 23,079,500
(8,813) Florists-4531 1,613,925 1,622,738
1,894,053 Office Supplies, Stationery, Gift Stores-4532 11,215,427 9,321,374
1,855,125 Office Supplies and Stationery Stores-45321 6,270,871 4,415,746
38,929 Gift, Novelty and Souvenir Stores-45322 4,944,557 4,905,628
1,632,556 Used Merchandise Stores-4533 3,498,761 1,866,205
6,414,400 Other Miscellaneous Store Retailers-4539 16,683,583 10,269,183
(19,755,693)Non-Store Retailers-454 94,323,499 114,079,192
6,976,719Foodservice and Drinking Places-722 131,300,032 124,323,313
(177,733) Full-Service Restaurants-7221 61,339,233 61,516,966
Prepared By: Edward J. Collins Center
© 2013 The Nielsen Company. All rights reserved.Prepared For: Town of Maynard, Massachusetts
Project Code: Maynard
105 OfPage
Nielsen Solution Center 1 800 866 6511
Wed Feb 06, 2013Prepared On:

RMP Opportunity Gap - Retail Stores
Radius 2: GREAT RD AT PARKER ST, MAYNARD, MA 01754, 0.00 - 5.00 Miles, Total
2013 Supply2013 Demand
Retail Stores Gap/Surplus(Retail Sales)
Opportunity
(Consumer Expenditures)
10,783,624 Limited-Service Eating Places-7222 53,233,488 42,449,864
(4,307,746) Special Foodservices-7223 10,351,247 14,658,993
678,573 Drinking Places -Alcoholic Beverages-7224 6,376,063 5,697,490
88,590,021GAFO * 305,354,673 216,764,652
63,906,408 General Merchandise Stores-452 155,451,103 91,544,695
6,236,506 Clothing and Clothing Accessories Stores-448 61,561,531 55,325,025
5,275,750 Furniture and Home Furnishings Stores-442 26,757,999 21,482,249
9,327,888 Electronics and Appliance Stores-443 25,396,011 16,068,123
1,949,415 Sporting Goods, Hobby, Book, Music Stores-451 24,972,601 23,023,186
1,894,053 Office Supplies, Stationery, Gift Stores-4532 11,215,427 9,321,374
Prepared By: Edward J. Collins Center
© 2013 The Nielsen Company. All rights reserved.Prepared For: Town of Maynard, Massachusetts
Project Code: Maynard
106 OfPage
Nielsen Solution Center 1 800 866 6511
Wed Feb 06, 2013Prepared On:

RMP Opportunity Gap - Retail Stores
Radius 3: GREAT RD AT PARKER ST, MAYNARD, MA 01754, 0.00 - 10.00 Miles, Total
2013 Supply2013 Demand
Retail Stores Gap/Surplus(Retail Sales)
Opportunity
(Consumer Expenditures)
540,396,909Total Retail Sales Incl Eating and Drinking Places 5,034,451,030 4,494,054,121
124,802,668Motor Vehicle and Parts Dealers-441 903,109,303 778,306,635
90,594,940 Automotive Dealers-4411 779,372,698 688,777,758
5,375,160 Other Motor Vehicle Dealers-4412 48,098,521 42,723,361
28,832,567 Automotive Parts/Accsrs, Tire Stores-4413 75,638,083 46,805,516
21,715,422Furniture and Home Furnishings Stores-442 110,138,137 88,422,715
15,427,426 Furniture Stores-4421 59,643,335 44,215,909
6,287,997 Home Furnishing Stores-4422 50,494,802 44,206,805
38,394,361Electronics and Appliance Stores-443 104,532,083 66,137,722
26,405,598 Appliances, TVs, Electronics Stores-44311 77,458,191 51,052,593
2,586,016 Household Appliances Stores-443111 13,043,218 10,457,202
23,819,581 Radio, Television, Electronics Stores-443112 64,414,972 40,595,391
11,667,335 Computer and Software Stores-44312 23,960,643 12,293,308
321,428 Camera and Photographic Equipment Stores-44313 3,113,249 2,791,821
60,012,252Building Material, Garden Equip Stores -444 492,955,488 432,943,236
30,018,682 Building Material and Supply Dealers-4441 445,361,261 415,342,579
48,103,058 Home Centers-44411 181,259,484 133,156,426
(987,248) Paint and Wallpaper Stores-44412 7,395,057 8,382,305
6,463,321 Hardware Stores-44413 43,974,344 37,511,023
(23,560,450) Other Building Materials Dealers-44419 212,732,376 236,292,826
(8,349,655) Building Materials, Lumberyards-444191 84,040,805 92,390,460
29,993,571 Lawn, Garden Equipment, Supplies Stores-4442 47,594,228 17,600,657
749,050 Outdoor Power Equipment Stores-44421 5,295,067 4,546,017
29,244,520 Nursery and Garden Centers-44422 42,299,160 13,054,640
(112,131,300)Food and Beverage Stores-445 618,378,020 730,509,320
(95,123,444) Grocery Stores-4451 531,044,396 626,167,840
(74,620,949) Supermarkets, Grocery (Ex Conv) Stores-44511 504,882,393 579,503,342
(20,502,496) Convenience Stores-44512 26,162,002 46,664,498
17,081,208 Specialty Food Stores-4452 44,524,361 27,443,153
(34,089,063) Beer, Wine and Liquor Stores-4453 42,809,263 76,898,326
(46,553,015)Health and Personal Care Stores-446 255,043,188 301,596,203
(63,477,414) Pharmancies and Drug Stores-44611 201,474,841 264,952,255
5,437,524 Cosmetics, Beauty Supplies, Perfume Stores-44612 17,597,872 12,160,348
3,006,549 Optical Goods Stores-44613 13,194,272 10,187,723
8,480,325 Other Health and Personal Care Stores-44619 22,776,203 14,295,878
Prepared By: Edward J. Collins Center
© 2013 The Nielsen Company. All rights reserved.Prepared For: Town of Maynard, Massachusetts
Project Code: Maynard
107 OfPage
Nielsen Solution Center 1 800 866 6511
Wed Feb 06, 2013Prepared On:

RMP Opportunity Gap - Retail Stores
Radius 3: GREAT RD AT PARKER ST, MAYNARD, MA 01754, 0.00 - 10.00 Miles, Total
2013 Supply2013 Demand
Retail Stores Gap/Surplus(Retail Sales)
Opportunity
(Consumer Expenditures)
169,136,106Gasoline Stations-447 489,699,590 320,563,484
156,084,445 Gasoline Stations With Conv Stores-44711 355,666,122 199,581,677
13,051,661 Other Gasoline Stations-44719 134,033,468 120,981,807
25,669,973Clothing and Clothing Accessories Stores-448 253,392,352 227,722,379
17,033,693 Clothing Stores-4481 189,379,997 172,346,304
2,559,618 Men's Clothing Stores-44811 10,703,206 8,143,588
1,886,105 Women's Clothing Stores-44812 43,199,493 41,313,388
(1,502,815) Childrens, Infants Clothing Stores-44813 11,244,234 12,747,049
6,121,409 Family Clothing Stores-44814 98,869,274 92,747,865
2,886,412 Clothing Accessories Stores-44815 8,295,681 5,409,269
5,082,963 Other Clothing Stores-44819 17,068,108 11,985,145
2,223,784 Shoe Stores-4482 27,359,482 25,135,698
6,412,496 Jewelry, Luggage, Leather Goods Stores-4483 36,652,873 30,240,377
5,954,498 Jewelry Stores-44831 34,377,098 28,422,600
457,998 Luggage and Leather Goods Stores-44832 2,275,775 1,817,777
8,023,956Sporting Goods, Hobby, Book, Music Stores-451 102,789,292 94,765,336
9,688,114 Sportng Goods, Hobby, Musical Inst Stores-4511 74,880,578 65,192,464
5,072,091 Sporting Goods Stores-45111 40,168,398 35,096,307
3,642,321 Hobby, Toys and Games Stores-45112 21,692,561 18,050,240
191,679 Sew/Needlework/Piece Goods Stores-45113 5,445,326 5,253,647
782,023 Musical Instrument and Supplies Stores-45114 7,574,293 6,792,270
(1,664,158) Book, Periodical and Music Stores-4512 27,908,714 29,572,872
(1,292,093) Book Stores and News Dealers-45121 23,391,473 24,683,566
800,145 Book Stores-451211 21,729,664 20,929,519
(2,092,239) News Dealers and Newsstands-451212 1,661,809 3,754,048
(372,065) Prerecorded Tapes, CDs, Record Stores-45122 4,517,241 4,889,306
263,044,058General Merchandise Stores-452 639,849,594 376,805,536
17,399,188 Department Stores Excl Leased Depts-4521 265,588,074 248,188,886
245,644,869 Other General Merchandise Stores-4529 374,261,519 128,616,650
40,881,744Miscellaneous Store Retailers-453 135,878,875 94,997,131
(36,275) Florists-4531 6,643,048 6,679,323
7,796,081 Office Supplies, Stationery, Gift Stores-4532 46,163,627 38,367,546
7,635,846 Office Supplies and Stationery Stores-45321 25,811,422 18,175,576
160,235 Gift, Novelty and Souvenir Stores-45322 20,352,205 20,191,970
6,719,735 Used Merchandise Stores-4533 14,401,191 7,681,456
26,402,202 Other Miscellaneous Store Retailers-4539 68,671,009 42,268,807
(81,316,067)Non-Store Retailers-454 388,243,321 469,559,388
28,716,751Foodservice and Drinking Places-722 540,441,788 511,725,037
(731,560) Full-Service Restaurants-7221 252,477,357 253,208,917
Prepared By: Edward J. Collins Center
© 2013 The Nielsen Company. All rights reserved.Prepared For: Town of Maynard, Massachusetts
Project Code: Maynard
108 OfPage
Nielsen Solution Center 1 800 866 6511
Wed Feb 06, 2013Prepared On:

RMP Opportunity Gap - Retail Stores
Radius 3: GREAT RD AT PARKER ST, MAYNARD, MA 01754, 0.00 - 10.00 Miles, Total
2013 Supply2013 Demand
Retail Stores Gap/Surplus(Retail Sales)
Opportunity
(Consumer Expenditures)
44,386,287 Limited-Service Eating Places-7222 219,113,438 174,727,151
(17,731,038) Special Foodservices-7223 42,606,591 60,337,629
2,793,062 Drinking Places -Alcoholic Beverages-7224 26,244,403 23,451,341
364,643,851GAFO * 1,256,865,084 892,221,233
263,044,058 General Merchandise Stores-452 639,849,594 376,805,536
25,669,973 Clothing and Clothing Accessories Stores-448 253,392,352 227,722,379
21,715,422 Furniture and Home Furnishings Stores-442 110,138,137 88,422,715
38,394,361 Electronics and Appliance Stores-443 104,532,083 66,137,722
8,023,956 Sporting Goods, Hobby, Book, Music Stores-451 102,789,292 94,765,336
7,796,081 Office Supplies, Stationery, Gift Stores-4532 46,163,627 38,367,546
both supply and demand estimates.
specified reporting geography. When the demand is greater than (less than) the supply, there is an opportunity gap (surplus)
for that retail outlet. For example, a positive value signifies an opportunity gap, while a negative value signifies a surplus.
Survey (CE Survey), which is fielded by the U.S. Bureau of Labor Statistics (BLS). The supply data is derived from the Census
of Retail Trade (CRT), which is made available by the U.S. Census.Additional data sources are incorporated to create
The difference between demand and supply represents the opportunity gap or surplus available for each retail outlet in the
Nielsen' RMP data is derived from two major sources of information. The demand data is derived from the Consumer Expenditure
* GAFO (General merchandise, Apparel, Furniture and Other) represents sales at stores that sell merchandise normally sold in
department stores. This category is not included in Total Retail Sales Including Eating and Drinking Places.
Prepared By: Edward J. Collins Center
© 2013 The Nielsen Company. All rights reserved.Prepared For: Town of Maynard, Massachusetts
Project Code: Maynard
109 OfPage
Nielsen Solution Center 1 800 866 6511
Wed Feb 06, 2013Prepared On:

RMP Opportunity Gap - Retail Stores
Appendix: Area Listing
Radius Definition:
Designated Market AreaType: Radius 1 Reporting Detail: Aggregate Reporting Level:
Area Name:
MAYNARD, MA 01754 -Radius
Latitude/LongitudeGREAT RD AT PARKER ST
0.00 1.00
-71.44791542.422739
Radius Definition:
Designated Market AreaType: Radius 2 Reporting Detail: Aggregate Reporting Level:
Area Name:
MAYNARD, MA 01754 -Radius
Latitude/LongitudeGREAT RD AT PARKER ST
0.00 5.00
-71.44791542.422739
Radius Definition:
Designated Market AreaType: Radius 3 Reporting Detail: Aggregate Reporting Level:
Area Name:
MAYNARD, MA 01754 -Radius
Latitude/LongitudeGREAT RD AT PARKER ST
0.00 10.00
-71.44791542.422739
1
971542728
Project Information:
Order Number:
Site:
Prepared By: Edward J. Collins Center
© 2013 The Nielsen Company. All rights reserved.Prepared For: Town of Maynard, Massachusetts
Project Code: Maynard
1010 OfPage
Nielsen Solution Center 1 800 866 6511
Wed Feb 06, 2013Prepared On:

Pop-Facts: Population Quick Facts 2013 Report
Radius 1: GREAT RD AT PARKER ST, MAYNARD, MA 01754, aggregate
Radius 2: GREAT RD AT PARKER ST, MAYNARD, MA 01754, aggregate
Radius 3: GREAT RD AT PARKER ST, MAYNARD, MA 01754, aggregate
Radius 3Radius 2
0.00 - 10.00 miles0.00 - 5.00 miles0.00 - 1.00 miles
% % %Radius 1Description
Population
283,42668,8587,540 2018 Projection
277,35467,3837,378 2013 Estimate
273,45766,4367,274 2010 Census
262,99063,8936,996 2000 Census
2.19%2.19%2.20% Growth 2013 - 2018
1.43%1.43%1.43% Growth 2010 - 2013
3.98%3.98%3.97% Growth 2000 - 2010
2013 Est. Population by Age 67,383 277,3547,378
15,540 5.605.603,775413 Age 0 - 4 5.60
15,858 5.725.723,853422 Age 5 - 9 5.72
16,761 6.046.044,072446 Age 10 - 14 6.04
11,042 3.983.982,683294 Age 15 - 17 3.98
12,136 4.384.372,948323 Age 18 - 20 4.38
15,788 5.695.693,836420 Age 21 - 24 5.69
35,179 12.6812.688,547936 Age 25 - 34 12.69
35,920 12.9512.958,727956 Age 35 - 44 12.96
42,578 15.3515.3510,3441,133 Age 45 - 54 15.36
36,413 13.1313.138,847969 Age 55 - 64 13.13
22,006 7.937.935,346585 Age 65 - 74 7.93
12,102 4.364.362,940322 Age 75 - 84 4.36
6,031 2.172.171,465160 Age 85 and over 2.17
225,558 81.3281.3254,7996,000 Age 16 and over 81.32
218,152 78.6578.6553,0005,803 Age 18 and over 78.65
206,016 74.2874.2850,0515,480 Age 21 and over 74.27
40,139 14.4714.479,7521,068 Age 65 and over 14.48
2013 Est. Median Age 39.6 39.639.6
2013 Est. Average Age 39.60 39.6039.60
Nielsen Solution Center 1 800 866 6511
Prepared By: Edward J. Collins Center
Prepared For: Town of Maynard, Massachusetts
Project Code: Maynard
31 OfPage
© 2013 The Nielsen Company. All rights reserved.
Wed Feb 06, 2013Prepared On:
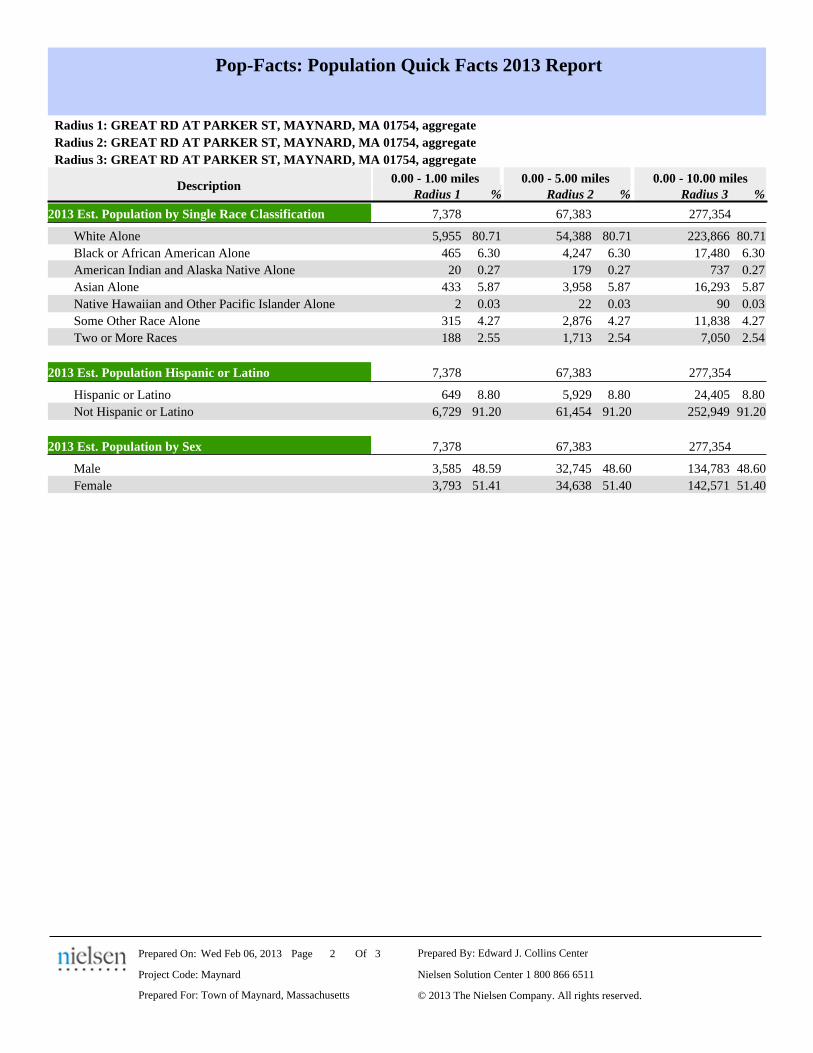
Pop-Facts: Population Quick Facts 2013 Report
Radius 1: GREAT RD AT PARKER ST, MAYNARD, MA 01754, aggregate
Radius 2: GREAT RD AT PARKER ST, MAYNARD, MA 01754, aggregate
Radius 3: GREAT RD AT PARKER ST, MAYNARD, MA 01754, aggregate
Radius 3Radius 2
0.00 - 10.00 miles0.00 - 5.00 miles0.00 - 1.00 miles
% % %Radius 1Description
2013 Est. Population by Single Race Classification 67,383 277,3547,378
223,866 80.7180.7154,3885,955 White Alone 80.71
17,480 6.306.304,247465 Black or African American Alone 6.30
737 0.270.2717920 American Indian and Alaska Native Alone 0.27
16,293 5.875.873,958433 Asian Alone 5.87
90 0.030.03222 Native Hawaiian and Other Pacific Islander Alone 0.03
11,838 4.274.272,876315 Some Other Race Alone 4.27
7,050 2.542.541,713188 Two or More Races 2.55
2013 Est. Population Hispanic or Latino 67,383 277,3547,378
24,405 8.808.805,929649 Hispanic or Latino 8.80
252,949 91.2091.2061,4546,729 Not Hispanic or Latino 91.20
2013 Est. Population by Sex 67,383 277,3547,378
134,783 48.6048.6032,7453,585 Male 48.59
142,571 51.4051.4034,6383,793 Female 51.41
Nielsen Solution Center 1 800 866 6511
Prepared By: Edward J. Collins Center
Prepared For: Town of Maynard, Massachusetts
Project Code: Maynard
32 OfPage
© 2013 The Nielsen Company. All rights reserved.
Wed Feb 06, 2013Prepared On:

Pop-Facts: Population Quick Facts 2013 Report
Appendix: Area Listing
Radius Definition:
Designated Market AreaType: Radius 1 Reporting Detail: Aggregate Reporting Level:
Area Name:
MAYNARD, MA 01754 -Radius
Latitude/LongitudeGREAT RD AT PARKER ST
0.00 1.00
-71.44791542.422739
Radius Definition:
Designated Market AreaType: Radius 2 Reporting Detail: Aggregate Reporting Level:
Area Name:
MAYNARD, MA 01754 -Radius
Latitude/LongitudeGREAT RD AT PARKER ST
0.00 5.00
-71.44791542.422739
Radius Definition:
Designated Market AreaType: Radius 3 Reporting Detail: Aggregate Reporting Level:
Area Name:
MAYNARD, MA 01754 -Radius
Latitude/LongitudeGREAT RD AT PARKER ST
0.00 10.00
-71.44791542.422739
1
971542728
Project Information:
Order Number:
Site:
Nielsen Solution Center 1 800 866 6511
Prepared By: Edward J. Collins Center
Prepared For: Town of Maynard, Massachusetts
Project Code: Maynard
33 OfPage
© 2013 The Nielsen Company. All rights reserved.
Wed Feb 06, 2013Prepared On:

Pop-Facts: Household Quick Facts 2013 Report
Radius 1: GREAT RD AT PARKER ST, MAYNARD, MA 01754, aggregate
Radius 2: GREAT RD AT PARKER ST, MAYNARD, MA 01754, aggregate
Radius 3: GREAT RD AT PARKER ST, MAYNARD, MA 01754, aggregate
Radius 3Radius 2
0.00 - 10.00 miles0.00 - 5.00 miles0.00 - 1.00 miles
% % %Radius 1Description
Households
111,02326,9732,953 2018 Projection
108,18626,2842,878 2013 Estimate
106,30525,8272,828 2010 Census
100,94724,5252,685 2000 Census
2.62%2.62%2.61% Growth 2013 - 2018
1.77%1.77%1.77% Growth 2010 - 2013
5.31%5.31%5.33% Growth 2000 - 2010
2013 Est. Households by Household Income 26,284 108,1862,878
11,995 11.0911.092,914319 CY HHs, Inc < $15,000 11.08
8,780 8.128.122,133234 CY HHs, Inc $15,000 - $24,999 8.13
8,414 7.787.782,044224 CY HHs, Inc $25,000 - $34,999 7.78
12,391 11.4511.453,010330 CY HHs, Inc $35,000 - $49,999 11.47
18,557 17.1517.154,508494 CY HHs, Inc $50,000 - $74,999 17.16
14,410 13.3213.323,501383 CY HHs, Inc $75,000 - $99,999 13.31
10,939 10.1110.112,658291 CY HHs, Inc $100,000 - $124,999 10.11
7,147 6.616.601,736190 CY HHs, Inc $125,000 - $149,999 6.60
7,735 7.157.151,879206 CY HHs, Inc $150,000 - $199,999 7.16
2,706 2.502.5065772 CY HHs, Inc $200,000 - $249,999 2.50
3,764 3.483.48914100 CY HHs, Inc $250,000 - $499,999 3.47
1,348 1.251.2532836 CY HHs, Inc $500,000+ 1.25
2013 Est. Average Household Income $91,492 $91,492$91,492
2013 Est. Median Household Income $66,858 $66,858$66,858
2013 Median HH Inc. by Single Race Class
69,99069,99069,990 White Alone
43,65243,65243,652 Black or African American Alone
41,60741,60741,607 American Indian and Alaska Native Alone
72,92472,92472,924 Asian Alone
60,55060,55060,550 Native Hawaiian and Other Pacific Islander Alone
37,06437,06437,064 Some Other Race Alone
48,91048,91048,910 Two or More Races
37,67537,67537,675 Hispanic or Latino
69,08169,08169,081 Not Hispanic or Latino
Nielsen Solution Center 1 800 866 6511
Prepared By: Edward J. Collins Center
Prepared For: Town of Maynard, Massachusetts
Project Code: Maynard
31 OfPage
© 2013 The Nielsen Company. All rights reserved.
Wed Feb 06, 2013Prepared On:

Pop-Facts: Household Quick Facts 2013 Report
Radius 1: GREAT RD AT PARKER ST, MAYNARD, MA 01754, aggregate
Radius 2: GREAT RD AT PARKER ST, MAYNARD, MA 01754, aggregate
Radius 3: GREAT RD AT PARKER ST, MAYNARD, MA 01754, aggregate
Radius 3Radius 2
0.00 - 10.00 miles0.00 - 5.00 miles0.00 - 1.00 miles
% % %Radius 1Description
2013 Est. Households by Household Type 26,284 108,1862,878
68,550 63.3663.3616,6541,824 Family Households 63.38
39,636 36.6436.649,6301,054 Non Family Households 36.62
2013 Est. Group Quarters Population 2,216 9,120243
2013 Est. Households by Household Size 26,284 108,1862,878
30,670 28.3528.357,451816 1-person household 28.35
34,949 32.3032.308,491930 2-person household 32.31
17,798 16.4516.454,324473 3-person household 16.44
14,993 13.8613.863,642399 4-person household 13.86
6,403 5.925.921,556170 5-person household 5.91
2,221 2.052.0554059 6-person household 2.05
1,152 1.061.0728031 7 or more person household 1.08
2013 Est. Average Household Size 2.48 2.482.48
2013 Est. Household Type, Presence Own Children 16,654 68,5501,824
22,441 32.7432.745,452597 Married-Couple Family, own children 32.73
29,573 43.1443.147,185787 Married-Couple Family, no own children 43.15
1,929 2.812.8246951 Male Householder, own children 2.80
2,307 3.373.3656061 Male Householder, no own children 3.34
6,810 9.939.941,655181 Female Householder, own children 9.92
5,490 8.018.011,334146 Female Householder, no own children 8.00
Nielsen Solution Center 1 800 866 6511
Prepared By: Edward J. Collins Center
Prepared For: Town of Maynard, Massachusetts
Project Code: Maynard
32 OfPage
© 2013 The Nielsen Company. All rights reserved.
Wed Feb 06, 2013Prepared On:

Pop-Facts: Household Quick Facts 2013 Report
Appendix: Area Listing
Radius Definition:
Designated Market AreaType: Radius 1 Reporting Detail: Aggregate Reporting Level:
Area Name:
MAYNARD, MA 01754 -Radius
Latitude/LongitudeGREAT RD AT PARKER ST
0.00 1.00
-71.44791542.422739
Radius Definition:
Designated Market AreaType: Radius 2 Reporting Detail: Aggregate Reporting Level:
Area Name:
MAYNARD, MA 01754 -Radius
Latitude/LongitudeGREAT RD AT PARKER ST
0.00 5.00
-71.44791542.422739
Radius Definition:
Designated Market AreaType: Radius 3 Reporting Detail: Aggregate Reporting Level:
Area Name:
MAYNARD, MA 01754 -Radius
Latitude/LongitudeGREAT RD AT PARKER ST
0.00 10.00
-71.44791542.422739
1
971542728
Project Information:
Order Number:
Site:
Nielsen Solution Center 1 800 866 6511
Prepared By: Edward J. Collins Center
Prepared For: Town of Maynard, Massachusetts
Project Code: Maynard
33 OfPage
© 2013 The Nielsen Company. All rights reserved.
Wed Feb 06, 2013Prepared On:

Household Trend 2013
Radius 1: GREAT RD AT PARKER ST, MAYNARD, MA 01754, 0.00 - 1.00 Miles, Total
2013-20182000-2013%Change
Description Census Estimate Projection
2000 2013 2018%Change
Universe Totals
Population 7,540 2.20%6,996 7,378 5.46%
Households 2,953 2.61%2,685 2,878 7.19%
Families 1,869 2.47%1,743 1,824 4.65%
Housing Units 3,276 2.54%2,897 3,195 10.29%
Group Quarters Population 241 -0.82%225 243 8.00%
Average Household Size 2.472.52 2.48
%%201820132000
% ProjectionEstimateCensusDescription
Total Household Income 2,9532,686 2,878
12.92% 11.08% 10.57% Income Less than $15,000 312347 319
9.61% 8.13% 7.82% Income $15,000 - $24,999 231258 234
10.16% 7.78% 7.45% Income $25,000 - $34,999 220273 224
14.63% 11.47% 10.97% Income $35,000 - $49,999 324393 330
20.55% 17.16% 16.46% Income $50,000 - $74,999 486552 494
13.29% 13.31% 13.04% Income $75,000 - $99,999 385357 383
7.63% 10.11% 10.13% Income $100,000 - $124,999 299205 291
3.91% 6.60% 7.08% Income $125,000 - $149,999 209105 190
3.57% 7.16% 7.72% Income $150,000 - $199,999 22896 206
1.64% 2.50% 3.35% Income $200,000 - $249,000 9944 72
1.41% 3.47% 3.79% Income $250,000 - $499,999 11238 100
0.67% 1.25% 1.63% Income $500,000 or more 4818 36
Average Household Income $97,594$69,218 $91,492
Median Household Income $70,033$53,259 $66,858
Median HH Inc. by Single Race Class
White Alone 73,53755,518 69,990
Black or African American Alone 46,02935,377 43,652
Amer Indian and Alaska Native Alone 43,44040,116 41,607
Asian Alone 78,00553,294 72,924
Native Hawaiian and Other Pacific Islan 67,66934,828 60,550
Some Other Race Alone 39,02730,308 37,064
Two or More Races 52,21036,361 48,910
Hispanic or Latino 39,84431,225 37,675
Not Hispanic or Latino 72,63154,496 69,081
Nielsen Solution Center 1 800 866 6511
Prepared By: Edward J. Collins Center
Prepared For: Town of Maynard, Massachusetts
Project Code: Maynard
71 OfPage
© 2013 The Nielsen Company. All rights reserved.
Wed Feb 06, 2013Prepared On:
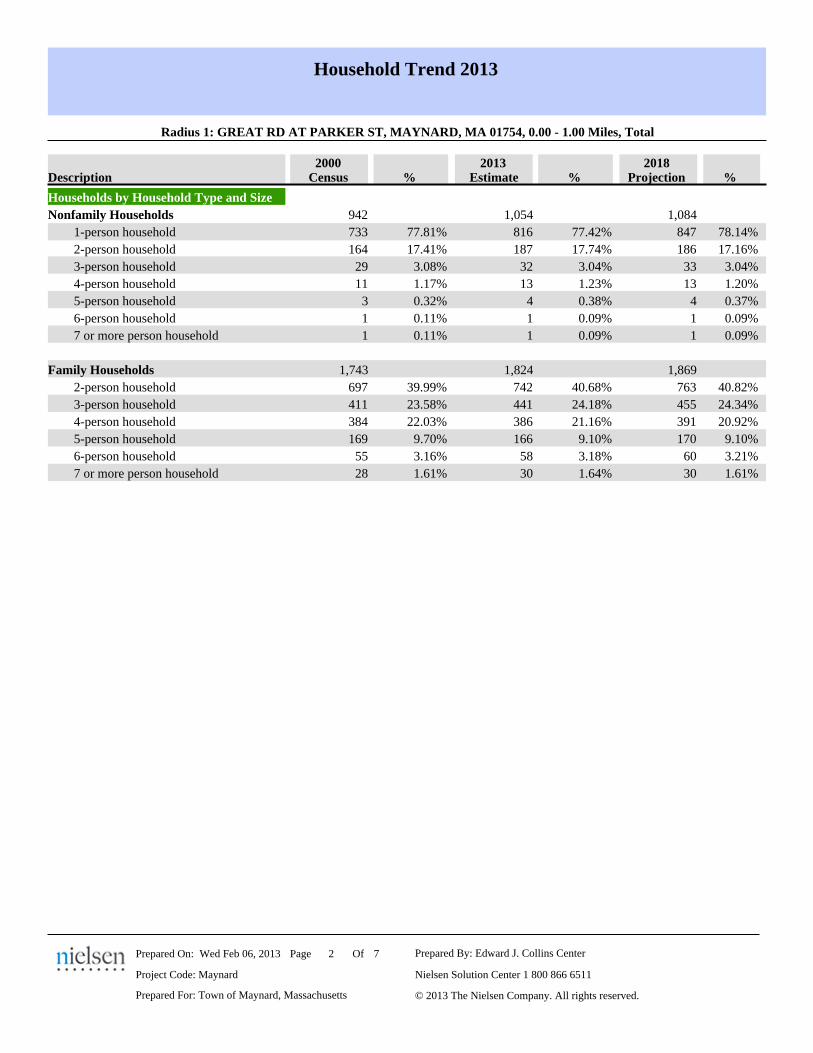
Household Trend 2013
Radius 1: GREAT RD AT PARKER ST, MAYNARD, MA 01754, 0.00 - 1.00 Miles, Total
%%201820132000
% ProjectionEstimateCensusDescription
Households by Household Type and Size
Nonfamily Households 1,084942 1,054
77.81% 77.42% 78.14% 1-person household 847733 816
17.41% 17.74% 17.16% 2-person household 186164 187
3.08% 3.04% 3.04% 3-person household 3329 32
1.17% 1.23% 1.20% 4-person household 1311 13
0.32% 0.38% 0.37% 5-person household 43 4
0.11% 0.09% 0.09% 6-person household 11 1
0.11% 0.09% 0.09% 7 or more person household 11 1
Family Households 1,8691,743 1,824
39.99% 40.68% 40.82% 2-person household 763697 742
23.58% 24.18% 24.34% 3-person household 455411 441
22.03% 21.16% 20.92% 4-person household 391384 386
9.70% 9.10% 9.10% 5-person household 170169 166
3.16% 3.18% 3.21% 6-person household 6055 58
1.61% 1.64% 1.61% 7 or more person household 3028 30
Nielsen Solution Center 1 800 866 6511
Prepared By: Edward J. Collins Center
Prepared For: Town of Maynard, Massachusetts
Project Code: Maynard
72 OfPage
© 2013 The Nielsen Company. All rights reserved.
Wed Feb 06, 2013Prepared On:
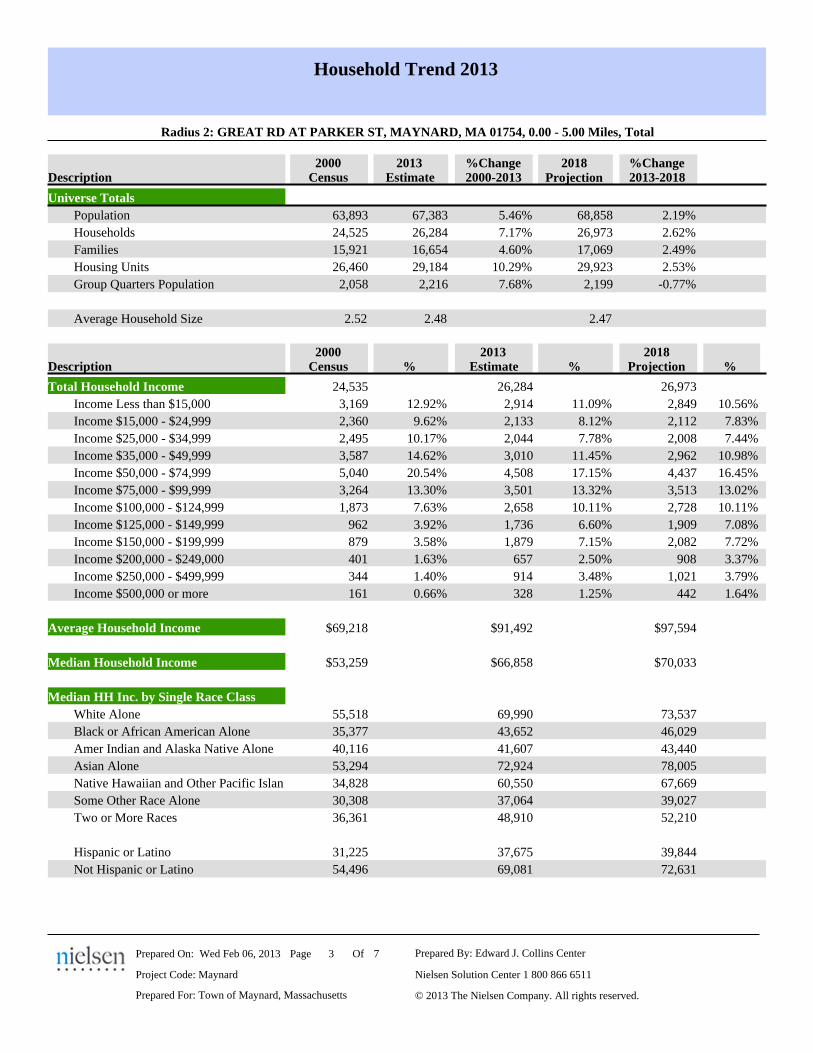
Household Trend 2013
Radius 2: GREAT RD AT PARKER ST, MAYNARD, MA 01754, 0.00 - 5.00 Miles, Total
2013-20182000-2013%Change
Description Census Estimate Projection
2000 2013 2018%Change
Universe Totals
Population 68,858 2.19%63,893 67,383 5.46%
Households 26,973 2.62%24,525 26,284 7.17%
Families 17,069 2.49%15,921 16,654 4.60%
Housing Units 29,923 2.53%26,460 29,184 10.29%
Group Quarters Population 2,199 -0.77%2,058 2,216 7.68%
Average Household Size 2.472.52 2.48
%%201820132000
% ProjectionEstimateCensusDescription
Total Household Income 26,97324,535 26,284
12.92% 11.09% 10.56% Income Less than $15,000 2,8493,169 2,914
9.62% 8.12% 7.83% Income $15,000 - $24,999 2,1122,360 2,133
10.17% 7.78% 7.44% Income $25,000 - $34,999 2,0082,495 2,044
14.62% 11.45% 10.98% Income $35,000 - $49,999 2,9623,587 3,010
20.54% 17.15% 16.45% Income $50,000 - $74,999 4,4375,040 4,508
13.30% 13.32% 13.02% Income $75,000 - $99,999 3,5133,264 3,501
7.63% 10.11% 10.11% Income $100,000 - $124,999 2,7281,873 2,658
3.92% 6.60% 7.08% Income $125,000 - $149,999 1,909962 1,736
3.58% 7.15% 7.72% Income $150,000 - $199,999 2,082879 1,879
1.63% 2.50% 3.37% Income $200,000 - $249,000 908401 657
1.40% 3.48% 3.79% Income $250,000 - $499,999 1,021344 914
0.66% 1.25% 1.64% Income $500,000 or more 442161 328
Average Household Income $97,594$69,218 $91,492
Median Household Income $70,033$53,259 $66,858
Median HH Inc. by Single Race Class
White Alone 73,53755,518 69,990
Black or African American Alone 46,02935,377 43,652
Amer Indian and Alaska Native Alone 43,44040,116 41,607
Asian Alone 78,00553,294 72,924
Native Hawaiian and Other Pacific Islan 67,66934,828 60,550
Some Other Race Alone 39,02730,308 37,064
Two or More Races 52,21036,361 48,910
Hispanic or Latino 39,84431,225 37,675
Not Hispanic or Latino 72,63154,496 69,081
Nielsen Solution Center 1 800 866 6511
Prepared By: Edward J. Collins Center
Prepared For: Town of Maynard, Massachusetts
Project Code: Maynard
73 OfPage
© 2013 The Nielsen Company. All rights reserved.
Wed Feb 06, 2013Prepared On:

Household Trend 2013
Radius 2: GREAT RD AT PARKER ST, MAYNARD, MA 01754, 0.00 - 5.00 Miles, Total
%%201820132000
% ProjectionEstimateCensusDescription
Households by Household Type and Size
Nonfamily Households 9,9048,604 9,630
77.86% 77.37% 78.14% 1-person household 7,7396,699 7,451
17.41% 17.77% 17.11% 2-person household 1,6951,498 1,711
3.05% 3.07% 3.01% 3-person household 298262 296
1.17% 1.24% 1.20% 4-person household 119101 119
0.34% 0.36% 0.36% 5-person household 3629 35
0.10% 0.10% 0.11% 6-person household 119 10
0.08% 0.07% 0.07% 7 or more person household 77 7
Family Households 17,06915,921 16,654
39.97% 40.71% 40.85% 2-person household 6,9736,363 6,780
23.56% 24.19% 24.34% 3-person household 4,1553,751 4,029
22.05% 21.16% 20.91% 4-person household 3,5693,511 3,524
9.69% 9.13% 9.09% 5-person household 1,5521,542 1,520
3.15% 3.18% 3.21% 6-person household 548502 529
1.58% 1.64% 1.59% 7 or more person household 272251 273
Nielsen Solution Center 1 800 866 6511
Prepared By: Edward J. Collins Center
Prepared For: Town of Maynard, Massachusetts
Project Code: Maynard
74 OfPage
© 2013 The Nielsen Company. All rights reserved.
Wed Feb 06, 2013Prepared On:

Household Trend 2013
Radius 3: GREAT RD AT PARKER ST, MAYNARD, MA 01754, 0.00 - 10.00 Miles, Total
2013-20182000-2013%Change
Description Census Estimate Projection
2000 2013 2018%Change
Universe Totals
Population 283,426 2.19%262,990 277,354 5.46%
Households 111,023 2.62%100,947 108,186 7.17%
Families 70,256 2.49%65,533 68,550 4.60%
Housing Units 123,167 2.53%108,913 120,122 10.29%
Group Quarters Population 9,050 -0.77%8,470 9,120 7.67%
Average Household Size 2.472.52 2.48
%%201820132000
% ProjectionEstimateCensusDescription
Total Household Income 111,023100,988 108,186
12.92% 11.09% 10.56% Income Less than $15,000 11,72613,045 11,995
9.62% 8.12% 7.83% Income $15,000 - $24,999 8,6949,713 8,780
10.17% 7.78% 7.45% Income $25,000 - $34,999 8,26610,268 8,414
14.62% 11.45% 10.98% Income $35,000 - $49,999 12,19014,763 12,391
20.54% 17.15% 16.45% Income $50,000 - $74,999 18,26420,744 18,557
13.30% 13.32% 13.03% Income $75,000 - $99,999 14,46213,435 14,410
7.63% 10.11% 10.12% Income $100,000 - $124,999 11,2307,708 10,939
3.92% 6.61% 7.08% Income $125,000 - $149,999 7,8603,961 7,147
3.58% 7.15% 7.72% Income $150,000 - $199,999 8,5723,620 7,735
1.63% 2.50% 3.37% Income $200,000 - $249,000 3,7361,651 2,706
1.40% 3.48% 3.79% Income $250,000 - $499,999 4,2041,417 3,764
0.66% 1.25% 1.64% Income $500,000 or more 1,821662 1,348
Average Household Income $97,594$69,218 $91,492
Median Household Income $70,033$53,259 $66,858
Median HH Inc. by Single Race Class
White Alone 73,53755,518 69,990
Black or African American Alone 46,02935,377 43,652
Amer Indian and Alaska Native Alone 43,44040,116 41,607
Asian Alone 78,00553,294 72,924
Native Hawaiian and Other Pacific Islan 67,66934,828 60,550
Some Other Race Alone 39,02730,308 37,064
Two or More Races 52,21036,361 48,910
Hispanic or Latino 39,84431,225 37,675
Not Hispanic or Latino 72,63154,496 69,081
Nielsen Solution Center 1 800 866 6511
Prepared By: Edward J. Collins Center
Prepared For: Town of Maynard, Massachusetts
Project Code: Maynard
75 OfPage
© 2013 The Nielsen Company. All rights reserved.
Wed Feb 06, 2013Prepared On:

Household Trend 2013
Radius 3: GREAT RD AT PARKER ST, MAYNARD, MA 01754, 0.00 - 10.00 Miles, Total
%%201820132000
% ProjectionEstimateCensusDescription
Households by Household Type and Size
Nonfamily Households 40,76735,414 39,636
77.86% 77.38% 78.13% 1-person household 31,85327,574 30,670
17.41% 17.77% 17.11% 2-person household 6,9766,165 7,043
3.04% 3.07% 3.01% 3-person household 1,2271,077 1,216
1.17% 1.23% 1.20% 4-person household 489414 488
0.34% 0.37% 0.36% 5-person household 148119 145
0.11% 0.11% 0.11% 6-person household 4439 43
0.08% 0.08% 0.07% 7 or more person household 3027 30
Family Households 70,25665,533 68,550
39.97% 40.71% 40.85% 2-person household 28,70126,192 27,906
23.56% 24.19% 24.34% 3-person household 17,10115,441 16,582
22.05% 21.16% 20.91% 4-person household 14,69214,451 14,504
9.69% 9.13% 9.10% 5-person household 6,3906,349 6,258
3.15% 3.18% 3.21% 6-person household 2,2552,065 2,178
1.58% 1.64% 1.59% 7 or more person household 1,1181,035 1,122
Nielsen Solution Center 1 800 866 6511
Prepared By: Edward J. Collins Center
Prepared For: Town of Maynard, Massachusetts
Project Code: Maynard
76 OfPage
© 2013 The Nielsen Company. All rights reserved.
Wed Feb 06, 2013Prepared On:

Household Trend 2013
Appendix: Area Listing
Radius Definition:
Designated Market AreaType: Radius 1 Reporting Detail: Aggregate Reporting Level:
Area Name:
MAYNARD, MA 01754 -Radius
Latitude/LongitudeGREAT RD AT PARKER ST
0.00 1.00
-71.44791542.422739
Radius Definition:
Designated Market AreaType: Radius 2 Reporting Detail: Aggregate Reporting Level:
Area Name:
MAYNARD, MA 01754 -Radius
Latitude/LongitudeGREAT RD AT PARKER ST
0.00 5.00
-71.44791542.422739
Radius Definition:
Designated Market AreaType: Radius 3 Reporting Detail: Aggregate Reporting Level:
Area Name:
MAYNARD, MA 01754 -Radius
Latitude/LongitudeGREAT RD AT PARKER ST
0.00 10.00
-71.44791542.422739
1
971542728
Project Information:
Order Number:
Site:
Nielsen Solution Center 1 800 866 6511
Prepared By: Edward J. Collins Center
Prepared For: Town of Maynard, Massachusetts
Project Code: Maynard
77 OfPage
© 2013 The Nielsen Company. All rights reserved.
Wed Feb 06, 2013Prepared On:

-B-1-
APPENDIX B: DETAILED COMMENTS ON BYLAW AMENDMENTS
(Proposed February 28, 2013)

-B-2-
THIS PAGE IS INTENTIONALLY BLANK

-B-3-
DETAILED COMMENTS REGARDING PROPOSED ZONING BY-LAW AMENDMENTS 9.3 Neighborhood Business Overlay District (NBOD)
Below are detailed comments prepared by the Collins Center in its review of the proposed Zoning Bylaw amendments, submitted to the Town of Maynard on February 28, 2013. Amendments proposed by the applicant are shown by strikeout where existing text is proposed for deletion or bold/underline where text is proposed for addition. 1. 9.3.2 Applicability. The NBOD is an overlay district superimposed over… Where any provision of
the NBOD is different than any provision elsewhere in the Protective Zoning District By-Laws, the provision of the NBOD shall control. The developer’s added sentence can be construed to read that if the NBOD is silent on a topic, that silence (i.e., difference) controls over other sections of the By Law that otherwise apply. Alternate language could be, “Where a provision(s) of the NBOD is in conflict with provisions elsewhere in the Protective Zoning District By-laws, the provision(s) of the NBOD shall control.” Since the Bylaw has requirements distributed throughout the document, one should be careful not to accidentally delete reference to an important provision.
2. Section 9.3.3 Requirement for Approval of a Concept Plan at Town Meeting.
#6. The general location and size of all required buffer areas provided in compliance with Section 6.1 9.3.11.3. There appears to be a scrivener’s error in the existing zoning. There are no buffering requirements in Section 6.1; the section establishes important parking requirements including dimensional and landscaping requirements. This submittal requirement but be revised as follows: 6. The general location and size of all parking required buffer areas provided in compliance with Section 6.1. Where the requirements for the number of spaces by use differs between the NBOD and Section 6.1, the NBOD shall control, as is provided for in Section 9.3.2 Applicability.
3. Section 9.3.3 Requirement for Approval of a Concept Plan at Town Meeting.
#11. A written proposal from Prior to the vote at Town Meeting on the Concept Plan, a Development Agreement shall be signed by the Board of Selectmen, Planning Board and the Property Owner (“Developer”) that addresses, but is not limited to, the following:
This revision is not consistent with Maynard’s practice on the prior proposal for 195 Parker Street where the agreement was signed after the Concept Plan was approved, but before the Site Plan Approval once all of the infrastructure and other technical studies had been completed.
4. Section 9.3.3 Requirement for Approval of a Concept Plan at Town Meeting.
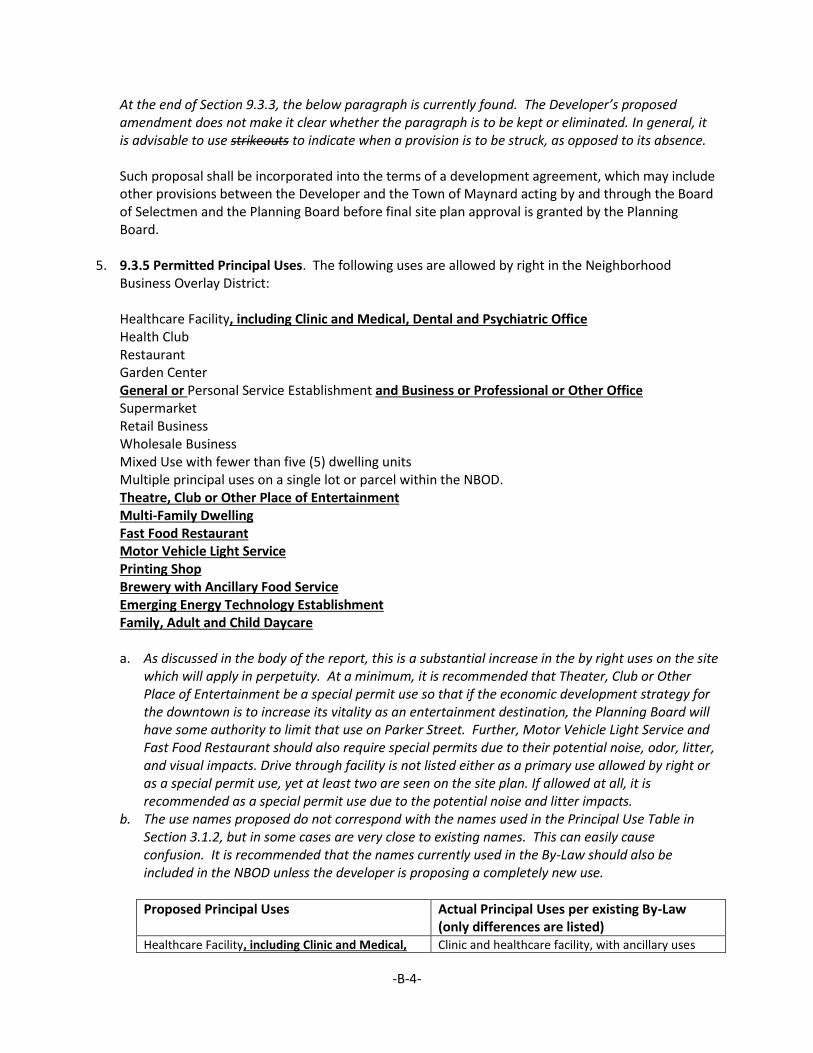
-B-4-
At the end of Section 9.3.3, the below paragraph is currently found. The Developer’s proposed amendment does not make it clear whether the paragraph is to be kept or eliminated. In general, it is advisable to use strikeouts to indicate when a provision is to be struck, as opposed to its absence. Such proposal shall be incorporated into the terms of a development agreement, which may include other provisions between the Developer and the Town of Maynard acting by and through the Board of Selectmen and the Planning Board before final site plan approval is granted by the Planning Board.
5. 9.3.5 Permitted Principal Uses. The following uses are allowed by right in the Neighborhood Business Overlay District:
Healthcare Facility, including Clinic and Medical, Dental and Psychiatric Office Health Club Restaurant Garden Center General or Personal Service Establishment and Business or Professional or Other Office Supermarket Retail Business Wholesale Business Mixed Use with fewer than five (5) dwelling units Multiple principal uses on a single lot or parcel within the NBOD. Theatre, Club or Other Place of Entertainment Multi-Family Dwelling Fast Food Restaurant Motor Vehicle Light Service Printing Shop Brewery with Ancillary Food Service Emerging Energy Technology Establishment Family, Adult and Child Daycare
a. As discussed in the body of the report, this is a substantial increase in the by right uses on the site
which will apply in perpetuity. At a minimum, it is recommended that Theater, Club or Other Place of Entertainment be a special permit use so that if the economic development strategy for the downtown is to increase its vitality as an entertainment destination, the Planning Board will have some authority to limit that use on Parker Street. Further, Motor Vehicle Light Service and Fast Food Restaurant should also require special permits due to their potential noise, odor, litter, and visual impacts. Drive through facility is not listed either as a primary use allowed by right or as a special permit use, yet at least two are seen on the site plan. If allowed at all, it is recommended as a special permit use due to the potential noise and litter impacts.
b. The use names proposed do not correspond with the names used in the Principal Use Table in Section 3.1.2, but in some cases are very close to existing names. This can easily cause confusion. It is recommended that the names currently used in the By-Law should also be included in the NBOD unless the developer is proposing a completely new use.
Proposed Principal Uses Actual Principal Uses per existing By-Law (only differences are listed)
Healthcare Facility, including Clinic and Medical, Clinic and healthcare facility, with ancillary uses

-B-5-
Dental and Psychiatric Office
Medical Office
Health Club
Restaurant Use table says “Restaurants or other food service uses not including fast food restaurants”, NBOD says “Restaurant”
Garden Center
General or Personal Service Establishment and Business or Professional or Other Office
General or personal service establishment
Business or professional office Supermarket Retail Business
Wholesale Business Use table says Wholesale Use, NBOD says Wholesale Business
Mixed Use with fewer than five (5) dwelling units
Multiple principal uses on a single lot or parcel within the NBOD
Theatre, Club or Other Place of Entertainment Theater, halls, clubs or other places of entertainment
Multi-Family Dwelling Multifamily dwelling
Fast Food Restaurant
Motor Vehicle Light Service
Printing Shop
Brewery with Ancillary Food Service
Emerging Energy Technology Establishment Emerging energy technology
Family, Adult and Child Daycare Child Care Center
Adult day care
Family day care home, small
Family day care home, large
c. Question should be asked regarding what type of day care is appropriate in the multi-story
buildings proposed by the developer and/or whether they should require a special permit, as well as the State licensing requirements should be reviewed.
6. 9.3.6 Permitted Accessory Uses
Section 9.3.6 is not listed in the amendment, which may be because it is not being modified but since so much of the NBOD is being modified, its absence raises question. It may be clearer to include the entire section as it exists, but use strikeouts to show deletions and bold/underline to show additions so that a section which is to remain unmodified will be shown as is.
7. 9.3.7 Uses Permitted by Special Permit of the Planning Board Multi-family Dwelling Elderly Housing and Assisted Living Parking Structures Mixed use with five (5) or more dwelling units

-B-6-
This issue is discussed in the body of the report. In addition, to align with the existing Use Table, the proposed new residential use would be “Health care/elderly housing, Assisted Living Residence”.
8. 9.3.8 Dimensional Requirements. Table G lists the dimensional requirements for each single principal use within the NBOD. Uses listed in Table G as “N/A” have no corresponding dimensional requirement, unless otherwise set forth in Section 9.3.
TABLE G: NBOD DIMENSIONAL REQUIREMENTS
Principal Use Maximum Gross Floor
Area Multi-Family Dwelling N/A Healthcare Facility N/A Health Club 30,000 s.f. Restaurant 10,000 s.f. Garden Center 25,000 s.f. Personal Services Establishment 5,000 s.f. Supermarket 75,000 s.f. Retail Business 35,000 s.f. Wholesale Business 35,000 s.f.
Principal Use Maximum Gross Floor Area
1. Multi-Family Dwelling and Garden Apartment and Elderly Housing and Assisted Living
325,000 s.f.
2. Retail Business and all other Permitted Principal Uses set forth in Section 9.3.5 other than 1. and 3. in this Table G a. No more than 1 structure b. No more than 2 structures c. No more than 2 structures d. No more than 3 structures
349,000 s.f. total calculated as follows:
152,000 s.f. 117,000 s.f. 14,000 s.f. 16,000 s.f.
3. Municipal Facility 55,000 s.f.
The Planning Board may issues a special permit to increase the square footage of any Principal Use by up to 5% of the Maximum Gross Floor Area in Table G above, without Town Meeting approval, except that no special permit shall be required if the developer increases a Principal Use by up to 15% if the developer reduces another Principal Use or Uses by the same square footage.
a. The policy questions relating to this section are discussed in the body of this report. b. The residential uses listed in the box do not align with the Use Table. c. A 15% shift in the largest structure represents 22,800 s.f, which is larger than several of the
proposed building on site and in the downtown. A 15% shift in residential uses is 48,750 s.f. This would mean the that Board could increase the gross square footage of the residential uses, but not the number of units which is regulated in Section 9.3.10. This section diminishes the ability of Town Meeting to guide development on the site.

-B-7-
9. 9.3.9 District Non-Residential Total. The total gross floor area for all principal uses within the NBOD, including nonresidential portions of the Mixed Use structures, excluding multifamily dwellings, healthcare facilities, and residential components of mixed use structures, shall not exceed 175,000 s.f. the corresponding Maximum Gross Floor Area set forth in Table G above except as otherwise set forth in Section 9.3.
It appears that the developer’s Table G should be moved to this section to establish the allowable size of the buildings and the total non-residential square footage as it no longer has use to establish size thresholds for the different primary uses.
10. 9.3.10 Housing Cap. The maximum number of housing units in the NBOD shall not exceed one-
hundred (100) two hundred fifty (250). The Board of Selectmen may issue a special permit to increase the number of housing units by 5% without Town Meeting approval.
This would allow another 12 units to be built without Town Meeting approval. Elsewhere in town, that would be a substantial housing development.
11. 9.3.11 Design Criteria.
Setbacks/Buffers. For the construction of any new building, a setback area of one-hundred (100) feet shall be provided at the perimeter of any lot or parcel in the NBOD where it abuts the property line of any residentially zoned or occupied properties, front and rear setback areas of at least fifty (50) feet and side setback area of at least forty (40) feet shall be provided at the perimeter of the NBOD development where it abuts the property line of any residentially zoned properties and twenty (20) feet where it abuts open space zoned properties, except for fences twelve (12) feet in height or less and driveways necessary for access and egress to and from the new building(s); provided, however, that existing structures and existing access roadways and paved areas are exempt from this requirement. Notwithstanding the preceding, existing structures and paved areas shall not be made more non-conforming except for American (sic) with Disabilities Act (ADA) compliance. A buffer area of forty-five (45) no less than twenty (20) feet shall be provided where the property line of any land within the NBOD perimeter of the NBOD development is contiguous to the property line of another lot within an existing residential district. The buffer shall be landscaped and screened by way of fences, walls, and/or plantings (including existing vegetation and trees) to reasonably and substantially shield abutting land from parking and loading areas and buildings. Any such fences or walls may, in the reasonable determination of the Planning Board, provide openings to allow safe pedestrian access and egress between the development site and the adjacent neighborhood. The Collins Center believes that revisions to the site plan for the 58 acre site could be made so that the existing setback and buffer requirements. See comments in Concept Plan Review section of the main document.
12. 9.3.11.4 Parking. Required parking shall be four (4) one (1) spaces per one thousand (1,000) three hundred (300) square feet of gross floor area for office, retail and supermarket uses and all other allowed uses not setforth herein. For outdoor sales and display areas of a Garden Center use, required parking shall be one (1) space per three thousand (3,000) square feet of outside merchandise display area. For all other allowed uses, the parking requirement for such use shall be in accordance with the schedule or parking uses set forth in Section 6.1 of this By-law. For multi-

-B-8-
family and other dwelling units, required parking shall be 1.75 spaces per unit. For all restaurant uses, required parking shall be one (1) space per eighty-five (85) square feet of gross floor area. For warehouse uses, required parking shall be one (1) space per twenty-five hundred square feet of gross floor area. Relief from these parking standards may be granted by special permit by the Planning Board.
Demand for parking will be analyzed as part of the traffic peer review. See comments in the Concept Plan Review section of the main document.
13. 9.3.11.5. Dimensional Requirements. The minimum dimensional requirements of a NBOD
development shall be an area of 15,000 s.f.; 100 feet of frontage and 100 feet in width; total maximum building coverage 35% of the NBOD development; maximum building height of fifty-two feet for residential uses and forty (40) feet for any other uses within the NBOD; minimum landscape open area of 20% of the NBOD development; and minimum landscape open area of 5% in the front yard of the NBOD development. a. This section reduces the lot size and frontage requirements that currently apply to the property
through the underlying I District zoning. However, since only three proposed buildings front on Parker Street, subdivision options are limited. The internal access roads do not constitute “frontage”.
b. The proposed 5% minimum front yard landscaping is a 50% reduction in the current I District requirement of 10% and is not recommended given the proximity to the homes on the opposite side of Parker Street.
c. The proposed 20% minimum landscape open area is a 33% reduction in the current I District requirement of 30% and warrants significant discussion given the site’s large size, and proximity to residential homes, wetlands, and the School Woods.
d. The height requirements warrant considerable discussion as height would be needed to create vertically mixed use and thereby reduce building footprint and increase open space, yet the site is surrounded by sensitive uses including residential uses and wetlands.
14. 9.3.12 Site Plan Approval. The provisions of Section 10.5, Site Plan Approval, shall apply to uses,
buildings and structures permitted by right or by Special Permit in the NBOD.
1. All new development pursuant to the NBOD shall be subject to Site Plan Approval from the Planning Board. The Planning Board may not issue such Approval unless the proposed Site Plan substantially does not conforms to the Concept Plan approved by the Town Meeting. The Planning Board may permit minor modifications to the proposed development in connection with its site plan review, provided that the Planning Board finds, in its reasonable discretion and in writing, that any such modifications do not substantially and materially conflict with the general intent of the Concept Plan as approved.
This appears to turn the relationship between the developer and the Planning Board upside down. Instead of the developer proving to the Planning Board that the Site Plan conforms with the Concept Plan, the Planning Board must show why it does not.