table statistics
TRANSCRIPT

8/11/2019 Table Statistics
http://slidepdf.com/reader/full/table-statistics 1/25
Appendix A
StatisticalTables and
Charts
651

8/11/2019 Table Statistics
http://slidepdf.com/reader/full/table-statistics 2/25
652 APPENDIX A STATISTICAL TABLES AND CHARTS
Table I Summary of Common Probability Distributions
Probability Section Name Distribution Mean Variance in Book
Discrete
Uniform 3-5
Binomial np 3-6
Geometric 3-7.1
Negative binomial 3-7.2
Hypergeometric np, 3-8
Poisson 3-9
Continuous
Uniform 4-5
Normal 2 4-6
Exponential 4-8
Erlang 4-9.1
Gamma 4-9.2
Weibull 4-10
Lognormal 4-11e221e2
12 e2 21
x2 2expa 3 ln1 x2 42
22 b
2 c a1 1
b d 20 x, 0 , 0
2 a1 2
b a1
1
b
a x
b 1
e1 x 2 ,
r 2r xr 1e x
1r 2 , 0 x, 0 r , 0
r 2r
r xr 1e x
1r 12 ! , 0 x, r 1, 2, . . .
1 21 e x, 0 x, 0
x , , 0
1
1 2
e1 2 1 x
2 2
1b a 2 212
1b a 2 2
1
b a, a x b
e
x
x!, x 0, 1, 2, . . . , 0
min1 K , n2 , K N , n N
x max10, n N K 2 , 1, . . .
where p K
N
np11 p 2 a N n
N 1ba
K
x b a N K
n x ba N
nb
x r , r 1, r 2, . . . , 0 p 1
r 11 p 2 p2r pa x 1
r 1b 11 p 2 xr pr
x 1, 2, . . . , 0 p 1
11 p 2 p21 p11 p 2 x1 p,
x 0, 1, . . . , n, 0 p 1
np11 p 2 an
xb p x11 p 2 n x,
1b a 12 2 1121b a 2 2
1n
, a b

8/11/2019 Table Statistics
http://slidepdf.com/reader/full/table-statistics 3/25
APPENDIX A 653
Table II Cumulative Standard Normal Distribution
z 0.09 0.08 0.07 0.06 0.05 0.04 0.03 0.02 0.01 0.00
3.9 0.000033 0.000034 0.000036 0.000037 0.000039 0.000041 0.000042 0.000044 0.000046 0.000048
3.8 0.000050 0.000052 0.000054 0.000057 0.000059 0.000062 0.000064 0.000067 0.000069 0.000072
3.7 0.000075 0.000078 0.000082 0.000085 0.000088 0.000092 0.000096 0.000100 0.000104 0.000108
3.6 0.000112 0.000117 0.000121 0.000126 0.000131 0.000136 0.000142 0.000147 0.000153 0.000159
3.5 0.000165 0.000172 0.000179 0.000185 0.000193 0.000200 0.000208 0.000216 0.000224 0.000233
3.4 0.000242 0.000251 0.000260 0.000270 0.000280 0.000291 0.000302 0.000313 0.000325 0.000337
3.3 0.000350 0.000362 0.000376 0.000390 0.000404 0.000419 0.000434 0.000450 0.000467 0.000483
3.2 0.000501 0.000519 0.000538 0.000557 0.000577 0.000598 0.000619 0.000641 0.000664 0.000687
3.1 0.000711 0.000736 0.000762 0.000789 0.000816 0.000845 0.000874 0.000904 0.000935 0.000968
3.0 0.001001 0.001035 0.001070 0.001107 0.001144 0.001183 0.001223 0.001264 0.001306 0.001350
2.9 0.001395 0.001441 0.001489 0.001538 0.001589 0.001641 0.001695 0.001750 0.001807 0.001866
2.8 0.001926 0.001988 0.002052 0.002118 0.002186 0.002256 0.002327 0.002401 0.002477 0.002555
2.7 0.002635 0.002718 0.002803 0.002890 0.002980 0.003072 0.003167 0.003264 0.003364 0.003467
2.6 0.003573 0.003681 0.003793 0.003907 0.004025 0.004145 0.004269 0.004396 0.004527 0.004661
2.5 0.004799 0.004940 0.005085 0.005234 0.005386 0.005543 0.005703 0.005868 0.006037 0.006210
2.4 0.006387 0.006569 0.006756 0.006947 0.007143 0.007344 0.007549 0.007760 0.007976 0.008198
2.3 0.008424 0.008656 0.008894 0.009137 0.009387 0.009642 0.009903 0.010170 0.010444 0.010724
2.2 0.011011 0.011304 0.011604 0.011911 0.012224 0.012545 0.012874 0.013209 0.013553 0.013903
2.1 0.014262 0.014629 0.015003 0.015386 0.015778 0.016177 0.016586 0.017003 0.017429 0.0178642.0 0.018309 0.018763 0.019226 0.019699 0.020182 0.020675 0.021178 0.021692 0.022216 0.022750
1.9 0.023295 0.023852 0.024419 0.024998 0.025588 0.026190 0.026803 0.027429 0.028067 0.028717
1.8 0.029379 0.030054 0.030742 0.031443 0.032157 0.032884 0.033625 0.034379 0.035148 0.035930
1.7 0.036727 0.037538 0.038364 0.039204 0.040059 0.040929 0.041815 0.042716 0.043633 0.044565
1.6 0.045514 0.046479 0.047460 0.048457 0.049471 0.050503 0.051551 0.052616 0.053699 0.054799
1.5 0.055917 0.057053 0.058208 0.059380 0.060571 0.061780 0.063008 0.064256 0.065522 0.066807
1.4 0.068112 0.069437 0.070781 0.072145 0.073529 0.074934 0.076359 0.077804 0.079270 0.080757
1.3 0.082264 0.083793 0.085343 0.086915 0.088508 0.090123 0.091759 0.093418 0.095098 0.096801
1.2 0.098525 0.100273 0.102042 0.103835 0.105650 0.107488 0.109349 0.111233 0.113140 0.115070
1.1 0.117023 0.119000 0.121001 0.123024 0.125072 0.127143 0.129238 0.131357 0.133500 0.135666
1.0 0.137857 0.140071 0.142310 0.144572 0.146859 0.149170 0.151505 0.153864 0.156248 0.158655
0.9 0.161087 0.163543 0.166023 0.168528 0.171056 0.173609 0.176185 0.178786 0.181411 0.184060
0.8 0.186733 0.189430 0.192150 0.194894 0.197662 0.200454 0.203269 0.206108 0.208970 0.2118550.7 0.214764 0.217695 0.220650 0.223627 0.226627 0.229650 0.232695 0.235762 0.238852 0.241964
0.6 0.245097 0.248252 0.251429 0.254627 0.257846 0.261086 0.264347 0.267629 0.270931 0.274253
0.5 0.277595 0.280957 0.284339 0.287740 0.291160 0.294599 0.298056 0.301532 0.305026 0.308538
0.4 0.312067 0.315614 0.319178 0.322758 0.326355 0.329969 0.333598 0.337243 0.340903 0.344578
0.3 0.348268 0.351973 0.355691 0.359424 0.363169 0.366928 0.370700 0.374484 0.378281 0.382089
0.2 0.385908 0.389739 0.393580 0.397432 0.401294 0.405165 0.409046 0.412936 0.416834 0.420740
0.1 0.424655 0.428576 0.432505 0.436441 0.440382 0.444330 0.448283 0.452242 0.456205 0.460172
0.0 0.464144 0.468119 0.472097 0.476078 0.480061 0.484047 0.488033 0.492022 0.496011 0.500000
z 0
(z)
1 z 2 P 1Z z 2 z
1
2 2e
12
u2
du

8/11/2019 Table Statistics
http://slidepdf.com/reader/full/table-statistics 4/25
654 APPENDIX A STATISTICAL TABLES AND CHARTS
Table II Cumulative Standard Normal Distribution (continued)
z 0.00 0.01 0.02 0.03 0.04 0.05 0.06 0.07 0.08 0.09
0.0 0.500000 0.503989 0.507978 0.511967 0.515953 0.519939 0.532922 0.527903 0.531881 0.535856
0.1 0.539828 0.543795 0.547758 0.551717 0.555760 0.559618 0.563559 0.567495 0.571424 0.575345
0.2 0.579260 0.583166 0.587064 0.590954 0.594835 0.598706 0.602568 0.606420 0.610261 0.614092
0.3 0.617911 0.621719 0.625516 0.629300 0.633072 0.636831 0.640576 0.644309 0.648027 0.651732
0.4 0.655422 0.659097 0.662757 0.666402 0.670031 0.673645 0.677242 0.680822 0.684386 0.687933
0.5 0.691462 0.694974 0.698468 0.701944 0.705401 0.708840 0.712260 0.715661 0.719043 0.722405
0.6 0.725747 0.729069 0.732371 0.735653 0.738914 0.742154 0.745373 0.748571 0.751748 0.754903
0.7 0.758036 0.761148 0.764238 0.767305 0.770350 0.773373 0.776373 0.779350 0.782305 0.785236
0.8 0.788145 0.791030 0.793892 0.796731 0.799546 0.802338 0.805106 0.807850 0.810570 0.813267
0.9 0.815940 0.818589 0.821214 0.823815 0.826391 0.828944 0.831472 0.833977 0.836457 0.838913
1.0 0.841345 0.843752 0.846136 0.848495 0.850830 0.853141 0.855428 0.857690 0.859929 0.862143
1.1 0.864334 0.866500 0.868643 0.870762 0.872857 0.874928 0.876976 0.878999 0.881000 0.882977
1.2 0.884930 0.886860 0.888767 0.890651 0.892512 0.894350 0.896165 0.897958 0.899727 0.901475
1.3 0.903199 0.904902 0.906582 0.908241 0.909877 0.911492 0.913085 0.914657 0.916207 0.917736
1.4 0.919243 0.920730 0.922196 0.923641 0.925066 0.926471 0.927855 0.929219 0.930563 0.931888
1.5 0.933193 0.934478 0.935744 0.936992 0.938220 0.939429 0.940620 0.941792 0.942947 0.944083
1.6 0.945201 0.946301 0.947384 0.948449 0.949497 0.950529 0.951543 0.952540 0.953521 0.954486
1.7 0.955435 0.956367 0.957284 0.958185 0.959071 0.959941 0.960796 0.961636 0.962462 0.963273
1.8 0.964070 0.964852 0.965621 0.966375 0.967116 0.967843 0.968557 0.969258 0.969946 0.9706211.9 0.971283 0.971933 0.972571 0.973197 0.973810 0.974412 0.975002 0.975581 0.976148 0.976705
2.0 0.977250 0.977784 0.978308 0.978822 0.979325 0.979818 0.980301 0.980774 0.981237 0.981691
2.1 0.982136 0.982571 0.982997 0.983414 0.983823 0.984222 0.984614 0.984997 0.985371 0.985738
2.2 0.986097 0.986447 0.986791 0.987126 0.987455 0.987776 0.988089 0.988396 0.988696 0.988989
2.3 0.989276 0.989556 0.989830 0.990097 0.990358 0.990613 0.990863 0.991106 0.991344 0.991576
2.4 0.991802 0.992024 0.992240 0.992451 0.992656 0.992857 0.993053 0.993244 0.993431 0.993613
2.5 0.993790 0.993963 0.994132 0.994297 0.994457 0.994614 0.994766 0.994915 0.995060 0.995201
2.6 0.995339 0.995473 0.995604 0.995731 0.995855 0.995975 0.996093 0.996207 0.996319 0.996427
2.7 0.996533 0.996636 0.996736 0.996833 0.996928 0.997020 0.997110 0.997197 0.997282 0.997365
2.8 0.997445 0.997523 0.997599 0.997673 0.997744 0.997814 0.997882 0.997948 0.998012 0.998074
2.9 0.998134 0.998193 0.998250 0.998305 0.998359 0.998411 0.998462 0.998511 0.998559 0.998605
3.0 0.998650 0.998694 0.998736 0.998777 0.998817 0.998856 0.998893 0.998930 0.998965 0.998999
3.1 0.999032 0.999065 0.999096 0.999126 0.999155 0.999184 0.999211 0.999238 0.999264 0.9992893.2 0.999313 0.999336 0.999359 0.999381 0.999402 0.999423 0.999443 0.999462 0.999481 0.999499
3.3 0.999517 0.999533 0.999550 0.999566 0.999581 0.999596 0.999610 0.999624 0.999638 0.999650
3.4 0.999663 0.999675 0.999687 0.999698 0.999709 0.999720 0.999730 0.999740 0.999749 0.999758
3.5 0.999767 0.999776 0.999784 0.999792 0.999800 0.999807 0.999815 0.999821 0.999828 0.999835
3.6 0.999841 0.999847 0.999853 0.999858 0.999864 0.999869 0.999874 0.999879 0.999883 0.999888
3.7 0.999892 0.999896 0.999900 0.999904 0.999908 0.999912 0.999915 0.999918 0.999922 0.999925
3.8 0.999928 0.999931 0.999933 0.999936 0.999938 0.999941 0.999943 0.999946 0.999948 0.999950
3.9 0.999952 0.999954 0.999956 0.999958 0.999959 0.999961 0.999963 0.999964 0.999966 0.999967
z0
Φ (z)
1 z 2 P 1Z z 2 z
1
2 2e
12
u2
du
8/11/2019 Table Statistics
http://slidepdf.com/reader/full/table-statistics 5/25
APPENDIX A 655
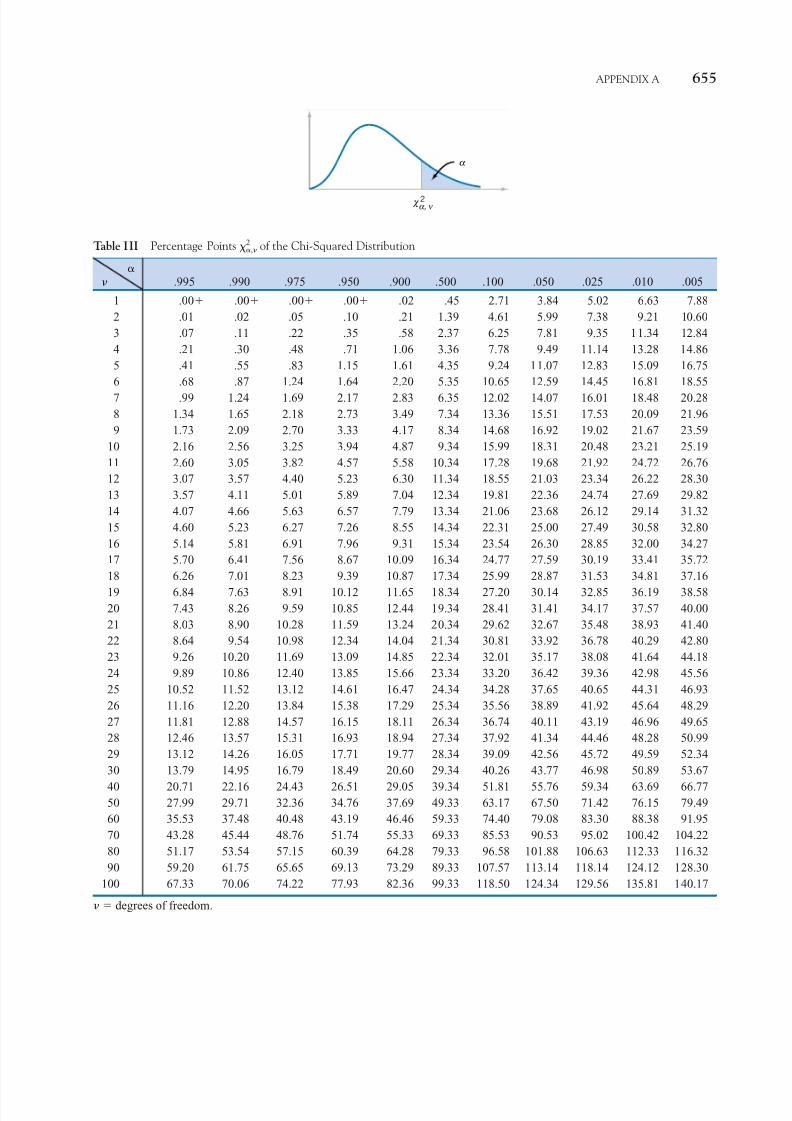
Table III Percentage Points 2, of the Chi-Squared Distribution
.995 .990 .975 .950 .900 .500 .100 .050 .025 .010 .005
1 .00 .00 .00 .00 .02 .45 2.71 3.84 5.02 6.63 7.88
2 .01 .02 .05 .10 .21 1.39 4.61 5.99 7.38 9.21 10.60
3 .07 .11 .22 .35 .58 2.37 6.25 7.81 9.35 11.34 12.84
4 .21 .30 .48 .71 1.06 3.36 7.78 9.49 11.14 13.28 14.86
5 .41 .55 .83 1.15 1.61 4.35 9.24 11.07 12.83 15.09 16.75
6 .68 .87 1.24 1.64 2.20 5.35 10.65 12.59 14.45 16.81 18.55
7 .99 1.24 1.69 2.17 2.83 6.35 12.02 14.07 16.01 18.48 20.28
8 1.34 1.65 2.18 2.73 3.49 7.34 13.36 15.51 17.53 20.09 21.96
9 1.73 2.09 2.70 3.33 4.17 8.34 14.68 16.92 19.02 21.67 23.59
10 2.16 2.56 3.25 3.94 4.87 9.34 15.99 18.31 20.48 23.21 25.19
11 2.60 3.05 3.82 4.57 5.58 10.34 17.28 19.68 21.92 24.72 26.76
12 3.07 3.57 4.40 5.23 6.30 11.34 18.55 21.03 23.34 26.22 28.30
13 3.57 4.11 5.01 5.89 7.04 12.34 19.81 22.36 24.74 27.69 29.82
14 4.07 4.66 5.63 6.57 7.79 13.34 21.06 23.68 26.12 29.14 31.32
15 4.60 5.23 6.27 7.26 8.55 14.34 22.31 25.00 27.49 30.58 32.80
16 5.14 5.81 6.91 7.96 9.31 15.34 23.54 26.30 28.85 32.00 34.27
17 5.70 6.41 7.56 8.67 10.09 16.34 24.77 27.59 30.19 33.41 35.72
18 6.26 7.01 8.23 9.39 10.87 17.34 25.99 28.87 31.53 34.81 37.16
19 6.84 7.63 8.91 10.12 11.65 18.34 27.20 30.14 32.85 36.19 38.58
20 7.43 8.26 9.59 10.85 12.44 19.34 28.41 31.41 34.17 37.57 40.00
21 8.03 8.90 10.28 11.59 13.24 20.34 29.62 32.67 35.48 38.93 41.40
22 8.64 9.54 10.98 12.34 14.04 21.34 30.81 33.92 36.78 40.29 42.80
23 9.26 10.20 11.69 13.09 14.85 22.34 32.01 35.17 38.08 41.64 44.18
24 9.89 10.86 12.40 13.85 15.66 23.34 33.20 36.42 39.36 42.98 45.56
25 10.52 11.52 13.12 14.61 16.47 24.34 34.28 37.65 40.65 44.31 46.93
26 11.16 12.20 13.84 15.38 17.29 25.34 35.56 38.89 41.92 45.64 48.29
27 11.81 12.88 14.57 16.15 18.11 26.34 36.74 40.11 43.19 46.96 49.65
28 12.46 13.57 15.31 16.93 18.94 27.34 37.92 41.34 44.46 48.28 50.99
29 13.12 14.26 16.05 17.71 19.77 28.34 39.09 42.56 45.72 49.59 52.34
30 13.79 14.95 16.79 18.49 20.60 29.34 40.26 43.77 46.98 50.89 53.67
40 20.71 22.16 24.43 26.51 29.05 39.34 51.81 55.76 59.34 63.69 66.7750 27.99 29.71 32.36 34.76 37.69 49.33 63.17 67.50 71.42 76.15 79.49
60 35.53 37.48 40.48 43.19 46.46 59.33 74.40 79.08 83.30 88.38 91.95
70 43.28 45.44 48.76 51.74 55.33 69.33 85.53 90.53 95.02 100.42 104.22
80 51.17 53.54 57.15 60.39 64.28 79.33 96.58 101.88 106.63 112.33 116.32
90 59.20 61.75 65.65 69.13 73.29 89.33 107.57 113.14 118.14 124.12 128.30
100 67.33 70.06 74.22 77.93 82.36 99.33 118.50 124.34 129.56 135.81 140.17
degrees of freedom.
χ α, ν 2
α
8/11/2019 Table Statistics
http://slidepdf.com/reader/full/table-statistics 6/25
656 APPENDIX A STATISTICAL TABLES AND CHARTS
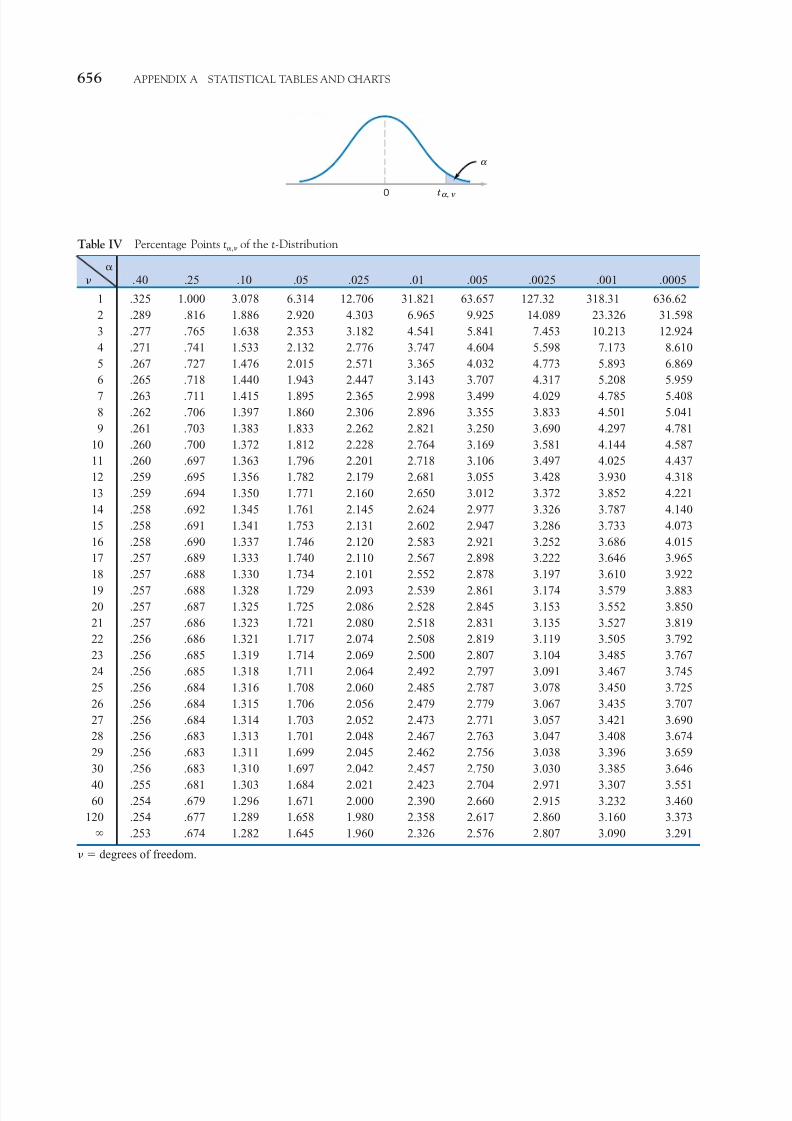
Table IV Percentage Points t, of the t-Distribution
.40 .25 .10 .05 .025 .01 .005 .0025 .001 .0005
1 .325 1.000 3.078 6.314 12.706 31.821 63.657 127.32 318.31 636.62
2 .289 .816 1.886 2.920 4.303 6.965 9.925 14.089 23.326 31.598
3 .277 .765 1.638 2.353 3.182 4.541 5.841 7.453 10.213 12.924
4 .271 .741 1.533 2.132 2.776 3.747 4.604 5.598 7.173 8.610
5 .267 .727 1.476 2.015 2.571 3.365 4.032 4.773 5.893 6.869
6 .265 .718 1.440 1.943 2.447 3.143 3.707 4.317 5.208 5.959
7 .263 .711 1.415 1.895 2.365 2.998 3.499 4.029 4.785 5.408
8 .262 .706 1.397 1.860 2.306 2.896 3.355 3.833 4.501 5.041
9 .261 .703 1.383 1.833 2.262 2.821 3.250 3.690 4.297 4.781
10 .260 .700 1.372 1.812 2.228 2.764 3.169 3.581 4.144 4.587
11 .260 .697 1.363 1.796 2.201 2.718 3.106 3.497 4.025 4.437
12 .259 .695 1.356 1.782 2.179 2.681 3.055 3.428 3.930 4.318
13 .259 .694 1.350 1.771 2.160 2.650 3.012 3.372 3.852 4.221
14 .258 .692 1.345 1.761 2.145 2.624 2.977 3.326 3.787 4.140
15 .258 .691 1.341 1.753 2.131 2.602 2.947 3.286 3.733 4.073
16 .258 .690 1.337 1.746 2.120 2.583 2.921 3.252 3.686 4.015
17 .257 .689 1.333 1.740 2.110 2.567 2.898 3.222 3.646 3.965
18 .257 .688 1.330 1.734 2.101 2.552 2.878 3.197 3.610 3.922
19 .257 .688 1.328 1.729 2.093 2.539 2.861 3.174 3.579 3.88320 .257 .687 1.325 1.725 2.086 2.528 2.845 3.153 3.552 3.850
21 .257 .686 1.323 1.721 2.080 2.518 2.831 3.135 3.527 3.819
22 .256 .686 1.321 1.717 2.074 2.508 2.819 3.119 3.505 3.792
23 .256 .685 1.319 1.714 2.069 2.500 2.807 3.104 3.485 3.767
24 .256 .685 1.318 1.711 2.064 2.492 2.797 3.091 3.467 3.745
25 .256 .684 1.316 1.708 2.060 2.485 2.787 3.078 3.450 3.725
26 .256 .684 1.315 1.706 2.056 2.479 2.779 3.067 3.435 3.707
27 .256 .684 1.314 1.703 2.052 2.473 2.771 3.057 3.421 3.690
28 .256 .683 1.313 1.701 2.048 2.467 2.763 3.047 3.408 3.674
29 .256 .683 1.311 1.699 2.045 2.462 2.756 3.038 3.396 3.659
30 .256 .683 1.310 1.697 2.042 2.457 2.750 3.030 3.385 3.646
40 .255 .681 1.303 1.684 2.021 2.423 2.704 2.971 3.307 3.55160 .254 .679 1.296 1.671 2.000 2.390 2.660 2.915 3.232 3.460
120 .254 .677 1.289 1.658 1.980 2.358 2.617 2.860 3.160 3.373
.253 .674 1.282 1.645 1.960 2.326 2.576 2.807 3.090 3.291
degrees of freedom.
0
α
α, ν t

8/11/2019 Table Statistics
http://slidepdf.com/reader/full/table-statistics 7/25
Table V Percentage Points f ,v1 ,v2of the F-Distribution
f 0.25,v1,v2
Degrees of freedom for the numerator (v
1)1 2 3 4 5 6 7 8 9 10 12 15 20 24 30 40 60 120
1 5.83 7.50 8.20 8.58 8.82 8.98 9.10 9.19 9.26 9.32 9.41 9.49 9.58 9.63 9.67 9.71 9.76 9.80 9.85
2 2.57 3.00 3.15 3.23 3.28 3.31 3.34 3.35 3.37 3.38 3.39 3.41 3.43 3.43 3.44 3.45 3.46 3.47 3.48
3 2.02 2.28 2.36 2.39 2.41 2.42 2.43 2.44 2.44 2.44 2.45 2.46 2.46 2.46 2.47 2.47 2.47 2.47 2.47
4 1.81 2.00 2.05 2.06 2.07 2.08 2.08 2.08 2.08 2.08 2.08 2.08 2.08 2.08 2.08 2.08 2.08 2.08 2.08
5 1.69 1.85 1.88 1.89 1.89 1.89 1.89 1.89 1.89 1.89 1.89 1.89 1.88 1.88 1.88 1.88 1.87 1.87 1.87
6 1.62 1.76 1.78 1.79 1.79 1.78 1.78 1.78 1.77 1.77 1.77 1.76 1.76 1.75 1.75 1.75 1.74 1.74 1.74
7 1.57 1.70 1.72 1.72 1.71 1.71 1.70 1.70 1.70 1.69 1.68 1.68 1.67 1.67 1.66 1.66 1.65 1.65 1.65
8 1.54 1.66 1.67 1.66 1.66 1.65 1.64 1.64 1.63 1.63 1.62 1.62 1.61 1.60 1.60 1.59 1.59 1.58 1.58
9 1.51 1.62 1.63 1.63 1.62 1.61 1.60 1.60 1.59 1.59 1.58 1.57 1.56 1.56 1.55 1.54 1.54 1.53 1.53
10 1.49 1.60 1.60 1.59 1.59 1.58 1.57 1.56 1.56 1.55 1.54 1.53 1.52 1.52 1.51 1.51 1.50 1.49 1.48
11 1.47 1.58 1.58 1.57 1.56 1.55 1.54 1.53 1.53 1.52 1.51 1.50 1.49 1.49 1.48 1.47 1.47 1.46 1.45
12 1.46 1.56 1.56 1.55 1.54 1.53 1.52 1.51 1.51 1.50 1.49 1.48 1.47 1.46 1.45 1.45 1.44 1.43 1.42
13 1.45 1.55 1.55 1.53 1.52 1.51 1.50 1.49 1.49 1.48 1.47 1.46 1.45 1.44 1.43 1.42 1.42 1.41 1.40
14 1.44 1.53 1.53 1.52 1.51 1.50 1.49 1.48 1.47 1.46 1.45 1.44 1.43 1.42 1.41 1.41 1.40 1.39 1.38
15 1.43 1.52 1.52 1.51 1.49 1.48 1.47 1.46 1.46 1.45 1.44 1.43 1.41 1.41 1.40 1.39 1.38 1.37 1.36
16 1.42 1.51 1.51 1.50 1.48 1.47 1.46 1.45 1.44 1.44 1.43 1.41 1.40 1.39 1.38 1.37 1.36 1.35 1.34
17 1.42 1.51 1.50 1.49 1.47 1.46 1.45 1.44 1.43 1.43 1.41 1.40 1.39 1.38 1.37 1.36 1.35 1.34 1.33
18 1.41 1.50 1.49 1.48 1.46 1.45 1.44 1.43 1.42 1.42 1.40 1.39 1.38 1.37 1.36 1.35 1.34 1.33 1.32
19 1.41 1.49 1.49 1.47 1.46 1.44 1.43 1.42 1.41 1.41 1.40 1.38 1.37 1.36 1.35 1.34 1.33 1.32 1.30
20 1.40 1.49 1.48 1.47 1.45 1.44 1.43 1.42 1.41 1.40 1.39 1.37 1.36 1.35 1.34 1.33 1.32 1.31 1.29
21 1.40 1.48 1.48 1.46 1.44 1.43 1.42 1.41 1.40 1.39 1.38 1.37 1.35 1.34 1.33 1.32 1.31 1.30 1.28
22 1.40 1.48 1.47 1.45 1.44 1.42 1.41 1.40 1.39 1.39 1.37 1.36 1.34 1.33 1.32 1.31 1.30 1.29 1.28
23 1.39 1.47 1.47 1.45 1.43 1.42 1.41 1.40 1.39 1.38 1.37 1.35 1.34 1.33 1.32 1.31 1.30 1.28 1.27
24 1.39 1.47 1.46 1.44 1.43 1.41 1.40 1.39 1.38 1.38 1.36 1.35 1.33 1.32 1.31 1.30 1.29 1.28 1.26
25 1.39 1.47 1.46 1.44 1.42 1.41 1.40 1.39 1.38 1.37 1.36 1.34 1.33 1.32 1.31 1.29 1.28 1.27 1.25
26 1.38 1.46 1.45 1.44 1.42 1.41 1.39 1.38 1.37 1.37 1.35 1.34 1.32 1.31 1.30 1.29 1.28 1.26 1.25
27 1.38 1.46 1.45 1.43 1.42 1.40 1.39 1.38 1.37 1.36 1.35 1.33 1.32 1.31 1.30 1.28 1.27 1.26 1.24
28 1.38 1.46 1.45 1.43 1.41 1.40 1.39 1.38 1.37 1.36 1.34 1.33 1.31 1.30 1.29 1.28 1.27 1.25 1.24
29 1.38 1.45 1.45 1.43 1.41 1.40 1.38 1.37 1.36 1.35 1.34 1.32 1.31 1.30 1.29 1.27 1.26 1.25 1.23
30 1.38 1.45 1.44 1.42 1.41 1.39 1.38 1.37 1.36 1.35 1.34 1.32 1.30 1.29 1.28 1.27 1.26 1.24 1.23
40 1.36 1.44 1.42 1.40 1.39 1.37 1.36 1.35 1.34 1.33 1.31 1.30 1.28 1.26 1.25 1.24 1.22 1.21 1.19
60 1.35 1.42 1.41 1.38 1.37 1.35 1.33 1.32 1.31 1.30 1.29 1.27 1.25 1.24 1.22 1.21 1.19 1.17 1.15
120 1.34 1.40 1.39 1.37 1.35 1.33 1.31 1.30 1.29 1.28 1.26 1.24 1.22 1.21 1.19 1.18 1.16 1.13 1.10
1.32 1.39 1.37 1.35 1.33 1.31 1.29 1.28 1.27 1.25 1.24 1.22 1.19 1.18 1.16 1.14 1.12 1.08 1.00
D e g r e e s o f f r e e d o m f o
r t h
e d e n o m i n a t o r ( v 2
)
v1
v2
α
f ,
1 ,
2
6 5 7

8/11/2019 Table Statistics
http://slidepdf.com/reader/full/table-statistics 8/25
Table V Percentage Points of the F-Distribution (continued)
f 0.10,v1,v2
Degrees of freedom for the numerator (v1)
1 2 3 4 5 6 7 8 9 10 12 15 20 24 30 40 60 120
1 39.86 49.50 53.59 55.83 57.24 58.20 58.91 59.44 59.86 60.19 60.71 61.22 61.74 62.00 62.26 62.53 62.79 63.06 63.33
2 8.53 9.00 9.16 9.24 9.29 9.33 9.35 9.37 9.38 9.39 9.41 9.42 9.44 9.45 9.46 9.47 9.47 9.48 9.49
3 5.54 5.46 5.39 5.34 5.31 5.28 5.27 5.25 5.24 5.23 5.22 5.20 5.18 5.18 5.17 5.16 5.15 5.14 5.13
4 4.54 4.32 4.19 4.11 4.05 4.01 3.98 3.95 3.94 3.92 3.90 3.87 3.84 3.83 3.82 3.80 3.79 3.78 3.76
5 4.06 3.78 3.62 3.52 3.45 3.40 3.37 3.34 3.32 3.30 3.27 3.24 3.21 3.19 3.17 3.16 3.14 3.12 3.10
6 3.78 3.46 3.29 3.18 3.11 3.05 3.01 2.98 2.96 2.94 2.90 2.87 2.84 2.82 2.80 2.78 2.76 2.74 2.72
7 3.59 3.26 3.07 2.96 2.88 2.83 2.78 2.75 2.72 2.70 2.67 2.63 2.59 2.58 2.56 2.54 2.51 2.49 2.478 3.46 3.11 2.92 2.81 2.73 2.67 2.62 2.59 2.56 2.54 2.50 2.46 2.42 2.40 2.38 2.36 2.34 2.32 2.29
9 3.36 3.01 2.81 2.69 2.61 2.55 2.51 2.47 2.44 2.42 2.38 2.34 2.30 2.28 2.25 2.23 2.21 2.18 2.16
10 3.29 2.92 2.73 2.61 2.52 2.46 2.41 2.38 2.35 2.32 2.28 2.24 2.20 2.18 2.16 2.13 2.11 2.08 2.06
11 3.23 2.86 2.66 2.54 2.45 2.39 2.34 2.30 2.27 2.25 2.21 2.17 2.12 2.10 2.08 2.05 2.03 2.00 1.97
12 3.18 2.81 2.61 2.48 2.39 2.33 2.28 2.24 2.21 2.19 2.15 2.10 2.06 2.04 2.01 1.99 1.96 1.93 1.90
13 3.14 2.76 2.56 2.43 2.35 2.28 2.23 2.20 2.16 2.14 2.10 2.05 2.01 1.98 1.96 1.93 1.90 1.88 1.85
14 3.10 2.73 2.52 2.39 2.31 2.24 2.19 2.15 2.12 2.10 2.05 2.01 1.96 1.94 1.91 1.89 1.86 1.83 1.80
15 3.07 2.70 2.49 2.36 2.27 2.21 2.16 2.12 2.09 2.06 2.02 1.97 1.92 1.90 1.87 1.85 1.82 1.79 1.76
16 3.05 2.67 2.46 2.33 2.24 2.18 2.13 2.09 2.06 2.03 1.99 1.94 1.89 1.87 1.84 1.81 1.78 1.75 1.72
17 3.03 2.64 2.44 2.31 2.22 2.15 2.10 2.06 2.03 2.00 1.96 1.91 1.86 1.84 1.81 1.78 1.75 1.72 1.69
18 3.01 2.62 2.42 2.29 2.20 2.13 2.08 2.04 2.00 1.98 1.93 1.89 1.84 1.81 1.78 1.75 1.72 1.69 1.66
19 2.99 2.61 2.40 2.27 2.18 2.11 2.06 2.02 1.98 1.96 1.91 1.86 1.81 1.79 1.76 1.73 1.70 1.67 1.63
20 2.97 2.59 2.38 2.25 2.16 2.09 2.04 2.00 1.96 1.94 1.89 1.84 1.79 1.77 1.74 1.71 1.68 1.64 1.61
21 2.96 2.57 2.36 2.23 2.14 2.08 2.02 1.98 1.95 1.92 1.87 1.83 1.78 1.75 1.72 1.69 1.66 1.62 1.59
22 2.95 2.56 2.35 2.22 2.13 2.06 2.01 1.97 1.93 1.90 1.86 1.81 1.76 1.73 1.70 1.67 1.64 1.60 1.57
23 2.94 2.55 2.34 2.21 2.11 2.05 1.99 1.95 1.92 1.89 1.84 1.80 1.74 1.72 1.69 1.66 1.62 1.59 1.55
24 2.93 2.54 2.33 2.19 2.10 2.04 1.98 1.94 1.91 1.88 1.83 1.78 1.73 1.70 1.67 1.64 1.61 1.57 1.5325 2.92 2.53 2.32 2.18 2.09 2.02 1.97 1.93 1.89 1.87 1.82 1.77 1.72 1.69 1.66 1.63 1.59 1.56 1.52
26 2.91 2.52 2.31 2.17 2.08 2.01 1.96 1.92 1.88 1.86 1.81 1.76 1.71 1.68 1.65 1.61 1.58 1.54 1.50
27 2.90 2.51 2.30 2.17 2.07 2.00 1.95 1.91 1.87 1.85 1.80 1.75 1.70 1.67 1.64 1.60 1.57 1.53 1.49
28 2.89 2.50 2.29 2.16 2.06 2.00 1.94 1.90 1.87 1.84 1.79 1.74 1.69 1.66 1.63 1.59 1.56 1.52 1.48
29 2.89 2.50 2.28 2.15 2.06 1.99 1.93 1.89 1.86 1.83 1.78 1.73 1.68 1.65 1.62 1.58 1.55 1.51 1.47
30 2.88 2.49 2.28 2.14 2.03 1.98 1.93 1.88 1.85 1.82 1.77 1.72 1.67 1.64 1.61 1.57 1.54 1.50 1.46
40 2.84 2.44 2.23 2.09 2.00 1.93 1.87 1.83 1.79 1.76 1.71 1.66 1.61 1.57 1.54 1.51 1.47 1.42 1.38
60 2.79 2.39 2.18 2.04 1.95 1.87 1.82 1.77 1.74 1.71 1.66 1.60 1.54 1.51 1.48 1.44 1.40 1.35 1.29
120 2.75 2.35 2.13 1.99 1.90 1.82 1.77 1.72 1.68 1.65 1.60 1.55 1.48 1.45 1.41 1.37 1.32 1.26 1.19
2.71 2.30 2.08 1.94 1.85 1.77 1.72 1.67 1.63 1.60 1.55 1.49 1.42 1.38 1.34 1.30 1.24 1.17 1.00
D e g r e e s o f f r e e d o m f o
r t h e d e n o m i n a t o r ( v
2 )
v1
v2
6 5 8

8/11/2019 Table Statistics
http://slidepdf.com/reader/full/table-statistics 9/25
6 5 9
Table V Percentage Points of the F -Distribution (continued)
f 0.05,v1,v2
Degrees of freedom for the numerator (v1)
1 2 3 4 5 6 7 8 9 10 12 15 20 24 30 40 60 120
1 161.4 199.5 215.7 224.6 230.2 234.0 236.8 238.9 240.5 241.9 243.9 245.9 248.0 249.1 250.1 251.1 252.2 253.3 254.3
2 18.51 19.00 19.16 19.25 19.30 19.33 19.35 19.37 19.38 19.40 19.41 19.43 19.45 19.45 19.46 19.47 19.48 19.49 19.50
3 10.13 9.55 9.28 9.12 9.01 8.94 8.89 8.85 8.81 8.79 8.74 8.70 8.66 8.64 8.62 8.59 8.57 8.55 8.53
4 7.71 6.94 6.59 6.39 6.26 6.16 6.09 6.04 6.00 5.96 5.91 5.86 5.80 5.77 5.75 5.72 5.69 5.66 5.63
5 6.61 5.79 5.41 5.19 5.05 4.95 4.88 4.82 4.77 4.74 4.68 4.62 4.56 4.53 4.50 4.46 4.43 4.40 4.36
6 5.99 5.14 4.76 4.53 4.39 4.28 4.21 4.15 4.10 4.06 4.00 3.94 3.87 3.84 3.81 3.77 3.74 3.70 3.677 5.59 4.74 4.35 4.12 3.97 3.87 3.79 3.73 3.68 3.64 3.57 3.51 3.44 3.41 3.38 3.34 3.30 3.27 3.23
8 5.32 4.46 4.07 3.84 3.69 3.58 3.50 3.44 3.39 3.35 3.28 3.22 3.15 3.12 3.08 3.04 3.01 2.97 2.93
9 5.12 4.26 3.86 3.63 3.48 3.37 3.29 3.23 3.18 3.14 3.07 3.01 2.94 2.90 2.86 2.83 2.79 2.75 2.71
10 4.96 4.10 3.71 3.48 3.33 3.22 3.14 3.07 3.02 2.98 2.91 2.85 2.77 2.74 2.70 2.66 2.62 2.58 2.54
11 4.84 3.98 3.59 3.36 3.20 3.09 3.01 2.95 2.90 2.85 2.79 2.72 2.65 2.61 2.57 2.53 2.49 2.45 2.40
12 4.75 3.89 3.49 3.26 3.11 3.00 2.91 2.85 2.80 2.75 2.69 2.62 2.54 2.51 2.47 2.43 2.38 2.34 2.30
13 4.67 3.81 3.41 3.18 3.03 2.92 2.83 2.77 2.71 2.67 2.60 2.53 2.46 2.42 2.38 2.34 2.30 2.25 2.21
14 4.60 3.74 3.34 3.11 2.96 2.85 2.76 2.70 2.65 2.60 2.53 2.46 2.39 2.35 2.31 2.27 2.22 2.18 2.13
15 4.54 3.68 3.29 3.06 2.90 2.79 2.71 2.64 2.59 2.54 2.48 2.40 2.33 2.29 2.25 2.20 2.16 2.11 2.07
16 4.49 3.63 3.24 3.01 2.85 2.74 2.66 2.59 2.54 2.49 2.42 2.35 2.28 2.24 2.19 2.15 2.11 2.06 2.01
17 4.45 3.59 3.20 2.96 2.81 2.70 2.61 2.55 2.49 2.45 2.38 2.31 2.23 2.19 2.15 2.10 2.06 2.01 1.96
18 4.41 3.55 3.16 2.93 2.77 2.66 2.58 2.51 2.46 2.41 2.34 2.27 2.19 2.15 2.11 2.06 2.02 1.97 1.92
19 4.38 3.52 3.13 2.90 2.74 2.63 2.54 2.48 2.42 2.38 2.31 2.23 2.16 2.11 2.07 2.03 1.98 1.93 1.88
20 4.35 3.49 3.10 2.87 2.71 2.60 2.51 2.45 2.39 2.35 2.28 2.20 2.12 2.08 2.04 1.99 1.95 1.90 1.84
21 4.32 3.47 3.07 2.84 2.68 2.57 2.49 2.42 2.37 2.32 2.25 2.18 2.10 2.05 2.01 1.96 1.92 1.87 1.81
22 4.30 3.44 3.05 2.82 2.66 2.55 2.46 2.40 2.34 2.30 2.23 2.15 2.07 2.03 1.98 1.94 1.89 1.84 1.78
23 4.28 3.42 3.03 2.80 2.64 2.53 2.44 2.37 2.32 2.27 2.20 2.13 2.05 2.01 1.96 1.91 1.86 1.81 1.7624 4.26 3.40 3.01 2.78 2.62 2.51 2.42 2.36 2.30 2.25 2.18 2.11 2.03 1.98 1.94 1.89 1.84 1.79 1.73
25 4.24 3.39 2.99 2.76 2.60 2.49 2.40 2.34 2.28 2.24 2.16 2.09 2.01 1.96 1.92 1.87 1.82 1.77 1.71
26 4.23 3.37 2.98 2.74 2.59 2.47 2.39 2.32 2.27 2.22 2.15 2.07 1.99 1.95 1.90 1.85 1.80 1.75 1.69
27 4.21 3.35 2.96 2.73 2.57 2.46 2.37 2.31 2.25 2.20 2.13 2.06 1.97 1.93 1.88 1.84 1.79 1.73 1.67
28 4.20 3.34 2.95 2.71 2.56 2.45 2.36 2.29 2.24 2.19 2.12 2.04 1.96 1.91 1.87 1.82 1.77 1.71 1.65
29 4.18 3.33 2.93 2.70 2.55 2.43 2.35 2.28 2.22 2.18 2.10 2.03 1.94 1.90 1.85 1.81 1.75 1.70 1.64
30 4.17 3.32 2.92 2.69 2.53 2.42 2.33 2.27 2.21 2.16 2.09 2.01 1.93 1.89 1.84 1.79 1.74 1.68 1.62
40 4.08 3.23 2.84 2.61 2.45 2.34 2.25 2.18 2.12 2.08 2.00 1.92 1.84 1.79 1.74 1.69 1.64 1.58 1.51
60 4.00 3.15 2.76 2.53 2.37 2.25 2.17 2.10 2.04 1.99 1.92 1.84 1.75 1.70 1.65 1.59 1.53 1.47 1.39
120 3.92 3.07 2.68 2.45 2.29 2.17 2.09 2.02 1.96 1.91 1.83 1.75 1.66 1.61 1.55 1.55 1.43 1.35 1.25
3.84 3.00 2.60 2.37 2.21 2.10 2.01 1.94 1.88 1.83 1.75 1.67 1.57 1.52 1.46 1.39 1.32 1.22 1.00
D e g r e e s o f f r e e d o m f o
r t h e d e n o m i n a t o r ( v
2 )
v1
v2

8/11/2019 Table Statistics
http://slidepdf.com/reader/full/table-statistics 10/25
Table V Percentage Points of the F-Distribution (continued)
f 0.025,v1,v2
Degrees of freedom for the numerator (v1)
1 2 3 4 5 6 7 8 9 10 12 15 20 24 30 40 60 120
1 647.8 799.5 864.2 899.6 921.8 937.1 948.2 956.7 963.3 968.6 976.7 984.9 993.1 997.2 1001 1006 1010 1014 1018
2 38.51 39.00 39.17 39.25 39.30 39.33 39.36 39.37 39.39 39.40 39.41 39.43 39.45 39.46 39.46 39.47 39.48 39.49 39.50
3 17.44 16.04 15.44 15.10 14.88 14.73 14.62 14.54 14.47 14.42 14.34 14.25 14.17 14.12 14.08 14.04 13.99 13.95 13.90
4 12.22 10.65 9.98 9.60 9.36 9.20 9.07 8.98 8.90 8.84 8.75 8.66 8.56 8.51 8.46 8.41 8.36 8.31 8.26
5 10.01 8.43 7.76 7.39 7.15 6.98 6.85 6.76 6.68 6.62 6.52 6.43 6.33 6.28 6.23 6.18 6.12 6.07 6.02
6 8.81 7.26 6.60 6.23 5.99 5.82 5.70 5.60 5.52 5.46 5.37 5.27 5.17 5.12 5.07 5.01 4.96 4.90 4.85
7 8.07 6.54 5.89 5.52 5.29 5.12 4.99 4.90 4.82 4.76 4.67 4.57 4.47 4.42 4.36 4.31 4.25 4.20 4.148 7.57 6.06 5.42 5.05 4.82 4.65 4.53 4.43 4.36 4.30 4.20 4.10 4.00 3.95 3.89 3.84 3.78 3.73 3.67
9 7.21 5.71 5.08 4.72 4.48 4.32 4.20 4.10 4.03 3.96 3.87 3.77 3.67 3.61 3.56 3.51 3.45 3.39 3.33
10 6.94 5.46 4.83 4.47 4.24 4.07 3.95 3.85 3.78 3.72 3.62 3.52 3.42 3.37 3.31 3.26 3.20 3.14 3.08
11 6.72 5.26 4.63 4.28 4.04 3.88 3.76 3.66 3.59 3.53 3.43 3.33 3.23 3.17 3.12 3.06 3.00 2.94 2.88
12 6.55 5.10 4.47 4.12 3.89 3.73 3.61 3.51 3.44 3.37 3.28 3.18 3.07 3.02 2.96 2.91 2.85 2.79 2.72
13 6.41 4.97 4.35 4.00 3.77 3.60 3.48 3.39 3.31 3.25 3.15 3.05 2.95 2.89 2.84 2.78 2.72 2.66 2.60
14 6.30 4.86 4.24 3.89 3.66 3.50 3.38 3.29 3.21 3.15 3.05 2.95 2.84 2.79 2.73 2.67 2.61 2.55 2.49
15 6.20 4.77 4.15 3.80 3.58 3.41 3.29 3.20 3.12 3.06 2.96 2.86 2.76 2.70 2.64 2.59 2.52 2.46 2.40
16 6.12 4.69 4.08 3.73 3.50 3.34 3.22 3.12 3.05 2.99 2.89 2.79 2.68 2.63 2.57 2.51 2.45 2.38 2.32
17 6.04 4.62 4.01 3.66 3.44 3.28 3.16 3.06 2.98 2.92 2.82 2.72 2.62 2.56 2.50 2.44 2.38 2.32 2.25
18 5.98 4.56 3.95 3.61 3.38 3.22 3.10 3.01 2.93 2.87 2.77 2.67 2.56 2.50 2.44 2.38 2.32 2.26 2.19
19 5.92 4.51 3.90 3.56 3.33 3.17 3.05 2.96 2.88 2.82 2.72 2.62 2.51 2.45 2.39 2.33 2.27 2.20 2.13
20 5.87 4.46 3.86 3.51 3.29 3.13 3.01 2.91 2.84 2.77 2.68 2.57 2.46 2.41 2.35 2.29 2.22 2.16 2.09
21 5.83 4.42 3.82 3.48 3.25 3.09 2.97 2.87 2.80 2.73 2.64 2.53 2.42 2.37 2.31 2.25 2.18 2.11 2.04
22 5.79 4.38 3.78 3.44 3.22 3.05 2.93 2.84 2.76 2.70 2.60 2.50 2.39 2.33 2.27 2.21 2.14 2.08 2.00
23 5.75 4.35 3.75 3.41 3.18 3.02 2.90 2.81 2.73 2.67 2.57 2.47 2.36 2.30 2.24 2.18 2.11 2.04 1.97
24 5.72 4.32 3.72 3.38 3.15 2.99 2.87 2.78 2.70 2.64 2.54 2.44 2.33 2.27 2.21 2.15 2.08 2.01 1.9425 5.69 4.29 3.69 3.35 3.13 2.97 2.85 2.75 2.68 2.61 2.51 2.41 2.30 2.24 2.18 2.12 2.05 1.98 1.91
26 5.66 4.27 3.67 3.33 3.10 2.94 2.82 2.73 2.65 2.59 2.49 2.39 2.28 2.22 2.16 2.09 2.03 1.95 1.88
27 5.63 4.24 3.65 3.31 3.08 2.92 2.80 2.71 2.63 2.57 2.47 2.36 2.25 2.19 2.13 2.07 2.00 1.93 1.85
28 5.61 4.22 3.63 3.29 3.06 2.90 2.78 2.69 2.61 2.55 2.45 2.34 2.23 2.17 2.11 2.05 1.98 1.91 1.83
29 5.59 4.20 3.61 3.27 3.04 2.88 2.76 2.67 2.59 2.53 2.43 2.32 2.21 2.15 2.09 2.03 1.96 1.89 1.81
30 5.57 4.18 3.59 3.25 3.03 2.87 2.75 2.65 2.57 2.51 2.41 2.31 2.20 2.14 2.07 2.01 1.94 1.87 1.79
40 5.42 4.05 3.46 3.13 2.90 2.74 2.62 2.53 2.45 2.39 2.29 2.18 2.07 2.01 1.94 1.88 1.80 1.72 1.64
60 5.29 3.93 3.34 3.01 2.79 2.63 2.51 2.41 2.33 2.27 2.17 2.06 1.94 1.88 1.82 1.74 1.67 1.58 1.48
120 5.15 3.80 3.23 2.89 2.67 2.52 2.39 2.30 2.22 2.16 2.05 1.94 1.82 1.76 1.69 1.61 1.53 1.43 1.31
5.02 3.69 3.12 2.79 2.57 2.41 2.29 2.19 2.11 2.05 1.94 1.83 1.71 1.64 1.57 1.48 1.39 1.27 1.00
D e g r e e s o f f r e e d o m f o
r t h e d e n o m i n a t o r ( v
2 )
v1
v2
6 6 0
8/11/2019 Table Statistics
http://slidepdf.com/reader/full/table-statistics 11/25
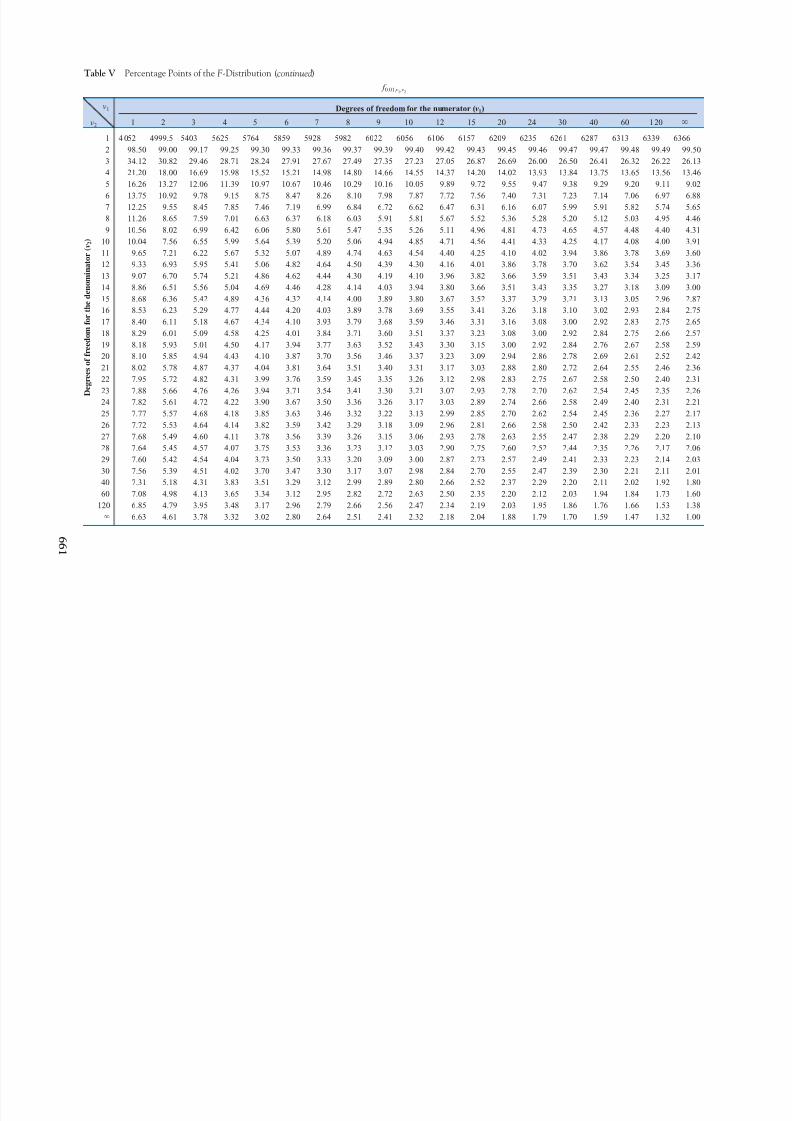
Table V Percentage Points of the F-Distribution (continued)
f 0.01,v1,v2
Degrees of freedom for the numerator (v1)
1 2 3 4 5 6 7 8 9 10 12 15 20 24 30 40 60 120
1 4 052 4999.5 5403 5625 5764 5859 5928 5982 6022 6056 6106 6157 6209 6235 6261 6287 6313 6339 6366
2 98.50 99.00 99.17 99.25 99.30 99.33 99.36 99.37 99.39 99.40 99.42 99.43 99.45 99.46 99.47 99.47 99.48 99.49 99.50
3 34.12 30.82 29.46 28.71 28.24 27.91 27.67 27.49 27.35 27.23 27.05 26.87 26.69 26.00 26.50 26.41 26.32 26.22 26.13
4 21.20 18.00 16.69 15.98 15.52 15.21 14.98 14.80 14.66 14.55 14.37 14.20 14.02 13.93 13.84 13.75 13.65 13.56 13.46
5 16.26 13.27 12.06 11.39 10.97 10.67 10.46 10.29 10.16 10.05 9.89 9.72 9.55 9.47 9.38 9.29 9.20 9.11 9.02
6 13.75 10.92 9.78 9.15 8.75 8.47 8.26 8.10 7.98 7.87 7.72 7.56 7.40 7.31 7.23 7.14 7.06 6.97 6.887 12.25 9.55 8.45 7.85 7.46 7.19 6.99 6.84 6.72 6.62 6.47 6.31 6.16 6.07 5.99 5.91 5.82 5.74 5.65
8 11.26 8.65 7.59 7.01 6.63 6.37 6.18 6.03 5.91 5.81 5.67 5.52 5.36 5.28 5.20 5.12 5.03 4.95 4.46
9 10.56 8.02 6.99 6.42 6.06 5.80 5.61 5.47 5.35 5.26 5.11 4.96 4.81 4.73 4.65 4.57 4.48 4.40 4.31
10 10.04 7.56 6.55 5.99 5.64 5.39 5.20 5.06 4.94 4.85 4.71 4.56 4.41 4.33 4.25 4.17 4.08 4.00 3.91
11 9.65 7.21 6.22 5.67 5.32 5.07 4.89 4.74 4.63 4.54 4.40 4.25 4.10 4.02 3.94 3.86 3.78 3.69 3.60
12 9.33 6.93 5.95 5.41 5.06 4.82 4.64 4.50 4.39 4.30 4.16 4.01 3.86 3.78 3.70 3.62 3.54 3.45 3.36
13 9.07 6.70 5.74 5.21 4.86 4.62 4.44 4.30 4.19 4.10 3.96 3.82 3.66 3.59 3.51 3.43 3.34 3.25 3.17
14 8.86 6.51 5.56 5.04 4.69 4.46 4.28 4.14 4.03 3.94 3.80 3.66 3.51 3.43 3.35 3.27 3.18 3.09 3.00
15 8.68 6.36 5.42 4.89 4.36 4.32 4.14 4.00 3.89 3.80 3.67 3.52 3.37 3.29 3.21 3.13 3.05 2.96 2.87
16 8.53 6.23 5.29 4.77 4.44 4.20 4.03 3.89 3.78 3.69 3.55 3.41 3.26 3.18 3.10 3.02 2.93 2.84 2.75
17 8.40 6.11 5.18 4.67 4.34 4.10 3.93 3.79 3.68 3.59 3.46 3.31 3.16 3.08 3.00 2.92 2.83 2.75 2.65
18 8.29 6.01 5.09 4.58 4.25 4.01 3.84 3.71 3.60 3.51 3.37 3.23 3.08 3.00 2.92 2.84 2.75 2.66 2.57
19 8.18 5.93 5.01 4.50 4.17 3.94 3.77 3.63 3.52 3.43 3.30 3.15 3.00 2.92 2.84 2.76 2.67 2.58 2.59
20 8.10 5.85 4.94 4.43 4.10 3.87 3.70 3.56 3.46 3.37 3.23 3.09 2.94 2.86 2.78 2.69 2.61 2.52 2.42
21 8.02 5.78 4.87 4.37 4.04 3.81 3.64 3.51 3.40 3.31 3.17 3.03 2.88 2.80 2.72 2.64 2.55 2.46 2.36
22 7.95 5.72 4.82 4.31 3.99 3.76 3.59 3.45 3.35 3.26 3.12 2.98 2.83 2.75 2.67 2.58 2.50 2.40 2.31
23 7.88 5.66 4.76 4.26 3.94 3.71 3.54 3.41 3.30 3.21 3.07 2.93 2.78 2.70 2.62 2.54 2.45 2.35 2.2624 7.82 5.61 4.72 4.22 3.90 3.67 3.50 3.36 3.26 3.17 3.03 2.89 2.74 2.66 2.58 2.49 2.40 2.31 2.21
25 7.77 5.57 4.68 4.18 3.85 3.63 3.46 3.32 3.22 3.13 2.99 2.85 2.70 2.62 2.54 2.45 2.36 2.27 2.17
26 7.72 5.53 4.64 4.14 3.82 3.59 3.42 3.29 3.18 3.09 2.96 2.81 2.66 2.58 2.50 2.42 2.33 2.23 2.13
27 7.68 5.49 4.60 4.11 3.78 3.56 3.39 3.26 3.15 3.06 2.93 2.78 2.63 2.55 2.47 2.38 2.29 2.20 2.10
28 7.64 5.45 4.57 4.07 3.75 3.53 3.36 3.23 3.12 3.03 2.90 2.75 2.60 2.52 2.44 2.35 2.26 2.17 2.06
29 7.60 5.42 4.54 4.04 3.73 3.50 3.33 3.20 3.09 3.00 2.87 2.73 2.57 2.49 2.41 2.33 2.23 2.14 2.03
30 7.56 5.39 4.51 4.02 3.70 3.47 3.30 3.17 3.07 2.98 2.84 2.70 2.55 2.47 2.39 2.30 2.21 2.11 2.01
40 7.31 5.18 4.31 3.83 3.51 3.29 3.12 2.99 2.89 2.80 2.66 2.52 2.37 2.29 2.20 2.11 2.02 1.92 1.80
60 7.08 4.98 4.13 3.65 3.34 3.12 2.95 2.82 2.72 2.63 2.50 2.35 2.20 2.12 2.03 1.94 1.84 1.73 1.60
120 6.85 4.79 3.95 3.48 3.17 2.96 2.79 2.66 2.56 2.47 2.34 2.19 2.03 1.95 1.86 1.76 1.66 1.53 1.38
6.63 4.61 3.78 3.32 3.02 2.80 2.64 2.51 2.41 2.32 2.18 2.04 1.88 1.79 1.70 1.59 1.47 1.32 1.00
D e g r e e s o f f r e e d o m f o
r t h e d e n o m i n a t o r ( v
2 )
v1
v2
6 6 1

8/11/2019 Table Statistics
http://slidepdf.com/reader/full/table-statistics 12/25
662 APPENDIX A STATISTICAL TABLES AND CHARTS
0.2
1 2 3 4
0.4
0.6
0.8
500
1.0
d
P r o b a b i l i t y
o f a c c e p t i n g H
0
n = 1
2
4
1 0 0
5
6 7 1
0
1 5
2 0
3 0
4 0
5 0
7 5
8
3
(b) O.C . curves for different values of n for the two-sided normal test for a level of significance 0.01.
Source: Charts VIa, e, f, k, m, and q are reproduced with permission from “Operating Characteristics
for the Common Statistical Tests of Signif icance,’’ by C. L. Ferris, F. E. Grubbs, and C. L. Weaver,
Annals of Mathematical Statistics, June 1946.
Charts VIb, c, d, g, h, i, j, l, n, o, p, and r are reproduced with permission from Engineering Statistics,
2nd Edition, by A. H. Bowker and G. J. Lieberman, Prentice-Hall, 1972.
(a) O.C . curves for different values of n for the two-sided normal test for a level of significance 0.05.
00
1 2 3 4
0.20
0.40
0.60
0.80
1.00
d
P r o b a b i l i t y
o f a c c e p t i n g
H 0
n = 1
3 4
1 0 0
5 6 7
1 0
1 5
2 0
3 0 4
0
5 0 7
5
8
9
2
Chart VI Operating Characteristic Curves

8/11/2019 Table Statistics
http://slidepdf.com/reader/full/table-statistics 13/25
APPENDIX A 663
–1.000
n = 1
3
1 0 0
5
–0.50 0.0 2.00 3.00
0.20
0.40
0.60
0.80
1.00
P r o b a b i l i t y
o f a c c e p t i n g
H 0
0.50 1.00 1.50 2.50
d
6 7
1 0
1 5
2 0
3 0
4 0
5 0
7 5
8 9
4
2
–1.00
0
–0.50 0.0 0.50 1.00 1.50 2.00 2.50 3.00
0.20
0.40
0.60
0.80
1.00
n = 1
4
1 0 0
5 6
7
1 0
1 5
2 0
3 0
4 0
5 0
7 5
8 9
P r o b a b i l i t y
o f a c c e p t i n
g
H 0
d
3
2
(c) O.C . curves for different values of n for the one-sided normal test for a level of significance 0.05.
(d ) O.C . curves for different values of n for the one-sided normal test for a level of significance 0.01.
Chart VI Operating Characteristic Curves (continued )

8/11/2019 Table Statistics
http://slidepdf.com/reader/full/table-statistics 14/25
664 APPENDIX A STATISTICAL TABLES AND CHARTS
n = 2
1 0 0
4
0
0
1 2
0.2
0.4
0.6
0.8
1.0
7
1 5
3
d
P r o b a b i l i t y
o f a c c e p t i n g
H 0
2 0
3 0
4 0
5 0
7 5
3
5
1 0
0.20
0.10
0.20
0.30
0.40
0.50
0.60
0.70
0.80
0.90
1.00
0.4 0.6 0.8 1.0 1.2 1.4 1.6 1.8 2.0 2.2 2.4 2.6 2.8 3.0 3.20
P r o b a b i l i t y
o f a c c e p t i n g
H 0
d
n = 4
n = 5
n = 7
n = 1 0
n = 1 5
n = 2 0
n = 3 0
n = 4 0
n = 1 0 0
n = 7 5 n
= 5 0
n = 3
(e) O.C . curves for different values of n for the two-sided t -test for a level of significance 0.05.
( f ) O.C . curves for different values of n for the two-sided t -test for a level of significance 0.01.
Chart VI Operating Characteristic Curves (continued )

8/11/2019 Table Statistics
http://slidepdf.com/reader/full/table-statistics 15/25
APPENDIX A 665
Chart VI Operating Characteristic Curves (continued )
0
– 0. 2 0 0 .2 0. 4 0.6 0.8 1. 0 1. 2 1 .4 1. 6 1 .8 2. 0 2.2 2. 4 2.6 2.8 3 .0 3. 2
0.10
0.20
0.30
0.40
0.50
0.60
0.70
0.80
0.90
1.00
–0.4–0.6–0.8
P r o b a b i l i t y
o f a c c e p t i n g
H 0
d
n = 4 0 n
= 5 0
n = 7 5
n = 3 n = 4 n
= 5
n = 7
n = 1 0
n = 1 5
n = 2 0
n = 3 0
n = 1 0 0
0
– 0. 2 0 0 .2 0. 4 0.6 0.8 1. 0 1. 2 1 .4 1. 6 1 .8 2.0 2 .2 2. 4 2.6 2 .8 3 .0 3. 2
0.10
0.20
0.30
0.40
0.50
0.60
0.70
0.80
0.90
1.00
–0.4–0.6–0.8
P r o b a b i l i t y
o f a c c e p t i n g
H 0
d
n = 5
n = 4 0
n = 5 0
n = 7 5
n = 1 0 0
n = 3
n = 4
n = 7
n = 1 0
n = 1 5
n = 2 0
n = 3 0
( g ) O.C . curves for different values of n for the one-sided t -test for a level of significance 0.05.
(h) O.C . curves for different values of n for the one-sided t -test for a level of significance 0.01.

8/11/2019 Table Statistics
http://slidepdf.com/reader/full/table-statistics 16/25
666 APPENDIX A STATISTICAL TABLES AND CHARTS
Chart VI Operating Characteristic Curves (continued )
0
0.40 0.80 1.20 1.60 2.00 2.40 2.800 3.20 3.60 4.00
0.10
0.20
0.30
0.40
0.50
0.60
0.70
0.80
0.90
1.00
1.00
P r o b a b i l i t y
o f a c c e p t i n g
H 0
6
5
5
4
3
λ
4
n = 2
3 6
n = 2
100
75
50
40
30
20
15
10
9
8
7
00.40 0.80 1.20 1.60 2.00 2.40 2.800 3.20 3.60 4.00
0.10
0.20
0.30
0.40
0.50
0.60
0.70
0.80
0.90
1.00
1.00
P r o b a b i l i t y
o f a c c e p
t i n g
H 0
5
3 6
5
4
λ
6
n = 2
4
100
75
50
40
30
20
15
10
9
8
7
n = 3
(i) O.C . curves for different values of n for the two-sided chi-square test for a level of significance 0.05.
( j ) O.C . curves for different values of n for the two-sided chi-square test for a level of significance 0.01.

8/11/2019 Table Statistics
http://slidepdf.com/reader/full/table-statistics 17/25
APPENDIX A 667
Chart VI Operating Characteristic Curves (continued )
00
1.0 2.0 3.0 4.0
0.20
0.40
0.60
0.80
1.00
P r o b a b i l i t y
o f a c c e p t i n g
H 0
n = 2
4
5
6 7
1
0 0
1 0
1 5
2 0
3 0
4 0
5 0
7 5
λ
3
8
00
1.0
0.20
n = 3
5 6
100
1 0 15
20
30
40
50
75
7 9
8
2.0 3.0 4.0 5.0 6.0 7.0 8.0 9.0
0.40
0.60
0.80
1.00
λ
P r o b a b i l i t y
o f a c c e p t i n g
H 0
4
(k ) O.C . curves for different values of n for the one-sided (upper tail) chi-square test for a level of
significance 0.05.
(l ) O.C . curves for different values of n for the one-sided (upper tail) chi-square test for a level of
significance 0.01.

8/11/2019 Table Statistics
http://slidepdf.com/reader/full/table-statistics 18/25
668 APPENDIX A STATISTICAL TABLES AND CHARTS
Chart VI Operating Characteristic Curves (continued )
0
0
0.40 0.80 1.20 1.40
0.20
0.40
0.60
0.80
1.00
P r o b a b i l i t y
o f a c c e p t i n g
H 0
0.20 0.60 1.00
n = 2
3
4
5
6
1 0
1 5
2 0
3 0
4 0
5 0
7 5
7
8 9
λ
1 0 0
(m) O.C . curves for different values of n for the one-sided (lower tail) chi-square test for a level of
significance 0.05.
(n) O.C . curves for different values of n for the one-sided (lower tail) chi-square test for a level of
significance 0.01.
0
0
n = 2
3
4
5
1 0 0
0.5 01. 1.5 2.0
0.2
0.4
0.6
0.8
1.0
P r o b a b i l i t y
o f a c c e p t i n g
H 0
1 0
1 5
2 0 3
0
4 0
5 0
7 5
7 8
λ
6

8/11/2019 Table Statistics
http://slidepdf.com/reader/full/table-statistics 19/25
APPENDIX A 669
Chart VI Operating Characteristic Curves (continued )
00
0.40 0.80 1.40 1.80 2.20 2.60 3.00 3.40 3.80 4.00
0.20
0.40
0.60
0.80
1.00
λ
1.00
P r o b a b i l i t y
o f a c c e p t i n g
H 0
6
7
9
1 6
1 0 1
4
5
4
3
8
1 0
2 1
3 1 5
1
5
n1 = n
2 = 3
6
7
8
9
10
16
21
31
51
101
00
0.40 0.80 1.20 1.60 2.00 2.40 2.80 3.20 3.60 4.00
0.20
0.40
0.60
0.80
1.00
λ
1.00
P r o b a b i l i t y
o f a c c e p t
i n g
H 0
6
7
9
5 1 1
0 1
5
4
8
1 0
1 6
2 1
3 1
n1 = n2 = 3
6
7
8
9
10
16
21
31
51
101
34
5
(o) O.C . curves for different values of n for the two-sided F -test for a level of significance 0.05.
( p) O.C. curves for different values of n for the two-sided F -test for a level of significance 0.01.

8/11/2019 Table Statistics
http://slidepdf.com/reader/full/table-statistics 20/25
670 APPENDIX A STATISTICAL TABLES AND CHARTS
Chart VI Operating Characteristic Curves (continued )
10
2 3 4
0.20
0.40
0.60
0.80
1.00
3
4
5
1 0 0
1 0
1 5
2 0 3
0
7 8
P r o b a b i l i t y
o f a c c e p t i n g
H 0
4 0
5 0
7 5
λ
n1 = n
2 = 2
6
00
2.00 4.00 5.00 8.00 10.00 12.00 14.00
0.20
0.40
0.60
0.80
1.00
16.00
n1 = n
2 = 2
3
4
5
6 7
8 1 0
9 1 6
2 1 4
1
5 1
3 1
1.00
λ
P r o b a b i l i t y
o f a c c e p t i n g
H 0
1 2 1
(q) O.C . curves for different values of n for the one-sided F -test for a level of significance 0.05.
(r ) O.C . curves for different values of n for the one-sided F -test for a level of significance 0.01.

8/11/2019 Table Statistics
http://slidepdf.com/reader/full/table-statistics 21/25
APPENDIX A 671
Table VII Critical Values for the Sign Test
r*
0.10 0.05 0.01 Two-sided tests 0.10 0.05 0.01 Two-sided testsn 0.05 0.025 0.005 One-sided tests n 0.05 0.025 0.005 One-sided tests
5 0 23 7 6 46 0 0 24 7 6 5
7 0 0 25 7 7 5
8 1 0 0 26 8 7 6
9 1 1 0 27 8 7 6
10 1 1 0 28 9 8 6
11 2 1 0 29 9 8 7
12 2 2 1 30 10 9 7
13 3 2 1 31 10 9 7
14 3 2 1 32 10 9 8
15 3 3 2 33 11 10 8
16 4 3 2 34 11 10 9
17 4 4 2 35 12 11 9
18 5 4 3 36 12 11 919 5 4 3 37 13 12 10
20 5 5 3 38 13 12 10
21 6 5 4 39 13 12 11
22 6 5 4 40 14 13 11
Table VIII Critical Values for the Wilcoxon Signed-Rank Test
w*
0.10 0.05 0.02 0.01 Two-sided testsn* 0.05 0.025 0.01 0.005 One-sided tests
4
5 0
6 2 07 3 2 0
8 5 3 1 0
9 8 5 3 1
10 10 8 5 3
11 13 10 7 5
12 17 13 9 7
13 21 17 12 9
14 25 21 15 12
15 30 25 19 15
16 35 29 23 19
17 41 34 27 23
18 47 40 32 27
19 53 46 37 3220 60 52 43 37
21 67 58 49 42
22 75 65 55 48
23 83 73 62 54
24 91 81 69 61
25 100 89 76 68
*If n 25, W (or W ) is approximately normally distributed with mean n(n 1)4and variance n(n 1)(2n 1)24.

8/11/2019 Table Statistics
http://slidepdf.com/reader/full/table-statistics 22/25
672 APPENDIX A STATISTICAL TABLES AND CHARTS
Table IX Critical Values for the Wilcoxon Rank-Sum Testw0.05
n1*n2 4 5 6 7 8 9 10 11 12 13 14 15
4 10
5 11 176 12 18 26
7 13 20 27 36
8 14 21 29 38 49
9 15 22 31 40 51 63
10 15 23 32 42 53 65 78
11 16 24 34 44 55 68 81 96
12 17 26 35 46 58 71 85 99 115
13 18 27 37 48 60 73 88 103 119 137
14 19 28 38 50 63 76 91 106 123 141 160
15 20 29 40 52 65 79 94 110 127 145 164 185
16 21 31 42 54 67 82 97 114 131 150 169
17 21 32 43 56 70 84 100 117 135 154
18 22 33 45 58 72 87 103 121 139
19 23 34 46 60 74 90 107 124
20 24 35 48 62 77 93 11021 25 37 50 64 79 95
22 26 38 51 66 82
23 27 39 53 68
24 28 40 55
25 28 42
26 29
27
28
*For n1 and n2 8, W 1 is approximately normally distributed with mean and variance n1n2(n1 n2 1)12.12n11 n1 n2 12
Table IX Critical Values for the Wilcoxon Rank-Sum Test (continued)w0.01
n1
n2 4 5 6 7 8 9 10 11 12 13 14 15
5 15
6 10 16 23
7 10 17 24 32
8 11 17 25 34 43
9 11 18 26 35 45 56
10 12 19 27 37 47 58 71
11 12 20 28 38 49 61 74 87
12 13 21 30 40 51 63 76 90 106
13 14 22 31 41 53 65 79 93 109 125
14 14 22 32 43 54 67 81 96 112 129 147
15 15 23 33 44 56 70 84 99 115 133 151 171
16 15 24 34 46 58 72 86 102 119 137 155
17 16 25 36 47 60 74 89 105 122 140
18 16 26 37 49 62 76 92 108 125
19 17 27 38 50 64 78 94 11120 18 28 39 52 66 81 97
21 18 29 40 53 68 83
22 19 29 42 55 70
23 19 30 43 57
24 20 31 44
25 20 32
26 21
27
28

8/11/2019 Table Statistics
http://slidepdf.com/reader/full/table-statistics 23/25
APPENDIX A 673
Table X Factors for Constructing Variables Control Charts
Factor for Control Limits
Chart R Chart S Chart
n* A1 A2 d 2 D3 D4 c4 n
2 3.760 1.880 1.128 0 3.267 0.7979 2
3 2.394 1.023 1.693 0 2.575 0.8862 3
4 1.880 .729 2.059 0 2.282 0.9213 4
5 1.596 .577 2.326 0 2.115 0.9400 5
6 1.410 .483 2.534 0 2.004 0.9515 6
7 1.277 .419 2.704 .076 1.924 0.9594 7
8 1.175 .373 2.847 .136 1.864 0.9650 8
9 1.094 .337 2.970 .184 1.816 0.9693 9
10 1.028 .308 3.078 .223 1.777 0.9727 10
11 .973 .285 3.173 .256 1.744 0.9754 11
12 .925 .266 3.258 .284 1.716 0.9776 12
13 .884 .249 3.336 .308 1.692 0.9794 13
14 .848 .235 3.407 .329 1.671 0.9810 14
15 .816 .223 3.472 .348 1.652 0.9823 15
16 .788 .212 3.532 .364 1.636 0.9835 16
17 .762 .203 3.588 .379 1.621 0.9845 17
18 .738 .194 3.640 .392 1.608 0.9854 18
19 .717 .187 3.689 .404 1.596 0.9862 19
20 .697 .180 3.735 .414 1.586 0.9869 20
21 .679 .173 3.778 .425 1.575 0.9876 21
22 .662 .167 3.819 .434 1.566 0.9882 22
23 .647 .162 3.858 .443 1.557 0.9887 23
24 .632 .157 3.895 .452 1.548 0.9892 24
25 .619 .153 3.931 .459 1.541 0.9896 25
* where n number of observations in sample.n 25: A1 3 1 n
X

8/11/2019 Table Statistics
http://slidepdf.com/reader/full/table-statistics 24/25
674 APPENDIX A STATISTICAL TABLES AND CHARTS
Table XI Factors for Tolerance Intervals
Values of k for Two-Sided Intervals
Confidence
Level 0.90 0.95 0.99
PercentCoverage 0.90 0.95 0.99 0.90 0.95 0.99 0.90 0.95 0.99
2 15.978 18.800 24.167 32.019 37.674 48.430 160.193 188.491 242.300
3 5.847 6.919 8.974 8.380 9.916 12.861 18.930 22.401 29.055
4 4.166 4.943 6.440 5.369 6.370 8.299 9.398 11.150 14.527
5 3.949 4.152 5.423 4.275 5.079 6.634 6.612 7.855 10.260
6 3.131 3.723 4.870 3.712 4.414 5.775 5.337 6.345 8.301
7 2.902 3.452 4.521 3.369 4.007 5.248 4.613 5.488 7.187
8 2.743 3.264 4.278 3.136 3.732 4.891 4.147 4.936 6.468
9 2.626 3.125 4.098 2.967 3.532 4.631 3.822 4.550 5.966
10 2.535 3.018 3.959 2.839 3.379 4.433 3.582 4.265 5.594
11 2.463 2.933 3.849 2.737 3.259 4.277 3.397 4.045 5.308
12 2.404 2.863 3.758 2.655 3.162 4.150 3.250 3.870 5.07913 2.355 2.805 3.682 2.587 3.081 4.044 3.130 3.727 4.893
14 2.314 2.756 3.618 2.529 3.012 3.955 3.029 3.608 4.737
15 2.278 2.713 3.562 2.480 2.954 3.878 2.945 3.507 4.605
16 2.246 2.676 3.514 2.437 2.903 3.812 2.872 3.421 4.492
17 2.219 2.643 3.471 2.400 2.858 3.754 2.808 3.345 4.393
18 2.194 2.614 3.433 2.366 2.819 3.702 2.753 3.279 4.307
19 2.172 2.588 3.399 2.337 2.784 3.656 2.703 3.221 4.230
20 2.152 2.564 3.368 2.310 2.752 3.615 2.659 3.168 4.161
21 2.135 2.543 3.340 2.286 2.723 3.577 2.620 3.121 4.100
22 2.118 2.524 3.315 2.264 2.697 3.543 2.584 3.078 4.044
23 2.103 2.506 3.292 2.244 2.673 3.512 2.551 3.040 3.993
24 2.089 2.489 3.270 2.225 2.651 3.483 2.522 3.004 3.947
25 2.077 2.474 3.251 2.208 2.631 3.457 2.494 2.972 3.904
30 2.025 2.413 3.170 2.140 2.529 3.350 2.385 2.841 3.733
40 1.959 2.334 3.066 2.052 2.445 3.213 2.247 2.677 3.518
50 1.916 2.284 3.001 1.996 2.379 3.126 2.162 2.576 3.385
60 1.887 2.248 2.955 1.958 2.333 3.066 2.103 2.506 3.293
70 1.865 2.222 2.920 1.929 2.299 3.021 2.060 2.454 3.225
80 1.848 2.202 2.894 1.907 2.272 2.986 2.026 2.414 3.173
90 1.834 2.185 2.872 1.889 2.251 2.958 1.999 2.382 3.130
100 1.822 2.172 2.854 1.874 2.233 2.934 1.977 2.355 3.096

8/11/2019 Table Statistics
http://slidepdf.com/reader/full/table-statistics 25/25
APPENDIX A 675
Table XI Factors for Tolerance Intervals (continued)
Values of k for One-Sided Intervals
Confidence
Level 0.90 0.95 0.99
PercentCoverage 0.90 0.95 0.99 0.90 0.95 0.99 0.90 0.95 0.99
2 10.253 13.090 18.500 20.581 26.260 37.094 103.029 131.426 185.617
3 4.258 5.311 7.340 6.155 7.656 10.553 13.995 17.370 23.896
4 3.188 3.957 5.438 4.162 5.144 7.042 7.380 9.083 12.387
5 2.742 3.400 4.666 3.407 4.203 5.741 5.362 6.578 8.939
6 2.494 3.092 4.243 3.006 3.708 5.062 4.411 5.406 7.335
7 2.333 2.894 3.972 2.755 3.399 4.642 3.859 4.728 6.412
8 2.219 2.754 3.783 2.582 3.187 4.354 3.497 4.285 5.812
9 2.133 2.650 3.641 2.454 3.031 4.143 3.240 3.972 5.389
10 2.066 2.568 3.532 2.355 2.911 3.981 3.048 3.738 5.074
11 2.011 2.503 3.443 2.275 2.815 3.852 2.898 3.556 4.829
12 1.966 2.448 3.371 2.210 2.736 3.747 2.777 3.410 4.63313 1.928 2.402 3.309 2.155 2.671 3.659 2.677 3.290 4.472
14 1.895 2.363 3.257 2.109 2.614 3.585 2.593 3.189 4.337
15 1.867 2.329 3.212 2.068 2.566 3.520 2.521 3.102 4.222
16 1.842 2.299 3.172 2.033 2.524 3.464 2.459 3.028 4.123
17 1.819 2.272 3.137 2.002 2.486 3.414 2.405 2.963 4.037
18 1.800 2.249 3.105 1.974 2.453 3.370 2.357 2.905 3.960
19 1.782 2.227 3.077 1.949 2.423 3.331 2.314 2.854 3.892
20 1.765 2.028 3.052 1.926 2.396 3.295 2.276 2.808 3.832
21 1.750 2.190 3.028 1.905 2.371 3.263 2.241 2.766 3.777
22 1.737 2.174 3.007 1.886 2.349 3.233 2.209 2.729 3.727
23 1.724 2.159 2.987 1.869 2.328 3.206 2.180 2.694 3.681
24 1.712 2.145 2.969 1.853 2.309 3.181 2.154 2.662 3.640
25 1.702 2.132 2.952 1.838 2.292 3.158 2.129 2.633 3.601
30 1.657 2.080 2.884 1.777 2.220 3.064 2.030 2.515 3.447
40 1.598 2.010 2.793 1.697 2.125 2.941 1.902 2.364 3.249
50 1.559 1.965 2.735 1.646 2.065 2.862 1.821 2.269 3.125
60 1.532 1.933 2.694 1.609 2.022 2.807 1.764 2.202 3.038
70 1.511 1.909 2.662 1.581 1.990 2.765 1.722 2.153 2.974
80 1.495 1.890 2.638 1.559 1.964 2.733 1.688 2.114 2.924
90 1.481 1.874 2.618 1.542 1.944 2.706 1.661 2.082 2.883
100 1.470 1.861 2.601 1.527 1.927 2.684 1.639 2.056 2.850