tableau desktop 6 core certification - tableau software
TRANSCRIPT

Tableau Desktop 6 Core Certification
STUDY GUIDE
The testing center computers will be pre-loaded with Tableau 6.1. The content described below, and the exam itself, are based on the feature set of Tableau 6.0. If you are currently using Tableau 5.2 or earlier, it is recommended that you either upgrade to Tableau 6.1 or trial Tableau 6.1 and understand the new capabilities prior to attempting the exam.
Recommended PreparationPath A• Attend the Tableau Fundamentals Training.
• Attend Tableau Advanced Training.
Path B:• Watch these videos:
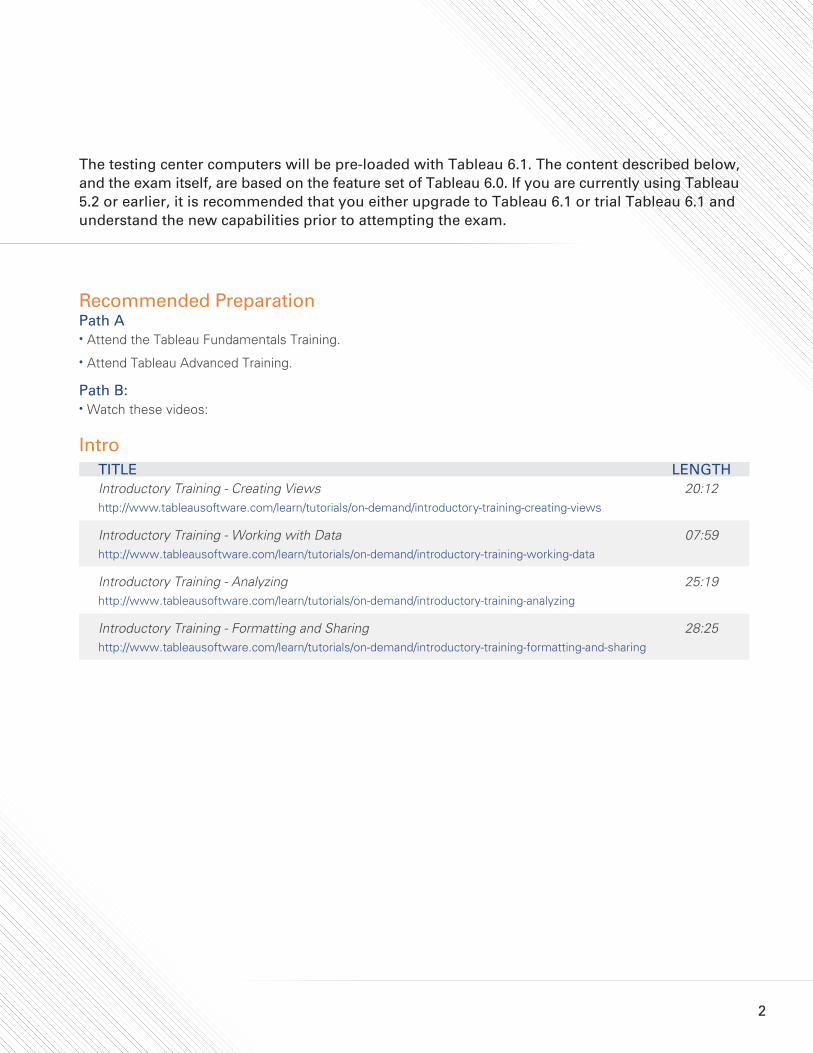
IntroTITLE LENGTHIntroductory Training - Creating Views 20:12http://www.tableausoftware.com/learn/tutorials/on-demand/introductory-training-creating-views
Introductory Training - Working with Data 07:59http://www.tableausoftware.com/learn/tutorials/on-demand/introductory-training-working-data
Introductory Training - Analyzing 25:19http://www.tableausoftware.com/learn/tutorials/on-demand/introductory-training-analyzing
Introductory Training - Formatting and Sharing 28:25http://www.tableausoftware.com/learn/tutorials/on-demand/introductory-training-formatting-and-sharing
2
3
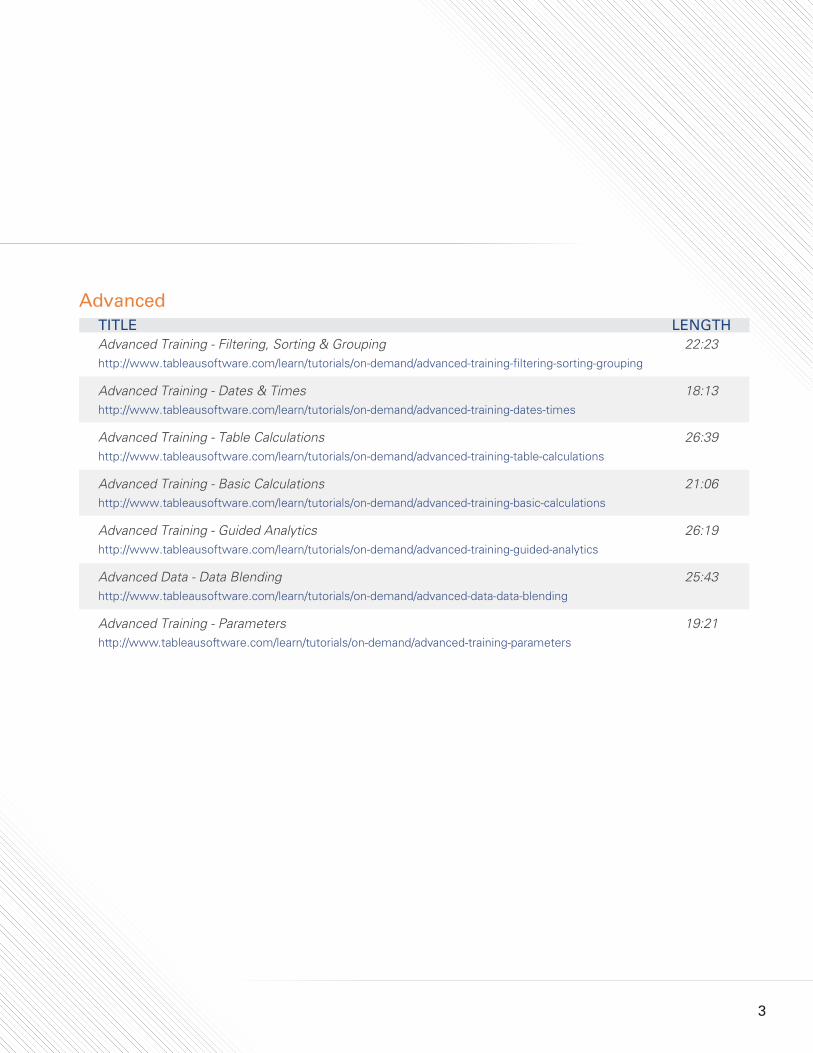
AdvancedTITLE LENGTHAdvanced Training - Filtering, Sorting & Grouping 22:23http://www.tableausoftware.com/learn/tutorials/on-demand/advanced-training-filtering-sorting-grouping
Advanced Training - Dates & Times 18:13http://www.tableausoftware.com/learn/tutorials/on-demand/advanced-training-dates-times
Advanced Training - Table Calculations 26:39http://www.tableausoftware.com/learn/tutorials/on-demand/advanced-training-table-calculations
Advanced Training - Basic Calculations 21:06http://www.tableausoftware.com/learn/tutorials/on-demand/advanced-training-basic-calculations
Advanced Training - Guided Analytics 26:19http://www.tableausoftware.com/learn/tutorials/on-demand/advanced-training-guided-analytics
Advanced Data - Data Blending 25:43http://www.tableausoftware.com/learn/tutorials/on-demand/advanced-data-data-blending
Advanced Training - Parameters 19:21http://www.tableausoftware.com/learn/tutorials/on-demand/advanced-training-parameters
PracticeAll of the examples below use the “Sample-Superstore Sales (Excel).xls’ file. It is not recommended that you use the saved data source of the same name, rather make a new connection to the excel file directly. When trying to recreate these examples, your dates and resulting visualizations may differ from the examples.
Be able to:
1. BASIC CONCEPTS AND DATA
1.1. Build Views.
1.2. Build Dashboards.
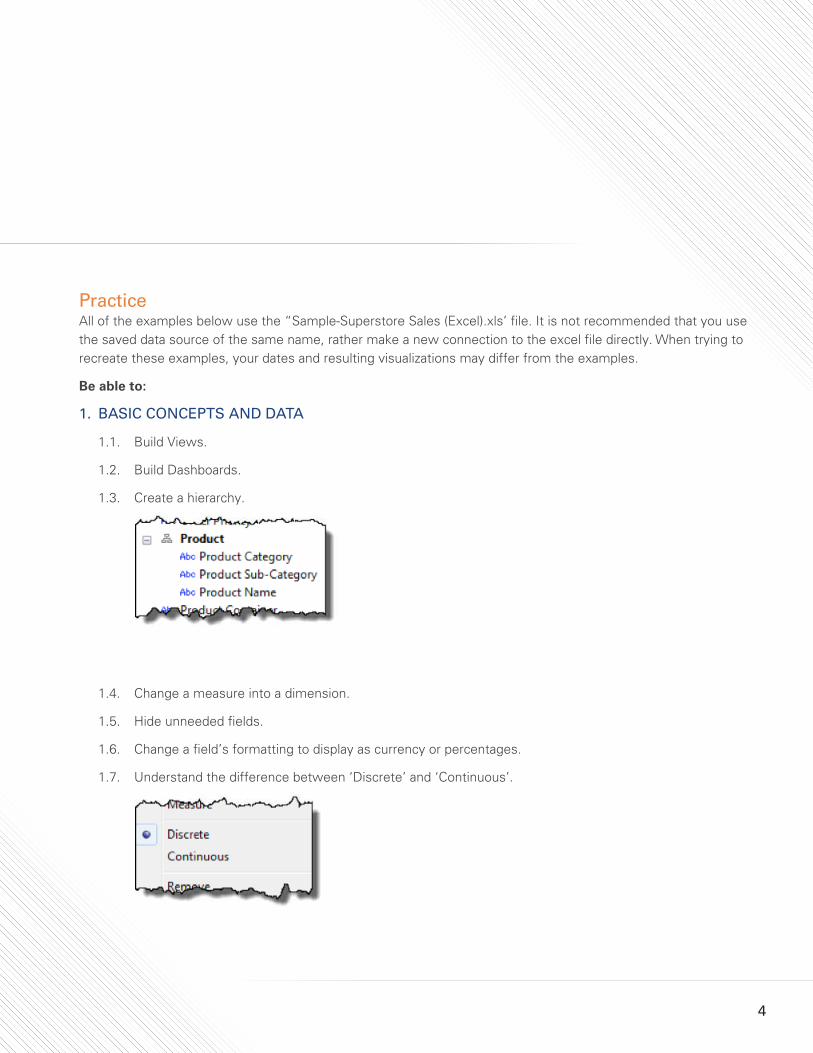
1.3. Create a hierarchy.
1.4. Change a measure into a dimension.
1.5. Hide unneeded fields.
1.6. Change a field’s formatting to display as currency or percentages.
1.7. Understand the difference between ‘Discrete’ and ‘Continuous’.
4
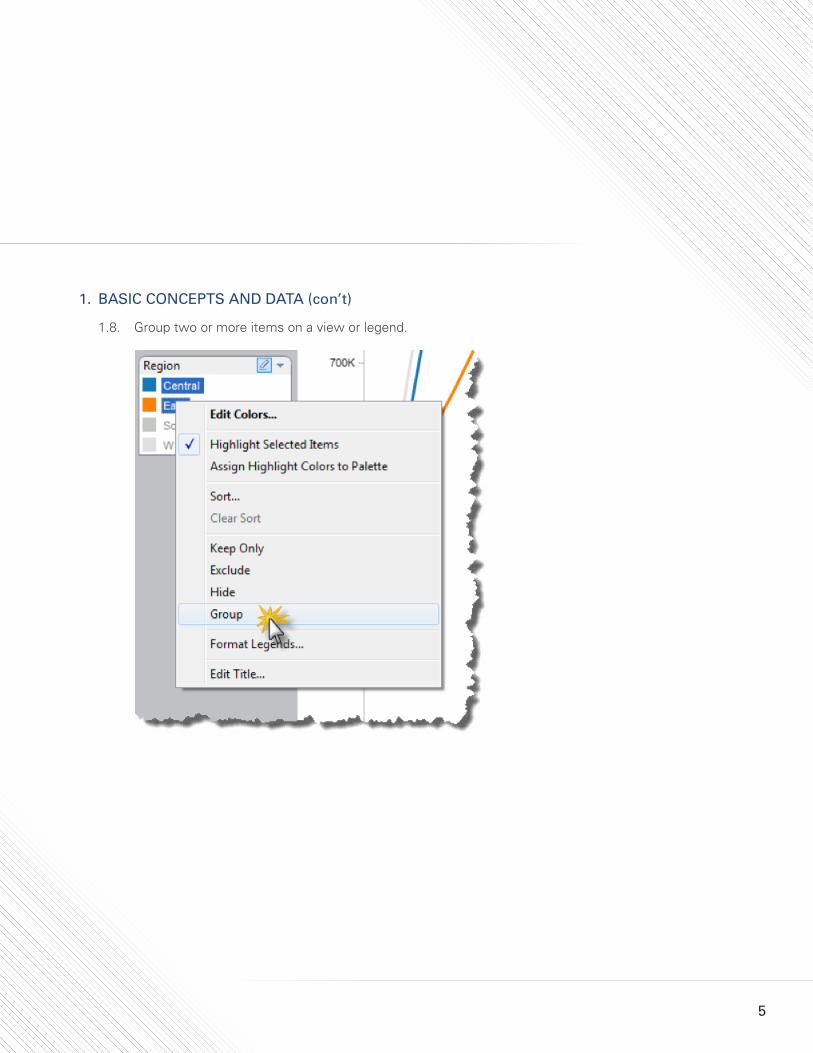
1. BASIC CONCEPTS AND DATA (con’t)
1.8. Group two or more items on a view or legend.
5
1. BASIC CONCEPTS AND DATA (con’t)
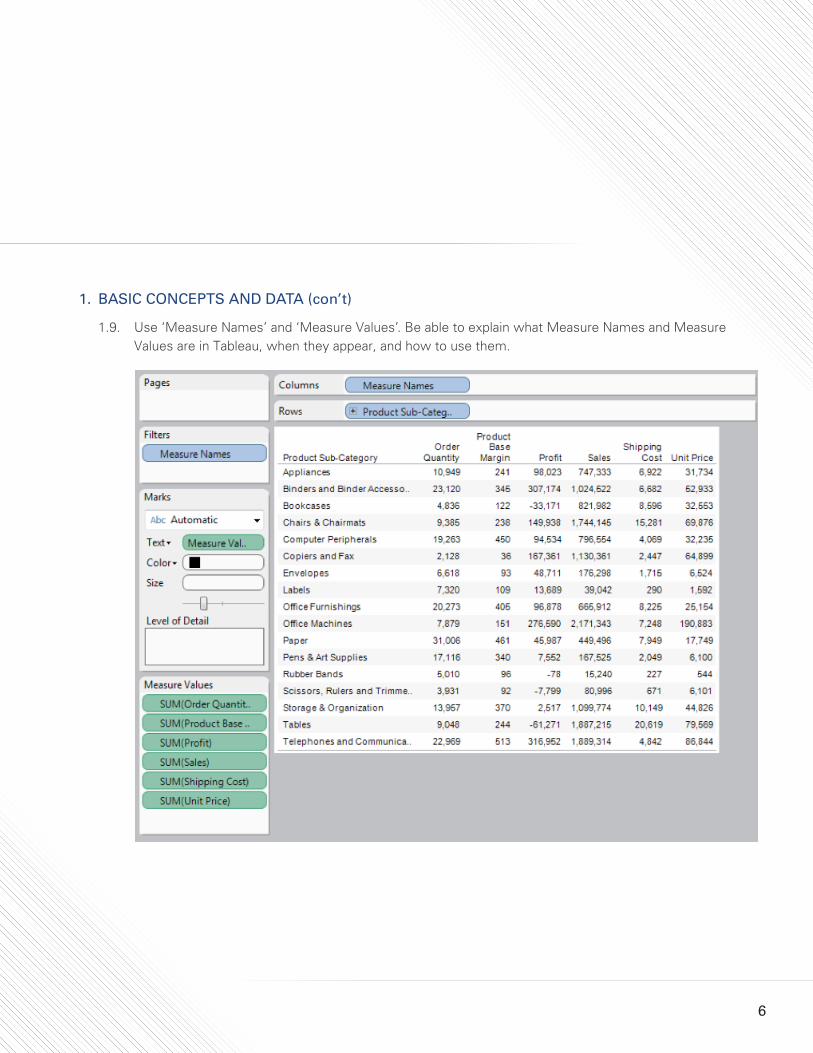
1.9. Use ‘Measure Names’ and ‘Measure Values’. Be able to explain what Measure Names and Measure Values are in Tableau, when they appear, and how to use them.
6
1. BASIC CONCEPTS AND DATA (con’t)
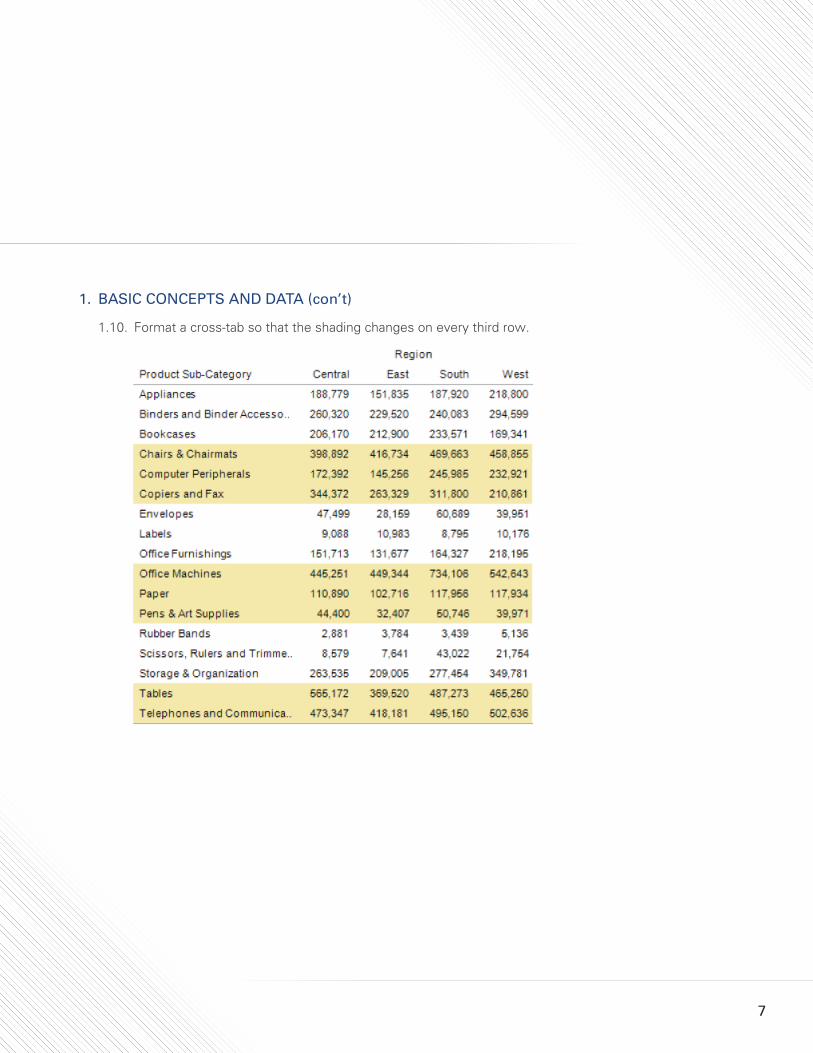
1.10. Format a cross-tab so that the shading changes on every third row.
7
1. BASIC CONCEPTS AND DATA (con’t)
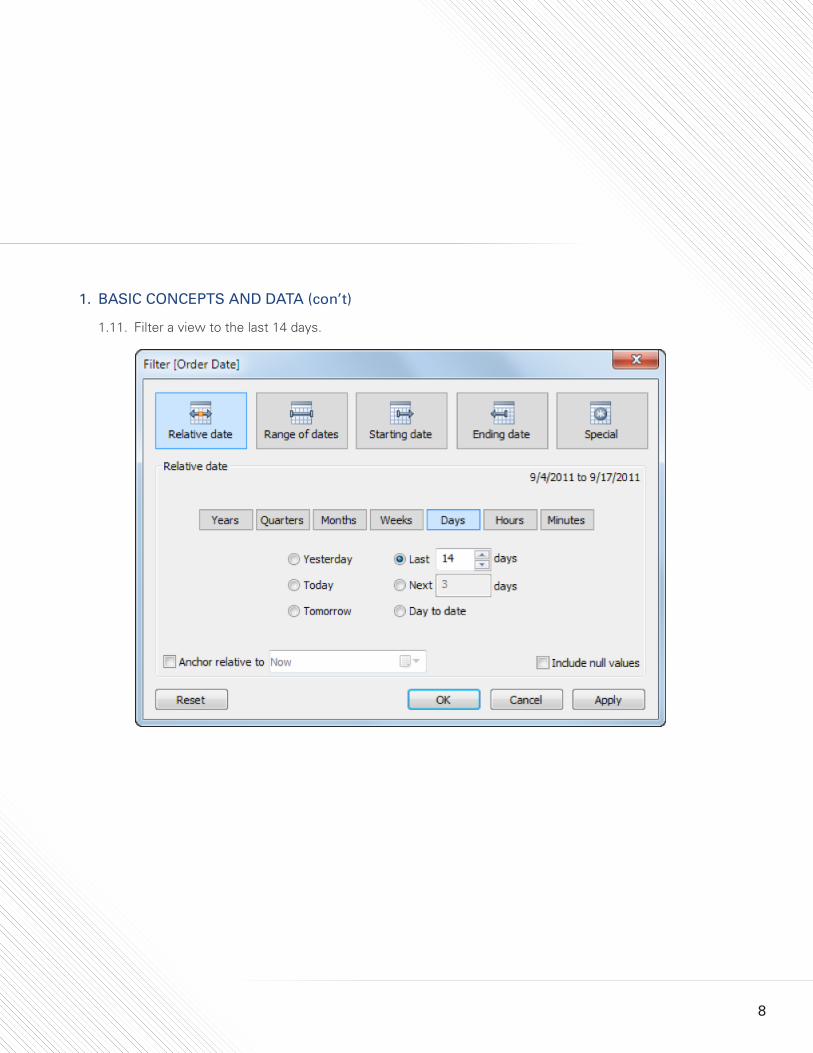
1.11. Filter a view to the last 14 days.
8
1. BASIC CONCEPTS AND DATA (con’t)
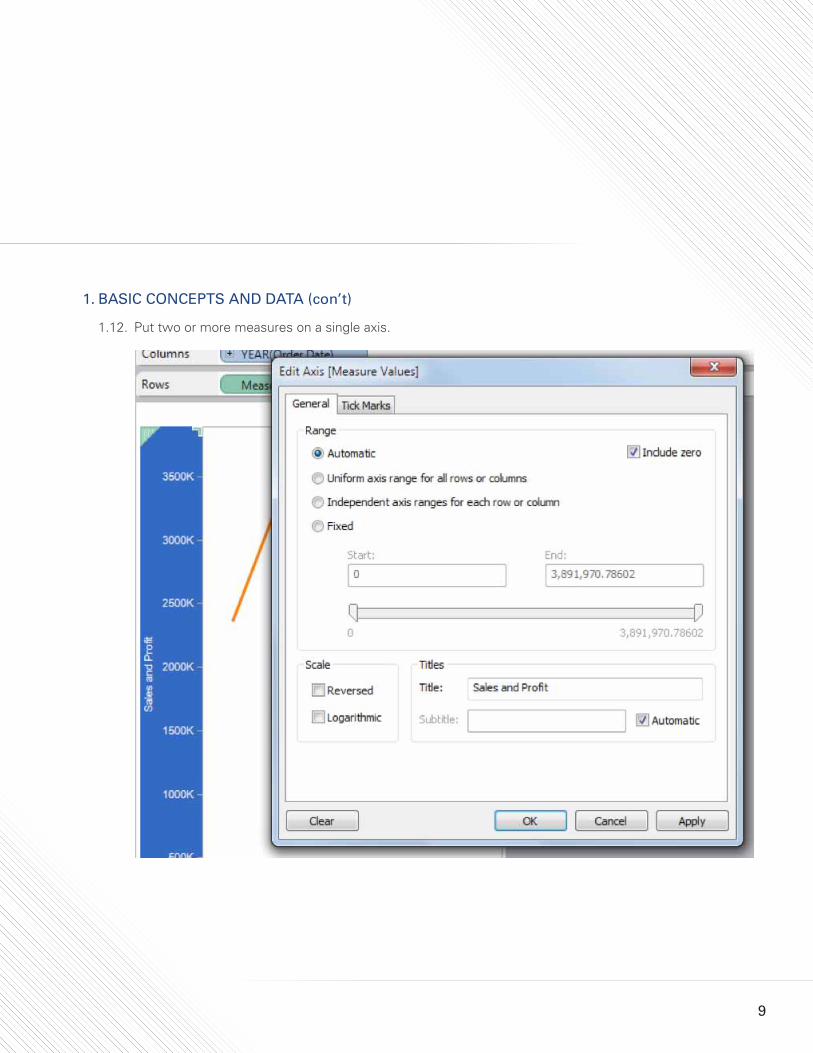
1.12. Put two or more measures on a single axis.
9
1. BASIC CONCEPTS AND DATA (con’t)
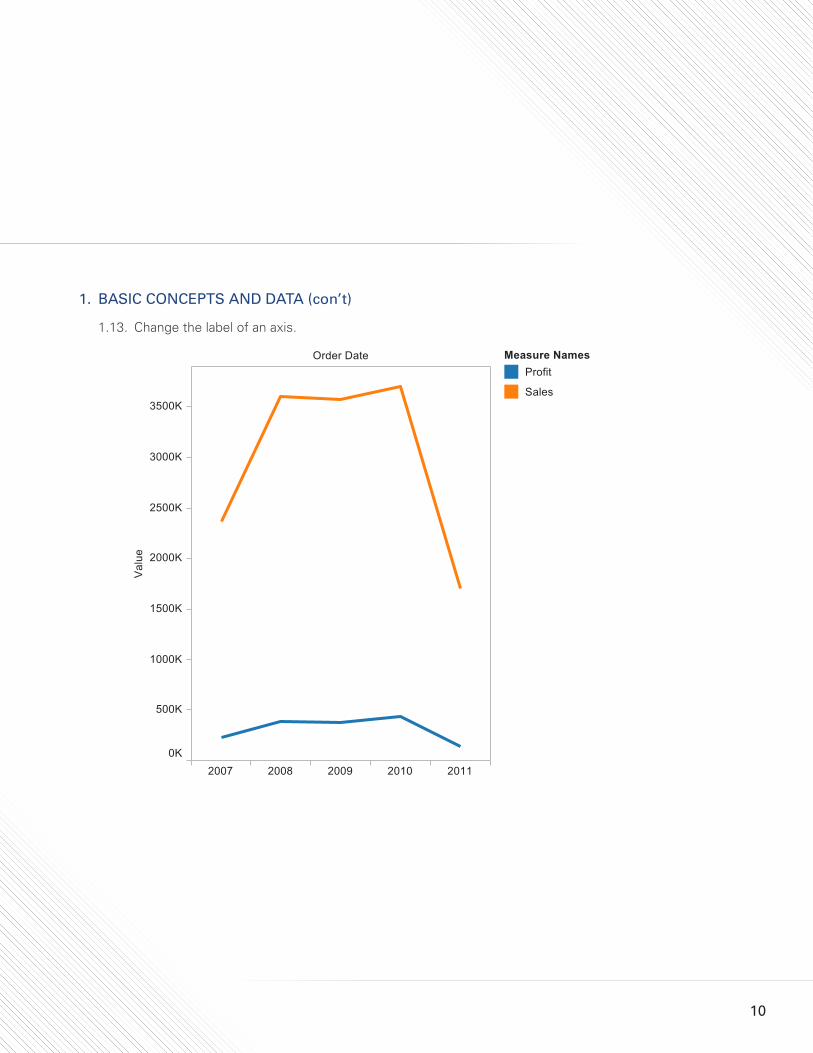
1.13. Change the label of an axis.
10
1. BASIC CONCEPTS AND DATA (con’t)
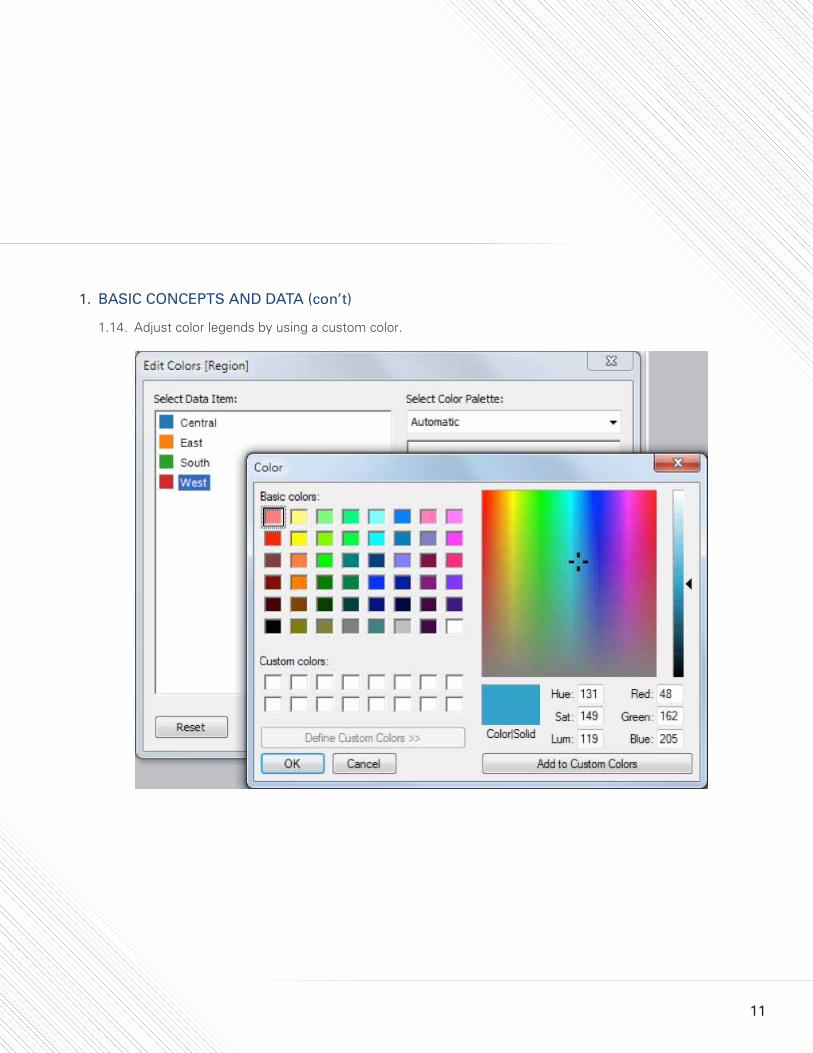
1.14. Adjust color legends by using a custom color.
11
1. BASIC CONCEPTS AND DATA (con’t)
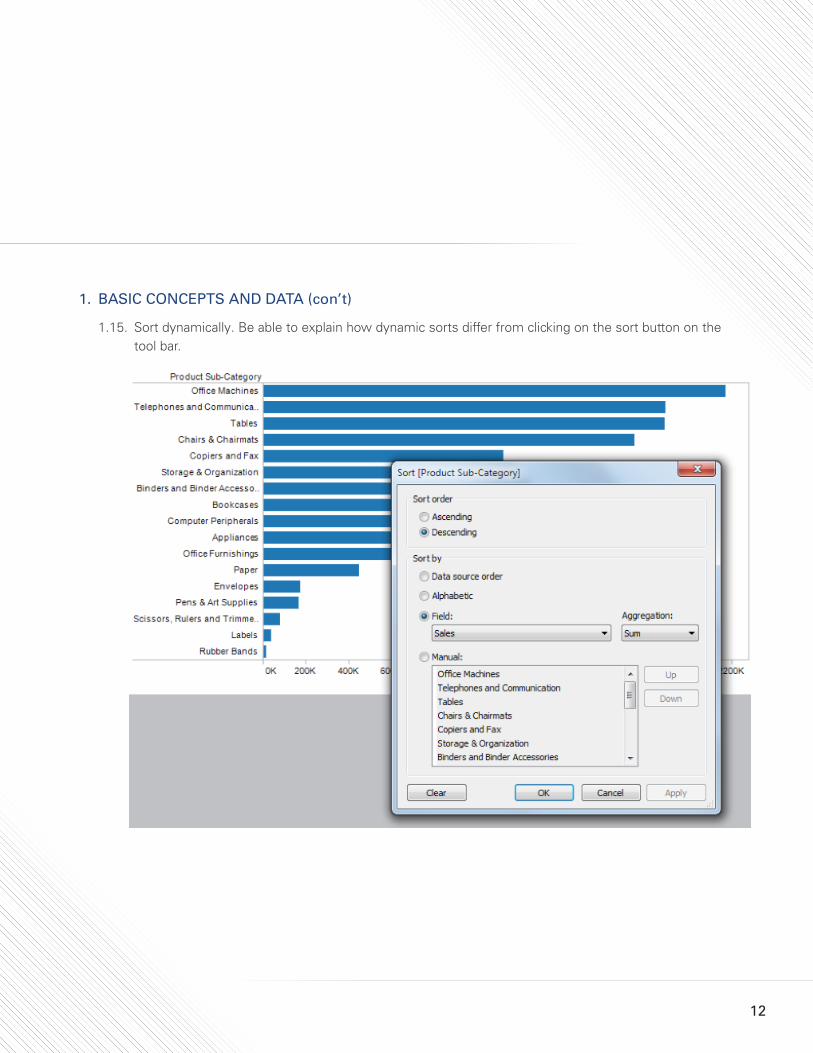
1.15. Sort dynamically. Be able to explain how dynamic sorts differ from clicking on the sort button on the tool bar.
12
1. BASIC CONCEPTS AND DATA (con’t)
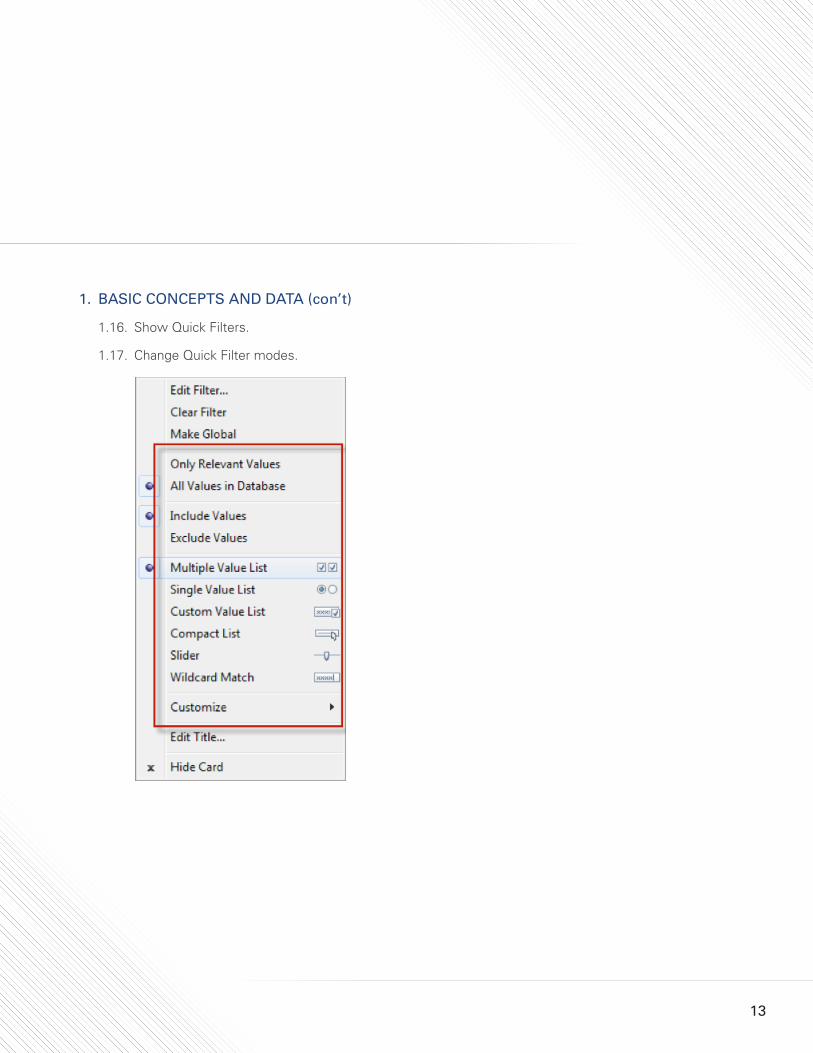
1.16. Show Quick Filters.
1.17. Change Quick Filter modes.
13
1. BASIC CONCEPTS AND DATA (con’t)
1.18. ‘Make Global’ filters.
1.19. Understand how ‘Context Filters’ interact with Top n filters.
1.20. Understand the difference between making a field discrete versus continuous. Why might you want to change this in Tableau? How can you tell if a field is discrete or continuous?
1.21. Understand your options when connecting 2 tables in Tableau Desktop.
1.22. What is a Saved Data Connection in Tableau and how might you use one?
1.23. Save a packaged workbook with your name as the title.
1.24. Publish to a Tableau Server.
14
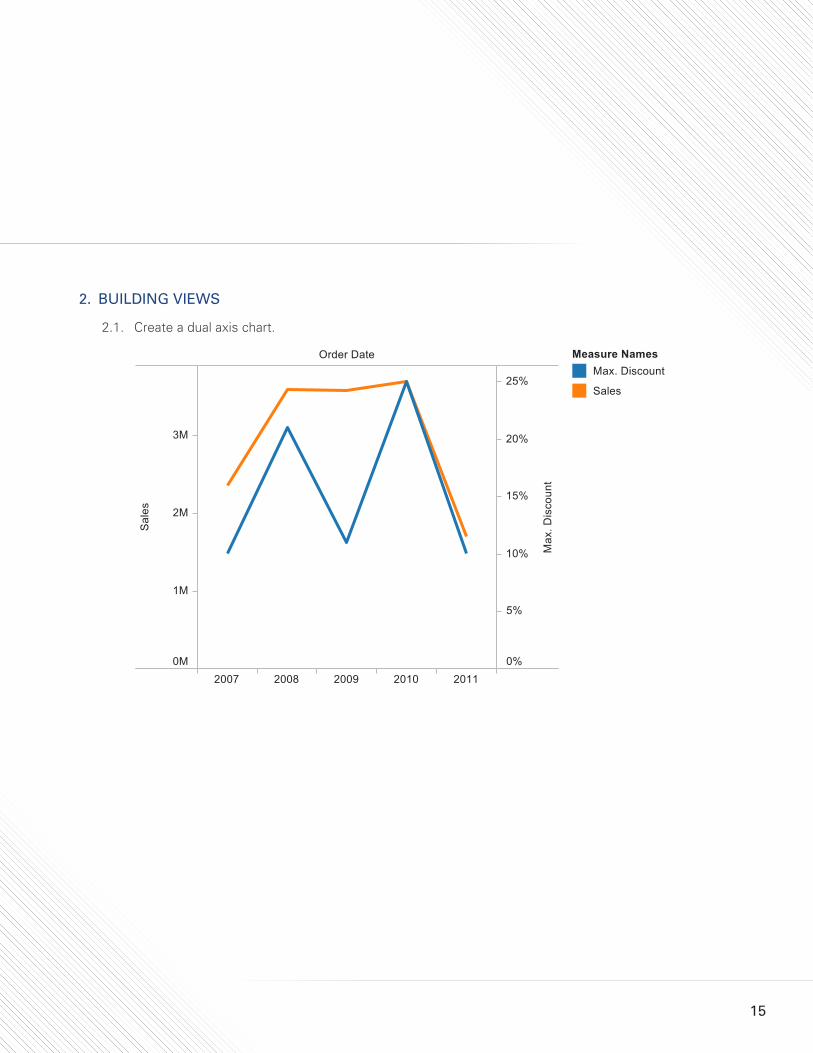
2. BUILDING VIEWS
2.1. Create a dual axis chart.
15
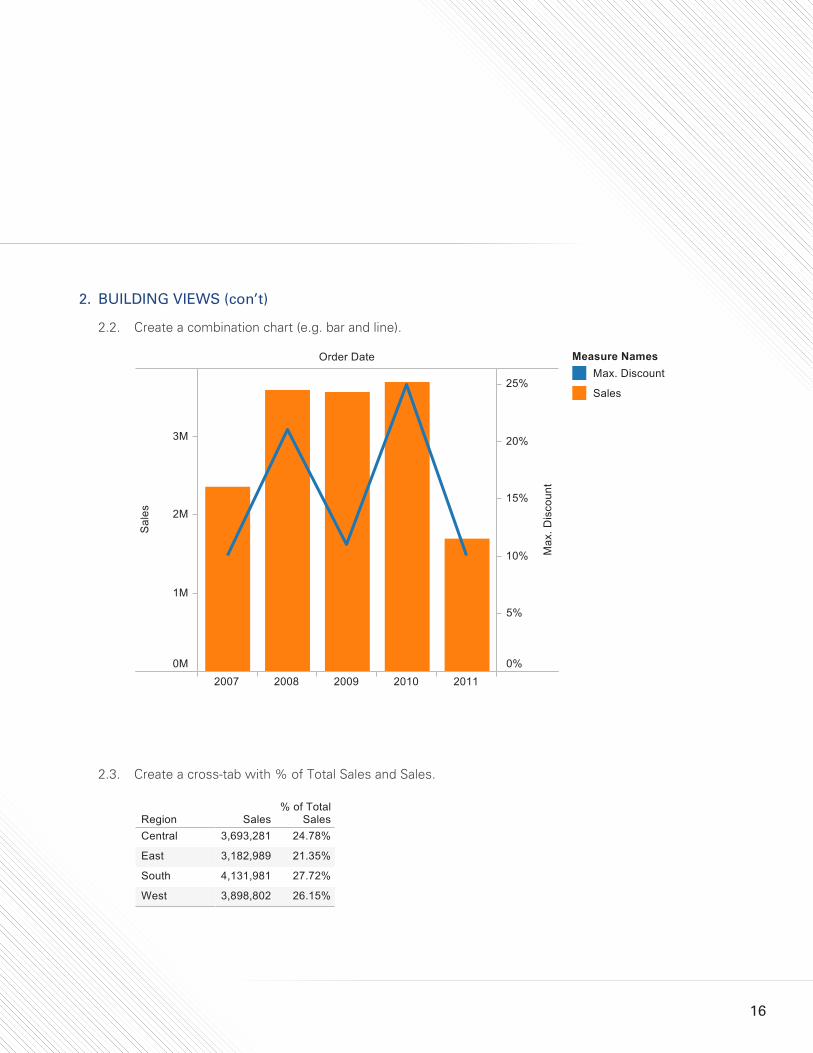
2. BUILDING VIEWS (con’t)
2.2. Create a combination chart (e.g. bar and line).
2.3. Create a cross-tab with % of Total Sales and Sales.
16
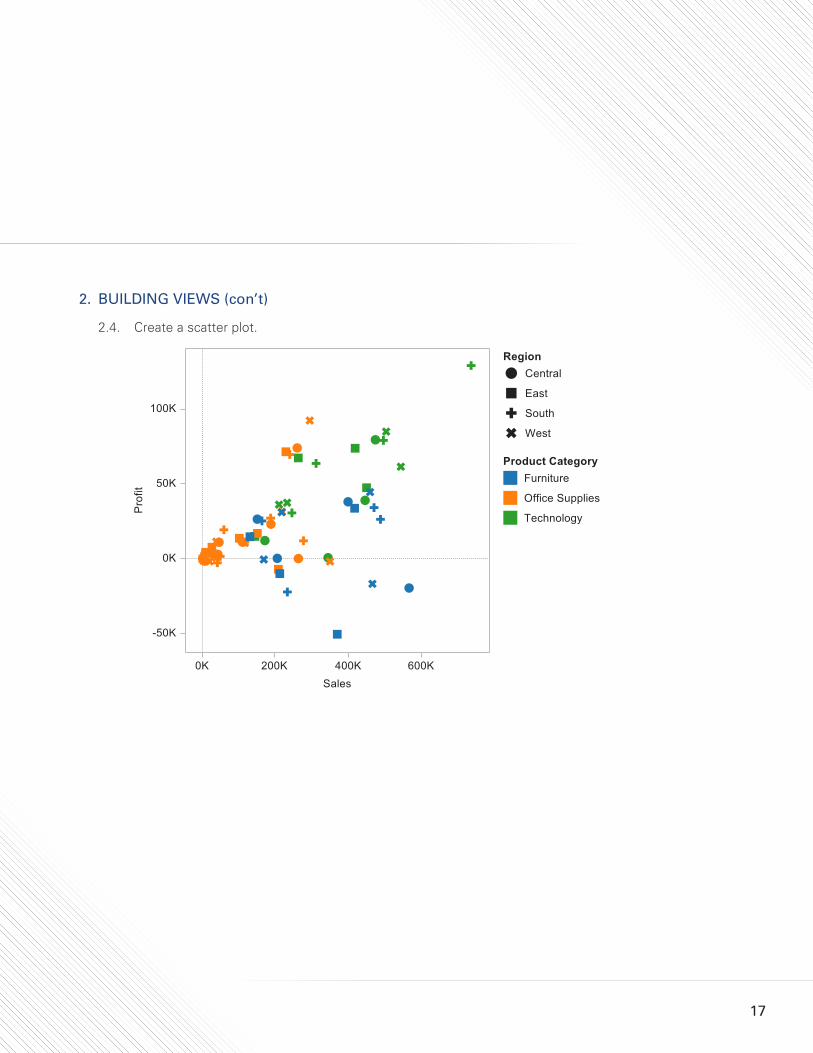
2. BUILDING VIEWS (con’t)
2.4. Create a scatter plot.
17
2. BUILDING VIEWS (con’t)
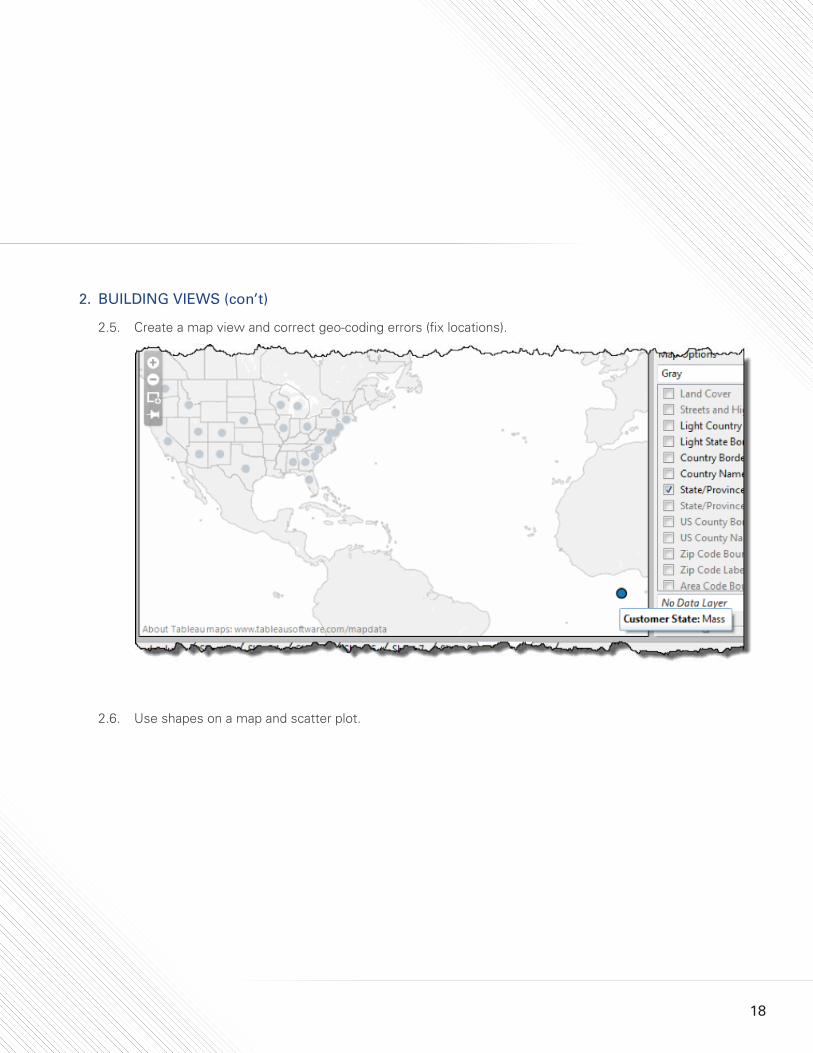
2.5. Create a map view and correct geo-coding errors (fix locations).
2.6. Use shapes on a map and scatter plot.
18
2. BUILDING VIEWS (con’t)
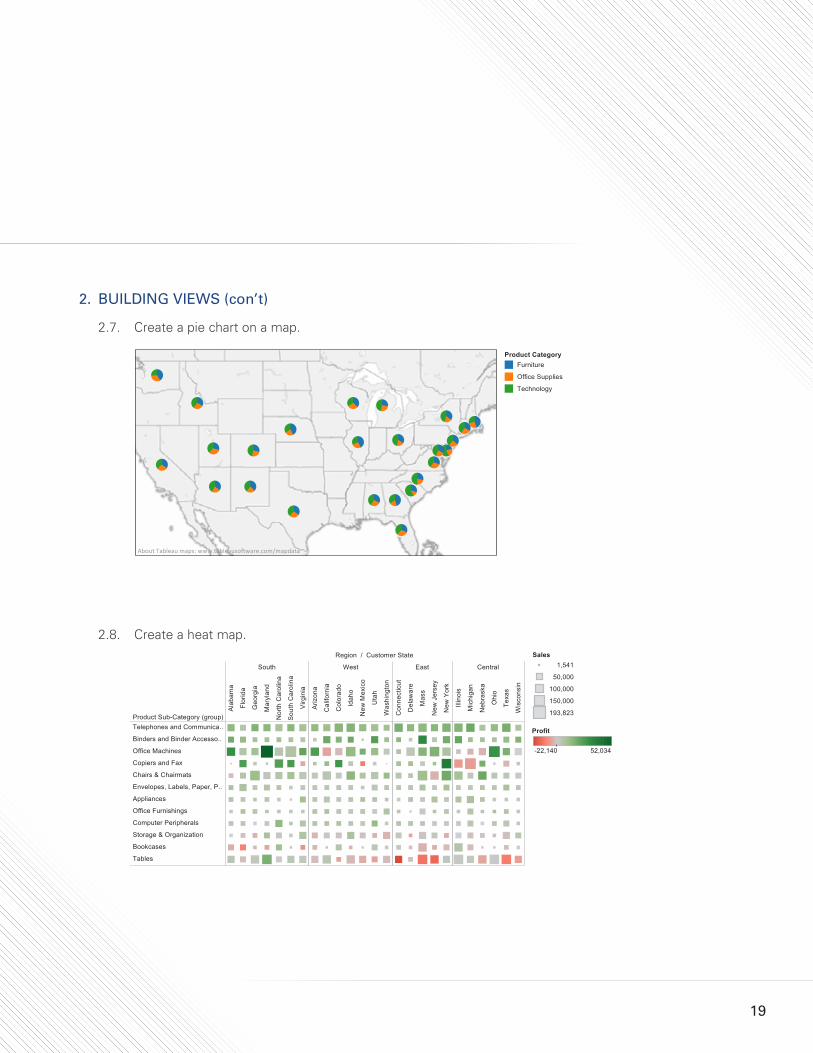
2.7. Create a pie chart on a map.
2.8. Create a heat map.
19
2. BUILDING VIEWS (con’t)
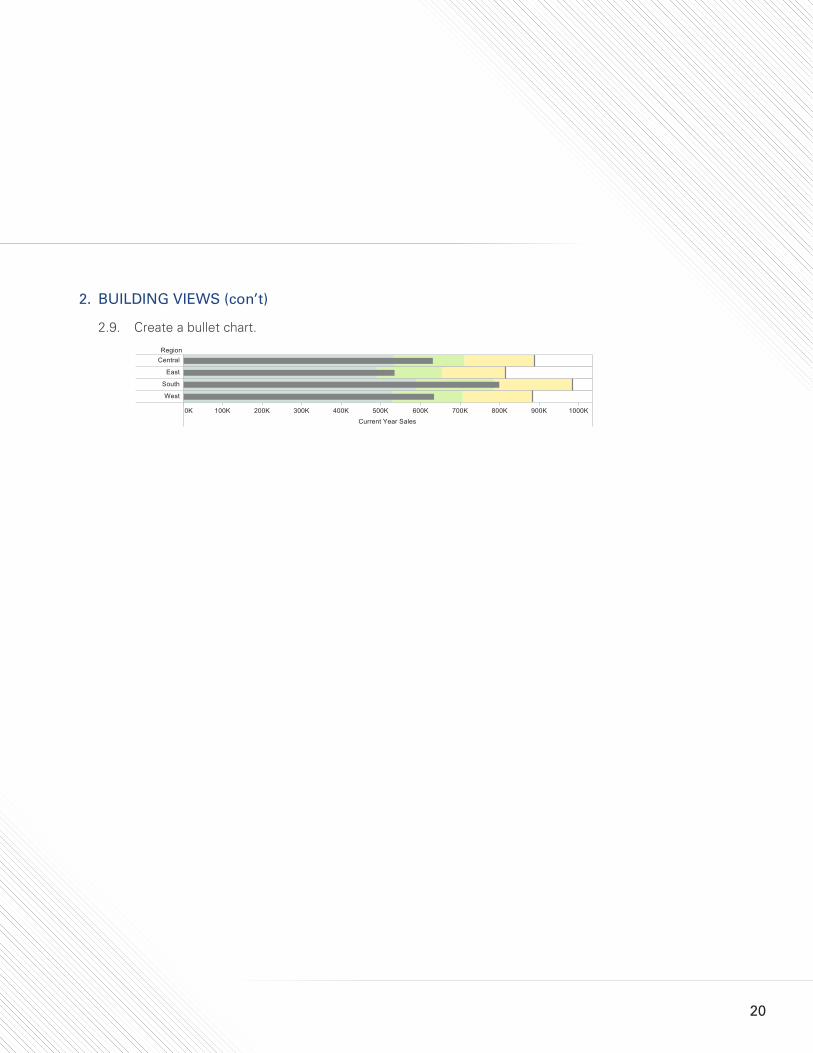
2.9. Create a bullet chart.
20
3. ANALYTICS
3.1. Create Calculated Fields.
3.2. Use date functions such as DATEDIFF() and DATETRUNC().
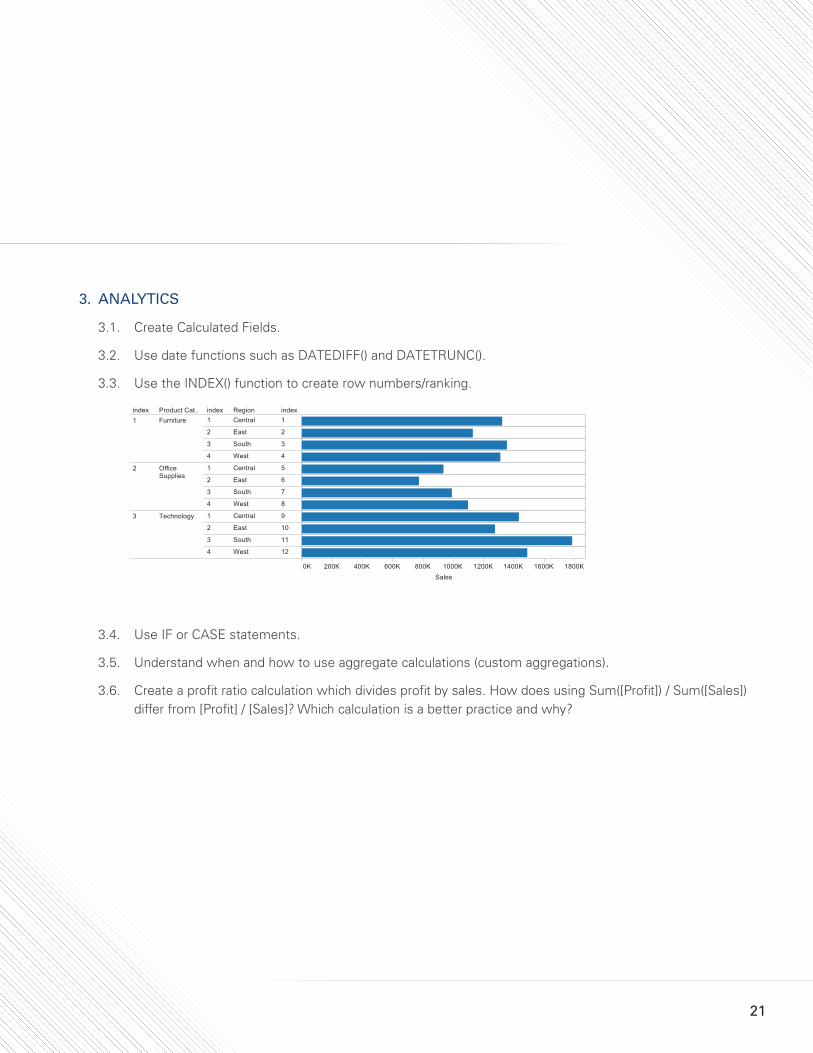
3.3. Use the INDEX() function to create row numbers/ranking.
3.4. Use IF or CASE statements.
3.5. Understand when and how to use aggregate calculations (custom aggregations).
3.6. Create a profit ratio calculation which divides profit by sales. How does using Sum([Profit]) / Sum([Sales]) differ from [Profit] / [Sales]? Which calculation is a better practice and why?
21
22
3. ANALYTICS (con’t)
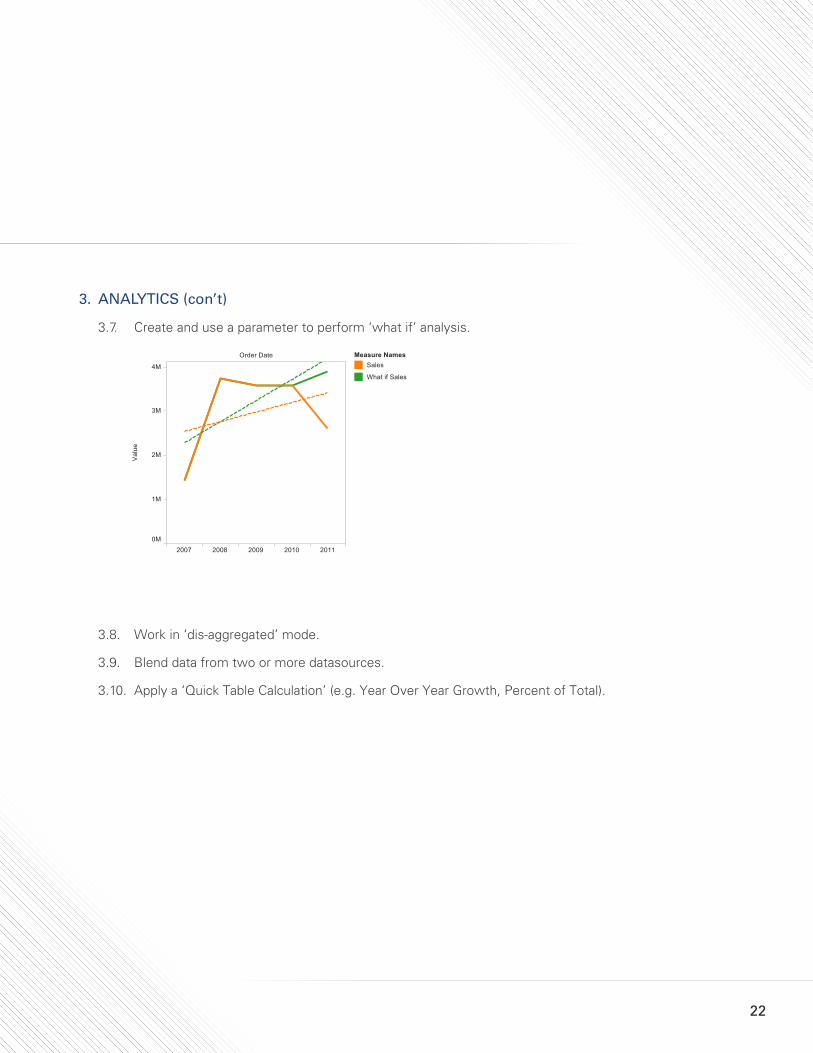
3.7. Create and use a parameter to perform ‘what if’ analysis.
3.8. Work in ‘dis-aggregated’ mode.
3.9. Blend data from two or more datasources.
3.10. Apply a ‘Quick Table Calculation’ (e.g. Year Over Year Growth, Percent of Total).
3. ANALYTICS (con’t)
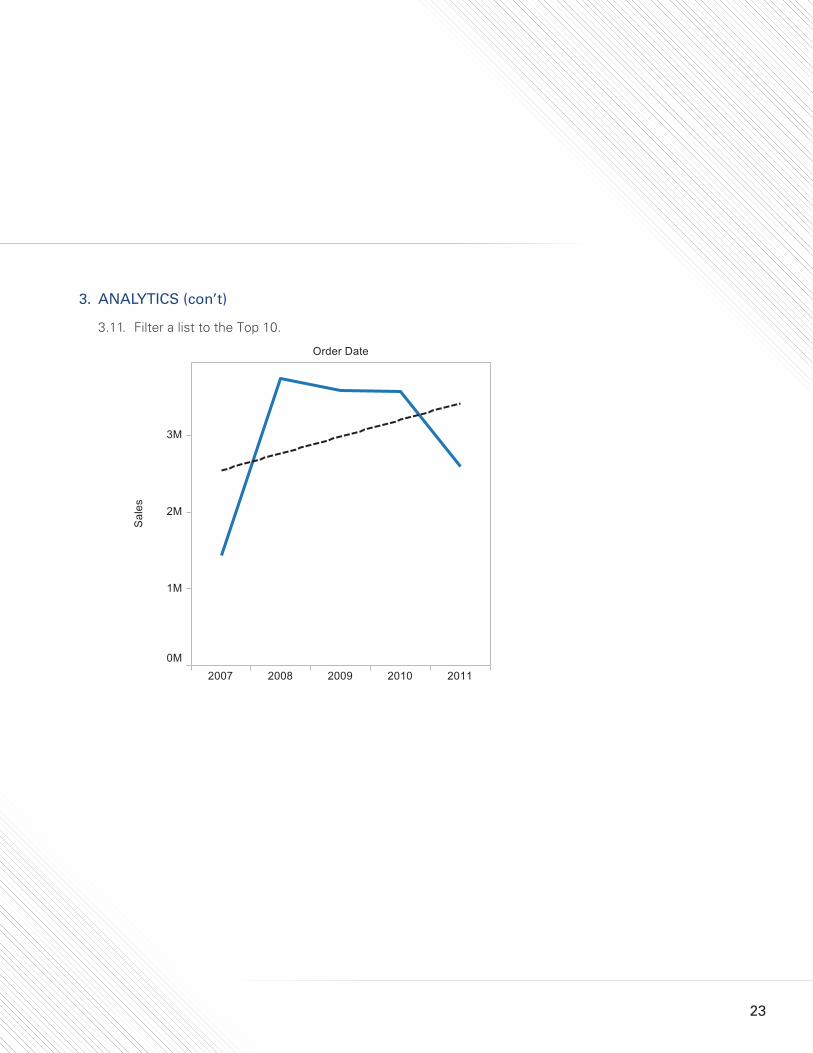
3.11. Filter a list to the Top 10.
23
3. ANALYTICS (con’t)
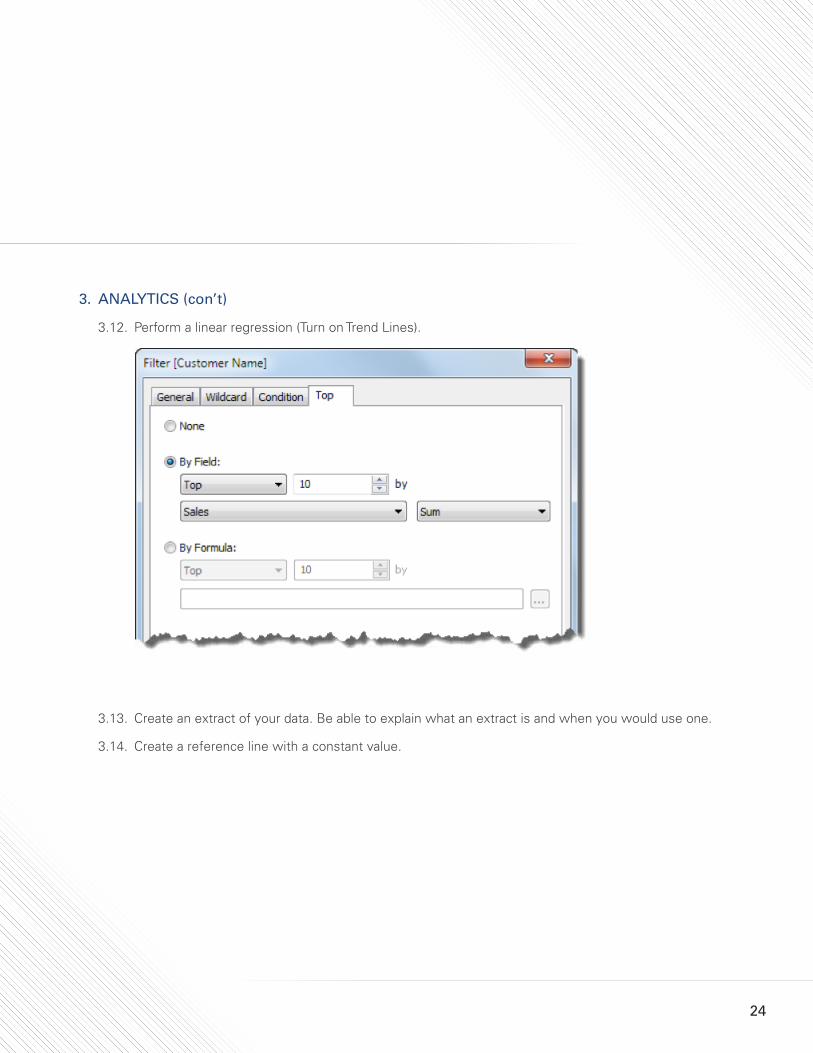
3.12. Perform a linear regression (Turn on Trend Lines).
3.13. Create an extract of your data. Be able to explain what an extract is and when you would use one.
3.14. Create a reference line with a constant value.
24
3. ANALYTICS (con’t)
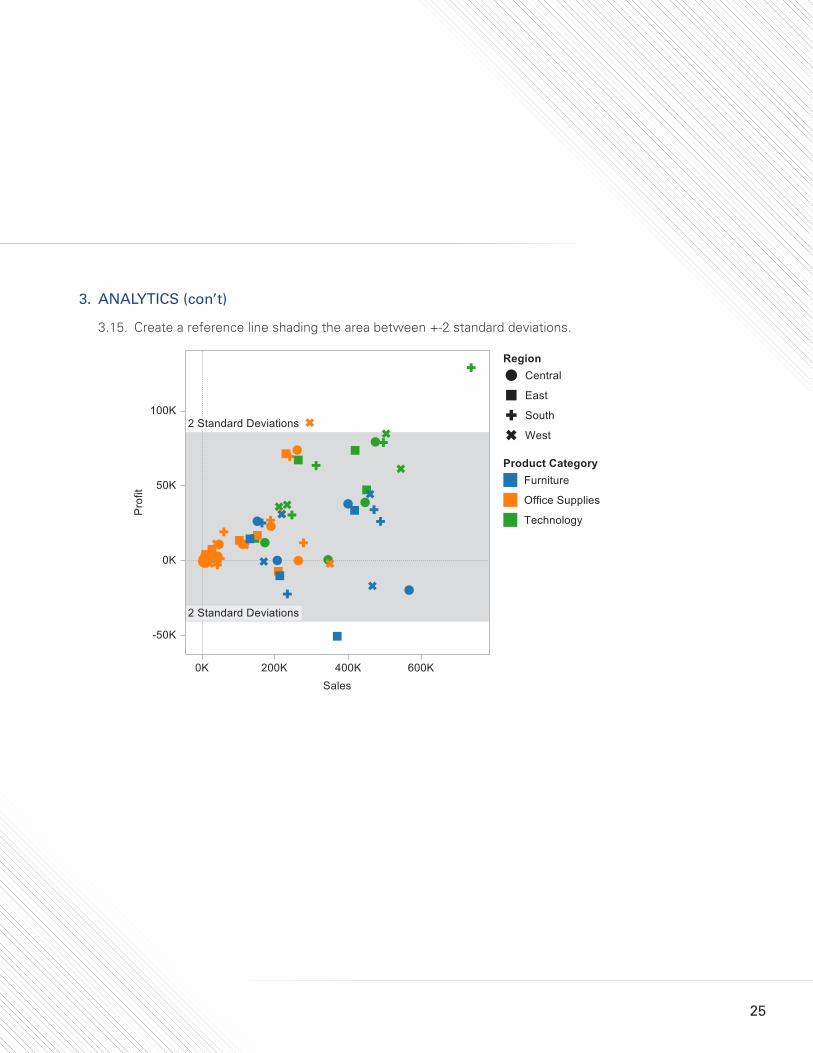
3.15. Create a reference line shading the area between +-2 standard deviations.
25
4. DASHBOARDS
4.1. Add quick filters to dashboards.
4.2. Organize dashboards by moving items.
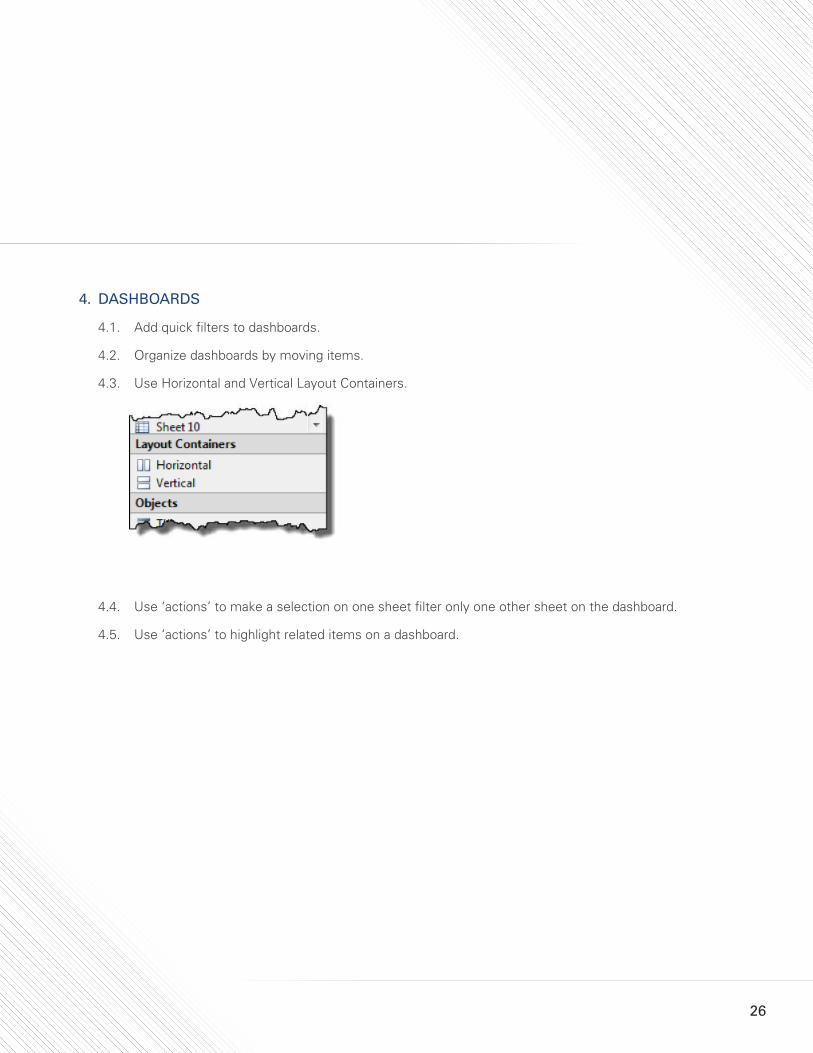
4.3. Use Horizontal and Vertical Layout Containers.
4.4. Use ‘actions’ to make a selection on one sheet filter only one other sheet on the dashboard.
4.5. Use ‘actions’ to highlight related items on a dashboard.
26