tackling uk poverty and disadvantage in the twenty … joseph rowntree foundation has supported this...
TRANSCRIPT

Tackling UK poverty and disadvantage in the twenty-first century
An exploration of the issues
Edited by David Darton and Jason Strelitz
R O W N T R E E
F O U N D AT I O N
J O S E P H
JR
Using this reportThis book is primarily designed to be accessed as a pdf
document. It contains internal links that can be followed by
hovering over the underlined text with your cursor. You can
return to your original place in the text using marginal
arrow/page number boxes (e.g. ). This publication is
also available in hard copy form.
The Joseph Rowntree Foundation has supported this project as
part of its programme of research and innovative development
projects, which it hopes will be of value to policy makers,
practitioners and service users. The facts presented and views
expressed in this report are, however, those of the authors and
not necessarily those of the Foundation.
Joseph Rowntree Foundation
The Homestead
40 Water End
York YO30 6WP
Website: www.jrf.org.uk
© Joseph Rowntree Foundation 2003
First published in 2003 by the Joseph Rowntree Foundation
All rights reserved. Reproduction of this report by photocopying
or electronic means for non-commercial purposes is permitted.
Otherwise, no part of this report may be reproduced, adapted,
stored in a retrieval system or transmitted by any means,
electronic, mechanical, photocopying, or otherwise without the
prior written permission of the Joseph Rowntree Foundation.
ISBN 1 85935 070 4 (paperback)
1 85935 090 9 (pdf: available at www.jrf.org.uk)
A CIP catalogue record for this report is available from the
British Library.
▲ 9

Part I
David Darton and Jason Strelitz
1 Introduction: The unsolved problem within the UK’s economic success 7
2 The key questions 13
3 Appendices to Part I 31
i A poverty indicator 31
ii The association of poverty with other disadvantage 36
iii Labour market trends 38
iv Geographic trends 41
v Demographic trends 43
vi Types of household in poverty 45
vii Gender and poverty 47
viii The reasons for tackling poverty 49
Part II
4 Tackling disadvantage: Education 57
Inequalities of opportunities and outcomes
Jason Strelitz
5 Tackling disadvantage: Families 76
Breaking the link between family poverty and social exclusion
David Utting
6 Tackling disadvantage: Place 91
Inequalities in the regions
Jason Strelitz and David Darton
Contents
7 Tackling disadvantage: Incomes 104
Combining opportunity and support
Donald Hirsch and David Darton
8 Tackling disadvantage: Housing 120
More shortages and homelessness?
Richard Best
9 Tackling disadvantage: Care 143
Meeting the growing demand for long-term care
Richard Best
Part III
Conclusion 161
People consulted by JRF 163

Part I

The UK has become much more prosperous over the last two decades. The considerableeconomic success enjoyed by the nation has been reflected in increased affluence andopportunities for the majority of British people. For example:
• Median income1 has risen by nearly 50 per cent, with a huge expansion in leisure spendingon items such as holidays and eating out, increased access to a range of household goodsand a continuing increase in home ownership.
• We are far more mobile – in 2001/2 the total number of miles travelled was 30 per centhigher than 15 years ago.
We are now among the 10 richest countries in the world in terms of average income per head.However, behind this story of economic success lies a major problem: the sustained highnumbers of households on relatively low incomes (see Figure 1.1).
• The poorest 10 per cent, and even the poorest 25 per cent, have benefited much less thanthe rest from the increase in prosperity over the last 20 years.2
• During the 1980s, whilst median income rose by 28 per cent in real terms, that of thebottom quarter rose by only 15 per cent, and that of the bottom 10 per cent by only 6 percent. In recent years, whilst the incomes of all have grown at a more equal rate, the gapsof the 1980s have not been closed.
• Relative to the majority of the population, many people – and in some cases wholeneighbourhoods – have fallen further and further behind. Many millions of people areunable to afford goods and services that the majority deem necessary. Wider disadvantageassociated with this increase in poverty, such as growing health inequalities and areadeprivation have been well documented.3
In this web report we discuss important next steps in tackling disadvantage over the next 20years. This and the summary document Tackling disadvantage: A twenty year enterprise arebased on a wide-ranging review of the research evidence and a large-scale consultation withacademics and practitioners in the field.
This report deals with broad questions of why we should be concerned with tacklingpoverty and disadvantage, what is meant by these concepts and the feasibility of a sustained,long-term drive to tackle them. There are links between the chapters that deal with particularaspects of reducing poverty. These discuss policy goals in areas such as education, family andhousing policy, and provide some illustrations of how aspects of policy may be oriented if thereduction of disadvantage is the long-term priority. These are designed to spark policy debate
7
1 Introduction: Theunsolved problem within
the UK’s economic success
Tackling UK poverty and disadvantage in the twenty-first century

in preparation for the Foundation’s Centenary Conference in 2004, which we hope will set outan agenda for tackling poverty over the next 20 years.
This agenda must address how to reduce widespread poverty whilst ensuring that themomentum of economic growth experienced over the last 20 years is maintained.4 In the1980s, Government policy aimed to increase incentives (i.e. financial rewards) for ‘enterprise’and ‘wealth creation’, with the goal of ending the economic stagnation and high inflation ofthe 1970s. But the theory that rising prosperity would then ‘trickle down’ to the rest of thepopulation proved to be incorrect. The 1980s saw a huge rise in the number of people whoseincomes were far below the incomes of the majority. In general over the last 20 years, worse-off people saw their incomes stagnate or grow much more slowly than the average.
There is now a broad consensus that it is important to reduce the widespread poverty thathas resulted, and that the market will not achieve this on its own through some kind of ‘trickledown’ effect. Nevertheless, the levels of poverty remain at stubbornly high levels incomparison with both our post-war history and the present situation in most Europeancountries. We now have almost the highest level of relative poverty5 in Europe, and thechallenge is to steadily reduce it so that in 20 years it is the lowest.
Policies introduced in recent years, or announced for implementation in the near future,may yet have some significant impact on meeting this challenge. But it is timely to highlightkey areas where further policy development is essential if we are really to make substantialinroads into tackling disadvantage.
8 Tackling UK poverty and disadvantage in the twenty-first century
Figure 1.1 Change in incomes 1981–2000. Income for households at variouspercentiles and the median (before housing costs) at 2001 prices
170
160
150
140
130
120
110
100
90
80
Source: Office for National Statistics (2002) Social Trends 32, London: The Stationery Office
1981
1982
1983
1984
1985
1986
1987
1988
1989
1990
1991
1992
1993
–4
1994
–5
1995
–6
1996
–7
1997
–8
1998
–9
1999
–00
10th percentile25th percentileMedian
75th percentile90th percentile
Inde
x: 1
981
= 1
00
Note: Each line on the above graph shows income growth at a particular point in the distribution. For examplea person who is poorer than exactly 90% of the population is at the 10th percentile

We begin this task in the next chapter of this report, which addresses some key questions:
1 Poverty: What do we mean? What should we be aiming for?2 What impact will demographic and economic trends have on the extent and nature of
poverty and disadvantage?3 Who exactly are we talking about? What characterises the population in poverty?4 Why is it important to reduce poverty? 5 Is tackling poverty an economically and politically feasible goal?6 What broad approach will ensure that if we tackle poverty we do not scupper economic
growth?
The answers to these questions underpin the arguments made in Part II, where chapters dealwith some specific policy areas:
Tackling disadvantage: Education Inequalities of opportunities and outcomesJason StrelitzThis paper argues that a major policy challenge is to address the needs of the one-in-fouryoung people who get no GCSEs A*–C, who are left in a highly vulnerable position withrespect to future employment and educational opportunities.
The policy goals suggested are to:
• Reduce wider inequalities, beyond education, to give students the right start in childhood.
• Tackle concentrations of disadvantage within schools with policies that counter, rather thancontribute to polarisation.
• Prioritise the tackling of low attainment in the allocation of resources and in the incentivestructure governing the way schools are run.
Tackling disadvantage: FamiliesBreaking the link between family poverty and social exclusionDavid UttingThis argues that a major policy challenge is to reduce the huge numbers of children who stillgrow up in poverty, and develop policies that support families and tackle some of the widerexclusionary factors experienced by poor families.
The policy goals suggested deal with the need to:
• Sustain the assault on child poverty, in terms of bringing ever more families above asatisfactory income threshold.
• Structure services to deliver support to families, which offers direct help to parents andchildren in dealing with their lives.
• Extend family support policies in new directions.
9Tackling UK poverty and disadvantage in the twenty-first century

Tackling disadvantage: PlaceA persistent regional divideJason Strelitz and David DartonThis argues that a major policy challenge is to enable the rest of the UK regions to catch upwith London and the South-East. Whilst there is poverty in all regions, much of the countryoutside of the south of England is characterised by a fundamental lack of wealth generation.In these areas, the lack of good employment opportunities operates as a major barrier totackling poverty.
The policy goals suggested are to:
• Deploy targeted support for private investment in ways that the evidence suggests canhave the most positive impact.
• Deploy public spending with regional considerations in mind.
• Encourage an urban renaissance through broad support for policies encouraging people toreturn to urban living, whilst maintaining a regional focus.
• Support the development of bottom-up solutions.
Tackling disadvantage: IncomesCombining opportunity and supportDonald Hirsch and David DartonThis argues that a major policy challenge is to ensure that no one has an income below 60 percent of median income for sustained periods, at the same time gradually reducing the role ofmeans-testing. Recent initiatives to reshape the welfare state may help towards ensuring anadequate minimum income. Most notable has been the introduction of tax credits and somehelpful specific measures for particular groups, such as more generous earnings disregards incertain circumstances, or the disregard of Disability Living Allowance in means testing fordisabled people. This paper highlights some future directions for policy within a frameworkthat would allow more people to have an adequate minimum income without disincentivisingthose contributions that the UK needs, such as paid employment, caring or education andtraining.
The policy goals suggested are to:
• Enhance earnings from paid work.
• Value and reward activities outside paid work.
• Create a sound basis for providing incomes for needy groups outside the labour market.
10 Tackling UK poverty and disadvantage in the twenty-first century

Tackling disadvantage: Housing More shortages and homelessness?Richard Best This argues that a major policy challenge is to sharply reduce the shortages of homes – mostacutely felt by poor people in need of access to affordable homes.
The policy goals suggested are to:
• Change perceptions about land for housing and about urban living.
• Develop new approaches to increasing supply in this new context.
• Find better ways of ensuring that there are a sufficient number of affordable homes toserve disadvantaged households.
Tackling disadvantage: CareMeeting the growing demand for long-term careRichard BestThis argues that a major policy challenge is to find ways of meeting the cost of long-term care.Existing problems of funding adequate provision will only grow with an ageing population.Here the problem is not so much greater targeting of policy on the needs of those in poverty,but rather the need to take measures that ensure the overall supply of resources is sufficient.This is part of any anti-poverty strategy, because it is those who are relatively poor who willsuffer the most if there is an overall shortage of resources in areas such as care, health, orhousing.
The policy goals suggested are:
• Health education for all people, which can potentially reduce support costs in old age.
• Preventative support and intermediate care through improved low intensity support, whichwould reduce or delay the need for intensive long-term care and free-up hospital places.
• A new insurance-based mechanism for paying for long-term care.
11Tackling UK poverty and disadvantage in the twenty-first century

Notes1 Median households income is the income of the middle household if all households were to be lined up from the
poorest to the richest, taking account of different household sizes. This measure is increasingly used in preference tothe more common ‘average’ – the ‘mean’ – because the mean is more affected by growth in the income of theextremely rich. The median can be thought of as representing the income of the large number of people clusteredaround the middle of the income distribution. The figures in this project are based on the income left after housingcosts have been met, unless otherwise stated.
2 Barclay, Sir Peter (chair) (1995) Inquiry into Income and Wealth, York, Joseph Rowntree Foundation; Department ofWorks and Pensions (2002) Households Below Average Income 1994/5–2000/01, London: The Stationery Office.
3 Palmer, G., Rahman, R. and Kenway, P. (2002) Monitoring poverty and social exclusion 2002, York: Joseph RowntreeFoundation; Social Exclusion Unit (1998) Bringing Britain Together: A national strategy for neighbourhood renewal,London: The Stationery Office.
4 Other major challenges that affect the population as a whole, such as environmental ones or work-life balanceissues for the affluent majority, or problems of public services aimed at the whole population, are largely outside thescope of this report. We do note, however, at the outset that measures taken to alleviate poverty need to takeaccount of sustainability issues. The Joseph Rowntree Foundation has therefore been funding a programme of workon reconciling social needs and environmental needs, details of which can be found on the Foundation Website,www.jrf.org.uk.
5 In terms of 60 per cent below median income (see section on this below).
12 Tackling UK poverty and disadvantage in the twenty-first century

Poverty: What do we mean? What should we be aiming for?It is poverty and relative income that are importantMost people accept in general terms that poverty is more than just a lack of the basicrequirements of food and shelter:
• Nearly two in three people think someone in Britain is in poverty if they have enough to eatand drink, but not other things that they need.1
• A large majority believe a range of goods and activities to be ‘essential’ beyond food andshelter. These include a warm, waterproof coat, insurance for possessions and a damp-freehome.2
Surveys show that people’s idea of ‘necessities’ changes slowly over time. For example in 1983the majority did not consider that a telephone, having friends or family round for dinner orhaving a best outfit were necessities. By 2000 they did. They also thought that a wide range ofactivities were necessities, such as being able to collect children from school or being able tosave a minimal amount ‘for a rainy day’.
We therefore need an indicator of poverty trends that relates to general living standards atany given time. A range of measures might be chosen to define which households are poor,including:
– Households unable to afford certain things (either those things that the majority thinkare necessary (lacking socially-perceived necessities) or a basket of goods and servicesthat experts believe to be necessary (known as a Household Budget standard).
– Those for whom a very high proportion of expenditure is on basic goods like food andshelter.
– Longitudinal measures that show movements in and out of poverty.– Those whose relative income is low. A number of thresholds may be chosen, such as 50
per cent, 60 per cent and 70 per cent of median income.
It is useful for different purposes to consider all of these. Some countries also regularlymonitor indicators that are a mixture of measures – for example, the Irish poverty indicatorcombines income and possession of necessity measures.3
There is a danger that policy development is distracted by important, but often esoteric,debates about which measures should be used. The final choice of indicator inevitably hassome element of arbitrariness, but clarity and simplicity are important if the indicator is tomotivate change. We suggest that the measure that should be at the centre of discussionsabout poverty should be the number of people with incomes less than 60 per cent of themedian. For a discussion of the reason for this see Appendix i: A poverty indicator.
13
2 The key questions
Tackling UK poverty and disadvantage in the twenty-first century
▲ 9

There are a number of resources in addition to income that, through adequate collectiveprovision, allow people to ‘afford’ those things that society thinks of as essential; housing,care, and health services are amongst these. In the papers on specific policy areas, we considerthe disadvantages that a lack of some of these resources can create.
But adequate income is critical, and it is on poverty in these terms that this projectconcentrates. Evidence shows that lack of income is associated with a wide range of otherdisadvantages, such as worse health, poorer education and the likelihood of being a victim ofcrime.4 Some examples are given in Appendix ii: The association of poverty with otherdisadvantage.
What impact will demographic and economic trends have on theextent and nature of poverty and disadvantage?If we are to succeed in reducing poverty, we will have to effect change through policy.Economic and demographic trends will not lead to its reduction. Indeed, some polarisingtrends are likely to continue:
• In the labour market: The changing occupational structure of the labour market, polarisingbetween low paid and well paid work and spreading employment opportunities unequallyacross areas and households.
• Between areas: As a result of the location choices more affluent people and firms make.
• Between generations: Increased longevity and low fertility means that the population willcontinue to age. Unless the relative incomes of older people rise, this will contribute togrowing proportions of relatively poor people.
Policy that is concerned with tackling poverty will also need to take account of:
• Changing family structures that are resulting in a larger number of smaller, more diversehouseholds.
• Increasing need for people to combine and easily move between caring, training andemployment roles.
• High concentrations in some areas of people with low qualifications.
• A larger minority ethnic population.
• Relatively high numbers of immigrants.
These are covered in more detail in: Appendix iii: Labour market trends, which covers changingoccupational structure, increasing wage dispersion and the changing distribution of non-employment; Appendix iv: Geographic trends, which discusses some of the main factorsleading to polarisation between areas; and Appendix v: Demographic trends, which covers theageing population, increasing number of households, increasing numbers of people in minorityethnic groups and immigration trends.
14 Tackling UK poverty and disadvantage in the twenty-first century
▲ 9

Who exactly are we talking about? What characterises thepopulation in poverty?In this report, poverty refers to those households with incomes below 60 per cent of median.One way of understanding the broad characteristics of the population in poverty is as follows:
• Of the 11.5 million or so people in poverty, two million are pensioners.5
• Of the remaining 9.5 million, about 3.5 million are children; about 45% of these are insingle parent families.
• Of the six million non-pensioner adults in poverty, 2.5 million are parents. Just over800,000 of these are single parents and over 80 per cent of them are entirely reliant onbenefits, with no employment income. Just over 1.5 million couples with children make upthe remainder of poor parents and, with the extra flexibility that two parents have, justover half are reliant entirely on benefits. A fifth have a mix of earnings and benefit incomeand a quarter rely solely on earnings.
• That leaves 3.5 million adults in poverty living in households without children. Half of theseare lone adults; of those adults in poverty living in households without children, three-quarters are living on benefits alone. Only a quarter have earnings, and of these nearly athird supplement this with in-work benefits.
• Overall, 6.5 million of the 9.5 million non-pensioner poor are in households solely reliant onbenefits, with just over 21/4 million being children.
• Of the 23/4 million people in households with low earnings, just over 1 million are children.
• Of the 23/4 million people in households with low earnings, 11/4 million are in householdsreceiving in-work benefits.
Appendix vi: Types of household in poverty contains further data.
Different types of households vary in how far they are, on average, below the poverty line (60per cent of median income) – the so-called poverty gap. Figure 2.1 summarises this. Columnheight shows the average poverty gap of each group, column width shows the relative size ofthat group amongst the population with incomes below 60 per cent median.
A number of groups are at particular risk of being in poverty. These include somepensioners, lone parent families, workless households, those with low qualifications, thoseliving in particular areas and types of housing, minority ethnic groups and disabled people. Thefollowing sections look at each of these groups in turn.
Women are also likely to accumulate less income over their life times than men and aretherefore particularly vulnerable to poverty in certain circumstances. For a brief discussion ongender and poverty see Appendix vii.
PensionersIn 2000, more than one in four pensioners had incomes below 60 per cent of median income,and a large proportion of pensioners relied on means-tested benefits.6 The Minimum IncomeGuarantee provides £92.15 for a single pensioner. This is short of the £99–£125 that theFamily Budget Unit estimates a single pensioner requires to provide for basic dietary, warmthand transport needs.7 It is not as far short as some other groups and, as Figure 2.1 shows, the
15Tackling UK poverty and disadvantage in the twenty-first century
▲ 9

average depth of poverty is not as great for pensioners as some others. However, there is aproblem that significant proportions of pensioners do not claim their full entitlements.8
A further reason for specific concern about pensioner poverty is that the fluctuations ofincome which most people experience during their working life come to a relative standstill inlater life.9 For most pensioners there is little chance to increase income once retired. Theirincome will be based upon the entitlements they have built up during their working life andthe level of state provision. Converting assets and savings into income will be insufficient tocompensate for this over an extended period, especially for the most disadvantaged whogenerally lack assets and savings altogether.
The impact of pensioner poverty is most vivid each winter when thousands die, because ofan inability to keep their homes sufficiently warm. In the winter of 1999–2000, 44,000 olderpeople died of cold-related illnesses.10
Lone parentsThe number of lone parent families has trebled since the beginning of the 1970s.11 Today 22 per cent of families are headed by a lone parent, 90 per cent of which are female-led. AsFigure 2.1 shows, lone parent families account for about a fifth of poor households, but therisk of living in poverty is high (30 per cent). With responsibility for both caring and providingfor themselves and their children, it is very difficult for many lone parents to secure anadequate income. Whilst many lone parents express a desire to work – especially when thechildren start school – the high costs and uncertainty often associated with employment haveremained a great barrier. At the same time, for those who cannot find cost-effective work orwant to look after their children, critical social attitudes have, until recently, underpinned lowlevels of benefit that such families have been able to access. Consequently, more than half oflone parent families are living on incomes below 60 per cent median.
Workless householdsFigure 2.2 shows that most poor households rely on benefits. Work is a major route out ofpoverty. ‘Workless households’ account for half the poverty in the UK today. Seventy per centof workless households are poor, but where there are children – and nearly two millionchildren live in workless households – the risk rises to 90 per cent of households.12 Of thesechildren, approximately 70 per cent live in single parent families, whilst 30 per cent live inhouseholds headed by couples where neither partner works.
Households reliant on benefitsThe poverty of workless households is sustained not only by their lack of employment, but alsoby benefit levels that have until recently been moving families ever further away from theliving standards of the mainstream. In 1981 the Supplementary Benefit Rate was equivalent toone-fifth of average earnings; in 2000 Income Support was only one-eighth of averageearnings.13
People with low qualificationsThe link between qualifications and better-paid jobs remains strong. Currently, over 40 percent of working age adults with incomes below 60 per cent median lack any qualifications.14
16 Tackling UK poverty and disadvantage in the twenty-first century

People living in particular types of housing and particular areasResidents of social housing are particularly likely to be poor, as shown in Figure 2.3. The ‘rightto buy’ policy brought home ownership to many social housing residents who otherwisewould never have afforded it, but the majority of houses sold were from the best housingstock in the most socially mixed areas.15 The remaining social housing is now often a lastresort for people. People in social housing comprise half of the population below 60 per centof median income16 and, furthermore, many deprived areas are full of poor quality privately
17Tackling UK poverty and disadvantage in the twenty-first century
Figure 2.1 Average poverty gap by household typeWidth of column represents total share in poor population
90
80
70
60
50
40
30
20
10
0
Pove
rty
gap
(£ p
er w
eek)
Sole adult,no child
Two parents2+ adult,no child
Household type
Lone parent Pensioners
60
50
40
30
20
10
0
Source: Polimod dataset
Pove
rty
gap
(£ p
er w
eek)
Benefits only Benefits and earnings
Households by source of income
82
Earnings only
Figure 2.2 Average poverty gap by source of incomeWidth of column represents total share in poor population
Source: Polimod dataset
* The ‘poverty gap’ is the averageamount by which each householdfalls below 60% median income

rented accommodation. Concentrations of poverty are associated with wider disadvantage,such as a withdrawal of private services, under-funded public services and a poorenvironment.
Minority ethnic groupsDisproportionate numbers of working-age adults from minority ethnic groups have incomesbelow 60 per cent of the median. They also experience a higher prevalence of childdeprivation. In the Joseph Rowntree Foundation’s Poverty and Social Exclusion (PSE) Survey, 14per cent of ‘white’ children lacked two items that the majority of the population believe to benecessities, but 35 per cent of ‘non-white’ children did – over half from the latter group lackedat least one item.17
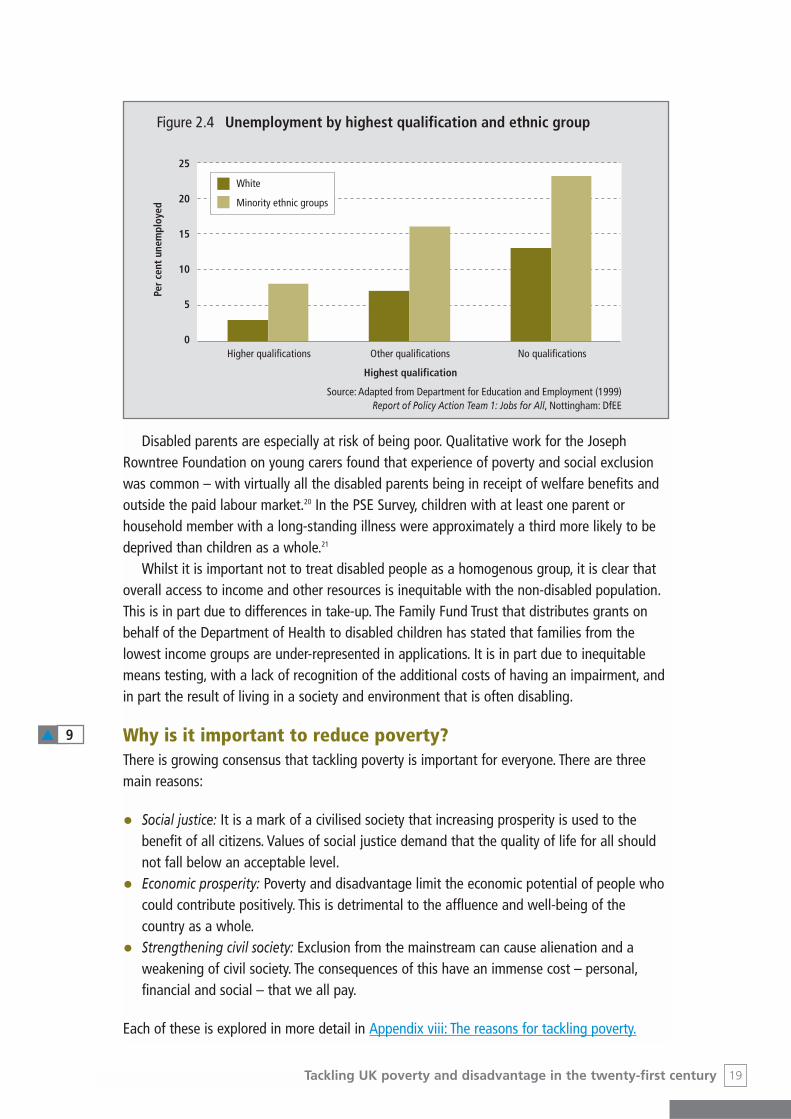
It is important to recognise the contrasting experiences of different ethnic groups but,taken as a whole, ethnic minorities fare worse than the average on a number of indicators ofdisadvantage. One example is the below-average educational attainment of these groups.Further disadvantage is evident in the fact that unemployment is higher whatever theeducational qualification, as shown in Figure 2.4. One reason for this is discrimination. Forexample, there is strong evidence that ‘white’ applicants are much more likely to get jobinterviews than their minority counterparts.18
Disabled peopleDisabled people have a relatively high probability of being poor, both because of theadditional costs associated with being disabled and the disproportionate likelihood ofbelonging to groups more at risk of being poor: lone parent families, workless households etc.Half of all disabled people had incomes below 50 per cent of mean income in 1999 (close tothe 60 per cent of median income threshold in that year) after making adjustments for extracosts. Even without such adjustment the probability of being below this threshold is 40 percent – an increase of one-sixth since 1985. Employment rates are low, at around 40 per centand one-third of disabled people who do find work are out of a job again by the followingyear.19
18 Tackling UK poverty and disadvantage in the twenty-first century
40
35
30
25
20
15
10
5
0
Perc
enta
ge
Gross weekly household income
Under £100 £100,less than
£200
£200,less than
£300
£300,less than
£400
£400,less than
£500
£500,less than
£600
£600or more
All owners
All social rented sector tenants
Figure 2.3 Social housing residents are poorer on averageGross weekly household income
Source: ODPM, Survey of English Housing, <http://www.housing.odpm.gov.uk/research/seh/seh01/#annex1>
Disabled parents are especially at risk of being poor. Qualitative work for the JosephRowntree Foundation on young carers found that experience of poverty and social exclusionwas common – with virtually all the disabled parents being in receipt of welfare benefits andoutside the paid labour market.20 In the PSE Survey, children with at least one parent orhousehold member with a long-standing illness were approximately a third more likely to bedeprived than children as a whole.21
Whilst it is important not to treat disabled people as a homogenous group, it is clear thatoverall access to income and other resources is inequitable with the non-disabled population.This is in part due to differences in take-up. The Family Fund Trust that distributes grants onbehalf of the Department of Health to disabled children has stated that families from thelowest income groups are under-represented in applications. It is in part due to inequitablemeans testing, with a lack of recognition of the additional costs of having an impairment, andin part the result of living in a society and environment that is often disabling.
Why is it important to reduce poverty? There is growing consensus that tackling poverty is important for everyone. There are threemain reasons:
• Social justice: It is a mark of a civilised society that increasing prosperity is used to thebenefit of all citizens. Values of social justice demand that the quality of life for all shouldnot fall below an acceptable level.
• Economic prosperity: Poverty and disadvantage limit the economic potential of people whocould contribute positively. This is detrimental to the affluence and well-being of thecountry as a whole.
• Strengthening civil society: Exclusion from the mainstream can cause alienation and aweakening of civil society. The consequences of this have an immense cost – personal,financial and social – that we all pay.
Each of these is explored in more detail in Appendix viii: The reasons for tackling poverty.
19Tackling UK poverty and disadvantage in the twenty-first century
25
20
15
10
5
0
Per
cent
une
mpl
oyed
Higher qualifications Other qualifications No qualifications
Highest qualification
White
Minority ethnic groups
Figure 2.4 Unemployment by highest qualification and ethnic group
Source: Adapted from Department for Education and Employment (1999)Report of Policy Action Team 1: Jobs for All, Nottingham: DfEE
▲ 9

Large numbers in povertyIf there were only a few people in poverty, perhaps these consequences would be small scaleand it would be easier to deal with them. However, the proportion of people living in povertyhas increased sharply over the past 20 years and remains at historically high levels. Reversingthis trend and bringing the levels dramatically down is critical.
Figure 2.5 shows the well-recognised rise in poverty between the 1970s and today, with mostof it occurring during the 1980s. There has been little sign of significant reductions since then.
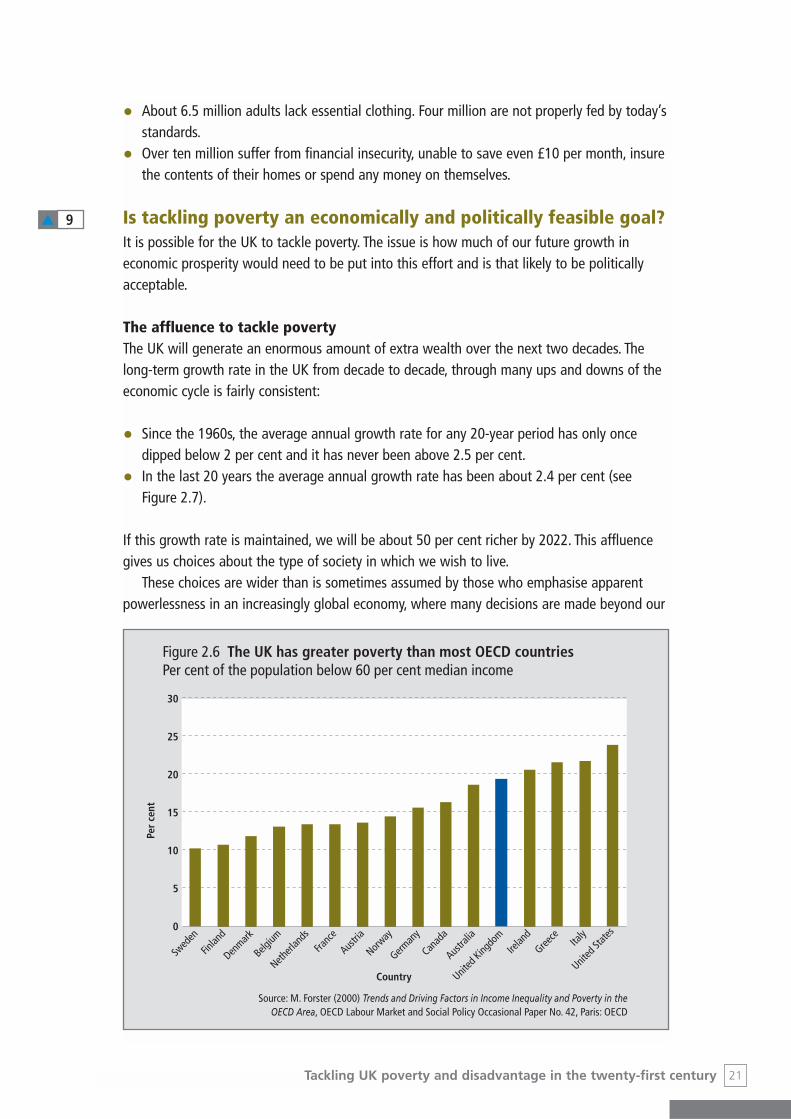
This growth in poverty was not mirrored in many other countries. Whilst some, such as theUSA and New Zealand also saw large rises, levels in most European countries stayed fairlystable, rose only slightly or diminished. In these countries the curtailment of poverty remaineda policy priority. As Figure 2.6 shows, the UK has greater poverty than most OECD countries.
Although cross-national comparisons of poverty are complicated, recent research byUNICEF illustrates the UK’s comparative position. Among wealthy nations, the UK’s childpoverty rate is less than only that of the USA, Italy and Mexico. Nine countries have less thanhalf the UK rate. Five – Sweden, Norway, Finland, Belgium and Luxembourg – have less thanfive per cent of children in households with income below 60 per cent of the median.22
The increase in households with income below 60 per cent median was mirrored by agrowth in the number unable to afford ‘socially perceived necessities’. In 1983 the BreadlineBritain survey showed 14 per cent lacking three or more necessities because they could notafford them. By 1990 this had risen to 21 per cent and by 1999 to 24 per cent.23
In these terms the position in Britain in 2000 was severe. Identifying goods and activitiesthat a majority thought ‘necessary, which all adults should be able to afford and which theyshould not have to do without’, the Poverty and Social Exclusion Survey 2000 found that:
• Nearly one in four of the population could not afford three or more of these necessities.
• About eight million could not afford one or more essential household goods. A similarnumber were too poor to engage in common social activities considered necessary by themajority of the population.
• Two million British children go without at least two things they need.
20 Tackling UK poverty and disadvantage in the twenty-first century
40
35
30
25
20
15
10
5
0
Per
cent
Children
Total
1981
1982
1983
1984
1985
1986
1987
1988
1989
1990
1991
1992
1993
1994
1995
1996
1997
1998
1999
2000
1980
1979
1978
Figure 2.5 Increasing proportions of poor householdsPer cent below 60 per cent median income after housing costs
Source: IFS calculations based on FES and FRS/HBAI datasets for 1999 and 2000
• About 6.5 million adults lack essential clothing. Four million are not properly fed by today’sstandards.
• Over ten million suffer from financial insecurity, unable to save even £10 per month, insurethe contents of their homes or spend any money on themselves.
Is tackling poverty an economically and politically feasible goal?It is possible for the UK to tackle poverty. The issue is how much of our future growth ineconomic prosperity would need to be put into this effort and is that likely to be politicallyacceptable.
The affluence to tackle povertyThe UK will generate an enormous amount of extra wealth over the next two decades. Thelong-term growth rate in the UK from decade to decade, through many ups and downs of theeconomic cycle is fairly consistent:
• Since the 1960s, the average annual growth rate for any 20-year period has only oncedipped below 2 per cent and it has never been above 2.5 per cent.
• In the last 20 years the average annual growth rate has been about 2.4 per cent (seeFigure 2.7).
If this growth rate is maintained, we will be about 50 per cent richer by 2022. This affluencegives us choices about the type of society in which we wish to live.
These choices are wider than is sometimes assumed by those who emphasise apparentpowerlessness in an increasingly global economy, where many decisions are made beyond our
21Tackling UK poverty and disadvantage in the twenty-first century
30
25
20
15
10
5
0
Swed
en
Finlan
d
Denmark
Belgium
Netherl
ands
Franc
e
Austria
Norway
German
y
Canad
a
Austra
lia
United
Kingdo
mIre
land
Greece Ita
ly
United
State
s
Country
Per
cent
Figure 2.6 The UK has greater poverty than most OECD countriesPer cent of the population below 60 per cent median income
Source: M. Forster (2000) Trends and Driving Factors in Income Inequality and Poverty in theOECD Area, OECD Labour Market and Social Policy Occasional Paper No. 42, Paris: OECD
▲ 9
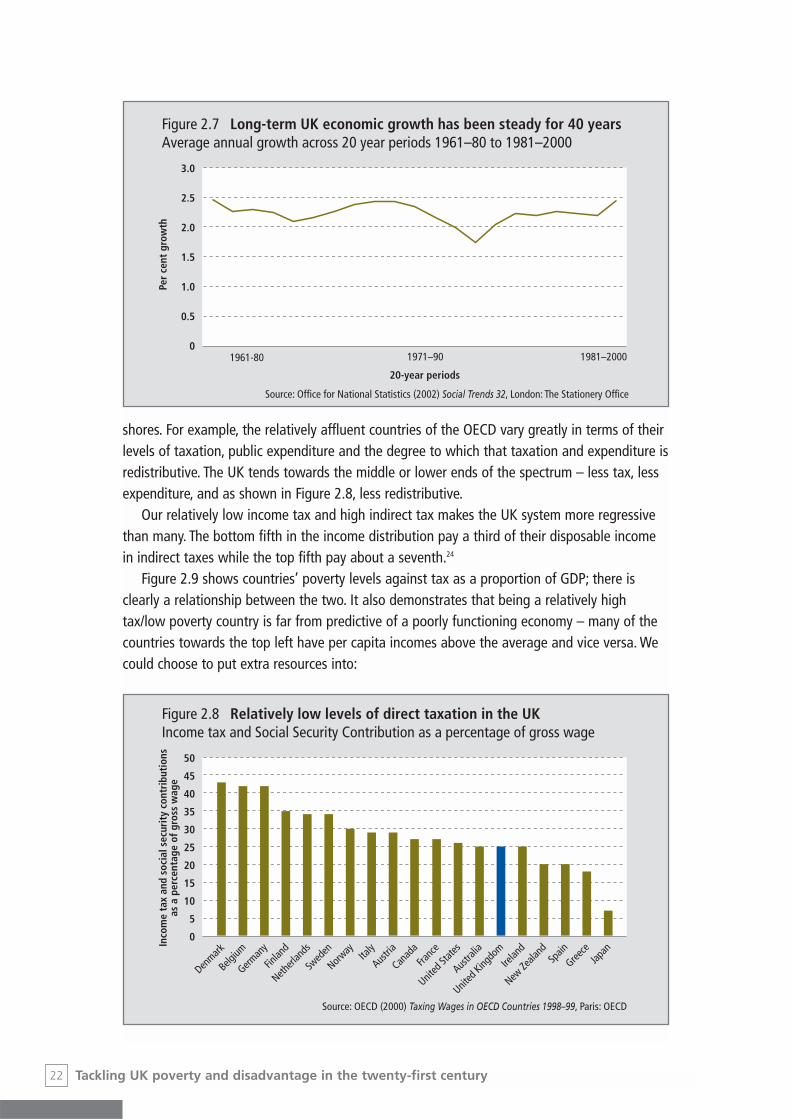
shores. For example, the relatively affluent countries of the OECD vary greatly in terms of theirlevels of taxation, public expenditure and the degree to which that taxation and expenditure isredistributive. The UK tends towards the middle or lower ends of the spectrum – less tax, lessexpenditure, and as shown in Figure 2.8, less redistributive.
Our relatively low income tax and high indirect tax makes the UK system more regressivethan many. The bottom fifth in the income distribution pay a third of their disposable incomein indirect taxes while the top fifth pay about a seventh.24
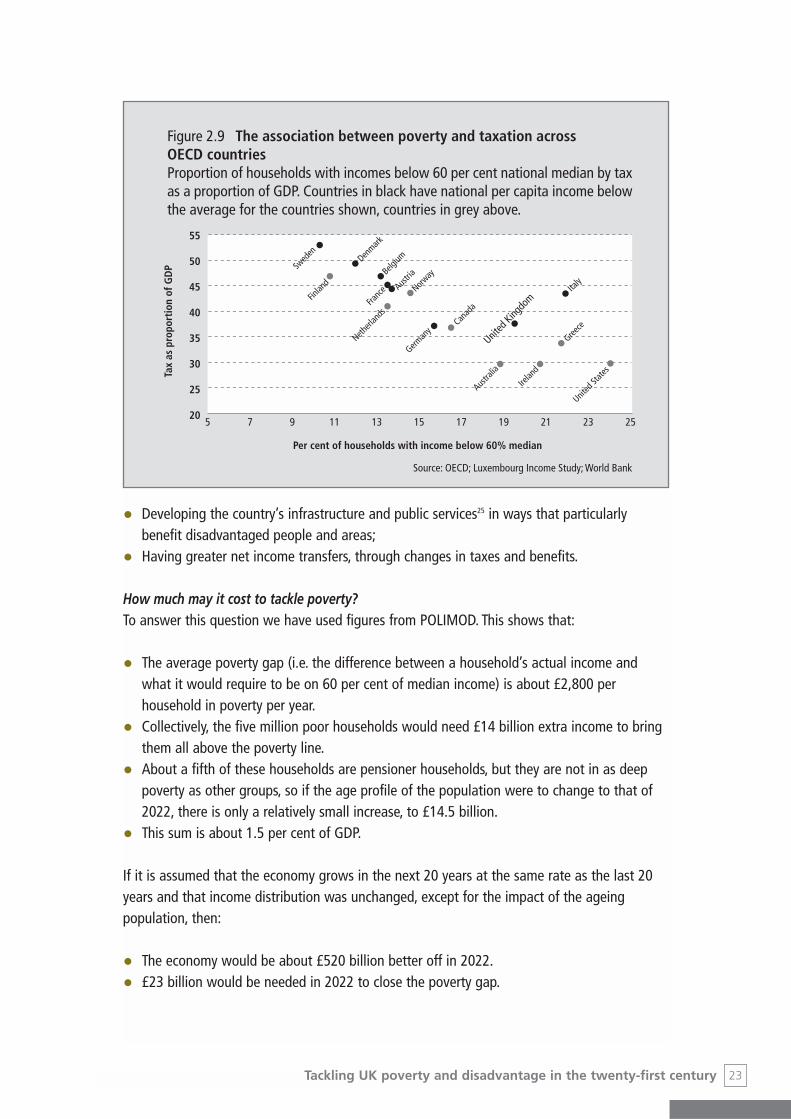
Figure 2.9 shows countries’ poverty levels against tax as a proportion of GDP; there isclearly a relationship between the two. It also demonstrates that being a relatively hightax/low poverty country is far from predictive of a poorly functioning economy – many of thecountries towards the top left have per capita incomes above the average and vice versa. Wecould choose to put extra resources into:
22 Tackling UK poverty and disadvantage in the twenty-first century
3.0
2.5
2.0
1.5
1.0
0.5
0
Per
cent
gro
wth
1961-80
20-year periods
1971–90 1981–2000
Figure 2.7 Long-term UK economic growth has been steady for 40 yearsAverage annual growth across 20 year periods 1961–80 to 1981–2000
Source: Office for National Statistics (2002) Social Trends 32, London: The Stationery Office
50
45
40
35
30
25
20
15
10
5
0Inco
me
tax
and
soci
al s
ecur
ity
cont
ribu
tion
sas
a p
erce
ntag
e of
gro
ss w
age
Denmark
Belgium
German
y
Finlan
d
Netherl
ands
Swed
en
Norway Ita
ly
Austria
Canad
aFra
nce
United
State
s
Austra
lia
United
Kingdo
mIre
land
New Ze
aland
Spain
Greece
Japan
Figure 2.8 Relatively low levels of direct taxation in the UKIncome tax and Social Security Contribution as a percentage of gross wage
Source: OECD (2000) Taxing Wages in OECD Countries 1998–99, Paris: OECD
• Developing the country’s infrastructure and public services25 in ways that particularlybenefit disadvantaged people and areas;
• Having greater net income transfers, through changes in taxes and benefits.
How much may it cost to tackle poverty?To answer this question we have used figures from POLIMOD. This shows that:
• The average poverty gap (i.e. the difference between a household’s actual income andwhat it would require to be on 60 per cent of median income) is about £2,800 perhousehold in poverty per year.
• Collectively, the five million poor households would need £14 billion extra income to bringthem all above the poverty line.
• About a fifth of these households are pensioner households, but they are not in as deeppoverty as other groups, so if the age profile of the population were to change to that of2022, there is only a relatively small increase, to £14.5 billion.
• This sum is about 1.5 per cent of GDP.
If it is assumed that the economy grows in the next 20 years at the same rate as the last 20years and that income distribution was unchanged, except for the impact of the ageingpopulation, then:
• The economy would be about £520 billion better off in 2022.
• £23 billion would be needed in 2022 to close the poverty gap.
23Tackling UK poverty and disadvantage in the twenty-first century
55
50
45
40
35
30
25
20
Tax
as p
ropo
rtio
n of
GD
P
Denmark
Belgium
German
y
Finlan
d
Netherl
ands
Swed
en
Norway
ItalyAus
tria
Canad
aFranc
e
United
State
s
Austra
lia
United
Kingdo
m
Irelan
d
Greece
5 7 9 11 13 15 17 19 21 23 25
Per cent of households with income below 60% median
Figure 2.9 The association between poverty and taxation acrossOECD countriesProportion of households with incomes below 60 per cent national median by taxas a proportion of GDP. Countries in black have national per capita income belowthe average for the countries shown, countries in grey above.
Source: OECD; Luxembourg Income Study; World Bank
In other words, about £1 of every £23 of our future growth in prosperity would need to go topeople who would otherwise be living in poverty. If this gap did exist in 2022 and had to beclosed by income transfers alone, the actual cost would be greater because it would beimpossible to means test accurately, and undesirable to have 100 per cent tapers even if youcould. Some income transfer would inevitably go to people above the poverty threshold inorder to avoid acute poverty and unemployment traps. But even if it cost half as much againto actually close the poverty gap, the country would need to give up only £1 for every extra£15 the economy grows by.
Problems of disadvantage would not be solved by filling this poverty gap with incometransfers alone. Action on many fronts is required to empower people, both to increase theirincomes on their own and to take control of many aspects of their lives. However, calculatingthe overall poverty gap gives us a sense of how much the economy as a whole mustredistribute – through a variety of means – in order to address the income shortages thatnearly one in four British people continue to experience.
In reality it would be hoped that some of the steps suggested in other parts of this reportwould lead to investment in people’s skills, in services and in places, so that more peoplewould benefit sufficiently from the market economy. The costs of this investment wouldhopefully therefore have a pay-back, in terms of a smaller poverty gap to be filled by incometransfers. However, calculating the broad amounts involved if this did not happendemonstrates that:
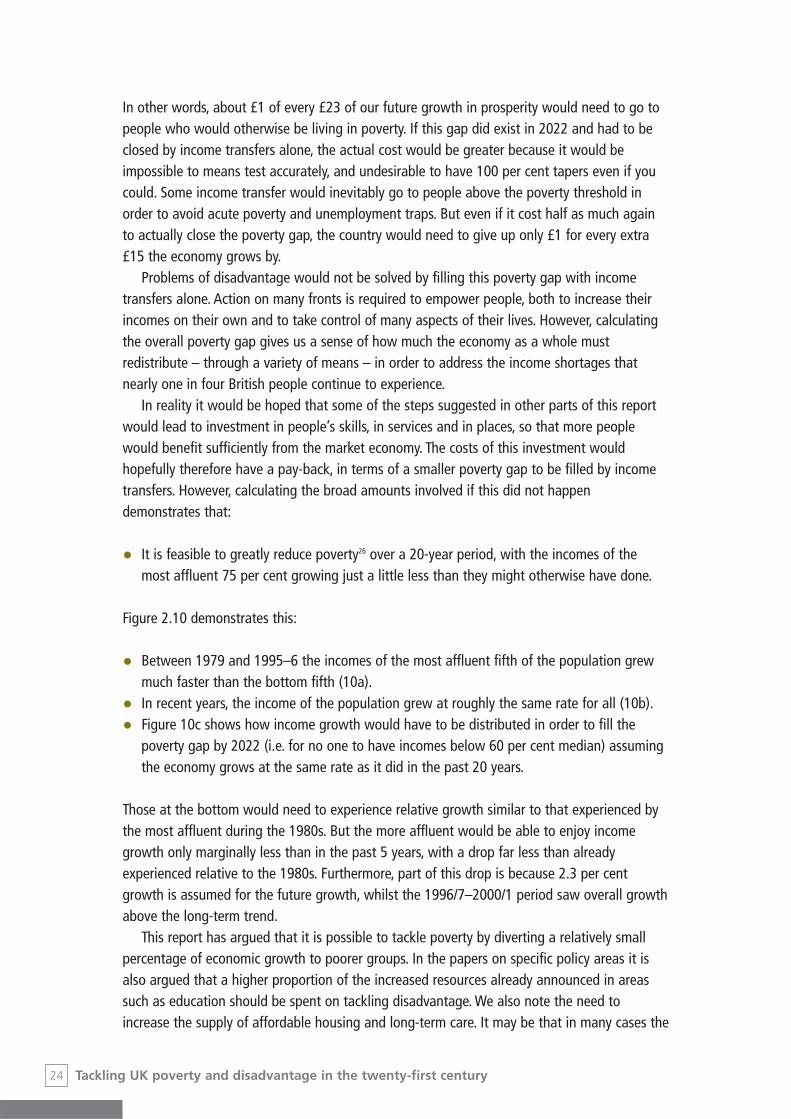
• It is feasible to greatly reduce poverty26 over a 20-year period, with the incomes of themost affluent 75 per cent growing just a little less than they might otherwise have done.
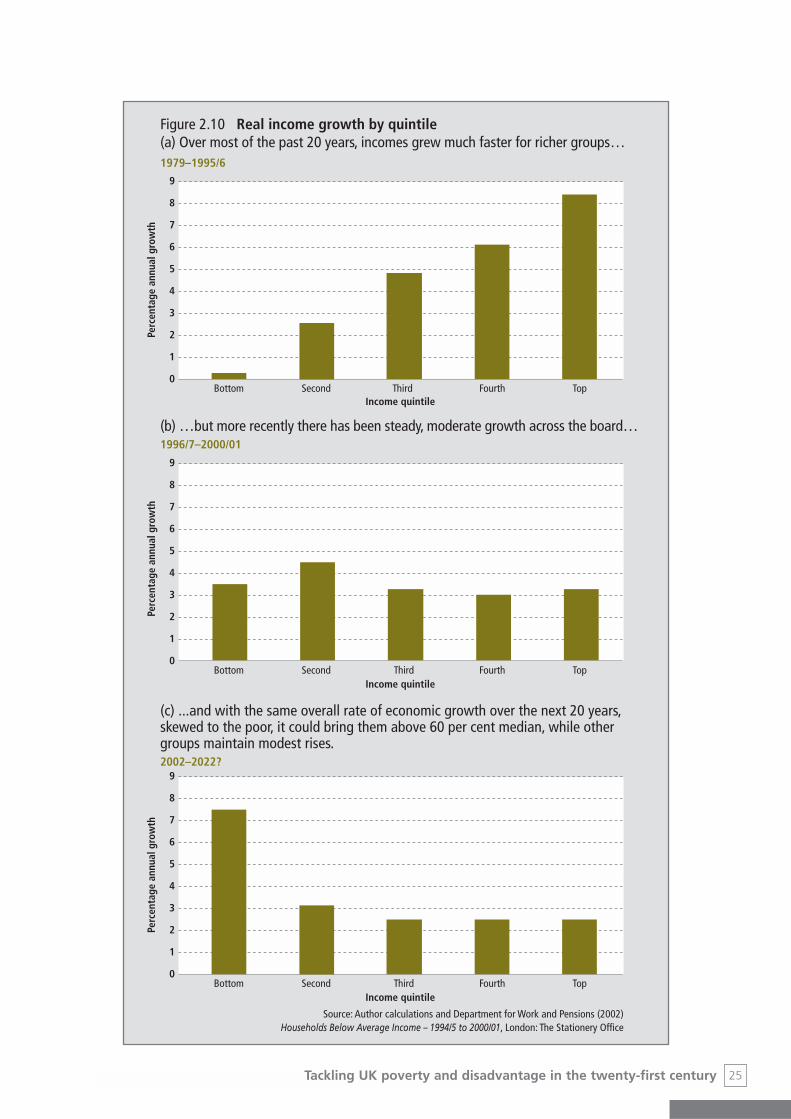
Figure 2.10 demonstrates this:
• Between 1979 and 1995–6 the incomes of the most affluent fifth of the population grewmuch faster than the bottom fifth (10a).
• In recent years, the income of the population grew at roughly the same rate for all (10b).
• Figure 10c shows how income growth would have to be distributed in order to fill thepoverty gap by 2022 (i.e. for no one to have incomes below 60 per cent median) assumingthe economy grows at the same rate as it did in the past 20 years.
Those at the bottom would need to experience relative growth similar to that experienced bythe most affluent during the 1980s. But the more affluent would be able to enjoy incomegrowth only marginally less than in the past 5 years, with a drop far less than alreadyexperienced relative to the 1980s. Furthermore, part of this drop is because 2.3 per centgrowth is assumed for the future growth, whilst the 1996/7–2000/1 period saw overall growthabove the long-term trend.
This report has argued that it is possible to tackle poverty by diverting a relatively smallpercentage of economic growth to poorer groups. In the papers on specific policy areas it isalso argued that a higher proportion of the increased resources already announced in areassuch as education should be spent on tackling disadvantage. We also note the need toincrease the supply of affordable housing and long-term care. It may be that in many cases the
24 Tackling UK poverty and disadvantage in the twenty-first century
25Tackling UK poverty and disadvantage in the twenty-first century
Figure 2.10 Real income growth by quintile(a) Over most of the past 20 years, incomes grew much faster for richer groups…
9
8
7
6
5
4
3
2
1
0
Income quintileBottom
Perc
enta
ge a
nnua
l gro
wth
Second Third Fourth Top
9
8
7
6
5
4
3
2
1
0
Income quintileBottom
Perc
enta
ge a
nnua
l gro
wth
Second Third Fourth Top
Source: Author calculations and Department for Work and Pensions (2002)Households Below Average Income – 1994/5 to 2000/01, London: The Stationery Office
9
8
7
6
5
4
3
2
1
0
Income quintileBottom
Perc
enta
ge a
nnua
l gro
wth
Second Third Fourth Top
2002–2022?
1979–1995/6
1996/7–2000/01
(b) …but more recently there has been steady, moderate growth across the board…
(c) ...and with the same overall rate of economic growth over the next 20 years,skewed to the poor, it could bring them above 60 per cent median, while othergroups maintain modest rises.
increased spending on public services already announced will be sufficient if emphasis is givento tackling disadvantage. But some new resources may be needed to raise the floor of incomesto 60 per cent of median income and to improve services. How much will depend on howsuccessful policy is in raising the capacity of disadvantaged groups to succeed economically.Three factors discussed above make a degree of direct redistributive taxation to fund any newresources required look feasible:
• The Government has made a start over the past five years with budgets that have givendisproportionately to those on low incomes.
• Gradual movement in this direction over the long-term does not require anyone to havereduced disposable income – simply for some to become better-off a little more slowly.
• The UK remains a relatively low taxed country, with most of its EU neighbours raisingconsiderably more taxed, particularly directly.
This is not an argument for making redistributive taxation the centre of a strategy to combatpoverty and disadvantage, but it can play its part – especially if there is a sustained publiccommitment to this enterprise.
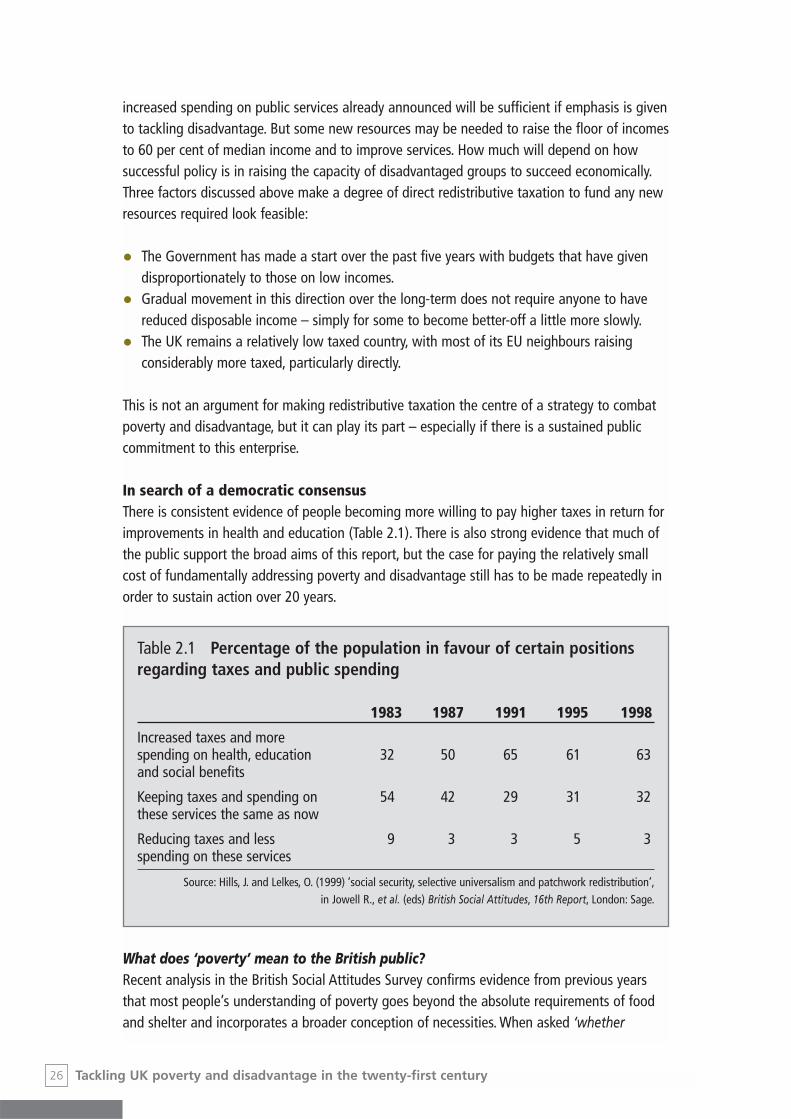
In search of a democratic consensusThere is consistent evidence of people becoming more willing to pay higher taxes in return forimprovements in health and education (Table 2.1). There is also strong evidence that much ofthe public support the broad aims of this report, but the case for paying the relatively smallcost of fundamentally addressing poverty and disadvantage still has to be made repeatedly inorder to sustain action over 20 years.
What does ‘poverty’ mean to the British public?Recent analysis in the British Social Attitudes Survey confirms evidence from previous yearsthat most people’s understanding of poverty goes beyond the absolute requirements of foodand shelter and incorporates a broader conception of necessities. When asked ‘whether
26 Tackling UK poverty and disadvantage in the twenty-first century
Table 2.1 Percentage of the population in favour of certain positionsregarding taxes and public spending
1983 1987 1991 1995 1998
Increased taxes and more spending on health, education 32 50 65 61 63and social benefits
Keeping taxes and spending on 54 42 29 31 32these services the same as now
Reducing taxes and less 9 3 3 5 3spending on these services
Source: Hills, J. and Lelkes, O. (1999) ‘social security, selective universalism and patchwork redistribution’,in Jowell R., et al. (eds) British Social Attitudes, 16th Report, London: Sage.

someone in Britain was in poverty, if they had enough to eat and live, but not other thingswhich they needed’, nearly 60 per cent thought that they were. Furthermore more people thinkthat there is ‘quite a lot’ of real poverty today, than thought so in 1986, a period during whichgeneral living standards have risen. This confirms the point made earlier that people’s notionof necessities changes over time, in line with a concept of relative poverty. Moreover, there isincreasing evidence of congruity between the 60 per cent median poverty line and people’sself-reporting of their own poverty experiences. Fundamentally, about two out of three peoplebelieve that there is ‘quite a lot’ of ‘real poverty’ in Britain today. Nor is this biased towardslow-income groups; this belief is shared across the income distribution.27
Do they think Government should do something about it?Believing that poverty exists is still different from thinking that something should be doneabout; a third of the population think that poverty is ‘an inevitable part of modern life’.However, the majority of the population do believe that government should take action toreduce disadvantage.
When asked more specifically about the mechanisms for addressing poverty anddisadvantage and the groups who should be targeted, people are more equivocal. There isoverwhelming belief that older people and those who cannot work due to disability and illhealth should be guaranteed a decent standard of living. Most people also believe that it isthe Government’s responsibility to ensure a job for all who want one. However, people are lesswilling to support those who can work but, for a variety of reasons, are not sufficiently activein the labour market.
How far are people prepared to go?There has long been a view held by some that, whilst people may tell opinion pollsters andsurvey researchers that they are willing to pay more taxes for improved services andaddressing poverty, in the confines of the poll booth they will vote with their pockets. Whetherthis has been true or not in the past, there are signs of a growing consensus towards tacklingthese issues, as shown by many of the statistics above. Despite this, there remain hurdles toreally winning the argument on tackling poverty and disadvantage:
• A knowledge gap Many people are surprised both at the incomes that people living inpoverty survive on, and the extent of poverty in Britain compared with other countries.
• A belief gap Whilst many believe that Government should take action towards alleviatingpoverty and disadvantage, many are sceptical as to whether they can. People will not bewilling to pay taxes unless they see a return.
With the Government’s commitment to eradicate child poverty over the next 20 years; withthe prominence of improving public service standards in this parliament; and with a virtuebeing made of helping poorer households in various budget statements, the politicalenvironment is arguably more favourable to prioritising the tackling of disadvantage than atsome times in the past. This bodes well for the concerted effort that will be required now tokick-start a 20-year enterprise to greatly reduce poverty in the UK.
27Tackling UK poverty and disadvantage in the twenty-first century

What broad approach will ensure that if we tackle poverty wedo not scupper economic growth?We have argued that tackling disadvantage is vital, not only from a social justice perspective,but also pragmatically in terms of the country’s economic performance and social well-being.Among the benefits that success in tackling disadvantage would bring is a Britain where:
• Far fewer experience disadvantage through disability, ethnicity or other personal or culturalcharacteristics.
• Far fewer experience periods of poverty.
• Such periods of poverty that do occur are transitory.
• The occupation and income of your parents are less predictive of where you will live, whatyou will do and how much you will earn.
To achieve this at the expense of economic growth, however, would be counter-productive.Indeed, for it to be affordable and politically acceptable in the terms discussed in the lastsection, the long-term growth rate of the UK economy must be maintained. It is the increasedwealth that growth will create over the next 20 years that will actually allow us to tacklepoverty and reap these benefits.
It is therefore critical that the first principle in tackling poverty is to:
1 Increase the capacity of poorer households and communities to gain from the marketeconomy.
Apart from the social and financial benefits to the individuals concerned, success in this wouldimply that their average productivity has risen. There would also therefore be a ‘second order’benefit of higher long-term economic growth.
However successful this strand of policy is in the long term, redistribution of income willalso be required, both to enable people to develop their own capacity and to protect theneeds of those who the market necessarily fails. A second principle must therefore be to:
2 Ensure an adequate floor income that relates to what as a society we believe are thenecessities of contemporary living.
The policy priority proposed here is to minimise the number of people in households withbelow 60 per cent of median income.
Shortage of income, however, is not the only aspect of poverty. Severe disadvantage alsooccurs for some because of a shortage of other resources, particularly health, care andhousing. A third principle therefore needs to be to:
3 Ensure that all, particularly relatively poor people and those living in multiplydeprived areas,have access to adequate health care, personal care, housing and other essential services.
Some groups are particularly prone to poverty, as discussed above. Some of this is due toinequality that relates to the personal characteristics of people – their gender, race, disability,
28 Tackling UK poverty and disadvantage in the twenty-first century
▲ 9

sexual orientation, religion, or age. European legislation requires the UK government to havemachinery in place to promote and enforce labour market equality in relation to these sixpersonal characteristics by 2003 (2006 in the case of age). Because some people with thesecharacteristics are particularly vulnerable to poverty, equality policies are a fourth strand oftackling poverty. However, these equality policies need to be extended from the issue ofemployment to the implementation of all policies aimed at tackling disadvantage, includingservice provision, if they are going to be fully effective. A fourth principle is therefore to:
4 Ensure that in the implementation of policies aimed at tackling disadvantage, there is nodiscrimination on the grounds of gender, race, disability, sexual orientation, religion or age.
(This principle cuts across all the papers on specific policy areas, but is not dealt with in anydetail because specific implementation issues are not covered.)
All of the policies aimed at tackling disadvantage must not only be based on these fourprinciples, but also take account of a world where, among other things:
• There is likely to be continued polarisation in occupations and wages.
• People will need to switch between and combine employment and non-employment roles(such as care and training) to a greater extent than before.
• Pressures leading to polarisation between different areas are likely to continue.
• There will be more households to find homes for.
• There will be more older people with continuing care needs.
• There will be more people in some groups currently disadvantaged, such as disabled peopleand people from minority ethnic groups.
ConclusionShort chapters on specific policy areas are provided in Part II of this report. Clearly these arenot the only areas where policy needs development if we are to succeed in the enterprise oftackling disadvantage over the next 20 years. However, progress along the lines indicatedabove would be a major step forward. These include:
• A greater focus on the needs of the disadvantaged in the areas of education, familysupport and regional spending in order to improve the capacity of people to benefit fromthe market.
• Further welfare reform to minimise the number of people on incomes of less than 60 percent of the median.
• Policies that dramatically increase the supply of care for older people and housing(particularly in the south); these will help avoid shortages that will be particularlydetrimental to those on relatively low incomes.
• Implementation that avoids discrimination against disadvantaged groups.
29Tackling UK poverty and disadvantage in the twenty-first century
Notes1 Hills, J. (2001) ‘Poverty and Social Security: What rights? Whose responsibilities?’ in Jowell, R. et al. (eds) British Social
Attitudes, 18th report, London: Sage.2 Mack, J. and Lansley, S. (1985) Poor Britain, London: Allen and Unwin; Gordon, D. and Pantanzis, C. (1997) Breadline
Britain in the 1990s, Aldershot: Ashgate; Gordon, D., Adelman, L., Ashworth, K., Bradshaw, J., Levitas, R., Middleton,S., Pantazis, C., Patsios, D., Payne, S., Townsend, P. and Williams, J. (2000) Poverty and Social Exclusion in Britain, York:Joseph Rowntree Foundation.
3 Layte, R., Nolan, B. and Whelan, C. (2001) ‘Reassessing Income and Deprivation Approaches to Poverty in Ireland’,Economic and Social Review, 32 (3), 239–262.
4 MORI Political Monitor: Most plus Other Important Issues – 1974–Present<http://www.mori.com/polls/trends/issues.shtml> Accessed 21 January 2003.
5 Analysis of the POLIMOD model at Cambridge University shows the types of households (in terms of their size andmain source of income), to show that there are some particularly large groups within the poor population.
6 In 1982 the figure was only 17%. This is partly because state pensions have been increased only in line with pricesover a period when average earnings have increased much faster than prices.
7 Help the Aged (2001) Tackling Pensioner’ Poverty Today Help the Aged; see Wilkinson, P., Armstrong, B., Landon, M.,et al. (2001) Cold Comfort: The social and environmental determinants of excess winter deaths in England,1986–1996, York: Joseph Rowntree Foundation, for a discussion of this issue.
8 Department of Social Security (2001) Income Related Benefits: Estimates of take-up in 1999–2000, London: TheStationery Office.
9 Emmerson, C. (1998) ‘UK Pensioner Incomes’, in Persistent Poverty and Life-time Inequality: The evidence, HMTreasury Occasional Paper 10, London: The Stationery Office.
10 Help the Aged (2001) Addressing excess winter deaths: the causes and solutions, Help the Aged / British Gas.11 A number of factors have fed into this trend, including the increase in divorce, falling marriage rates, and an increase
in births outside of marriage. In 1975, 9 per cent of births took place outside of marriage – by 1998 this had risen to39 per cent, with only half being jointly registered. Overall, marriage and childbearing have been decreasing. Formost, they are becoming increasingly delayed, as people spend longer in education and look to secure their futurebefore settling down to family life. This overall delay in childbearing is, however, paralleled by a sustained rate ofearly pregnancy that is very high by international standards, predominantly amongst women from moredisadvantaged backgrounds.
12 In this section ‘poor’ households are defined as those below 60 per cent median income.13 ONS (2002) New Earnings Survey 2001; IFS (2002) Fiscal Facts <http://www.ifs.org.uk/taxsystem/contents.shtml>
Accessed 23 January 2003.14 Department for Work and Pensions (2002) The Abstract of Statistics, London: Stationery Office.15 Jones, C. and Murie, A. (1998) Reviewing the Right to Buy, York: Joseph Rowntree Foundation.16 Dept for Work and Pensions, Abstract of Statistics.17 Gordon, D., Adelman, L., Ashworth, K., Bradshaw, J., Levitas, R., Middleton, S., Pantazis, C., Patsios, D., Payne, S.,
Townsend, P. and Williams, J. (2000) Poverty and Social Exclusion in Britain, York: Joseph Rowntree Foundation.18 Performance and Innovation Unit (2001) Improving the Labour Market Achievements for Ethnic Minorities in British
Society, London: PIU.19 Burchardt, T. (2000) Enduring Economic Exclusion: Disabled people, income and work, York: Joseph Rowntree
Foundation/YPS.20 Dearden, C. and Becker, S. (2000) Growing up Caring: Vulnerability and transitions to adulthood – young carers’
experiences. National Youth Agency.21 Gordon, D. et al., Poverty and Social Exclusion22 UNICEF (2000) Child Poverty in Rich Nations, Report Card Florence: UNICEF.23 Gordon, D. and Pantazis, C. (1997) Breadline Britain in the 1990s, Aldershot: Ashgate; Gordon, D., Adelman, L.,
Ashworth, K., Bradshaw, J., Levitas, R., Middleton, S., Pantazis, C., Patsios, D., Payne, S., Townsend, P. and Williams, J.(2000) Poverty and Social Exclusion in Britain, York: Joseph Rowntree Foundation.
24 Office for National Statistics (2001) Social Trends 31, London: The Stationery Office.25 We have choices about the way in which the new money that has been made available in recent budgets for public
services is spent. Joseph Rowntree Foundation research [Sefton, T. (1997) The Changing Distribution of the Social Wage,York: Joseph Rowntree Foundation] shows that currently expenditure on public services is only moderately pro-poor.
26 That is, reduce the proportion of households with below 60 per cent of median equivalised income to below 5 percent or so from the current levels of over 20 per cent.
27 Hills, J. and Lelkes, O. (1999) ‘social security, selective universalism and patchwork redistribution’, in R. Jowell et al.(eds) British Social Attitudes, 16th Report, London: Sage.
30 Tackling UK poverty and disadvantage in the twenty-first century

Appendix i: A poverty indicatorUsing 60 per cent of median household income as a threshold for monitoringprogress in combating povertyThis Appendix outlines the reasoning behind using 60 per cent of median household income asa threshold for measuring poverty in the Tackling Disadvantage report. It discusses the mainadvantages of using this approach, as well as the conceptual and technical weaknesses.1
If we are aiming to reduce poverty dramatically over the next 20 years, we require somemeans of monitoring progress and determining relative success or failure on a regular basis.We need a straightforward indicator that will help to evaluate how effective public policy is inmeeting overall aims. This would help to garner public support for applying resources towardsa clear objective. It would also be easier to hold Government to account over any existing orfuture pledges on reducing poverty.
There are many ways of measuring different aspects of poverty but this report argues that‘60 per cent of median household income’ is an appropriate key indicator to track attempts toreduce poverty. There are several reasons for this:
• A single headline indicator is vital. In order to hold Government to account and to gearpublic consciousness towards tackling poverty, a single measure is needed. The academicand policy communities are quite rightly interested in the complexities and nuances ofdefinition and measurement. However, from the perspective of the wider public, it is claritythat is most important. Moreover, multiple indicators make it easier for Governments toavoid taking responsibility for key goals if necessary.
In any field, quantitative measures that are regularly monitored and announced publiclyare complex and do not tell the whole story. For example, standard unemployment figurescapture a major essence of the ‘employment’ story, but far from all of it. The academic andpolicy community can worry about the bits left out, such as wider economic inactivity.Similarly, it will be vital to collect a range of data in the case of poverty and low incomesthat can inform the wider pool of knowledge, but this data need not complicate theheadline message.
• Income is important. In looking at poverty and disadvantage, there are many things thatmatter. Access to services, family make-up, and neighbourhood conditions all have a vitaleffect on the wider quality of life, but income is central in determining the choice andcontrol that individuals and households have.
• Relative income matters. Absolute poverty is, of course, important and we should be gladthat the overall standard of living for most people in the UK has been rising over manyyears. But relative poverty matters. It matters for a cohesive society that rises in generalliving standards do not leave behind a minority. It matters because in a changing societywhat is considered a necessity changes over time (who considered a telephone necessary
31
3 Appendices to Part I
Tackling UK poverty and disadvantage in the twenty-first century
▲ 12
▲ 13
▼ 105
50 years ago, who will not consider regular access to IT a necessity in 10 years time?). Itmatters because relative poverty has implications in areas such as health, education andcrime, which are detrimental not only to the lives of people on low incomes, but to societyas a whole.
• Connecting to the mainstream is key. British society is very unequal; there are extremes ofwealth, as well as poverty. Social justice demands that the wealthy should contribute toimproving the relative position of all, and reducing overall inequality is the aim of some.However, this report concentrates on the position of those on low incomes in relation tothose in the middle of the income distribution. The causes and symptoms of poverty can betackled by closing the gap between the least well off and the mainstream populationwithout worrying about the spiralling wealth of the rich whose lifestyles are a million milesfrom the experience of most people. The ‘median’ is the measure that takes the income ofthe household in the middle if all households are lined up from the household with thelowest income to the household with the highest. Thus, 50 per cent of households will bebelow the median and 50 per cent above. As a result, unlike the ‘mean’ or ‘average’ it isnot affected by the extremes of wealth.
• The relevant data is collected annually. Data collection is an expensive business, yetGovernment already collects data that can track this measure. Whilst the collection offurther data on an annual basis that could complement this (see below) would bewelcome, it cannot be guaranteed. Moreover, we have data on this measure now stretchingback many years and in most other developed nations, lending us a depth of historical andinternational perspective that most other measures cannot offer.
These reasons suggest taking a measure of income that relates to the median, but notnecessarily the 60 per cent figure. Justification for the 60 per cent figure is less clear-cut – it isto a certain extent arbitrary. However, several things make it appropriate:
• It’s already being used: The UK Government in the Households Below Average Incomeseries, a wide range of other national Governments, international organisations includingthe EU and the OECD are all using this measure for tracking progress. Whilst the UKGovernment has not said explicitly that it is using the 60 per cent measure as itsbenchmark for abolishing child poverty, all the statements surrounding this goal haveindicated that this is the measure that they are (or, at least, were initially) intending to use.Therefore, there is no need to convince them to use it. It is likely that if the child povertybenchmark is made more sophisticated, 60 per cent of median household income will be amajor component of any composite measure.2
• It’s close to the Budget Standard level: ‘Budget standards’ are measured by calculating theminimum reasonable cost of those specific goods and services that comprise a ‘basket ofgoods’ deemed necessary by experts. Using this approach, the Family Budget Unit hasdefined ‘low cost, but acceptable’ budgets for certain types of household. The levels theyhave come up with are at present fairly close to the 60 per cent median level for particular
32 Tackling UK poverty and disadvantage in the twenty-first century
household types. Sixty per cent of median therefore has some meaning when talking abouthouseholds on low incomes – it represents a very basic amount needed for essentials (seeBox below). The 60 per cent median income data is also less cumbersome to collect andcalculate than the budget standard measure.
However, for several reasons, 60 per cent of median household income does not tell the wholestory.
• Its major weakness is that when the population on incomes below 60 per cent median iscompared to the population lacking three or more ‘socially perceived necessities’ asmeasured in the Joseph Rowntree Foundation’s Poverty and Social Exclusion (PSE) Survey,the overlap of the populations said to be ‘poor’ is relatively low. Yet the PSE/BreadlineBritain approach of measuring relative deprivation is an important one. The problem is thatthe data for household income comes from the Family Resources Survey, which measureshousehold income at a single point in time. Yet we know that the incomes of working-agefamilies can fluctuate greatly over very short periods. This is especially true for those onlower incomes who are not in permanent full-time employment, which is what gives arelative degree of income stability. The lack of congruity between the two measures jars. Inall likelihood one would need to track income longitudinally before a more consistentoverlap was found between the populations who are on persistently low incomes, andthose who are deprived.
• Some suggest that income surveys cannot really capture households’ true access todisposable income, and that expenditure would be a more reliable proxy of access toresources.
• It is susceptible to paradoxes in periods of economic boom and bust. In a fast growingeconomy even if living standards of all are rising, as in Ireland in recent years, numbers onincomes below 60 per cent median could be going up. Conversely, in a highly recessiveeconomy where people perceive poverty to be increasing greatly, the numbers below 60per cent median could be shrinking alongside all incomes. Research for the JosephRowntree Foundation by David Piachaud and Holly Sutherland reflects this point. Despitethe measures that have been taken to boost many household’s incomes over the past fiveyears, progress in reducing the incomes below 60 per cent of median income has beenslower than expected as much of the population has enjoyed income growth.
• As a measure it does not resonate with how people understand poverty in the way thateither the PSE/Breadline Britain or Household Budget Standard approaches. Both theseapproaches paint some kind of picture of what poverty actually means.
• There are numerous technical difficulties with the data. For example, there aredisagreements over the appropriate equivalence scale – the statistical technique used toascribe equivalent incomes to different family types and sizes. The current need to presentincomes both ‘Before’ and ‘After Housing costs’ also complicates the message significantly.
33Tackling UK poverty and disadvantage in the twenty-first century

How do we deal with these problems?The problems above fit into two different kinds – technical and conceptual. From a technicalperspective, the current Households Below Average Income (HBAI) measure is adequate. Nomeasure, however, will ever be entirely satisfactory and we should aspire to improvements. Theway the data is collected and presented in the HBAI series can be improved so as to addresscertain statistical anomalies and presentational inadequacies.
The conceptual problems are more significant and pose a threat to the overall choice ofmeasure. Other measures, such as longitudinal data from the British Household Panel Study,the PSE/Breadline Britain approach and the Budget Standards Approach are vital parts ofdeveloping our knowledge of low incomes and poverty. Moreover, the latter two especiallyplay an important role in developing public consciousness of what the experience of povertymay actually mean to some people. Monitoring these measures, alongside 60 per cent ofmedian household income, can enhance our overall understanding of poverty.
But the reason for selecting 60 per cent median relates to our initial aims. These were tomonitor progress in a way that facilitates comparisons both historically and cross-nationally,using a simple indicator that is congruent with the values we are concerned with, which cangive the public a sense of progress or lack of it, and through which the Government of the daycan be held to account. We believe that 60 per cent of median household income meets thesecriteria and that it can counter the objections outlined above. For example, it is clear that if, asoverall living standards rise, the incomes of some fall behind the mainstream, those peoplewill lack the resources to allow them to afford items considered essential by contemporarystandards. This is evidenced by the fact that the changing proportions of people defined asdeprived in the various Breadline Britain surveys corresponded very closely with changingproportions below 60 per cent median. Thus, whilst the Breadline Britain Survey and the 60per cent median indicator are measuring different things and are not showing entirely thesame populations, they appear to be measuring related phenomena, whose movement isinfluenced by similar social and economic forces. When considered over the course of theeconomic cycle, the 60 per cent of median measure therefore appears robust.
34 Tackling UK poverty and disadvantage in the twenty-first century
Comparing the ‘low-cost but acceptable’ budget with 60 per cent of median incomePoverty can be understood as the inability of a household to purchase a sufficient ‘basketof goods and services’ deemed necessary for a certain kind of household. It can bemeasured by calculating the minimum reasonable cost of those specific goods and servicesthat comprise the ‘basket of goods’ and comparing the overall cost to the actualdisposable incomes of households. Using this approach, the Family Budget Unit hasdefined ‘low cost, but acceptable’ budgets. These include all potential expenditure that ahousehold requires. Some, such as food, rent or childcare are part of normal weeklyexpenditure. Other goods such as a fridge-freezer are calculated in terms of how often itmust be bought (every 15 years), how much it costs (£260.00) and the cost translated intoa weekly amount over the 15 year period (£0.33). Table 3.1 shows the weekly expenditurefor a couple with a boy aged 10 and a girl aged 4.

35Tackling UK poverty and disadvantage in the twenty-first century
This expenditure is indeed minimal, but it is in many ways unrealistic. In reality, manypeople smoke and the price of expensive goods cannot be divided into weekly amountsover many years, so those on low incomes must pay more expensive hire purchase prices,or borrow at substantial interest rates. Also, there is no saving here for later in life.
A household on 60 per cent of median income would have £227 per week. They wouldbe able to afford the low-cost but adequate budget.
Yet for a couple with two children of this age, the average weekly income for those inthe bottom tenth of the distribution is just £153.3 This is only 70 per cent of the amountrequired to purchase those items indicated in the budget. Noone can be in doubt that thisis a highly acute level of poverty in the context of contemporary Britain.
Table 3.1 The ‘low-cost but acceptable budget’: two adults, twochildren (1998 prices)
Variable Costs £ Budget Standard Costs £
Housing 47.54 Food 53.23
Council Tax 9.01 Clothing 24.97
Fuel (within the home) 13.29 Personal care (e.g. soap, cosmetics) 4.05
Transport (non-car using) 6.42 Household goods 15.78
NHS Charges 0.05 Household services (e.g. telephone, baby-sitting) 5.43
Insurance/ Pensions 1.51 Leisure goods (e.g. toys, television) 8.79
Debts, Fines, 0.00 Leisure services 12.11Maintenance Orders (e.g. outings, TV licence)
Seeking work costs 0.00
Total weekly expenditure £214.08
Pets 3.28
Alcohol 8.62
Tobacco 0.00
Charitable donations 0.00
Source: Parker, H. (ed.) (1998) Low Cost but Acceptable : A minimum income standard for the UK; Families with young children, Bristol: The Policy Press/Zacchaeus 2000 Trust

Appendix ii: The association of poverty with other disadvantageIncome poverty does not in itself present the sole challenge over the next 20 years. Unless weseek to address factors such as employment, health, education, housing, discrimination andconcentrations of deprivation, we will succeed in combating neither poverty nor its multipleconsequences. Such factors are both the causes of poverty and disadvantage, and thesymptoms, impacting on each other and ultimately on the quality and opportunities ofpeople’s lives.
Three issues that surveys consistently suggest are the most important to British people areindicative of the far-reaching consequences of poverty: health, education and crime.4 In today’sBritain the least affluent suffer most on all three fronts.
The disparities in health experiences and outcomes according to incomes are large.5 Poorerpeople are more likely to die younger than more wealthy people – and the gap has grown inthe period that income inequalities have risen.6 The gaps are large on many different aspectsof both mental and physical health. Children from poorer families are more likely to be bornwith low birth weight, to suffer from accidental deaths, and to experience mental disorders(Figure 3.1).7
As a society we may be less concerned with income inequality if all children had the sameopportunity to achieve. However, this is demonstrably not the case as shown in Figure 3.2.Three factors are key predictors of educational attainment: poverty, peer group and parentalinvolvement.8 In deprived areas these problems may well compound each other, ensuring thatvery few young people achieve any qualifications.
36 Tackling UK poverty and disadvantage in the twenty-first century
Source: Meltzer, H. and Gatward, R. (2000) Mental Health of Children and Adolescents in Great Britain,London: Office for National Statistics
Figure 3.1 Children in poorer households are more likely to experience mentalhealth problems
25
20
15
10
5
0Boys
Perc
enta
ge o
f chi
ldre
n ex
peri
enci
ngm
enta
l dis
orde
rs
Girls
Household income
<£100pw
>£770pw
▲ 14

Where crime and the fear of crime are present, they undermine the basic sense of securitythat people need in their day-to-day lives. Not only is the fear of crime greater amongst poorpeople, as shown in Figure 3.3, but the risk is also genuinely greater. In some of Britain’s mostdeprived local authorities there are more then 10 times as many ‘reported’ violent crimes peryear than in some more affluent places; at the neighbourhood level these disparities are likelyto be far greater.9
37Tackling UK poverty and disadvantage in the twenty-first century
Figure 3.2 Poorer groups are less likely to do well at school
80
70
60
50
40
30
20
10
0
Parents’ occupationManagerial
Perc
enta
ge o
f you
ng p
eopl
eat
tain
ing
5 G
CSEs
A*–
C in
Yea
r 11
by p
aren
t’s o
ccup
atio
n
Unskilled manual
Source: Department for Education and Skills (2001)Youth Cohort Study, <http://www.dfes.gov.uk/statistics/DB/SFR/s0230/index.html> Accessed 27 January 2003
Figure 3.3 Poorer groups are more likely to fear crime
30
25
20
15
10
5
0Be burgled
Perc
enta
ge fe
arin
g th
at in
the
next
yea
r th
ey w
ill
Be mugged/robbed
Source: Home Office (2000) The 2000 British Crime Survey: England and Wales, London: Home Office
Household income
<£5000 a year
>£30,000 a year

Appendix iii: Labour market trendsChanging occupationsAs the UK economy has moved from traditional manufacturing towards an economy largelybased on service industries the nature of work, in terms of occupations has changed:
• There are fewer requirements for trade related and basic unskilled occupations.
• There is an increased demand for professional, managerial and technical work.
The result has been polarisation, with many new well-paid and poorly paid jobs, but fewer inthe middle of the wage spectrum. Furthermore, the ladders that operated in many traditionalindustries, enabling poorly qualified individuals to progress during their career haveincreasingly disappeared. The extent of the gap between winners and losers could widen asthe occupational structure of the UK’s labour market continues to change.
In 1981, of the nine major occupational classifications, skilled trade and elementaryoccupations10 were ranked first and second, amounting to nearly 35 per cent of allemployment. By 2010 they are projected to be ranked fifth and sixth respectively, providingless than a quarter of all jobs.
Significantly, as Figure 3.4 shows, not only is there a continuing polarisation between thebetter and lower paid jobs, but there is also a significant decline in the least paid jobs – jobsaccessible to those with the very few skills and the most minimal or no qualifications.
Wage dispersionThe labour market increasingly requires a skilled, educated workforce with at least basicliteracy and numeracy skills, and key personal and computer skills. It places high premiums on
38 Tackling UK poverty and disadvantage in the twenty-first century
Figure 3.4 Projected changes in employees by occupation 1999–2010Occupations ranked in order of average wage – highest paid at top
% increase
Source: Institute for Employment Research (2001)Projections of Occupations and Qualifications 2000/2001, Sheffield: DfEE
–6 –4 –2 0 2 4 6
managers & senior officials
professional
associate professional & technical
skilled trade
process, plant & machine operatives
personal services
administrative, clerical & secretarial
sales & customer service
elementary
▲ 14

more advanced skills. Failures in the education and skills training system to respond to thechanging economy have resulted in an over-supply of labour for low-skilled work and hugepay rises in the professional and managerial sectors. The result has been
• Minimal growth in real terms of wages towards the bottom of the wage distribution. In1980 average earnings of the 10 per cent lowest paid were 68 per cent of the average,today they are 58 per cent.
Over three-quarters of current jobs are in the ‘service sector’.11 Many of these are well-paidand offer opportunities for training and career development, but many are quite the opposite.There are a ‘basement dozen occupations’ that have particularly high proportions of peoplewho are low paid; these include cleaners, care assistants and security guards.12 Such jobs notonly pay the worst, but they seldom act as stepping-stones to better employment throughpossibilities of promotion or training. On the contrary, many low-wage jobs are temporary innature; often people find themselves in a ‘no-pay, low-pay’ cycle, moving between poor qualityjobs and unemployment.13
The rise of the workless householdThroughout the last quarter of the 20th century the rate of female employment continued torise, whilst that of men has declined. Employment rates for men declined from 92 per cent to80 per cent; for woman they rose from 58 per cent to 70 per cent. The increase in workingwomen has taken place entirely amongst partners of working men. Partners of theunemployed and lone parents are no more likely to be active in the labour market than 25years ago.14 The result has been many more households with two adults working, at the sametime as a large increase in households with no adult in work. Between 1975 and 2000 the
39Tackling UK poverty and disadvantage in the twenty-first century
Figure 3.5 Increasing wage dispersionAverage wages for male full-time workers 1980–2000 in real terms indexed to 1980
170
160
150
140
130
120
110
100
90
80
Source: Office for National Statistics (1990 and 2001) New Earnings Survey, London: The Stationery Office
1982 1984 1986 1988 1990 1992 1994 1996 1998
Inde
x
2000
Lowest decile
Median
Highest decile
1980

proportion of such ‘workless households’ rose from 6.5 per cent to 16.7 per cent,15 equivalentto one in every six households containing people of working age. This phenomenon isunusually pronounced in the UK. Many other Western countries, even with substantially higherunemployment rates, do not have the same proportion of workless households.
Changing distribution of non-employmentEconomic inactivity rates (the proportion of the working age population not working orseeking work) were similar in the 1970s to today. However, whereas the economically inactivepopulation was largely female, reflecting enduring social norms about male breadwinners andfemale housewives, today it often signals an inability for older men and lone mothers toaccess work, or a decision to ‘drop-out’ of the labour market. Figure 3.6 shows that the declinein male economic activity after the age of 45 is much greater now than it used to be.
40 Tackling UK poverty and disadvantage in the twenty-first century
Figure 3.6 Male economic activity
100
90
80
70
60
50
40
30
20
10
0
Per
cent
eco
nom
ical
ly a
ctiv
e
Source: Office for National Statistics (2001) Social Focus on Men, London: ONS
16–24Age
25–44 45–54 55–59 65 and over
1971
2000
60–64
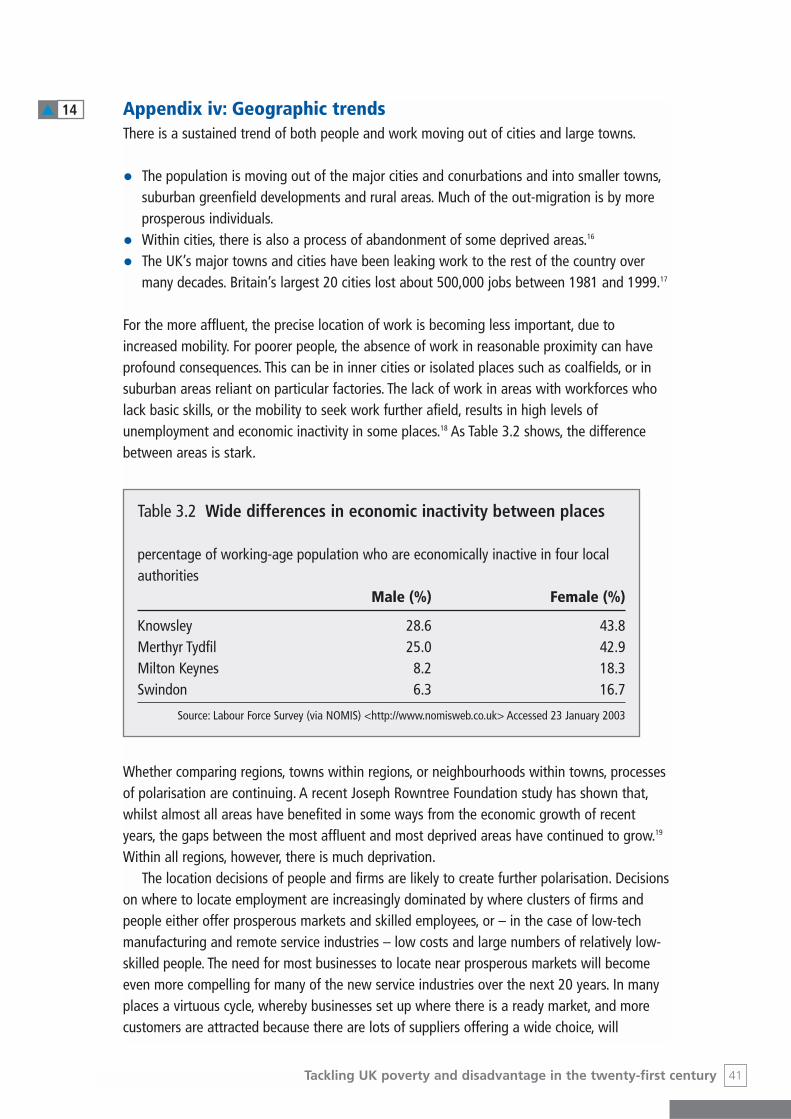
Appendix iv: Geographic trendsThere is a sustained trend of both people and work moving out of cities and large towns.
• The population is moving out of the major cities and conurbations and into smaller towns,suburban greenfield developments and rural areas. Much of the out-migration is by moreprosperous individuals.
• Within cities, there is also a process of abandonment of some deprived areas.16
• The UK’s major towns and cities have been leaking work to the rest of the country overmany decades. Britain’s largest 20 cities lost about 500,000 jobs between 1981 and 1999.17
For the more affluent, the precise location of work is becoming less important, due toincreased mobility. For poorer people, the absence of work in reasonable proximity can haveprofound consequences. This can be in inner cities or isolated places such as coalfields, or insuburban areas reliant on particular factories. The lack of work in areas with workforces wholack basic skills, or the mobility to seek work further afield, results in high levels ofunemployment and economic inactivity in some places.18 As Table 3.2 shows, the differencebetween areas is stark.
Whether comparing regions, towns within regions, or neighbourhoods within towns, processesof polarisation are continuing. A recent Joseph Rowntree Foundation study has shown that,whilst almost all areas have benefited in some ways from the economic growth of recentyears, the gaps between the most affluent and most deprived areas have continued to grow.19
Within all regions, however, there is much deprivation.The location decisions of people and firms are likely to create further polarisation. Decisions
on where to locate employment are increasingly dominated by where clusters of firms andpeople either offer prosperous markets and skilled employees, or – in the case of low-techmanufacturing and remote service industries – low costs and large numbers of relatively low-skilled people. The need for most businesses to locate near prosperous markets will becomeeven more compelling for many of the new service industries over the next 20 years. In manyplaces a virtuous cycle, whereby businesses set up where there is a ready market, and morecustomers are attracted because there are lots of suppliers offering a wide choice, will
41Tackling UK poverty and disadvantage in the twenty-first century
Table 3.2 Wide differences in economic inactivity between places
percentage of working-age population who are economically inactive in four localauthorities
Male (%) Female (%)
Knowsley 28.6 43.8Merthyr Tydfil 25.0 42.9Milton Keynes 8.2 18.3Swindon 6.3 16.7
Source: Labour Force Survey (via NOMIS) <http://www.nomisweb.co.uk> Accessed 23 January 2003
▲ 14
continue to develop. At the most local level, such processes are visible often on a daily basis ingentrifying areas, where numbers of leisure and retail outlets often multiply exponentially overa short period of time. Over larger areas the same process occurs with big business, whether itbe legal firms or biotechnology industries.
At a very broad level there is a fundamental difference between the South and the rest ofthe country:
• Whilst the southern regions (essentially London, the South-east and East) are increasinglycharacterised by a problem of wealth distribution, the ‘northern’ regions (essentially therest of the UK) suffer from a fundamental lack of wealth generation.
• The result in the South is small pockets of concentrated deprivation and a major crisis inhousing shortages, leading to increased homelessness and overcrowding for the poorest.
• In the North, however, there are large poverty clusters, alongside a housing problem of lackof demand, leading, in the worst hit areas, to some places being abandoned.
Lack of qualifications is likely to become an increasingly pressing problem, as the labourmarket continues to change. The fact that people with poor qualifications are oftenconcentrated in particular areas intensifies the problem. Although there are still manyunskilled employment opportunities, they are often distributed widely across areas in basicservice jobs, or serving a high-wage local economy, rather than being concentrated in a localmanufacturing base. The result is low relative demand for unskilled work alongside highsupply, allowing wages to remain low and leaving many people outside the labour market.Furthermore, there is a disincentive for employer-funded training, with the consequence thatpeople in these jobs fall even further behind the opportunities and experience of much of thepopulation.
Overall, therefore, pressures are towards further polarisation between areas.
42 Tackling UK poverty and disadvantage in the twenty-first century
Appendix v: Demographic trendsThe ageing populationThe UK has a gradually ageing population, both in terms of the proportion of the populationabove retirement age and, perhaps more significantly, the longevity that can be expected bymany who pass beyond this age. By 2021, nearly 20 per cent of the UK’s population will beaged over 65, with nearly 10 per cent over 75. This compares to 16 per cent and seven percent in 2001.20
Current evidence suggests that the extra years of life enjoyed by those with increased lifeexpectancy are not being accompanied by extra years of poor health, although the lack ofrobust longitudinal data gives cause for concern.21 Even if this proves to be the case, however,the rising number of very old people (above age 85) will raise overall care requirements.Increasing longevity raises questions about sustaining the incomes of older people for manymore years than pensions have needed to do in the past.
The older population is not homogenous. Older women, for example, are already the mostdisadvantaged group within the pensioner population. It is often widowhood and living alonethat expose female pensioners to poverty. At younger ages the differences in poverty rates aredisguised by the fact that women share in the household income of men. With the increase indivorce that has occurred over recent years, the young single pensioner population will growover the next 20 years (despite significant re-marrying). Given that 20 per cent of informalcare is estimated to be spousal, this may store up problems for beyond 2021 when care needsincrease.22
Increasing number of householdsThe sustained decrease in marriage rates, increase in divorce and co-habitation, and reducedand delayed child-bearing means that the household composition of the population is nowhighly varied.23 There have been dramatic rises in single parent (most female-led) families, andmany children will experience parental divorce at some point in their lives. There is acontinuing ageing population (see below) and sustained high levels of net inwardimmigration.
These factors have contributed to a dramatic rise in the number of households from 16.3million in 1971 to over 24 million in 2001 (for the UK). This growth looks set to continuerelentlessly. It is projected that from 1996–2021 we will need to accommodate a further 4.3million households in England alone.
One notable increase has been in the rise of single person households and, within that, therise amongst single men of working age of whom 10.3 per cent now live alone, compared toonly 3.3 per cent in 1971. These trends look set to continue over forthcoming decades.
Larger minority ethnic populationThe UK’s expanding minority ethnic populations have given many of Britain’s urban areas astrong multi-ethnic base. London, for example, in the 1991 census contained 1.3 millionpeople from minority ethnic groups and 37 different minority communities with over 10,000people.24 There are substantial population centres in the West Midlands, West Yorkshire andGreater Manchester. There are likely to be several local authorities with a ‘multi-ethnicmajority’ in 20 years time, including Brent, Newham and Tower Hamlets in London.25 In total,
43Tackling UK poverty and disadvantage in the twenty-first century
▲ 14

there are 15 local education authorities where more than 50 per cent of secondary schoolpupils are of ‘non-white’ ethnic origin.26
The largest groups are from South Asia, the Caribbean, Africa and Ireland – the latter groupbeing regularly excluded from the literature and statistics relating to minority ethnicpopulations.27
The size of the minority ethnic populations will grow rapidly over the next 20 years, andthe nature of the social and age profile of different groups mean that alongside such growththere will be profound changes in the character of each group. Whereas 97 per cent of peoplefrom minorities over the age of 44 were born outside of the UK, 90 per cent of those under 15were born here.28
The age structures of the country’s minority ethnic populations are also very different fromthe white population, with much lower median ages. The proportion of the UK’s populationaccounted for by minority ethnic groups is about 2 per cent for over-75s, but more than 10 percent for under 15s.29
Immigration trendsVery high proportions of those who have entered the country in the last 10 years are living inpoverty. In recent years, levels of immigration to the UK have risen sharply and officialprojections for net inward migration into the UK have been raised from 95,000 per year to135,000.30 This figure combines 395,000 coming into the UK and 260,000 leaving, whichmeans that there are projected to be 8.4 million immigrants to the UK over the next 20 years.The data on immigrants and asylum seekers is currently poor. The estimated numbers shouldbe treated with caution, and with regards to the ethnic composition and socio-economicbackground of immigrants there is a genuine lack of knowledge at present. However, a recentstudy that looked at the labour market participation of refugees with permission to workhighlighted the difficulty faced by this particular group in accessing work. For those who dofind work, the opportunities are often characterised by low pay and poor conditions.31
44 Tackling UK poverty and disadvantage in the twenty-first century
Table 3.3: Projections for immigration to the UK over the next 20 years
Projected number of immigrants
Per year Next 20 years
Origin of immigrantsEuropean Economic Area 105,000 2.1 millionOld Commonwealth + USA 120,000 2.4 millionNew Commonwealth 45,000 900,000Rest of world 75,000 1.5 millionRepublic of Ireland 15,000 375,000
Non-immigrant status on arrivalAsylum seekers 20,000 500,000Visitor switchers 25,000 625,000
Total 335,000 (adjusted) 8.4 million
Source: Government Actuary’s Department (2002) National Population Projections 2000-Based, London: The Stationery Office

Appendix vi: Types of household in povertyCertain types of household, dependent on particular sources of income, are especially at risk ofbeing in poverty. To examine this in detail we have used POLIMOD,32 a model developed atCambridge University.33
Using 60 per cent of median income as the dividing line between those defined as poorand those not,34 just over a fifth are in poverty. Table 3.4 shows the broad make-up of poorhouseholds in terms of the type of household35 and in terms of the source of income.36
Half of people in poverty are in households with children.37 However, about a third of non-pensioner poor people are not families and, of these, about 60 per cent are adults living alone.Less than 15 per cent of the poor are reliant solely on earnings. Unsurprisingly, the level ofbenefits (particularly out-of-work benefits) is the most important source of income that willimpact on the degree of poverty.
Depth of povertyThose defined as poor in the sense of those living below 60 per cent of median income areprimarily in the bottom two-tenths of the income distribution. Those in the lowest tenth areclearly in greater income poverty than others. Table 3.5 provides a broad-brush break down foreach of the lowest two-tenths in the same way as Table 3.4 did for the poor population as awhole. The largest group in the poorest tenth are adults without children. Two-thirds of theseare adults living alone.
It is possible to go further than this broad approach and see, on average, how far belowthe poverty line38 different groups are. For this analysis we combine dimensions of householdtype and source of income. Table 3.6 shows the average amount below the line differentindividuals are in pounds per week. The average poverty gap39 is about £65 per person perweek. Many relying on benefits only are in particularly deep poverty, and multi-adulthouseholds without children are, on average, in deeper poverty than other groups.
45Tackling UK poverty and disadvantage in the twenty-first century
Table 3.4 Most poor individuals are in families and/or receiving benefitPer cent of people (including children) in households with income below 60%of equivalised income
Household type % Source of income %
Two-parent families 30 Earned income only 15Lone parent families 20 Earned income and benefits 10Other working age 30 Benefits 60Pensioners 20 Pension income 15Total 100 Total 100
Source: Polimod dataset – rounded to nearest 5%
▲ 15

46 Tackling UK poverty and disadvantage in the twenty-first century
Table 3.5 Most poor individuals are in families and/or receiving benefitsPer cent of people (including children) in households with income below 60%of equivalised income
Household type Poorest Next Source Poorest Next tenth tenth of income tenth tenth
Two-parent families 35 30 Earned income only 10 15Lone parent families 10 30 Earned income + benefits 10 10Other working age 45 20 Benefits 70 50Pensioners 10 25 Pension income 10 25Total 100 100 Total 100 100
Source: Poliomod dataset – to the nearest 5%. Figures do not always sum to 100 due to rounding
Table 3.6 Depth of poverty Pounds per week below 60% of median income (rounded)
£ per week
Poor adults without children, but not living alone Benefits only 140Earnings only 90
Poor couples with children Benefits only 85Benefits and earnings 75Earnings only 65
Lone adults Little difference between source of income 65
Lone parents Benefits only 40Benefits and earnings 30
Pensioners (little difference between Pensions 30older, single or couple)
All (including children) 65

Appendix vii: Gender and povertyThere is considerable evidence suggesting that women are more likely to be poor than men,and that there are particular reasons for this. The following brief summary is based on aliterature review and data re-analysis undertaken for the Equal Opportunities Commission bythe University of York.40
Women are poorerOverall as Table 3.7 shows, a higher proportion of women than men are poor (live inhouseholds with below 60 per cent of median income). Women are more likely than men to bepoor when they are single pensioners over 70, unemployed, Pakistani/Bangladeshi or tenants.They are a higher proportion of the poor than men if they are single pensioners, lone parents,local authority tenants or without occupational pensions.
The characteristics that increase the probability of being poor are, of course, inter-related.However, if one controls for the factors covered in the Family Resources Survey, such asethnicity, disability etc., the data suggest that there is still a strong gender impact. Theprobability of a woman being poor is 80 per cent higher than for a man. Using the data in thePoverty and Social Exclusion Survey 2000, which contains different variables, the probability ofa woman being poor is 50 per cent higher than for a man after controlling for the otherfactors covered. Therefore, although it is difficult to be accurate on the precise magnitude ofthe difference, it is clear that women are substantially more at risk of being poor than men.41
47Tackling UK poverty and disadvantage in the twenty-first century
Table 3.7 Family Resources Survey 1999/00, poverty rates by gender
% Men Women
Before housing costs 16 18After housing costs 22 25
▲ 15
Why women are poorer than menOne of the major reasons why women are poorer than men is their relationship with thelabour market. There is still a significant gender pay gap, with full-time working men earningabout 20 per cent more than full-time working women, excluding any effect from differingworking hours.42 The pay gap stems partly from continued occupational segregation, with jobspredominantly done by women tending to be lower paid, and partly because of a looserattachment to the labour market as a result of women’s involvement with childbirth andcaring roles. Particularly those women with lower educational qualifications have interruptedperiods in employment and are much more likely to be in lower paid part-time work. Ingeneral, although girls out-perform boys in school, they disproportionately tend to pursuesubjects that do not lead to high pay in the labour market.
Lone mothers are particularly prone to experience poverty. The number of lone parenthouseholds has been increasing, and the majority are still headed by mothers. Access toemployment is difficult, not only because of childcare problems, but because they tend toconcentrate in localities of high unemployment.
Women’s labour market disadvantages lead to lower lifetime incomes and they are lesslikely to have rights to the full state pension, or as good occupational pensions as men. Therisk of poverty at retirement age is therefore greater for women. Older single pensioners arealso more prone to poverty, and these are mainly women as their life-expectancy is longer.
There are also more hidden causes of women’s poverty. First, in households where men arethe main earners, partners may not get access to earnings entering the household. This seemsto be particularly true of some low-income families. Second, women are often the peopleresponsible for managing inadequate household budgets and therefore suffer more of thestresses of managing on low incomes. Third, parents, but especially mothers, often sacrificetheir own needs for those of their children.
Underpinning these causes of poverty is an assumption in policy – in the way benefits arestructured and the way pensions in particular work – that women are or should be financiallydependent on men. This also legitimises low pay and poor employment opportunities. Povertyof lone mothers and older pensioners is often associated with the fact that there is not a manwith higher earning power or pension rights.
Ultimately, people are less likely to be in poverty when they have the capacity to supportthemselves. Some commentators have suggested that, to reduce women’s vulnerability topoverty, policy will need not only to improve women’s independent income, but also tackle theprivate sphere of life, relieving women of some of the unpaid work they do in the home. Theyargue that the first without the second would simply double women’s workload.43 Policy hasnot yet really begun to address this private sphere. If there was more of a level playing field interms of the choices men and women make between caring and work roles and betweendifferent occupations, it is likely that people’s lives overall would be more satisfying and thattotal productivity in the broadest sense would be higher in Britain than it is today.
48 Tackling UK poverty and disadvantage in the twenty-first century
Appendix viii: The reasons for tackling povertySocial justice: opportunities and outcomesWhilst the concept of social justice lacks clear definition, it reflects society’s changing commonvalues and norms. In today’s affluent society, it implies a quality of life for disadvantagedpeople that relates to the average, not with that of the least affluent in other countries, or inthis country 50 years ago.
Britain is not an immobile society where a child’s occupation and place on the incomedistribution is pre-ordained. But evidence from longitudinal studies demonstrates that thesocial conditions surrounding someone as they grow up remain highly predictive of conditionsin later life (see for example Figure 3.7). The area people grow up in, the schools they attend,and the occupations of their parents are strongly associated with different outcomes.44
As important as the lack of social mobility is, we are equally concerned with outcomes.Whatever the circumstances surrounding someone’s life, their standard of living should staywithin touching distance of that of the mainstream population. For many, it is seen asinherently unsatisfactory, inequitable and unjust that some people repeatedly suffer fromgreater ill-health, worse levels of educational opportunity, increased experience of crime andthe poorest quality of essential services. For most, it is unacceptable that poorer people shouldhave shorter lives; the life expectancy of men and women from unskilled backgrounds isrespectively 7.4 and 5.7 years shorter than for men and women from professionalbackgrounds (Figure 3.8).
Poverty limits economic growth and the UK’s overall affluencePoverty and disadvantage impact negatively on the country’s ability to generate wealth and onthe distribution of public services. Poverty is often associated with low levels of skilldevelopment. This stops the UK economy from performing to its potential. In many parts of thecountry too many low-skilled individuals are chasing too few jobs at the bottom end of thelabour market. This discourages in-work training and staff development, and reduces theincentive for employers to increase the productivity of jobs. At the same time, the under-supplyof skilled workers, such as information and communication techology staff and teachers,results in missed business opportunities or under-productive public services. If productivitywould increase by as little as 0.1 per cent, through raising skills levels, £10 billion more outputcould be generated over the next decade.45
Many deprived areas have high crime rates, a poor quality environment, and a populationwith low skills levels and minimal spending power. They often struggle to attract investment,and as much as 75 per cent of money in circulation within deprived areas derives from centralor local Government.46 Such areas cannot contribute to their full potential.47 Reviving theselocal economies would not only be highly beneficial to the local population, but throughgenerating wealth and consumer spending would clearly also benefit the national economy.
Social cohesion helps us allA strong civil society is based around the members of that society believing that they have astake in its future, and an ability to affect change. Yet we continue to exclude many peoplewho have little control over their source of income, the location or type of housing they live in,
49Tackling UK poverty and disadvantage in the twenty-first century
▲ 19
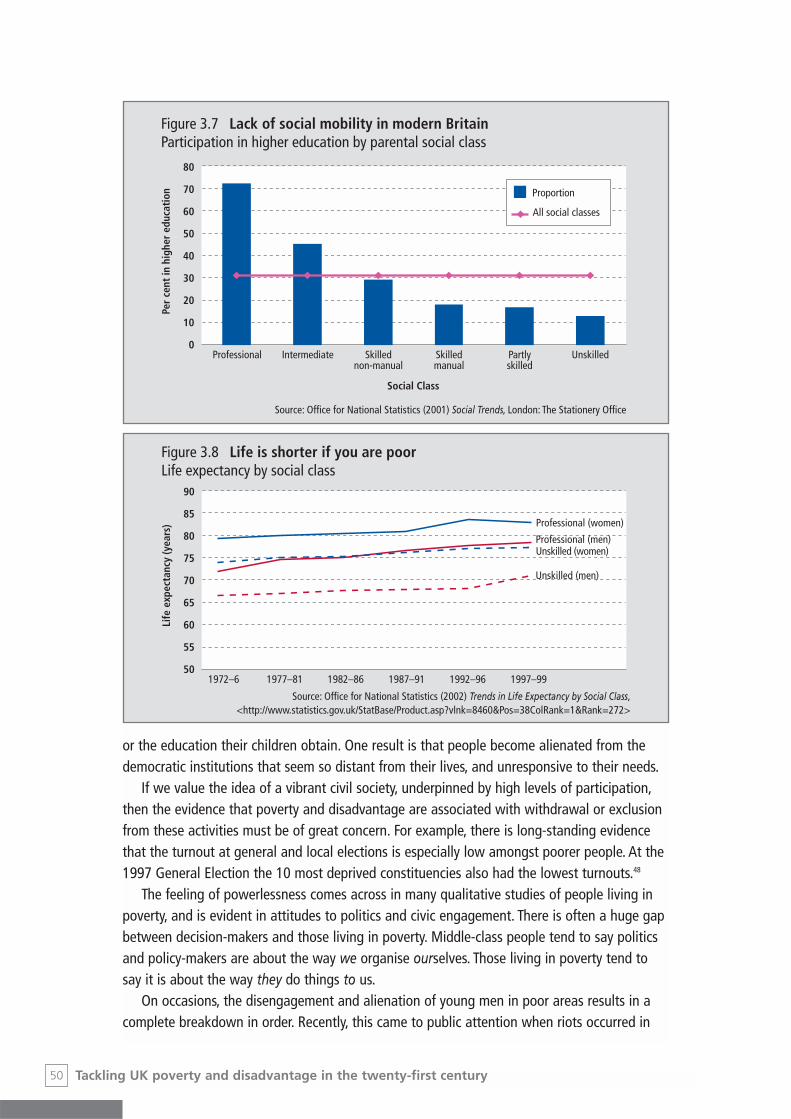
or the education their children obtain. One result is that people become alienated from thedemocratic institutions that seem so distant from their lives, and unresponsive to their needs.
If we value the idea of a vibrant civil society, underpinned by high levels of participation,then the evidence that poverty and disadvantage are associated with withdrawal or exclusionfrom these activities must be of great concern. For example, there is long-standing evidencethat the turnout at general and local elections is especially low amongst poorer people. At the1997 General Election the 10 most deprived constituencies also had the lowest turnouts.48
The feeling of powerlessness comes across in many qualitative studies of people living inpoverty, and is evident in attitudes to politics and civic engagement. There is often a huge gapbetween decision-makers and those living in poverty. Middle-class people tend to say politicsand policy-makers are about the way we organise ourselves. Those living in poverty tend tosay it is about the way they do things to us.
On occasions, the disengagement and alienation of young men in poor areas results in acomplete breakdown in order. Recently, this came to public attention when riots occurred in
50 Tackling UK poverty and disadvantage in the twenty-first century
Figure 3.7 Lack of social mobility in modern BritainParticipation in higher education by parental social class
80
70
60
50
40
30
20
10
0
Per
cent
in h
ighe
r ed
ucat
ion
Source: Office for National Statistics (2001) Social Trends, London: The Stationery Office
Social Class
Professional Intermediate Skillednon-manual
Skilledmanual
Partlyskilled
Unskilled
Proportion
All social classes
Figure 3.8 Life is shorter if you are poorLife expectancy by social class
90
85
80
75
70
65
60
55
50
Life
exp
ecta
ncy
(yea
rs)
1972–6 1977–81 1982–86 1987–91 1992–96 1997–99
Professional (women)
Unskilled (women)Professional (men)
Unskilled (men)
Source: Office for National Statistics (2002) Trends in Life Expectancy by Social Class,<http://www.statistics.gov.uk/StatBase/Product.asp?vlnk=8460&Pos=38ColRank=1&Rank=272>

several of England’s northern towns, where a potent mix of social deprivation and racialtension resulted in serious confrontations between young men and the police. Such instancesare not, however, always tied to ethnic relations; Joseph Rowntree Foundation research hasconsistently shown that the key factors are high levels of deprivation and few jobs.49
The causes of violence and disorder are complex, but the reality that they are moreassociated with poverty and deprivation is clear. Highlighting this link is not to justify theactions of the perpetrators. It is an attempt to understand and deal with the root causes ofconditions that foster crime and disorder, rather than focusing solely on the symptoms. Risingviolent crime (at the same time as general crime rates are falling) affects people in poor areasthe most. But it impacts on the lives of all in society. Large parts of urban America arecharacterised by a polarisation between crime-riven ‘no go’ inner-city areas and securitisedsuburbs and public spaces. The better-off have often opted out into privatised, individualisedsolutions to social ills. It is a direction than many are seeking to avoid for British society.
Notes1 See CASE/DSS (2000) Indicators of progress: a discussion of approaches to monitor the Government’s strategy to
tackle poverty and social exclusion, CASE report 13, London: Centre for the Analysis of Social Exclusion, LondonSchool of Economics – for a wide-ranging discussion of indicators of poverty and social exclusion.
2 The Government may adopt something akin to the Irish model (a composite indicator of income poverty anddeprivation) for its child poverty target.
3 Department for Work and Pensions (2002) The Abstract of Statistics, London: Stationery Office.4 MORI Political Monitor: Most plus Other Important Issues – 1974–Present
<http://www.mori.com/polls/trends/issues.shtml> Accessed 21 January 2003.5 Rahman, M., Palmer, G. and Kenway, P. (2001) Monitoring Poverty and Social Exclusion, York: Joseph Rowntree
Foundation.6 Dorling, D. (1997) Death in Britain, York: Joseph Rowntree Foundation.7 Rahman et al., op. cit. (2001); Meltzer, H. and Gatward, R. (2000) Mental Health of Children and Adolescents in Great
Britain, London: Office for National Statistics.8 Feinstein, L. and Symons, J. (1999) ‘Attainment in Secondary School’, Oxford Economic Papers, 51, 300–321;
Gregg, P. and Machin, S. (1997) Child Development and Success or Failure in the Youth Labour Market, London:Centre for Economic Performance, London School of Economics.
9 Home Office (2001) Recorder Crime Statistics: England and Wales, London: The Stationery Office.10 This is based on the ONS’ Standard Occupation Classifications. Skilled Trade occupations may require a substantial
period of training, often provided by means of a work-based training programme (e.g. gardeners and welders).Elementary Occupations will usually require a minimum general level of education (i.e. that which is provided by theend of the period of compulsory education) (e.g. labourers).
11 National Statistics (2003) Labour Market Trends, January 2003, London: The Stationery Office.12 Stewart, M. (1999) ‘Low Pay in Britain’, in Gregg, P. and Wadsworth, J. (eds) The State of Working Britain,
Manchester: Manchester University Press.13 Stewart, M. (1998) ‘Low Pay, No Pay Dynamics’, in: Persistent Poverty and Lifetime Inequality: The Evidence, HM
Treasury Occasional Paper 10, London: The Stationery Office; Gosling, A., Johnson, P., McCrae, J. and Paull, G. (1997)The Dynamics of Low Pay and Unemployment in Early 1990s Britain, Institute for Fiscal Studies.
14 Desai, T. et al. (1999) ‘Gender and the labour market’, in Gregg, P. and Wadsworth J. (eds) The State of WorkingBritain, Manchester: Manchester University Press.
15 The definition of workless households excludes those where the ‘head of household’ is in full-time education orabove pensionable age; Gregg, P., Hansen, K. and Wadsworth, J. (1999) ‘The rise of workless households’, in Gregg P.and Wadsworth J. (eds) The State of Working Britain, Manchester: Manchester University Press.
16 Champion, T. (2000) ‘Flight from the cities?’ in Bate, R., Best, R. and Holmans A. (eds) On the Move: The housingconsequences of migration, York: Joseph Rowntree Foundation.
17 Turok, I. and Edge, N. (1999) The Job’s Gap in Britain’s Cities, York: Joseph Rowntree Foundation/The Policy Press.
51Tackling UK poverty and disadvantage in the twenty-first century
18 This is, of course, a story not unique to Britain – see for example Wilson, W.J. (1996) When Work Disappears: Theworld of the new urban poor, New York: Alfred A Knopf.
19 Evans, M. and Noble, M. (2002) Growing Together or Growing Apart? Geographic patterns of Income Support andincome-based Jobseeker’s Allowance claimants in England between 1995 and 2000, York: Joseph RowntreeFoundation.
20 Government Actuary’s Department (2002) National Population Projections 2000-Based, London: The Stationery Office.21 Sutherland, Sir Stuart (chair) (1999) With Respect to Old-Age: A report by the Royal Commission on Long Term Care,
London: The Stationery Office.22 Office for National Statistics (1998) Informal Carers: Results of an independent study carried out on behalf of the
Department of Social Security as part of the 1995 General Household Survey, London: The Stationery Office.23 Although the general trend is toward later childbirth, there has been an increase in teenage pregnancies in the UK
compared to the highest rate in the EU. The ratio of births to teenage women is 30.4 (per thousand women agedunder 20) in the UK compared to 9.8 in the median country, Finland and 5.6 in the lowest country, The Netherlands.Teenage pregnancy is particularly high among people in poverty. This issue is covered in more detail in Chapter 5.
24 Storkey, M., Maguire, J. and Lewis, R. (1997) Cosmopolitan London: past, present and future, London: LondonResearch Centre.
25 London Research Centre (1999) Round ethnic minority projections, London: London Research Centre.26 Department for Education and Employment (1999) Minority Ethnic Pupils in Maintained Schools by Local Education
Authority Area in England, Statistical First Release, London: Department for Education and Employment. The 15 LEAsare: Hounslow, Slough, Harrow, Haringey, Islington, Wandsworth, Westminster and City of London, Southwark,Lambeth, Hackney, Ealing, Newham, Tower Hamlets, and Brent. Other LEAs with high proportions of secondaryschool pupils from minority ethnic group include Leicester City (47 per cent) and Birmingham (42 per cent).
27 Hickman, M.J. and Walter, B. (1996) Discrimination and the Irish Community in Britain, London: Commission for RacialEquality.
28 Scott, A., Pearce, D. and Goldblatt, P. (2001) The Sizes and Characteristics of the Minority Ethnic Populations of GreatBritain – Latest Estimates, Population Trends 105, London: Office for National Statistics.
29 Ibid.30 Shaw, C. (2001) Assumptions for the 2000-Based National Population Projections, Population Trends, London: Office
for National Statistics.31 Bloch, A. (2002) Refugees’ Opportunities and Barriers in Employment and Training, London: Department of Work and
Pensions.32 We use POLIMOD to help develop a broader understanding of the quantitative picture with respect to the population
in poverty. It is based on micro-data from the Family Expenditure Survey. These data are Crown Copyright. They havebeen made available by the Office for National Statistics (ONS) through the Data Archive and are used bypermission. Neither the ONS nor the Data Archive bear any responsibility for the analysis or interpretation of thedata reported here.
33 The estimates calculated for this chapter use the same methods as in Piachaud, D. and Sutherland, H. (2001), ‘ChildPoverty: Aims, Achievements and Prospects for the future’, New Economy 8 (2), pp. 71–6 and in Sutherland H.,(2001), Five Labour Budgets (1997–2001): Impacts on the distribution of household incomes and on child poverty,Microsimulation Unit Research Note MU/RN/41. The only difference is that an after housing cost measure is usedrather than a before housing cost one. The figures are different from the 1999/2000 published HBAI figures becausethey include policy changes since 1999/2000, but will not be the same as the 2000/2001 HBAI figures because wecannot include behavioural responses to the policy reforms introduced.
34 Both the definition of 60 per cent of median and the figures presented in this section are based on equivalisedhousehold income, measured over people.
35 The household type definitions are mutually exclusive. A parent who is over pension age is counted in the parentcategory, not the pensioner category. The characteristics refer to current living arrangements (i.e. a parent is someonecurrently living with a dependent child – pensioners who are parents, are not counted unless their children are stilldependent and co-resident).
36 The pension income category applies when all adults in the benefit unit are over pension age. They may or may nothave earnings and may or may not be in receipt of means-tested benefits.
37 We are talking here of proportions of individuals, including children. The proportion of poor households that containchildren is about a third.
38 60 per cent of median equivalised income.
52 Tackling UK poverty and disadvantage in the twenty-first century

39 To calculate this, the equivalised poverty line (60 per cent of median) for each household is ‘unequivalised’ back intoreal money and the household’s ‘poverty gap’ is the shortfall in its actual income relative to that ‘unequivalised’ levelthat they would need. The figures in Table 3.6 are the average for different types of individuals across households.
40 Bradshaw et al. Gender and Poverty (forthcoming), Manchester: Equal Opportunities Commission.41 These figures are based on logistic regressions carried out on the Family Resources Survey data and the Poverty and
Social Exclusion Survey 2000 data cited in Bradshaw et al. (ibid).42 Based on the New Earnings Survey 2002 as cited in Equal Opportunities Commission (2003) Facts about Women and
Men in Great Britain 2003 Manchester: Equal Opportunities Commission, p. 11.43 Glendinning C. and Millar J. (eds) (1992) Women in Poverty in Britain in the 1990s, Hemel Hempstead: Harvester
Wheatsheaf.44 For example, Ermisch, H. and Fancesconi, M. (2002) ‘Intergenerational Social Mobility and Assortative Mating in
Britain’, ISER Working Paper 2002–06.45 Department for Education and Employment (2001) Towards Full Employment in a Modern Society, London: The
Stationery Office.46 Department for the Environment, Transport and the Regions (1998) Where does public spending go? Pilot study to
analyse the flows of public expenditure to local areas, London: The Stationery Office.47 Social Investment Taskforce (2000) Enterprising Communities: Wealth beyond welfare, London: Social Investment
Taskforce.48 Commission on Poverty, Participation and Power (2000) Listen Hear, Bristol: The Policy Press/UK Coalition against
Poverty.49 Power, A. and Tunstall, R. (1997) Dangerous Disorder, York: Joseph Rowntree Foundation.
53Tackling UK poverty and disadvantage in the twenty-first century


Part II


57Tackling UK poverty and disadvantage in the twenty-first century
Introduction Over the last 20 years the UK has seen an increasing number of young people staying on ineducation beyond the compulsory age, more young people attending university and a rate ofuniversity graduation amongst the highest in the world. However, alongside theseimprovements there has been relative stagnation at the lower end of the attainment scale.Whilst in recent years policies have been introduced aimed at improving this situation, theyhave yet to change sufficiently radically a system that disadvantages many young people inthe UK today.
This chapter opens by discussing the importance of education, both to individuals’ capacityto improve their employment prospects and to creating a labour market that promotes moreequitable outcomes. It highlights how many young people have been missed out by theeducational improvements that have taken place in recent years. Factors contributing to lowattainment, including the pivotal role of poverty and social class, are discussed. The currentpolicy context, looking at the existing system and policies implemented in recent years, isdiscussed, concluding with some principles that we believe should underpin a long-termapproach to reforming education policy.
The centrality of educationThere are many reasons why tackling educational inequalities and low attainment areessential elements of any drive to tackle disadvantage.
The individual’s life-course
• Employment is the most important way of avoiding poverty. The better that employment, interms of pay, security and access to continued training and development, the moresustainable and long-term a move into work is likely to be. The better qualified and morehighly skilled individuals are, the better their chance of accessing this kind of work.1
• Any pretensions Britain may have to being a fair society are confounded by the reality thatequal educational opportunities still do not exist for most people from disadvantagedbackgrounds. For example, only 13 per cent of young people from unskilled backgroundsattend university, compared with 72 per cent of those from professional backgrounds.
• Education has a role beyond providing a springboard for labour market participation. Itrelates to people’s overall cognitive, emotional, intellectual and moral development, whichhas implications for all aspects of life – from sense of self and relationships within families
4 Tackling disadvantage:Education
Inequalities of opportunities and outcomesJason Strelitz
▲ 9
▼ 95
▼ 96
▼ 112

and community, to sense of civil society. Moreover, basic skills, such as numeracy andliteracy, are fundamental to full participation in society. For people who are well educated itis difficult to comprehend the exclusionary impact in today’s world for an adult who hasgreat difficulties in reading or writing.
A wider economic impact
• In many parts of the UK there is a need to generate more employment, but this isimpossible without greater numbers of higher skilled people. As part of this project weconsulted many people involved with trying to tackle sustained low levels of employmentand wealth generation in relatively depressed parts of the UK. Everyone consultedsuggested that lack of skills amongst the local population is amongst the most significantobstacles to raising employment levels (see Chapter 6 for a fuller discussion of demandissues within less favoured regions).
• The over-supply of unskilled labour is especially problematic in places that in the past havehad low education levels, but were traditionally served by core industries. As theseindustries decline, there are not only fewer lower skilled jobs in the country overall, butthey are also less concentrated in these areas. In places with a continuing over-supply oflow-skilled labour, wages are kept low and there are few incentives for employers to investin training and other employment-related benefits. The lack of training further contributesto widening the gap between the already low skilled and those better educated. In thecurrent UK system, where continued training is often employer-funded, it is the bettereducated who are more likely to receive opportunities for development.
• Improving education levels is an investment. If more people can increase their employmentprospects and raise their earnings potential, then there will be less need for redistributionthrough the tax and benefit system.
Problems of low educational attainment exist today. However, future trends make the need totackle these problems ever more critical. The long-standing shift from manufacturing industriesto services and, within both manufacturing and services, from lower-skilled to higher-skilledwork is set to continue apace. Whilst education levels lag behind this labour markettransformation, the consequence will be an ongoing skills mismatch.
The skills mismatchThe changes that have occurred in the labour market are long-standing and have occurredacross a number of dimensions:
• The rapid decline of traditional manufacturing industry has continued over the past 25years. The continual losses in industries such as coal mining, steel, car making, textiles andshipbuilding, have contributed to a fall in the proportion of manufacturing jobs from 27 percent in 1978 to 15 per cent in 2000.2
58 Tackling UK poverty and disadvantage in the twenty-first century

• There has been a large increase in demand for people with higher level skills and differentskills caused, for example, by huge post-war increases in the health and education sectors,and, more recently, by rapid computerisation and the pervasiveness of information andcommunication technology (ICT). This has lead to a boom in professional services, leisureand retail, together with a huge increase in managerial and professional work.
• A fall in the demand for people with ‘middle’ level skills, including both routine clericalwork, which has been automated, and semi-skilled production work, which hasdisappeared along with mass production industries.
• An explosion in demand for personal service occupations, which require little by way offormal qualifications but are quite demanding in terms of interpersonal skills
The result has been the so-called ‘skills mismatch’. This is not as simple as a straight mismatchbetween overall labour demand and supply; changes have occurred across differentdimensions, such as place and gender.
Impacting on placeChanges have had greatest impact on inner urban and traditional manufacturing and tradeareas. JRF research identified that during 1981–99 Britain’s 20 major cities experienced a netloss of 500,000 jobs.3 However, the decline in traditional employment was even more acutethan this indicates, for there was substantial, concurrent growth in professional andmanagerial jobs filled by commuting populations. With the long-standing educationalproblems in many urban areas, the implications of the changing occupational structure havebeen immense, even in places with an apparently buoyant labour market. Research in oneLondon area suggested that:
in West London, demand from employers for labour is concentrated at the level of NVQ3 4
and above, while the local supply shows predominance at level NVQ2 and below. Someexperts believe that by 2006, the entry-level requirement for the West London labourmarket will be NVQ4, that is, a university degree or its vocational equivalent. This leads tothe phenomenon of high-skill workers commuting into the area and excluded andunemployed local residents. Despite nearly 24,000 unemployed people in West London, 50per cent of all vacancies remained unfilled at the end of the first quarter 1997. For everyunfilled vacancy at the end of April 1997, there were four applicants who could not securethat job.5
In areas with low levels of demand, such as former coalfields, the problems can be evenworse: no demand for traditional mining-related labour; no wider economic infrastructure orwealth to drive new innovation; no workforce with a broad set of well developed transferableskills to encourage inward investment. The consequence in many areas has been severeshortages of employment opportunities. One commentator has remarked about a former steelcommunity:
59Tackling UK poverty and disadvantage in the twenty-first century
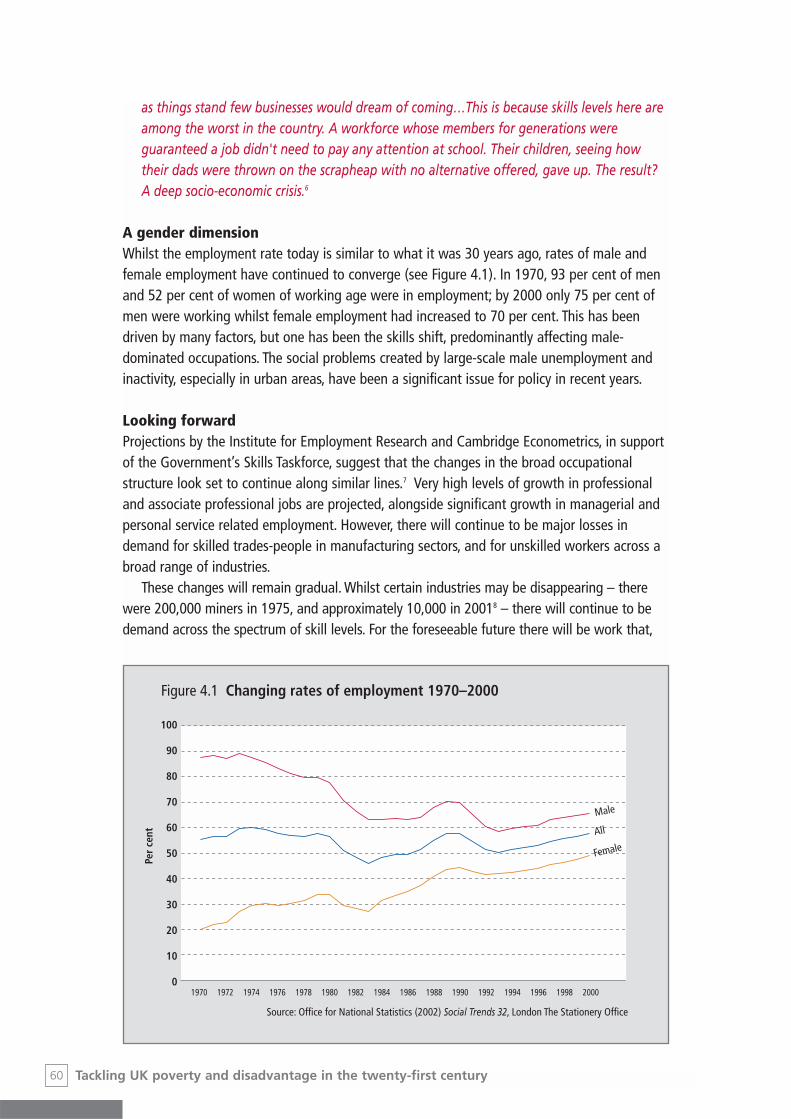
as things stand few businesses would dream of coming…This is because skills levels here areamong the worst in the country. A workforce whose members for generations wereguaranteed a job didn't need to pay any attention at school. Their children, seeing howtheir dads were thrown on the scrapheap with no alternative offered, gave up. The result?A deep socio-economic crisis.6
A gender dimensionWhilst the employment rate today is similar to what it was 30 years ago, rates of male andfemale employment have continued to converge (see Figure 4.1). In 1970, 93 per cent of menand 52 per cent of women of working age were in employment; by 2000 only 75 per cent ofmen were working whilst female employment had increased to 70 per cent. This has beendriven by many factors, but one has been the skills shift, predominantly affecting male-dominated occupations. The social problems created by large-scale male unemployment andinactivity, especially in urban areas, have been a significant issue for policy in recent years.
Looking forwardProjections by the Institute for Employment Research and Cambridge Econometrics, in supportof the Government’s Skills Taskforce, suggest that the changes in the broad occupationalstructure look set to continue along similar lines.7 Very high levels of growth in professionaland associate professional jobs are projected, alongside significant growth in managerial andpersonal service related employment. However, there will continue to be major losses indemand for skilled trades-people in manufacturing sectors, and for unskilled workers across abroad range of industries.
These changes will remain gradual. Whilst certain industries may be disappearing – therewere 200,000 miners in 1975, and approximately 10,000 in 20018 – there will continue to bedemand across the spectrum of skill levels. For the foreseeable future there will be work that,
60 Tackling UK poverty and disadvantage in the twenty-first century
Figure 4.1 Changing rates of employment 1970–2000
100
90
80
70
60
50
40
30
20
10
0
Source: Office for National Statistics (2002) Social Trends 32, London The Stationery Office
1970 1972 1974 1976 1978 1980 1982 1984 1986 1988 1990 1992 1994 1996 1998 2000
Per
cent
Male
All
Female

relatively speaking, requires few skills and even less in terms of formal qualifications, and manyindustries where vocational apprenticeships would be highly appropriate (although notnecessarily the kind of industries traditionally associated with such apprenticeships). However,the balance has shifted dramatically. Whilst we cannot be sure what changes may occur 20years hence, we can assume that the greater the proportion of the population that has a broadset of skills, the more equipped we will be as a country to respond proactively and efficiently.
The importance of generic key skillsThe key skills that most people now require encompass: basic communication, numeracy andliterary, information technology (IT), ability to work with others, problem solving, improvingown learning and performance, reasoning skills for work planning, and work processmanagement skills.9
Such skills are required for an extremely wide spectrum of jobs.10 They are generic and, assuch, should be highly transferable and adaptable to new work and changing circumstances.11
They provide a platform for further personal development and mobility. People need no longerthink in terms of one skill or trade for life.12
In short, people need the competencies traditionally associated with white-collar work.13
But entry to white collar occupations has been through possession of the ‘O level standard’,and the higher qualifications that flow from it.14 The equivalent to this is GCSE grade C (orNVQ level 2) and above. Lack of this level of qualification and/or minimum literacy, numeracyand communicative skills is the critical challenge to overcome.
The education problemThese occupational changes are being mirrored throughout Western economies. Britain hasadapted faster than most countries, in recent years, in expanding access to higher leveleducation. Since the introduction of GCSEs there has been a rapid increase in the numberscontinuing in post-compulsory education, completing A-Levels and attending a much largeruniversity system. However, Britain remains behind most other countries in reducing thenumbers of people who leave education with few or no qualifications. We have failed torecognise that there are now many fewer jobs than in the past available to people who lack abasic educational foundation.
In the OECD’s PISA study (Programme for International Student Assessment), analysing theliteracy and numeracy levels of 15-year-olds in developed countries, the UK performed fairlywell at both the highest and lowest ends of the achievement scale.15 However, to an extentunmatched in most other countries, the distribution of educational achievement maintainedpre-existing inequalities, with differences between high and low attainment accounted for bysocio-economic class. Moreover, the tests were carried out on 15-year-olds. It is beyond thispoint that the dividing lines between the educational ‘haves’ and ‘have not’s’ becomeevermore clear. At age 17, just 74 per cent in Britain are in full-time education, the fourthlowest proportion out of OECD countries – only higher than Mexico, Greece and Portugal; tencountries have participation rates over 90 per cent, including France, Germany, Australia andthe Netherlands.16 Comparative research across Europe has shown that it is primarily levels ofprior educational attainment that are the key determinant of staying on, rather than factorssuch as opportunities in the youth labour market.17 One specific consequence has been thephenomenon known as NEET – young people not in education, employment or training. The
61Tackling UK poverty and disadvantage in the twenty-first century

Social Exclusion Unit estimates that there are 161,000 so-called NEET young people everyyear18 and this has remained unchanged for 8 years.19
A failing school population20
The significant improvement over the last ten years in attainment has seen the proportionattaining five or more GCSEs A*–C increase from 33 per cent in 1989 to 50 per cent in 2001.However, more than 25 per cent of pupils get no grades A*–C.21 They are one in four of theyoung adults entering the labour force, and their level of attainment has stagnated. Oneanalysis of GCSE results from 1993-1997 showed that whilst the top 10 per cent of studentsincreased their scores on average by over 4 points,22 the scores of the bottom 10 per centactually worsened.23
At this level attainment really matters. More often than not attaining five GCSEs A*–C inYear 11 is a ticket to A-levels and then on to university. For others, and many attaining slightlylower levels, there is access to good further education and good prospect of decentemployment and the employer-funded skills escalator. As Figure 4.3 shows, the majority ofthose who get 1–4 GCSEs A–C after school year 11 (mostly aged 16), those who mostnarrowly miss the benchmark, go on to reach Level 2 or 3 qualifications by the time they are19; for those with less, the prospects are clearly much worse – with many fewer picking upmore qualifications over the next few years in further education.
Whilst one in fourteen 17-year-olds who get 1–4 GCSEs A*–C after school year 11 are notin education, training or employment, one in four of the cohort who get 1–4 GCSEs D–G are inthis situation.24 Whilst many who lack qualifications do find success in the labour market, theirchances are much reduced.
Factors associated with low attainment There are many factors that feed into someone completing compulsory education with few orzero qualifications. However, it is a complex issue and isolating the key variables and inferringcausality remains less clear-cut. There are several reasons for this:
62 Tackling UK poverty and disadvantage in the twenty-first century
Figure 4.2 Fewer pupils than in other countries stay on at schoolParticipation in education and training aged 17 in OECD countries
100
90
80
70
60
50
40
30
Per
cent
in e
duca
tion
/tra
inin
gag
ed 1
7
Source: OECD (1998) Education at a Glance, Paris: OECD
Greece
Portu
gal
United
Kingdo
m
Hunga
rySp
ain
Icelan
d
Irelan
d
Luxe
mbourg
Canad
a
New Ze
aland
United
State
s
Switz
erlan
d
Denmark
Czech R
epub
lic
Austria
Korea
Polan
d
Finlan
dFra
nce
Norway
German
y
Netherl
ands
Austra
liaJap
an
Swed
en
Belgium

1 Many of the key variables discussed below interact very strongly with each other.2 Much of the quantitative evidence derives from longitudinal studies.25 Such studies are
invaluable, however they are neither exhaustive nor can they reveal more nuanced effectsthat qualitative studies may elucidate. Amongst these may be factors that many believe arecentral to a successful educational process, such as values (of pupils, parents and teachers),which are very difficult to quantify and compare on a large scale.
3 There are a range of individual, human differences that impact upon the whole process. Forevery young person who succeeds ‘against the odds’ there are those who would appear tohave all the comparative advantages associated with good attainment levels, but who dopoorly.
As education is a process, different factors have a cumulative effect. Under-development atone stage will lead to ill-preparedness at the next, which in turn may impact in a range ofways. This process begins before a child is born, and poverty appears to bite even in this earlystage. In infancy a range of environmental factors will feed into the skill-set a child has by thetime they reach primary school. At primary school whilst ‘home’ factors such as nutrition orparental interest continue to be important, other factors also matter, such as peer groupinfluences (an intake factor) and school quality. A powerful interplay between these factorscontinues to affect the attainment process throughout. In the following section we consider‘home’ factors, ‘intake factors’ and ‘school quality’ factors, although in reality they areinterdependent.
A further issue of great significance is the experience and outcomes for children of minorityethnic groups within education. Whilst not considered at length in this paper, the differentialoutcomes and some ways of thinking about the problem are considered in the box overleaf.
63Tackling UK poverty and disadvantage in the twenty-first century
Figure 4.3 Attainment trajectories after school year 11Highest qualification aged 19 by qualifications at end of school year 11
80
70
60
50
40
30
20
10
0
Per
cent
in e
duca
tion
/tra
inin
gag
ed 1
7
Source: Department for Education and Skills (2001)Youth Cohort Study: The activities and experience of 16-year-olds: England and Wales,
<http://www.dfes.gov.uk/statistics/DB/SFR/s0230/index.html>. Accessed 27 January 2003
Highest qualification at end of Year 11
5+ GCSEgrades A*–C
1–4 GCSEgrades A*–C
5+ GCSEgrades D–G
Less than 5GCSE grades
D–G/none
Level 3+ (2 A levels and/or degree/vocational equivalents)
Level 2 (5+ GCSEs A*–C /vocational equivalents)
Below level 2

64 Tackling UK poverty and disadvantage in the twenty-first century
Education and minority ethnic groupsDiscussion of the educational achievement of minority ethnic groups has been hamperedby the poor quality of data, the culture of blame that has often permeated the debate andthe emotive nature of any discussion involving race and racism. Yet many young peoplefrom some minority groups have lower than average attainment levels; it requiresattention and intervention.
Despite significant data issues (see box) a broad picture of the position is presented here.Table 4.1 and Figure 4.4 are based on a new analysis of data from three waves of theYouth Cohort Study.
This data shows some stark differences. The overall performance of women is better inevery group. However, the difference in attainment levels between ethnic groups is fargreater – ranging from 68 per cent of Chinese young people who attain five GCSEs A–C
Table 4.1 Per cent gaining five GCSEs A*–C by ethnicity and gender
Overall (%) Men (%) Women (%)
White 47 43 52Caribbean 26 22 30African 32 22 41Other black 33 * 34Indian 54 50 58Pakistani 27 24 30Bangladeshi 29 22 37Chinese 68 68 69Other Asian 61 53 72All others 36 31 42
Source: Department for Education and Skills (2001) Youth Cohort Study: The activities and experience of 16-year-olds: England and Wales,
<http://www.dfes.gov.uk/statistics/DB/SFR/s0230/index.html>. Accessed 27 January 2003* Number witheld due to sample size
Figure 4.4 Attainment of five GCSEs A*–C by ethnic group
80
70
60
50
40
30
20
10
0
Per
cent
gai
ning
5 G
CSEs
A*–
C
Ethnic origin
Chinese OtherAsian
Indian White Otherblack
African Bangla-deshi
Pakistani Carib-bean
Allothers
Source: Department for Education and Skills (2001)Youth Cohort Study: The activities and experience of 16-year-olds: England and Wales,
<http://www.dfes.gov.uk/statistics/DB/SFR/s0230/index.html>. Accessed 27 January 2003

65Tackling UK poverty and disadvantage in the twenty-first century
compared with 26 per cent of Black Carribean pupils.There is evidence of worrying processes. For example, as Figure 4.5 illustrates in one
local authority, the achievement of African Caribbean children was shown to be 20 percent higher than the LEA average on entry to school at age 5, but 20 per cent below theLEA average by the end of their GCSEs.
The interactions of different characteristics, such as poverty and deprivation, the ethniccomposition of particular area and school and gender make determining cause highlycomplicated.26 Indeed there are likely to be many explanations for the disparities inattainment between different groups, many hidden by the reality that aggregateexperiences of one ethnic group hide great diversity within it. What seems to be clear isthat there are multiple causes. It is important for educational institutions to respond tothese differences in ways that begin to enhance achievement. This is supported by theobservation of the Commission on the Future of Multi-ethnic Britain that:
…the most successful multi-ethnic schools are ‘listening schools….’ schools which tooktime to talk to students and parents; which were prepared to consider and debate valuesas well as strategies; which took seriously the views students and parents offered andtheir own interpretations of school process; and which used this learning to reappraise,and where necessary change their practices to build a more inclusive curriculum.27
Some popular explanations for disparities in achievement run counter to thisobservation: those that blame children for their own school ‘failure’; those that castcultural aspersions about behavioural norms and values to explain collective group ‘underachievement’; those that do not recognise that problems within the education systemreflect structural inequalities within society as a whole.
Moving forward requires recognising that the vast majority of those involved indelivering education, from policy-makers, through LEA officials, governors and teachers donot necessarily fully understand the knowledge, values and aspirations of the communitieswhom they serve. Furthermore, they cannot expect nor be expected to, until the systemattempts to engage with different communities at all levels.
Figure 4.5 Inequalities from Baseline to GCSE by ethnic origin in relationto LEA average in one LEA
25
20
15
10
5
0
-5
-10
-15
-20
-25
Perc
enta
ge o
f LEA
ave
rage
Source: Gilborn, D. and Mirza, H. (2000) Educational Inequality: Mapping race, class and gender, a synthesisof research evidence, London: OFSTED.
Baseline Key stage 1 Key stage 2 Key stage 3 GCSE
Black
White
LEA average
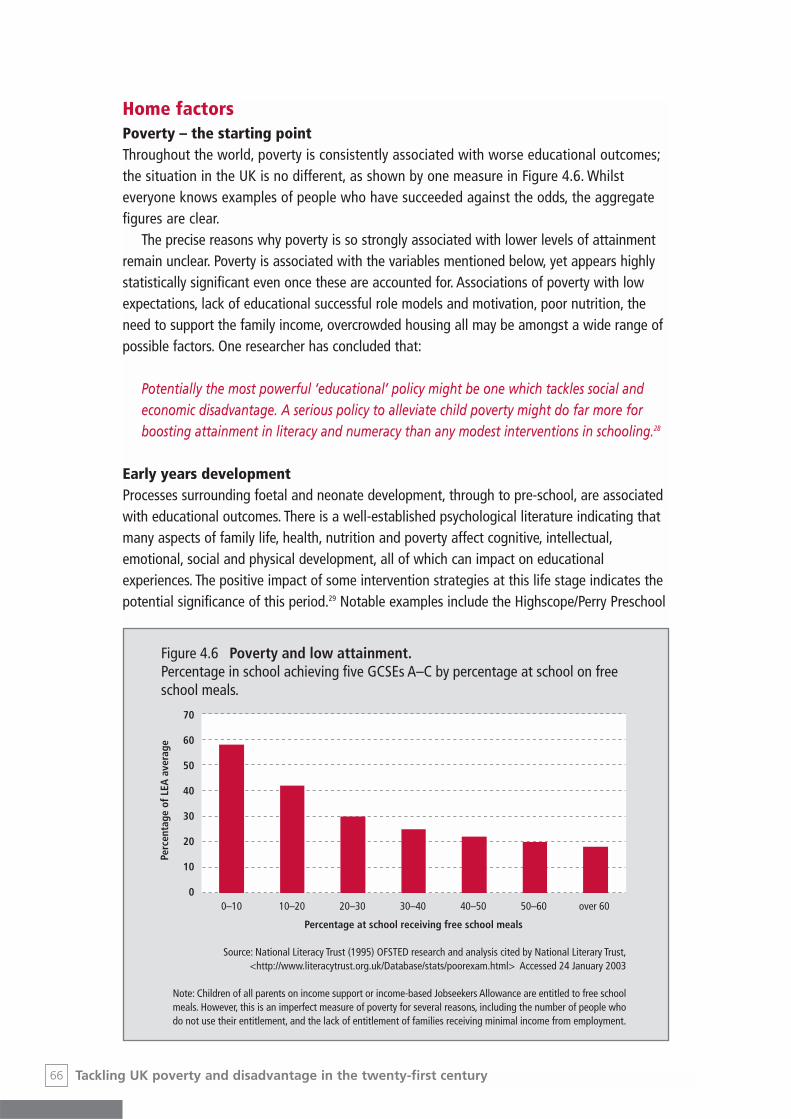
Home factorsPoverty – the starting pointThroughout the world, poverty is consistently associated with worse educational outcomes;the situation in the UK is no different, as shown by one measure in Figure 4.6. Whilsteveryone knows examples of people who have succeeded against the odds, the aggregatefigures are clear.
The precise reasons why poverty is so strongly associated with lower levels of attainmentremain unclear. Poverty is associated with the variables mentioned below, yet appears highlystatistically significant even once these are accounted for. Associations of poverty with lowexpectations, lack of educational successful role models and motivation, poor nutrition, theneed to support the family income, overcrowded housing all may be amongst a wide range ofpossible factors. One researcher has concluded that:
Potentially the most powerful ‘educational’ policy might be one which tackles social andeconomic disadvantage. A serious policy to alleviate child poverty might do far more forboosting attainment in literacy and numeracy than any modest interventions in schooling.28
Early years developmentProcesses surrounding foetal and neonate development, through to pre-school, are associatedwith educational outcomes. There is a well-established psychological literature indicating thatmany aspects of family life, health, nutrition and poverty affect cognitive, intellectual,emotional, social and physical development, all of which can impact on educationalexperiences. The positive impact of some intervention strategies at this life stage indicates thepotential significance of this period.29 Notable examples include the Highscope/Perry Preschool
66 Tackling UK poverty and disadvantage in the twenty-first century
Figure 4.6 Poverty and low attainment.Percentage in school achieving five GCSEs A–C by percentage at school on freeschool meals.
70
60
50
40
30
20
10
0
Perc
enta
ge o
f LEA
ave
rage
Source: National Literacy Trust (1995) OFSTED research and analysis cited by National Literary Trust,<http://www.literacytrust.org.uk/Database/stats/poorexam.html> Accessed 24 January 2003
Note: Children of all parents on income support or income-based Jobseekers Allowance are entitled to free schoolmeals. However, this is an imperfect measure of poverty for several reasons, including the number of people whodo not use their entitlement, and the lack of entitlement of families receiving minimal income from employment.
0–10 10–20 20–30 30–40 40–50 50–60 over 60
Percentage at school receiving free school meals

Project in the USA, an intensive developmental programme for people from disadvantagedbackgrounds, which has resulted in substantially enhanced educational outcomes forparticipants.30
Parental supportMany studies have shown that the academic achievements of parents are associated witheducational outcomes for children; this appears to feed through the significant role thatparental interest and involvement plays in children’s education.31 There are manycommonsense reasons why this factor is important. Parents can give practical help; forexample, reading to children and then helping them to read has been shown to have apowerful impact. However, throughout childhood ongoing emotional support andencouragement and the constant reinforcement of the value of education and setting of highexpectations are all important. Moreover, knowledge of how to maximise a child’s educationalpotential – such as encouraging them to do their homework, discussing problemsconstructively with teachers and being able to play the system to the greatest possible effect –are all significant.
Intake factorsPrior attainmentPerhaps the most significant predictor of attainment at secondary level is attainment at theprevious level. Much of this is likely to be associative – similar factors that led to good or badattainment previously will feed into the similar results later on. However, it is likely that thereare certain causal factors as well. A pupil going through the Key Stages of education reachingthe expected levels at each stage will be prepared to move on to the next stage, whereas apupil who falls behind will find the work cumulatively ever harder and more de-motivating.Furthermore, if schools intakes or structures are in any way connected to prior attainment (e.g.through selection or setting), then peer group effects, discussed further below, take effect.
Peer groups There is robust evidence that peer groups have a strong impact on the education attainmentof their members.32 The effect, depending on the peer group in question, can be positive ornegative, and operates both at the school and classroom level and even within the widercommunity. The peer group effect manifests itself overtly through the capabilities in somegroups for pupils to help each other, or to bring each other down, as has been shown starklywithin qualitative studies.33
However, the more important effect is thought to be in the transmission of values that willimpact in a variety of ways, from classroom behaviour to propensity to do homework,encompassing motivation, commitment and expectations of one’s own potential achievement.These are values that many educationalists believe are really at the heart of educationalsuccess, and are very much part of a broader notion of human capital.
67Tackling UK poverty and disadvantage in the twenty-first century

School quality factorsTransitions to secondary schoolThe transition from primary to secondary school is one that has a major impact on children,socially, emotionally and academically. Major changes range from a new teaching and learningstyle, large curriculum changes and a new structure to the day, to a much larger environmentwith new people, both teachers and peers. All these changes occur at the same time as manychildren are experiencing changes associated with adolescence. When transitions areunsuccessful, the result can be stagnation in learning, which even if short-lived can have along-term impact.34
Broader school quality issuesThe relative significance of ‘school quality’ continues to be much debated. In large-scalelongitudinal studies, aspects of school quality that are detectable, such as class size, oftenappear insignificant. At the same time, whole arms of academia, Government and theeducation profession, not only in the UK but internationally, are aiming to improve levels ofacademic provision, making poor schools better, improving all schools. Furthermore parents‘know’ a good head-teacher when they see one, and recognise the importance of an inspiringteacher and a positive learning environment to their child’s progress. Is this all irrelevant?Surely not.
School effectiveness research suggests several factors that can have a positive effect onhelping a school to reach its potential. These factors include: a professional leadership, ashared vision and goals, a learning environment, concentration on teaching and learning,purposeful teaching, high expectations, positive reinforcement, the monitoring of progress, anemphasis on pupil rights and responsibilities, positive home-school partnerships and theschool acting as a learning organisation.35
Evidence from OFSTED (Office for Standards in Education) supports this view. Repeatedstudies show that schools with very similar intakes have very different examinationperformance. This must indicate the potential salience of school quality factors. However, theresearch simultaneously shows that even the very best performing schools servingdisadvantaged intakes – which perform well above the national average on OFSTED inspectionratings – struggle to perform at the national average in terms of exam results. The implicationis that within the current system, schools can have a differential impact upon children’sattainment, but the potential effect is limited by the nature of the school’s intake. Theconclusion must be that within the present system there is little chance of radically alteringthe educational prospects of the most disadvantaged.
However, evidence exists that where schools are given extra opportunities – above what isoffered to the mainstream – results can improve more rapidly. An example comes from theUSA. Independent pilot studies of schools serving disadvantaged communities in Wisconsin(SAGE) and Tennessee (STAR) have had very positive test results experimenting with classroomsizes of no more than 15. The greatly enhanced test results in comparison to control groups,are reinforced by qualitative analysis of teachers’ experiences, which in the case of SAGEshowed that:
68 Tackling UK poverty and disadvantage in the twenty-first century
…because of the small class sizes, they (teachers) know the strengths and weaknesses ofeach child. They know where each is in the learning cycle and can respond appropriately.The teacher gets around to every child to offer help in a one-to-one situation. Furthermore,the teacher can give help instantly when the class is small. 36
Moreover, classroom management issues were shown to be greatly reduced.
The current policy contextThe current Government has recognised the plethora of factors discussed above and has rolledout a broad policy agenda.
Discussed elsewhere in the report, there have been policies aimed at tackling child poverty.Sure Start is one of the more tightly focussed on factors associated with low attainment. SureStart aims to improve those aspects of child development discussed previously. Its goal is:
• to work with parents-to-be, parents and children to promote the physical, intellectual andsocial development of babies and young children – particularly those who aredisadvantaged – so that they can flourish at home and when they get to school.37
It is modelled on a programme originating in the USA, which has been shown to positivelyinfluence disadvantaged children’s long-term education and employment trajectories.
At primary school level there has been the introduction of numeracy and literacy hours,aimed at improving the basic skills lacked by too many children entering secondary schools, aswell as the reduction of primary school class size to below 30. There is evidence that primaryschool results have been improving throughout the population, and that the social class gapmay be narrowing at this stage.38
There have been initiatives aimed at providing more information for parents, giving greatervoice and encouraging family learning. Schools are required to produce home–schoolagreements. Sure Start is also about actively involving parents in their children’s education andempowering them to take on such a role permanently. The emphasis on lifelong learningshould, if ultimately successful, improve the capacity of parents to be more directly involved intheir children’s education.
There has been the introduction, and curtailment of the Education Action Zones, and themore popular Excellence in Cities (EiC). EiC in 2001–2 has injected an extra £300m into a widevariety of programmes aimed at improving attainment at predominantly secondary level ininner city schools. Programmes have ranged form Learning Support Units, which take‘problematic’ pupils out of the classroom to give them special attention and allow theclassroom to function better, to the Gifted and Talented programme, which identifiespotentially high attaining pupils to give them extra opportunities. There has also been moneyto expand Specialist schools, City Learning Academies and the Beacon School initiative.
However, these policies must be seen in the context not only of the massive rise of povertyand increases in area polarisation discussed elsewhere, but a number of systemicdisadvantages that currently exist:
• The introduction of a quasi-market in education during the 1980s has had particular
69Tackling UK poverty and disadvantage in the twenty-first century
implications for the bottom 25 per cent of pupils. ‘Formula funding’ meant that schools’priority was to maximise their pupil numbers. With published performance indicators –commonly known as league tables – and with those performance indicators beingmeasured on a relatively high attainment target (five GCSEs A–C), the incentive for schoolswas to focus on helping pupils to meet this target. This had several implications. Withexisting pupils there was an incentive to focus resources on those who could reasonablyexpect to have a chance of meeting the benchmark.39 Those languishing with little hopewould count for no more whether they got no GCSEs or two. Secondly – and this isdiscussed further below – the best way of maximising numbers of successful pupils, is togarner the right intake. With published league tables and a liberalisation of several aspectsof intake policy, the seeds of greater segregation were sewn.
• At the same time, as discussed elsewhere in the report, there have been other processes ofpolarisation, across place, housing sectors and in the labour market. These processes havealso influenced the make-up of schools in many ways, such as an increasingly residualisedestate providing an increased proportion of a school’s intake. Also, long anecdotallyrecognised, now supported by research, is the process of house prices being heavilyinfluenced by the quality of local schools, with parents willing to pay a hefty premium tosend their children to ‘good’ schools.40
These factors have led to increasing social segregation in schools (even if research is yet toagree which cause was more significant).41 The result has been to maximise the polarisingimpact of peer-group influences on educational inequality.
There is evidence that people from disadvantaged backgrounds are more likely to go toschools that do more poorly in many of the key elements of school quality mentioned before.Nearly one in seven inner-city secondary schools have been identified by OFSTED as having‘serious weakness’ or ‘requiring special measures’, compared with 1 in 19 nationally – anindicator neither looking at exam performance, nor focussing on intake factors.42 Schools withabove 35 per cent pupils known to be eligible for free school meals are well below theaverage on OFSTED inspection grades for good or very good in key areas, such as school ethosand management.43
Quantitative evidence is lacking in other areas. However, there is qualitative and anecdotalevidence – supported by our consultations. In deprived areas there are more likely to beunqualified teachers, high rates of teacher turnover, large numbers of supply teachers andteacher shortages, dilapidated buildings and poor facilities, including access to ICT.
Looking forwardIf the focus is on tackling disadvantage, then the education system must concentrate on thelowest achieving and facilitating their capacity to improve their circumstances through thelabour market.
Even taking this approach, however, we recognise there are many questions that are highlycontested within academia, the policy world and the public as a whole. What is the purpose ofeducation? Is education aimed at producing well-rounded people or is it to facilitate stronglabour market performance? If it is aimed at facilitating strong labour market performance, isit necessary to judge which range of skills and abilities would be best for the country, and totry and mould the education system to fit this recipe, or is it to allow all to compete? What are
70 Tackling UK poverty and disadvantage in the twenty-first century

the lines between personal choices and each individual’s or parents’ understanding of theirown needs and the responsibilities of society? Why, for example, do people have a choice toleave school at 16 and not 14 or 18?
We cannot answer all of these questions, but seek rather to assert the principle that theanswers to such questions should be the same for disadvantaged groups as they are for themore privileged. It is based on an assumption that, for many young people who do not gethigh attainment at schools, there are a range of factors beyond their control that arecontributing to this low attainment. This is not to suggest that all young people would – if theschool system was fully effective – be able to follow a successful traditional learning path. Butit does suggest that, given the right opportunities, many more young people fromdisadvantaged backgrounds would. The corollary is that whilst there is an important role for amore widespread and varied curriculum that recognises different people’s strengths andinterests, the focus of such a new curriculum should not be on the currently disadvantaged –otherwise such a curriculum would forever be residualised. We need to balance up the chanceof all young people succeeding in the traditional route, and offering choice based on abilitiesand interests not on social class and differential opportunities.
Principles for changeA real change in education is possible over 20 years. It requires a commitment to a long-termtransformation that will – if successful – make our society in 20 years look very different fromwhat it does today. Whilst there may be potential avenues for quick gains, overall it is likely torequire a broad consensus that the status quo is both unjust and deeply unhelpful to theeconomic and social future of this country.
Out of our consultations emerged three principles that must lie at the heart of educationpolicy.
1 Reducing wider inequalities: We cannot expect schools to solve all the problems ofdisadvantage. Unless children have the right start, and are supported throughoutchildhood, both at home and in their wider environment, in all aspects of theirdevelopment, inequalities will persist.
2 Tackling concentrations of disadvantage within schools: Whilst all schools have the potentialto achieve great things with their children, those that have concentrations of poverty anddisadvantage will struggle to help children attain the levels of those in schools with moreadvantaged intakes. We need a policy agenda that seeks to counter, rather than contributeto the trends of polarisation.
3 Prioritising the tackling of the lowest attainment within schools: Whatever the social make-up of a school, it needs the frameworks, incentives and resources to make the educationalattainment of those towards the lower end of the attainment scale a major priority.
The first issue of addressing wider inequalities is dealt with elsewhere in the report. Chapter 5focuses on family support and the wide range of risk and protective factors associated withearly child development. Chapter 7 looks at adequately supporting incomes. We thereforeconcentrate here on the second two.
We are not aiming to be prescriptive about policy implementation in the education sphere.
71Tackling UK poverty and disadvantage in the twenty-first century

Teachers and governors, researchers and policy-makers, parents and children all need to beengaged in developing a wide range of effective strategies – at different levels – in order toaddress these problems. However, our consultations and the existing literature reveal somepromising directions to explore in developing these strategies. It is to this that we now turn.
Tackling concentrations of disadvantage in schoolsCentral to this is a challenging reality that there is a middle class hegemony in education.Each individual parent wants to maximise their child’s potential gains from the educationsystem, and the middle classes would react harshly to any attempts at systemic change thatare seen as challenging the advantages which they currently accrue. The tension is most visiblein frequent media discussions about politicians’ choice of schools for their children. Thishegemony is maintained through a wide variety of means: some of the main ones have beenmentioned earlier (selective schools, selection by mortgage). There are others, however, such asthe continued existence of independent schools which, for example in many parts of London,allow poverty and affluence to live ‘cheek by jowl’, with some parents being able to buy out ofthe local education system. There are several policy levers available for tackling such issues.However, whether or not desirable, they are all controversial.
Some are well rehearsed:
• Directing the wider policy agenda more towards creating more socially balance and mixed-income areas, countering the trend toward social polarisation that has increasinglyoccurred in recent decades. This requires an emphasis, not just on housing policy, but on allthe factors that drive the private market, such as the broad quality of public services, crime,public spaces etc.
• Changing league tables as we know them to reflect added value rather than grossattainment levels. A focus on the attainment of all pupils, rather than just those who getfive GCSEs A–C would encourage schools to take a wider intake, in the knowledge thatthey would be rewarded for progress made with all pupils and not merely those theypropelled over one required threshold.
• Cutting back on school selection. In the maintained sector there remain many old stylegrammar schools, moreover there are increasingly a broad range of schools that operatesome method of selection. Furthermore, the state continues to give a subsidy for the mostaffluent to buy out of mainstream provision, which could be addressed by removing thecharitable status that independent schools carry.
A further idea suggested by our consultations is:
• League tables based on clusters of schools. This is an educational point as much as a peer-group point, making the case for schools to be considered within a larger locality, to sharethe resources and expertise and to be judged as an education cluster.
72 Tackling UK poverty and disadvantage in the twenty-first century

The government’s policy in this area is to make disadvantaged schools better, and by doingthis to encourage ‘middle class’ parents to choose them. This is an explicit aim of theExcellence in Cities policy. However, there is great concern that the focus on Specialist schoolsis creating another tier, which the more affluent will find a way of buying into and the poorestfamilies will continue to be left with a residualised option. 44
Prioritising the tackling of the lowest attainment within schools Whatever intake a school has it should be incumbent on the education system to try to reducepre-existing inequalities and give all the opportunity to reach good attainment levels.Achieving this requires action on four fronts.
1 Equalising access to the same level of basic provision. This means providing the necessaryresources to ensure that all young people from disadvantaged backgrounds have equalaccess to dimensions such as quality of teachers and levels of facilities, whether sportingand Information Technology or actual building conditions.
2 Dissemination of good practice. In both a general sense and in specific areas faced byschools serving large numbers of disadvantaged children, knowledge of ‘what works’ needsto be spread. This includes specific training for Senior Management (including, of course,head teachers) and teachers dealing with specific issues.
3 Incentives for concentrating on those in greatest need. Whilst incentives exist for schools toconcentrate their resources on those who can get five GCSEs A–C, the 25 per cent of youngpeople not getting any GCSEs A–C will remain marginalised.
These priorities should be uncontroversial. There has been some Government action on all ofthese fronts. However, there remains a long way to go in many places and where resources arerequired to meet any of these needs they should represent an urgent short-term priority.
4 If the educational opportunities for disadvantaged groups are truly to be transformed, thenthe education system needs to offer such groups something beyond the mainstream schoolexperience to give them a chance of meeting the same goals. All those we consultedbelieved that if more resources were targeted in the correct way towards meeting needsthen progress could be made. The Government has already accepted this argument,however the scale of extra resource allocation is far from adequate.
For far too long in the UK, spending on education as a proportion of GDP has been well belowthe OECD average. The Government’s latest spending plans, announced in the 2002 SpendingReview, building on previous announcements, will substantially raise spending, with theintention to match the OECD average of 5.6 per cent of GDP by 2005–6. This offers a realopportunity to make a marked impact on the educational opportunities of disadvantagedyoung people. The size of expansion allows the Government to ensure that all benefit, whilstdirecting significant extra resources to disadvantaged groups, thus beginning to redress thelong-standing inequalities.
73Tackling UK poverty and disadvantage in the twenty-first century

The potential efficacy of a resources-led strategy to combat educational disadvantage iscontested, with strong advocates on either side.45 However, there has been little evaluation todate of major mainstream resource-driven attempts to reduce educational disadvantage, basedon allocating resources in those areas identified as key by school-effectiveness research.
We need serious levels of investment, buttressed by rigorous longitudinal evaluation over asustained period of time. Precisely how that investment is used goes beyond the scope of thischapter, however we must:
• Have the same expectations for all, but provide the extra resources necessary to makethose expectations realistic.
• Develop better mechanisms for targeting disadvantage, both between and within schools.The current mechanisms that predominantly target schools fail to do this adequately, butalso fail to meet the needs of disadvantaged young people who attend schools that are notrecipients of extra resources.
• Not be afraid to think radically, and try out new ideas – such an approach is imperative.One idea suggested in our consultations was to offer a scheme where talented youngteachers are offered the incentive of a paid year of travelling abroad in return for acommitment to 5 years in a disadvantaged school with special training and a strongsupport structure. Another would be to try an equivalent of the STAR and SAGEprogrammes mentioned earlier.
• Have a rigorous longitudinal evaluation in place, so we can have a good understanding ofwhat works and what effects there are, not just on attainment at school but also on lateroutcomes.
Notes1 There is much evidence showing the financial benefits of both extra years of schooling and obtaining qualifications.
See Walker, I. and Harmon, C. (2001) The Returns to Education: A review of evidence, issues and deficiencies in theliterature, RR254, London: Department for Education and Skills for a discussion.
2 Office for National Statistics (2001) Social Trends 31, London: The Stationery Office.3 Turok, I. and Edge, N. (1999) The Job’s Gap in Britain’s Cities, York: Joseph Rowntree Foundation/Policy Press.4 NVQ levels: Level 1, GCSEs D–G; Level 2, GCSEs A*–C; Level 3, A levels; Levels 4 and 5, higher levels qualifications.5 Kleinman, M. (2000) Include Me Out? The new politics of place and poverty, CASE paper 11, London: Centre for the
Analysis of Social Exclusion, London School of Economics, p. 9.6 Mathiason, N. (2000) Guardian Newspaper, 8 October.7 Wilson, R. (ed.) (2001) Projections of Occupations and Qualifications 2000/2001, London: IER/CE/DfEE.8 Office for National Statistics cited on <http://news.bbc.co.uk/1/hi/business/1216593.stm> Accessed 22 January 2003.9 Institute for Employment Research (2001) Projections of Occupations and Qualifications 2000/2001, Sheffield:
Department for Education and Employment.10 These skills include many of the ‘soft’ skills that have been emphasised recently in employers’ concerns about the
employability of young and/or unskilled people.11 Green, F. (1999) ‘Training the workers’. In Gregg, P. and Wadsworth, J. (eds.) The State of Working Britain,
Manchester: Manchester University Press.12 Dench, S., Perryman, S. and Giles, L. (1998) Employers Perceptions of Key Skills, Report 349, Brighton: The Institute for
Employment Studies.13 Department of Trade and Industry (1998) Our Competitive Future: Building the knowledge driven economy: The
Competitiveness White Paper, London: The Stationery Office.14 Heath, A. (1981) Social Mobility, London, Fontana.15 OECD (2001) Knowledge and Skills For Life: First results from PISA 2000, Paris: OECD.
74 Tackling UK poverty and disadvantage in the twenty-first century

16 OECD (2000) Education at a Glance, Paris: OECD.17 Macintosh, S (2001) ‘The Demand for Post-Compulsory Education in Four European Countries’ Education Economics,
9 (1), 69–90.18 SEU (1999) Bridging the Gap, London: The Stationery Office.19 Rahman, M., Palmer, G. and Kenway, P. (2001) Monitoring Poverty and Social Exclusion, York: Joseph Rowntree
Foundation.20 Many of the issues raised in this chapter refer to both secondary and primary schools. Whilst problems at secondary
schools may appear more acute, many of the seeds of secondary school problems are sown at primary school. Issuesto do with concentrations of disadvantage and lack of resources apply to both, if not always equally.
21 We note that there has been improving results for low-achieving primary school pupils over the past decade.22 Equivalent to two GCSE grades.23 Sparkes, J. (1999) Schools, Education and Social Exclusion, CASE paper 29, Centre for the Analysis of Social Exclusion,
London School of Economics.24 Youth Cohort Study, Department for Education and Skills, unpublished.25 Primarily in the UK, the National Child Development Study and the British Cohort Study.26 Gillborn, D. and Mirza, H. (2000) Educational Inequality: Mapping race, class and gender, a synthesis of research
evidence, London: OFSTED.27 Blair, M., Bourne, J. et al. ‘Making the difference: teaching and learning strategies in successful multi-ethnic schools’
cited in Parekh, Lord (2000) Commission on The Future of Multi-Ethnic Britain, Runnymede Trust.28 Robinson, P. (1997) Literacy, Numeracy and Economic Performance, London: Centre for Economic Performance,
London School of Economics: p. 17.29 Danziger, S. and Waldfogel, J. (2000) Investing in Children: What do we know? What should we do?, CASE paper 34,
London: Centre for the Analysis of Social Exclusion, London School of Economics.30 Schweinhart, L., Barnes, H. and Weikart, D. (1993) ‘significant Benefits: The High/Scope Perry Preschool study through
age 27’ Monographs of the High/Scope Educational Research Foundation, 10, Ypsilanti: High/Scope Press.31 Hobcraft, J. (2000) The Roles of Schooling and Educational Qualifications in the Emergence of Adult Social Exclusion,
CASE Paper 43, Centre for the Analysis of Social Exclusion, London School of Economics; and Feinstein, L. andSymons, J. (1997) Attainment in Secondary School, Discussion Paper 341, Centre for Economic Performance, LondonSchool of Economics.
32 Robertson, D. and Symons, J. (1996) ‘Do peer groups matter? Peer groups versus schooling effects on academicattainment’, CEP 311, Centre for Economic Performance, London School of Economics.
33 MacDonald, R. and Marsh, J. (2001) ‘Disconnected youth?’, Journal of Youth Studies, 4 (4), 373–391.34 For a full discussion of the issues see Dalton, M., Morrison, I. and Pell, T. (2000) ‘Transfer and transition in English
schools: Reviewing the evidence’, International Journal of Educational Research, 33, 341–363.35 Sammons, P., Hillman, J. and Mortimore, P. (1995) Key Characteristics of Effective Schools: A review of school
effectiveness research, London: Institute of Education, International School Effectiveness and Improvement Centre, forthe Office for Standards in Education.
36 Molnar, A., Smith, P., Zahorik, J., Palmer, A., Halbach, A. and Ehrle, K. (1999) ‘Evaluating the SAGE Program: A pilotprogram in targeted pupil-teacher reduction in Wisconsin’, Educational Evaluation and Policy Analysis, 21 (2), 165–177.
37 What is Sure Start? (2002) <http://www.surestart.gov.uk/aboutWhatis.cfm?section=2> Accessed 16 January 2003.38 Glennerster, H. (2001) UK Education 1997–2001, CASE paper 50, London: Centre for the Analysis of Social Exclusion,
London School of Economics.39 Hallgarten, J. (2001) ‘school League Tables: Have they outlived their usefulness?’, New Economy, 8 (4), 189–196.40 Gibbons, S. and Machin, S. (2001) Valuing Primary Schools, London: Centre for the Economics of Education, London
School of Economics.41 Noden, P. (2001) ‘school Choice and Polarisation. Any evidence for increased segregation?’, New Economy, 8 (4),
199–202.42 Barber, M. (1999) Minutes of Evidence Taken Before the Education and Employment Committee (Education Sub-
committee), 14 July, London: The Stationery Office.43 OFSTED (2000) Improving City Schools, London: The Stationery Office.44 Whitty, G. (2001) Has Comprehensive Education a Future Under New Labour?, Speech to the University of London Union.45 West, A., Pennell, H., Travers, T. and West, R. (2001) ‘Financing School Based Education in England: poverty,
examination results and expenditure’, Environment and Planning – Government and Policy, 19, 461–471; andHanushek, E. (1998) ‘Conclusions and Controversies About Effectiveness of School Resources’, Federal Reserve Bankof New York Economic Policy Review, 4 (1), 11–25.
75Tackling UK poverty and disadvantage in the twenty-first century
76 Tackling UK poverty and disadvantage in the twenty-first century
Family poverty: a continuing storyThe most politically charged aspect of the widening gap between rich and poor in the past 20years has been the increased concentration of families with dependent children towards thebottom of the income distribution. Between 1979 and 1996 the number of people living inhouseholds with less than 60 per cent of the median income (after housing costs) increasedfrom approximately 7.5 million (13.2 per cent) to a peak of 13.9 million (24.6 per cent). Yetthe number of children who were living in ‘poor’ households grew even faster over the sameperiod, from 1.7 million (14 per cent) to 4.4 million (34 per cent).1 Moving into the 21stcentury, the figures for 2000/2001 – the latest statistics available – show a decline of abouthalf a million to 3.9 million. But that continues to represent three in ten children.2
International comparisons have shown that child poverty rates in Britain have risen tobecome higher than those in almost all other European states – double those of France andthe Netherlands and five times those in Finland, Sweden and Norway.3 This, as the JosephRowntree Foundation (JRF) Inquiry into Income and Wealth4 demonstrated during the mid-1990s, was not merely a matter of people with low incomes in the UK getting ‘richer’ lessrapidly than high earners. Looking back, there was compelling evidence that during the ‘boom’years of the mid-1980s, the poorest 20–30 per cent of the population failed to benefit in anysignificant way from economic growth. The Inquiry issued a warning to the ‘prosperousmajority’ that they should beware the long-term potential for social dislocation if so manychildren continued to be raised in relative poverty.
Looking ahead 20 years, we can take greater comfort than seemed possible in the mid-1990s, yet still find cause for concern. Although little discussed during the 2001 electioncampaign, the eradication of child poverty has become a central goal of the LabourGovernment that took power in 1997. In the words of the Prime Minister:
Our historic aim will be for ours to be the first generation to end child poverty…It is a 20year mission.5
A raft of measures that began taking effect during the second half of the Government’s firstterm, and have been sustained and extended during its second term, are deliberately designedto reduce the number of children living in poverty. The Government has launched its attack onthree fronts:
5 Tackling disadvantage:FamiliesBreaking the links between family povertyand social exclusionDavid Utting
▲ 9
▼ 71

1 Redistribution of income towards families with children: including a more generous WorkingFamilies Tax Credit (WFTC) in place of Family Credit, and above-inflation increases in ChildBenefit. A Children’s Tax Credit has replaced the Married Couple’s Tax Allowance and ratesof Income Support have been raised in successive budgets for families with children. FromApril 2003, a new, integrated Child Tax Credit (paid to the main carer and replacing allincome transfers for children apart from the non-means-tested Child Benefit) will simplifythe system. The Government’s ‘two-track’ policy will, as a result, become more transparent:namely, that a transfer of income is taking place in favour of all families with children, butthat a much greater redistribution is occurring in favour of those on low incomes.6
2 ‘Welfare to work’ incentives for parents: In addition to the tax credits available for workingparents, these incentives include the New Deal for Lone Parents – a voluntary package ofmeasures to help lone parents into training and work, with an associated target of having70 per cent of lone parents in paid work by 2010. Funding has also been progressivelyincreased to make more childcare places available for working parents. The 2002Comprehensive Spending Strategy looked forward to an extra 250,000 affordable childcareplaces by 2006.7
3 Initiatives to tackle wider social exclusion. Additional investments in children’s health andeducation include the Sure Start programme, offering comprehensive support services tofamilies of children under four in disadvantaged neighbourhoods, the Children’s Fundsupporting older children and their parents and specified elements of the National Strategyfor Neighbourhood Renewal. The administration of the Government’s English childcare,early years and Sure Start programmes have been brought together in a single, cross-departmental unit, with increased funding. Children’s Centres, combining childcare withchild and family support services, are to be established in each of the 20 per cent mostdeprived wards.8
Without exception, these measures represent serious attempts not only to raise the levels ofincome available to families, but also improve the well-being and life chances ofdisadvantaged children. Yet the first flush of enthusiasm among anti-poverty campaigners atfinding a government prepared to listen to research messages about low family incomes andsocial disadvantage has given way to more searching questions about the capacity of thecurrent strategy to achieve its goals.
Recent research has underlined the need to pursue such a strategy by demonstrating howchronic poverty, sustained from year to year, is disproportionately common among householdswith children.9 From another perspective, the JRF Poverty and Social Exclusion Survey of Britainshowed how more than two million children in the late 1990s were going without two ormore items that most people considered necessary. These ‘necessities’ included adequateclothing, a healthy diet, items to help their educational development, an annual week’sholiday away from home, and social activities. Deprivation was greatest in homes where noadult had any work at all or worked only part-time, in lone-parent households, in largefamilies, households where someone was chronically sick or disabled and in families of non-white ethnic origin.10
77Tackling UK poverty and disadvantage in the twenty-first century
Given the continuing evidence of what life is like for low-income families,11 there will be agrowing and unrelenting requirement from now on for hard evidence of the Government’sability to deliver. Hence, the central question driving this project: what more should theGovernment be doing now to reach its highly desirable, but ambitious aims?
Within a generation?Few would disagree with Gordon Brown, the Chancellor of the Exchequer, that child poverty isa ‘scar on the nation’s soul’.12 But it seems increasingly unlikely that his commitment to halvechild poverty by 2010 and then eradicate it ‘within a generation’–repeated in the 2002 Budgetstatement13–can be met unless the goal is pursued with still greater vigour and determination.The most recent statistics on Households Below Average Income, for 2000-2001, suggest thatLabour politicians overstated the case when they claimed, during the 2001 election, to havetaken a million children out of poverty.14,15 A policy modelling exercise by Piachaud andSutherland, funded by the Foundation, provides further evidence that the Government risksmissing its immediate target, set for 2004, of reducing child poverty by a quarter of its 1996/7level. Doing this would require a reduction of around 1.2 million in the number of childrenliving in poor households. Yet the estimated impact of current policies is a reduction by 2003/4of no more than 750,000.16
Political disputes over the latest statistics may prove ephemeral in the context of the next20 years, but it is still necessary to understand why the figures are currently not falling as fastas many had hoped. Brewer, Clark and Goodman, in an analysis for the Institute for FiscalStudies (IFS),17 point out that the 2000–2001 HBAI figures fail to capture the full impact ofbenefit increases in October 2000 and that measures in Labour’s first term may have liftedanother 100,000 to 200,000 children above the poverty line, by the end of 2001. But they alsohighlight factors with significant longer-term implications for the Government’s chances ofmeeting its targets:
• Although the measures taken in successive budgets have redistributed income in favour oflow-income families with children, pushing them towards the average, the average itself isa moving target. Over much of the past 20 years, earnings for higher income groups havetended to rise faster than earnings for poorer people in work, and faster than welfarebenefits. To reverse this, the government needs to ensure that benefits rise faster thanaverage incomes, and that tax credits for people in work rise fast enough to compensatefor any further decline in the relative earnings at the bottom end of the labour market.
• There appear to be problems with the take-up of Income Support and Working Families TaxCredit (WFTS). According to the 2000–01 Family Resources Survey only 62 per cent ofchildren below the poverty line are in households receiving either benefit. This suggeststhat as many as 1.5 million children in families defined as poor were living beyond thereach of the Government’s main instruments for tackling child poverty. The degree to whichthese numbers relate to families with genuinely low incomes, or to households whoseincomes had temporarily dipped at the time of the survey, is not clear. But in either case,they amount to a substantial barrier in the way of government reaching its targets ascurrently defined.
78 Tackling UK poverty and disadvantage in the twenty-first century
In relation to the Working Families Tax Credit and Children’s Tax Credit, the IFS analysissuggests that their impact on poverty has probably been less than expected because many ofthe households receiving them already had incomes above the poverty line. If Child Benefitincreases, paid to all parents with dependent children, are taken into account, then it is evenmore apparent how current policies are designed to help families with children in general aswell as those in poverty. All this can be justified in policy terms by a general desire torecognise the role and added costs of parenthood through the tax/benefit system18 and aspecific requirement to preserve work incentives as benefits for non-working parents increase.However, it is necessary to recognise that if more money is channelled through the new,integrated Child Tax Credit, not all of it will feed directly into poverty reduction.
Another reason for believing that the task the Government has set itself will become moredifficult over time is the straightforward observation that the children most easily raised abovethe 60 per cent of median income threshold are those whose family incomes are alreadyclosest to the line. In other words, as the Government moves closer to its target, the familiesleft below the line are likely to be those families in the deepest poverty, who are leastsusceptible to its welfare-to-work measures. In this context, it is important to recognise thatchild poverty is not only more widespread than 20 years ago, but also deeper – as evidencedby a disproportionate rise in the number of households with less than 40 per cent of averagenet income.19 The most recent HBAI figures show that out of 1.75 million children in poorfamilies with at least one parent in work, more than half were in households whose incomeswere £50 a week or more below the poverty line. There were also 750,000 children in non-working households whose net incomes were £50 a week below the 2000–2001 threshold.Around 300,000 were £100 a week below the poverty line.20
The genuine, though less than intended, progress made in reducing child poverty stillleaves some of the highest and seemingly most intractable levels of poverty in Europe. Itfollows that even if economic recession can be avoided and unemployment kept below amillion, the Government will need to redouble its efforts.21 While its chosen tools appear to bethe right ones, the balance between them may need to change. As previously noted, it is alsoapparent (from the Family Resources Survey) that more than a third (38 per cent) of familiesbelow the poverty threshold receive neither Income Support nor the Working Families TaxCredit. There are likely to be a number of reasons why this is so. These range from inclusion inthe survey of households whose income has only temporarily dipped to delays in processingbenefit claims, ignorance concerning entitlement and outright refusal to claim. Eachcontributing problem will demand a different policy response;22 making it imperative that theGovernment unravels the statistics as a matter of urgency.
Remedial action, including take-up campaigns and measures to improve administrativeefficiency, may be part of the answer. But the IFS report by Brewer, Clark and Goodman alsoimplies a need to re-examine the way that child poverty itself is measured. If ‘snapshot’surveys mean the poverty statistics misleadingly include significant numbers of families whoselow income is temporary, then it may be that additional measurements – such as ability toafford ‘necessities’ and length of time spent in poverty – would give a clearer impression ofprogress and the impact of particular policies.
Better information is essential if the right choices are to be made in future about thebalance between different policies. Paid work is currently seen as the best pathway out of
79Tackling UK poverty and disadvantage in the twenty-first century

poverty for those parents who are in a position to take advantage. Indeed, few children whoseparents are unemployed or economically inactive have moved out of poverty altogether in thepast five years – although there is some evidence that unemployed families have movednearer to the line.23 But short of compulsion – adopted by some American states at the price ofnegative or neutral income consequences for significant numbers of families24 – there will beparents who not only lack the basic skills and qualifications to obtain paid work, but alsomake a positive decision that their childcare responsibilities preclude it. Lifting these familiesout of poverty is, sooner or later, likely to require even greater emphasis on incomeredistribution and increases in tax credit and benefit levels. It also raises the question ofwhether the increased spending could be targeted more accurately to reach the poorestfamilies. The IFS report demonstrates how, in a perfectly targeted system, it would cost justunder one per cent of GDP to raise all households with dependent children above the currentpoverty line. However, that level of extra investment channelled through the new Child TaxCredit would, for reasons already referred to, only halve child poverty.
The Foundation’s own research programme has shown how low-income parents often gowithout themselves rather than see their children miss out on necessary items that mostfamilies take for granted.25 Even so, spending by the poorest fifth of the population on toys,children’s clothing, shoes and fresh fruit in the mid-1990s was no higher in real terms it hadbeen almost 30 years earlier.26 Demonstrable progress in raising the incomes of these, thepoorest, non-working families in the next few years would send a clear signal that theGovernment is committed to tackling poverty in its depth, as well as its breadth. Moregenerous benefits more closely targeted on the poorest non-working parents would inevitablyraise detailed issues concerning their relationship with ‘in-work’ benefits and erosion of‘welfare to work’ incentives. It is a nettle that, in time, will have to be grasped.
Links between poverty and social exclusionWhile action to remove child poverty can be justified as an end itself, low income is numberedas one among a whole range of important factors that influence children and young people’swell-being and life chances. The term ‘cycle of deprivation’, coined 30 years ago by theConservative politician Sir Keith Joseph, proved too determinist a description of the way thatpoverty and social disadvantage can be transmitted from one generation to the next.27 But thelinks between relative poverty and the risks that children will lead adult lives on the marginsof mainstream society – now referred to as ‘social exclusion’ – are well-established.28
According to the distinguished American academic and commentator, Lisbeth Schorr:
Poverty is the greatest risk factor of all. Family poverty is relentless correlated with highrates of school-age childbearing, school failure and violent crime – and with all theirantecedents. Low income is an important risk factor in itself, and so is relativepoverty…especially in a society that places a high value on economic success.29
Low family income in the UK is associated with less good outcomes in health andeducation, including the chances of leaving school at 16 and failure to obtain qualifications.30
It is also linked to adolescent and adult anti-social behaviour, with evidence suggesting that itsinfluence on children occurs indirectly through the stress placed on parents and other family
80 Tackling UK poverty and disadvantage in the twenty-first century

members. A Joseph Rowntree Foundation study by Gregg, Harkness and Machin,31 using thelongitudinal National Child Development Study, found that social disadvantage duringchildhood was correlated with an increased risk of low earnings, unemployment and otheradversity in young adulthood. Poverty was much the most important force among family-based measures linking childhood development with later social and economic problems.Turning to the next generation, the research found that parents in their early thirties who had,themselves, been disadvantaged as children were more likely than others to have children whowere performing poorly in school.
Risk and protective factors Action to reduce the extent and depth of family poverty in the next 20 years can, on theevidence available, be expected to produce positive effects for children and young people thatextend well beyond the boundaries of their economic well-being. It follows, however, thatthere is a broader task of tackling social disadvantage that demands wider action across theother main areas where children and young people are exposed to risk. The Government’sSocial Exclusion Unit has played an invaluable role in drawing the attention of other policymakers to the mosaic of links between poverty and an increased likelihood that problems willbe transmitted from one generation to the next. It has also reinforced the understanding thatthe multiple problems contributing to social exclusion can only be adequately answeredthrough multi-agency solutions. A number of Government initiatives have embraced thisessential premise for ‘joined-up’ policy making. The New Deal for Communities, for example,approaches area regeneration from a standpoint where local residents, schools and police canplay an important part alongside the agencies more conventionally concerned with arearenewal. Sure Start, the Government’s programme for children under four and their parents indisadvantaged neighbourhoods, aims to deliver comprehensive support services ranging fromantenatal support and parenting groups to day nurseries and training for parents planning areturn to work.
The Joseph Rowntree Foundation has supported an even more systematic approach totackling social exclusion – not least through its support for the Communities that Careinitiative in demonstration areas.32 This draws on longitudinal and other research to identifythe risk factors that are most likely to be implicated, directly or indirectly, in producing pooroutcomes for children and young people. The underpinning theory draws its strength from theway that low family income and other factors recur as risks for different problems experiencedby children and young people, such as lack of qualifications, school-age pregnancy, poormental health and problem drug and alcohol use, as well as criminal activity. The risks rangefrom ‘individual’ characteristics – such as hyperactivity disorders and anti-social attitudes – to‘community’ factors such as growing up in a disadvantaged run-down neighbourhood withhigh population turnover. School-related risks, like low academic achievement and disruptivebehaviour, figure prominently. Family factors, in addition to low income and poor housing,include conflict between parents, and poor parental supervision and discipline. This approachto tackling social disadvantage also recognises the important part played by protective factors,such as warm, affectionate family relationships, in explaining why some children exposed tomultiple risks remain resilient and do well in later life despite the odds stacked against them.According to this model – which has influenced the strategic framework adopted by policy
81Tackling UK poverty and disadvantage in the twenty-first century

makers in the Children and Young People’s Unit and elsewhere in government25 – the aim ofpolicy is that of enhancing the level of protection in children and young people’s lives whilereducing risks.34
Supporting familiesPolicy makers who apply the model of ‘risk and protection-focused prevention’ areacknowledging that targeting individual factors – even low family income – offers anincomplete answer to social exclusion. Action to raise standards in schools, improve access topaid work and regenerate disadvantaged neighbourhoods must also be part of the jigsaw forthe next 20 years, alongside support services provided for individual children in need and theirfamilies.35 Since housing, education and training are considered by other chapters, the focus forthe remainder of this paper is on the additional support that could help prevent socialexclusion among families in the next 20 years.
Public policy always steers a course between providing legitimate support for families intheir role of raising healthy, competent and confident children, and unjustified intervention inthe private sphere of people’s lives.36 The Labour Government’s consultation paper, SupportingFamilies, has stated that, except in extreme circumstances such as domestic violence or childabuse, its role should be to support parents in non-stigmatising ways, rather than attemptingto substitute for them. It has also declared that government’s primary policy interest should beto give the next generation the best possible start in life.37
While there has been continuing debate about the right balance between the public andprivate spheres, its hands-on application through Sure Start, the Children’s Fund and theChildren and Young People’s Unit has encountered little criticism. The Government’s fundingintentions are, by traditional standards, long-term and generous. Yet by 2021 these initiativescould be a distant memory, unless they are able to influence the way that mainstream servicesfor children and families are planned and provided. Even Sure Start, targeted to reach over400,000 children under four by 2004, will miss two-thirds of under fours being raised in poorhouseholds.
‘Mainstreaming’ issuesReaching more children at risk of exclusion is increasingly seen to depend on whethermainstream services – whose expenditure dwarfs the sums being invested in Sure Start andthe Children’s Fund – can be re-oriented to deliver similarly ‘joined-up’ services. This carriesimportant implications for central government funding and guidance, as well as the way thatlocal government and other agencies plan, budget and implement their services. TheGovernment has promised local authorities an enhanced role in organising delivery of servicesfor children and families, including the new Children’s Centres proposed to reach an extra300,000 children in the most disadvantaged wards. It is also creating a single, inter-departmental unit within Whitehall to deal with Sure Start, early years and childcare. Moreradically, the 2002 Comprehensive Spending Review commits the Government to piloting theconcept of Children’s Trusts, which will bring together all the agencies involved in providingservices for children. It looks to a future in which mainstream services adopt a commonframework for integrating the lesson from Sure Start and the other special initiatives into theirwork. Specifically, this would include:
82 Tackling UK poverty and disadvantage in the twenty-first century

• multi-disciplinary working on the basis of core learning and skills objectives across allstatutory and voluntary agencies;
• integrated service delivery and co-location of services to improve co-ordination, backed bycapital investment in shared premises.38
As statements of intent, the Spending Review proposals are welcome – as are specificinitiatives such as nine pilot exercises exploring how the Sure Start approach spread acrossmajor cities. Importantly, they leave the door open for central and local governmentpolicymakers to take ‘mainstreaming’ a step further by abandoning performance indicatorsrelating to service outputs in favour of a firm focus on actual, measurable results or‘outcomes’ that planners expect their services to achieve for children. A shift towards‘outcome-based’ planning would create a framework for budget pooling between departmentsand genuine, multi-agency service delivery. But it would also create welcome opportunities toinvolve children, young people and their parents in local decisions about strategy and theservices that are most likely to help them reach their goals.39
New directions in family policyIn addition to reform of the overall structure of service delivery, there are some specific areaswhere demographic and other trends suggest a need for new directions in policy for childrenand families. These concern:
• early parenthood
• relationship support
• work–life balance.
Early parenthoodBritain has the highest teenage birth rate in Western Europe. Unlike other European countries,it has also seen little decline in the rate during the past 20 years. This unenviable recordmatters not only because young mothers are particularly likely to come from disadvantagedbackgrounds and have few educational qualifications themselves, but also because theirchildren are more likely than others to be raised in poverty. As Kathleen Kiernan has pointedout in a paper for the Joseph Rowntree Foundation 2022 project,40 the general trend acrossBritain and Europe is for couples to start their families at older ages when they have improvedtheir position in terms of earnings, career options, housing and consumer goods. A wideninggap can be foreseen in the next 20 years between the life-chances of children raised indouble-income families begun by parents in their thirties and forties, and the children ofparents in their teens and early twenties – especially ‘solo’ mothers who are not living withtheir child’s father at the time of birth.
Longitudinal research findings suggest that investment in educational opportunities is atleast as necessary to discouraging early parenthood as reliable advice on contraception.41 It alsoendorses the current work of the Government’s Teenage Pregnancy Unit and the Sure Start Plusprogramme in ensuring that young parents-to-be have access to impartial advice whenconception is confirmed. If they choose to continue with the pregnancy, they should receivecomprehensive pre- and post-natal support. This approach chimes with the Foundation’s ownresearch findings in neighbourhoods where teenage pregnancy rates are high.42
83Tackling UK poverty and disadvantage in the twenty-first century
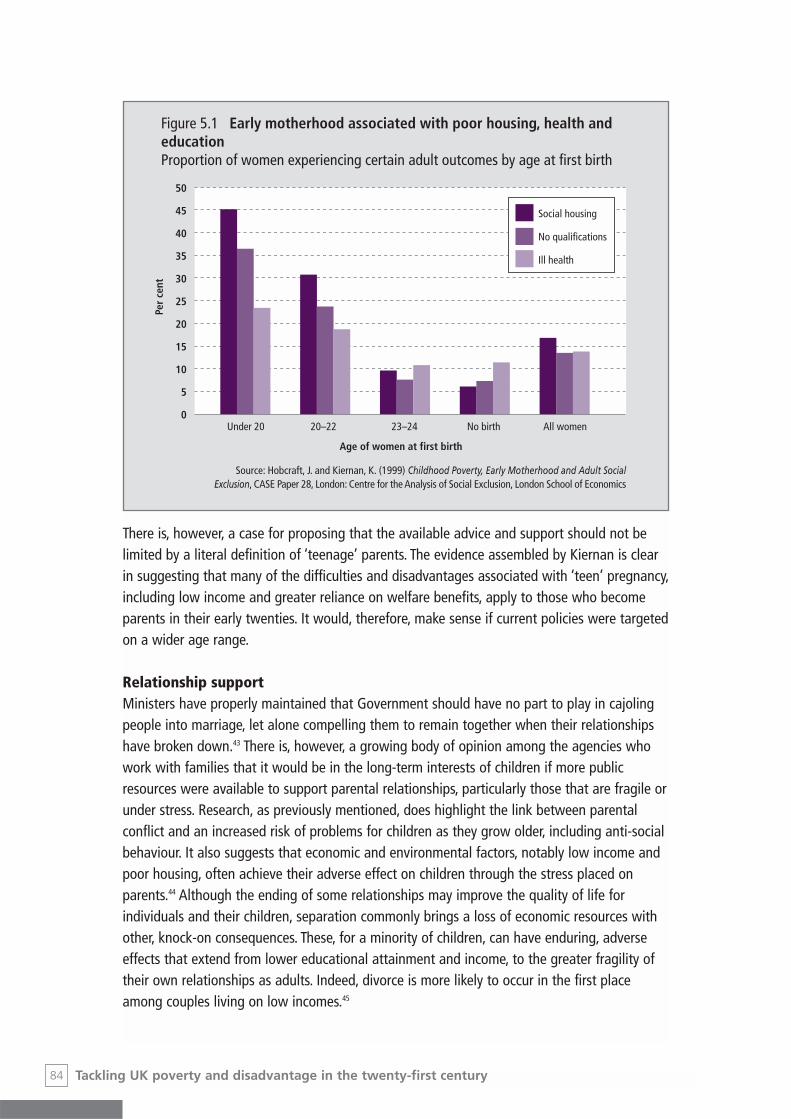
There is, however, a case for proposing that the available advice and support should not belimited by a literal definition of ‘teenage’ parents. The evidence assembled by Kiernan is clearin suggesting that many of the difficulties and disadvantages associated with ‘teen’ pregnancy,including low income and greater reliance on welfare benefits, apply to those who becomeparents in their early twenties. It would, therefore, make sense if current policies were targetedon a wider age range.
Relationship supportMinisters have properly maintained that Government should have no part to play in cajolingpeople into marriage, let alone compelling them to remain together when their relationshipshave broken down.43 There is, however, a growing body of opinion among the agencies whowork with families that it would be in the long-term interests of children if more publicresources were available to support parental relationships, particularly those that are fragile orunder stress. Research, as previously mentioned, does highlight the link between parentalconflict and an increased risk of problems for children as they grow older, including anti-socialbehaviour. It also suggests that economic and environmental factors, notably low income andpoor housing, often achieve their adverse effect on children through the stress placed onparents.44 Although the ending of some relationships may improve the quality of life forindividuals and their children, separation commonly brings a loss of economic resources withother, knock-on consequences. These, for a minority of children, can have enduring, adverseeffects that extend from lower educational attainment and income, to the greater fragility oftheir own relationships as adults. Indeed, divorce is more likely to occur in the first placeamong couples living on low incomes.45
84 Tackling UK poverty and disadvantage in the twenty-first century
Figure 5.1 Early motherhood associated with poor housing, health andeducationProportion of women experiencing certain adult outcomes by age at first birth
50
45
40
35
30
25
20
15
10
5
0
Per
cent
Under 20
Age of women at first birth
Source: Hobcraft, J. and Kiernan, K. (1999) Childhood Poverty, Early Motherhood and Adult SocialExclusion, CASE Paper 28, London: Centre for the Analysis of Social Exclusion, London School of Economics
20–22 23–24 No birth All women
Social housing
No qualifications
Ill health

Britain not only has one of the highest divorce rates in Europe, but also a marriage ratethat until 2001 was in steady decline. During discussions as part of this project, it has beenargued that the growing numbers of children that are born and raised outside marriage mustbe afforded greater policy recognition, given evidence that cohabiting relationships withchildren are more fragile than those of married couples. Kiernan’s paper for the project46
makes an important qualifying point that the comparative instability of cohabitation isprobably a ‘selection effect’. In other words, it is the stronger, more committed partnershipsthat tend to lead to marriages, a growing number of which now take place after childrenbecome part of the relationship. Even so, there is still a problem because the UK has higherrates than other European countries of relationship breakdown among cohabiting parents andamong parents who marry some time after the birth of a child.
Public policy cannot legislate for better personal relationships, but there is undoubtedlymore that could be done to make support available to couples at times of stress and to limitthe economic and other socially excluding effects of relationship breakdown on children.47 Andwhile a continuing high divorce rate demonstrates the limitations of relying on institutional orlegal structures to strengthen relationships, it would, be wrong to dismiss out of hand thepotential for preventing relationship breakdown by offering greater and more publicrecognition to unmarried unions. The concept of Civil Solidarity Pacts, introduced in France, isone of the options that merits further investigation for the UK, since there are signs that manyFrench parents who do not wish to marry welcome the rights, responsibilities and recognitionthat such a pact confers on their relationship.48
Experience gained from attempted reform of the divorce laws and implementation of theFamily Law Act 1996 highlights other opportunities, yet to be consistently applied, for makingtimely support available to couples whose relationships are in difficulties, especially parents.These include screening and counselling at well-known stress points, such as the months afterthe birth of a child, and training for GPs and other front-line professionals who are most likelyto be approached during the early stages of relationship problems.49 Another area forextending publicly-funded support would be counselling and mediation services designed tohelp parents, especially those who are separating, to manage the process in ways that areleast damaging to their children.50
Work–life balanceLow-income parents, especially lone parents, often face invidious choices between the need toimprove their economic situation through paid work, and their desire to spend time with theirchildren. In the language of ‘risk’ and ‘protection’, their efforts to minimise factors like lowincome and poor housing can come into conflict with their desire to strengthen the protectiveattachment between parent and child. Parents of pre-school children may, especially, feel thatthe quality of care that they can provide is an important contribution to their child’s earlydevelopment. Research reinforces the dilemma. For example, one Joseph Rowntree Foundationstudy has identified a trade-off between the potential benefits from avoiding poverty throughhigher family income, and evidence that children whose mothers had worked full-time forlonger periods when they were pre-schoolers were less likely to have gained A-levelqualifications.51 There has been no suggestion during discussions for this project that thechoice of whether to work, and for how long, should be anything other than a matter for
85Tackling UK poverty and disadvantage in the twenty-first century

parents. But while they alone must decide what seems right for their child (and themselves),their view will be influenced by factors such as their access to affordable, alternative childcare,and their confidence in its quality. The Government, judged by its intention to create 250,000more childcare places by 2006, is prepared to spend heavily in meeting its ‘welfare to work’objectives, and the aim of having seven out of ten lone parents in paid work by 2010. But ithas also, through above-inflation increases in the child allowances within Income Support,been investing on the other side of the equation by raising the incomes of non-workingparents. There is no great contradiction between these different arms of policy if the aim is topreserve parental choice while reducing poverty. The dominant emphasis is, for the present, onwelfare-to-work. Yet success in reducing poverty may, paradoxically, depend in the longer-termon policy makers making it easier for parents to spend more of the time they deem necessarywith their children.
The fact that most ‘dual-earner’ families consist of one parent working full-time and theother working part-time is itself evidence of the widespread demand for flexible, family-friendly employment arrangements. Likewise, the fact that most women returning to workafter maternity leave switch from full to part-time work.52 Meanwhile, there are significantlevels of dissatisfaction among UK fathers, whose average working hours are the longest inEurope. The Government’s own baseline study of work–life balance issues in the workplacehas found that men in couple households with dependent children are even more likely thanothers to work long hours. More than a third worked more than 49 hours a week and one ineight were working over 60 hours a week. While two out of three men feared that a switch topart-time working would damage their careers, it was apparent that fathers, especially,favoured greater flexibility, including opportunities to work from home.53
Working outside the 48-hour limit specified by the European Union’s Working Time Directiveis especially common among British men in professional and managerial positions. However, astudy of parents working ‘atypically’ outside the normal ‘9 to 5’ found that fathers from lowersocio-economic groups who worked at nights or weekends were especially likely to feel theyhad no choice.54 Other findings from the Foundation’s current Family and Work research seriesdemonstrate why issues concerning flexible working or ‘family-friendly employment’ are seldomstraightforward. For example, the Government’s work–life balance campaign aims to workthrough persuasion and partnership with employers, rather than edict. This places moreemphasis on establishing a business case for flexible working, alongside the social and ethicaljustifications. An analysis of the Workplace Employee Relations Survey has provided reinforcingevidence that employers who adopt family-friendly working policies tend to rate their financialperformance and productivity more highly than others.55 However, it is also clear that in manyworkplaces, flexible working options – where they exist – are limited to making part-timeworking available and, less often, flexitime.56 Moreover, the mere existence of flexible workingpolicies within an organisation is not sufficient to ensure that employees will find themaccessible or choose to make use of them. On the one hand, as family-friendly employmentpolices become more widely available, many parents who are in work will need increasingreassurance that reducing their hours or taking family leave will not cost them their careers. Onthe other, non-working parents may start demanding better evidence – especially if they haveyoung children and plan to work full-time – that making paid work their route out of poverty ismore likely to enhance than harm their child’s development.
86 Tackling UK poverty and disadvantage in the twenty-first century
Since reviewing work–life balance issues in a consultation paper in 200057 the Governmenthas announced enhancements in maternity leave and pay and, for the first time from April2003, a father’s right to two weeks’ paid paternity leave. Entitlement to unpaid parental leaveis being extended from 13 to 18 weeks in the first five years of a child’s life. As a furthermeasure, the recommendation of a Government task force is being implemented to placeemployers under a duty to consider requests from employees with children under 6 who wishto work flexibly.58
It would be premature to declare the Government’s largely voluntary approach to work–lifebalance has foundered. It is, however, a matter of record that UK entitlements to family leaveand other family-friendly arrangements lag behind those in a number of European states,where there is greater compulsion. This is especially true of the Nordic countries, whereparental- and family-leave provision is comparatively generous and family-friendly policieshave been viewed politically as an important contribution to the well-being of children.59 It isnot, therefore, unreasonable to propose that, while continuing to pursue its campaign, theBritish Government should embrace a more forthright and radical set of longer-term aims.These would include a right, as already exists in Germany and the Netherlands, for employeesto reduce or change their hours for family reasons unless there a compelling business case forrefusing them. Another desirable goal would be an extension of parental leave, part of whichshould be a paid entitlement to make it more accessible by low-wage earners. More rigorousenforcement of the EU Working Time Directive would also help low-paid parents, especiallyfathers who currently feel they have no choice but to accept long and unsocial working hours.
From alleviating poverty to eradicating it…for the children and parents living on a low income it matters little whether they are
called ‘poor’ or ‘relatively deprived’. What matters to them is that they are excluded fromfull participation in the world around them.60
On existing policies, the alleviation of child poverty and social exclusion has begun and – ifthey remain in place – is likely to continue. The reasons for this are broadly those set out in anoptimistic paper by Jonathan Bradshaw:61
• There will be fewer dependent children. The number of women of child-bearing age willdecline after 2010 and fertility rates are likely to continue below ‘replacement level’ for theUK population.
• The economy shows sustained signs of stability, with less likelihood of a return to the veryhigh levels of unemployment of the 1980s and early 1990s, which were the most importantforce creating poverty.
• The Labour Government, re-elected in 2001, has demonstrated an unprecedented degree ofpolitical commitment to tackling relative poverty affecting children.
In Bradshaw’s view, these factors are more than enough to outweigh the most obvious areawhere social trends might point to an increase in child poverty: namely, the continuing highrates of divorce and breakdown in cohabiting relationships between parents.
87Tackling UK poverty and disadvantage in the twenty-first century

Whether the Government is on course to meet its welcome, but hugely ambitious, target oferadicating child poverty in a generation is a very different question. The evidence concerningslower than expected progress so far, suggests that it will not be achieved without a re-doubling of the current effort. Although a better set of measures for family poverty mightmake the task in hand appear more manageable, a stronger commitment to incomeredistribution will still be needed, including willingness to raise benefit levels for those parentswho do not and cannot enter paid work.
Tackling poverty is only one, albeit important, contribution to the wider objective ofimproving children’s life chances and reducing the risks of social exclusion. Sure Start, theChildren’s Fund and other Government initiatives give holistic recognition to the multiple riskfactors that can cluster together in the lives of disadvantaged children, in their families,schools and communities. However, there is doubt whether social exclusion and itstransmission from one generation to the next can be tackled effectively in the next 20 yearsunless the principles of ‘joined-up’ action become embedded in mainstream support services.
In addition, there are trends and policy areas where greater attention from policy makersnow could be expected to contribute to a long-term diminution of social exclusion. The optionsinclude:
• Policies acknowledging that parents in their early twenties and their children would alsobenefit from the comprehensive support services now being made available to teenagers.
• Public investment in services that support parental relationships, possibly including thecreation of a new institutional and legal status for cohabiting couples with children.
• Stronger public recognition for the role of parents in raising the next generation, includinga statutory entitlement to flexible working arrangements and paid parental leave, matchingthe family-friendly policies in a number of other European states.
Notes1 Palmer, G., Rahman, M. and Kenway, P. (2002) Monitoring poverty and social exclusion 2002. York: Joseph Rowntree
Foundation.2 Office for National Statistics (2002) Households Below Average Income – 1994/5 to 2000/01. London: Department for
Work and Pensions.3 Bradbury, B. and Jantti, M. (1999) Child Poverty Across Industrialised Nations. Innocenti Occasional Papers, EPS 1971.
Florence: UNICEF.4 Joseph Rowntree Foundation (1995) Joseph Rowntree Foundation Inquiry into Income and Wealth Volume 1. York:
Joseph Rowntree Foundation.5 Speech by Rt Hon. Tony Blair MP, 18 March 1999 at Toynbee Hall, London.6 Piachaud, D. and Sutherland, H. (2000) How Effective is the British Government’s Attempt to Reduce Child Poverty?
CASE paper 38. London: Centre for Analysis of Social Exclusion, London School of Economics; and Sutherland, H. andPiachaud, D. (2001) ‘Reducing child poverty in Britain: an assessment of government policy 1997–2001’, EconomicJournal, 111 (469) F85–F101.
7 H.M. Treasury (2002) Opportunity and security for all. Investing in an enterprising, fairer Britain. New Public SpendingPlans 2003–2006, July 2002. London: The Stationery Office.
8 H.M. Treasury, Opportunity and Security.9 Hill, M.S. and Jenkins, S.P. (1999) Poverty Among British Children: Chronic or transitory? Colchester: Institute for
Social and Economic Research.10 Gordon, D., Adelman, L., Ashworth, K., Bradshaw, J., Levitas, R., Middleton, S., Pantazis, C., Patsios, D., Payne, S.,
Townsend, P. and Williams, J. (2000) Poverty and Social Exclusion in Britain. York: Joseph Rowntree Foundation/YPS.
88 Tackling UK poverty and disadvantage in the twenty-first century

11 See, for example, Kempson, E. (1996) Life on a Low Income. York: York Publishing Services/Joseph RowntreeFoundation; and Shropshire, J. and Middleton, S. (1999) Small Expectations: Learning to be poor. York: JosephRowntree Foundation/YPS.
12 Speech by Gordon Brown, Chancellor of the Exchequer, 13 December 2001, London13 H.M. Treasury (2002) Budget 2002. The Strength to Make Long-Term Decisions. Investing in an enterprising, fairer
Britain. Economic and Fiscal Strategy Report and Financial Statement and Budget Report April 2002. London: TheStationery Office.
14 Office for National Statistics, Households Below Average Income.15 See also Kenway, P. and Palmer. G. (2002) What do the Poverty Numbers Really Show?. NPI Policy Analysis Paper 3.
London: New Policy Institute.16 Piachaud, D. and Sutherland, H. (2002) Changing Poverty Post-1997. CASE paper 63. London: Centre for Analysis of
Social Exclusion, London School of Economics.17 Brewer, M., Clark, T. and Goodman, A. (2002) The Government’s Child Poverty Target: How much progress has been
made? London: Institute for Fiscal Studies.18 See Utting, D. (1995) Family and Parenthood. Supporting families, preventing breakdown. York: Joseph Rowntree
Foundation, for a description of how support for families through the tax/benefit system was progressively erodedover 30 years.
19 Palmer et al., Monitoring Poverty.20 Office for National Statistics, Households Below Average Income.21 Piachaud and Sutherland, Changing Poverty.22 Brewer et al., Government’s Child Poverty Target.23 Piachaud and Sutherland, Changing Poverty.24 Waldfogel, J.K., Danziger, S.K., Danziger, S. and Seefeldt, K. (2001) Welfare Reform and Lone Mothers’ Employment in
the US. CASE paper 47. London: Centre for Analysis of Social Exclusion, London School of Economics.25 Kempson, E. (1996) as above; and Middleton, S., Ashworth, K. and Braithwaite, I. (1997) Small Fortunes. Spending on
children, childhood poverty and parental sacrifice. York: Joseph Rowntree Foundation/YPS.26 Gregg, P., Harkness, S. and Machin, S. (1999) Child Development and Family Income. York: Joseph Rowntree
Foundation/YPS.27 Rutter, M. and Madge, N. (1976) Cycles of Disadvantage: A review of research. Studies in Deprivation and
Disadvantage No 1. London: Heinemann; and Rutter, M., Quinton, D. and Liddle, C. (1983) ‘Parenting in TwoGenerations: Looking backwards and looking forwards’ in Madge, N. (ed.) Families at Risk. Studies in Deprivation andDisadvantage No 8. London: Heinemann.
28 Bynner, J. (2001) ‘Childhood Risks and Protective Factors in Social Exclusion’, Children & Society, 15, 285–301.29 Schorr, L.B. (1988) Within Our Reach. Breaking the cycle of disadvantage, New York: Doubleday/Anchor.30 Bradshaw, J. (2001) Poverty: The Outcomes for Children, London: National Children’s Bureau; Ermisch, J., Francesconi,
M. and Pevalin, D.J. (2001) Outcomes for Children of Poverty. Department for Work and Pensions, Research Report no158. Leeds: Corporate Document Services.
31 Gregg et al., Child Development.32 See Communities that Care (1997) Communities that Care: A new kind of prevention programme, London:
Communities that Care; and France, A. and Crow, I. (2001) CTC – the Story so Far. An interim evaluation ofCommunities That Care, York: Joseph Rowntree Foundation/YPS.
33 Farrington, D.P. (2000) ‘Explaining and Preventing Crime: the globalization of knowledge’ Criminology, 38 (1), 1–24.34 Catalano, R.F. and Hawkins, J.D. (1996) ‘The Social Development Model: A theory of antisocial behavior’ in J.D.
Hawkins (ed.) Delinquency and Crime. Current theories. Cambridge: Cambridge University Press; and the NationalStrategy for Neighbourhood Renewal (2000) Report of Policy Action Team 12: Young people. London: The StationeryOffice.
35 Social Exclusion Unit (2001) Preventing Social Exclusion. Report by the Social Exclusion Unit. London: Social ExclusionUnit.
36 Utting, D. and Pugh G., ‘The social context of parenting’ in Hoghughi, M. and Long, N. (eds.) The Handbook ofParenting. London: Sage Publications (in press).
37 Home Office (1998) Supporting Families. A consultation document. London: The Stationery Office.38 H.M. Treasury, Opportunity and Security.39 Utting, D., Rose, W. and Pugh, G. (2001) Better Results for Children and Families. Involving communities in planning
outcome-based services for children and families. London: UK Initiative/Association of Directors of Social
89Tackling UK poverty and disadvantage in the twenty-first century
Services/National Association of Voluntary Child Care Organisations.40 Kiernan, K. (2003) Disadvantaged Family Futures. Paper for the Joseph Rowntree Foundation Tackling Disadvantage
project. (See appendix).41 Kiernan, Disadvantaged Family Futures.42 Burghes, L. with Brown, M. (1995) Single Lone Mothers: Problems, prospects and policies. London: Family Policy
Studies Centre/ Joseph Rowntree Foundation; Tabberer, S., Hall, C., Webster, A. and Prendergast, S. (2000) TeenagePregnancy and Choice: Abortion or motherhood: influences on the decision. York: Joseph Rowntree Foundation/YPS.
43 Straw, J. (1998) ‘Introduction by the Home Secretary’ in Supporting Families. A consultation document. London: TheStationery Office.
44 Farrington ‘Explaining and Prevnting Crime’ as above; Rutter, M., Giller, H. and Hagell, A. (1998) Antisocial Behaviourby Young People. Cambridge: Cambridge University Press; and Anderson, B., Beinast, S., Farrington, D.P., Langman, J.,Sturgis, P. and Utting, D. (2001) Risk and Protective Factors Associated with Youth Crime and Effective Interventions toPrevent it, London: Youth Justice Board.
45 Rodgers, B. and Pryor, J. (1998) Divorce and separation. The outcomes for children. York: Joseph RowntreeFoundation.
46 Kiernan, Disadvantaged Family Futures.47 See , for example, Hawthorne, J., Jessop, J., Pryor, J. and Richards, M. (2003) Supporting Children Through Family
Change. York: Joseph Rowntree Foundation/YPS.48 Kiernan, Disadvantaged Family Futures.49 Mansfield, P. (2001) Support for relationships between adults and adults and their children – its importance and the
barriers that prevent it happening. Paper given to a JRF seminar on Relationship support for adults and their children,24 April 2001.
50 Walker, J. (ed.) (2001) Information Meetings and Associated Provisions within the Family Law Act 1996. FinalEvaluation Report. London: Lord Chancellor’s Department; Walker, J.J. and McCarthy, P. (2001) Marriage SupportServices and Divorce: A contradiction in terms? Paper given to a JRF seminar on Relationship support for adults andtheir children, 24 April 2001.
51 Ermisch, J. and Francesconi, M. (2001) The Effects of Parents’ Employment on Children’s Lives. York: Joseph RowntreeFoundation/YPS.
52 Hogarth, T., Hasluck, C. and Pierre, G. with Winterbotham, M. and Vivian, D. (2000) Work–Life Balance 2000. Baselinestudy of work-life balance practices in Great Britain. London: Department for Education and Employment.
53 Hogarth, et al., Work–Life Balance 2000.54 La Valle, I., Arthur, S., Millward, C. and Scott, J. with Clayden, M. (2002) Happy Families? Atypical work and its
influence on family life. Bristol: The Policy Press/ Joseph Rowntree Foundation.55 Dex, S. and Smith, C. (2002) The Nature and Pattern of Family-Friendly Employment. Bristol: The Policy Press/Joseph
Rowntree Foundation.56 Dex, S. and Smith, C., The Nature; Dex, S. and Scheibl, F. (2002) SMEs and Flexible Working Arrangements. Bristol: The
Policy Press/Joseph Rowntree Foundation.57 Department for Education and Employment/Scotland Office/The National Assembly for Wales (2000) Work Life
Balance. Changing Patterns in a Changing World. A discussion document. London: Department for Education andEmployment.
58 Work and Parents Task Force (2001) About Time: Flexible working. London: Department of Trade and Industry.59 Evans, J.M. (2001) Firms’ Contribution to the Reconciliation Between Work and Family Life. Labour Market and Social
Policy Occasional Papers No 48. Paris: OECD.60 Middleton, S. and Walker, R. (1994) ‘Conclusion: the reality of childhood poverty in Britain’ in Middleton, S.,
Ashworth, K. and Walker, R. (eds), Family Fortunes. Pressures on parents and children in the 1990s. London: ChildPoverty Action Group.
61 Bradshaw, J. (2000) ‘Prospects for Poverty in Britain in the First Twenty-Five Years of the Next Century’. Sociology, 34(1), 53–70.
90 Tackling UK poverty and disadvantage in the twenty-first century

91Tackling UK poverty and disadvantage in the twenty-first century
The considerable variation between areas in the depth and breadth of poverty anddisadvantage has been a significant issue within recent policy discussions. Much of the focushas been directed at the urban level or lower, with considerable attention being paid toproblems occurring at the neighbourhood and local level. In recent years, substantial resourceshave been targeted towards neighbourhoods and local authorities perceived as being in need.The array of area-based programmes introduced in recent years has encompassed a verybroad range of issues, including health, education, community development, housing,transport, crime, job-search, and employment training.
Alongside this, there has been increasing emphasis placed on the need to develop andimplement public policy at the regional level. The introduction of the Regional DevelopmentAgencies and White Paper on Regional Governance, alongside the more substantial devolutionthat has taken place to Scotland, Wales, Northern Ireland and London, are the most obviousoutcomes of this. Different aims appear to be converging here: a belief in devolution as ademocratic principle and a conviction that it is important to create effective strategies forareas that approximate to ‘regional economies’. The focus of the new regional approach –especially within the English regions, has not at present embraced the importance of tacklingpoverty and disadvantage.
But the dominant causes of poverty do differ between the regions and, in particular, thereis a significant divide between the South (essentially London, South-east and Eastern Regions)and the North (more or less the rest of the UK).1 Area-based policy will face an uphill struggleto make significant inroads into tackling poverty and concentrated deprivation at theneighbourhood level if regional issues of economic development are not also tackled.
In this paper we examine the nature of the divide between the South and North. Wediscuss some of the factors that have led to this position, and how they may impact uponpoverty and disadvantage in the future. We conclude that narrowing the gap between regionsof the UK over the next 20 years is an important policy objective in tackling disadvantage.
In broad terms there are three main reasons why, from the perspective of reducingdisadvantage, it is important to tackle the regional divide.
1 In London and the South-east there is a crisis in housing. There are booming numbers offamilies in temporary accommodation, major problems in housing key public-sector workersand a growing but at present largely hidden problem of overcrowding. By contrast, in manyparts of the North population densities are very low – unsustainably so in many places –and therefore unable to support adequate public and private services. There are manyempty homes and in the worst hit areas neighbourhoods have been virtually abandoned.2
6 Tackling disadvantage:Place
A persistent regional divideJason Strelitz and David Darton
▲ 10
▲ 58

2 Throughout the North there are large poverty clusters – places where deprived areas lienext to each other. As one researcher argues:
Clusters of poverty matter because all the disadvantages associated with poverty are moreconcentrated and more extensive, therefore escape becomes more difficult. Large povertyclusters within cities often have a long history and attract powerful stigma, making themhard to change. They work to limit people’s chances in many ways.3
3 The factors that have driven regional disparities in differential wealth generation andemployment creation have yet to run their course. The consequence is that withoutsignificant policy intervention, the inequalities between regions are likely to become widerover the next 20 years.4 As economic restructuring continues, strong regions will build ontheir existing comparative advantages while weaker regions continue to suffer. Recognisingthese structural inequalities, does not imply that regional development should be treatedas a zero-sum game. For example, jeopardising London’s global position would be highlydetrimental to the country as a whole. However, there are areas where such recognitionand policy emphases are important.
The regional divideThere are without doubt major problems of poverty and disadvantage throughout all regionsof the UK.5 However, whilst the southern regions are characterised by a problem with wealthdistribution, the North has a fundamental lack of wealth generation.6 This is highlighted byFigure 6.2, which shows that of the UK’s twelve regions only London and the South-east haveGDP per capita significantly above the EU average.7
92 Tackling UK poverty and disadvantage in the twenty-first century
Figure 6.1 Regional poverty clustersPercentage of region’s population living in one of 10 per cent most deprived localauthorities in England
60
50
40
30
20
10
0
Per
cent
livi
ng in
one
of t
he 1
0% m
ost
depr
ived
loca
l aut
hori
ties
in E
ngla
nd, b
y re
gion
Region
Source: DETR Index of Multiple Deprivation (2003)<http://www.urban.odpm.gov.uk/research/id2000/> Accessed 23 January 2003
NorthEast
NorthWest
Yorkshireand theHumber
WestMidlands
London EastMidlands
Eastern SouthEast
SouthWest

Figure 6.3 demonstrates the problem further. If incomes were spread equally across theregions then each column would be 20 per cent – with one-fifth of each region’s population inboth the bottom and top quintiles of the income distribution. However, the East, South-eastand London have a greater proportion of their population in the top than the bottom quintile,whilst for the other regions the opposite is true. In some cases the difference between thecolumns is extreme. (The figure takes the after housing costs measure; with the before housingcosts measure, the regional disparities are much more extreme.)8
In more affluent regions, many people have not benefited from economic growth of recentyears and there is a polarisation of incomes and opportunities. London contains the mostextreme examples of this polarisation. A recent report showed that over half of children withininner London are living in households with incomes below 60 per cent median.9 However, theeconomy in the South does generate sufficient wealth and employment for the situation to beturned around if tackling disadvantage is prioritised. The sorts of the measures that may formpart of this strategy are the subject of most of this report. This paper is more concerned withthose areas where overall demand is low.
For example, whilst work is being generated and new businesses formed, supply-sidelabour policies are able to help people successfully access the labour market. However, inplaces without sufficient jobs this is not true. Evidence from the New Deal for Young People isindicative of this. Whilst overall it has had some success, there has been a wide divergence ofimpact across different places.10 There have been disparities not just in the ability to place NewDeal clients in work, but in the quality and longevity of the employment. In relatively buoyantlabour markets the New Deal has often come up against a hard-core of hard-to-employ youngpeople (albeit at times within dense pockets). The research therefore suggests that moreradically targeted policies are needed to help these people access work.11 In more depressedlabour markets, however, the New Deal has struggled to find decent work for many of themore ‘employable’ – the jobs are just not there.
93Tackling UK poverty and disadvantage in the twenty-first century
Figure 6.2 UK regions vary in wealth from well above to well below the EUaverage
250
200
150
100
50
0
GD
P pe
r ca
pita
(Ind
ex: E
U a
v=10
0)
Europe’s regions
Source: Office for National Statistics (2001) Regional Trends 2001, London: The Stationery Office
Brussells, Belgium
Northern Ireland
Acores, PortugalNorth East
Wales
Yorks & Humber
LondonSouth East
EastScotland
East Midlands
West Midlands
North West
South West
EU average

When considering poverty and disadvantage, employment opportunities – as discussedthroughout this report – are key. Moreover it is access to well-paid, permanent, full-time andsecure employment that truly helps propel people out of sustained poverty. However, on allthese aspects there is a significant regional divide. Despite some narrowing in recent years,there is a persistent difference in levels of unemployment between the regions.
This only begins to tell the whole story. It is employment rates, indicating the overall levelsof economic activity, where there is a more serious divide that has remained stubbornlyconsistent, even during the recent period of healthy economic growth. In lagging regions, notonly are there more people ‘actively seeking work’ but there are many more who havedropped out of the labour market altogether.
During the period 1995–2001 employment in London and the South-east grew by 16 percent and 13.9 per cent respectively; in Scotland, Yorkshire and the Humber and the North-east,over the same period, employment grew by 0.5 per cent, 0.9 per cent and 1 per cent.Moreover, in those weaker regions there was an actual loss of full-time male employment.12
Key trends The regional divisions have not always been this way. There was a time when towns and citiessuch as Bradford, Sheffield and Sunderland were wealthier, and flourishing on the back ofthriving heavy industry. However, throughout much of this century the key international role ofsuch places within manufacturing industry and trade has steadily declined. In many places thework in these manufacturing industries has largely disappeared. Where such work remains itoften hangs on a knife-edge, frequently a branch plant of major multinational corporations,with thousands of jobs able to be lost with one announcement.
94 Tackling UK poverty and disadvantage in the twenty-first century
Figure 6.3 High and low incomes in the regions
35
30
25
20
15
10
5
0
Per
cent
Region
Source: Department for Works and Pensions (2002) Households Below Average Income–1994/5 to 2000/01,London: The Stationery Office
Sout
h Ea
st
Lond
on
East
ern
East
Mid
land
s
Nor
th W
est
and
Mer
seys
ide
Sout
h W
est
Scot
land
Wes
t Mid
land
s
York
shire
and
the
Hum
ber
Wal
es
Nor
th E
ast
Top quintile
Bottom quintile
The UK’s long-term shift from a manufacturing to a service economy is long-standing andcontinuing.13 In the country as a whole, lost manufacturing jobs have been sufficiently replacedby those in the service sector. However, the location of the new work – and especially thebetter-paid work – has generally not been in many of those places that suffered greatly fromthe loss of manufacturing industry. Those places reliant on one specific industry have sufferedthe most.
Building on existing advantages, such as being a centre of tourism, the seat of centralgovernment and one of the capitals of the world’s financial markets, London has successfullydeveloped into a centre of the new service industries. Alongside this, the South-east, East and,to a lesser extent, the East Midlands have been beneficiaries of the changing economic context.
It’s all about people now: the location of employmentDecisions on where to locate employment are increasingly dominated by where clusters offirms and people offer either prosperous markets and skilled employees, or low costs and largenumbers of relatively low-skilled people. Relatively little employment now needs to be locatednear raw materials, and continuing reductions in transaction and transport costs as technologyadvances reduce the need for industries to be near ports. It’s all about where the right people are.
The need to locate near prosperous markets will become even more compelling for many ofthe new service industries over the next 20 years. In many places a virtuous cycle, wherebybusinesses set up where there is a ready market and more customers are attracted becausethere are lots of suppliers offering a wide choice, will continue to develop. At the most locallevel such processes are visible often on a daily basis in gentrifying areas, where rates of leisureand retail outlets often multiply exponentially over a short period of time. Across larger areasthe same process occurs with big business, whether it be legal firms or biotechnology industries
Consequently, it has become increasingly compelling for employment to becomeconcentrated in particular areas. Whilst their salience should not be overstated, the ‘neweconomy’ industries are illustrative. The ideas being exchanged are increasingly complex orsubtle. Beyond the increased trends for certain generic skills (discussed in Chapter 4) aparallel, if seemingly contradictory trend to specialisation has emerged.14 For example, in thepast there were many accountants and they were largely interchangeable. Today, aprogrammer with experience of particular software and database management is part of amuch smaller occupational group. Just as academics have always congregated in universities,software programmers or option traders want to work in a community of peers. It is in theinterests of these people and the firms that employ them to cluster together. This enablesinformal networking and communication between different but independent specialists, butalso creates possibilities for firms to recruit and employees to change jobs without theupheaval of moving long distances.
The employment strategies of many financial services firms offer a good example of theincreasing inequality that is likely to develop between places. They will pay an extremely highprice for some key workers to be present at the heart of the flow of information (e.g. in theCity of London). At the same time, low-skilled, low-paid employment in their call centres isbased in other less affluent locations.15
95Tackling UK poverty and disadvantage in the twenty-first century

Figure 6.4 highlights how the occupational structure of the labour market is very differentacross the regions. Whilst all regions have fairly similar proportions – between 35 and 40 percent working in middle-earning jobs – the proportions in low-paid and high-paid work arevery different. In London, nearly 50 per cent more of the population is employed inprofessional, managerial and technical occupations than in the North-east; conversely in theNorth-east there are well over 60 per cent more doing traditionally less-skilled work.
There is a danger that in 2022, more places will be dominated by low-paid, low-qualityjobs in a cycle that will be difficult to escape from. However, not only will high proportions ofthe work be low paid, but the lack of high-skill, high-wage – i.e. high productivity work thatdrives much of the service economy – will result in a continuing shortage of employment.
It was widely held amongst economists and policy makers that regional economies withinone country should converge over time.16 The fact that this has not occurred in the UK, or inmost other European countries, indicates that it is unlikely to occur simply as a result ofmarket forces. As we have discussed, the forces towards geographic concentration of affluenceand poverty are strong. To differing degrees, the key factors that feed into high productivity,and therefore economic growth, are all differentially distributed throughout the regions.17
SkillsHuman capital is vital in creating a high-skill, high-wage economy to drive a virtuous cycle ofgrowth (see Chapter 4). Yet most lagging regions suffer on multiple fronts in relation to skills.The current working-age population of such places are often more poorly qualified. Waiting forthe present working population to retire will not be enough, as two key trends point towardsa persistent and ongoing problem. Firstly, there is continuing propensity for more educatedpeople to leave these regions. In London, the South-east and East, there are more graduates
96 Tackling UK poverty and disadvantage in the twenty-first century
Figure 6.4 The occupational structure of regional labour markets
50
45
40
35
30
25
20
15
10
5
0
Per
cent
in o
ccup
atio
n
Region
NorthEast
NorthWest
Yorkshireand theHumber
WestMidlands
LondonEastMidlands
Eastern SouthEast
SouthWest
Higher skilled
Lower skilled
Source: Labour Force Survey (Via NOMIS), <http://www.nomisweb.co.uk> Accessed November 2002.Site moved January 2003 to <http://parus.dur.ac.uk/>
Note: The classifications shown here exclude middle-level jobs. In all regions the proportions in these aresimilar, at around 35–40%.
working than studied there. In every other region the reverse is true, indicating a substantial‘brain-drain’.18 Furthermore, those three strong regions have the highest number of 17-year-olds participating in full-time education, and substantially more than all other English regionsexcept for the South-west.19
Investment and innovationNew investment is a starting point for economic growth. Such investment can come fromwithin Britain or overseas, from the private or public sector. On all counts London and theSouth-east are favoured by investment decisions. Britain has been very successful at garneringinternationally mobile investment capital; it makes the news when such investment createsjobs in depressed regions, yet by far the largest proportions come to the regions in the Southand this has been increasing. The public sector is also a hugely important part of inwardinvestment toward regions in the UK. In the UK’s more depressed areas public sectorinvestment plays a hugely significant role in the local economy.20
Enterprise and competitionOf the 20 local authorities with the highest rates of business formation, all bar two are in theSouth. Conversely the 20 with lowest rates are all found in Wales, Scotland, the North-West,the North-east and the South-west. This pattern is replicated across the regions. In recent yearssome of the worst effected regions have seen net business closures, even during this period ofeconomic growth.21 This is a sign both of the current difference between the regions and amajor signal for future concern. The lack of enterprise is a product of lack of resources andlack of confidence – however all these feed long-term into a lack of enterprise culture. Withoutnew business formation, there is a lack of competition, and in turn less drive for increasedproductivity, for investment in research and development and for continued education andtraining of the workforce.22
That serious inequalities exist alongside trends which point to those inequalities wideningover the next 20 years suggests that action needs to be taken. Indeed, the most recentprojections by Cambridge Econometrics do suggest that, along with London, the South-eastand Eastern Regions, only Northern Ireland of the UK’s countries and regions will haveemployment growth above the UK average over the period to 2015.
Policy goals for addressing the divide
…there is a broad consensus in the academic literature that government policy is a keydeterminant of the growth performance of poor regions and can make a differencebetween stagnation and success.23
The Treasury and the Department of Trade and Industry believe that the Government can havea key impact on growth in lagging regions. A range of possible interventions have beendebated at length within the academic literature. These suggest some policy directions forregional development, which we consider below.
In the strong regions, particularly London and the South-east, there are severe problemsrelated to the distribution of wealth, including a housing problem that will ultimately impact
97Tackling UK poverty and disadvantage in the twenty-first century

on all people, especially the most disadvantaged (see Chapter 8). Furthermore, the continuingstrength of some regions of the UK makes it harder for weaker regions to fulfil their potential.The ever-present carrot of the London and South-east labour markets for graduates is a primeexample of this.
A regional policy that strongly favours growth in lagging regions will therefore benefit allregions by taking some pressure off the South, as well as contributing to employment andwealth-creation in the North. The argument that the distant relationship between people indifferent regions makes ‘regional redistribution’ a tough political argument to win is no reasonfor not making this case strongly, and introducing policies accordingly. In this report we areconcerned with tackling poverty and disadvantage, and from this perspective such a regionalpolicy is clearly important. However, the potential contribution of regional development tonational wealth generation, environmental sustainability and alleviating some of the housingpressures on London and the South-east should not be under-stated.
Strategies and potential interventionsPotential interventions need to satisfy certain criteria: they need to relate to productivity anddriving economic growth, they need to be within the scope of Government capability, both interms of feasibility (political and economic) and legality (given European competition laws),and they need to address those areas where there are regional disparities.
Here we consider four policy areas that have emerged from our consultations:
1 targeting private investment2 the impact of public spending3 core cities and the urban renaissance4 bottom up: civil society, and local governance.
Improvements in human capital are also, of course, fundamental to the task of regionaldevelopment. This is partly a role for education, dealt with elsewhere in the report. However,all of these policy areas have a role to play in encouraging both those with skills to stay incurrently lagging regions and, over time, persuading others to see moving into those regionsas a realistic and positive option. Moreover, building realistic expectations of the possiblerewards that education can bring, can contribute to the development of more vibrant regionallearning and skills culture.
Targeting private investment One of the most traditional tools of regional development has been the use of fiscal measuresto help attract private investment. There are a variety of means available to Government, suchas tax incentives – including preferential tax rates and capital allowances – and financialincentives, for instance, government grants and subsidies. These include Regional SelectiveAssistance and the EU-allocated Structural Funds, loan guarantees and shared risk-equityparticipation. There are also non-financial incentives, such as subsidised infrastructure andpreferential Government contracts.
The main questions surrounding such policies are: how effective are they? How much‘deadweight’ cost is incurred – subsidising investment that would have taken place anyway?What is the cost per job and is that acceptable?
98 Tackling UK poverty and disadvantage in the twenty-first century
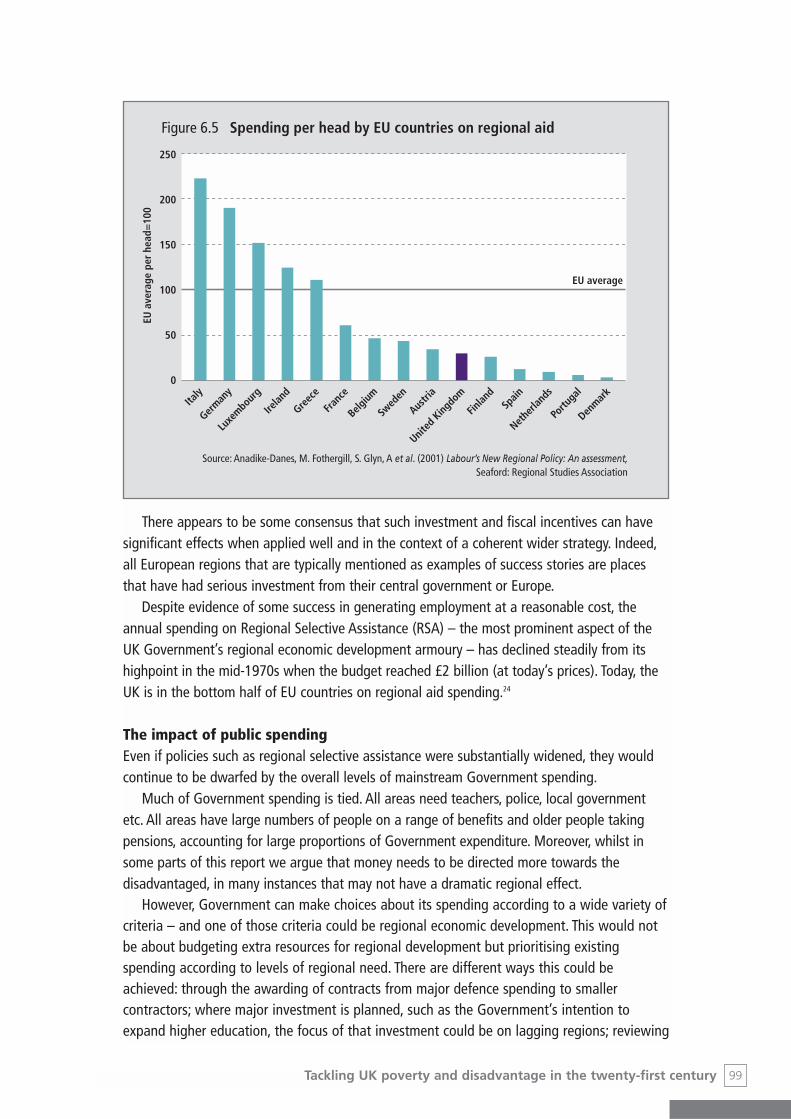
There appears to be some consensus that such investment and fiscal incentives can havesignificant effects when applied well and in the context of a coherent wider strategy. Indeed,all European regions that are typically mentioned as examples of success stories are placesthat have had serious investment from their central government or Europe.
Despite evidence of some success in generating employment at a reasonable cost, theannual spending on Regional Selective Assistance (RSA) – the most prominent aspect of theUK Government’s regional economic development armoury – has declined steadily from itshighpoint in the mid-1970s when the budget reached £2 billion (at today’s prices). Today, theUK is in the bottom half of EU countries on regional aid spending.24
The impact of public spendingEven if policies such as regional selective assistance were substantially widened, they wouldcontinue to be dwarfed by the overall levels of mainstream Government spending.
Much of Government spending is tied. All areas need teachers, police, local governmentetc. All areas have large numbers of people on a range of benefits and older people takingpensions, accounting for large proportions of Government expenditure. Moreover, whilst insome parts of this report we argue that money needs to be directed more towards thedisadvantaged, in many instances that may not have a dramatic regional effect.
However, Government can make choices about its spending according to a wide variety ofcriteria – and one of those criteria could be regional economic development. This would notbe about budgeting extra resources for regional development but prioritising existingspending according to levels of regional need. There are different ways this could beachieved: through the awarding of contracts from major defence spending to smallercontractors; where major investment is planned, such as the Government’s intention toexpand higher education, the focus of that investment could be on lagging regions; reviewing
99Tackling UK poverty and disadvantage in the twenty-first century
Figure 6.5 Spending per head by EU countries on regional aid
250
200
150
100
50
0
Italy
Source: Anadike-Danes, M. Fothergill, S. Glyn, A et al. (2001) Labour’s New Regional Policy: An assessment,Seaford: Regional Studies Association
German
y
Luxe
mbour
g
Irelan
d
Greec
e
Franc
e
Belgium
Swed
en
Austri
a
United
Kingdo
m
Finlan
dSp
ain
Nethe
rland
s
Portu
gal
Denmar
k
EU average
EU a
vera
ge p
er h
ead=
100
the location of existing civil service offices, and relocating where possible (see below). This isnot suggesting that regional economic development becomes the prime aim in the wayGovernment spends money, but that in judging value for money, this is one factor that couldcontribute to a judgement of value.
Indeed, when public-sector relocation out of London was initially introduced following theFlemming Report in 1963, saving money was the primary driver. Originally, most dispersal wasfrom London to the South-east. In time, full regional dispersal with the objective of spreadinggood quality jobs became one of the aims. This policy had a positive effect, creating good,skilled employment, not related to the economic cycle, in areas where such work wasgenerally lacking.25 There is evidence that the new employment had positive multiplier effectsgenerating private sector activity. This would not be unexpected after bringing substantial newinvestment into an area.
The Urban Renaissance AgendaThe role that major regional capitals can take in leading regional economic revivals isbecoming an increasingly important debate. The Urban Renaissance Agenda has emerged inrecent years out of the Urban Taskforce report and subsequent publication of an Urban WhitePaper.26 This sets out a vision for Britain’s towns and cities, drawn more on the experience andphilosophy of European cities, such as Barcelona and Amsterdam, than from the Britishexperience. Economic development is not the sole focus of this agenda; the quality of theurban fabric for all, the environmental consequences of suburban sprawl, residential densitiesand consumption, and a sustainable approach to meeting the country’s long-term housingrequirements are all central elements.
Building on this has been the establishment of the Core Cities Group, bringing togetherBirmingham (West Midlands), Nottingham (East Midlands), Bristol (South-west) Leeds andSheffield (Yorkshire and the Humber), Liverpool and Manchester (North-west) and Newcastle(North-east). These cities are keen to assert their key role as potential regional hubs.
There is evidence that these cities have begun to turn the corner, with people returning tocity living and increases in the amount of total employment.27 Large cities such as these, witha critical mass of people able to support a wide variety of cultural and leisure activities, aswell business and public services, have great potential to attract highly skilled workers andinward private investment. However, a great deal of investment as well as strategic planning ispivotal to achieving the necessary development. Leeds is a good example of the dangers.Although it has developed rapidly in recent years, it contains many pockets of extremedeprivation, and the spill-over of growing prosperity into neighbouring places, such asBradford, has been limited. If this strategy is to be pursued it must be done in a way that:
• Takes into account regional needs and does not assume a trickle-out process will occurfrom any improvement to the major cities. Linkages are key here – both physical, in termsof a transport infrastructure that matches a notional sense of regional hub and in respectof governance, where the connections between the hub and outlying areas are asimportant as the hub itself.
• Development occurs in a way that does not just lead to more affluent cities that have greatpolarisation within them – replicating the problems of London. This means sensitivity in thedevelopment of housing that seeks to create mixed income and age communities, and a
100 Tackling UK poverty and disadvantage in the twenty-first century
commitment to the service needs of all. Furthermore, it requires significant input in trainingand education for the least skilled to help them access new jobs as they are created.
Housing marketsOne area currently garnering particular attention is the issue of housing markets and, especially,the low demand for housing found in many urban areas especially in the north of England. ‘Lowdemand’ areas are characterised by extreme difficulties in letting some social rented stock, andhigh void levels, a growth in private renting, and static or falling prices in the private sector. Inthe worst cases, significant concentrations of abandoned dwellings are found.
Low demand may be linked to poor physical conditions, but the causes go much wider.Long-term out-migration and decentralisation of population in response to employmentdecline and other factors are the root causes of the problem. However, these trends arecompounded by the poor image and stigmatisation of much social housing, the poor quality ofthe physical and social environment, and amenities, such as schools, associated with manyestates. The unpopularity of certain property types, such as medium- and high-rise flats or, inthe private sector, some smaller pre-1919 terraced houses, the increasing availability of short-term alternatives, such as private rented housing, or the longer-term solution of low-cost new-build housing for owner occupation, also feed into this.
In the social rented sector, flexibility in letting housing, better neighbourhood management,targeted investment in dwelling improvements, and broader-based social and economicregeneration initiatives have had an impact in some areas. More realistic business planning inthe social rented sector is also leading to rationalisation through demolition, and todiversification of tenure mix through redevelopment. In the private sector, problems are moreintractable, because of low equity levels caused by falling property values, the fragmentationof ownership and the inability or unwillingness of owners to invest.
In some areas, such as inner Manchester and Liverpool, studies have concluded that thescale of problems goes beyond what can be achieved through current regeneration or housinginvestment programmes.28 Unless there is large-scale renewal of housing, and the physical andsocial infrastructure of these areas, economic regeneration alone may simply generate inwardcommuting, rather than save or create local communities.
Regional and sub-regional planning frameworks need to play a part by ensuring that newinvestment in economic development, housing, transport and the social infrastructure is notdiverted into other localities. Appropriate vehicles and implementation tools for securing theseobjectives also need urgent development. As well as serving as channels for significant inputsof public resources new vehicles, such as regeneration companies, need to be capable ofoperating across whole housing markets at a sub-regional scale. They need the ability to raiseprivate finance and secure private investment, acquiring and demolishing obsolete property,assembling land, securing redevelopment, guaranteeing loans and, most importantly, workingwith partnerships of existing agencies, such as local authorities and RSLs to secure theirobjectives. Within this context it will be interesting to observe how the Government’s plannedinvestment in a housing market renewal fund is delivered.29
Bottom up: civil society and local governanceRegions are administrative constructions. They are neither discrete labour markets, nor organiceconomic entities of any other sort. They do not necessarily lend themselves to a coherent ‘1 +
101Tackling UK poverty and disadvantage in the twenty-first century

1 = 2’ strategy for the region as a whole. For example, the problems of wealth creation ininner city Bristol and rural Cornwall require different approaches; Merseyside and GreaterManchester may have more similar problems, however each requires a specific focus sensitiveto sub-regional nuances. Current processes of decentralisation are important in recognisingthis; a local entity whether devolved democratic structure or quango is more likely torecognise local diversity and needs than central government.
However, decentralisation must be about more than just the efficient delivery of centralgovernment policy. As one academic has argued:
Many of the prosperous regions of Europe are also regions of participatory politics, activecitizenship, civic pride and intense institutionalization of collective interests – of societybrought back into the art of governance. Within them, association life is active, politics isshare and commonly owned, and a strong culture of autonomy and self-governance seepsthrough local society. These are regions of developed ‘social capital’ 30
Whilst it is unclear how to foster such a situation, Amin31 suggests ‘catalyst projects such asfestivals, and the recovery of local public spaces’ as well as a broader social agenda. Incountries such as France, Germany and Ireland there is significant policy support for a widerange of community generated activity.
In this light it will be interesting to track developments over the medium to long-term inManchester post-Commonwealth Games. The impression the city gave to the country as awhole was of greatly heightened levels of social capital. All concepts listed above appearedmaximised – with high levels of local pride, based on perceptions of being able to deliver aworld-class event, in the ability of local politicians and civic leaders to surpass national andinternational expectations, of a reinvigorated culture of volunteerism.
Whether this can be built upon will come down to many issues. One such issue emanatingfrom Joseph Rowntree Foundation research is the need for vertical integration of policy.Throughout the past decade there has been an increased emphasis placed on partnershipswithin neighbourhoods or local areas. What needs to be built on is an understanding of howdifferent strategies at national, regional and local levels can be used to complement eachother – implementing policy at the most appropriate spatial level.
ConclusionThis paper has argued that, whilst there is poverty throughout the UK, the socio-economicconditions of much of the South are very different to elsewhere. With projections that suggestthe market, if unchecked, may well exacerbate these inequalities over the next 20 years, thisissue must emerge on to the policy agenda.
The narrowing of the regional divide requires a coherent strategy that embraces seriousinvestment, good governance at the appropriate spatial level and partnerships working bothhorizontally across agencies at each level and vertically from the national through regional tothe local. Many of these pieces of the jigsaw are, to a degree, in place. However, recognition ofa significant regional economic divide by the Government is required, as at present it is clearthat the market will only perpetuate existing problems. Such recognition, buttressed by targetsand investment, is necessary if the divide is to be reduced 20 year hence.
102 Tackling UK poverty and disadvantage in the twenty-first century
Notes1 The problems of parts of the South-west, where there is very low wealth generation, but where industrial and
manufacturing decline are not central problems, are unique within the UK context. See Cornwall Country Council(2000) Cornwall and Scilly Objective One Programme2000–2006.<http://www.cornwall.gov.uk/business/objone/objone2.htm>, visited 22 January 2003, for a fullbackground.
2 Power, A. and Mumford, K. (1999) The Slow Death of Great Cities? Urban abandonment or urban renaissance, York:Joseph Rowntree Foundation/YPS.
3 Power, A. and Wilson, W.J. (2000) Social Exclusion and the Future of Cities, CASE paper 35, London: Centre for theAnalysis of Social Exclusion, London School of Economics, p.8.
4 Cambridge Econometrics (2002) Regional Economic Prospects, Cambridge: Cambridge Econometrics.5 See, for example, Department for Works and Pensions (2002) Households Below Average Income, London: The
Stationery Office, Table 3.4.6 Parkinson, M. (2001) ‘The Urban White Paper: Halfway to Paradise?’, New Economy, 8 (1), 47–51.7 Behrens, A. (2002) Regional Gross Domestic Product in the European Union 1999, European Communities.8 Greater London Authority (2002) London Divided – Income inequality and poverty in the capital, London: Greater
London Authority.9 Sunley, P., Martin, R. and Nativel, C. (2001) ‘Mapping the New Deal: local disparities in the performance of Welfare-
to-Work’, Transactions of the Institute of British Geographers, 26 (4), 484–512.10 The JRF has carried out much research in this area. See, for example, Meadows, P. (2001) Young Men on the Margins
of Work: An overview, York: Joseph Rowntree Foundation/YPS.11 Cambridge Econometrics (2002) Regional Economic Prospects, Cambridge: Cambridge Econometrics.12 Robson, B. (2000) The State of English Cities, London, Department of the Environment, Transport and the Regions.13 Pearson, R., Jagger, N. and Aston, J. (1999) Science Skills Issues, Skills Task Force Research Paper 17, London
Department for Education and Employment.14 Richardson, R. and Belt, V. (2001) ‘saved by the Bell? Call centres and economic development in less favoured
regions’, Economic and Industrial Democracy, 22, 67–98.15 Labour Force Survey (Via NOMIS), <http://www.nomisweb.co.uk> Visited 23 January 2003.16 Hurst, C., Thisse, J.-F. and Vanhoudt, P. (2000) ‘What diagnosis for Europe’s ailing regions?’, EIB Papers, 5 (1), 9–29.17 H.M. Treasury/DTI (2001) Productivity in the UK: The regional dimension, London: The Stationery Office.18 Ibid.19 Department for Education and Skills (2002) Participation in Education and Training by 16- and 17-year-olds in each
local area in England <http://www.dfes.gov.uk/statisctics/DB/SBU/b0369/index.html> Visited 27 January 2003.20 Cambridge Econometrics, Regional Economic Prospects.21 Small Business Service Statistics (2003) <http://www.sbs.gov.uk/content/statistics/vat9401.xls> Visited 1Feb 2003.22 HM Treasury/Department for Trade and Industry (2001) Productivity in the UK: The regional dimension, London:
Stationery Office.23 RSA (2001) Labour’s New Regional Policy: An assessment, Seaford: Regional Studies Association, p. 40.24 Hutchins, M. (2000) Are Big Cities Getting Better? European Institute for Urban Affairs,
<http://cwis.livjm.ac.uk/cities/Papers/CC.pdf> Visited 23 January 2003.25 Jefferson, C.W. and Trainor, M. (1996) ‘Public Sector Relocation and Regional Development’, Urban Studies, 33 (1),
37–4826 Department of the Environment, Transport and the Regions (2000) Our Towns and Cities: The future: delivering an
urban renaissance, London: The Stationery Office; and Lord Rogers (chair) (1999) Towards an Urban Renaissance: Finalreport of the Urban Task Force, London: E and F N Spon.
27 Hutchins, Are Big Cities Getting Better?28 Nevin, B., Lee, P., Goodson, L., Murie, A. and Phillimore, J. (2000) Changing Housing Markets and Urban Regeneration
in the M62 Corridor, London: Housing Corporation.29 Leather, P. (2001) Submission to the Report.30 Amin, A (1999) ‘An Institutionalist Perspective on Regional Economic Development’, International Journal of Urban
and Regional Research, 23 (2), 365–378.31 Amin, ‘An institutional Perspective’.
103Tackling UK poverty and disadvantage in the twenty-first century

104 Tackling UK poverty and disadvantage in the twenty-first century
IntroductionThe consequences for society of continued poverty for the individual, in terms of a lack ofdignity, choice and control stemming from incomes out of touch with the mainstream, areunacceptable. In Part I we concluded that 60 per cent of median household income1 representsa threshold below which anyone living in the United Kingdom in the 21st century is unlikely toenjoy an adequate standard of living. A principal task in tackling disadvantage over the next20 years will be to ensure that as few people as possible spend time relying on incomes belowthat threshold.
It was established that this is an affordable objective over the long term, in the sense thatit could be achieved by expected economic growth going disproportionately to poorerhouseholds, while still maintaining a steady rise in living standards among other incomegroups – not greatly different from that experienced in the past five years. A different, andharder, question concerns the mechanisms by which the relative incomes of the least well offcan be increased.
An overall strategyIn a modern democracy with a market economy, it is not realistic to think that unjust levels ofpoverty can be rectified by simple redistribution alone. Such a strategy is unlikely to gainpublic approval, if it appears to discourage efforts by people on lower incomes to helpthemselves, and thereby to produce a growing burden of dependency of one section of thepopulation on the generosity of another. On the other hand, if tackling disadvantage isapproached primarily in terms of helping people on lower incomes towards betteropportunities, encouraging them to make an active contribution to society, while protectingeveryone against certain types of contingency, there is more prospect that public transfers ofincome to help disadvantaged people, where needed, will gain social and political consent.That is the central approach of this chapter.
More specifically, this chapter advocates a strategy that aims to minimise the number ofpeople living in households with below 60 per cent of median income, while at the sametime minimising where possible the use of direct, income-tested redistribution to achieve this.Instead, it proposes maximising the use of other mechanisms to enhance low incomes –whether through earnings or through entitlements that are not directly means-tested. Thus,while basic Income Support will need to rise, it is essential to pursue simultaneously a rangeof strategies to enhance poorer people’s incomes that reduce their need to resort to thissafety net.
7 Tackling disadvantage:IncomesCombining opportunity and supportDonald Hirsch and David Darton
▲ 10
▲ 71
Establishing a threshold of 60 per cent median incomeThe income objective recommended is:
To minimise the number of people in households with incomes below 60 per cent of medianand in particular the amount of time spent on such incomes for those who do fall short ofthe threshold.
Justifying the thresholdPart I of this report explored the extent and consequences of poverty in the UK today.Inevitably, to set a line below which a society does not wish anyone’s income to fall involves adegree of arbitrary judgement. Deprivation and disadvantage exist on a continuum, ratherthan disappearing the moment a person’s income reaches a particular threshold. Moreover,two people in identical circumstances may in reality feel very differently about whether theirincomes are enough to buy the things that they need. Nevertheless, it is useful to use a singlemain income threshold to which politicians and the public relate. The value of such a thresholdin helping to sustain the priority of poverty eradication is already apparent in the quest to endchild poverty.
As discussed in Appendix (i) of Part I, there are several reasons for proposing that 60 percent of median should be seen as a minimum:
• This level corresponds roughly with calculations of a ‘low cost but adequate’ family budget.
• 60 per cent of median is the most widely recognised international poverty threshold, andcan therefore be seen as an internationally defined benchmark.
• A threshold based on the median sets a standard relative to a norm among ordinaryworking households. It is less sensitive than a threshold based on the mean to fluctuationsover the economic cycle, since it has no direct relationship with the incomes of the rich. Inthis sense it also more accurately measures disadvantage, relative to society’s mainstreamexpectations, rather than inequality overall, which can increase solely as a result of the richbecoming richer.
• A relative income threshold of this kind reflects prevailing social attitudes. Surveys such asthe Joseph Rowntree Foundation’s Poverty and Social Exclusion Survey and the BritishSocial Attitude surveys demonstrate that most of the public believe that people in the UKshould not go without the basics that have become norms of our society. The resultsconfirm that society does not consider that minimum living standards should be the samein the UK today as in developing countries, or in the UK in the past. For example, most ofthe population believe that everyone in the country should be able to afford a telephone, atelevision and a washing machine.2
The Foundation has been searching out causes of and solutions to social need and poverty fora century. But there are some particular reasons for society today to adopt an explicit objectivefor enhancing the incomes of the worst off over the long term. Until the late 1970s, their
105Tackling UK poverty and disadvantage in the twenty-first century

relative position had been steadily improving; in the past two decades, however, the numberson relatively low incomes has risen dramatically, by about 21/2 times. Even more importantly,many of the factors driving increasing inequalities remain with us, and some could get worse(even though the deterioration in some of them seems at least temporarily to have halted).These include:
• Changes in occupational and employment structure, with higher degrees of risk continuingto be borne by the individual. The concept for example of the portfolio worker carryingaround their own human capital and pension entitlements from one employer to anothercontrasts strongly with a more paternalistic model of lifelong jobs and protection byemployers.
• Widening wage dispersion, connected in particular to differences in opportunities forpeople with and without educational qualifications and skills.
• Historically high levels of separating and re-forming households, leaving some people,especially women, with reduced sources of family income.
• Some increased burdens on families in the form of requirements for support from otherfamily members. Examples are children making longer transitions into adulthood, and frailelderly people with limited access to institutional care and support making more demandson informal care within some families.
• A growth in the population of some groups at high risk of being on low incomes – notablycertain ethnic minorities, recent immigrants and people with disabilities.
• The ageing of the population. Although average income of pensioners has been rising, sohas pensioner inequality, and those who remain on low fixed incomes in later life comprisea substantial proportion of people in long-term poverty. Demographic change has alsomade governments more cautious about raising the basic pension in line with overallgrowth, so those without private pensions have become increasingly dependent on means-tested relief to rescue them from deep poverty.
• Polarisation in the number of earners in households, with an increase in the number withtwo and with no earners, and a reduction in the number with one earner.
A number of these trends not only help increase the number on relatively low incomes butalso make low incomes more of a long-term rather than transitory phenomenon for manypeople. For example, an older worker who loses their job and who lacks qualifications todayfaces a strong prospect of never working again.3 Poverty has particularly detrimental effectswhen it is sustained over a long period;4 hence the priority given by this report to limiting theamount of time that anyone has to spend living on an income below 60 per cent of median.Priority needs therefore to be given to measures that help groups suffering long-term poverty,including, for example, people who have been out of work for long periods and pensionerswith low incomes who are not claiming their full entitlements.
106 Tackling UK poverty and disadvantage in the twenty-first century

Do the underlying forces summarised above make the ambition to reduce the numbers onlow incomes unrealistic? Not necessarily, providing that these forces are well understood, andtheir effects tackled directly. Thus, for example, we argue below that the worsening ofprospects for those without education and skills makes training, and continuing education andtraining a priority; at the same time, the growing instability of family relationships makes itimportant, for example, to improve pension protection for people who are separated ordivorced from the person on whom they had depended for income in old age.
What would commitment to a threshold mean?A wide range of advanced industrial countries define ‘minimum income standards’ as areference point for their systems of social security and social protection.5 These may be basedon various criteria, ranging from minimum wages to relative incomes or baskets of goods TheUK has resisted adopting such standards. An important point to note is that in countries thatdo set them, there is a well-understood difference between stating an aspiration for minimumincomes and making a political commitment guaranteeing that this level will be maintained.Recent political history in the UK is littered with examples of firm pledges and targets, some ofwhich have come back to haunt those who made them. In the case of a minimum incomethreshold, we suggest that a different approach is taken. A political or social commitment toreducing the number below 60 per cent median household income, whatever form it takes,should meet two essential criteria:
1 It should make the reduction in this number a high profile, high stakes objective. The bestparallel is unemployment. Nobody imagines that under any government it will beeliminated tomorrow, and realistically we can expect it always to exist in some form. Yetwe care continually about its level, expect every government to make its best efforts tocontain it, and find it unacceptable when it rises too high. Most importantly, everyoneagrees on the desirability of a single measure, which is therefore regularly and prominentlyreported. (The case of unemployment shows that, even where there is more than onemeasure, a ‘headline’ figure can play a powerful role. The government’s ‘preferred measure’of ‘ILO’ unemployment is regularly published, yet the psychological impact of whether theclaimant count is, say, above a million remains. The claimant count had been used for longenough to become a measure familiar to the public.)
2 Second, more specifically, it should set as a basic objective a cycle on cycle reduction in thenumber of people below the threshold. It is unrealistic to imagine that the number on lowincomes will reduce year on year. But its reduction over an economic cycle would indicateprogress in improving the structure of the income distribution over the long term.
Routes to adequate incomes (1): Means-tested benefitsIncome Support (IS) and associated safety-net benefits6 provide a level below which nobody inthe UK needs to fall, providing they claim such benefits and do not contravene conditions suchas availability for work. The general level of IS is at present far too low to provide a basicincome equal to 60 per cent of median. For example, for a single person basic IS is £54 aweek, while 60 per cent of median income after housing costs works out at £84 a week for asingle person (adjusted to reflect household composition).
107Tackling UK poverty and disadvantage in the twenty-first century

Over a long period, therefore, there is a need to raise the safety net at a rate faster thanmedian incomes (and therefore probably faster than average earnings) in order that it shouldcome closer to providing an income that can be considered adequate to live on. This appliesmore to people of working age than to pensioners: following generous recent increases, theminimum income guarantee, presently £98 a week for a single pensioner, is close to 60 percent of median.7
Simply redistributing incomes through IS to top up everyone to 60 per cent of the medianwould be an expensive solution that relieved poverty without addressing its underlying causes.Any raising of a safety net needs to be combined with measures that reduce the chance ofpeople falling into it. A further objective is therefore to:
Reduce as far as possible the use of means-testing by maximising the use of other routes to income.
Means-testing has become an increasingly important part of the UK’s social security system.Transfers to individuals on the basis of their incomes are serving a range of functions that gofar beyond that of an emergency safety net to catch those falling through gaps in the socialsecurity system. In particular, they:
• Top up the incomes of nearly two million pensioners whose state and private pensions donot reach a set minimum. From April 2003, a new form of income-tested support will beextended to about half of all pension households through the Pension Credit.
• Cover incomes of 700,000 unemployed people,8 compared with just 200,000 whoseincomes are covered by the contributory insurance system envisaged by Beveridge.
• Help four million tenants on low incomes to pay their rent, through housing benefit.9
108 Tackling UK poverty and disadvantage in the twenty-first century
Figure 7.1 With benefits stagnant in real terms, they have steadily fallenas a percentage of average earnings
30
25
20
15
10
5
0
Source: Department for Work and Pensions (2002) The Abstract of Statistics,London: The Stationery Office; Institute for Fiscal Studies (2002) Fiscal Facts,
http://www.ifs.org.uk/taxsystem/contents.shtml> Accessed 27 January 2003
Per
cent
1981 1982 1983 1984 1985 1986 1987 1988 1989 1990 1991 1992 1993 1994 1995 1996 1997 1998 1999 20012000
Basic State Pension
Supplementary Benefit/Income Support

• Top up incomes of over a million families in work with low incomes, through the tax creditsystem. From April 2003 this support will be extended to include families without children.
Note that these changes, as well as extending means-testing to more people, have alsoinvolved using it in a wider variety of ways. One kind of means-test (e.g. income support) actsas a pure safety net by setting an absolute threshold, and topping up incomes to that levelwhere households fall below it. Another kind (e.g. Working Families Tax Credit) aims to helppeople on lower incomes more widely, even where they are above this minimum. For examplein the case of the pensioner credit and in-work tax credits, support is reduced as incomes rise,but falls by less than a pound for every extra pound earned. This contrasts with the 100 percent withdrawal rate that applies, for example, to people on income support earning morethan a small amount of disregarded10 income, or until recently to the Minimum IncomeGuarantee for pensioners.
Means-tested approaches to supporting incomes are at one level attractive. Theypotentially concentrate resources on those in the greatest need. However, there are someserious disadvantages with a social security system that uses income tested benefits as theprime method of ensuring that everyone has an adequate income – a situation towards whichthe UK appears to be moving:
Five difficulties with excessive means-testing1 It may reduce people’s incentives to provide income for themselves.
If the state provides an adequate standard of living, will individuals and householdsdecide that there is no point making efforts to earn and save? Incentive issues arise in avariety of forms. The strongest disincentive results occur when someone with limitedearning power has little or no prospect of becoming better off through their own effortsthan the state-guaranteed minimum. For example, income support could make someone aswell off out of work as they could expect to be in it; or when deciding whether to save forincome in retirement, a low income earner might have no hope of adding to the minimumguaranteed by the state. In practice, a ‘100 per cent withdrawal’11 of extra income hasrecently been made far less likely in the case of work incentives (through improved in-worksupport combined with the minimum wage), and effectively abolished in the case ofpension income (through the pension credit). However, in both cases a more gradual, butstill problematic, form of withdrawal now applies to a wider section of the population,since the income at which means-tested support is payable has increased. The newgeneration of tax credits will leave nearly 11/2 million low-income working households withcompounded withdrawal rates12 of above 60 per cent, nearly double the number before1999. This may, in particular, discourage a potential second earner from taking a job,knowing that on a minimum wage of £4.20 an hour, less than £2 might end up in theirpocket. In the case of the Pension Credit, a pensioner in the lower half of the incomedistribution will lose 40p in reduced state support for each extra £1 they have in privatepensions, keeping the other 60p.
Do these theoretical disincentives in fact affect behaviour? This has proven hard todetermine since such a wide range of factors affect decisions about whether to work.Research has tended to indicate that disincentive effects can be significant, but not as
109Tackling UK poverty and disadvantage in the twenty-first century

large as one would expect if marginal take-home pay were the only consideration abouthow much to work.13
But even if the visible behavioural response to disincentives is limited, society may beuncomfortable with their existence. First, because the public tends to be unhappy with theidea that the system discourages effort. Second, because a fear that the disincentive ishaving a hidden influence, or may come to affect behaviour, is bound to linger.
2 Sharp withdrawal rates create poverty traps and may be seen as unfair.Even insofar as means-testing does not create behavioural changes through
disincentives (people work less because they will not be much better off), there are reasonsto be concerned about the effect of high income withdrawal rates. If people do not changetheir behaviour, but find themselves little better off from working more, this creates issuesabout fairness and about the operation of a poverty trap.
The provision of an income floor can be seen as a socially just measure because itguarantees everyone a basic living standard. On the other hand, if a large proportion of thepopulation find that increasing their earnings makes them little better off, this may be seenby themselves and by society as unfair. Whether or not it creates disincentives, it reducesthe capacity of individuals to better themselves. A low income pensioner who has saved formany years to achieve a small private pension, and is little or no better off than theirneighbour who has saved nothing, is likely to regard the system as unfair. So is a low-paidworker who undergoes some training, achieves a pay rise, and then later has their taxcredit and housing benefit cut, largely offsetting this gain.
3 Some people may find it humiliating to have to appeal to the state because they are poor.Means-testing has, in different circumstances, created greater or lesser humiliation of its
subjects. The extreme situation of the Victorian poor laws, which aimed to make claimingpoor relief as unpleasant as possible to ensure that it was used as a last resort, is certainlya thing of the past. At the other extreme, some forms of means-test can minimiseintrusiveness and stigma – especially where they are part of a system involving peopleacross the income range. An example is the old student grant system, at the time when allstudents got some award, with a minimum level for higher-income families and amaximum for lower-income ones. The new Child Tax Credit will be similar in that respect,with lower and upper rates covering almost everyone, although the richest parents will notbe eligible. Overall, the government has tried to take the stigma out of means-testedbenefits, through a variety of methods, including rebranding them as tax credits andreducing the frequency with which claims must be renewed. It has also concentrated morethan in the past on testing income, rather than capital, more of which is now disregarded.
4 Take-up of means-tested benefits is often relatively low.Whether because of their attitudes to undergoing a means-test, or because of lack of
information about what they are entitled to, a large percentage of people do not claimmeans-tested support. The government’s efforts to reduce stigma do not appear so far tohave wholly transformed people’s attitudes: more than 20 per cent of those entitled areestimated not to claim the Working Families Tax Credit and the Minimum Income
110 Tackling UK poverty and disadvantage in the twenty-first century

Guarantee, and neither seems to have produced a dramatic increase in take-up comparedto their predecessors. This undermines efforts to ensure that people are not living inpoverty. It is true that the majority of people who do not claim tend to be those eligibleonly for small amounts. But before deciding that this does not matter much, policy makersshould pause to reflect about why people would think that it is not worth claiming even afew pounds a week to which they are entitled, when they are on very low incomes. Forsome, it would appear that the means-test is still seen as an unwelcome intrusion.
5 The ethos of widespread means-testing does not sit comfortably in an affluent society.In the case of pensions, for example, there is an important distinction between a system
that says ‘everyone who has worked has earned an entitlement to a decent pensionbeyond retirement age’, and one that says ‘the poorer half of old people can have theirincome topped up to a decent level if they come to the state and ask for help’. Thesealternatives are, of course, caricatures, but in thinking about what society we want 20 yearshence, one can hope to aim for the first type of outcome rather than the second.
Despite the fact that the present government has increased the number of people subject tomeans-tests, there is widespread awareness of the above disadvantages, including withingovernment. The present administration hopes, for example, that its pensions strategy willeventually reduce the number of older people on income-related benefits. It has also tried toreduce the disadvantages of means-testing through the design of benefits and tax credits.
There is certainly scope for minimising the drawbacks of means-tested support for incomes.The recent spread of means-tested tax credits rather than benefits does not in itself removethe disadvantages. Whether one calls an income transfer a tax credit or a benefit, and whetherit is paid by the Inland Revenue or the benefits service, does not alter its fundamentalcharacteristics. However, several other changes that have to some extent been associated withthe move to a tax credit system are likely to be beneficial. In particular:
• Less frequent assessment of income helps blunt the relationship between changes inincome and eligibility for financial help, reducing the degree to which every time someoneimproves their position the government takes something away. It also reduces stigma andintrusiveness. New tax credits for working-age people will be assessed annually; those forpensioners every five years.
• A flat-rate payment over a relatively wide band of income, in the case of the Child TaxCredit, gives extra security for low income households.
• A relaxing of capital14 limits on a number of benefits means that people with savings are notexcluded: hence the means-test is becoming less intrusive than when it looked at every aspectof a person’s means. In the case of the pension credit, all limits on capital have been removed.
Yet despite such modifications, means-tested support remains a ‘second best’ route toadequate incomes – one that will be necessary where other means fail to raise themsufficiently. The remainder of this paper considers three such alternative methods: enhancingincomes earned from work; developing new rewards for activities outside paid work; andimproving entitlements to meet the needs of those who are not working. Although none of
111Tackling UK poverty and disadvantage in the twenty-first century
these methods is likely in the near future to take very large numbers of people out of means-testing altogether, if they are emphasised over a number of years, the importance of means-testing in propping up incomes could dwindle.
Routes to adequate incomes (2): Enhancing incomes from paidworkThe measure with the greatest potential to enhance the incomes of the most disadvantaged isto increase their opportunities for earning income from work. One element of this is helpingmore people to move into work, especially those in workless households. Recent governments,and particularly the present one, have focused on this, maintaining that working is the bestroute out of poverty.
However, somewhat less attention has been given to the task of enabling people to thrivein the working world, in terms of getting stable, high-quality jobs that are well enough paid toavoid having to fall back on means-tested support in order to obtain an adequate income. It isimportant to recognise that even relatively good wages are not guaranteed to lift every familyout of poverty – that depends on the composition of the household and how many hours aweek of wages its members bring in. Nevertheless, a sustainable long-term reduction inpoverty rates depends on the individuals who make up the poorest households increasing theirlifetime earning power – which can improve their standard of living in the working years andalso, indirectly, in retirement, by giving them greater ability to save and contribute topensions.15
Improving relative pay at the bottom of the labour market is not easy: it requires a reversalof a long-standing trend in the opposite direction, associated with the growing reward forskills and education and the declining demand for unskilled jobs. Wage and income dispersionin different OECD countries can be directly associated with education and skill inequalities.This evidence demonstrates that any strategy to reduce low pay must centre around the twinobjectives of improving human capital and raising productivity.
As discussed in Chapter 4, this means improving education and training for disadvantagedgroups, not just at the beginning of, but also throughout their lives. Such improvement inhuman capital is a necessary but not sufficient condition for raising job quality and pay at thelower end of the labour market. Government needs to work with employers to ensure thatimproved skills are actively used. Indeed, since much worker training is provided and/orfunded by employers themselves, persuading employers to focus more on training their lessqualified workers needs to go hand-in-hand with persuading them to tap their potential morein the workplace. At the same time, government needs to make training a greater priority in itsefforts to help disadvantaged groups in the labour market, for example through the NewDeals, which hitherto have been oriented primarily on finding and entering jobs, rather thanbuilding skills that will lead to job progression.
At the same time as improving skills and productivity, the earnings floor can beprogressively raised through upratings in the minimum wage. It is correctly argued that thereare bound to be limits to how high this minimum can be set without destroying jobs, andhence undermining the objective of using work as a route out of poverty. However, if a steadyincrease in the earnings power of lower-paid workers is seen as highly desirable, governmentswill seek to maximise the level of the minimum wage within this constraint, rather than
112 Tackling UK poverty and disadvantage in the twenty-first century
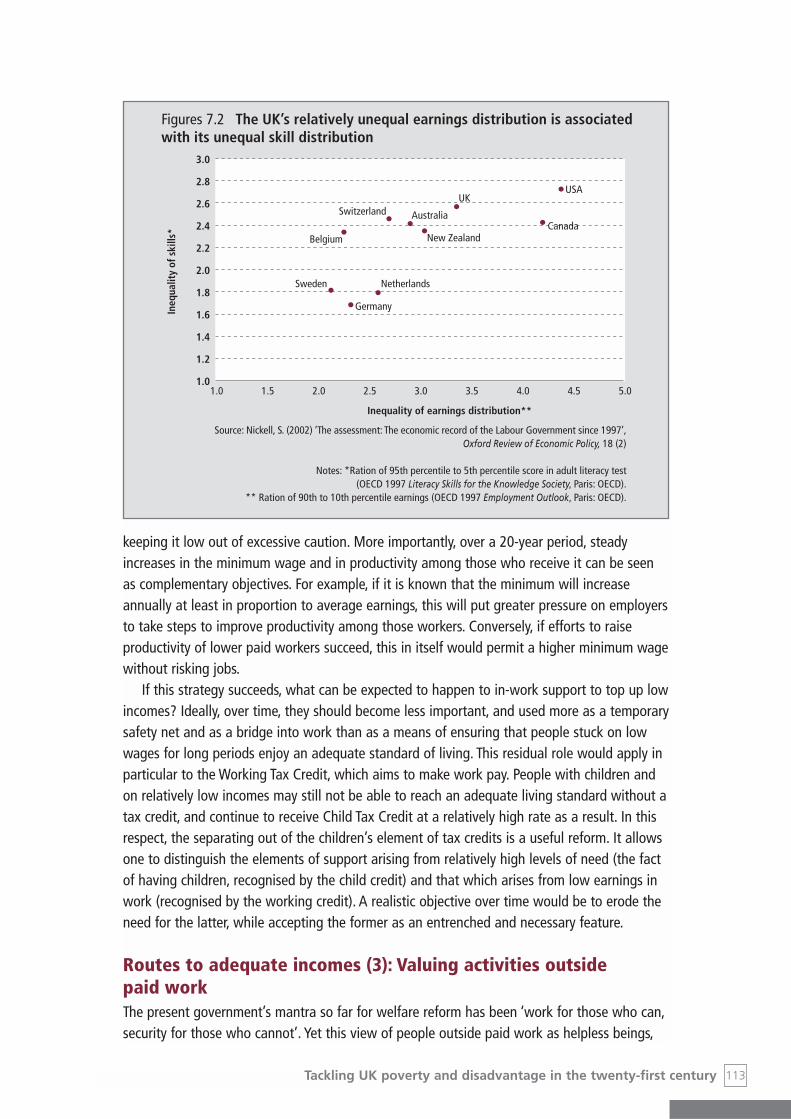
keeping it low out of excessive caution. More importantly, over a 20-year period, steadyincreases in the minimum wage and in productivity among those who receive it can be seenas complementary objectives. For example, if it is known that the minimum will increaseannually at least in proportion to average earnings, this will put greater pressure on employersto take steps to improve productivity among those workers. Conversely, if efforts to raiseproductivity of lower paid workers succeed, this in itself would permit a higher minimum wagewithout risking jobs.
If this strategy succeeds, what can be expected to happen to in-work support to top up lowincomes? Ideally, over time, they should become less important, and used more as a temporarysafety net and as a bridge into work than as a means of ensuring that people stuck on lowwages for long periods enjoy an adequate standard of living. This residual role would apply inparticular to the Working Tax Credit, which aims to make work pay. People with children andon relatively low incomes may still not be able to reach an adequate living standard without atax credit, and continue to receive Child Tax Credit at a relatively high rate as a result. In thisrespect, the separating out of the children’s element of tax credits is a useful reform. It allowsone to distinguish the elements of support arising from relatively high levels of need (the factof having children, recognised by the child credit) and that which arises from low earnings inwork (recognised by the working credit). A realistic objective over time would be to erode theneed for the latter, while accepting the former as an entrenched and necessary feature.
Routes to adequate incomes (3): Valuing activities outside paid workThe present government’s mantra so far for welfare reform has been ‘work for those who can,security for those who cannot’. Yet this view of people outside paid work as helpless beings,
113Tackling UK poverty and disadvantage in the twenty-first century
Figures 7.2 The UK’s relatively unequal earnings distribution is associatedwith its unequal skill distribution
3.0
2.8
2.6
2.4
2.2
2.0
1.8
1.6
1.4
1.2
1.0
Source: Nickell, S. (2002) ‘The assessment: The economic record of the Labour Government since 1997’,Oxford Review of Economic Policy, 18 (2)
Notes: *Ration of 95th percentile to 5th percentile score in adult literacy test(OECD 1997 Literacy Skills for the Knowledge Society, Paris: OECD).
** Ration of 90th to 10th percentile earnings (OECD 1997 Employment Outlook, Paris: OECD).
Ineq
ualit
y of
ski
lls*
1.0 1.5 2.0 2.5 3.0 3.5 4.0 4.5 5.0
Inequality of earnings distribution**
NetherlandsSweden
Germany
Belgium
Switzerland
New Zealand
Australia
UK
Canada
USA
whose only need is support, creates an unhelpful dichotomy and devalues the manycontributions that people make outside paid work. An alternative approach is to encourageand reward a range of activities – such as learning, caring and volunteering – that go onoutside the context of paid work, but nevertheless add social value. An important aspect ofthis task is to enable people to move between different activities more easily. Therefore afurther objective is:
To develop an approach to income support that values roles other than paid work andenables people to move more easily between them.
As a minimum, in moving towards the provision of a secure income for people who are notworking, it will be important not to deter activity outside the context of paid work. In the past,people on benefits have often been nervous about engaging in learning or voluntary work, forfear either that they might not meet availability for work requirements or, if on IncapacityBenefit, because they might be deemed capable of paid work and lose their benefits. Thegovernment has already taken some steps to reverse this situation – for example by makingclearer the rules that allow voluntary work while claiming Job Seekers’ Allowance – but couldgo much further in this direction. In particular, in developing a ‘work-focused’ gateway tobenefits it needs to take care that for those whose prospects of paid work are slim, alternativeactivities are encouraged.
A more ambitious aim would be, not just to create a permissive environment towardsactivities outside work while claiming benefits, but to make it clear that certain socially valuedactivities would earn a higher than normal basic income. Two priority areas of support might be:
• Support for carers. A substantial benefit or tax credit designed to support the incomes ofpeople spending given amounts of time caring for sick or elderly relations or friends couldensure that carers had adequate living standards that took them above 60 per cent medianincome and was not clawed back sharply against earnings – although some exclusion ofhigher income groups would make it more affordable. This could build on the presentCarers Allowance. One option would be to provide a (more generous and flexible) carer’sallowance to people on low and middle incomes and to exempt any reward for domesticcaring – whether from the allowance or from private payment – from income testsaffecting benefit and tax credit entitlements. In this way, caring could provide a particularlyvaluable income supplement for people on low incomes.
Research on carers has shown that many people both inside and outside workundertake substantial amounts of unpaid and unacknowledged care, which often leavesthem feeling stressed and undervalued by society.16 In the long term, while the percentageof children in the UK population can be expected to decline,17 the number of older peopleneeding personal care will greatly increase. If we continue to take for granted the army ofunpaid labour on which we now depend to provide personal care for these groups, there isa strong risk that there will not be enough people willing to put in the dedicated servicethat is needed. The long-term cost to formal care and health services could greatly exceedthe cost of providing supplementary income to carers. Moreover, more than four-fifths of
114 Tackling UK poverty and disadvantage in the twenty-first century
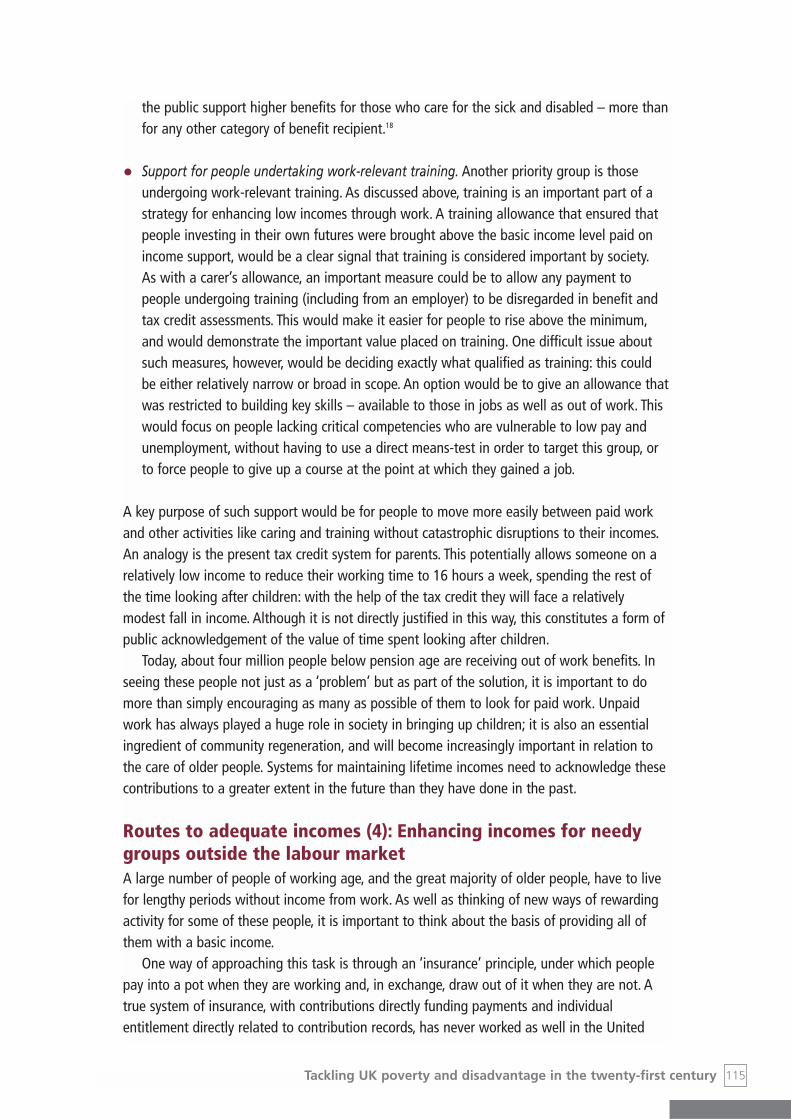
the public support higher benefits for those who care for the sick and disabled – more thanfor any other category of benefit recipient.18
• Support for people undertaking work-relevant training. Another priority group is thoseundergoing work-relevant training. As discussed above, training is an important part of astrategy for enhancing low incomes through work. A training allowance that ensured thatpeople investing in their own futures were brought above the basic income level paid onincome support, would be a clear signal that training is considered important by society.As with a carer’s allowance, an important measure could be to allow any payment topeople undergoing training (including from an employer) to be disregarded in benefit andtax credit assessments. This would make it easier for people to rise above the minimum,and would demonstrate the important value placed on training. One difficult issue aboutsuch measures, however, would be deciding exactly what qualified as training: this couldbe either relatively narrow or broad in scope. An option would be to give an allowance thatwas restricted to building key skills – available to those in jobs as well as out of work. Thiswould focus on people lacking critical competencies who are vulnerable to low pay andunemployment, without having to use a direct means-test in order to target this group, orto force people to give up a course at the point at which they gained a job.
A key purpose of such support would be for people to move more easily between paid workand other activities like caring and training without catastrophic disruptions to their incomes.An analogy is the present tax credit system for parents. This potentially allows someone on arelatively low income to reduce their working time to 16 hours a week, spending the rest ofthe time looking after children: with the help of the tax credit they will face a relativelymodest fall in income. Although it is not directly justified in this way, this constitutes a form ofpublic acknowledgement of the value of time spent looking after children.
Today, about four million people below pension age are receiving out of work benefits. Inseeing these people not just as a ‘problem’ but as part of the solution, it is important to domore than simply encouraging as many as possible of them to look for paid work. Unpaidwork has always played a huge role in society in bringing up children; it is also an essentialingredient of community regeneration, and will become increasingly important in relation tothe care of older people. Systems for maintaining lifetime incomes need to acknowledge thesecontributions to a greater extent in the future than they have done in the past.
Routes to adequate incomes (4): Enhancing incomes for needygroups outside the labour market A large number of people of working age, and the great majority of older people, have to livefor lengthy periods without income from work. As well as thinking of new ways of rewardingactivity for some of these people, it is important to think about the basis of providing all ofthem with a basic income.
One way of approaching this task is through an ‘insurance’ principle, under which peoplepay into a pot when they are working and, in exchange, draw out of it when they are not. Atrue system of insurance, with contributions directly funding payments and individualentitlement directly related to contribution records, has never worked as well in the United
115Tackling UK poverty and disadvantage in the twenty-first century

Kingdom as in many other European countries, and in recent years has all but broken down.Two examples illustrate this. First, the linking, in the 2002 Budget, of a 1p rise in nationalinsurance contributions to an increase in resources for the National Health Service – an areaof expenditure which is not part of the insurance system – demonstrating that the revenuefrom National Insurance is now regarded as a tax. Second, the fact, referred to above, thatonly one in five unemployed people are entitled to contributory benefits, illustrating thedegree to which means-tested support has become the main prop for working-age adultswithout their own income. There would be considerable merit in operating a more robustsystem of social insurance as still exists in countries like France and Germany, but this wouldrequire a massive overhaul of the whole UK social security system. Discussions about how torevive the insurance principle19 have tended to founder on the twin rocks of political realismand economic caution. To make such a principle viable is likely to require a substantialincrease in employers’ contributions at precisely the time that many countries are trying toreduce theirs because they believe they are economically damaging.
An alternative is to think about social protection in more general terms, of helping peoplein certain circumstances and life stages, without trying to set up specific insurance funds towhich people pay in and from which they draw out, and without narrow means-tests. Adeveloping model for providing support of this type is the money paid for families withchildren. Child Benefit is paid to all such families regardless of means, while the new Child TaxCredit will be paid to most families, with different rates for people on lower and on higherincomes. Between them these benefits have helped improve the living standards of all familieswith children, with a relatively light-touch element of means-testing. Child Benefit has enjoyedalmost universal take-up and, as abortive efforts to change child benefit have illustrated,strong political support. For parents moving in and out of low-to-modestly paid work, both ofthese benefits provide a stable sum that recognise their status as parents and give a fixed,substantial level of support for their children.
Could such support, providing stable incomes to all people in certain life circumstances, beextended to more categories?The British Social Attitudes Survey shows substantial publicsupport for improving the benefits available to certain groups. Over two-thirds of peoplequestioned think for example that disabled people and retired people should be getting morefrom the government than now.20
In the case of people whose disabilities restrict their ability to work, there is scope forsimplifying and strengthening benefits to provide a reliable basic income, greater than theminimum. This would acknowledge society’s support for them and give them something stableon which to build. At present, Incapacity Benefit gives some of those who are not working(subject to modest contribution requirements) an income that tends to be higher than themeans-tested level (relied on by those without sufficient contributions), while disabled peoplein work and on low incomes are eligible for tax credits. A more straightforward entitlement toa basic income for those whose impairments restrict their ability to earn might look more likethe Child Tax Credit, with a fixed basic amount (although perhaps reduced or phased out ifstable income from work rises above a certain level), paid whether or not they are currentlyworking and regardless of contribution records. Note that such a structure would, like thepresent Incapacity Benefit, be distinct from assistance given to people to help cope with theirdisabilities, through Disability Living Allowance. Like Child Benefit, this is a pure ‘contingency’
116 Tackling UK poverty and disadvantage in the twenty-first century

benefit that could exist alongside a benefit that was eventually reduced or withdrawn forthose finding stable, well-paid work.
A further contingency for which a substantial basic income is desirable is old age. Pensionsare discussed in more detail below. At present, the first and second state pensions are linkedto contribution records, but to a large extent are contingency based, insofar as thecontribution requirements are modest. As with Incapacity Benefit, there is merit in consideringwhether a contribution condition remains relevant, especially if the state retirement pensionwere to be restored as the main bulwark for income in retirement for lower income groups.
The particular case of pensionsAs discussed throughout this paper, incomes in retirement are subject to many of the sameconsiderations as incomes throughout working life. In retirement as at other times of life,income inequalities have been rising and it is desirable to ensure that individuals andhouseholds have at least a basic income sufficient to allow them to enjoy a reasonablestandard of living that rises with general levels of prosperity. Also like in working life, means-testing in retirement can create a range of difficulties, although in this case issues ofincentives and fairness relate to prior savings rather than current earnings from work.
Yet the ability of individuals to better themselves in terms of retirement income is far moreconstrained and limited than working-life income. Even though the latter can require somefairly long-term investments in terms of, for example, education, it is relatively easy to see thecause and effect of improving one’s qualifications and getting a better job within a reasonabletime period. Enhancing one’s retirement income 30 or 40 years ahead by making adequateprovision now, especially on the basis of a low income, on the other hand, is full ofuncertainties. It is hardly surprising that so many people are making inadequate pensionsavings. Although there are a number of ways in which such provision can be usefullyenhanced (notably by improving people’s in-work incomes), a voluntaristic approach topension saving is unlikely to reduce dependence on means-testing in later life.
Rather, the minimum income guarantee and the pension credit will continue to provide themain support against poverty in later life unless systematic measures are taken to providealternative, non-means-tested sources of income. When it was originally announced, thesecond state pension was supposed to perform this function – but only as it was built up over50 years, and even this goal has been undermined by the pensioner credit, which pushesincome-testing further up the pensioner income scale. Are there other options for replacingmeans-tested transfers with more adequate pensions over the next 20 years? Three possibleways of doing this would be:
1 To make the second state pension more generous, and accelerate its introduction, so thatwithin 20 years it provides 60 per cent of median income.
2 To raise the value of the main state pension to the present level of the minimum incomeguarantee, and peg it to earnings, making it possible to abolish the pensions credit.21
3 To introduce a further tier of pensions, an earnings-related compulsory insurance scheme,but with a minimum amount payable that tops up the basic and second pension to at least60 per cent median. Pensions (as well as long-term care) are an area in which a significantstrengthening of the insurance principle could yet prove feasible in the UK – largely
117Tackling UK poverty and disadvantage in the twenty-first century

because income needs in old age can be anticipated as a near-certainty for all socialgroups, and there is potentially a strong interest for the better-off as well as the worse offin supporting such a scheme.
None of these options would be cheap, but neither would they be unaffordable.22 Moreover,the second and third options would yield very tangible benefits, in the form of a more stablebase income in retirement to people across income groups who were being asked to pay morein taxes and/or insurance contributions. We do not advocate any particular one of theseoptions, but believe that some such route to adequate pension entitlements for everybody,rather than a system of poor relief covering a swathe of the pensioner population, needs to bedeveloped for the decades ahead.
A final question is whether, for pensioners as for families with children and potentiallydisabled people, a semi-universal benefit with an element of means-testing (like the Child TaxCredit) might in the long term provide a more viable compromise. This could take the form, forexample, of a retirement pension paid to everyone, with a maximum and a minimum rate. Thefull maximum rate, equal to around 60 per cent of median income, would be payable not justto those with no private means, but to people with incomes up to a certain level (e.g. 25 percent above the minimum), thus improving the scope for using a small amount of savings andprivate pensions to raise one’s income above a basic amount. Once above this income, thepension would be reduced relatively quickly with rising income to a minimum amount(perhaps similar to the present state retirement pension). This would lead to final incomes notgreatly different from the present system, but with less severe means-testing for the worst-offand, more importantly, a single entitlement pension providing adequately for everyone, ratherthan requiring the worst-off to apply for income top-ups. Such a hybrid system may indeedhave potential as a ‘second-best’ alternative to the three other options suggested above. Yet itwould still have a significant disadvantage compared to an adequate state retirement pensionfor all, which all members of society would have a direct interest in maintaining at levels thatincreased with national prosperity.
ConclusionsThis paper has set out a number of long-term directions in which we should be heading if wewant people to have sufficient incomes to escape disadvantage.
In summary, these should involve:
• Raising the safety net of minimum income to more adequate levels.
• Taking measures to increase worker skills, productivity and pay at the worst-rewarded endof the labour market, both through training and through attention to the level of protectionafforded by the minimum wage.
• Rewarding activities outside paid work that society most values, notably care and training.
• Providing stable entitlements to benefits or tax credits that are not narrowly means-tested– either through universal entitlement for people in certain life situations or throughentitlements that reduce above a certain income threshold rather than continuously withrising income.
118 Tackling UK poverty and disadvantage in the twenty-first century

None of these objectives can be achieved quickly, easily or without cost. However, over a longperiod if we keep sight of them and move steadily towards them, much can be achieved. Thatis why they are described as directions: above all we need a steady compass that enables agradual but consistent move towards a more satisfactory system for protecting incomes. Evenlong journeys can, eventually, be completed successfully as long as the course remains asteady one.
Notes1 Note that this is ‘equivalised’ to adjust for household size.2 Gordon, D., Adelman, L., Ashworth, K. et al. (2000), Poverty and Social Exclusion in Britain, York: Joseph Rowntree
Foundation pp. 14–15.3 See, for example, Campbell, N. (1999), The Decline of Employment Among Older People in Britain, CASE paper 19,
London: London Centre for the Analysis of Social Exclusion, London School of Economics.4 For evidence of its effects see Kempson, E. (1996), Life on a Low Income, York: Joseph Rowntree Foundation.5 Veit-Wilson, J. (1998) Setting Adequacy Standards: How governments define minimum incomes, Bristol: Policy Press.6 Notably Job Seeker’s Allowance, where claimants do not have an entitlement based on contributions and, for older
people, the Minimum Income Guarantee/Pensioner Credit.7 Note that for the single pensioner, ‘60 per cent of median income’ is calculated as £107 before housing costs.8 Those who have are not entitled to insurance-based benefit, and those who receive such benefits but require
supplements to take them up to a safety-net income threshold.9 The particular case of housing benefit is not dealt with here. Housing benefit has made an important contribution to
the growth in means-testing, although this has been driven primarily by the shift away from subsidies andregulations to ensure low rents, rather than by a fundamental change in methods of supporting incomes. Similarly,the recently announced pilot change in the housing benefit system will start by reducing benefit sensitivity to rentrather than to incomes (eligibility will be the same for each tenant in an area, regardless of actual rent); means-testing against income will remain.
10 i.e. income that is ignored for the purpose of assessing benefit entitlement.11 i.e. for every £1 extra earned, £1 is lost in lower benefits and/or higher taxes.12 i.e. the total rate at which rising earnings are offset by increasing tax/national insurance liabilities and by falling
benefits/tax credits.13 See, for example, Duncan, A. and Giles, C. (1996) ‘Labour supply incentives and recent family credit reforms’,
Economic Journal, 106 (434), 142–155.14 Capital includes the value of all savings, property and investments, other than the claimant’s own home and
personal possessions.15 Note that by far the most important predictor of one’s chances of being poor in retirement is one’s work history. See
Bardasi, E. and Jenkins, S.P. (2002) Income in Later Life: Work history matters, Bristol: Policy Press.16 Mooney, A., Statham, J. and Simon, A. (2002) The Pivot Generation: Informal care and work after 50, York: Joseph
Rowntree Foundation/Policy Press; Phillips, J., Bernard, M. and Chittenden, M. (2002) Juggling Work and Care: Theexperiences of working carers of older adults, York: Joseph Rowntree Foundation/Policy Press.
17 The population of children under 16 is projected to fall from 20.2 per cent of the total population in 2001 to 17.3per cent in 2021 – proportionately one in seven fewer children (National Statistics). Changes in fertility andmigration could have some effect on this, but bearing in mind that a 3 percentage point fall represents nearly twomillion fewer children, a substantial fall seems likely.
18 See Hills, J., (2000) Taxation for the Enabling State, CASE paper no 41, London: Centre for Analysis of SocialExclusion, London School of Economics, p. 17.
19 National Insurance or Social Insurance? Informing the Debate: seminar papers (1999) A collection of papers fromseminars organised by the Joseph Rowntree Foundation, July–November 1999.
20 Hills, Taxation.21 Brooks, R., Regan, S. and Robinson, P. (2002) A New Contract for Retirement, London: IPPR.22 Brooks, R. et al. as above; Pensions Reform Group (2001)A new Contract Universal Protected Pension: Modernising
Pensions for the Millennium, London: Institute for Community Studies.
119Tackling UK poverty and disadvantage in the twenty-first century

120 Tackling UK poverty and disadvantage in the twenty-first century
IntroductionHousing policies can make an immense difference to tackling disadvantage. They can ensurethat households even on the lowest incomes live in decent homes within a pleasantenvironment. Conversely, if policy fails to address housing issues, the lack of a satisfactoryhome can have a great impact on not only the quality of life of individuals but also their wideropportunities.
For many decades, governments have set as their goal a decent home within the means ofevery household. Much progress has been made in removing slums, improving conditions andreducing overcrowding. But the evidence suggests that there are underlying trends whichpoint to renewed housing shortages – with consequent impacts on house prices, conditions,overcrowding and homelessness.
Many areas suffer as a result of falling housing demand. Investment is needed not only toencourage growth in the number of households seeking accommodation but to relieve poorconditions and to buttress the range of other regeneration initiatives needed to revive thefortunes of the most disadvantaged neighbourhoods. Here, however, we address thecontrasting problem of the areas where the economy is strongest and, consequently, thoseplaces where housing demand is greatest.
The consequences of housing shortagesIn the areas of highest demand the supply of extra homes has not kept pace. This paperargues that this imbalance is destined to worsen. When far fewer homes are available thanare required, the effects are felt by those:
• Looking for somewhere to live – through the higher prices and market rents that they mustpay.
• Unable to take up employment opportunities because they cannot afford to live withinreach of the job on offer.
• Who have to commute long distances between their job and a home they can afford.
• Who are well housed but who feel the effects in high prices and lower quality services –like transport and health – which result from problems of recruiting and retaining staff.
• With mortgages who are hit by higher interest rates when these are used to damp-downinflationary price rises; (in the long-term it is improbable that falling interest rates willcoexist for sustained periods with rising house prices, as in the current situation).
8 Tackling disadvantage:Housing More shortages and homelessness?Richard Best
▲ 11
▲ 98
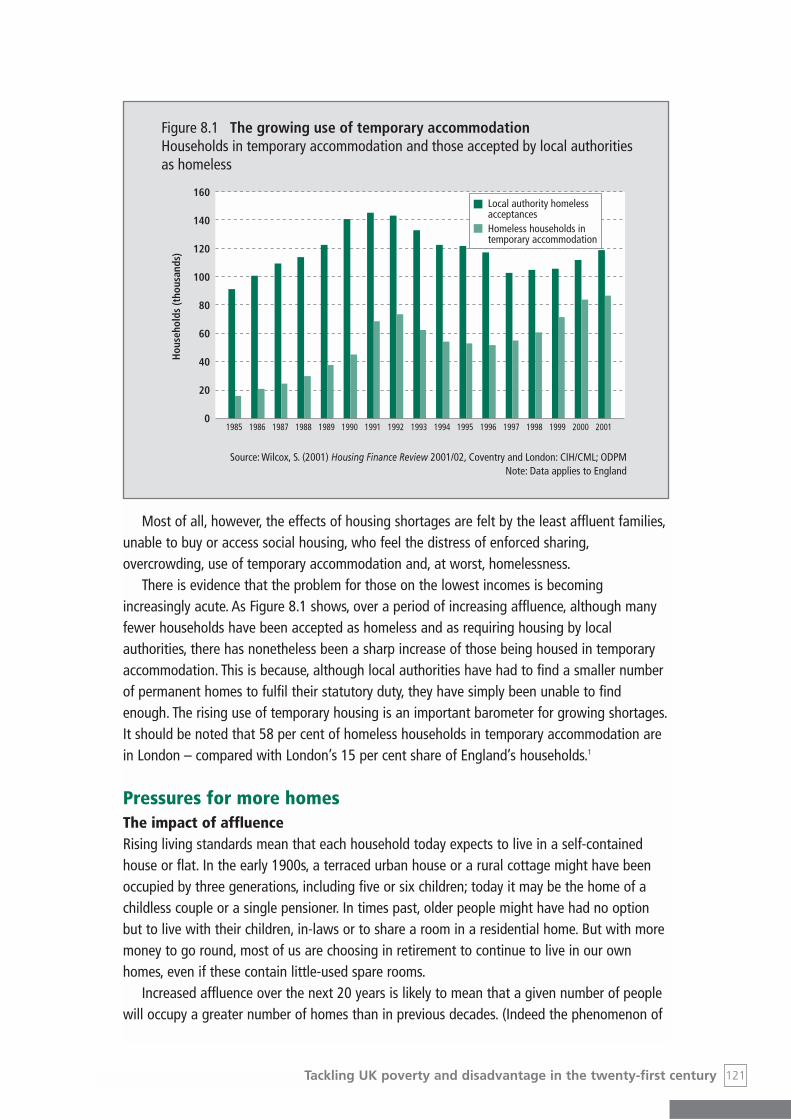
Most of all, however, the effects of housing shortages are felt by the least affluent families,unable to buy or access social housing, who feel the distress of enforced sharing,overcrowding, use of temporary accommodation and, at worst, homelessness.
There is evidence that the problem for those on the lowest incomes is becomingincreasingly acute. As Figure 8.1 shows, over a period of increasing affluence, although manyfewer households have been accepted as homeless and as requiring housing by localauthorities, there has nonetheless been a sharp increase of those being housed in temporaryaccommodation. This is because, although local authorities have had to find a smaller numberof permanent homes to fulfil their statutory duty, they have simply been unable to findenough. The rising use of temporary housing is an important barometer for growing shortages.It should be noted that 58 per cent of homeless households in temporary accommodation arein London – compared with London’s 15 per cent share of England’s households.1
Pressures for more homesThe impact of affluenceRising living standards mean that each household today expects to live in a self-containedhouse or flat. In the early 1900s, a terraced urban house or a rural cottage might have beenoccupied by three generations, including five or six children; today it may be the home of achildless couple or a single pensioner. In times past, older people might have had no optionbut to live with their children, in-laws or to share a room in a residential home. But with moremoney to go round, most of us are choosing in retirement to continue to live in our ownhomes, even if these contain little-used spare rooms.
Increased affluence over the next 20 years is likely to mean that a given number of peoplewill occupy a greater number of homes than in previous decades. (Indeed the phenomenon of
121Tackling UK poverty and disadvantage in the twenty-first century
Figure 8.1 The growing use of temporary accommodationHouseholds in temporary accommodation and those accepted by local authoritiesas homeless
160
140
120
100
80
60
40
20
0
Source: Wilcox, S. (2001) Housing Finance Review 2001/02, Coventry and London: CIH/CML; ODPMNote: Data applies to England
Hou
seho
lds
(tho
usan
ds)
1985 1986 1987 1988 1989 1990 1991 1992 1993 1994 1995 1996 1997 1998 1999 20012000
Local authority homelessacceptancesHomeless households intemporary accommodation

second homes might in future impose further strains.) While the majority continues to growricher, continuing to give high priority in their spending to securing the home they desire, thegap between the well-housed majority and those lacking a decent home could widen.
The impact of demography It is the number of households – not the number of people – that determines how many homes the nation requires. Figure 8.2 (taken from the Government’s 1996-based householdprojections) shows that household numbers are projected to continue to rise relentlessly to 2021.
122 Tackling UK poverty and disadvantage in the twenty-first century
Figure 8.2 Projected number of households in England and Wales 2001–21
26.0
25.5
25.0
24.5
24.0
23.5
23.0
22.5
22.0
21.5
21.0
Source: DETR (1999) Projections of Households in to England 2021; National Assembly for Wales
Mill
ion
2001 2006 2011 2016 2021
Figure 8.3 More older peopleProjected increase of population aged 60–74 and 75+ (2001–21)
18
16
14
12
10
8
6
4
2
0
Source: GAD (2001) 2000-based Population Projections for theUnited Kingdom and constituent countries, London: GAD
Per
cent
2001 2006 2011 2016 2021
Aged 60–74Aged 75+

There are three key reasons for the continuing increase in household numbers:
• Longer lives: Despite the lower birth rate, longer life expectancy means that natural growth– the excess of births over deaths – will continue to be positive. While houses often usedto be vacated following the death of their occupiers in their 60s, in the years to come moreand more residents will still be there in their 80s.
• More singles: Patterns of family life have changed: more people are becoming partners andparents later in life, or not at all, and more are divorcing and separating. This generateslarger numbers of working age single-person households – mostly amongst those over 25years old who cannot be expected to remain in their parental homes. Projections suggestthat these trends will continue over the next 20 years. Whilst over 60 per cent of singleperson households are projected to be people under 65, there will continue to be largenumbers of older single people, especially formerly married women.
• International migration: The total number of people living in the UK grows whenever thereare more inward migrants than people leaving the country. Although the global movementof people and jobs involves large numbers of UK citizens moving overseas, the movementoverall is an inward one. International inward migration is a significant contributor topopulation growth. This is supplemented by refugees and those seeking asylum who arefleeing from violence and oppression in other countries. Recently, the Government Actuary’sDepartment increased its figures for net inward migration to the UK from 95,000 to135,000 people per year for the period to 2021.
None of these demographic changes need be seen in a negative light:
• Most of us want to live longer lives than our predecessors. And few of us – older oryounger – want to share our homes all the time with other generations.
123Tackling UK poverty and disadvantage in the twenty-first century
Figure 8.4 Projected change in household make-up1996–2021
Source: DETR (1999) Projections of Households in England 2021Notes: Data applies to England
Thousands
–1000 –500 0 500 1000 1500 2000 2500
Couples under 65
Single person householdsaged under 65
Couples over 65
Single person householdsaged over 65
Lone parent households

• The growth in the number of single person households is important to the ‘urbanrenaissance’ agenda that requires the spending power and vitality that this group can bringto inner urban areas.
• International inward migration of younger households will redress some of the imbalancesfound in an ageing population (with the Japanese experience testifying to the problems ina country that has almost no immigration). New people are required for essential services,including doctors and health workers, and to sustain our economic growth, not least in theICT sector. Furthermore, immigrants bring the cultural diversity that can invigorate andstimulate city life.
124 Tackling UK poverty and disadvantage in the twenty-first century
Figure 8.5 More single person householdsChanging proportion of population living in single person households by age andgender (1971–2021)
16
14
13
10
8
6
4
2
0
Source: Office for National Statistics (2001) Social Trends, London: The Stationery Office
Per
cent
livi
ng in
sin
gle
pers
on h
ouse
hold
s
1971 1981 1991 2001 2011 2021
Males aged under 65
Females aged under 65
Males aged 65 and over
Females aged 65 and over
Figure 8.6 Projected annual net inward migration to the UK (1998–2021)
180
160
140
120
100
80
60
40
20
0
Source: GAD (2001) 2000-based Population Projections for the United Kingdom and Constituent Countries;GAD (1999) 1998-based Population Projections, London: GAD
Thou
sand
s
1998–2001 2001–2006 2006–2011 2011–2016 2016–2021
2000 based projections1998 based projections

Nevertheless, however positive these demographic trends, housing policies have to keep upwith them.
How many new homes are needed?Household projections, based on 1998 figures from the Government Actuary’s Department andpast trends in household formation, suggest that between 1996 and 2021, England will needto accommodate an extra 4.3 million households.2
However, this figure relates only to the additional households created in the period to2021. It makes no allowances for the new homes needed to meet the backlog of existing needfor groups including:
• Households in bed and breakfast and other temporary accommodation where localauthorities have accepted them as homeless.
• Concealed families and households forced to share.
• Would-be couples who are having to live apart.
• Hostel residents.
• Homeless people sleeping on the streets.
Estimates suggest that the backlog in 1996 was approximately 650,000 households.3 It seemslikely that the figure has increased over the last five years because supply has not matcheddemand.
There are several other factors to take into account when projecting the requirements forhouse building:
• Demolitions The current rate of demolition is approximately 16,000 homes per year.4 Whilstthis rate is low in historical terms, the desirable rate is probably higher. Clearly all homesthat are demolished need to be replaced to keep in touch with the housing target.
• Conversions and changes of use Overall, more conversions increase the number of homes(e.g. a single family house converted into two flats) than lead to a reduction (e.g. two flatsconverted into one): the net gain per annum is estimated at 12,700 homes.5
• Secondary residences Second homes must be accounted for when comparing the number ofdwellings with household population. In the UK the numbers are relatively low – around230,000 homes or 1 per cent of the total – and do not appear to be growing.6
• Vacant dwellings The Empty Homes Agency estimates that there are over 750,000 emptyhomes in England. If more empties could be permanently re-occupied there would be acorresponding reduction in the requirement for new homes. However, whilst estimates varyas to the amount that have been filled over the past decade, to date the problem hasproved resistant to any lasting solution.
In Housing Demand and Need in England 1996–2016 7 newly arising need for additionaldwellings was put at about 225,000–230,000 a year in England alone. Since those estimateswere published, further work by Alan Holmans for the Joseph Rowntree Foundation suggeststhat the 1998-based household projections, and the official 1996-based projections fromwhich they were derived, over-stated the number of households relative to the population.8
125Tackling UK poverty and disadvantage in the twenty-first century
126 Tackling UK poverty and disadvantage in the twenty-first century
The official estimates of households in 1999 were likely to be too high, by around 150,000: themost likely reason is that recent inward migrants are less likely to form separate householdsthan the population as a whole.
Working in the opposite direction is the new and higher 2000-based population projectionspublished by the Government Actuary’s Department late in 2001. In the medium term, netinward migration to the UK is assumed to run at 135,000 a year, compared with 95,000 a yearin the 1998-based projections.
The estimate of the annual net increase in households that takes account of the 2000-based population projections is 160,000, which implies that newly arising need for additionaldwellings, will be about 210,000 a year.
If we look at output from the house building industry and from the social housingproviders, we see a yawning gap opening up for the 20 years ahead. Taking an average outputin England of 154,000 9 homes over the last five years, and rolling this forward, the shortfallaccumulates at some 56,000 homes a year. This suggests a shocking gap of over 1.1 millionhomes 20 years hence, in England alone.
With the problem disproportionately concentrated in particular areas – particularly thosewithin London’s travel-to-work area – the picture is one of impending crisis.
The Deputy Prime Minister’s statement, following the Chancellor’s Spending Review in2002, indicates an acceptance of the nature and scale of these problems. There is now a publiccommitment to narrow the gap between demand and supply in the South-east, targetingpotential growth areas and taking a firm stance on unnecessary planning restrictions (whilesimultaneously boosting housing market renewal efforts in the northern urban areas). But thischapter argues that major increases in the supply of affordable homes are extremely unlikelywithout the underpinning of adequate subsidy for production. It is by no means certain thatthe amounts of additional funding so far announced for the early 2000s will be sufficient tohead off the impending, deep-seated crisis of housing shortage and homelessness.
The impact of geographySimply counting numbers of households and numbers of homes, across the country, revealsonly a partial picture. Where the people and the homes are located is all-important. If morepeople need or want to live in an area than there are homes to go round, housing shortageswill appear in that place – even if there are vacant homes at the other end of the country.
The next 20 years is likely to witness a continued polarisation between areas. This hascreated places – particularly in parts of our major conurbations – where the stock of housingalready exceeds the demand and is likely to continue to do so even if policies are successful inimproving the economy of these places. The housing issues in these areas of low demand arenot only about housing investment to support the process of reversing decline, but aboutfacing up to the obsolescence of some neighbourhoods, with demolition or clearance ofcertain estates and streets, and the ‘management of decline’.
Contrary to popular perception, however, the problems of high demand areas – mostprominently the South-east – are not caused principally by mass migration from North toSouth. Those who have left the urban centres of the Midlands and the North have seldommoved far, and have created pressures on the countryside and services in their own regions.Nevertheless, the UK’s housing problems do have a strong regional dimension.

Southern EnglandAlthough all regions are expected to see growth in household numbers, the greatest pressurewill continue to be felt in Southern England (i.e. London, the South-east, South-west, andEastern regions). For example, the population of the South-east region alone is expected toincrease by 50,000 a year – about 1 million extra homes in the twenty years to 2021.10
Table 8.1 shows that the spatial pressures on the South in the 1990s came principally from:
• Migration out of London, since the capital city – just like the six major conurbations to thenorth – sees more UK citizens moving out than moving in each year. This net internalmigration from London accounted for 50 per cent of the increase in population in theSouth of England.11
• Natural growth (i.e. more births than deaths), which accounted for 25 per cent of thepopulation change in the southern regions.
• The excess of international inward migration over internal outward migration from theregions (19 per cent).
Only eight per cent of the change is attributable to net internal migration from the North andMidlands and from Wales, Scotland and Northern Ireland.
LondonLondon is a special case. Although on average about 50,000 more people leave London thanmove in from elsewhere in the UK each year, these population losses are balanced by fargreater net inward international migration than for other areas. Those moving in from othercountries include extremes of rich and poor, fuelling central London house prices on the onehand and the need for social housing on the other. As well as top financiers and professionals
127Tackling UK poverty and disadvantage in the twenty-first century
Table 8.1 Where the extra people in the South are coming fromPopulation change in the South of England outside London 1991–98
Number Annual percentage(thousands) average
Natural change (births minus deaths) +183 +26 25Internal Migration (net) from North and Midlands and Wales,Scotland and Northern Ireland +61 +9 8Internal migration (net) from London +370 +53 50International migration (net) +137 +20 19Other changes –16 –2 –2Total population change +735 +105 100
Source: Bate, R., Best, R. and Holmes, A. (eds) (2000)On the Move: The housing consequences of migration, York; Joseph Rowntree Foundation/YPS

from all over the world, the London Boroughs are currently accommodating over 50,000people seeking asylum.12
So, although London’s pattern of ‘urban exodus’ is similar to that of the other big cities, itslosses are replenished in a way that seldom occurs elsewhere. At the same time, the youngerpopulation of London demonstrates a disproportionately high rate of natural populationgrowth (i.e. births minus deaths), making for an overall expansion in the city’s population.
It seems likely that with the sustained growth of London as a world city, and the compoundeffect of natural change and international inward migration, the pressures recorded for the1990s will become more acute over the next 20 years.
The increased demand for housing, especially in certain areas, will lead to acute shortagesunless housing supply problems are tackled. It is to this potential shortage that we now turn,but there is an additional issue of solving outstanding problems of poor quality housing. This isdiscussed in the box ‘Housing conditions’.
128 Tackling UK poverty and disadvantage in the twenty-first century
Housing conditions
The problemsAlthough housing conditions in the UK have improved steadily throughout the century, thenumber of homes that are unfit or in serious disrepair remains stubbornly high. Homes inpoor condition are hazardous; cold and damp buildings are bad for health; poorly heatedand insulated houses lead to ‘fuel poverty’, with occupiers spending disproportionately onkeeping warm. They also contribute to wasteful energy consumption.
There are problems of poor condition in all tenures: in numerical terms, the majority ofunfit homes are found in the owner-occupied sector. These occupiers are likely to be poor,and the majority are elderly, finding it hard to pay for maintenance and essential repairs.13
Although local authorities have the powers to make renovation grants available to home-owners, in practice these are hard to obtain. While numerically much smaller, the privaterented sector has much the largest proportion of its properties in poor condition (with
Table 8.2 Where the extra people in London are coming fromPopulation change in London 1991–98 (thousands)
Total Annual average
Natural change (births minus deaths) +273 +39Internal migration (net) from London –337 –48International migration (net) +335 +48Other changes +26 +4Total population change +297 +42
Source: Bate, R., Best, R. and Holmans, A. (eds) (2000) On the Move: The housing consequences of migration, York: Joseph Rowntree Foundation/YPS.
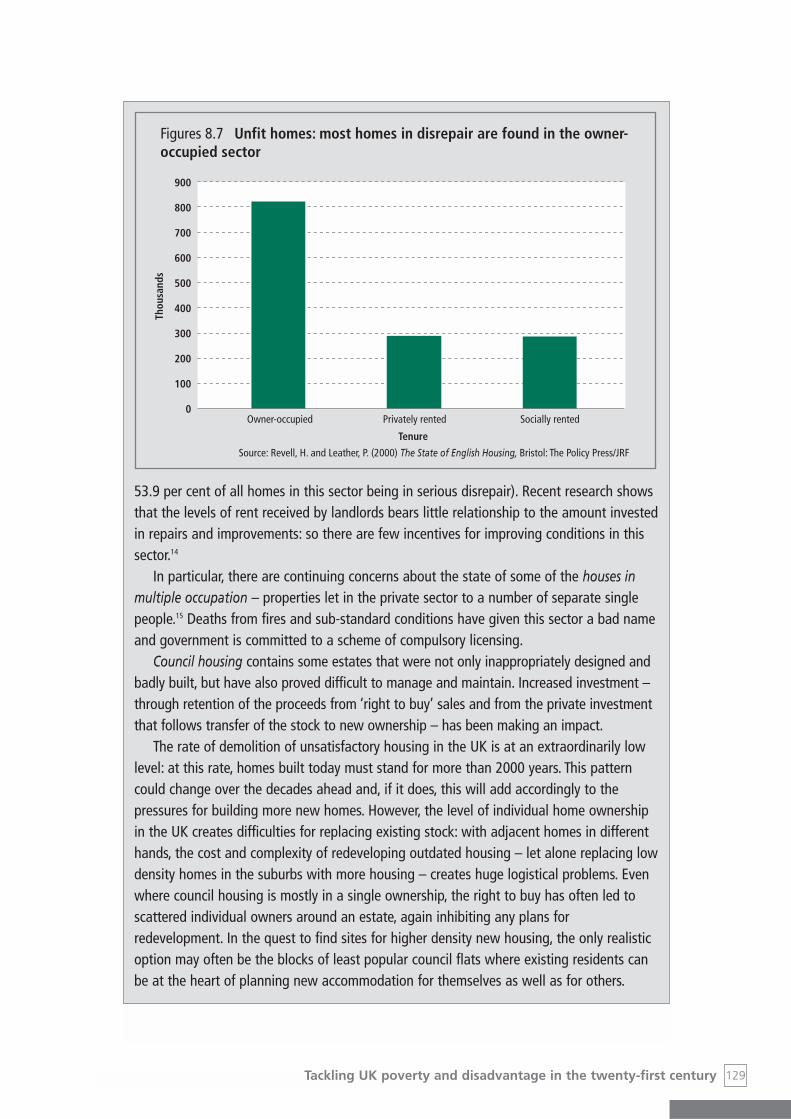
129Tackling UK poverty and disadvantage in the twenty-first century
53.9 per cent of all homes in this sector being in serious disrepair). Recent research showsthat the levels of rent received by landlords bears little relationship to the amount investedin repairs and improvements: so there are few incentives for improving conditions in thissector.14
In particular, there are continuing concerns about the state of some of the houses inmultiple occupation – properties let in the private sector to a number of separate singlepeople.15 Deaths from fires and sub-standard conditions have given this sector a bad nameand government is committed to a scheme of compulsory licensing.
Council housing contains some estates that were not only inappropriately designed andbadly built, but have also proved difficult to manage and maintain. Increased investment –through retention of the proceeds from ‘right to buy’ sales and from the private investmentthat follows transfer of the stock to new ownership – has been making an impact.
The rate of demolition of unsatisfactory housing in the UK is at an extraordinarily lowlevel: at this rate, homes built today must stand for more than 2000 years. This patterncould change over the decades ahead and, if it does, this will add accordingly to thepressures for building more new homes. However, the level of individual home ownershipin the UK creates difficulties for replacing existing stock: with adjacent homes in differenthands, the cost and complexity of redeveloping outdated housing – let alone replacing lowdensity homes in the suburbs with more housing – creates huge logistical problems. Evenwhere council housing is mostly in a single ownership, the right to buy has often led toscattered individual owners around an estate, again inhibiting any plans forredevelopment. In the quest to find sites for higher density new housing, the only realisticoption may often be the blocks of least popular council flats where existing residents canbe at the heart of planning new accommodation for themselves as well as for others.
Figures 8.7 Unfit homes: most homes in disrepair are found in the owner-occupied sector
900
800
700
600
500
400
300
200
100
0
Source: Revell, H. and Leather, P. (2000) The State of English Housing, Bristol: The Policy Press/JRF
Thou
sand
s
Owner-occupied Privately rented Socially rented
Tenure

130 Tackling UK poverty and disadvantage in the twenty-first century
There is also a race dimension to the problems of house condition: in many localities, thereare concentrations of houses – often pre-1919 terraces – in the worst conditions that areoccupied principally by ethnic minority groups. Very poor housing conditions are adding toother tensions and inequalities in these neighbourhoods, making investment in homeimprovements – for owners, for private landlords, and for registered social landlords whobuy and renovate such properties – a much higher priority.
In times past, Improvement Grants have been used to persuade owner occupiers andprivate landlords to bring their homes up to modern standards. But such untargetedsubventions are out of favour and few local authorities are keen to use precious resourcesfor this purpose. This inhibits the important work of home improvement agencies – ‘Careand Repair’ and ‘staying Put’ schemes – which assist poorer, usually older, owners toimprove their properties.
However, opportunities exist in areas where property prices are at or above averagelevels to release some of the equity to pay for home improvements. Over the years ahead,more sophisticated financial instruments should be devised for this purpose.
Where whole areas suffer from low demand, modernising unsound individual houses isunlikely to address the underlying problem. Area-based regeneration initiatives that raisethe quality of the whole neighbourhood will be required, in harness with measures toimprove the economy. Housing associations and regeneration agencies, based on localpartnerships, will often be at the centre of these initiatives. But Joseph RowntreeFoundation research, looking at areas of Birmingham that have been subject to investmentin property improvements, has shown that investment in improved conditions is noguarantee of long-term regeneration for a neighbourhood.16
Figure 8.8 Demolitions of dwellings in England 1969–1996
120
100
80
60
40
20
0
Source: Revell, H. and Leather, P. (2000) The State of English Housing, Bristol: The Policy Press/JRFDTLR (2001) Housing Statistics 2001, London: The Stationery Office
Notes: 1969–74 data applies to Great Britain, afterwards to the UK.Data up to 1972 is for calendar years; after 1982 for financial years.
Thou
sand
s
1973
1982
1983
1984
1985
1986
1987
1988
1989
1990
1991
1992
1993
1994
1995
1996
1972
1971
1970
1969
1974
1975
1976
1977
1978
1979
1980
1981
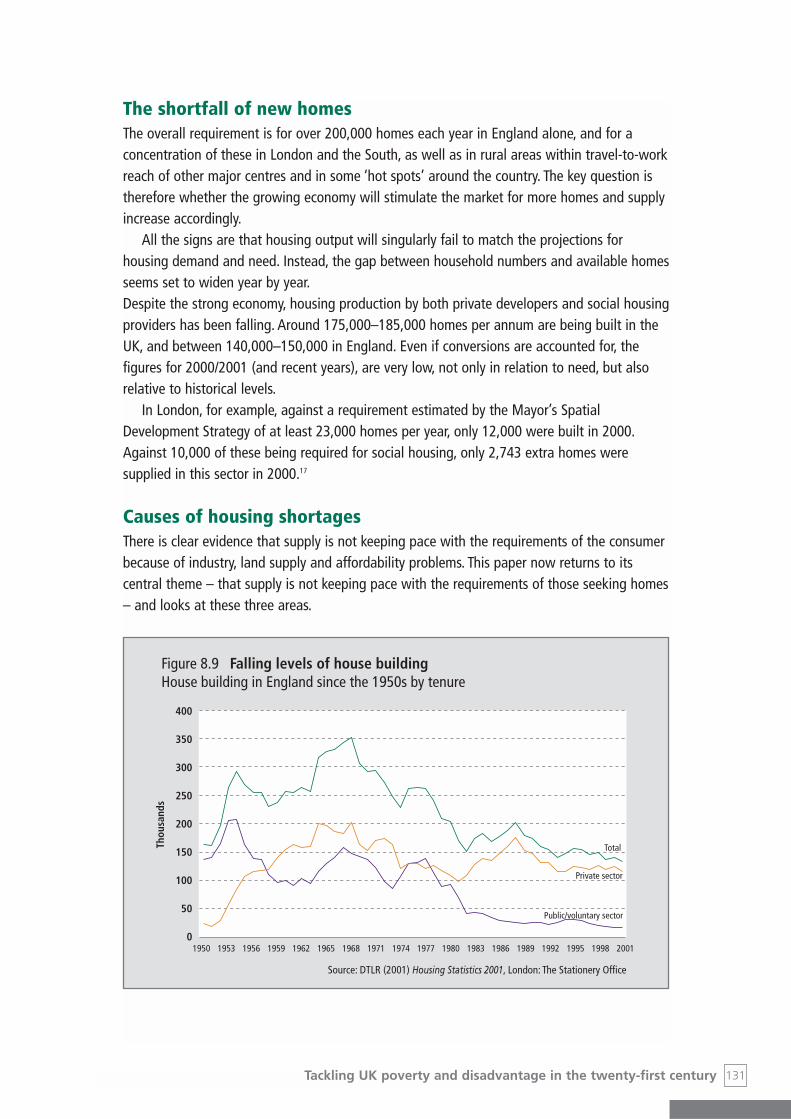
The shortfall of new homes The overall requirement is for over 200,000 homes each year in England alone, and for aconcentration of these in London and the South, as well as in rural areas within travel-to-workreach of other major centres and in some ‘hot spots’ around the country. The key question istherefore whether the growing economy will stimulate the market for more homes and supplyincrease accordingly.
All the signs are that housing output will singularly fail to match the projections forhousing demand and need. Instead, the gap between household numbers and available homesseems set to widen year by year.Despite the strong economy, housing production by both private developers and social housingproviders has been falling. Around 175,000–185,000 homes per annum are being built in theUK, and between 140,000–150,000 in England. Even if conversions are accounted for, thefigures for 2000/2001 (and recent years), are very low, not only in relation to need, but alsorelative to historical levels.
In London, for example, against a requirement estimated by the Mayor’s SpatialDevelopment Strategy of at least 23,000 homes per year, only 12,000 were built in 2000.Against 10,000 of these being required for social housing, only 2,743 extra homes weresupplied in this sector in 2000.17
Causes of housing shortagesThere is clear evidence that supply is not keeping pace with the requirements of the consumerbecause of industry, land supply and affordability problems. This paper now returns to itscentral theme – that supply is not keeping pace with the requirements of those seeking homes– and looks at these three areas.
131Tackling UK poverty and disadvantage in the twenty-first century
Figure 8.9 Falling levels of house buildingHouse building in England since the 1950s by tenure
400
350
300
250
200
150
100
50
0
Source: DTLR (2001) Housing Statistics 2001, London: The Stationery Office
Thou
sand
s
1950 1953 1956 1959 1962 1965 1968 1971 1974 1977 1980 1983 1986 1989 1992 1995 1998 2001
Total
Private sector
Public/voluntary sector

Industry problemsThere are difficulties within the UK construction industry to which attention has been drawnby the Latham and Egan reports.18 Structural, technical and cultural change in the years aheadmay lead to a sector better able to respond to the demands upon it. Pre-fabricated homes –built in clean, efficient, factory conditions not in the often chaotic circumstances ofconstruction sites, in unpredictable and inclement British weather – may make for higherstandards as well as a safer industry.19 Better procurement methods may mean less frictionbetween clients, professionals and builders. Shortages of sufficiently skilled labour20 may alsobe remedied, to some extent, by factory-building techniques; and government policies for skillsand training may well make a difference.
Land supplyOf huge significance in constraining new house building, are the controls over the supply ofland, largely dictated by the planning system. House builders claim that the planning system isfailing to release sufficient sites, and is thereby fuelling shortages and inflation of houseprices. Government has promised a review of the planning system,21 but the underlyingproblem remains the widespread and vociferous opposition to almost any development bythose already well-housed.22
In recent years, it has been not only those who wish to protect the countryside on groundsof amenity and aesthetics who have led campaigns against development, but also thoseconcerned with environmental issues, like the impact of CO2 emissions from traffic pollution,and the need to preserve natural habitats and bio-diversity. This powerful combination ofemotion and scientific opinion seems likely to continue to buttress the natural opposition to allnew housing that comes from those living near it – and their elected representatives.
Support from the planners and the public is much easier to obtain for development on‘brownfield’ recycled land. But these sites tend to be available where housing demand is low –
132 Tackling UK poverty and disadvantage in the twenty-first century
Figure 8.10 The house building gap in LondonHouse building in London and the Mayor’s target
25
20
15
10
5
0
Source: FPD Savills (2001) UK Residential Research Bulletin
Thou
sand
s
1990 1991 1992 1993 1994 1995 1996 1997 1998 1999 2000
Total housing target
Affordable housing target
Private housing completionsSocial housing completions

e.g. in the older industrial cities – or where substantial expenditure is required before it can beput to use.
House builders make much of their profit from the enhanced value of the land they buywhen it receives planning consent and is developed; such gains are harder to achieve onurban sites where prices are already at – or even above – development value.
AffordabilityFinally, there are the constraints of affordability for purchasers or tenants. Even if the housebuilding industry was to operate much more effectively in meeting the demands from thosewith reasonable incomes, the market cannot cater for those without any (or sufficient)resources to pay their way.
Subsidies to providers can mean homes produced at lower than market cost to the occupier(e.g. Social Housing Grant to registered social landlords). Alternatively, subsidies can go toindividual occupiers to bridge the gap between what they can afford and the cost to them ofrenting or buying (e.g. Housing Benefit for tenants or Income Support for Mortgage Paymentsfor owners). Lack of subsidy is the most direct influence on the production line for affordablehousing. But both producer subsidies and personal subsidies have diminished over recentyears.
Reductions in subsidies for housing production – which used to go to local authorities andnow go to housing associations – explain the overall drop in the supply of additional homes.Private sector house builders may be operating at a somewhat lower level than in the past,but the difference is not dramatic: the factor that makes the real difference to the total figuresfor new homes is the massive decline in the supply of public/social housing.
It is unrealistic to expect private sector house builders to accelerate their output muchabove the levels they have averaged in more productive times. Share prices of those house
133Tackling UK poverty and disadvantage in the twenty-first century
Figure 8.11 Falling levels of housing supportGovernment support for housing costs 1986/7–2000/1 adjusted to 1999/2000 prices
35
30
25
20
15
10
5
0
Source: S. Wilcox (2001) Housing Finance Review 2001/02, Coventry and London: CIH/CML
£ bi
llion
s
1986
/87
1987
/88
1988
/89
1989
/90
1990
/91
1991
/92
1992
/93
1993
/94
1994
/95
1995
/96
1996
/97
Total assistance to individualsTotal assistance to production
1997
/98
1998
/99
1999
/2000
2000
/01

builders who hold land banks and are not pulling out all the stops to develop them, tend to behigher than for those companies who are not sitting on land holdings. Lower output by housebuilders has not damaged profitability. Even though house builders might be encouraged tostep up their output to the level of their better years – not least by more streamlined planningdecisions – this is unlikely to make a major impact on the housing deficit.
The only prospect of returning to much higher levels of house building overall comesthrough the re-introduction of a much bigger stream of supply of subsidised housing.(Currently that means supply through the registered social landlords, although in theory itcould embrace other providers with access to subsidy.)
Changing our perceptionsIf every household is to have the opportunity of a decent home, some fundamental changes willbe needed, not just to the mechanisms we use to deliver new homes, but also to our planningsystem and our house-building industry in order to make both more effective. To enable thesechanges, we need to address our collective attitudes to certain problems that we face.
Greenfield sites: facing the truthFirst, there needs to be a recognition that it is of the greatest importance to the nation’s futurehealth and happiness that a plentiful supply of new homes is facilitated. Only on a very short-term basis do we gain from preventing the new homes being built that are urgently needed.The house-building process, by reducing artificial shortages and moderating their inflationaryimpact, brings benefits for the whole of society.
134 Tackling UK poverty and disadvantage in the twenty-first century
Figure 8.12 Private sector and social housing output in England
200
180
160
140
120
100
80
60
40
20
0
Source: ODPM <http: //www.housing.odpm.gov.uk/statistics/
Thou
sand
s
1950s 1960s 1970s 1980s 1990s
Private sector
Public/voluntary sector

We recognise that enhanced design and quality would help this general turnaround in ourperception that new housing is undesirable.23 Although new homes are better sited onbrownfield urban sites as far as possible, there must be acceptance that not all of the homesof tomorrow can be built on recycled land. Even if the government’s target of 60 per cent ofnew homes on such sites is realised, over one and a half million more homes will still need togo on greenfield land over the next two decades.
Urban living: recognising the value Second, our attitudes to urban living will need to change over the years ahead. For asustainable future, with sufficient homes for every household, we need to rediscover thepositive aspects of urban living. The role of area regeneration and neighbourhood renewal,underpinned by employment opportunities, is important in preventing the migration of peopleout of our older urban areas. But even where there is a strong local economy, the nationalantipathy to living in towns and cities is preventing us from making good use of our urbanfabric and infrastructure.
In the years ahead, the attractions of a city lifestyle may become more apparent to singleperson households and childless couples for whom there are fewer worries about schools orchild safety. London – which remains as fashionable and popular a place to live as ever,despite the inherent hazards of metropolitan living – can set the pace. Development outwardsfrom the city centres of conurbations like Birmingham, Manchester and Leeds hints at thepossibilities for the elusive ‘urban renaissance’. But sustained urban renaissance depends onthe inner ring of suburbs being attractive to families, as well as the centres of conurbationsbeing attractive to single people or childless couples.
Increasing supplyUrban extensionsIn facing up to the necessity of new homes on greenfield sites, there is growing agreementthat the most effective approach takes the form of urban extensions.24 Such developments pluginto the public transport routes and the existing schools, shops and facilities, much reducingthe likely congestion and pollution of commuter traffic. By undertaking house building on asufficient scale – with several hundred homes – highly significant ‘planning gains’ can benegotiated with landowners: reductions in the land price can then help to fund affordablehousing and community amenities. This approach lends itself to the use of a Master Plan thatengages the local authority creatively in the process of achieving sustainable designs andtraffic taming. By concentrating new development in major schemes of this kind, the need fordozens of small and unsuitable extra schemes – or for free-standing communities that are setin countryside elsewhere, with adverse environmental impacts – are avoided.25
Urban development: making it happenAfter years of population loss from the major urban areas, attracting and retaining populationin these places will only become a reality if there is considerable public and privateinvestment. The various recommendations made by Lord Rogers’ Urban Task Force could helpthis process, including:
135Tackling UK poverty and disadvantage in the twenty-first century

• The importance of reclaiming and re-using urban land. Interventions, positive and negative,such as tax incentives, compulsory purchase orders and brownfield focussed planningguidance, are the only way we will meet the 60 per cent target of building on brownfieldsites. A significant element of vacant brownfield land is owned by private sector industries,including the former public sector utilities. In some cases, these bodies are inclined to delaythe release of land for future housing or mixed-use development because of inertia or lackof external pressure: use of CPO powers – perhaps through English Partnerships orRegional Development Agencies – can prevent this land remaining unused for furtherlengthy periods. Capturing such sites presents special opportunities for the master-planningof mixed tenure new communities, often with a not-for-profit organisation as the leadagency in a development partnership.
• The opportunities created by higher densities. This approach, without sacrificing publicgreen spaces, often represents the best way of ensuring a sustainable and viable mixed use environment.
• The potential, in high value areas, for higher buildings. These can help the better-off singleand childless households, rather than poorer families as was tried – usually unsuccessfully– in the 1960s and 1970s and can fit more homes into the same space.
• More redevelopment will be necessary. Much of the land for meeting tomorrow’s housingrequirements may need to come from recycling the low density, or less popular sites ofexisting housing, both unloved public sector estates and deteriorating, low-rise suburbs.Organising the ‘intensification’ of development in such areas – including some demolition andreplacement – provides opportunities for engaging with existing residents in designing thenew communities and will present major challenges for housing policy over the next 20 years.
• The re-utilisation of empty properties and conversion of out-moded industrial and officebuildings. This may need more measures – such as comparable VAT rates to new housebuilding – than those announced to date if we are to really address the 1.3 million emptyproperties that offer an important alternative to large-scale greenfield development.
Harnessing private sector resourcesMuch of the funding for tomorrow’s housing could come from the private sector, if conditionsare right. The Joseph Rowntree Foundation has invested in two ‘CASPAR’ developments ofCity-centre Apartments for Single People at Affordable Rents (in Leeds and Birmingham). Thesedemonstrate that private investment in residential lettings can attract people back to the innercity while achieving very satisfactory returns, if the design targets middle income singlepeople.26 If even a fraction of the institutional investment that has been flowing intocommercial developments took up the emerging opportunity in the residential sector, this formof unsubsidised urban regeneration would gather momentum.
Positive planningIn fulfilling the requirements of the future for both greenfield and brownfield development,there is an urgent need for ‘positive planning’. Planning authorities – their elected members
136 Tackling UK poverty and disadvantage in the twenty-first century
and officers – need to take the bold step away from reacting, often negatively, to proposalsfrom developers and housing associations. They must work pro-actively with centralgovernment, regional bodies and their own colleagues with housing responsibilities at thelocal level: they are at the centre of ensuring the massive task of meeting national needs anddemand while ensuring the minimum environmental damage.
Intermediaries and partnershipsFew planning authorities still have the confidence and the skills to prepare Master Plans in-house. As a nation, we have become dependent upon private sector developers bringingforward their plans, with the role of planning authorities demoted to that of criticisingproposals. It is unrealistic to expect the statutory planners to revert quickly to a role of boldmaster-planning on behalf of their communities. But reliance on private developers and housebuilders – whose expertise and financial interests lie in building for outright sale, not creatingcommunities of mixed incomes and mixed tenures or of incorporating community facilities andpublic space that will require management for many decades to come – would seeminappropriate.
Regional agencies and local authorities need partners to produce Master Plans, inconsultation with local communities, and to see that these are executed. House building forsale is likely to be a major part of any such Master Plan; and private house builders haveconsiderable expertise in building to fixed costs and marketing their products. But the longterm interests of a newly built community (and its neighbours) would seem better served bybringing in different intermediary bodies. Some of the major housing associations andcharitable foundations are working in partnership with local authorities to prepare MasterPlans and see through their delivery, including the rented homes, the public space and thelocal facilities. This approach can involve genuine and extensive local consultation, the activeengagement of the local planning authority in the process, and a long-term commitment tosustaining the new development into the indefinite future.
AffordabilityHouse prices and market rents would be affordable to a higher proportion of the population ifsupply was in balance with demand. Otherwise, even if incomes are increased or purchasersare given special grants, so long as there are the same number of homes to go round, then thecost of each will simply rise further. Help for poorer households – or for those chosen becausethey are working in a particular industry – will just displace those slightly better off. This is thedanger of such schemes as the new Starter Homes Initiative, if these give grants to some keyworkers but do not increase the total number of homes.
However, it is vital to ensure that housing associations achieve a mix of incomes in anynew development to guard against properties becoming stigmatised and occupiers becominglabelled. The single tenure, monolithic estate has had profound consequences throughout theUK. We now know about the consequences of separating and isolating those on low-incomesand the most disadvantaged, and must guard against it. Local cost home ownership, throughschemes such as Homebuy or shared ownership can achieve a mix of incomes on otherwiseall-rented estates, thereby ensuring against the occupiers being labelled and stigmatised, andcreating a more sustainable long-term development.27
137Tackling UK poverty and disadvantage in the twenty-first century
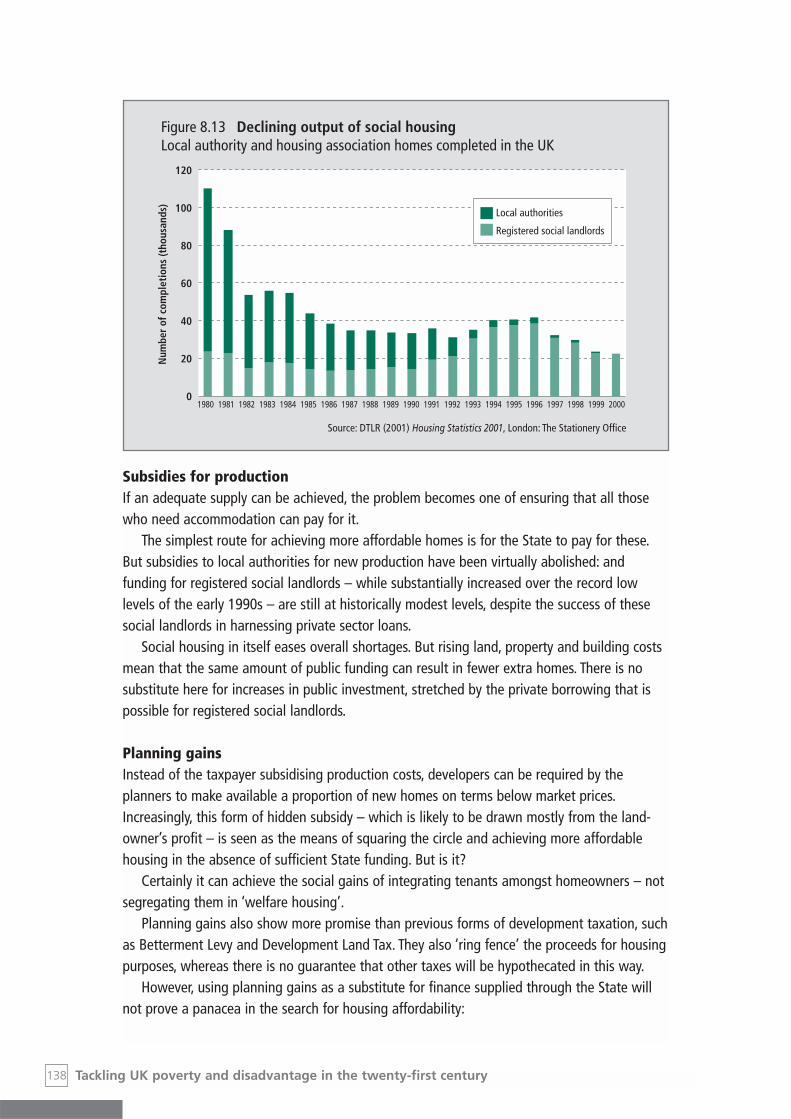
Subsidies for productionIf an adequate supply can be achieved, the problem becomes one of ensuring that all thosewho need accommodation can pay for it.
The simplest route for achieving more affordable homes is for the State to pay for these.But subsidies to local authorities for new production have been virtually abolished: andfunding for registered social landlords – while substantially increased over the record lowlevels of the early 1990s – are still at historically modest levels, despite the success of thesesocial landlords in harnessing private sector loans.
Social housing in itself eases overall shortages. But rising land, property and building costsmean that the same amount of public funding can result in fewer extra homes. There is nosubstitute here for increases in public investment, stretched by the private borrowing that ispossible for registered social landlords.
Planning gainsInstead of the taxpayer subsidising production costs, developers can be required by theplanners to make available a proportion of new homes on terms below market prices.Increasingly, this form of hidden subsidy – which is likely to be drawn mostly from the land-owner’s profit – is seen as the means of squaring the circle and achieving more affordablehousing in the absence of sufficient State funding. But is it?
Certainly it can achieve the social gains of integrating tenants amongst homeowners – notsegregating them in ‘welfare housing’.
Planning gains also show more promise than previous forms of development taxation, suchas Betterment Levy and Development Land Tax. They also ‘ring fence’ the proceeds for housingpurposes, whereas there is no guarantee that other taxes will be hypothecated in this way.
However, using planning gains as a substitute for finance supplied through the State willnot prove a panacea in the search for housing affordability:
138 Tackling UK poverty and disadvantage in the twenty-first century
Figure 8.13 Declining output of social housingLocal authority and housing association homes completed in the UK
120
100
80
60
40
20
0
Num
ber
of c
ompl
etio
ns (t
hous
ands
)
1981 1982 1983 1984 1985 1986 1987 1988 1989 1990 1991 1992 1993 1994 1995 1996 1997 1998 19991980 2000
Local authorities
Registered social landlords
Source: DTLR (2001) Housing Statistics 2001, London: The Stationery Office

• The system is characterised by major inconsistencies and is in danger of being discredited ifit becomes an instrument for too much delay, or suppresses legitimate developmentaltogether.
• Its value is dependent on the increase in land value that results from planning consent: thisoften cannot achieve more than a small proportion of the subsidy required in many areas.Even where it can, if the market falters this form of ‘taxation’ will drop and fewer homeswill result.
Personal subsidiesMortgage interest tax relief – which was costing the Exchequer £10 billion per annum 12years ago – has now been phased out. Spending on Housing Benefit has reduced considerablybecause of tougher rules and, more significantly, reductions in unemployment. Total spendingon personal subsidies to help people with their housing costs, therefore, has fallenconsiderably over the last decade.
However, not only is Housing Benefit in need of reform to reduce disincentives to work, butmany have argued for an extension of this safety net to home owners as well as tenants.Mortgage payment difficulties are a major cause of homelessness. Despite the currentlybenevolent economic environment, in recent years on average a thousand families have hadtheir homes repossessed by lenders every fortnight.28 The position could deteriorate muchfurther if the economy falters, or interest rates rise again.29
Rather than providing a tenure-neutral housing allowance for home owners as well astenants – which could also provide support with costs of urgent repairs and maintenance for(often elderly) owners without sufficient income – governments since 1991 have favoured aninsurance-based safety net for those with mortgages. This voluntary scheme of MortgagePayment Protection Insurance has had relatively low take-up and covers only about 21 per
139Tackling UK poverty and disadvantage in the twenty-first century
Figures 8.14 Falling personal housing subsidiesLevels of Housing Benefit and Mortgage Interest Tax Relief (1986/7–1999/2000).Total spending in real terms
14,000
12,000
10,000
8,000
6,000
4,000
2,000
0
Source: Wilcox, S. (2001) Housing Finance Review 2001/02, Coventry and London: CIH/CML
£ m
illio
n
1986
/87
1987
/88
1988
/89
1989
/90
1990
/91
1991
/92
1992
/93
1993
/94
1994
/95
1995
/96
1996
/97
1997
/98
1998
/99
1999
/2000
MITRHousing benefit

cent of those with mortgages (and just under 30 per cent of new borrowers).30 Even amongstthose who have taken out insurance risks still remain, since the cover does not includerelationship breakdown or reduced income. If it were compulsory, many of the presentproblems with MPPI would be diminished. Universality would spread risk dramatically andtherefore bring costs down, and it would enhance the regulation of policies that are atpresent, in many instances, inadequate. We do not see this scheme as a substitute for a moreuniversal ‘needs-related housing allowance’.
The introduction of the Working Families Tax Credit has served to reduce the numbers oftenant families who are dependent on Housing Benefit. By supplementing the incomes ofthose with low paid jobs there has been an indirect, positive attack on housing affordabilityproblems. But the separation of Housing Benefit from the tax credit arrangements – which aredue to be extended in 2003 – create serious disincentives to work. Integrated Housing Benefit(or a wider needs-related housing allowance) within the tax credit scheme could ensure that‘work pays’ for many currently deterred from getting a job.
ConclusionWe have concentrated on the issue of whether or not sufficient homes will be available wherethey are required, at prices that those who need them can afford. Our conclusion is that thisissue – crude housing shortage – may become one of the most significant social issues facingthe UK over the next 20 years. Although a sufficiency of housing does not guarantee thatevery household finds a home, if there is insufficient housing then many will certainly becompelled to share or become homeless.
Our conclusions are that demographic and economic factors will generate substantialdemand and need for additional accommodation, but that a matching supply is unlikely to beforthcoming. The shortages that can be predicted will lead to overcrowding and homelessness.They will also have significant knock-on effects for other groups too in the inflationaryconsequences that will inhibit economic growth and make it harder for good quality publicservices to be delivered. Already the numbers accommodated in bed and breakfastaccommodation are rising. In areas of the highest pressure, local authority housingdepartments are finding it impossible to accommodate those classified as homeless withintheir own areas.
Inadequacies within the construction industry, and problems of skill shortages may well beremedied. But the issue of land supply is likely to remain crucial. The nation needs to recognisethe importance of house building and must accept that some of tomorrow’s new homes mustgo on greenfield sites; urban extensions may be the most effective approach. As a nation, wealso need to rediscover the positive aspects of urban living. A series of measures couldstimulate the much-needed ‘urban renaissance’, but these will require a step change ingovernment intervention and investment.
The homes of tomorrow must also be affordable for those who need them. Reliance on‘planning gains’ would be unwise. Adequate levels of grants for producers must be found.Moreover, the time is right for reforms to personal subsidies for individual households: aneeds-related housing allowance that embraces poorer home owners as well as tenants,integrating the arrangements within new systems for tax credits, could combat the volatilityand insecurity currently built into our housing systems.
140 Tackling UK poverty and disadvantage in the twenty-first century

The Deputy Prime Minister’s statement, following the Chancellor’s Spending Review in2002, indicates an acceptance of the nature and scale of these problems. There is now a publiccommitment to narrow the gap between demand and supply in the South-east, targetingpotential growth areas and taking a firm stance on unnecessary planning restrictions (whilesimultaneously boosting housing market renewal efforts in the northern urban areas). But thischapter has argued that major increases in the supply of affordable homes are extremelyunlikely without the underpinning of adequate subsidy for production: it is by no meanscertain that the amounts of additional funding so far announced for the early 2000’s will besufficient to head off the impending, deep-seated crisis of housing shortage and homelessness.
Notes1 Department for Transport, Local Government and the Regions (2001) Homelessness Statistics, London: The Stationery
Office.2 Bate, R., Best, R. and Holmans, A. (2000) ‘Introduction: The people – where are they coming from?’ In Bate, R., Best,
R. and Holmans, A. (eds), On the Move: The housing consequences of migration, York: Joseph Rowntree Foundation.3 Holmans, A. (2001) Housing Demand and Need in England 1996–2016, London: The Town and Country Planning
Association/The National Housing Federation.4 Department for Transport, Local Government and the Regions (2001) Housing Statistics 2001 – average in
1997/98–2000/01, London: The Stationery Office.5 DTLR, Housing Statistics 2001.6 Holmans, Housing Demand.7 Holmans, Housing Demand.8 Holmans, A., forthcoming publication by the Joseph Rowntree Foundation.9 Department for Transport, Local Government and the Regions (2001) Housing Statistics – average for last 5 years
includes new dwelling completions and gains from conversions and change of use, London: The Stationery Office.10 Holmans, A., Kiddle, C., and Whitehead, C. (2000) Housing Need in the South East and London: An update,
Cambridge Housing and Planning Research Report III, Cambridge: University of Cambridge.11 Bate, R., Best, R. and Holmans, A. (2000) ‘Appendix: Sources of population growth in the South of England’, in Bate,
R., Best, R. and Holmans A. (eds) On the Move: The housing consequences of migration, York: Joseph RowntreeFoundation.
12 London Asylum Seekers Consortium (2001) Pan London Statistics, London: London Asylum Seekers Consortium.13 Askham, J., Nelson, H., Tinker, A. and Hancock, R. (1999) To Have and to Hold: The bond between older people and
the homes they own, York: Joseph Rowntree Foundation/YPS.14 Crook, A., Henneberry, J., Hughes, J. and Kemp, P. (2000) Repair and Maintenance by Private Landlords. London:
Department of the Environment, Transport and the Regions.15 Shelter (2001) Health and Housing, Shelter Fact-sheet.16 Groves, R. and Niner, P. (1998) A Good Investment? The impact of urban renewal on an inner city housing market,
York: Policy Press/Joseph Rowntree Foundation.17 Greater London Authority (2002) The London Plan: Spatial development strategy, London: Greater London Authority;
FPD Savills (2001) UK Residential Research Bulletin, London: Savills.18 Latham, Sir Michael (1994) Constructing the Team: Final report of the government/industry review of procurement
and contractual arrangements in the UK construction industry, London: The Stationery Office; Egan, Sir John (chair)(1998) Rethinking Construction: The report of the Construction Taskforce, London: Department for Trade and Industry.
19 Construction Associate Programme/Built Environment Research Panel (2001) Constructing the Future, London:Department of Trade and Industry.
20 Department of the Environment, Transport and the Regions/CCCIS (2000) The State of the Construction Industry,Issue 12, London: The Stationery Office.
21 Department of the Environment, Transport and the Regions (2001) Urban White Paper Implementation Plan, London:The Stationery Office.
22 Edwards, M, (2000) ‘sacred Cow or Sacrificial Lamb? Will London’s Green Belt have to go?’ CITY 4(1): 105–112.
141Tackling UK poverty and disadvantage in the twenty-first century

23 Rogers, Lord (chair) (1999) Towards an Urban Renaissance: Report of the Urban Task force, London: The StationeryOffice.
24 The Princes Foundation/Department of the Environment, Transport and the Regions/English Partnerships /CPRE(2000) Sustainable Urban Extensions: Planned through design, London: The Stationery Office; Environment, Transportand Regional Affairs Select Committee (1999) Seventeenth Report, London: The Stationery Office.
25 The Joseph Rowntree Foundation is involved in the development of an urban extension of some 520 new homes onthe edge of York: this could provide one model for development elsewhere.
26 Joseph Rowntree Foundation (2000) The Secrets of CASPAR, York: Joseph Rowntree Foundation.27 See Martin, G. (2001) Swamps and Alligators: The future of low cost home ownership, York: Joseph Rowntree
Foundation.28 Council or mortgage lenders.29 Maclennan, D., Meen, G., Gibb, K. and Stephens, M. (1997) Fixed Commitments, Uncertain Incomes: Sustainable
owner-occupation and the economy, York: Joseph Rowntree Foundation.30 Ford, J. and Kempson, E. (1997) Bridging the Gap? Safety nets for mortgage borrowers, York: Joseph Rowntree
Foundation/York Publishing Services.
142 Tackling UK poverty and disadvantage in the twenty-first century

143Tackling UK poverty and disadvantage in the twenty-first century
Poverty remains one of the distinguishing features of old age for many people. Retirementfrom the labour market typically brings with it a very substantial drop in income and anaccompanying change in lifestyle. But the degree of disadvantage faced by many older peoplealso depends on the quality, availability and affordability of care. While most older people willnot encounter the requirement for expensive long-term care, for the minority who do the costsare unpredictable and can be immense. The effects can dramatically reduce the standard ofliving of many who have lived on relatively comfortable incomes for much of their lives, aswell as for the persistently poor.
As this century progresses, the UK seems likely to face a considerable shortage of careresources. The resulting ‘care inequalities’ between those able to pay for a scarce resource, andthose unable to do so, could well become one of the most pressing social issues in the yearsto 2022.
This chapter looks at the current position, at demographic projections for the future, atfactors affecting demand for, and supply of care, and at ways of meeting the resulting costs. Itconcludes by urging more concerted action today to head off very serious social problems 20years from now.
The current positionThe UK is not yet experiencing the impact of a ‘demographic time-bomb’ and dramaticincreases in the number of people over 75 or over 85 are not expected in the next decade orso. But the numbers of people aged over 75 are projected to increase more rapidly after 2020,as the post-world war II ‘baby boom’ cohort turn 75. There is likely to be a near doubling inthe numbers of those over 75, and a near three-fold increase in the numbers of those over 85,by the middle of this century.
There is now a ‘window of opportunity’ in which to build up some of the financial resourcesfor long-term care, which the population projections indicate will be needed later on.1 However,despite the absence of an immediate crisis caused by demographic change, there are alreadysigns of considerable strain on current resources for the provision of continuing care.
Residential and nursing careCosts of care have been increasing by substantially more than the rate of inflation because of:
• Higher staffing costs, caused in some areas by the rise in the minimum wage (to £4.20 perhour for workers aged 22 and over, in January 2003) and elsewhere by competition for
9 Tackling disadvantage:Care
Meeting the growing demand for long-term care
Richard Best
▲ 11

staff. Vacancy rates for local authority care staff in 2001 were in excess of 20 per cent withturnover of 16.9 per cent.2 With near full employment in many areas, the care sector canonly recruit and retain staff by increasing wages.
• Improvements in standards required by government, in line with rising expectations. TheCare Standards Act 2000 does not require full compliance until 2007, but some of the newstandards will apply earlier and those operating nursing and residential care homes arelooking ahead to substantial increases in costs, not least for undertaking major physicalimprovements to their buildings (for which public funds have been scarce).
Meanwhile, pressure on Social Services budgets led them to plan an overspend in 2001/02 ofsome 12 per cent (£900m) above the amount expected by government in the StandardSpending Assessments. Even then, a further overspend above budgets was expected of over£200m.3 These constraints led many local authorities to refuse to pay for the actual costs ofcare provision, sometimes failing even to increase the fees paid in line with inflation.
Work by Laing and Buisson for the Joseph Rowntree Foundation, published in June 2002,showed councils are paying between £75 and £85 a week, on average, below the costs ofrunning a decent care home.4 Nationally, this adds up to an annual gap of around £1 billionbetween the amounts paid and the amounts required.
Rising costs and under-funding, unsurprisingly, have led to closures of residential andnursing homes without their replacement by new providers, with a net loss of some 10,000places in 2001.
Although such closures might be seen as reflecting consumer demand for care at home,they deny the option of residential care as an option for many who would choose this.
Following recommendations from the Royal Commission on Long Term Care, governmentprovided subsidies to cover the healthcare costs for those in nursing homes (but not personalcare or the ‘board and lodging’ fees) and to pay for ‘intermediate care’ for those needing
144 Tackling UK poverty and disadvantage in the twenty-first century
Figure 9.1 Increasing numbers of over 85s
2000
1800
1600
1400
1200
1000
800
600
400
200
0
Thou
sand
s
2001 2011 2021 2031 2041 2051
Males
Females
Source: Office for National Statistics (2001) Social Trends 31, London: The Stationery Office

145
Joseph Rowntree Housing Trust care homes
An example of the shortfall experienced by care-home providers comes from the JosephRowntree Housing Trust (JRHT), which provides residential care in York. The costs ofproviding satisfactory care are some £75 per week higher than the amount available fromthe Social Services Department (SSD); the funding gap for nursing care is around £115 perweek (2001).
The following figures demonstrate the worsening position over the last three years forthe JRHT’s main care homes:
Residential 2000 1999 1998JRHT charges 315.00 303.00 291.00SSD payment rates 238.50 234.40 230.37Funding gap 76.50 68.60 60.63
Nursing care 2000 1999 1998JRF charges 446.53 429.45 411.46SSD payment rates 331.00 326.00 320.39Funding gap 115.53 103.45 91.07
This funding gap has resulted in the JRHT taking a policy decision to offer no furtherplaces to those referred from Social Services Departments. This is despite the fact that it isa charity with a particular interest in supporting people on low incomes. The JRHT isunwilling to cover the shortfall out of charitable funds.
Such shortfalls mean other charities are pulling out – or have already done so – fromcare provision; by one estimate, charities are topping up the fees they receive from localauthorities to the tune of £184 million p.a. from charitable sources.5
Figure 9.2 Total number of care homes
18
17
16
15
14
13
12
11
10
Num
ber
of h
omes
(tho
usan
ds)
1996 1997 1998 1999 2000 2001
Source: Laing & Buisson Ltd (2002) Care of Elderly People UK Market Survey 2002, London: Laing & Buisson Ltd
Tackling UK poverty and disadvantage in the twenty-first century
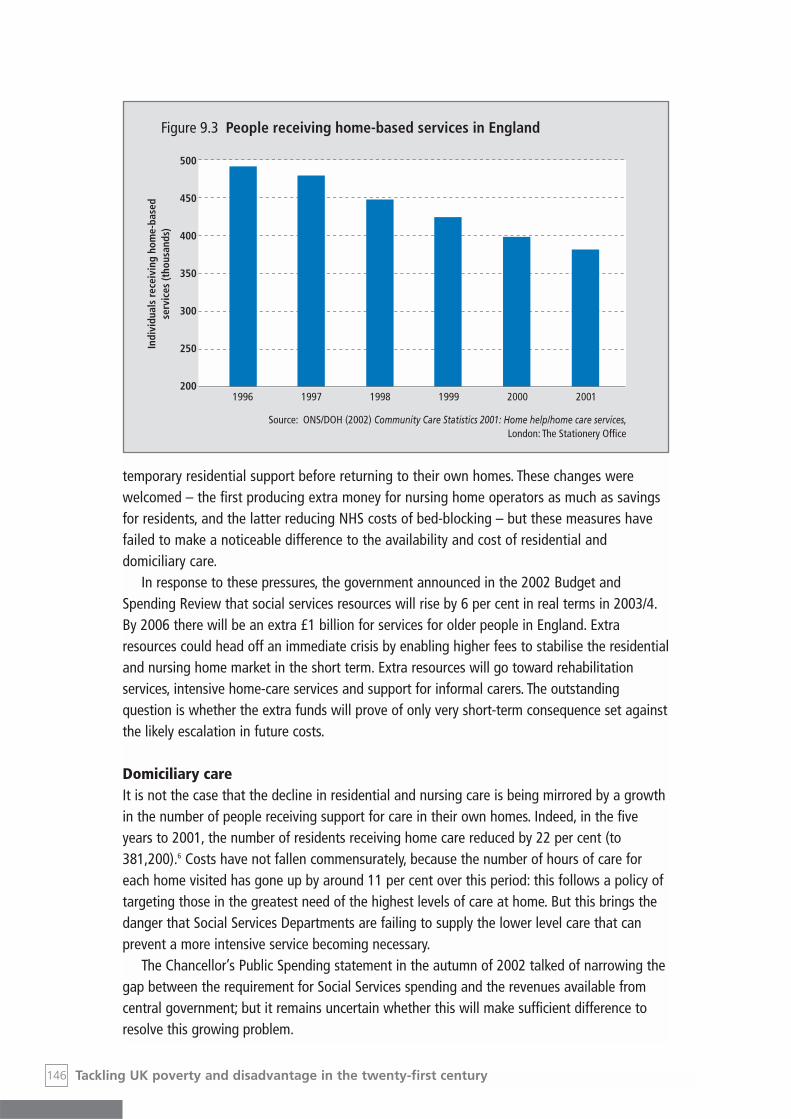
temporary residential support before returning to their own homes. These changes werewelcomed – the first producing extra money for nursing home operators as much as savingsfor residents, and the latter reducing NHS costs of bed-blocking – but these measures havefailed to make a noticeable difference to the availability and cost of residential anddomiciliary care.
In response to these pressures, the government announced in the 2002 Budget andSpending Review that social services resources will rise by 6 per cent in real terms in 2003/4.By 2006 there will be an extra £1 billion for services for older people in England. Extraresources could head off an immediate crisis by enabling higher fees to stabilise the residentialand nursing home market in the short term. Extra resources will go toward rehabilitationservices, intensive home-care services and support for informal carers. The outstandingquestion is whether the extra funds will prove of only very short-term consequence set againstthe likely escalation in future costs.
Domiciliary careIt is not the case that the decline in residential and nursing care is being mirrored by a growthin the number of people receiving support for care in their own homes. Indeed, in the fiveyears to 2001, the number of residents receiving home care reduced by 22 per cent (to381,200).6 Costs have not fallen commensurately, because the number of hours of care foreach home visited has gone up by around 11 per cent over this period: this follows a policy oftargeting those in the greatest need of the highest levels of care at home. But this brings thedanger that Social Services Departments are failing to supply the lower level care that canprevent a more intensive service becoming necessary.
The Chancellor’s Public Spending statement in the autumn of 2002 talked of narrowing thegap between the requirement for Social Services spending and the revenues available fromcentral government; but it remains uncertain whether this will make sufficient difference toresolve this growing problem.
146 Tackling UK poverty and disadvantage in the twenty-first century
Figure 9.3 People receiving home-based services in England
500
450
400
350
300
250
200
Indi
vidu
als
rece
ivin
g ho
me-
base
dse
rvic
es (t
hous
ands
)
1996 1997 1998 1999 2000 2001
Source: ONS/DOH (2002) Community Care Statistics 2001: Home help/home care services,London: The Stationery Office

The current position, therefore, hardly represents an attempt to get ahead whiledemographic trends are still relatively favourable. On the contrary, it shows rising costs –propelled by spending on staff and on higher standards to meet growing expectations andgovernment requirements – coupled with significant levels of under-funding by the State(principally via local authorities).
Demographic changeIn Part I we noted the ageing of the population throughout the developed world. Longer livesrepresent one of the great benefits of advanced societies. While those born at the turn of thelast century could expect to live only 45 or 49 years (for men and women respectively), thesefigures will soon reach 80 and 84 years.7 New research indicates that a girl born today standsa 50:50 chance of reaching 100 years; the same will be true for a boy, well before 2022.8 Thekey reasons for the greater proportion of older people in the UK results from:
• The ageing of two ‘baby boom’ generations, one from the immediate post-war years and,more significantly, one from the 1960s; this will include a significant proportion of peoplefrom minority ethnic backgrounds who arrived in Britain in the 1950s and 60s.
• Fewer babies being born, proportionately, leading to fewer young people as a proportion ofthe total population.
• Improvements in hygiene, diet and health care, leading to longer lives.
As a result, the average age for those living in the UK is expected to reach about 42 years by2022, compared with about 381/2 years today.9
However, the UK has already experienced a shift in the percentage of older people and it isin other countries – particularly Japan – that this trend will now become most dramatic. In theUK the number of older people increased by 400 per cent during the last century and hasdoubled since 1931. The more significant changes yet to come relate to the dramatic rise in thenumbers aged 85 or over: already almost half of those who are over 65 are aged at least 75.
The significance of the expected increase in the over 75s and, in particular, the over 85s,lies in the association between older age and increasing dependency. In general, the oldestcohorts are most likely to have health and care needs, and least likely to have survivingpartners or other close family members to provide support. As noted in the introductory paperof this series, over 70 per cent of those who are more than 80 years old have a disability and,in particular, the incidence of dementia rises exponentially with age, and doubles in each five-year age-band over 65. Thus although only one in 60 of those aged 65 are affected, one in fivepeople aged over 80 are likely to have problems with dementia, so the numbers affected couldwell double over the next 50 years.
But will this change? Is it likely that the extension of life expectancy could be accompaniedby an extension of health expectancy?
Other factors affecting the demand for careHealth educationSome put their faith in improved health education, and this is clearly of importance. The healthneeds of the older population could be improved not only by preventive interventions, but also
147Tackling UK poverty and disadvantage in the twenty-first century

by younger adults learning to lead healthier lifestyles. The growing affluence of the populationoverall gives more people the resources to afford healthy living; but one of the paradoxes ofgrowing wealth is the increase of both obesity and of malnutrition. Moreover, the resources tolive healthy lives are not distributed equally; people who have poor access to other financialand material resources are also less likely to have access to the resources that contribute tothe healthiest lifestyles.
Medical and technical changeThere has been a long-standing academic debate about the potential for the ‘compression ofmorbidity’.10 In reviewing the evidence, the Royal Commission on Long Term Care concludedthat there is some evidence that the onset of morbidity and disability may be compressed intoa brief period towards the end of life, and may not last much longer even if life itself is longer.The Commission’s underlying assumptions, therefore, were based on the premise that theproportion of years spent with some disability will remain roughly the same in relation tooverall life expectancy.11
The extent to which we will need care in old age will be greatly affected by furtherscientific developments. Scope for advances in medical science is considerable. We are on thecusp of developments in the use of stem cells and other genetic interventions that couldtransform the pattern of morbidity. Currently, much of the debate around such matters hasfocused on issues relating to fertility, and to ante-natal interventions. Alongside theseapplications (and their profound ethical considerations) is the scope for intervention in manychronic and debilitating diseases that so often accompany old age. Major scientificbreakthroughs in the treatment of dementia, and of conditions such as Parkinson’s diseasecould transform the future pattern of care needs relating to old age.
However, this remains an area of much uncertainty. For example, initially promising resultswith Parkinson’s disease have so far been set back by experimental treatments that have ledto irreversible deterioration, rather than improvements, among people treated with implantedfoetal cells.12
Technological advancesSome important progress is being made in exploiting new technology to enable older peopleto maintain their independence for longer. The Joseph Rowntree Foundation has experimentedwith Smart Home technology, which can allow independent living to be sustained for longer,with less recourse to costly home-care services. Many day-to-day chores can be automatedand remotely controlled, and conditions in the home can be monitored from afar to allowspeedy intervention when – but only when – it is needed. The downside of enhancedtechnology in the home, however, is that it cannot substitute for the benefits of personalcontact, which many older people value highly.
The design of new homes, following the Joseph Rowntree Foundation’s work in creatingLifetime Homes, will now always incorporate easier access into and around theaccommodation, as required by the government’s extension of Part M of the BuildingRegulations. These changes, affecting all new homes in the future, mean that wheelchairsusers, or those with mobility difficulties, will be able to enter the accommodation and movearound within it with relative ease. The hazards of unnecessary front steps, narrow corridors
148 Tackling UK poverty and disadvantage in the twenty-first century
and an absence of toilet facilities on the ground floor, are removed, making it easier for frailerolder people to stay longer in their own homes.
Preventive supportThe need for long-term care would also be reduced if preventive, low-intensity support wasavailable before people reached crisis point. As noted above, however, this is currently a lowpriority for cash-strapped local authorities, and the traditional home-help service is being rundown in many areas. While there is good evidence that a relatively modest input of earlysupport can save the substantial costs – to the State as well as to individuals – of residentialcare, this lesson has not yet been learnt. A body of work by the Joseph Rowntree Foundationhas demonstrated that low level help – e.g. with housework – can sustain self-respect andconfidence, which in itself may prevent or delay the need for residential care.13
An understanding of the real priorities for older people themselves may emerge from themonitoring of how Direct Payments are used in place of prescribed services. This approach alsoextends choice and autonomy, which in turn can reinforce independent living.14
Promisingly, in terms of the preventative factors that may reduce the need for care, thegovernment is investing in ‘intermediate care’. As noted in the box below, Joseph RowntreeFoundation work on this theme indicates that the availability of places in residential care forthose discharged from hospital not only reduces expenditure on hospital beds and cuts thenumber of emergency re-admissions for those discharged where insufficient help is available,but may well prevent the need for permanent admission to residential care. Such services alsogive respite to carers who might otherwise be unable to sustain their important work.
149Tackling UK poverty and disadvantage in the twenty-first century
Joseph Rowntree Housing Trust non-residential care
The Joseph Rowntree Housing Trust’s (JRHT) Continuing Care Retirement Community hasprovided an opportunity to see the extent to which residential and nursing care can beused for short periods of ‘intermediate care’. The community has residential care andnursing care provision at the centre of a complex of 152 individual bungalows.
• Twenty-nine of the community’s 200 bungalow residents spent at least one night inthis community’s Care Home over the 12 months to December 2000.
• They paid 41 visits to the Care Homes, staying a total of 714 nights.
The JRHT estimates that the availability of this facility within the community saved 374‘bed nights’ in hospital last year. This is of considerable importance to the York HealthTrust, which estimates that the number of people who are unwillingly ‘bed blocking’ rosefrom 52 to 70 at the York District Hospital, 2001.
In the majority of cases, the saved hospital bed nights came from people beingdischarged from hospital earlier than would have been possible but for the provision ofthis ‘intermediate’ care. Additional hospital bed nights were saved because of provision ofshort-term nursing care (although in the above calculation only a third of the nights havebeen counted when beds were occupied by bungalow residents for this reason).
It is worth noting that admissions from our sample into the intermediate care facilities

There is scope, therefore, for reducing the scale of demand and needs that an older populationpresents to health and care services. But advances in medical care, even if they extend lifeexpectancy, are not certain to cut the number of years of ill health. As things stand, therelationship between dementia and old age leads to predictions of considerable increases inthe number of people with dementia; dramatic breakthroughs in the relevant medical sciencemay not be imminent. Technology too can help; but this is a ‘high touch’ – rather than ‘hightech’ – service industry, and so much care provision depends entirely on the availability ofhuman resources.
The supply of careWorkforce shortagesThe social care sector is already experiencing acute shortages of nurses and insufficient careworkers of other kinds.15
A recent King’s Fund Care and Support Inquiry highlighted the difficulties of recruiting andretaining the employees – often unqualified and poorly paid – who are responsible for thevast bulk of care to people, both in the community and in residential and nursing homes. Itconcluded that this is an enduring and intensifying problem. Imaginative and innovativesolutions are required if the care crisis is not to be compounded.16 Part of the solution must liein paying realistic remuneration for hard and often highly demanding work. Pay and conditionsmust compete with other areas of the service sector. Moreover, if people are to choose suchwork in preference to, for example, working in a supermarket or DIY outlet, there needs to bea change to the image and status of these roles. Adoption of the more person-centredapproaches advocated by the JRF and others may increase the opportunity for job satisfactionfor support workers and personal assistants. But wider recognition of the importance of theseemployees is also needed.
The government has set a target of 50 per cent of care home staff and 50 per cent ofdomiciliary staff being properly qualified within five years. This contrasts with the currentposition, where 86 per cent of care staff in local authority homes have no qualifications.17 Theapproach of the General Social Council and TOPSS18 is to reduce barriers to access, includingfor those with educational disadvantage: but nothing will change unless there is adequatefunding for education and training.
The need for more training will increase costs, as will the necessity for pay to rise to thelevels necessary to attract and retain staff. But there is a growing realisation that essentialstaff in care support roles must be more highly valued.
Among the changes needed is an encouragement for a richer and more diverse mix of staffthan has been traditional. This will involve recruiting men as well as women, and not only
150 Tackling UK poverty and disadvantage in the twenty-first century
represent a lower take-up than would apply to a general intermediate care schemeelsewhere. This is because the JRHT offers an alternative to residential care by providinghigh quality domiciliary care (for up to 21 hours per week) for those who prefer to returndirectly to their bungalow, rather than going into intermediate care.
This suggests that even greater savings in relation to bed blocking could be expectedfor those not living in a ‘retirement village’, if good domiciliary care was readily available.

middle-aged but both younger people and those who may have retired early but haveexperience and skills to contribute, as well as people from a variety of cultural and ethnicbackgrounds.
And finally, in easing the problems of an absence of staff, there is scope for better andmore imaginative use of volunteers, not as a cheap substitute for a fully trained and skilledworkforce, but in support roles where time spent in personal contact – even just sitting andtalking – can make such a difference.
Changes to informal careAt present, over 70 per cent of care is provided on an unpaid basis. Changing this balance hasvery significant financial implications. There are some reasons to take a favourable view of theoutlook of the supply of informal care over the next two decades. The proportion of olderpeople with a surviving spouse is predicted by the Government Actuary’s Department to rise.And women reaching late old age will have lower levels of childlessness over these twodecades. But these factors look less positive after 2020.
There are several grounds for expecting the amount of informal care – nearly half providedby spouses and most of the remainder by (elderly) children – to diminish:
• Increased mobility means children living further from their parents. But already the numberof older people receiving care from children who live in the same household has fallenfrom some 42 per cent in 1962 to 14 per cent in 1986 and a good deal less today.19
• Demographic change means there are fewer middle-aged women, who have traditionallyacted as the main carers of their parents, compared with the numbers of older people.
• Culturally, older people increasingly express the desire ‘not to be a burden’ to their families,avoiding the past practice of moving in with relatives and increasing the expectations ofreceiving paid help.
• More women go out to work and a smaller proportion are prepared to devote themselvesto becoming full-time carers.
• There are signs of cultural change within some minority ethnic communities where therehas been a stronger tradition of expecting the next generation to look after parents in theirold age.
• The higher age of having a first child, and the greater period spent in education, meansmore people who might have been carers of parents in their 80s still have dependentchildren.
• Some observers also predict less support in old age as a result of more people nevermarrying and the higher incidence of marital/relationship breakdown.20
Perhaps surprisingly, the available evidence suggests that the provision of informal care byfamily members is not petering out. Support for carers – paying for respite care to give peoplea break, providing support and services specifically for the carer, and giving financial and fiscalincentives – could prevent a collapse of this vital work. But relatively small changes to thelevel of care provided informally – because it represents such a high proportion of the whole –could have disportionate impacts on the costs of paid-for care. Based on the (contestable)thesis that each hour of informal care would be replaced by an hour of paid-for care, the
151Tackling UK poverty and disadvantage in the twenty-first century
current split of costs at roughly 70 per cent informal and 30 per cent formal implies that adrop of just 10 per cent in informal care would lead to expenditure on formal care rising by athird. Even if this is an exaggeration, it is clear that there will be severe consequences offalling levels of family/informal care.
The quality of careIn thinking ahead to questions of service quality 20 years hence and beyond, there are variousdimensions that need to be addressed. First is the question of the quality of staffing (i.e.appropriately skilled and trained staff). Second is the issue of objective and material standardsof service.
National developments, including the Care Standards Act 2000 (which for the first timeprovides a framework for the regulation of social care), and the publication of minimumnational standards (such as in care homes), are welcome and significant steps forward. Someof the elements of how quality will be defined in the future can be anticipated: greatercomfort, improved privacy, and higher physical standards are obvious candidates, and thespeed of change over the last decade or so is apparent.
There has been a transformation in attitudes to the quality of care that should be providedin care homes. In the past, a bed in a geriatric hospital might have been deemed sufficient tomeet the need for residential care; then a shared room in an old people’s home was enough;but today most people want to look forward to their own room with en suite facilities.21 Thisdevelopment has directly paralleled the experience of consumers in other areas, and the risingmaterial expectations of society as a whole. If this trend continues, a logical extension will befrom an expectation of a bed-sitting room in a residential care home to having your own frontdoor. The need for institutional care will be increasingly questioned. Demand will rise foralternatives, such as retirement communities – like the JRHT’s continuing care retirementcommunity north of York – where care is delivered from central facilities, or better domiciliarycare in people’s own homes.
We cannot begin to second-guess all the dimensions of quality that may emerge in thefuture. An obvious example would be the increased expectations stemming from the spread ofownership of ‘white goods’ within the home. The massive expansion of ownership ofmicrowave ovens, video recorders, home computers, and mobile phones is apparent to all. Thetransition from luxury good to essential equipment is a rapid one, and the profile of what is‘normal’ in 20 years will probably be very different. In the same way as we have argued inprevious chapters that the incomes of the most disadvantage must be considered in relation tocontemporary living standards, so must the provision of care.
But material standards are only the beginning of the story. The National MinimumStandards for Care Homes for Older People focus on the impact of facilities and services in ahome under a number of key dimensions on the people living there. These include dimensionsof: choice of home, health and personal care, daily life and social activities, complaints andprotection, environment, staffing, management and administration.22 The standards areintended as proxies for judging the quality of life of service users. High material standards arenot good enough without parallel attention to the issues that service users have identified asthe things that matter most.
152 Tackling UK poverty and disadvantage in the twenty-first century

The last decade has seen a substantial growth in research evidence about what matters toservice users, and the outcomes that are of most importance. The evidence is consistent inhighlighting, issues such as:
• staff reliability and continuity
• kindness and understanding of care staff
• cheerfulness and demeanour of staff
• competence in carrying out care
• flexibility to respond to individual needs
• being treated with respect and feeling valued
• choice and control resting with the service user
• activity and engagement.23
Such considerations are likely to become more explicitly demanded with the ageing of cohortswho are used to ‘having it all’ and being assertive in ways that may be less true of currentolder groups (particularly older women). A further factor that is likely to be a majordeterminant in driving the changing pattern and quality of services is the rise of the consumer,and the power of the service user. User-led and person-centred services will cost more becauseof the extra quality and benefits they will deliver, although the evidence suggests they arebetter than traditional models from a cost–benefit perspective. Increasingly, Direct Payments –given a boost by the Secretary of State for Health’s statement in July 2002 – and similarschemes that place the service user at the centre of the process, are likely to see servicesobliged to respond more directly to the individual needs of users.
Questions of cultural responsiveness, and services that are sensitive to the diverse needs ofblack and minority communities, men and women, and people of different sexual orientationwill also become of growing importance if further inequalities are to be avoided. Despite goodexamples of locally developed specialist services often evolving out of grassroots activity,overall the evidence indicates that many groups are significantly disadvantaged as serviceusers (and often as care providers). Mainstream services typically provide a poor range andchoice of provision, and are often unable to make culturally appropriate responses (whether inrelation to food, culture, language, or gender considerations). While local black and minorityethnic groups have often been at the forefront in developing innovative and highly valuedservices, there remains an urgent challenge to ensure that mainstream services are able tomeet the needs of people from all backgrounds.24
Changes in the composition of the older population will create significant pressures in thisarea as black and minority ethnic groups age and grow as a proportion of the olderpopulation. Future cohorts will include many more minority ethnic older people and there willbe growing challenges if the issues of ‘triple jeopardy’ – the cumulative disadvantage due torace, age, and social class – are not to become of greater significance.25
The development of an improved infrastructure of health and care services in the comingyears would make a fundamental difference to the lives of millions of older people. This meansimproving the present system on five key fronts:
153Tackling UK poverty and disadvantage in the twenty-first century

1 Coherence, with the barriers between different types of service breaking down.2 Responsiveness to the needs of individuals, whether by putting more resources in the hands
of clients or in managing them in ways that are more client-centred.26
3 Accessibility to all who need services, rather than making provision dependent on resourcesavailable in a particular area.
4 Quality of provision, by creating a regime in which incentives are focused much less thanat present on low price.
5 Professionalism, through the development of a well-paid, well-trained set of carers, and anawareness that this is likely to be one of the most important professions of the 21stcentury.
This brief survey of care quality illustrates the need for planning funding requirements beyondan extrapolation based simply on the ageing population having the current level of provision.The present system survives by creating barriers through eligibility criteria that exclude manywho need care, and by paying very low wages to many who provide it. As well as tacklingworkforce shortage, it is going to be necessary to find much greater resources to meet thecosts of care.
Meeting the costs of long-term careA major contribution to understanding long-term care costs for older people, right up to 2051,has been published by the Institute of Public Policy Research (IPPR).27 This uses workcommissioned from the Personal Social Services Research Unit (PSSRU) at the London Schoolof Economics and the Nuffield Community Care Studies Unit (NCCSU) at the University ofLeicester. It suggests a basis for comparing the effects of different assumptions against centralbase case projections of long-term care expenditure rising by around 260 per cent in the firsthalf of this century. (It does not, however, take account of rising expectations.) It notes theconsiderable ‘funnel of doubt’ about future long-term care expenditure. But it implies that,with GDP likely to grow by, for example, 2.25 per cent per year, and projected increases inhome ownership that could fund care costs, the total level of expenditure need not represent aDoomsday scenario. It is not impossible for the nation to fund future care costs, provided wesee this as a major priority and set in place sensible mechanisms.
This chapter has described the strains that will emerge, if these mechanisms are not inplace, in that those with high spending power in retirement would be able to afford thequality of care they want. But those dependent on the State – or on friends and neighbours –are already finding it harder to get the services they need.
While the picture overall is one of shortages of resources, the sense of injustice at thesituation is felt most acutely by those who have accumulated modest assets in their lifetimeand now find themselves unexpectedly having to dispose of these to pay for care. Sometimesthe burden falls on the younger generation, but more often the hardship is experienced bythose who must sell all they have accumulated in their working lives – often invested in theirhome – to pay for care.
Many people expected social care, like health care, to be provided free. They have not seena clear distinction between suffering from dementia and suffering from cancer, as pointed outby the Royal Commission on Long Term Care.28 The gradual withdrawal of government from
154 Tackling UK poverty and disadvantage in the twenty-first century
much traditional care provision and the increases in charges as local authority budgets havereduced, has provoked a sense of a ‘broken contract’ between the citizen and the State.
Amidst an atmosphere of suspicion, there are fears that Social Services Departmentsdeliberately delay assessing older people’s care needs; that those assessed as in need ofresidential care are forced to wait until a sufficiently cheap place becomes available, withinunrealistically low limits set by the local authority; that there are perverse incentives on SocialServices Departments to move people into residential care so that their vacated home can besold to pay the bills. Against this background, the Royal Commission’s central recommendationto the government was that all personal care, as well as nursing care in residential settings,should be free at the point of delivery and paid for by general taxation.
However, while the government accepted many of the subsidiary proposals of the RoyalCommission, it rejected its key recommendation. Instead, it followed the line of two membersof the Commission who produced a Note of Dissent. They argued that, partly because of theexpense of this recommendation, partly because it could lead to reductions in informal care,and partly because it would not apply additional resources to helping those with the leastassets, only nursing care in nursing homes should be available free, without any means-test.
Would the provision of free personal care dramatically shift the balance between informaland formal care in the years ahead? In Scotland, with the impending provision of free care atthe point of delivery – including home care – the assessment has been that costs might rise asa consequence by some 12 per cent. But abuse of the system could be avoided by personalcare being dependent upon specific medical conditions, with strict definitions and subject toclear and rigid tests.
The passing of the Health and Social Care Act (2001) in England ended the anomaly ofhealth services being charged for in nursing homes. But much of the extra support has notdirectly benefited the individuals, since hard-pressed nursing home owners have raised theircharges in recognition of the availability of these extra resources (and the definition of‘nursing care’ has been criticised for redefining as charged-for personal care, much of whatnurses have previously provided in nursing homes).
Meanwhile in Scotland, the Scottish Executive announced in January 2001 that it hadaccepted the case for free personal care for older people. Measures were introduced in 2002to cover not only the nursing, but also the social and personal care in residential settings, andthe costs of domiciliary care. Nevertheless, because the accommodation costs of living in carehomes must still be paid for on a means-tested basis, and those costs represent about half ofthe whole, the changed regime has not represented as dramatic a breakthrough as some hadsupposed: choice is still restricted for those unable to contribute half the costs of their care;and for those with a home to sell, or other assets to dispose of, it may still be necessary toerode most of a lifetime’s savings to pay for care. However, experience from the Scottishscheme will produce significant information, for example confirming or denying thesupposition in the minority report from the Royal Commission that free care leads toreductions in informal, family care.
Care insuranceIn 1996, the Joseph Rowntree Foundation published the results of its Inquiry into Meeting theCosts of Continuing Care.29 The Joseph Rowntree Foundation, like the Royal Commission, had
155Tackling UK poverty and disadvantage in the twenty-first century
advocated that both health care and social care should be free at the point of delivery for allolder people (while the accommodation costs of residential/nursing care should continue to bepaid for on a means-tested basis). But the Joseph Rowntree Foundation Inquiry maderecommendations to cover the costs of this change and to accumulate the resources to meetthe accommodation costs as well as the care costs.
The Joseph Rowntree Foundation suggested that the nation should take advantage of thecurrent ‘window of opportunity’ to build up funds for the time when the numbers of olderpeople rises sharply. We should ‘throw forward’ some of the resources that are sure to beneeded later. To do this, a funded National Care Insurance scheme should be established. ANational Care Council would be established to set and review national standards of careentitlements and set levels of contribution rates – making ‘in-flight’ corrections to these asand when required.
The JRF Inquiry saw the advantages of a funded, regulated and compulsory care insurancescheme of this kind to be:
• A huge reduction in the costs of insuring against the potentially catastrophic risks of long-term care, because of the universal nature of the new national scheme: administration andmarketing costs would be kept to a minimum because all citizens would be included asbeneficiaries and all those in work would be contributors.
• An avoidance of ‘free riders’ who were capable of paying for their insurance but chose notto do so, rightly assuming that society will feel obliged to pick up the bill for them.
• Avoidance of ‘cherry picking’ by private insurers (which is likely to become more of aproblem as genetic testing and other techniques reveal levels of individual risk): poolingthe risks across the whole population allows everyone to benefit.
• An end to the anxieties about the loss of assets on the part of those who have savedduring their working lives, rewarding those who have made provision for their old ageand/or wish to pass on an inheritance to the next generation.
• Most important, the generation of substantial extra resources to supplement the input ofthe tax-payer (who would continue to pay for those unable to make provision forthemselves): this would fund more and better care all round.
Contributions to be paid into the scheme recommended by the Joseph Rowntree Foundationwould be compulsory at a rate which would ensure that someone on average earnings alltheir life would put in sufficient for insurance cover against the full cost of their continuingcare. The Government Actuary has assessed this level at 1–11/2 per cent of average earnings.(And the National Care Council would constantly review this rate in the light of increasing orfalling costs.)
Such a scheme does not imply the present generation paying twice – once through theirtaxes, for today’s older people, and once, through their contributions, for their own care later.There are gains to this generation too: those with parents with assets (principally owner-occupiers) would be protected from losing their inheritance, and they would also be able topass on their own assets to the next generation if they required expensive care themselves.
Although the scheme was costed as increasing public expenditure at about £540 millionper annum if introduced immediately – before insurance payments were available – it would
156 Tackling UK poverty and disadvantage in the twenty-first century

generate £3 billion annually. Payments out of the insurance fund would be small over the next20 years, since they would relate specifically to those who have paid in: so a substantialcapital fund of at least £50 billion would be accumulated in the period to 2022. Thereafter, thering-fenced fund would pay out around half of all continuing care costs.
Since the ‘free’ care available would not cover accommodation costs, those wishing toavoid means-testing and loss of assets could top up their own insurance payments (forexample by a single payment at the time they receive tax-free funds from their pensionprovision, or perhaps through partial equity release of a part of the value of their own home).
Whether or not the Joseph Rowntree Foundation’s compulsory care insurance is regardedas a ‘hypothecated tax by another name’ is of little importance: the point is that it would freepeople at all income levels from the distress and insecurity of wondering how they will pay forpotentially enormous care costs. Politicians and the electorate would see a major problem forthe future not stored up, but dealt with in advance.
In conclusionThis chapter identifies serious under-funding of current provision, and the likelihood ofsubstantially higher costs in the future, as a significant national issue. It is one that will causegrowing anxiety to rising numbers within the electorate and one, therefore, which maybecome increasingly relevant to politicians of all parties. The recent research from the IPPR,however, suggests that it would be possible to fund future care costs, if sensible mechanismsare put in place.
The Joseph Rowntree Foundation stands by its earlier recommendations for a regulated,funded, compulsory, National Care Insurance scheme. But there may be other ways of squaringthe circle and securing the resources that would pay for care free at the point of delivery. Forexample, for those unable to accept the case for compulsion, a preferable route might lie inthe avoidance of means-testing for those who take out private insurance to cover the first£X,000, with the State paying any costs thereafter: but any scheme that is not universal willsuffer problems of adverse selection, cherry-picking by insurers, higher marketing andadministration fees, etc.
The Joseph Rowntree Foundation Inquiry scheme may not be the only solution, but carecosts are set to rise significantly over the next two decades, even while the numbers of olderpeople are not increasing very dramatically. Unless some major initiative is introduced of thekind advocated, we believe care inequalities will proliferate and inadequate care provision willmean insecurity and hardship for very large numbers of older people by 2022.
Notes1 Government Actuary’s Department, (2002) National Population Projections 2000-based, London: The Stationery Office.2 Local Government Association (2002) Working Group for Personal Social Services, February 2002.3 Local Government Association (2002) Local Authority Social Services Budget Survey, February
2002.<http://www.adss.org.uk/pres/2002/budsum.shtml> Visited 23 January 2003.4 Laing, W. (2002) Calculating a Fair Price for Care, York: Joseph Rowntree Foundation/Policy Press; HM Treasury (2002)
The Wanless Report, London: The Treasury Office.5 Burstow, P. (2002) Cap in Hand, Liberal Democrats.
157Tackling UK poverty and disadvantage in the twenty-first century

6 Department of Health (2001) Community Care Statistics 2000/1: Home help/home care services, London: Departmentof Health.
7 Government Actuary’s Department (2002) National Population Projections 2000-based, London: The Stationery Office.8 Oeppen, J. and Vaupel, J.W. (2002) ‘Broken Limits to Life Expectancy’, Science, 296: 1029–1031.9 Financial Services Authority (2002) Financing the Future: Mind the gap: The implications of an ageing population,
London: FSA.10 Bone, M., Bebbington, A., Jagger, C., Morgan, K. and Nicholas, G. (1995) Health Expectancy and its Uses, London: The
Stationery Office.11 Sutherland, Sir Stewart (Chairman) (1999) With Respect to Old Age: Long term care – rights and responsibilities: A
Report by the Royal Commission on Long Term Care, Cm 4192-I. London: The Stationery Office. Chapter 2.12 Boseley, S. (2001) ‘Parkinson’s miracle cure turns into a catastrophe’, Guardian Newspaper 13 March 2001.13 Joseph Rowntree Foundation (1999) Low Intensity Support: Preventing dependency, Foundations 159, York: Joseph
Rowntree Foundation.14 Joseph Rowntree Foundation (2000) Implementing Direct Payments, Findings N60, York: Joseph Rowntree
Foundation.15 Social Services Inspectorate (2000) Modern Social Services: A commitment to people. The Ninth Annual Report of the
Chief Inspector of Social Services, London: Department of Health.16 Henwood, M. (2001), Future Imperfect? Report of the King’s Fund Care and Support Inquiry, London: King’s Fund.17 Brand, D. and McDonnell, F. (1999) Modernising the Social Care Workforce – the first national training strategy for
England, Consultation document, TOPSS England.18 TOPSS is the employment-led body leading on education, training and workforce development strategy for social care.19 Grundy, E. (1995) ‘Demographic influences on the future of family carers’ in Allen, I. and Perkins, E. (eds) The Future
of Family Care for Older People, London: HMSO; and Grundy, E. and Glaser, K. (1997) ‘Trends and transitions toinstitutional residence among older people in England and Wales 1971–1991’ Journal of Epidemiology andCommunity Health 51, 531–540.
20 London Economics (1998) The Economics of Informal Care, a Report to the Carers National Association, London:London Economics/Carers National Association.
21 Dwelly, T. (ed.) (2001) My Home, Not The Home: Residents’ views on new care homes, York: Joseph RowntreeFoundation.
22 Department of Health (2001) Care Homes for Older People: National Minimum Standards, London: The StationeryOffice.
23 Qureshi, H. and Henwood, M. (2000) Older People’s Definitions of Quality Service, York: Joseph RowntreeFoundation/YPS.
24 Henwood, Future Imperfect?25 Norman A. (1985), Triple Jeopardy: Growing old in a second homeland, London: Centre for Policy on Ageing26 See Clark, H. and Spafford, J. (2001) Piloting Choice and Control for Older People: An evaluation, York: Joseph
Rowntree Foundation/Policy Press.27 Wittenberg, W., Hancock, R., Comas-Herrera, A. and Pickard, L. (2002) ‘Demand for Long Term Care in the UK:
Projections of long term care finance for older people to 2051’, in: IPPR, A New Contract for Retirement, London:IPPR.
28 Royal Commission on Long Term Care (1999) With Respect to Old Age: Long Term Care – Rights and Responsibilities,London: The Stationery Office.
29 Joseph Rowntree Foundation (1996) Meeting the Costs of Continuing Care: Report and recommendations, York:Joseph Rowntree Foundation/YPS.
158 Tackling UK poverty and disadvantage in the twenty-first century

Part III


161Tackling UK poverty and disadvantage in the twenty-first century
Poverty and disadvantage are avoidable…This report has argued that widespread poverty and disadvantage is a damaging andavoidable feature of 21st century Britain. The damage is not just experienced by those directlyaffected, but by the whole of society, not least because of the economic cost of having a largegroup of people who require expensive support and are unable to achieve their full potential.
A strategy to combat disadvantage therefore needs to start with a concerted effort to helpeveryone play full economic and social roles. This means enabling individuals to acquire skillsand access paid work, but also valuing activities more widely and taking steps to help wholecommunities to flourish. At the same time, those who are unable to flourish in a marketeconomy require support in a variety of forms.
In a number of areas this requires governments to adopt bold long-term policy objectives.Among the most important ones suggested by this report are:
• A decisive reorienting of the education system to ensure that it serves those who have inthe past gained least from it.
• Measures to allow poorer groups to enjoy a higher than average rate of income growth inthe coming years, primarily through better opportunities and more stable and generoussupport.
• A new attitude to housing supply, in which society accepts the importance of meetinggrowing overall demand, as well as of expanding provision for those unable to pay marketprices.
• A system for paying for long-term care that gives everyone access to quality options.
…if they are tackled with persistence and co-ordination…Of course, none of this can be achieved overnight. Yet if these principles are pursued over along period, real progress is possible. Critically, this requires persistent, simultaneous action ona range of fronts, where sporadic or disjointed efforts would be ineffective.
One example is the pursuit of policies to enhance the incomes of people with low earningsfrom work. Efforts to raise productivity, progressive increases in the minimum wage and theuse of tax credits to support the most needy families would each, as an isolated policy,encounter serious difficulties. Pursued together, they have a much better chance of succeeding.
Similarly, measures focusing on income enhancement will, over the long term, be moreeffective if combined with wider measures to improve access to things that disadvantagedpeople need. Improving the overall supply of housing, for example, is a long-term mission thatis essential if one is to ensure that people can afford to pay for decent accommodation. With achronic overall shortage, no policies to supply affordable homes or help people pay their rentwill be adequate to eliminate housing disadvantage and associated hardship.
Conclusion: A long-termcommitment is affordable
…and over the long-term these principles are affordableThis report has not produced a detailed, costed policy agenda. Instead it shows, first that inprinciple it is possible to tackle relative poverty over 20 years by diverting a relatively smallpercentage of economic growth to poorer groups. Second, the report argues that a higherproportion of the resources spent on services such as education should be concentrated ontackling disadvantage.
Will this require new money to be raised from the taxpayer? In the case of spending on keyservices, such as education, housing and health, the present government has alreadycommitted large increases. The important thing will be to sustain higher spending in theseareas and to focus on tackling the problems identified in this report.
For raising the floor of incomes to the level recommended, some new resources may beneeded. How much is required over the long-term depends on success in raising the capacityof disadvantaged groups to succeed economically. However, three factors make a degree ofdirect redistributive taxation look like a feasible option.
1 The present government has made a start. The past five years have shown that it ispolitically possible to have budgets that give disproportionately to poorer groups withsome modest extra call on the means of richer ones.
2 Gradual movement in this direction over the long-term does not require anyone to havereduced disposable income – simply for some to become better off slightly more slowly.
3 The UK remains a relatively low taxed country, with most of its EU neighbours raisingconsiderably more, especially in direct taxation.
This is not an argument for making redistributive taxation the centre of a strategy to combatpoverty and disadvantage. But, alongside the other measures recommended here, it can playits part.
162 Tackling UK poverty and disadvantage in the twenty-first century

163
People consulted by JRF
Tackling UK poverty and disadvantage in the twenty-first century
The Joseph Rowntree Foundation and the
authors of this report would like to thank
the following for contributing their
knowledge and views during the course
of this project. Responsibility for the
content of this report remains fully with
the authors.
John Adams, IPPR
John Adcock, Freelance Writer
Mal Ainscow, Manchester University, and
government adviser
Stephen Aldridge, Cabinet Office
Tony Atkinson, Cambridge University
Mog Ball, Consultant
Sir Peter Barclay CBE
Ian Basnett, Camden & Islington Health
Authority
David Bell, Stirling University
Jamie Bell, CBI
Fran Bennett, University of Oxford
Richard Berthoud, University of Essex
Rodney Bickerstaffe, National Pensioners
Convention
Mark Beatson, DTI
Dame Margaret Booth DBE, JRF Trustee
Dame Ann Bowtell DCB, JRF Trustee
Jonathan Bradshaw, University of York
Don Brand, National Institute for Social Work
Mike Brewer, IFS
Richard Brooks, IPPR
Peter Bunn, DTI
Tania Burchardt, London School of Economics
Paul Burstow MP
Jabeer Butt, REU
Michael Carley, Heriot-Watt University
Karen Chouhan, De Montfort University
Dame June Clark DBE, University of Wales
George Cowcher, One North East
Diane Coyle, The Independent
John Crook, Department of Health
Gillian Dalley, Centre for Policy on Ageing
Shirley Dex, Cambridge University
Paula Diggle, HM Treasury
Andrew Dilnot CBE, Institute of Fiscal Studies
Josie Dixon, Improvement and Development
Agency
Kenneth Dixon CBE DL, JRF Trustee, Chair
Danny Dorling, University of Leeds
Tim Dwelly, Consultant
Alan Dyson, Newcastle University
Rebecca Endean, DWP
Lord Filkin
Janet Ford, York University
Julie Fry, Treasury
David Gilborn, Institute of Education
Sir Alistair Graham, Policy Complaints
Authority
Catherine Graham-Harrison, JRF Trustee
Anne Green, University of Warwick
Ruth Hancock, University of Leicester
David Harbourne, North Yorkshire LSC
Tessa Harding, Help the Aged
David Hargreaves, Government education
adviser
Susan V Hartshorne, JRF Trustee
Helena Herklots, Age Concern England
Peter Hetherington, The Guardian
John Hills, London School of Economics
Gina Hocking, Consultant
Nicholas Holgate, Treasury
Marilyn Howard, Consultant
John Hubbard, DfES
John Humphries, DTI
Lord Joffe CBE
Savita Katbamna, University of Leicester
Elaine Kempson, Bristol University
Kathleen Kiernan, London School of
Economics
Alex Kirwan, DfES
John Knell, Industrial Society
William Laing, Laing & Buisson Ltd
Janice Lawson, DfES
Desmond Le Grys, Consultant
Bob Lewis, Continuing Care Conference
Richard McCarthy, Peabody Trust
James McCormick, Scottish Council
Foundation
John McCracken, Department of Health
Rob MacDonald, Teesside University
Duncan Maclennan, Glasgow University
Mary MacLeod, National Family & Parenting
Institute
Hamish McRae, The Independent
Mary Marshall, Stirling University
Glyn Mathias
Barbara Maughan, Institute of Psychiatry
Robert Maxwell CVO CBE, JRF Trustee
Pamela Meadows, JRF Adviser
Paul Medlicott, Consultant
Jonathan Michie, Birkbeck College
Sue Middleton, Loughborough University
Jane Millar, University of Bath
Heidi Mirza, Middlesex University
Jenny Morris
Michael Moynagh, The Tomorrow Project
Sarah Mulley, Treasury
Daniel Murphy, Inland Revenue
Nigel Naish, JRF Trustee
Gus O’Donnell, Treasury
Derek Osborn, Consultant
Carey Oppenheim, No 10 Policy Unit
Debby Ounsted, JRF Trustee
Michael Parkinson, John Moores University
Theresa Perchaud and colleagues, NACAB
Norman Perry, Housing Corporation
Chris Pond MP
Claire Rayner
Sue Regan, IPPR
Ceridwen Roberts
David Robinson, Community Links
Janice Robinson, King’s Fund Centre
Angela Sarkis, Social Exclusion Unit
Tom Schuller, Birkbeck College
Martin Shreeve
Mark Shucksmith, University of Aberdeen
Gurbux Singh
George Smith, University of Oxford
Rob Smith, Regional Co-ordination Unit
Daphne Statham, National Institute for Social
Work
Keith Summer, Centre for Policy on Ageing
Holly Sutherland, University of Cambridge
Lord Sutherland of Houndwood Kt, University
of Edinburgh
Nick Timmins, Financial Times
Sir William Utting CB, JRF Trustee, Deputy
Chair
Moira Wallace, Social Exclusion Unit
Michael Ward, London Development Agency
Robin Wendt CBE
Michael White, Policy Studies Institute
Christine Whitehead, University of Cambridge
Michael Willmott, Future Foundation
Brian Wilson, Countryside Agency
Gerald Wistow, Nuffield Institute for Health
Raphael Wittenberg, Department of Health