taconite mining and processing industry profile - us epa · taconite mining and processing industry...
TRANSCRIPT
Taconite Mining and ProcessingIndustry Profile
Draft Report
Prepared for
Bryan J. HubbellU.S. Environmental Protection Agency
Office of Air Quality Planning and StandardsInnovative Strategies and Economics Group (MD-15)
Research Triangle Park, NC 27711
EPA Contract Number 68-D-99-024
RTI Project Number 7647.002.142
September 2001
EPA Contract Number RTI Project Number68-D-99-024 7647.002.142
Taconite Mining and ProcessingIndustry Profile
Draft Report
September 2001
Prepared for
Bryan J. HubbellU.S. Environmental Protection Agency
Office of Air Quality Planning and StandardsInnovative Strategies and Economics Group (MD-15)
Research Triangle Park, NC 27711
Prepared by
Katherine B. HellerJui-Chen Yang
Research Triangle InstituteCenter for Regulatory Economics and Policy Research
Research Triangle Park, NC 27709
iii
CONTENTS
Section Page
Executive Summary . . . . . . . . . . . . . . . . . . . . . . . . . . . . . . . . . . . . . . . . . . . . . . . . . . . ES-1
ES.1 Costs of Compliance . . . . . . . . . . . . . . . . . . . . . . . . . . . . . . . . . . . . . . . . . . . . ES-1
ES.2 Estimated Economic Impacts of the Proposed Refractories NESHAP . . . . . . ES-1
1 Introduction . . . . . . . . . . . . . . . . . . . . . . . . . . . . . . . . . . . . . . . . . . . . . . . . . . . . 1-1
1.1 Introduction . . . . . . . . . . . . . . . . . . . . . . . . . . . . . . . . . . . . . . . . . . . . . . 1-11.2 Organization of this Report . . . . . . . . . . . . . . . . . . . . . . . . . . . . . . . . . . 1-2
2 Industry Profile . . . . . . . . . . . . . . . . . . . . . . . . . . . . . . . . . . . . . . . . . . . . . . . . . . 2-1
2.1 The Supply Side . . . . . . . . . . . . . . . . . . . . . . . . . . . . . . . . . . . . . . . . . . . 2-12.1.1 Production Process, Inputs, and Outputs . . . . . . . . . . . . . . . . . . 2-1
2.1.1.1 Machines Used in the Production Process . . . . . . . . . . 2-42.1.1.2 Final Commodities . . . . . . . . . . . . . . . . . . . . . . . . . . . . 2-82.1.1.3 Emissions and Controls in Refractory Manufacturing 2-102.1.1.4 Inputs to Production of Refractory Products . . . . . . . 2-10
2.1.2 Types of Products . . . . . . . . . . . . . . . . . . . . . . . . . . . . . . . . . . . 2-12
2.1.3 Costs of Production . . . . . . . . . . . . . . . . . . . . . . . . . . . . . . . . . 2-122.1.3.1 Cost Data . . . . . . . . . . . . . . . . . . . . . . . . . . . . . . . . . . 2-12
2.2 Industry Organization . . . . . . . . . . . . . . . . . . . . . . . . . . . . . . . . . . . . . . 2-132.2.1 Refractory Manufacturing Facilities . . . . . . . . . . . . . . . . . . . . 2-17
2.2.1.1 Refractories Database Facilities . . . . . . . . . . . . . . . . . 2-172.2.1.2 Facility Location . . . . . . . . . . . . . . . . . . . . . . . . . . . . . 2-17
2.2.2 Capacity Utilization . . . . . . . . . . . . . . . . . . . . . . . . . . . . . . . . . 2-252.2.3 Industry Concentration and Market Structure . . . . . . . . . . . . . 2-27
2.2.3.1 Measures of Industry Concentration . . . . . . . . . . . . . . 2-282.2.3.2 Market Structure . . . . . . . . . . . . . . . . . . . . . . . . . . . . . 2-292.2.3.3 Small Businesses that Own Refractory Facilities . . . . 2-29
2.2.4 Current Trends in the Refractory Industry . . . . . . . . . . . . . . . . 2-30
iv
2.3 The Demand Side . . . . . . . . . . . . . . . . . . . . . . . . . . . . . . . . . . . . . . . . . 2-332.3.1 Product Characteristics . . . . . . . . . . . . . . . . . . . . . . . . . . . . . . 2-342.3.2 Uses and Consumers . . . . . . . . . . . . . . . . . . . . . . . . . . . . . . . . 2-342.3.3 Substitution Possibilities in Consumption . . . . . . . . . . . . . . . . 2-36
2.4 Markets for Refractory Products . . . . . . . . . . . . . . . . . . . . . . . . . . . . . 2-372.4.1 Market Data . . . . . . . . . . . . . . . . . . . . . . . . . . . . . . . . . . . . . . . 2-37
2.4.1.1 Domestic Production . . . . . . . . . . . . . . . . . . . . . . . . . 2-372.4.1.2 International Trade . . . . . . . . . . . . . . . . . . . . . . . . . . . 2-38
2.4.2 Market Prices . . . . . . . . . . . . . . . . . . . . . . . . . . . . . . . . . . . . . . 2-382.4.3 Industry Trends . . . . . . . . . . . . . . . . . . . . . . . . . . . . . . . . . . . . 2-41
3 Engineering Cost Analysis . . . . . . . . . . . . . . . . . . . . . . . . . . . . . . . . . . . . . . . . . 3-1
3.1 Overview of Emissions from Refractory Manufacturing . . . . . . . . . . . . 3-1
3.2 Compliance Cost Estimates . . . . . . . . . . . . . . . . . . . . . . . . . . . . . . . . . . 3-43.2.1 Emission Control Costs . . . . . . . . . . . . . . . . . . . . . . . . . . . . . . 3-53.2.2 Compliance Testing Costs . . . . . . . . . . . . . . . . . . . . . . . . . . . . . 3-53.2.3 Monitoring, Recordkeeping, and Reporting Costs . . . . . . . . . . . 3-63.2.4 Total Annualized Costs . . . . . . . . . . . . . . . . . . . . . . . . . . . . . . . 3-6
4 Economic Impact Analysis: Methods and Results . . . . . . . . . . . . . . . . . . . . . . 4-1
4.1 Markets Affected by the Proposed NESHAP . . . . . . . . . . . . . . . . . . . . 4-1
4.2 Conceptual Approach . . . . . . . . . . . . . . . . . . . . . . . . . . . . . . . . . . . . . . 4-24.2.1 Producer Characterization . . . . . . . . . . . . . . . . . . . . . . . . . . . . . 4-24.2.2 Consumer Characterization . . . . . . . . . . . . . . . . . . . . . . . . . . . . 4-24.2.3 Foreign Trade . . . . . . . . . . . . . . . . . . . . . . . . . . . . . . . . . . . . . . . 4-34.2.4 Baseline and With-Regulation Equilibrium . . . . . . . . . . . . . . . . 4-4
4.3 Economic Impact Results . . . . . . . . . . . . . . . . . . . . . . . . . . . . . . . . . . . . 4-54.3.1 Market-Level Impacts . . . . . . . . . . . . . . . . . . . . . . . . . . . . . . . . 4-54.3.2 Industry-Level Impacts . . . . . . . . . . . . . . . . . . . . . . . . . . . . . . . . 4-6
4.3.2.1 Facility Closures and Changes in Employment . . . . . 4-74.3.3 Social Cost . . . . . . . . . . . . . . . . . . . . . . . . . . . . . . . . . . . . . . . . . 4-84.3.4 Full-Cost-Absorption Scenario . . . . . . . . . . . . . . . . . . . . . . . . 4-10
5 Small Business Impacts . . . . . . . . . . . . . . . . . . . . . . . . . . . . . . . . . . . . . . . . . . . 5-1
5.1 Identify Small Entities . . . . . . . . . . . . . . . . . . . . . . . . . . . . . . . . . . . . . . 5-1
5.2 Economic Analysis . . . . . . . . . . . . . . . . . . . . . . . . . . . . . . . . . . . . . . . . 5-2

v
5.3 Assessment . . . . . . . . . . . . . . . . . . . . . . . . . . . . . . . . . . . . . . . . . . . . . . . 5-3
References . . . . . . . . . . . . . . . . . . . . . . . . . . . . . . . . . . . . . . . . . . . . . . . . . . . . . . . . . . . R-1
vi
LIST OF FIGURES
Number Page
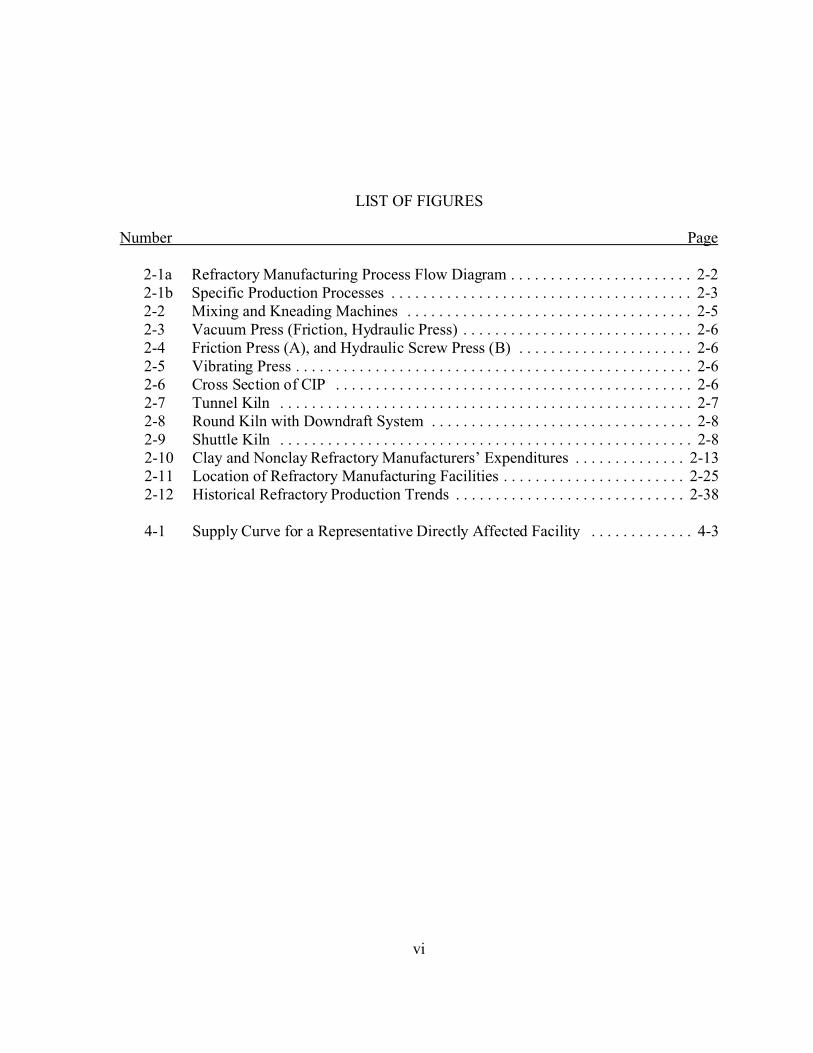
2-1a Refractory Manufacturing Process Flow Diagram . . . . . . . . . . . . . . . . . . . . . . . 2-22-1b Specific Production Processes . . . . . . . . . . . . . . . . . . . . . . . . . . . . . . . . . . . . . . 2-32-2 Mixing and Kneading Machines . . . . . . . . . . . . . . . . . . . . . . . . . . . . . . . . . . . . 2-52-3 Vacuum Press (Friction, Hydraulic Press) . . . . . . . . . . . . . . . . . . . . . . . . . . . . . 2-62-4 Friction Press (A), and Hydraulic Screw Press (B) . . . . . . . . . . . . . . . . . . . . . . 2-62-5 Vibrating Press . . . . . . . . . . . . . . . . . . . . . . . . . . . . . . . . . . . . . . . . . . . . . . . . . . 2-62-6 Cross Section of CIP . . . . . . . . . . . . . . . . . . . . . . . . . . . . . . . . . . . . . . . . . . . . . 2-62-7 Tunnel Kiln . . . . . . . . . . . . . . . . . . . . . . . . . . . . . . . . . . . . . . . . . . . . . . . . . . . . 2-72-8 Round Kiln with Downdraft System . . . . . . . . . . . . . . . . . . . . . . . . . . . . . . . . . 2-82-9 Shuttle Kiln . . . . . . . . . . . . . . . . . . . . . . . . . . . . . . . . . . . . . . . . . . . . . . . . . . . . 2-82-10 Clay and Nonclay Refractory Manufacturers’ Expenditures . . . . . . . . . . . . . . 2-132-11 Location of Refractory Manufacturing Facilities . . . . . . . . . . . . . . . . . . . . . . . 2-252-12 Historical Refractory Production Trends . . . . . . . . . . . . . . . . . . . . . . . . . . . . . 2-38
4-1 Supply Curve for a Representative Directly Affected Facility . . . . . . . . . . . . . 4-3
vii
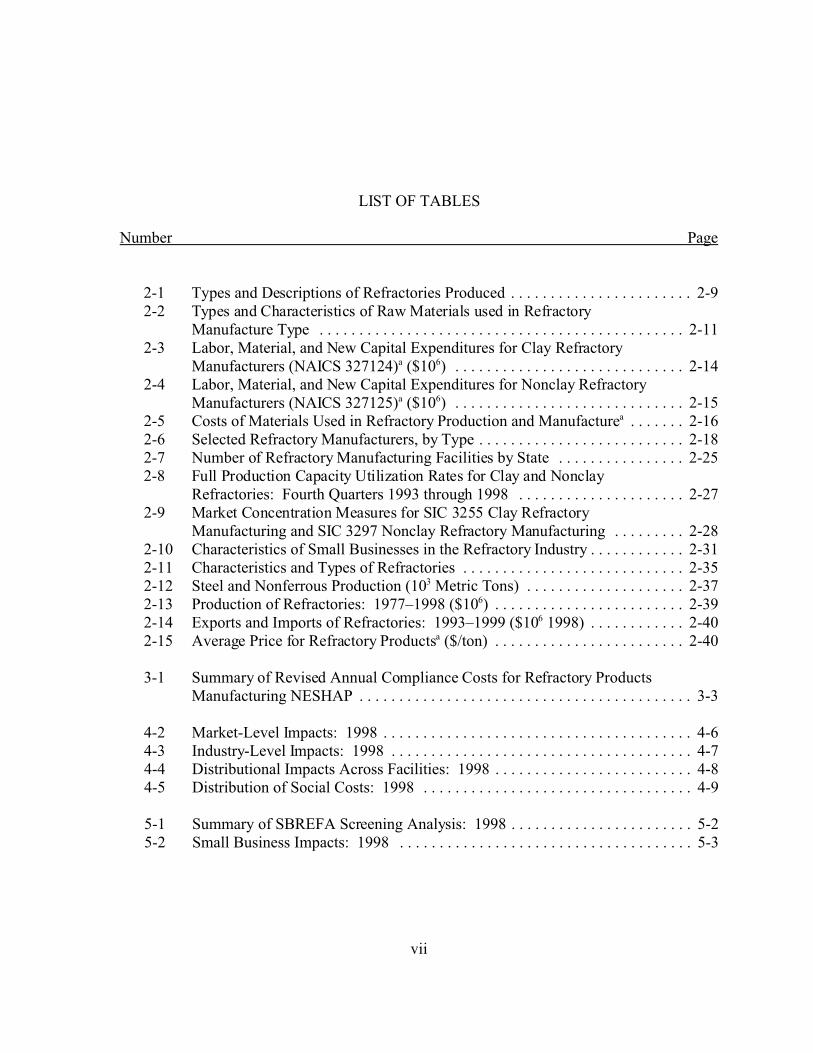
LIST OF TABLES
Number Page
2-1 Types and Descriptions of Refractories Produced . . . . . . . . . . . . . . . . . . . . . . . 2-92-2 Types and Characteristics of Raw Materials used in Refractory
Manufacture Type . . . . . . . . . . . . . . . . . . . . . . . . . . . . . . . . . . . . . . . . . . . . . . 2-112-3 Labor, Material, and New Capital Expenditures for Clay Refractory
Manufacturers (NAICS 327124)a ($106) . . . . . . . . . . . . . . . . . . . . . . . . . . . . . 2-142-4 Labor, Material, and New Capital Expenditures for Nonclay Refractory
Manufacturers (NAICS 327125)a ($106) . . . . . . . . . . . . . . . . . . . . . . . . . . . . . 2-152-5 Costs of Materials Used in Refractory Production and Manufacturea . . . . . . . 2-162-6 Selected Refractory Manufacturers, by Type . . . . . . . . . . . . . . . . . . . . . . . . . . 2-182-7 Number of Refractory Manufacturing Facilities by State . . . . . . . . . . . . . . . . 2-252-8 Full Production Capacity Utilization Rates for Clay and Nonclay
Refractories: Fourth Quarters 1993 through 1998 . . . . . . . . . . . . . . . . . . . . . 2-272-9 Market Concentration Measures for SIC 3255 Clay Refractory
Manufacturing and SIC 3297 Nonclay Refractory Manufacturing . . . . . . . . . 2-282-10 Characteristics of Small Businesses in the Refractory Industry . . . . . . . . . . . . 2-312-11 Characteristics and Types of Refractories . . . . . . . . . . . . . . . . . . . . . . . . . . . . 2-352-12 Steel and Nonferrous Production (103 Metric Tons) . . . . . . . . . . . . . . . . . . . . 2-372-13 Production of Refractories: 1977–1998 ($106) . . . . . . . . . . . . . . . . . . . . . . . . 2-392-14 Exports and Imports of Refractories: 1993–1999 ($106 1998) . . . . . . . . . . . . 2-402-15 Average Price for Refractory Productsa ($/ton) . . . . . . . . . . . . . . . . . . . . . . . . 2-40
3-1 Summary of Revised Annual Compliance Costs for Refractory ProductsManufacturing NESHAP . . . . . . . . . . . . . . . . . . . . . . . . . . . . . . . . . . . . . . . . . . 3-3
4-2 Market-Level Impacts: 1998 . . . . . . . . . . . . . . . . . . . . . . . . . . . . . . . . . . . . . . . 4-64-3 Industry-Level Impacts: 1998 . . . . . . . . . . . . . . . . . . . . . . . . . . . . . . . . . . . . . . 4-74-4 Distributional Impacts Across Facilities: 1998 . . . . . . . . . . . . . . . . . . . . . . . . . 4-84-5 Distribution of Social Costs: 1998 . . . . . . . . . . . . . . . . . . . . . . . . . . . . . . . . . . 4-9
5-1 Summary of SBREFA Screening Analysis: 1998 . . . . . . . . . . . . . . . . . . . . . . . 5-25-2 Small Business Impacts: 1998 . . . . . . . . . . . . . . . . . . . . . . . . . . . . . . . . . . . . . 5-3
DRAFT
1-1
SECTION 1
INTRODUCTION
This industry profile provides information to support the economic impact analysis
(EIA) of a proposed National Emission Standard for Hazardous Air Pollutants (NESHAP)
regarding taconite iron ore processing. Taconite mining and processing fall under the North
American Industry Classification System (NAICS) 21221 Iron Ore Mining. According to
the 1997 Economic Census of Manufacturing, in 1997, 32 establishments owned by 26
companies produced products that are categorized in NAICS 21221 (U.S. Department of
Commerce, Bureau of the Census, 2001). In 1997, these firms employed 7,920 workers and
shipped products valued at $1.9 billion (U.S. Department of Commerce, Bureau of the
Census, 2001).
Taconite, the principal iron ore mined in the United States, has a low (20 percent to
30 percent) iron (Fe) content and is found in hard, fine-grained, banded iron formations. The
main taconite iron ore deposits are located near Lake Superior in Minnesota (Mesabi Iron
Range) and Michigan (Marquette Iron Range). The taconite mining operations in Michigan
and Minnesota accounted for virtually all domestic iron ore production (Kirk, 1999a). The
following taconite ore production processes will be covered by the proposed rule (EPA,
2001):
C liberation of the iron ore by wet or dry crushing and grinding in gyratory crushers,cone crushers, rod mills, and ball mills;
C concentrating of the iron ore by magnetic separation or flotation;
C pelletization by wet tumbling with a balling drum or balling disc; and
C indurating using a vertical shaft furnace, straight grate, or grate/kiln, and materialhandling (transfer, pellet cooling) of the indurated pellets.
The economic effects of the rule are conditional on the technology for producing
taconite iron ore and their costs of production; the value of the taconite products to end users;
and the organization of the industries engaged in iron ore production and use. This profile
DRAFT
1-2
provides background information on these topics organized within a conventional economic
framework.
C Section 2 includes a detailed description of the production process for the taconitemining industry, with a brief discussion of the inputs to the production processand costs of production.
C Section 3 describes the characteristics, uses, and consumers of iron ore pellets aswell as substitution possibilities.
C Section 4 discusses the organization of the industry and provides facility- andcompany-level data. In addition, small businesses are reported separately for usein evaluating the impact on small businesses to meet the requirements of theRegulatory Flexibility Act (RFA) as amended in 1996 by the Small BusinessRegulatory Enforcement and Fairness Act (SBREFA).
C Section 5 contains market-level data on prices and quantities and discusses trendsand projections for the industry.
DRAFT
2-1
SECTION 2
THE SUPPLY SIDE
Domestic iron ore supply (production minus exports) satisfied 70 percent of domestic
demand in 2000 (McGraw-Hill, 2000). Low-grade taconite ores mined in Michigan and
Minnesota virtually accounted for all the useable ore production. Minnesota produced 76
percent of the national output of useable ore while Michigan accounted for 23 percent. The
production process typically involves four stages, and taconite iron ore is the primary input.
The production process, product characteristics and the associated costs of production are the
focus of this section.
2.1 Taconite Pellet Production Processes, Inputs and Outputs
Low-grade taconite ore in Michigan and Minnesota is the source of primary iron for
the iron and steel industry in the United States. Taconite iron ore processes are illustrated in
Figure 2-1. Figure 2-1 also demonstrates the emission points from taconite ore production.
Three types of hazardous air pollutants (HAPs) are released from the processes: acidic gases
(hydrochloric and hydrofluoric acid), metallic particulate matters, and products of
incomplete combustion (PICs) (EPA, 2001).
2.1.1 Mining of Crude Ore
Iron ore is a mineral substance that, when heated in the presence of a reductant, yields
metallic iron (Fe). It almost always consists of iron oxides, the primary forms of which are
magnetite (Fe3O4—iron content 72.4 percent), hematite (Fe2O3—iron content 69.9 percent),
and goethite (Fe2O3H2O—iron content 62.9 percent) (McKetta, 1988). In the United States,
iron ore is mined and processed primarily on the Mesabi Iron Range of northern Minnesota
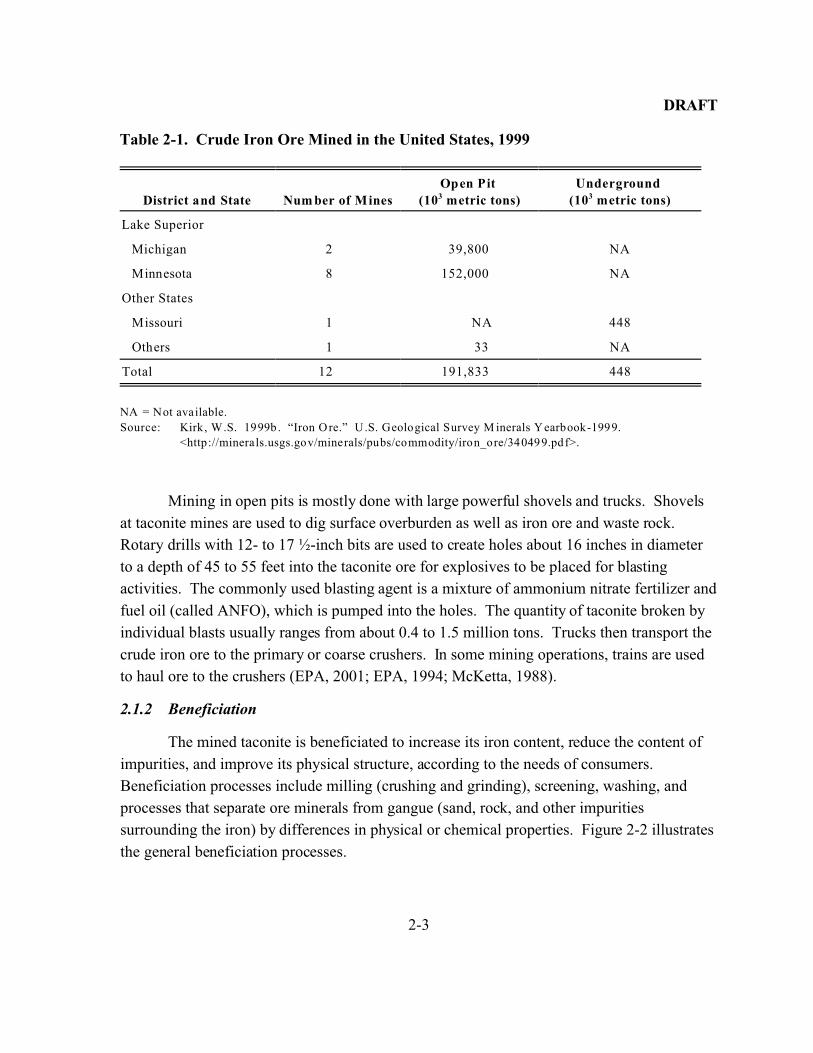
and the Marquette Iron Range of the Upper Peninsula of Michigan (see Table 2-1).
Domestic taconite is mined from open pits because most commercial ore bodies lie close to
the surface and their lateral dimensions are large. Mining activities involve overburden
removal, drilling, blasting, and removal of waste rock and crude taconite from the open-pit
(EPA, 2001).

DRAFT
2-2Figure 2-1. Process Flow Diagram for Taconite Iron Ore Processing
DRAFT
2-3
Table 2-1. Crude Iron Ore Mined in the United States, 1999
District and State Num ber of Mines
Open Pit
(103 metric tons)
Underground
(103 metric tons)
Lake Superior
Michigan 2 39,800 NA
Minnesota 8 152,000 NA
Other States
Missouri 1 NA 448
Others 1 33 NA
Total 12 191,833 448
NA = Not available.
Source: Kirk, W.S. 1999b . “Iron Ore.” U.S. Geological Survey M inerals Yearbook-1999.
<http://minerals.usgs.gov/minerals/pubs/commodity/iron_ore/340499.pdf>.
Mining in open pits is mostly done with large powerful shovels and trucks. Shovels
at taconite mines are used to dig surface overburden as well as iron ore and waste rock.
Rotary drills with 12- to 17 ½-inch bits are used to create holes about 16 inches in diameter
to a depth of 45 to 55 feet into the taconite ore for explosives to be placed for blasting
activities. The commonly used blasting agent is a mixture of ammonium nitrate fertilizer and
fuel oil (called ANFO), which is pumped into the holes. The quantity of taconite broken by
individual blasts usually ranges from about 0.4 to 1.5 million tons. Trucks then transport the
crude iron ore to the primary or coarse crushers. In some mining operations, trains are used
to haul ore to the crushers (EPA, 2001; EPA, 1994; McKetta, 1988).
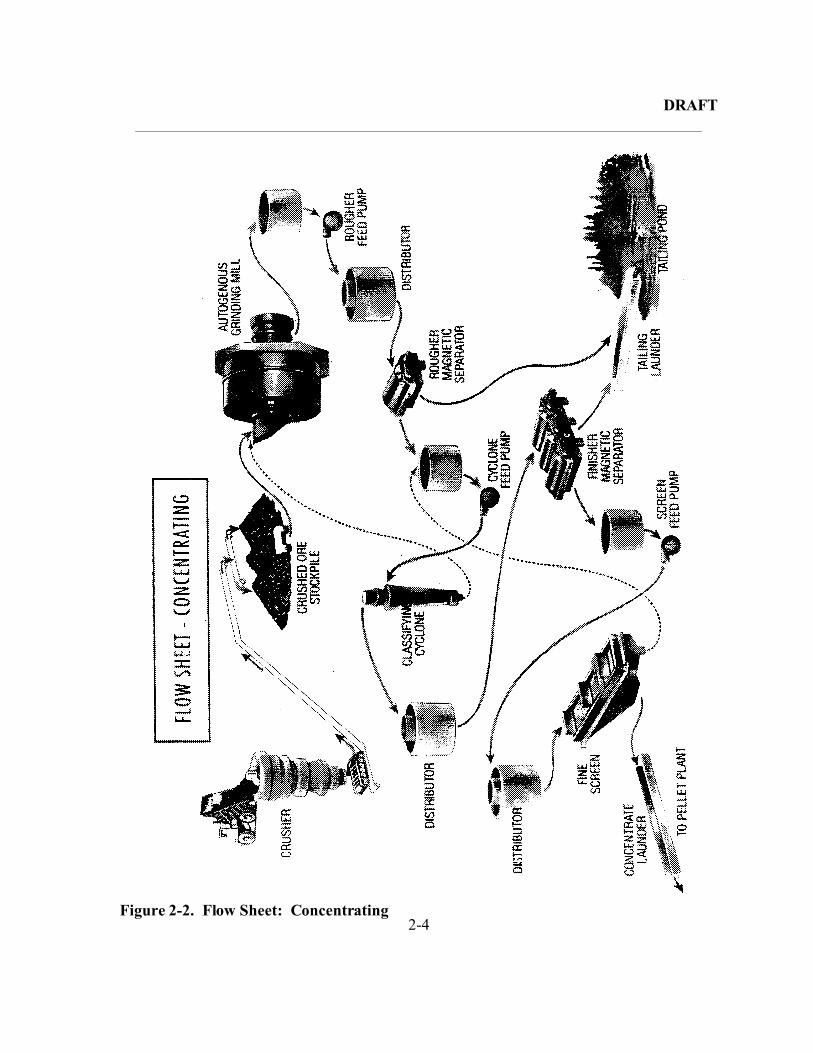
2.1.2 Beneficiation
The mined taconite is beneficiated to increase its iron content, reduce the content of
impurities, and improve its physical structure, according to the needs of consumers.
Beneficiation processes include milling (crushing and grinding), screening, washing, and
processes that separate ore minerals from gangue (sand, rock, and other impurities
surrounding the iron) by differences in physical or chemical properties. Figure 2-2 illustrates
the general beneficiation processes.
DRAFT
2-4Figure 2-2. Flow Sheet: Concentrating
DRAFT
2-5
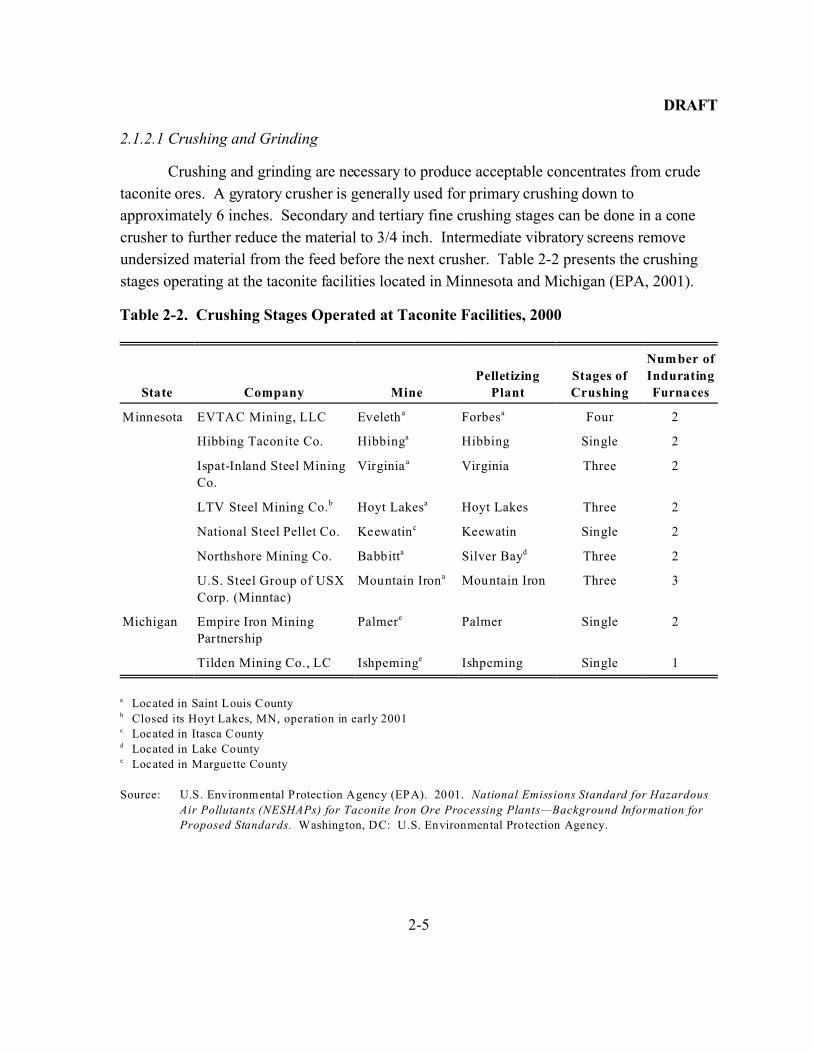
Table 2-2. Crushing Stages Operated at Taconite Facilities, 2000
State Company Mine
Pelletizing
Plant
Stages of
Crushing
Number of
Indurating
Furnaces
Minnesota EVTAC Mining, LLC Eveletha Forbesa Four 2
Hibbing Taconite Co. Hibbinga Hibbing Single 2
Ispat-Inland Steel Mining
Co.
Virginia a Virginia Three 2
LTV Steel Mining Co.b Hoyt Lakesa Hoyt Lakes Three 2
National Steel Pellet Co. Keewatinc Keewatin Single 2
Northshore Mining Co. Babbitta Silver Bayd Three 2
U.S. Steel Group of USX
Corp. (Minntac)
Mountain Irona Mountain Iron Three 3
Michigan Empire Iron Mining
Partnership
Palmere Palmer Single 2
Tilden Mining Co., LC Ishpeminge Ishpeming Single 1
a Located in Saint Louis Countyb Closed its Hoyt Lakes, MN, operation in early 2001c Located in Itasca Countyd Located in Lake Countye Located in Marguette County
Source: U.S. Environmental Protection Agency (EPA). 2001. National Emissions Standard for Hazardous
Air Pollutants (NESHAPs) for Taconite Iron Ore Processing Plants—Background Information for
Proposed Standards. Washington, DC: U.S. Environmental Protection Agency.
2.1.2.1 Crushing and Grinding
Crushing and grinding are necessary to produce acceptable concentrates from crude
taconite ores. A gyratory crusher is generally used for primary crushing down to
approximately 6 inches. Secondary and tertiary fine crushing stages can be done in a cone
crusher to further reduce the material to 3/4 inch. Intermediate vibratory screens remove
undersized material from the feed before the next crusher. Table 2-2 presents the crushing
stages operating at the taconite facilities located in Minnesota and Michigan (EPA, 2001).
DRAFT
2-6
After crushing, the crushed ore is sent to rod mills for fine grinding, then followed by
either ball or pebble mills (McKetta, 1988). A rod/ball mill is a large horizontal cylinder that
rotates on its horizontal axis and is charged with heavy steel rods or balls and taconite ore
with water slurry. The taconite ore slurry discharged from the rod/ball mills is passed
through multiple stages of magnetic separation (EPA, 2001). In some cases, autogenous
grinding can be used to replace the cone crushers and rod mills. Autogenous mills use coarse
pieces of the ore itself as grinding media instead of steel balls and rods (Kirk-Othmer, 1995).
2.1.2.2 Magnetic Separation
Magnetic separation involves three stages of separation: cobbing, cleaning/roughing,
and finishing. Each stage works on finer particles as a result of removing oversized particles
in earlier separations. Ore material not picked up by magnetic separators is rejected as
nonmagnetic gangue or tailings. Cobbers and rotating cylinders are partially submerged in
the taconite ore slurry, which allows iron-bearing particles to adhere to the magnetized
cylinder surface. As the cylinder surface rotates past the magnetic field, the iron-bearing ore
drops from the cylinder surface and into a weir located just below the point where the
magnetic field ends. About 40 percent of the feed is rejected as tailings, which are re-ground
to extract as much iron as possible. Cleaners and finishers then work on ore particles in the
range of 48 mesh and less than 100 mesh, respectively. Tailings from these two stages are
sometimes re-ground or discharged to the tailing basin (EPA, 2001; EPA 1994).
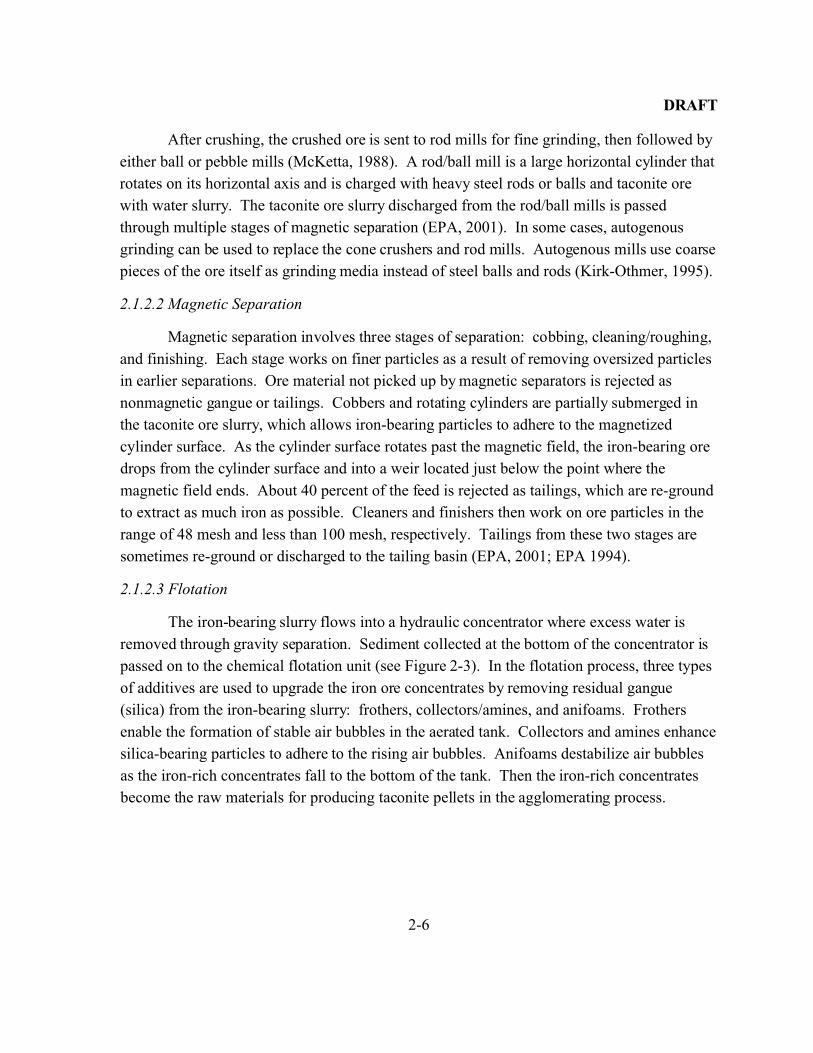
2.1.2.3 Flotation
The iron-bearing slurry flows into a hydraulic concentrator where excess water is
removed through gravity separation. Sediment collected at the bottom of the concentrator is
passed on to the chemical flotation unit (see Figure 2-3). In the flotation process, three types
of additives are used to upgrade the iron ore concentrates by removing residual gangue
(silica) from the iron-bearing slurry: frothers, collectors/amines, and anifoams. Frothers
enable the formation of stable air bubbles in the aerated tank. Collectors and amines enhance
silica-bearing particles to adhere to the rising air bubbles. Anifoams destabilize air bubbles
as the iron-rich concentrates fall to the bottom of the tank. Then the iron-rich concentrates
become the raw materials for producing taconite pellets in the agglomerating process.
DRAFT
2-7
Figure 2-3. Cross-Section of a Typical Flotation Cell
DRAFT
2-8
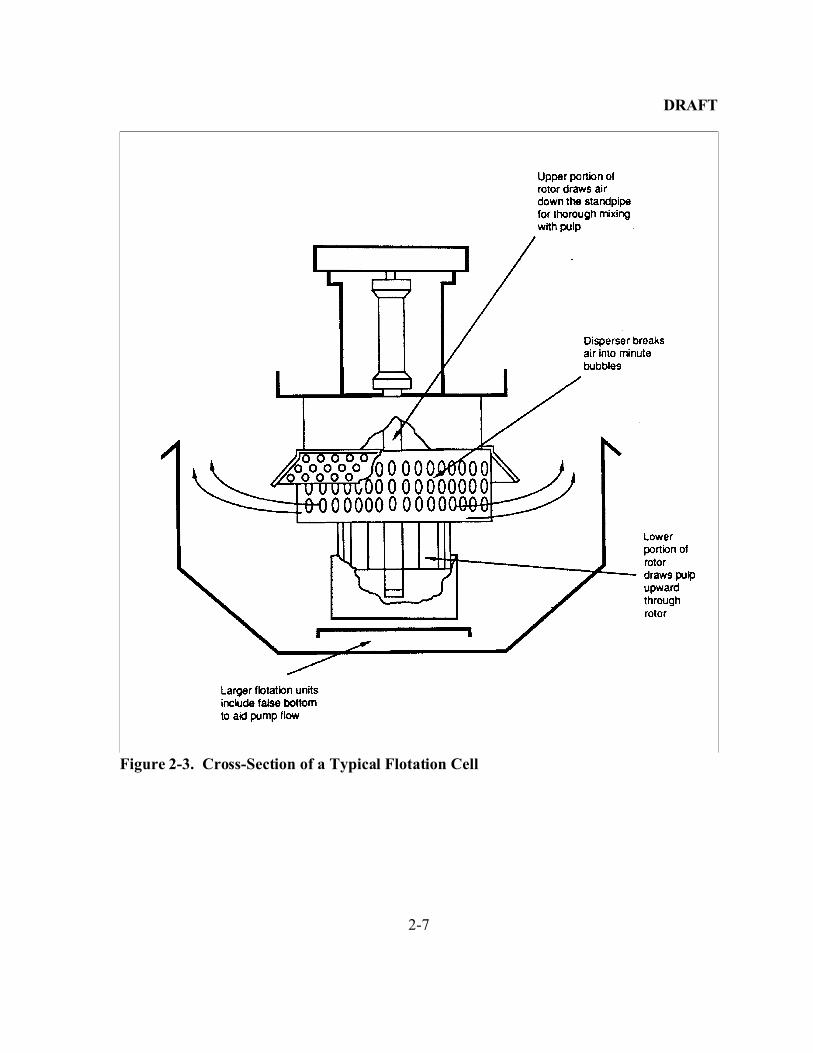
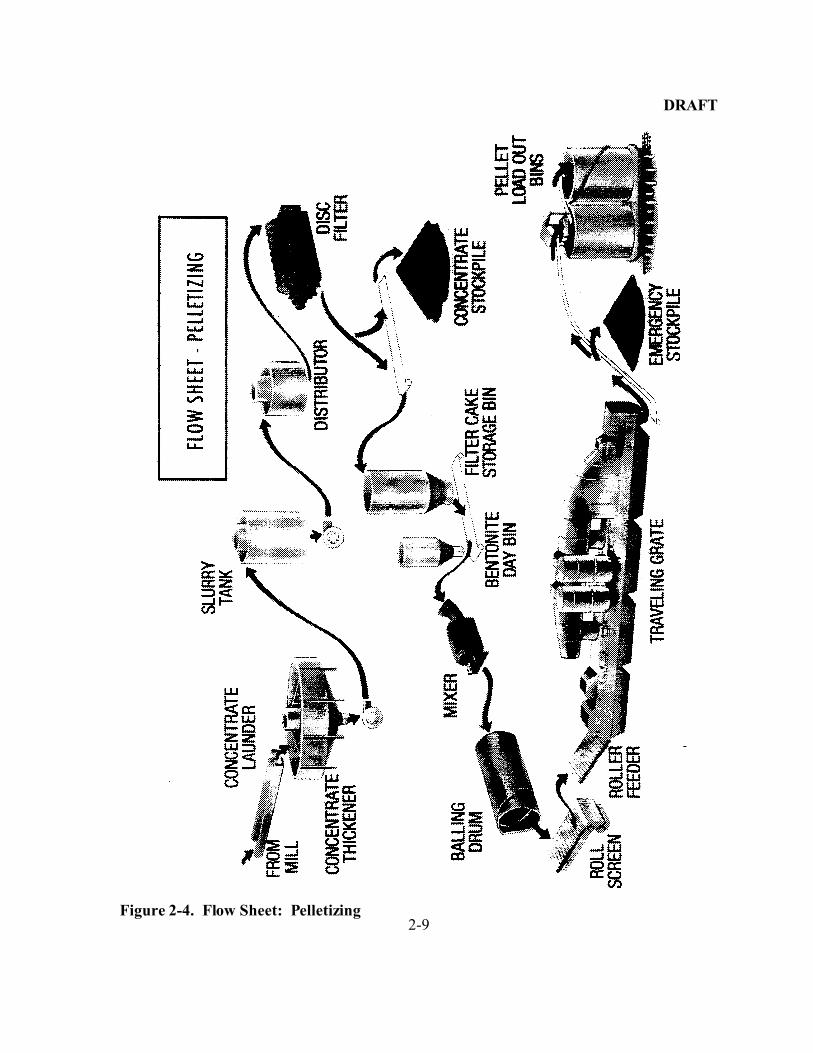
2.1.3 Agglomeration
After concentration activities, agglomeration is used to combine the iron-rich
concentrates into pellets, sinter, briquettes, or nodules. This section focuses only on the
pelletizing (indurating) processes because pellets account for more than 95 percent of
domestic iron ore production. Figure 2-4 presents the typical pelletizing procedures. In the
pelletizing processes, the iron-rich concentrates are mixed with water and a binder, normally
bentonite (clay), hydrated lime, or organic material (peridor). Then the concentrate is rolled
into marble-sized balls (3/8 to 5/8 inch [9-15 mm] in diameter) inside large rotating
cylinders. These green (moist and unfired) balls are then dried and heated to 2,354 to
2,552°F. The induration or heating of the green balls can be done in a vertical shaft furnace
on a travel grate (straight grate) or by a combination of a travel grate and a rotary kiln (grate-
kiln). The finished product is taconite pellets. As Table 2-3 shows, the travel grate and
grate-kiln are the most commonly used in the pelletizing processes in the United States
(EPA, 2001; EPA, 1994).
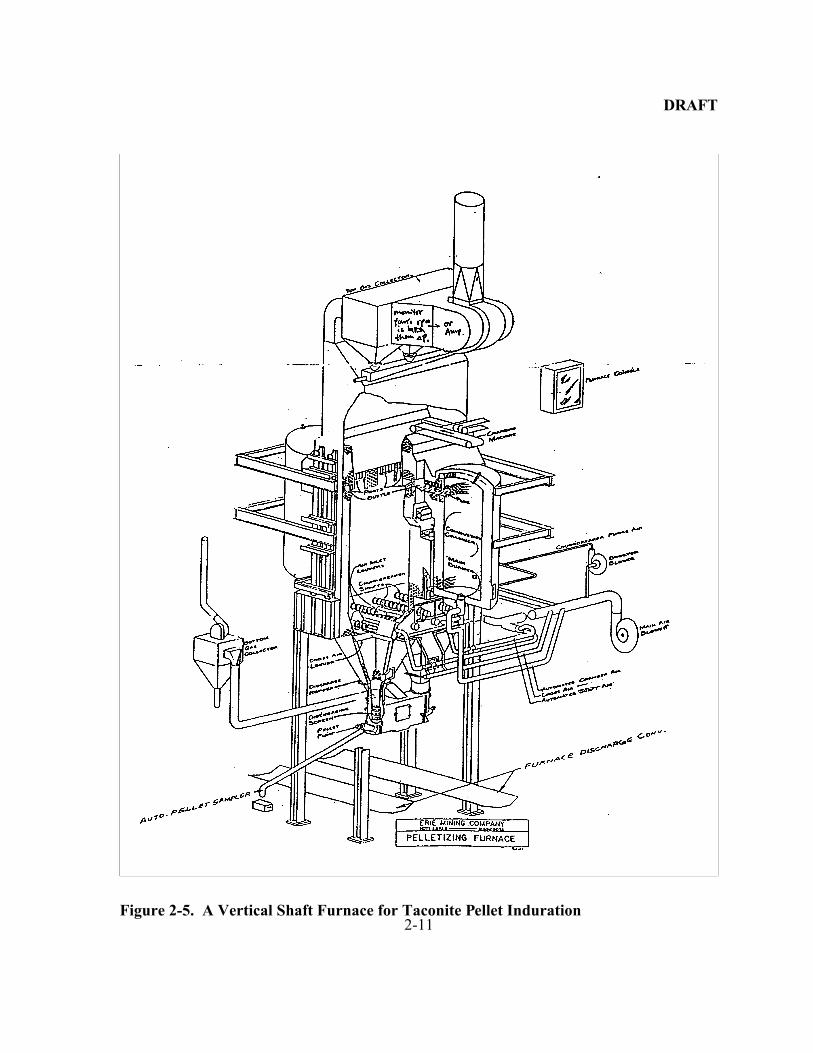
Vertical Shaft Furnace. In the vertical shaft furnace (see Figure 2-5), the green
pellets are distributed across the top of a conveyor belt that descends at a rate of 1 to 1.5
inches per minute. The pellets are dried and heated to 2,400°F and move downwards
through firing and cooling zones. The bottom two-thirds of the furnace is used to cool the
pellets. The pellets are discharged from hoppers at the bottom. In 2000, LTV Steel Mining
Company was the only taconite plant in the United States that used vertical shaft furnaces.
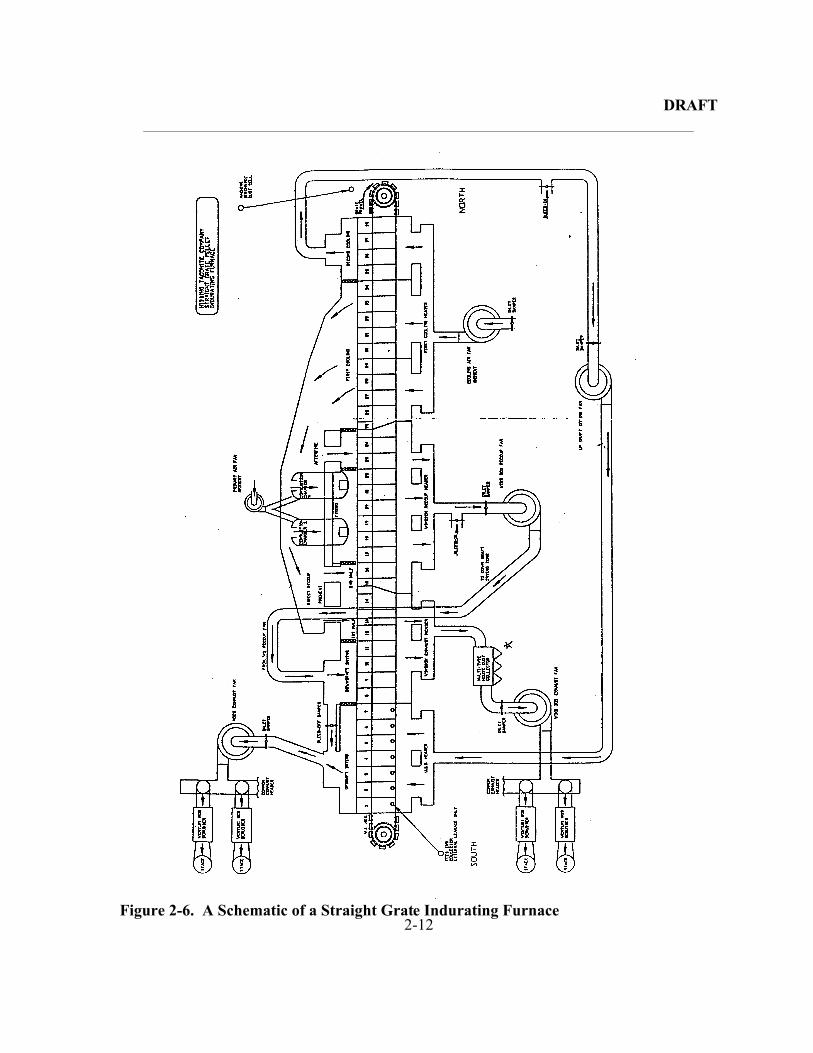
Travel Grate (Straight Grate). As shown in Figure 2-6, the green pellets are fed to a
travel grate to be dried and preheated. The pellets then are carried to the ignition section of
the grate, where all the magnetite is oxidized to hematite. Finally, the pellets are cooled by
intake air at cooling stages before they are discharged by conveyor belt to storage. In 2000,
Hibbing Taconite Company, Ispat-Inland Steel Mining Company, and Northshore Mining
Company used travel grate indurating furnaces.
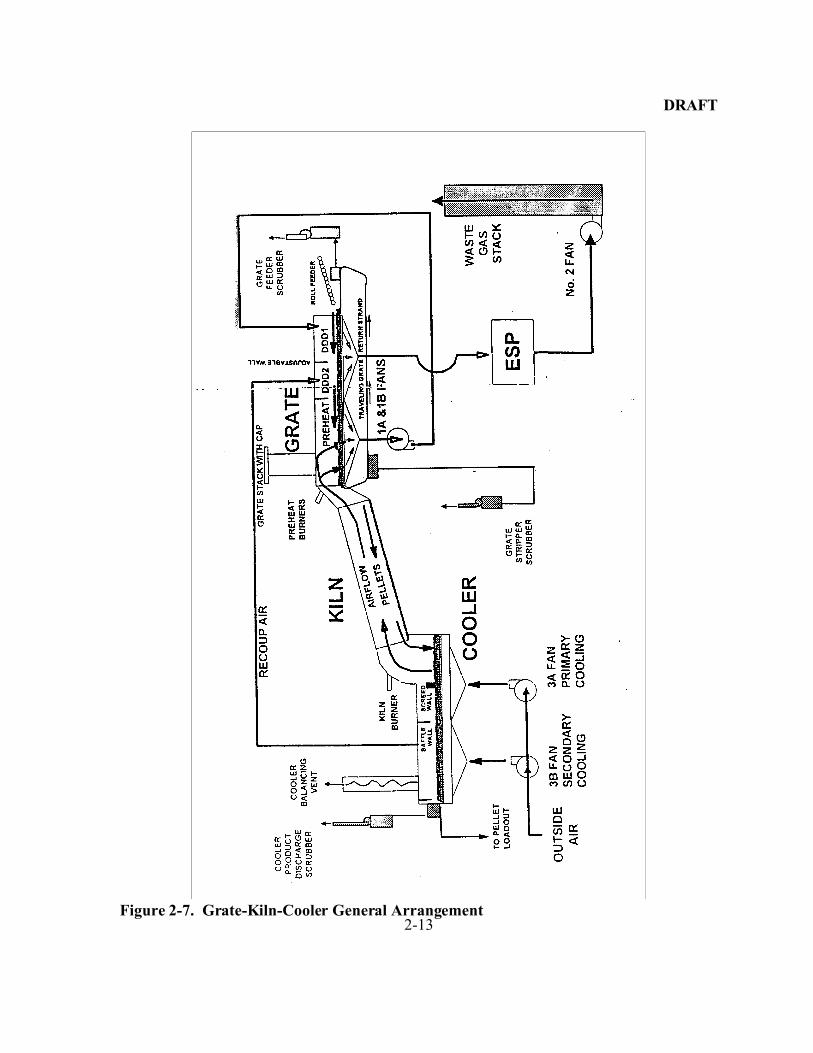
Grate-Kiln. The grate-kiln system combines a travel grate, a rotary kiln, and an
annular cooler (see Figure 2-7). Drying of the green pellets and partial induration occur at
the grate while final induration is finished in the rotary kiln. The pellets are heated to a
temperature of 2,000°F on the travel grate before being hardened in the rotary kiln furnace.
DRAFT
2-9Figure 2-4. Flow Sheet: Pelletizing
DRAFT
2-10
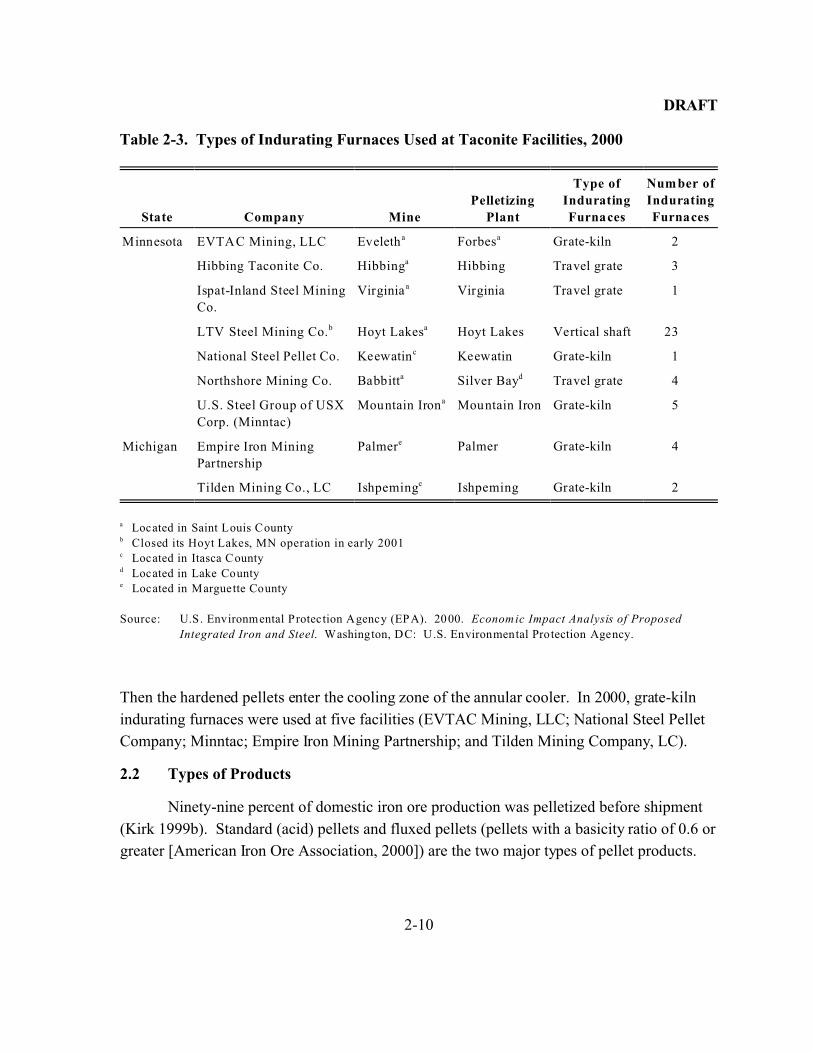
Table 2-3. Types of Indurating Furnaces Used at Taconite Facilities, 2000
State Company Mine
Pelletizing
Plant
Type of
Indurating
Furnaces
Number of
Indurating
Furnaces
Minnesota EVTAC Mining, LLC Eveletha Forbesa Grate-kiln 2
Hibbing Taconite Co. Hibbinga Hibbing Travel grate 3
Ispat-Inland Steel Mining
Co.
Virginia a Virginia Travel grate 1
LTV Steel Mining Co.b Hoyt Lakesa Hoyt Lakes Vertical shaft 23
National Steel Pellet Co. Keewatinc Keewatin Grate-kiln 1
Northshore Mining Co. Babbitta Silver Bayd Travel grate 4
U.S. Steel Group of USX
Corp. (Minntac)
Mountain Irona Mountain Iron Grate-kiln 5
Michigan Empire Iron Mining
Partnership
Palmere Palmer Grate-kiln 4
Tilden Mining Co., LC Ishpeminge Ishpeming Grate-kiln 2
a Located in Saint Louis Countyb Closed its Hoyt Lakes, MN operation in early 2001c Located in Itasca Countyd Located in Lake Countye Located in Marguette County
Source: U.S. Environmental Protection Agency (EPA). 2000. Economic Impact Analysis of Proposed
Integrated Iron and Steel. Washington, DC: U.S. Environmental Protection Agency.
Then the hardened pellets enter the cooling zone of the annular cooler. In 2000, grate-kiln
indurating furnaces were used at five facilities (EVTAC Mining, LLC; National Steel Pellet
Company; Minntac; Empire Iron Mining Partnership; and Tilden Mining Company, LC).
2.2 Types of Products
Ninety-nine percent of domestic iron ore production was pelletized before shipment
(Kirk 1999b). Standard (acid) pellets and fluxed pellets (pellets with a basicity ratio of 0.6 or
greater [American Iron Ore Association, 2000]) are the two major types of pellet products.
DRAFT
2-11Figure 2-5. A Vertical Shaft Furnace for Taconite Pellet Induration
DRAFT
2-12Figure 2-6. A Schematic of a Straight Grate Indurating Furnace
DRAFT
2-13Figure 2-7. Grate-Kiln-Cooler General Arrangement
DRAFT
2-14
In addition to iron, standard pellets can include silica, alumina, magnesia, manganese,
phosphorus, and sulfur. Fluxed pellets contain a certain amount of limestone (calcium
carbonate, CaCO3) and/or dolomite in addition to all the constituents of standard pellets.
Sometimes fluxed pellets are characterized by basicity ratio, which is a mass ratio of the sum
of calcium oxide and magnesium oxide divided by the sum of silicon oxide and aluminum
oxide:
Basicity ratio = [(CaO + MgO)/(SiO2 + Al2O3)]
Fluxed pellets of at least 1.0 basicity ratio are called fully fluxed pellets. Fluxed pellets’
share of total pellet production was 61.5 percent in 1999 while the total pellet production was
57.1 million tons.
2.3 Major By-Products, Co-Products, and Input Substitution Possibilities
Manganese, phosphorus (apatite), cobalt, copper, vanadium, and small quantities of
silver and gold are the by-products or co-products of U.S. iron ores. Manganese has a close
association with iron so that the oxides of both metals are usually smelted together. Cobalt
was an important by-product of iron ore mined in Pennsylvania until 1972. Both vanadium
and cobalt are not economically recoverable (McKetta, 1988).
Iron ore is the only source of primary iron. Hematite (jaspilite), magnetite (taconite),
goethite (limonite), siderite, ilmenite, and pyrite are the major types of iron ores mined.
Hematite, magnetite, and goethite are the most common ore types in the United States. The
main iron ore deposits in the United States are located in Michigan and Minnesota, which are
primarily magnetite and hematite with a small amount of goethite. Other minor iron ore
deposits located in Missouri and Utah are the possible substitutes for taconite. Besides
domestic iron ores, imported iron ore products, such as iron-rich concentrates, fine ores, and
pellets, are used as substitutes for taconite ore.
2.4 Costs of Production and Plant Size Efficiency
This section examines the costs of production as reported in the 1997 Economic
Census of Mining for the iron ore industry, historical costs for the industry, and plant size
efficiency. These figures are reported for NAICS 21221, Iron Ore Mining.
DRAFT
2-15
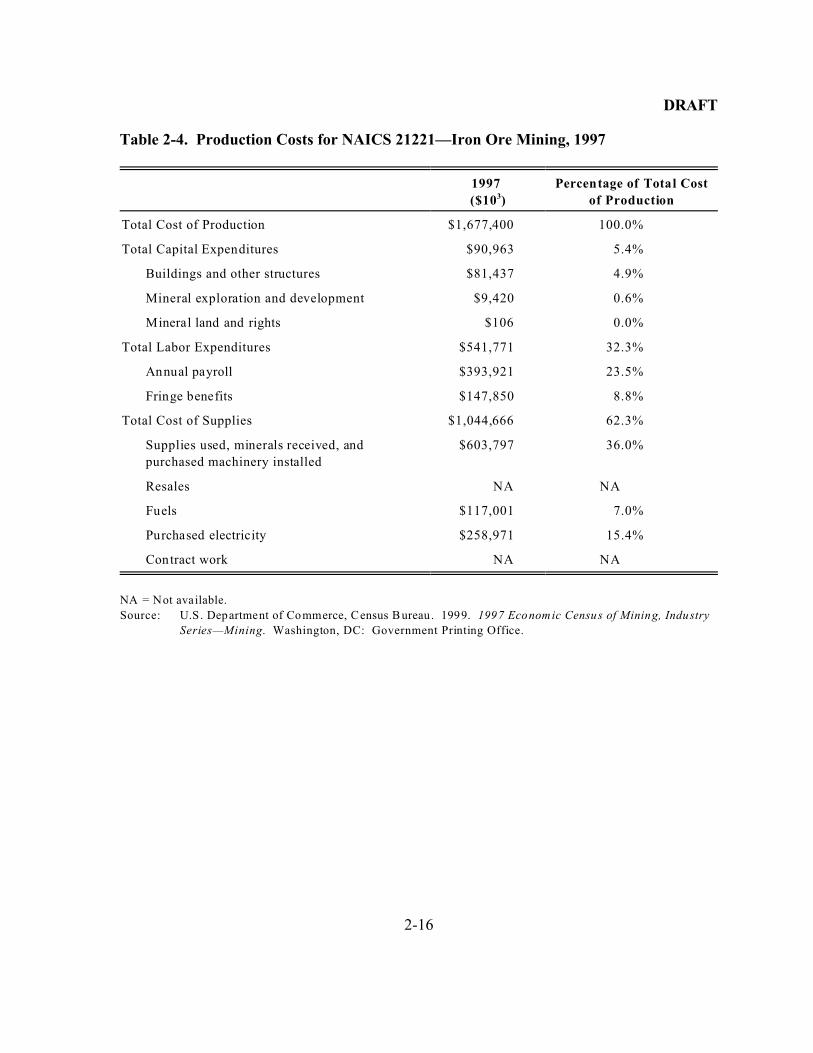
2.4.1 Costs of Production
The three primary types of production costs for the iron ore industry are capital
expenditures, labor expenses, and cost of inputs used. Each of these cost categories is
discussed below for the iron ore industry (U.S. Department of Commerce, Bureau of the
Census, 1999).
C As shown in Table 2-4, capital costs in 1997 for the iron ore industry totaledapproximately $91 million, or 5 percent of total production costs. Buildings andother structures accounted for $81 million (about 90 percent of capital costs)while $9 million (10 percent of these costs) can be attributed to mineralexploration and development. The expenditures for mineral land and rightsamounted $0.1 million.
C The iron ore industry spent approximately $542 million in 1997 on labor for atotal of 32 percent of total production costs. Twenty-seven percent of labor costswere spent on fringe benefits, and the remaining expenditures (about $394million) went toward the annual payroll.
C Cost of inputs used for the iron ore industry totaled $1 billion in 1997. Suppliesused, minerals received, and purchased machinery installation costs accounted forthe most significant portion of this cost (approximately 58 percent). Othermaterial costs included $117 million for fuel expenditures and about $259 millionfor purchased electricity.
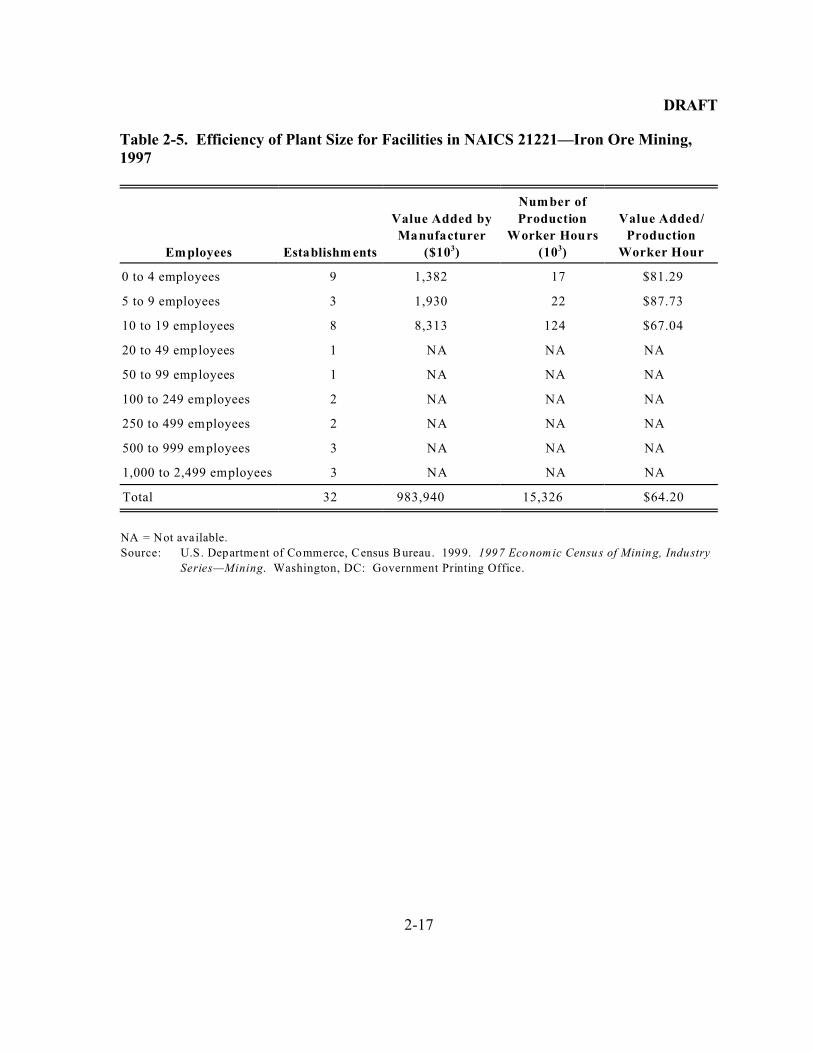
2.4.2 Economies of Size
Table 2-5 provides information on the efficiency of plant size for facilities in NAICS
21221. Using the value added per production worker as a measure of efficiency, there are no
apparent economies of size for the iron ore industry. As Table 2-5 shows, the overall value
added per production worker hour was $64.20. For those facilities with five to nine
employees, the value added per production worker hour peaked at $87.73. However,
companies with 20 or more employees chose not to disclose data on their employment and
annual payroll.
DRAFT
2-16
Table 2-4. Production Costs for NAICS 21221—Iron Ore Mining, 1997
1997
($103)
Percentage of Total Cost
of Production
Total Cost of Production $1,677,400 100.0%
Total Capital Expenditures $90,963 5.4%
Buildings and other structures $81,437 4.9%
Mineral exploration and development $9,420 0.6%
Mineral land and rights $106 0.0%
Total Labor Expenditures $541,771 32.3%
Annual payroll $393,921 23.5%
Fringe benefits $147,850 8.8%
Total Cost of Supplies $1,044,666 62.3%
Supplies used, minerals received, and
purchased machinery installed
$603,797 36.0%
Resales NA NA
Fuels $117,001 7.0%
Purchased electricity $258,971 15.4%
Contract work NA NA
NA = Not available.
Source: U.S. Department of Commerce, Census B ureau. 1999. 1997 Economic Census of Mining, Industry
Series—Mining. Washington, DC: Government Printing Office.
DRAFT
2-17
Table 2-5. Efficiency of Plant Size for Facilities in NAICS 21221—Iron Ore Mining,1997
Employees Establishm ents
Value Added by
Manufacturer
($103)
Number of
Production
Worker Hours
(103)
Value Added/
Production
Worker Hour
0 to 4 employees 9 1,382 17 $81.29
5 to 9 employees 3 1,930 22 $87.73
10 to 19 employees 8 8,313 124 $67.04
20 to 49 employees 1 NA NA NA
50 to 99 employees 1 NA NA NA
100 to 249 employees 2 NA NA NA
250 to 499 employees 2 NA NA NA
500 to 999 employees 3 NA NA NA
1,000 to 2,499 employees 3 NA NA NA
Total 32 983,940 15,326 $64.20
NA = Not available.
Source: U.S. Department of Commerce, Census B ureau. 1999. 1997 Economic Census of Mining, Industry
Series—Mining. Washington, DC: Government Printing Office.
DRAFT
3-1
SECTION 3
THE DEMAND SIDE
In addition to the supply side, estimating the economic impacts of the regulation on
the taconite iron ore manufacturing industry requires characterizing various aspects of the
demand for taconite pellets. This section describes the product characteristics desired by end
users and possible substitutes for taconite pellets.
3.1 Uses and Consumers
3.1.1 Uses
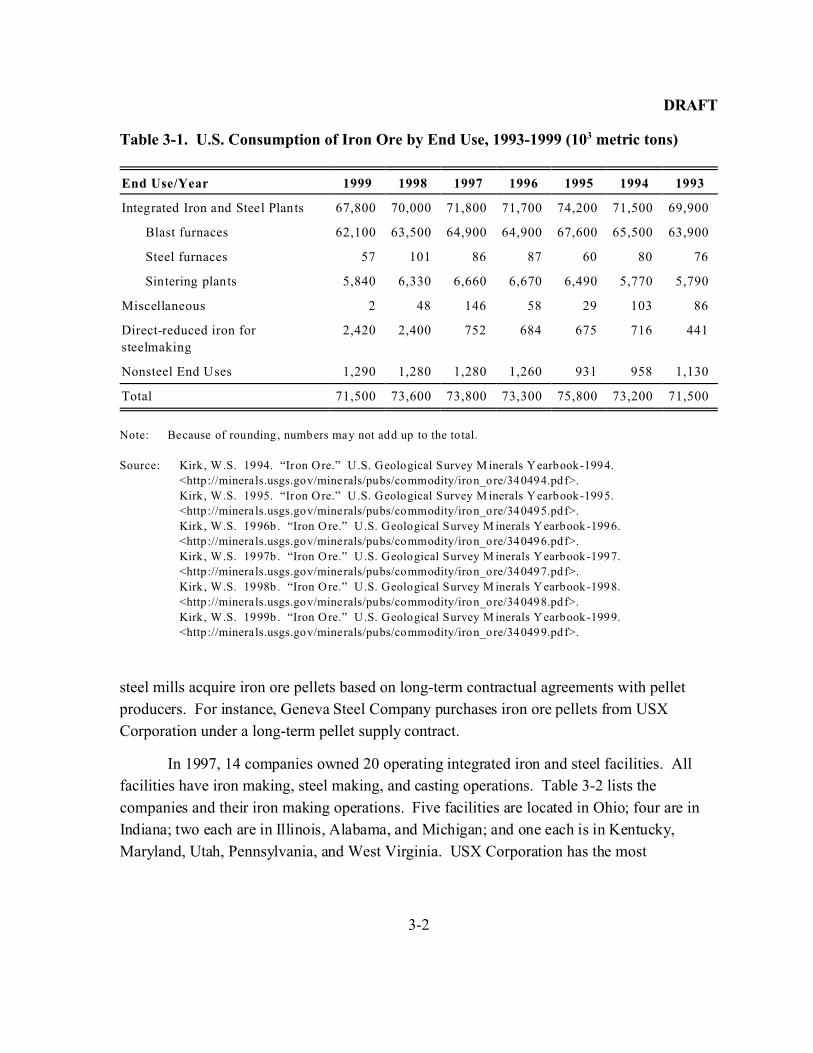
Taconite pellets are primarily consumed by iron and steel producers. As Table 3-1
illustrates, almost all (98 percent) of the iron ore produced in the United States was used for
manufacturing iron and steel in 1999. During the same year, integrated iron and steel plants
consumed about 95 percent of domestic iron ore production. The use of iron ore in
integrated iron and steel mills has been steadily decreasing since 1995. In addition to the
taconite pellets consumed in the iron and steel industry, the remaining 2 percent of taconite
ore production is used in manufacturing other commodities such as cement, heavy-medium
materials, ballast, iron oxide pigments, high-density concrete, ferrites, specialty chemicals,
and additives to animal feed (McKetta, 1988).
3.1.2 Consumer Characteristics
As of 1999, 60 percent of taconite pellet production was produced for captive use
(Kirk, 1999b). That is, taconite ore is mined, processed into pellets, and used in company-
owned blast furnaces to make iron and steel; the plants performing different steps in the
process are owned by a single company or by related companies. For example, Ispat-Inland
International N.V., USX Corporation, and Rouge Industries Incorporated have ownership
interests in mines to ensure secure sources of iron ore for their integrated steel mills. Other
DRAFT
3-2
Table 3-1. U.S. Consumption of Iron Ore by End Use, 1993-1999 (103 metric tons)
End Use/Year 1999 1998 1997 1996 1995 1994 1993
Integrated Iron and Steel Plants 67,800 70,000 71,800 71,700 74,200 71,500 69,900
Blast furnaces 62,100 63,500 64,900 64,900 67,600 65,500 63,900
Steel furnaces 57 101 86 87 60 80 76
Sintering plants 5,840 6,330 6,660 6,670 6,490 5,770 5,790
Miscellaneous 2 48 146 58 29 103 86
Direct-reduced iron for
steelmaking
2,420 2,400 752 684 675 716 441
Nonsteel End Uses 1,290 1,280 1,280 1,260 931 958 1,130
Total 71,500 73,600 73,800 73,300 75,800 73,200 71,500
Note: Because of rounding, numbers may not add up to the total.
Source: Kirk, W.S. 1994. “Iron Ore.” U.S. Geological Survey M inerals Yearbook-1994.
<http://minerals.usgs.gov/minerals/pubs/commodity/iron_ore/340494.pdf>.
Kirk, W.S. 1995. “Iron Ore.” U.S. Geological Survey M inerals Yearbook-1995.
<http://minerals.usgs.gov/minerals/pubs/commodity/iron_ore/340495.pdf>.
Kirk, W.S. 1996b . “Iron Ore.” U.S. Geological Survey M inerals Yearbook-1996.
<http://minerals.usgs.gov/minerals/pubs/commodity/iron_ore/340496.pdf>.
Kirk, W.S. 1997b . “Iron Ore.” U.S. Geological Survey M inerals Yearbook-1997.
<http://minerals.usgs.gov/minerals/pubs/commodity/iron_ore/340497.pdf>.
Kirk, W.S. 1998b . “Iron Ore.” U.S. Geological Survey M inerals Yearbook-1998.
<http://minerals.usgs.gov/minerals/pubs/commodity/iron_ore/340498.pdf>.
Kirk, W.S. 1999b . “Iron Ore.” U.S. Geological Survey M inerals Yearbook-1999.
<http://minerals.usgs.gov/minerals/pubs/commodity/iron_ore/340499.pdf>.
steel mills acquire iron ore pellets based on long-term contractual agreements with pellet
producers. For instance, Geneva Steel Company purchases iron ore pellets from USX
Corporation under a long-term pellet supply contract.
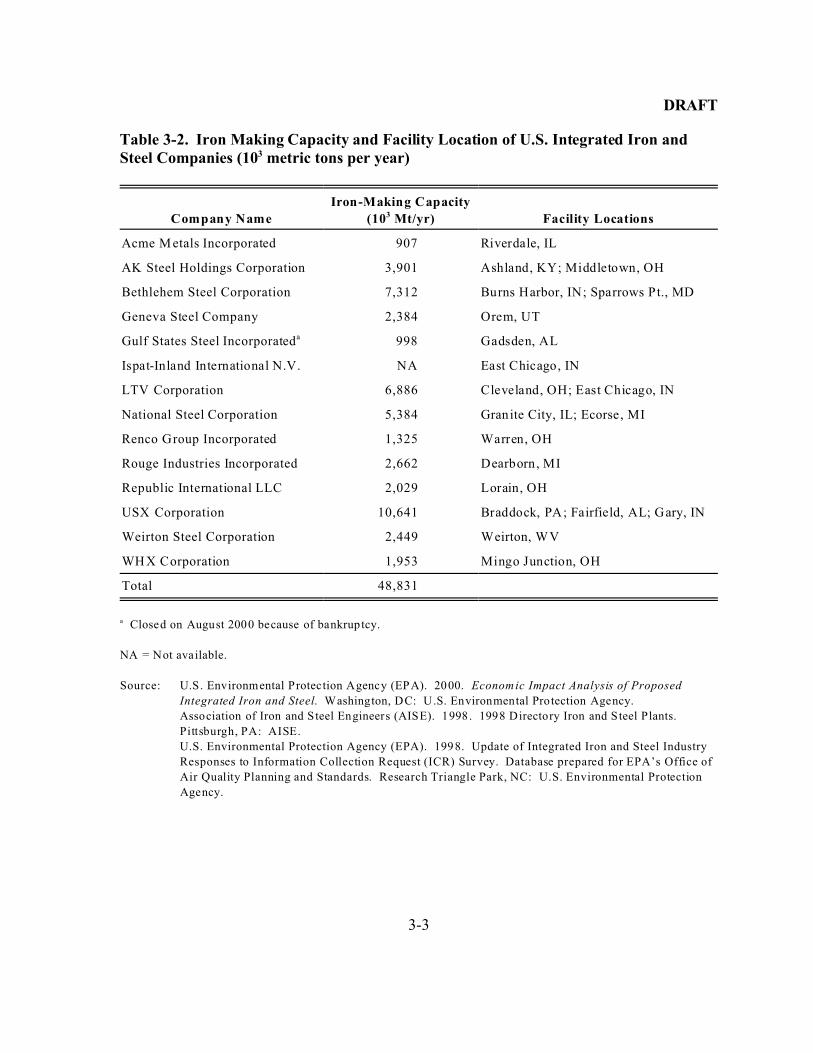
In 1997, 14 companies owned 20 operating integrated iron and steel facilities. All
facilities have iron making, steel making, and casting operations. Table 3-2 lists the
companies and their iron making operations. Five facilities are located in Ohio; four are in
Indiana; two each are in Illinois, Alabama, and Michigan; and one each is in Kentucky,
Maryland, Utah, Pennsylvania, and West Virginia. USX Corporation has the most
DRAFT
3-3
Table 3-2. Iron Making Capacity and Facility Location of U.S. Integrated Iron andSteel Companies (103 metric tons per year)
Company Name
Iron-Making Capacity
(103 Mt/yr) Facility Locations
Acme M etals Incorporated 907 Riverdale, IL
AK Steel Holdings Corporation 3,901 Ashland, KY; Middletown, OH
Bethlehem Steel Corporation 7,312 Burns Harbor, IN; Sparrows Pt., MD
Geneva Steel Company 2,384 Orem, UT
Gulf States Steel Incorporateda 998 Gadsden, AL
Ispat-Inland International N.V. NA East Chicago, IN
LTV Corporation 6,886 Cleveland, OH; East Chicago, IN
National Steel Corporation 5,384 Granite City, IL; Ecorse, MI
Renco Group Incorporated 1,325 Warren, OH
Rouge Industries Incorporated 2,662 Dearborn, MI
Republic International LLC 2,029 Lorain, OH
USX Corporation 10,641 Braddock, PA; Fairfield, AL; Gary, IN
Weirton Steel Corporation 2,449 Weirton, WV
WHX Corporation 1,953 Mingo Junction, OH
Total 48,831
a Closed on August 2000 because of bankruptcy.
NA = Not available.
Source: U.S. Environmental Protection Agency (EPA). 2000. Economic Impact Analysis of Proposed
Integrated Iron and Steel. Washington, DC: U.S. Environmental Protection Agency.
Association of Iron and Steel Engineers (AISE). 1998 . 1998 Directory Iron and Steel Plants.
Pittsburgh, PA: AISE.
U.S. Environmental Protection Agency (EPA). 1998. Update of Integrated Iron and Steel Industry
Responses to Information Collection Request (ICR) Survey. Database prepared for EPA’s Office of
Air Quality Planning and Standards. Research Triangle Park, NC: U.S. Environmental Protection
Agency.
DRAFT
3-4
production capacity for iron making, while Acme Metals Incorporated has the least capacity
of all companies owning integrated facilities.
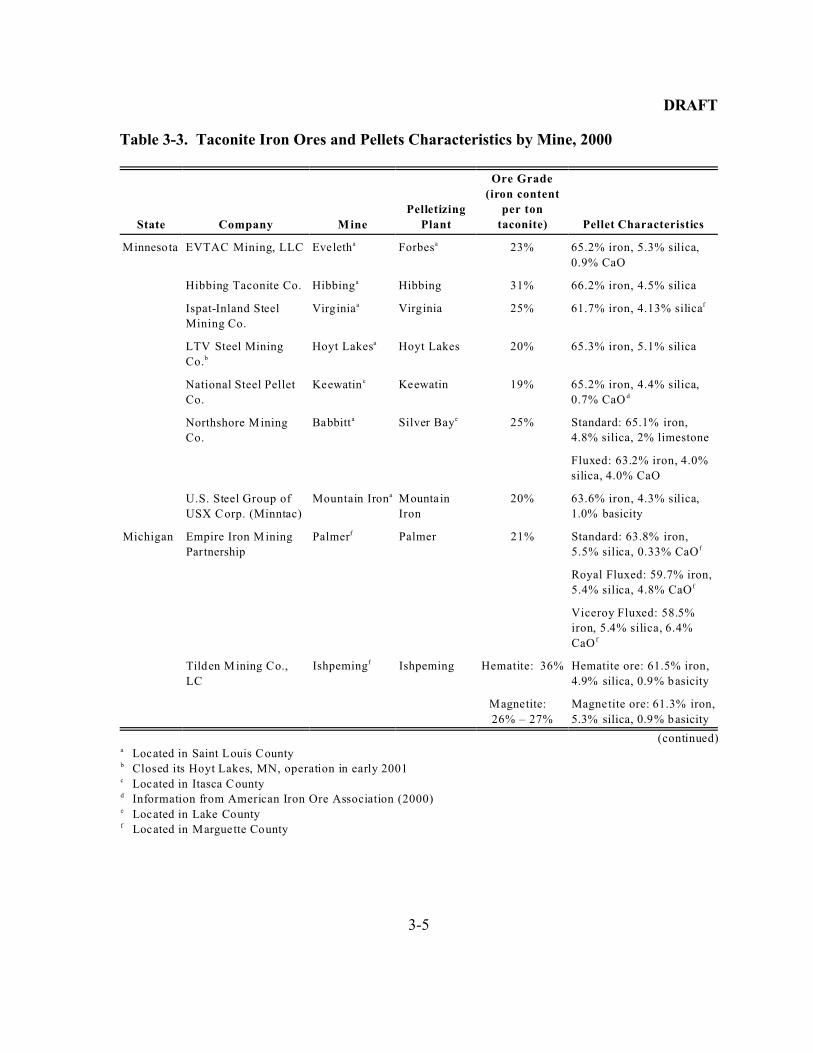
3.2 Product Characteristics
Pellets are usually the most desirable form of iron ore because they contribute the
most to the productivity of the blast furnace. Pellets usually measure from 3/8 to 5/8 inch
(9.55 to 16.0 millimeters) in diameter and contain 60 to 66 percent iron. In addition to iron,
standard pellets can include silica, alumina, magnesia, manganese, phosphorus, sulfur, and
moisture. Fluxed pellets contain a certain amount of limestone (calcium carbonate, CaCO3),
dolomite and/or lime (CaO) besides all the constituents of standard pellets. Table 3-3 lists
the product characteristics for specific mines.
3.3 Substitution Possibilities in Consumption
Domestic iron ore production has been steady since 1990 although the steel demand
has risen from 96 million metric tons in 1990 to 133 million metric tons in 1999 (a 39
percent increase). The need for domestic iron ore production in iron and steel making may
decrease because of the growth of minimills and imports of iron ore substitutes. Iron ore
substitutes for both integrated mills and minimills are steel mill products, scrap, pig iron, and
direct reduced iron (DRI). Steel mill products are semi-finished steel, such as blooms,
billets, and slabs, which must be finished before being shipped to consumers, and finished
steel, which consumers may use as is. Besides the domestic steel mill products, imports of
cheap semi-finished foreign steel are projected to rise to 10.1 million tons per year by 2003.
This increase would decrease the need for iron ore pellets from Minnesota and Michigan
(Skillings Mining Review, 2001). Pig iron is the product of blast furnaces and is used by
integrated mills and to some extent by minimills. DRI is a product obtained by reducing iron
ore to iron metal at temperatures below the melting point of iron. DRI is used as a scrap
substitute in electric arc furnace steel making at minimills (Kirk, 1999b).
DRAFT
3-5
Table 3-3. Taconite Iron Ores and Pellets Characteristics by Mine, 2000
State Company Mine
Pelletizing
Plant
Ore Grade
(iron content
per ton
taconite) Pellet Characteristics
Minnesota EVTAC Mining, LLC Eveletha Forbesa 23% 65.2% iron, 5.3% silica,
0.9% CaO
Hibbing Taconite Co. Hibbinga Hibbing 31% 66.2% iron, 4.5% silica
Ispat-Inland Steel
Mining Co.
Virginiaa Virginia 25% 61.7% iron, 4.13% silicaf
LTV Steel Mining
Co.b
Hoyt Lakesa Hoyt Lakes 20% 65.3% iron, 5.1% silica
National Steel Pellet
Co.
Keewatin c Keewatin 19% 65.2% iron, 4.4% silica,
0.7% CaO d
Northshore Mining
Co.
Babbitta Silver Baye 25% Standard: 65.1% iron,
4.8% silica, 2% limestone
Fluxed: 63.2% iron, 4.0%
silica, 4.0% CaO
U.S. Steel Group of
USX Corp. (Minntac)
Mountain Irona Mountain
Iron
20% 63.6% iron, 4.3% silica,
1.0% basicity
Michigan Empire Iron Mining
Partnership
Palmerf Palmer 21% Standard: 63.8% iron,
5.5% silica, 0.33% CaO f
Royal Fluxed: 59.7% iron,
5.4% silica, 4.8% CaO f
Viceroy Fluxed: 58.5%
iron, 5.4% silica, 6.4%
CaO f
Tilden Mining Co.,
LC
Ishpemingf Ishpeming Hematite: 36% Hematite ore: 61.5% iron,
4.9% silica, 0.9% basicity
Magnetite:
26% – 27%
Magnetite ore: 61.3% iron,
5.3% silica, 0.9% basicity
(continued)a Located in Saint Louis Countyb Closed its Hoyt Lakes, MN, operation in early 2001c Located in Itasca Countyd Information from American Iron Ore Association (2000)e Located in Lake Countyf Located in Marguette County
DRAFT
3-6
Table 3-3. Taconite Iron Ores and Pellets Characteristics by Mine, 2000 (continued)
Source: American Iron O re Association. 2000. Iron Ore: 1999 Statistical Report. Cleveland: American
Iron O re Association.
U.S. Environmental Protection Agency (EPA). 2001. National Emissions Standard for Hazardous
Air Pollutants (NESHAPs) for Taconite Iron Ore Processing Plants—Background Information for
Proposed Standards. Washington, DC: U.S. Environmental Protection Agency.
U.S. Environmental Protection Agency (EPA). August 1994 . Technical Resource Docum ent:
Extraction and Beneficiation of Ores and Minerals. Volume 3—Iron. Washington, DC: U.S.
Environmental Protection Agency.
“US/Canadian Iron Ore Production 2001.” Skillings Mining Review July 28, 2001. pp. 19-32.
“US/Canadian Iron Ore Production 2000.” Skillings Mining Review July 29, 2000. pp. 21-36.
Kirk, W.S. 1999b . “Iron Ore.” U.S. Geological Survey M inerals Yearbook-1999.
<http://minerals.usgs.gov/minerals/pubs/commodity/iron_ore/340499.pdf>.
DRAFT
4-1
SECTION 4
INDUSTRY ORGANIZATION
This section identifies the characteristics of the taconite industry in the United States.
The issues affecting this industry’s organization are addressed at both the company and
facility levels.
4.1 Taconite Manufacturing Facility Characteristics
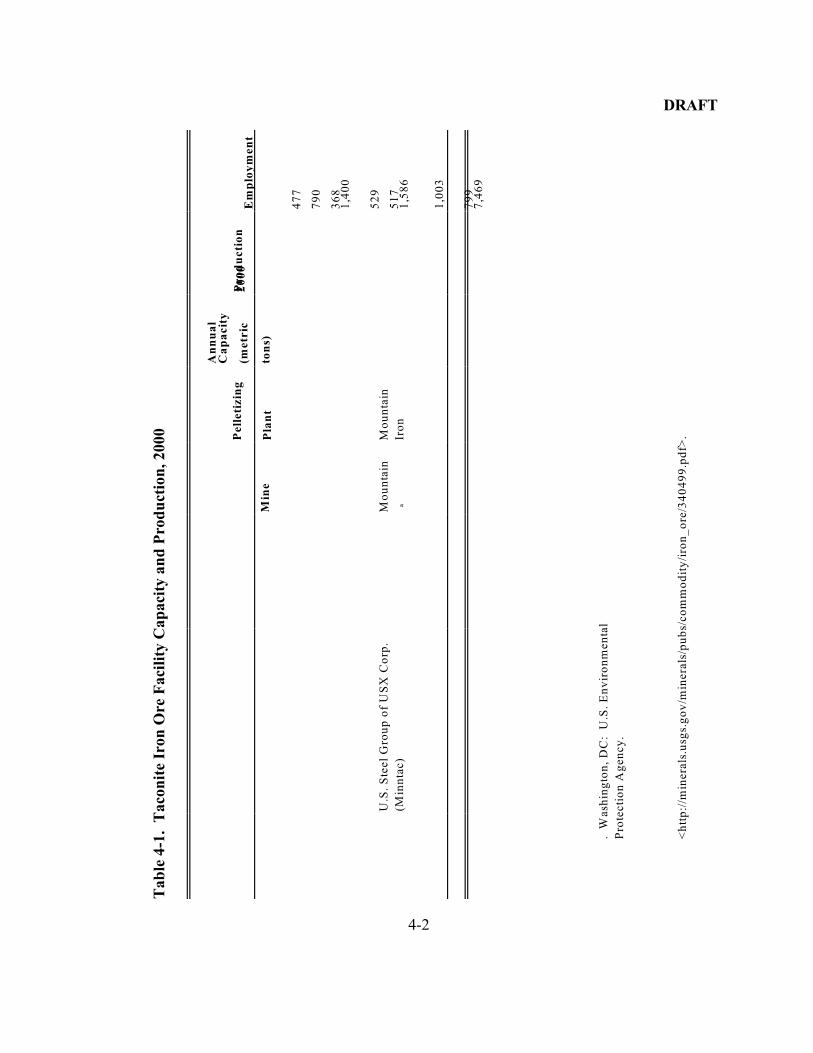
Table 4-1 lists the nine taconite mining and pelletizing plants in the United States as
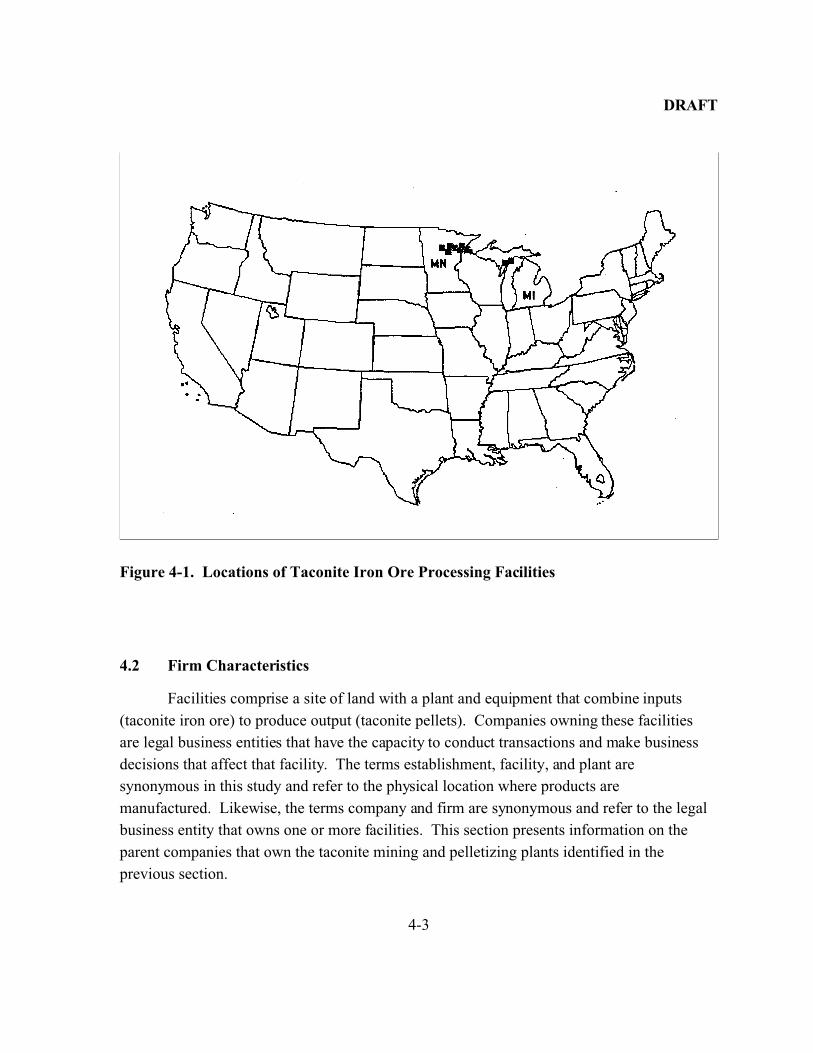
of 2000. Seven of these operations were on the Mesabi Iron Range in northeastern
Minnesota: EVTAC Mining LLC, Hibbing Taconite Company, Inland Steel Mining
Company, LTV Steel Mining Company (closed its operation in Hoyt Lakes in early 2001)
(Skillings Mining Review, 2001), National Steel Pellet Company, Northshore Mining
Company, and the U.S. Steel Group of USX Corporation (Minntac). The other two
operations, located on the Marquette Iron Range in the Upper Peninsula of Michigan, were
the Empire and Tilden Mines (Kirk, 1999a). Figure 4-1 illustrates the locations of taconite
facilities.
Besides the plant locations, Table 4-1 also provides information on plant annual
capacity, year 2000 production, and employment. The total U.S. pellet production in 2000
was about 63 million metric tons and the workforce totaled 7,460 employees. These nine
taconite mining operations in Michigan and Minnesota accounted for virtually all domestic
iron ore production. The facilities operated by Cleveland-Cliffs produced 35 million metric
tons in total, which was 56 percent of the total U.S. pellet production. Except for EVTAC
Mining LLC and Inland Steel Mining Company, all the plants employed more than 500
people. Employment at these facilities ranged from 368 employees at Ispat-Inland Steel
Mining Company to 1,586 employees at USX’s Minntac operations. Data on plant locations
and employment were obtained from the EPA (2001), Skillings Mining Review (2001), and
Kirk (1999b).
DRAFT
4-2
Tab
le 4
-1.
Tac
onit
e Ir
on O
re F
acil
ity
Cap
acit
y an
d P
rod
uct
ion
, 200
0
Min
e
Pel
leti
zin
g
Pla
nt
An
nu
al
Ca
pa
city
(met
ric
ton
s)
20
00
Pro
du
ctio
nE
mp
loy
men
t
47
7
79
0
36
81
,40
0
52
9
51
7U
.S.
Ste
el G
rou
p o
f U
SX
Co
rp.
(Min
nta
c)
Mo
un
tain
a
Mo
un
tain
Iro
n1
,58
6
1,0
03
79
97
,46
9
Lo
cate
d i
n S
ain
t L
ou
is C
ou
nty
Clo
sed
its
Ho
yt
Lak
es,
MN
, o
per
atio
n i
n e
arly
20
01
Lo
cate
d i
n I
tasc
a C
ou
nty
Lo
cate
d i
n L
ake
Co
un
ty
Lo
cate
d i
n M
arg
uet
te C
ou
nty
Bec
ause
of
rou
nd
ing
, n
um
ber
s m
ay n
ot
add
up
to
th
e to
tal.
Na
tio
na
l E
mis
sio
ns
Sta
nd
ard
fo
r H
aza
rdo
us
Air
Po
llu
tan
ts (
NE
SH
AP
s) f
or
. W
ash
ing
ton
, D
C:
U.S
. E
nv
iro
nm
enta
l
Pro
tect
ion
Ag
ency
.
Ju
ly 2
8,
20
01
. p
p.
19
-32
.
Ju
ly 2
9,
20
00
. p
p.
21
-36
.
Kir
k,
W.S
. 1
99
9b
. “
Iro
n O
re.”
U
.S.
Geo
log
ical
Su
rvey
Min
eral
s Y
earb
oo
k-1
99
9.
<h
ttp
://m
iner
als.
usg
s.g
ov
/min
eral
s/p
ub
s/co
mm
od
ity
/iro
n_
ore
/34
04
99
.pd
f>.
DRAFT
4-3
Figure 4-1. Locations of Taconite Iron Ore Processing Facilities
4.2 Firm Characteristics
Facilities comprise a site of land with a plant and equipment that combine inputs
(taconite iron ore) to produce output (taconite pellets). Companies owning these facilities
are legal business entities that have the capacity to conduct transactions and make business
decisions that affect that facility. The terms establishment, facility, and plant are
synonymous in this study and refer to the physical location where products are
manufactured. Likewise, the terms company and firm are synonymous and refer to the legal
business entity that owns one or more facilities. This section presents information on the
parent companies that own the taconite mining and pelletizing plants identified in the
previous section.
DRAFT
4-4
4.2.1 Ownership
As discussed in Section 4.1, ten companies operated nine mining and pelletizing
facilities in 2000. Table 4-2 lists companies that own and/or operate these facilities. With
five facilities, Cleveland-Cliffs operates more plants that produce taconite pellets than any
other domestic manufacturer.
As Table 4-2 shows, most iron ore mines are captive wholly owned subsidiaries of
one or more steel-producing companies. Some of the pellets are also produced for
commercial purposes. In 1999, about 60 percent of domestic ore was produced for captive
mines and did not reach the open market (Kirk, 1999a). For example, Ispat-Inland Steel
Mining Company obtains iron ore pellets directly from the Empire Mine in Michigan and
Minorca Mine in Minnesota, in which it has ownership interests. Stelco Incorporated has
ownership interests in EVTAC Mining Company, Hibbing Taconite Company, and Tilden
Mine to ensure secure sources of iron ore for its integrated steel companies. Other steel mills
acquire iron ore pellets based on long-term contractual agreements with pellet producers.
For instance, Geneva Steel Company purchases iron ore pellets from USX Corporation under
a long-term pellet supply contract.
4.2.2 Size Distribution
Company sales and employment ranges are reported in Table 4-3. Most companies
are large, publicly owned integrated steel companies, such as AK Steel Corporation,
Bethlehem Steel Corporation, Ispat International N.V., LTV Corporation, and USX
Corporation. Two companies have sales volumes less than $1 billion, six between $1 to $5
billion, and two with more than $5 billion. Five companies have fewer than 10,000
employees and the other five companies employ 10,000 or more people. Sales and
employment data were collected from Hoover’s Online and complemented with information
from InfoUSA.
4.2.3 Horizontal and Vertical Integration
Whether a firm in this industry is vertically or horizontally integrated depends on the
nature of the primary business activity that the parent company does. Vertically integrated
firms may produce the inputs used in their production process or use the product as an input
into other production processes. These firms may own several plants and/or operate many
DRAFT
4-5
Table 4-2. Taconite Iron Ore Facility Operator and Ownership, 2000
State Company Operator Ow nership
Share
(%)
Minnesota EVTAC Mining, LLC Independent Eveleth Taconite Co.a 45
Virginia Horn Taconite Co.b 40
Ontario Eveleth Taconite Co.c 15
Hibbing Taconite Co. Cleveland-Cliffs Cleveland-Cliffs 15
Bethlehem Steel Corp. 70
Stelco Inc. 15
Ispat-Inland Steel Mining Co. Ispat Inland, Inc. Ispat International N.V. 100
LTV Steel Mining Co.d Cleveland, Cliffs The LTV Corp. NA
Cleveland-Cliffs NA
National Steel Pellet Co. National Steel
Corp.
National Steel Corp. 100
Northshore Mining Co. Cleveland Cliffs Cleveland-Cliffs 100
U.S. Steel Group of USX Corp.
(Minntac)
U.S. Steel USX Corporation 100
Michigan Empire Iron M ining Partnership Cleveland Cliffs Cleveland-Cliffs 35
Ispat International N.V. 40
The LTV Corp. 25
Tilden Mining Co., LC Cleveland Cliffs Cleveland-Cliffs 40
Algoma Steel Inc. 45
Stelco Inc. 15
a Owned by Rouge Steel Companyb Owned by AK Steel Holding Corporationc Owned by Stelco Incorporatedd Closed its Hoyt Lakes, MN, operation in early 2001
NA = Not available.
Source: U.S. Environmental Protection Agency (EPA). 2001. National Emissions Standard for Hazardous
Air Pollutants (NESHAPs) for Taconite Iron Ore Processing Plants—Background Information for
Proposed Standards. Washington, DC: U.S. Environmental Protection Agency.
“Hibbing Taconite Resumes Operations.” Skillings Minings Review August 4, 2001. pp. 7.
“US/Canadian Iron Ore Production 2001.” Skillings Mining Review July 28, 2001. pp. 19-32.
“US/Canadian Iron Ore Production 2000.” Skillings Mining Review July 29, 2000. pp. 21-36.
Kirk, W.S. 1999b . “Iron Ore.” U.S. Geological Survey M inerals Yearbook-1999.
<http://minerals.usgs.gov/minerals/pubs/commodity/iron_ore/340499.pdf>.
U.S. Securities and Exchange Commission. Electronic Data Gathering, Analysis, and Retrieval
(EDGAR) System.
Hoover’s Online. Electronic database. <http://www.hoovers.com/>. Obtained on August 28, 2001 .
DRAFT
4-6
Table 4-3. Taconite Iron Ore Facility Owner Company Sales and Employment, 2000
Owner Company Legal Form of Organization Sales ($106) Employment
Algoma Steel Inc. Public 749 3,700
Bethlehem Steel Corp. Public 4,197 14,700
Cleveland-Cliffs Public 430 4,636
Eveleth Taconite Co.a Public 1,100 2,881
Ispat International N.V. Public 5,097 17,800
National Steel Corp. Public subsidiary 2,979 9,283
Stelco Inc. NA 1,893 9,922
The LTV Corp. Public 4,934 16,500
USX Corp. Public 6,132 30,892
Virginia Horn Taconite Co.b Public 4,612 11,500
a Owned by Rouge Steel Companyb Owned by AK Steel Holding Corporation
NA = Not available.
Source: U.S. Environmental Protection Agency (EPA). 2001. National Emissions Standard for Hazardous
Air Pollutants (NESHAPs) for Taconite Iron Ore Processing Plants—Background Information for
Proposed Standards. Washington, DC: U.S. Environmental Protection Agency.
“US/Canadian Iron Ore Production 2001.” Skillings Mining Review July 28, 2001. pp. 19-32.
Stelco Inc. website. <http://www.stelco.com/> . Obtained on August 28, 2001.
Hoover’s Online. Electronic database. <http://www.hoovers.com/>. Obtained on August 28, 2001 .
subsidiaries, each of which handles a different stage of production or directly or indirectly
produces an input or product. In the taconite industry, captive iron ore producers are parts
of vertically integrated iron and steel operations. For example, Ispat-Inland Steel Mining
Company, National Steel Corporation, and USX Corporation use taconite pellets produced
by taconite operations they own in their integrated steel operations to produce iron and steel.
Most of the companies in Table 4-2 are vertically integrated.
However, vertical and horizontal integration are not mutually exclusive. A
corporation may be both vertically integrated and horizontally integrated. Perceiving a firm
as horizontally or vertically integrated depends on vantage point. The above companies can
be seen as vertically integrated because one subsidiary feeds an input into another. In its
pure form, horizontal integration is the situation in which one company produces various,
unrelated products rather than specializing in one particular product. Companies that are not
DRAFT
4-7
integrated either horizontally or vertically produce only one type of product or set of closely
related products. The smaller companies involved in manufacturing taconite ore products
are, for the most part, not integrated; they produce a sole product without having forward or
backward corporate linkages. These companies purchase inputs from outside suppliers, not
of their corporate tree. Then they manufacture the product and sell it either directly to
consumers or through wholesalers.
4.3 Small Businesses in the Taconite Industry
To determine the possible impacts of the proposed NESHAP on small businesses,
businesses producing taconite are categorized as small or large using the Small Business
Administration’s (SBA’s) general size standards definitions. For NAICS 21221, these
guidelines indicate a small business employs 500 or fewer workers (U.S. Small Business
Administration, 2000). Based on the SBA definition and the company employment shown in
Table 4-3, this industry has no small businesses.
4.4 Market Structure
Market structure is of interest because it determines the behavior of producers and
consumers in the industry. If an industry is perfectly competitive, then individual producers
are not able to influence the price of the outputs they sell or the inputs they purchase. This
condition is most likely to hold if the industry has a large number of firms, the products sold
are undifferentiated, and entry and exit of firms are unrestricted. Product differentiation can
occur both from differences in product attributes and quality and from brand name
recognition of products. Entry and exit of firms are unrestricted for most industries except,
for example, in cases when government regulates who is able to produce, when one firm
holds a patent on a product, when one firm owns the entire stock of a critical input, or when a
single firm is able to supply the entire market.
When compared across industries, firms in industries with fewer firms, more product
differentiation, and restricted entry are more likely to be able to influence the price they
receive for a product by reducing output below perfectly competitive levels. This ability to
influence price is referred to as exerting market power. At the extreme, a single
monopolistic firm may supply the entire market and hence set the price of the output.
DRAFT
4-8
4.4.1 Measures of Industry Concentration
To assess the competitiveness of a market, economists often estimate four-firm
concentration ratios (CR4), eight-firm concentration ratios (CR8), and
Herfindahl-Hirschmann Indexes (HHI) for the subject market or industry. The CR4 and CR8
ratios measure the percentage of sales accounted for by the top four and eight firms in the
industry, respectively. The HHI is the sum of the squared market shares of firms in the
industry. Unfortunately, there is no objective criterion for determining market structure
based on the values of concentration ratios alone. However, economists do have criteria for
determining market structure based on the HHIs as provided in the 1997 Department of
Justice’s revised Horizontal Merger Guidelines (U.S. Department of Justice and the Federal
Trade Commission, 1997). According to these criteria, industries with HHIs below 1,000 are
considered unconcentrated (i.e., more competitive), those with HHIs between 1,000 and
1,800 are considered moderately concentrated (i.e., moderately competitive), and those with
HHIs above 1,800 are considered highly concentrated (i.e., less competitive). Firms in
less-concentrated industries are more likely to be price takers, while firms in
more-concentrated industries are more likely to be able to influence market prices. Tables 4-
1 and 4-2 provide data on the market share that each company holds in terms of pellet
production and company ownership share. With fewer than a dozen owner companies, many
of them vertically integrated, and with significant barriers to entry, the taconite industry is
likely fairly concentrated. However, there is no publicly available market concentration
statistics available for the taconite iron ore industry.
4.4.2 Geographic Concentration
As Table 4-1 and Figure 4-1 illustrate, the taconite mining and processing facilities
are located in either Minnesota or Michigan. In Minnesota, all of the iron ore production
comes from the Mesabi Range, located in Itasca (1990 population: 43,392), Lake (10,707),
and Saint Louis (196,414) Counties. In Michigan, the production is from the Empire and the
Tilden Mines in Marquette County (1990 population: 62,017). The geographic location of
the nine taconite facilities indicates that the potential impact of the proposed rule on regional
employment and economy will be concentrated in the four counties mentioned above. Based
on the information from Cleveland-Cliffs, the Empire and Tilden Mines have a local
economic impact of $390 million per year. The Hibbing Taconite and Northshore Mining
Companies have an economic impact of more than $400 million per year on the local
economy (Cleveland-Cliffs, 2001).
DRAFT
4-9
4.5 Current Trends in the Taconite Industry
U.S. iron ore production in 2000 totaled 61.6 million metric tons. Steel making
accounted for about 98 percent of domestic iron ore consumption (Kirk, 2001a). From 1992
to 1997, the production of usable iron ore trended upward from 55.6 million metric tons to
about 63.0 million metric tons, an average growth rate of 2.6 percent. The production of iron
ore decreased 8 percent in 1999, compared with 1998 production (Kirk, 1999b). The LTV
Steel Mining Company closed its taconite mining operation in Hoyt Lakes in early 2001,
which may lead to an 8 million metric ton deduction in annual total iron ore production.
Besides production, consumption of domestic iron ore has declined since 1995 by an average
of 2.5 percent per year.
The U.S. steel industry is experiencing structural changes that have the potential to
affect the domestic iron ore industry. Some of the integrated steel makers use iron ore as
feedstock to produce direct reduced iron. The feedstock for direct reduced iron produced
domestically is imported. The minimills use iron and steel scrap and direct reduced iron, and
their shares of the steel market has increased steadily, rising from 15 percent in 1970 to about
50 percent in 2000. This trend is expected to continue and will affect the domestic iron ore
industry negatively (McGraw-Hill, 2000).
DRAFT
5-1
SECTION 5
MARKETS
This section examines the historical market statistics and future trends and
projections for the taconite pellet industry. Historical data for this industry are provided for
domestic production and consumption, domestic prices, and foreign trade in iron ore pellets.
The future trends section focuses on projected demand and employment for the taconite
pellet industry.
5.1 Historical Market Data
This section provides data on historical quantities of iron ore produced and consumed
in the United States, the quantities imported and exported, and prices.
5.1.1 Domestic Production
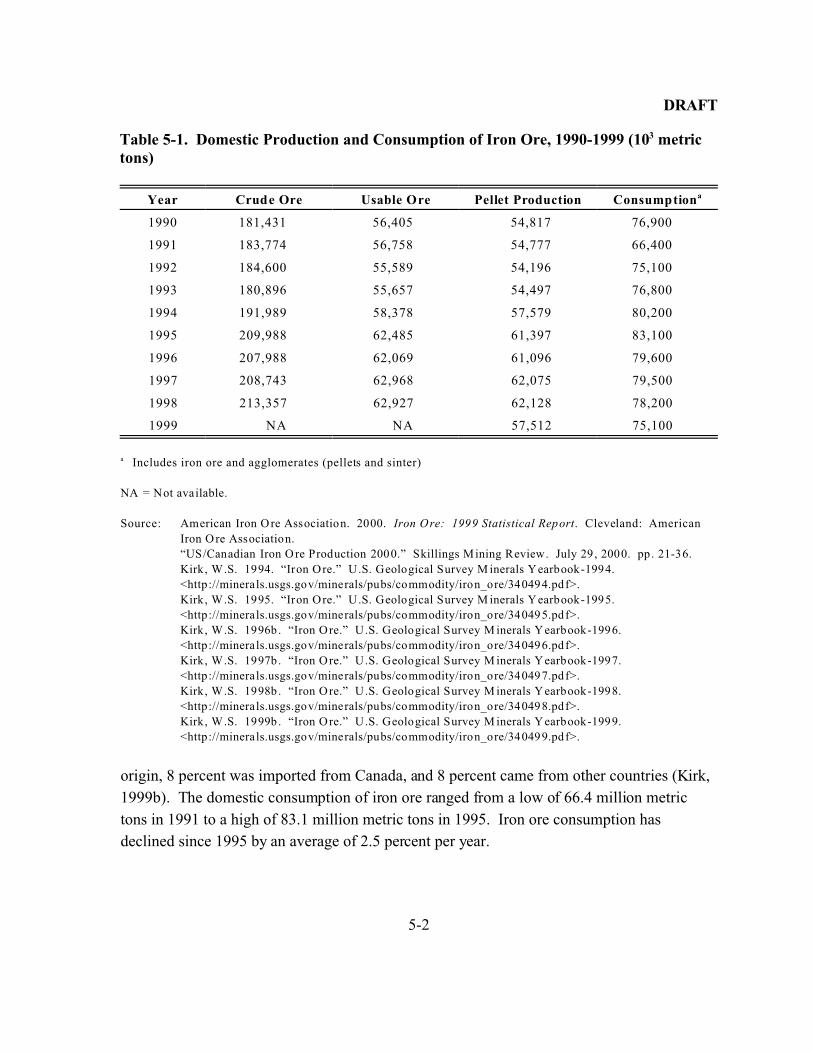
Table 5-1 presents the data on the quantities of iron ore production from 1990 to
1999, including crude ore, usable ore, and pellet productions. However, data on crude ore
and usable ore production for 1999 were not available. The domestic production of crude ore
ranged from a low of 180 million metric tons in 1993 to a high of 213 million metric tons in
1998. Of the crude ore mined, 30 percent could be processed into usable ore. The domestic
pellet production in 1999, at 57 million metric tons, fell by 8 percent because the United
Steel Workers of America labor contract expired on July 31, 1999 and a number of producers
closed their operations temporarily (Kirk, 1999b). The domestic production of pellets ranged
from a low of 54 million metric tons in 1992 to a high of 62 million metric tons in 1998.
5.1.2 Domestic Consumption
Table 5-1 also shows the domestic consumption of iron ore products. In 1999,
consumption was 75.1 million metric tons, including both iron ore and agglomerates (pellets
and sinter). During the same year, the integrated iron and steel producers consumed 71.1
million metric tons of iron ore products. Of the ore consumed, 84 percent was of domestic
DRAFT
5-2
Table 5-1. Domestic Production and Consumption of Iron Ore, 1990-1999 (103 metrictons)
Year Crude Ore Usable Ore Pellet Production Consumptiona
1990 181,431 56,405 54,817 76,900
1991 183,774 56,758 54,777 66,400
1992 184,600 55,589 54,196 75,100
1993 180,896 55,657 54,497 76,800
1994 191,989 58,378 57,579 80,200
1995 209,988 62,485 61,397 83,100
1996 207,988 62,069 61,096 79,600
1997 208,743 62,968 62,075 79,500
1998 213,357 62,927 62,128 78,200
1999 NA NA 57,512 75,100
a Includes iron ore and agglomerates (pellets and sinter)
NA = Not available.
Source: American Iron O re Association. 2000. Iron Ore: 1999 Statistical Report. Cleveland: American
Iron O re Association.
“US/Canadian Iron O re Production 2000.” Skillings Mining Review. July 29, 2000. pp. 21-36.
Kirk, W.S. 1994. “Iron Ore.” U.S. Geological Survey M inerals Yearbook-1994.
<http://minerals.usgs.gov/minerals/pubs/commodity/iron_ore/340494.pdf>.
Kirk, W.S. 1995. “Iron Ore.” U.S. Geological Survey M inerals Yearbook-1995.
<http://minerals.usgs.gov/minerals/pubs/commodity/iron_ore/340495.pdf>.
Kirk, W.S. 1996b . “Iron Ore.” U.S. Geological Survey M inerals Yearbook-1996.
<http://minerals.usgs.gov/minerals/pubs/commodity/iron_ore/340496.pdf>.
Kirk, W.S. 1997b . “Iron Ore.” U.S. Geological Survey M inerals Yearbook-1997.
<http://minerals.usgs.gov/minerals/pubs/commodity/iron_ore/340497.pdf>.
Kirk, W.S. 1998b . “Iron Ore.” U.S. Geological Survey M inerals Yearbook-1998.
<http://minerals.usgs.gov/minerals/pubs/commodity/iron_ore/340498.pdf>.
Kirk, W.S. 1999b . “Iron Ore.” U.S. Geological Survey M inerals Yearbook-1999.
<http://minerals.usgs.gov/minerals/pubs/commodity/iron_ore/340499.pdf>.
origin, 8 percent was imported from Canada, and 8 percent came from other countries (Kirk,
1999b). The domestic consumption of iron ore ranged from a low of 66.4 million metric
tons in 1991 to a high of 83.1 million metric tons in 1995. Iron ore consumption has
declined since 1995 by an average of 2.5 percent per year.
DRAFT
5-3
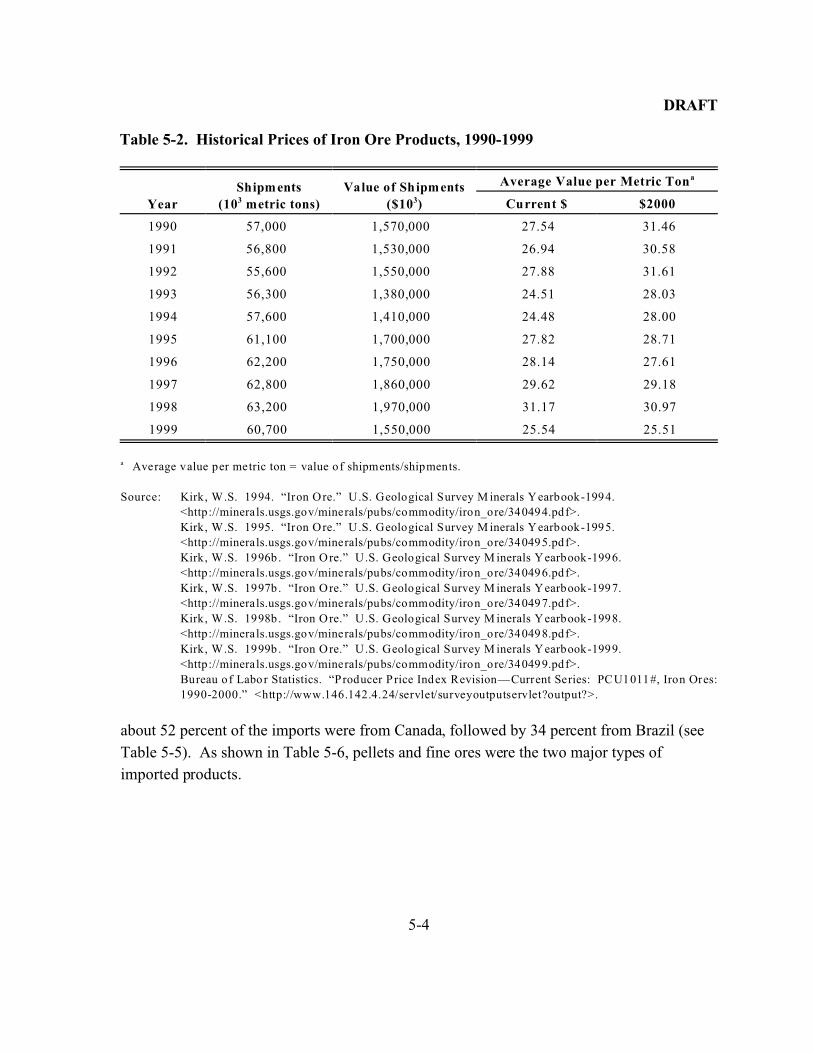
5.1.3 Domestic Prices
One of the major structural changes in the domestic iron ore industry occurred in
1982 with the development of a U.S. spot market for pellets, which led to the beginning of
price competition. As a result of the spot market for pellets, domestic iron ore producers
lowered prices to make domestic ore competitive with imported material and also reduced
production costs by improving labor productivity, reducing wages, negotiating lower-cost
power contracts and royalty agreements, pressing suppliers to reduce prices for materials,
lobbying legislators for tax breaks, and paying off debt (Kirk, 1998b).
Most spot sales are individually negotiated one-time contacts made directly between
buyer and seller. The domestic prices of iron ore products from 1990 through 1999 are
presented in both current and 2000 dollars in Table 5-2. Adjusted prices in 2000 dollars for
iron ore products range from a low of $25.51 per metric ton in 1999 to a high of $31.61 per
metric ton in 1992. Between 1993 and 1998, the adjusted price never went above $30 per
metric ton. In addition to vertically integrated production and the spot market, long-term
contracts (mentioned above) affect prices. The prices at which iron ore products change
hands under long-term contracts are frequently tied to movement in the spot market price or
the world price. The low spot market price in 1999 coincided with increased imports of pig
iron, DRI, and semifinished steel, reducing the demand for domestic iron ore. Steel
producers increased their use of imports because it allowed them to increase steel production
in response to cyclical increases in steel demand without having to increase their blast
furnace production, reopen idled blast furnaces, and hire new personnel.
5.1.4 Foreign Trade
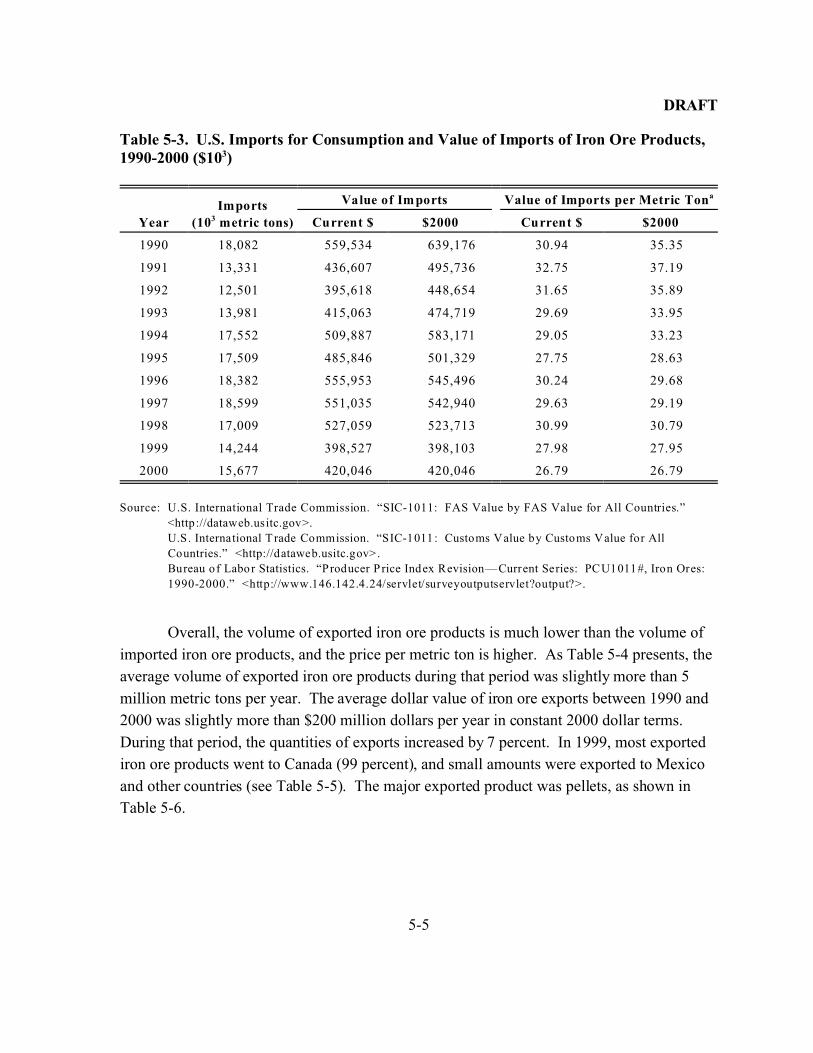
Table 5-3 provides data on the quantities and dollar values of imported iron ore
products from 1990 through 2000. The average volume of imported iron ore products during
that period was slightly more than 16 million metric tons per year. The average dollar value
of iron ore imports between 1990 and 2000 was slightly more than $500 million per year in
constant 2000 dollars. Because of declining quantity and price, 1999 imports were valued at
less than $400 million. While the import price continued to fall in 2000, the quantity
increased slightly so that the value of imported iron ore products in 2000 was approximately
$420 million. In 1999, the value of imported iron ore products per metric ton was $27.95 in
2000 dollars. During the same year,
DRAFT
5-4
Table 5-2. Historical Prices of Iron Ore Products, 1990-1999
Year
Shipments
(103 metric tons)
Value of Shipments
($103)
Average Value per Metric Tona
Current $ $2000
1990 57,000 1,570,000 27.54 31.46
1991 56,800 1,530,000 26.94 30.58
1992 55,600 1,550,000 27.88 31.61
1993 56,300 1,380,000 24.51 28.03
1994 57,600 1,410,000 24.48 28.00
1995 61,100 1,700,000 27.82 28.71
1996 62,200 1,750,000 28.14 27.61
1997 62,800 1,860,000 29.62 29.18
1998 63,200 1,970,000 31.17 30.97
1999 60,700 1,550,000 25.54 25.51
a Average value per metric ton = value of shipments/shipments.
Source: Kirk, W.S. 1994. “Iron Ore.” U.S. Geological Survey M inerals Yearbook-1994.
<http://minerals.usgs.gov/minerals/pubs/commodity/iron_ore/340494.pdf>.
Kirk, W.S. 1995. “Iron Ore.” U.S. Geological Survey M inerals Yearbook-1995.
<http://minerals.usgs.gov/minerals/pubs/commodity/iron_ore/340495.pdf>.
Kirk, W.S. 1996b . “Iron Ore.” U.S. Geological Survey M inerals Yearbook-1996.
<http://minerals.usgs.gov/minerals/pubs/commodity/iron_ore/340496.pdf>.
Kirk, W.S. 1997b . “Iron Ore.” U.S. Geological Survey M inerals Yearbook-1997.
<http://minerals.usgs.gov/minerals/pubs/commodity/iron_ore/340497.pdf>.
Kirk, W.S. 1998b . “Iron Ore.” U.S. Geological Survey M inerals Yearbook-1998.
<http://minerals.usgs.gov/minerals/pubs/commodity/iron_ore/340498.pdf>.
Kirk, W.S. 1999b . “Iron Ore.” U.S. Geological Survey M inerals Yearbook-1999.
<http://minerals.usgs.gov/minerals/pubs/commodity/iron_ore/340499.pdf>.
Bureau of Labor Statistics. “Producer P rice Index Revision—Current Series: PCU1011#, Iron Ores:
1990-2000.” <http://www.146.142.4.24/servlet/surveyoutputservlet?output?>.
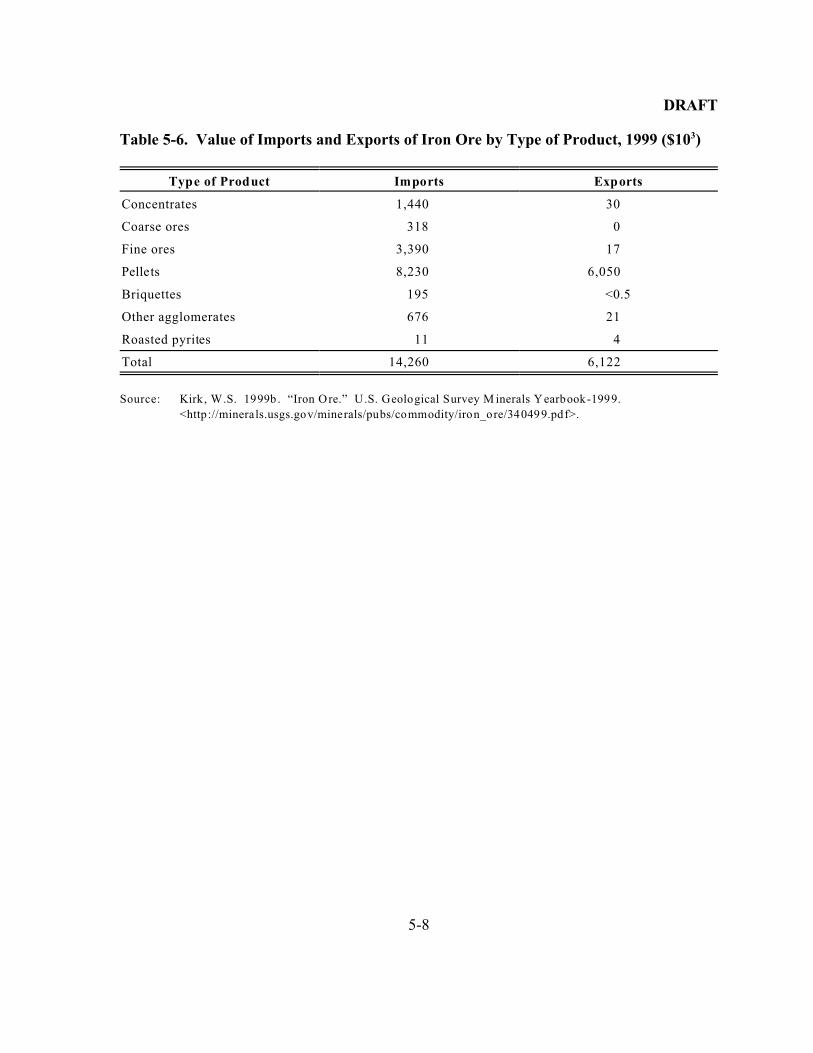
about 52 percent of the imports were from Canada, followed by 34 percent from Brazil (see
Table 5-5). As shown in Table 5-6, pellets and fine ores were the two major types of
imported products.
DRAFT
5-5
Table 5-3. U.S. Imports for Consumption and Value of Imports of Iron Ore Products,1990-2000 ($103)
Year
Imports
(103 metric tons)
Value of Imports Value of Imports per Metric Tona
Current $ $2000 Current $ $2000
1990 18,082 559,534 639,176 30.94 35.35
1991 13,331 436,607 495,736 32.75 37.19
1992 12,501 395,618 448,654 31.65 35.89
1993 13,981 415,063 474,719 29.69 33.95
1994 17,552 509,887 583,171 29.05 33.23
1995 17,509 485,846 501,329 27.75 28.63
1996 18,382 555,953 545,496 30.24 29.68
1997 18,599 551,035 542,940 29.63 29.19
1998 17,009 527,059 523,713 30.99 30.79
1999 14,244 398,527 398,103 27.98 27.95
2000 15,677 420,046 420,046 26.79 26.79
Source: U.S. International Trade Commission. “SIC-1011: FAS Value by FAS Value for All Countries.”
<http://dataweb.usitc.gov>.
U.S. International T rade Commission. “SIC-1011: Customs Value by Customs Value for All
Countries.” <http://dataweb.usitc.gov>.
Bureau of Labor Statistics. “Producer P rice Index Revision—Current Series: PCU1011#, Iron Ores:
1990-2000.” <http://www.146.142.4.24/servlet/surveyoutputservlet?output?>.
Overall, the volume of exported iron ore products is much lower than the volume of
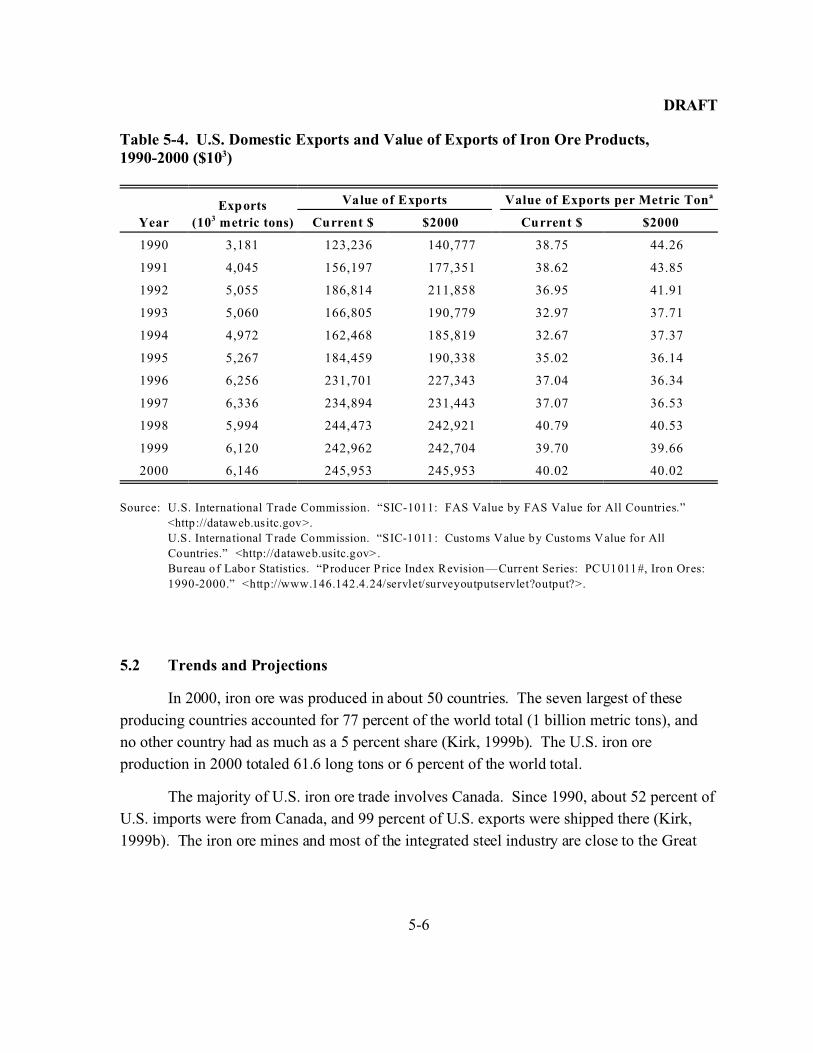
imported iron ore products, and the price per metric ton is higher. As Table 5-4 presents, the
average volume of exported iron ore products during that period was slightly more than 5
million metric tons per year. The average dollar value of iron ore exports between 1990 and
2000 was slightly more than $200 million dollars per year in constant 2000 dollar terms.
During that period, the quantities of exports increased by 7 percent. In 1999, most exported
iron ore products went to Canada (99 percent), and small amounts were exported to Mexico
and other countries (see Table 5-5). The major exported product was pellets, as shown in
Table 5-6.
DRAFT
5-6
Table 5-4. U.S. Domestic Exports and Value of Exports of Iron Ore Products,1990-2000 ($103)
Year
Exports
(103 metric tons)
Value of Exports Value of Exports per Metric Tona
Current $ $2000 Current $ $2000
1990 3,181 123,236 140,777 38.75 44.26
1991 4,045 156,197 177,351 38.62 43.85
1992 5,055 186,814 211,858 36.95 41.91
1993 5,060 166,805 190,779 32.97 37.71
1994 4,972 162,468 185,819 32.67 37.37
1995 5,267 184,459 190,338 35.02 36.14
1996 6,256 231,701 227,343 37.04 36.34
1997 6,336 234,894 231,443 37.07 36.53
1998 5,994 244,473 242,921 40.79 40.53
1999 6,120 242,962 242,704 39.70 39.66
2000 6,146 245,953 245,953 40.02 40.02
Source: U.S. International Trade Commission. “SIC-1011: FAS Value by FAS Value for All Countries.”
<http://dataweb.usitc.gov>.
U.S. International T rade Commission. “SIC-1011: Customs Value by Customs Value for All
Countries.” <http://dataweb.usitc.gov>.
Bureau of Labor Statistics. “Producer P rice Index Revision—Current Series: PCU1011#, Iron Ores:
1990-2000.” <http://www.146.142.4.24/servlet/surveyoutputservlet?output?>.
5.2 Trends and Projections
In 2000, iron ore was produced in about 50 countries. The seven largest of these
producing countries accounted for 77 percent of the world total (1 billion metric tons), and
no other country had as much as a 5 percent share (Kirk, 1999b). The U.S. iron ore
production in 2000 totaled 61.6 long tons or 6 percent of the world total.
The majority of U.S. iron ore trade involves Canada. Since 1990, about 52 percent of
U.S. imports were from Canada, and 99 percent of U.S. exports were shipped there (Kirk,
1999b). The iron ore mines and most of the integrated steel industry are close to the Great
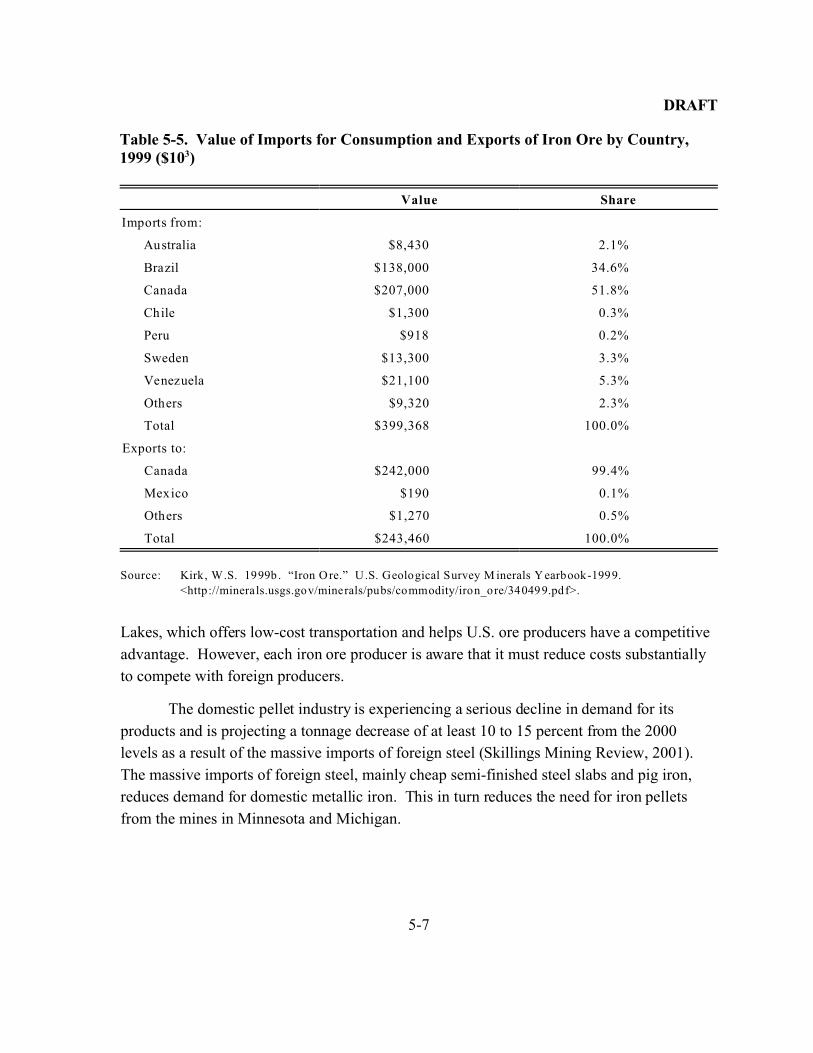
DRAFT
5-7
Table 5-5. Value of Imports for Consumption and Exports of Iron Ore by Country,1999 ($103)
Value Share
Imports from:
Australia $8,430 2.1%
Brazil $138,000 34.6%
Canada $207,000 51.8%
Chile $1,300 0.3%
Peru $918 0.2%
Sweden $13,300 3.3%
Venezuela $21,100 5.3%
Others $9,320 2.3%
Total $399,368 100.0%
Exports to:
Canada $242,000 99.4%
Mexico $190 0.1%
Others $1,270 0.5%
Total $243,460 100.0%
Source: Kirk, W.S. 1999b . “Iron Ore.” U.S. Geological Survey M inerals Yearbook-1999.
<http://minerals.usgs.gov/minerals/pubs/commodity/iron_ore/340499.pdf>.
Lakes, which offers low-cost transportation and helps U.S. ore producers have a competitive
advantage. However, each iron ore producer is aware that it must reduce costs substantially
to compete with foreign producers.
The domestic pellet industry is experiencing a serious decline in demand for its
products and is projecting a tonnage decrease of at least 10 to 15 percent from the 2000
levels as a result of the massive imports of foreign steel (Skillings Mining Review, 2001).
The massive imports of foreign steel, mainly cheap semi-finished steel slabs and pig iron,
reduces demand for domestic metallic iron. This in turn reduces the need for iron pellets
from the mines in Minnesota and Michigan.
DRAFT
5-8
Table 5-6. Value of Imports and Exports of Iron Ore by Type of Product, 1999 ($103)
Type of Product Imports Exports
Concentrates 1,440 30
Coarse ores 318 0
Fine ores 3,390 17
Pellets 8,230 6,050
Briquettes 195 <0.5
Other agglomerates 676 21
Roasted pyrites 11 4
Total 14,260 6,122
Source: Kirk, W.S. 1999b . “Iron Ore.” U.S. Geological Survey M inerals Yearbook-1999.
<http://minerals.usgs.gov/minerals/pubs/commodity/iron_ore/340499.pdf>.
DRAFT
R-1
REFERENCES
“Digging Into Minnesota Minerals—Minnesota Taconite.” Minnesota Department of Natural
Resources. <http://www.dnr.state.mn.us/minerals/digging_minerals/taconite.html>.
Obtained on May 23, 2001.
American Iron Ore Association. 2000. Iron Ore: 1999 Statistical Report. Cleveland:
American Iron Ore Association.
Association of Iron and Steel Engineers (AISE). 1998. 1998 Directory Iron and Steel Plants.
Pittsburgh, PA: AISE.
Bureau of Labor Statistics. “Producer Price Index Revision—Current Series: PCU1011#,
Iron Ores: 1990-2000.”
<http://www.146.142.4.24/servlet/surveyoutputservlet?output?>.
Cleveland-Cliffs Inc. webpage. <http://www.cleveland-cliffs.com/>. Obtained on August
28, 2001.
Dun & Bradstreet. Electronic database.
<http://www.lycos.com/business/companyresearch/index.html?src=col>.
Dun & Bradstreet. 2000. Industry Norms and Key Business Ratios. Desktop Edition 1999-
2000. Murray Hill, NJ: Dun & Bradstreet.
Dun & Bradstreet. 2001. 2001 Dun & Bradstreet Million Dollar Directory Series:
America’s Leading Public and Private Companies. Bethlehem, PA: Dun &
Bradstreet.
“Glossary of Terms.” <http://www.taxes.state.mn.us/mining/forms/pdf/00mining_guide.pdf>
Minnesota Department of Revenue—2000 Minnesota Mining Tax Guide.
“Hibbing Taconite Resumes Operations.” Skillings Mining Review August 4, 2001. pp. 7.
Hoover’s Online. Electronic database. <http://www.hoovers.com/>. Obtained on August
28, 2001.
DRAFT
R-2
InfoUSA Incorporated. 2001. ReferenceUSA [computer file]. Omaha, NE: InfoUSA,
Incorporated.
Kirk-Othmer Encyclopedia of Chemical Technology. 1995. Fourth Edition. Volume 14.
pp. 833-872. New York: John Wiley & Sons.
Kirk, W.S. 1994. “Iron Ore.” U.S. Geological Survey Minerals Yearbook-1994.
<http://minerals.usgs.gov/minerals/pubs/commodity/iron_ore/340494.pdf>.
Kirk, W.S. 1995. “Iron Ore.” U.S. Geological Survey Minerals Yearbook-1995.
<http://minerals.usgs.gov/minerals/pubs/commodity/iron_ore/340495.pdf>.
Kirk, W.S. 1996a. “Iron Ore.” U.S. Geological Survey, Mineral Commodity Summaries.
<http://minerals.usgs.gov/minerals/pubs/commodity/iron_ore/340396.txt>.
Kirk, W.S. 1996b. “Iron Ore.” U.S. Geological Survey Minerals Yearbook-1996.
<http://minerals.usgs.gov/minerals/pubs/commodity/iron_ore/340496.pdf>.
Kirk, W.S. 1997a. “Iron Ore.” U.S. Geological Survey, Mineral Commodity Summaries.
<http://minerals.usgs.gov/minerals/pubs/commodity/iron_ore/340397.pdf>.
Kirk, W.S. 1997b. “Iron Ore.” U.S. Geological Survey Minerals Yearbook-1997.
<http://minerals.usgs.gov/minerals/pubs/commodity/iron_ore/340497.pdf>.
Kirk, W.S. 1998a. “Iron Ore.” U.S. Geological Survey, Mineral Commodity Summaries.
<http://minerals.usgs.gov/minerals/pubs/commodity/iron_ore/340398.pdf>.
Kirk, W.S. 1998b. “Iron Ore.” U.S. Geological Survey Minerals Yearbook-1998.
<http://minerals.usgs.gov/minerals/pubs/commodity/iron_ore/340498.pdf>.
Kirk, W.S. 1999a. “Iron Ore.” U.S. Geological Survey, Mineral Commodity Summaries.
<http://minerals.usgs.gov/minerals/pubs/commodity/iron_ore/340399.pdf>.
Kirk, W.S. 1999b. “Iron Ore.” U.S. Geological Survey Minerals Yearbook-1999.
<http://minerals.usgs.gov/minerals/pubs/commodity/iron_ore/340499.pdf>.
Kirk, W.S. 2000. “Iron Ore.” U.S. Geological Survey, Mineral Commodity Summaries.
<http://minerals.usgs.gov/minerals/pubs/commodity/iron_ore/340300.pdf>.
Kirk, W.S. 2001a. “Iron Ore.” U.S. Geological Survey, Mineral Commodity Summaries.
<http://minerals.usgs.gov/minerals/pubs/commodity/iron_ore/340301.pdf>.
DRAFT
R-3
Kirk, W.S. “Metal Prices in the United States through 1998—Iron Ore.”
<http://minerals.usgs.gov/minerals/pubs/commodity/iron_ore/340798.pdf>. Obtained
September 7, 2001b.
McGraw-Hill. 2000. U.S. Industry & Trade Outlook. New York: McGraw-Hill.
McKetta, J.J., ed. 1988. Encyclopedia of Chemical Processing and Design. 1988. Volume
27. pp. 339-382. New York: Marcel Dekker, Inc.
Stelco Inc. website. <http://www.stelco.com/>. Obtained on August 28, 2001.
“US/Canadian Iron Ore Production 2000.” Skillings Mining Review July 29, 2000. pp.
21-36.
“US/Canadian Iron Ore Production 2001.” Skillings Mining Review July 28, 2001. pp.
19-32.
U.S. Department of Commerce, Census Bureau. 1999. 1997 Economic Census of Mining,
Industry Series—Mining. Washington, DC: Government Printing Office.
U.S. Department of Commerce, Census Bureau. 2001. 1997 Economic Census of Mining,
General Summary, Subject Series—Mining. Washington, DC: Government Printing
Office.
U.S. Department of Justice and the Federal Trade Commission. 1997. Horizontal Merger
Guidelines. Revised April 8, 1997. <http: www.usdof.gov/atr/public/
guidelines/horiz_bour/hmg.
U.S. Environmental Protection Agency (EPA). August 1994. Technical Resource
Document: Extraction and Beneficiation of Ores and Minerals. Volume 3—Iron.
Washington, DC: U.S. Environmental Protection Agency.
U.S. Environmental Protection Agency (EPA). 1998. Update of Integrated Iron and Steel
Industry Responses to Information Collection Request (ICR) Survey. Database
prepared for EPA’s Office of Air Quality Planning and Standards. Research Triangle
Park, NC: U.S. Environmental Protection Agency.
U.S. Environmental Protection Agency (EPA). 2000. Economic Impact Analysis of
Proposed Integrated Iron and Steel. Washington, DC: U.S. Environmental
Protection Agency.
DRAFT
R-4
U.S. Environmental Protection Agency (EPA). 2001. National Emissions Standard for
Hazardous Air Pollutants (NESHAPs) for Taconite Iron Ore Processing
Plants—Background Information for Proposed Standards. Washington, DC: U.S.
Environmental Protection Agency.
U.S. International Trade Commission. “SIC-1011: FAS Value by FAS Value for All
Countries.” <http://dataweb.usitc.gov>.
U.S. International Trade Commission. “SIC-1011: Customs Value by Customs Value for
All Countries.” <http://dataweb.usitc.gov>.
U.S. Securities and Exchange Commission. Electronic Data Gathering, Analysis, and
Retrieval (EDGAR) System.
U.S. Small Business Administration. 2000. “Small Business Size Regulations: Size
Standards and the North American Industry Classification System.” 13 CFR Part 121.
Weiss, N.L., ed. 1985. SME Mineral Processing Handbook. S New York: Society of
Mining Engineers.