tagger—a swiss army knife for multiomics to dissect cell
TRANSCRIPT

METHODS AND RESOURCES
Tagger—A Swiss army knife for multiomics to
dissect cell type–specific mechanisms of gene
expression in mice
Lech Kaczmarczyk1,2, Vikas BansalID3☯, Ashish RajputID
3☯, Raza-ur RahmanID3,
Wiesław Krzyżak4, Joachim DegenID4, Stefanie PollID
2, Martin Fuhrmann2,
Stefan Bonn3,5*, Walker Scot JacksonID1,2*
1 Wallenberg Center for Molecular Medicine, Department of Clinical and Experimental Medicine, Linkoping
University, Linkoping, Sweden, 2 German Center for Neurodegenerative Diseases, Bonn, Germany,
3 Institute for Medical Systems Biology, Center for Molecular Neuroscience, University Medical Center
Hamburg-Eppendorf, Hamburg, Germany, 4 Life & Medical Sciences Institute, University of Bonn, Bonn,
Germany, 5 German Center for Neurodegenerative Diseases, Tubingen, Germany
☯ These authors contributed equally to this work.
* [email protected] (SB); [email protected] (WSJ)
Abstract
A deep understanding of how regulation of the multiple levels of gene expression in mam-
malian tissues give rise to complex phenotypes has been impeded by cellular diversity. A
handful of techniques were developed to tag-select nucleic acids of interest in specific cell
types, thereby enabling their capture. We expanded this strategy by developing the Tagger
knock-in mouse line bearing a quad-cistronic transgene combining enrichment tools for
nuclei, nascent RNA, translating mRNA, and mature microRNA (miRNA). We demonstrate
that Tagger can capture the desired nucleic acids, enabling multiple omics approaches to
be applied to specific cell types in vivo using a single transgenic mouse line.
Introduction
Gene expression, a compilation of processes actuating information encoded in the genome, is
exquisitely controlled at multiple levels [1,2]. In the nucleus, chemical and conformational
modifications to chromatin modulate the access of transcriptional machineries to gene regula-
tory elements in DNA. A coordinated action of activators and repressors, as well as of chroma-
tin-modifying enzymes, govern which information is converted into RNA transcripts and
which remains silent. Some transcripts are then processed into mature mRNAs and shuttled to
the cytoplasm, where the encoded information is translated by ribosomes into protein. Trans-
lation is controlled at both the level of ribosome subunits binding to mRNAs and through the
actions of the RNA-induced silencing complex (RISC) guided by microRNAs (miRNAs) [3,4].
The latter can stall translation or target mRNAs for degradation [4,5]. This landscape is com-
plemented by various classes of long noncoding RNAs (lncRNAs), RNA species incompletely
understood but thought to have a role in many aspects of gene expression regulation [6,7].
PLOS Biology | https://doi.org/10.1371/journal.pbio.3000374 August 8, 2019 1 / 33
a1111111111
a1111111111
a1111111111
a1111111111
a1111111111
OPEN ACCESS
Citation: Kaczmarczyk L, Bansal V, Rajput A,
Rahman R-u, Krzyżak W, Degen J, et al. (2019)
Tagger—A Swiss army knife for multiomics to
dissect cell type–specific mechanisms of gene
expression in mice. PLoS Biol 17(8): e3000374.
https://doi.org/10.1371/journal.pbio.3000374
Academic Editor: Wendy V. Gilbert, Yale
University, UNITED STATES
Received: May 13, 2019
Accepted: July 17, 2019
Published: August 8, 2019
Copyright: © 2019 Kaczmarczyk et al. This is an
open access article distributed under the terms of
the Creative Commons Attribution License, which
permits unrestricted use, distribution, and
reproduction in any medium, provided the original
author and source are credited.
Data Availability Statement: The accession
number for all the raw NGS data generated in this
study is GSE123422.
Funding: This work was generously supported by
internal funding from the Knut and Alice
Wallenberg Foundation and the German Center for
Neurodegenerative Diseases. Additionally, MF was
supported by grants from the German Research
Foundation (SFB 1089, C01, B06) and ERA-NET
NEURON (MicroSynDep, MicroSchiz). VB, AR, RR,
and SB were supported by DFG and BMBF
Our understanding of how gene expression is coordinated at the cellular level of mamma-
lian tissues has been impeded by their heterogenous nature. Typical assays, when applied to
such tissues, provide information on general regulatory trends but give little to no information
about the cellular source of the observed changes, or about the specific level(s) of gene expres-
sion regulation that directed them. An innovative solution to tackle this challenge is the purifi-
cation of nucleic acids from a related subset of cells after tissue sample lysis. Several strategies
were developed that share the common theme of using cell type–specific genetically engi-
neered handles or tags to purify the target nucleic acids [8]. These methods often employ a
recombinase system, providing access to a wide spectrum of cell types based on cell identity,
developmental stage, or neuronal activity, for example. Transgenic techniques based on this
concept have been applied in laboratory mice to purify translating mRNA [9, 10], mature
miRNA [11,12], pulse-labeled total RNA [13,14], and chromatin and nuclear RNA [15–17].
These reports demonstrate that each level of gene regulation could be captured from specific
cell types with negligible effect of the methods themselves on gene expression.
However, each of these methods alone captures an incomplete picture of gene expression.
Hitherto, only a single method was specifically developed to capture more than one regulatory
level simultaneously by employing a combination of nuclear and ribosomal tags [18]. We
thought more could be gained by combining additional techniques into a single mouse to
investigate a fuller spectrum of gene expression simultaneously.
This prompted us to develop Tagger—a causes recombination (Cre)- and/or flippase (Flp)-
dependent mouse line that stoichiometrically expresses four proteins for the capture of distinct
populations of nucleic acids (Fig 1A and 1B). Tagger captures whole nuclei for chromatin and
nuclear RNA (Nuc-Tag), nascent RNA pulse labeled with 4-Thiouracil (TU-Tag), translating
mRNA embedded in ribosomes (Ribo-Tag), and mature miRNA bound to Argonaute2 (Ago-
Tag) (Fig 1A). Following activation with cell type–specific Cre and/or Flp driver lines, Tagger
provides a platform to perform multiple omics experiments on specific cell populations in vivo
using the same mouse (Fig 1B). In this report, we describe the development of Tagger and
demonstrate the robustness of each component, with comparisons to the original cutting-edge
methods that inspired us to create this multifunctional tool.
Results
Tagger expression is tightly controlled and specific
Our overall strategy was to co-express four proteins to carry out the four functions. Ribo-Tag
functionality was created by expressing the large subunit ribosomal protein 22 (Rpl22) with a
hemagglutinin (HA) epitope Tag (Rpl22-HA), TU-Tag functionality via expression of uracil
phosphoribosyltransferase from Toxoplasma gondii (TgUPRT), Nuc-Tag functionality via
expression of a red fluorescent protein (RFP) targeted to the nucleus with a nuclear localiza-
tion signal (NLS, together RFP-NLS), and Ago-Tag via expression of Argonaute 2 (Ago2) car-
rying V5 and FLAG epitopes (FLAG-V5-Ago2). All four components were encoded by the
same open reading frame and separated by 2A “self-cleaving” peptides [19,20] (Fig 1A and
S1A Fig). We gene-targeted the Tagger construct to the ROSA-26 “safe harbor” locus to access
a wide variety of cell types [21]. Expression is controlled by two terminators: Frt-NeoR-Frt
(FNF) and LoxP-STOP-LoxP (LSL), to enable transgene activation at the intersection of cell
populations expressing Flp and Cre driven by distinct promoters, to target cells based on com-
binations of cell identity markers or activity [22]. A potential problem with this design is the
“leakiness” of STOP cassettes. To rule it out, we tested the functionality of the STOP cassettes
by crossing Tagger mice with mice expressing Cre or Flp ubiquitously (deleter mice). No
detectable expression of any component was observed when either LSL or FNF was present
Multiple levels of gene expression in specific cell types
PLOS Biology | https://doi.org/10.1371/journal.pbio.3000374 August 8, 2019 2 / 33
(BO4221, IDSN, SFB 1286 Z2), Helmholtz iMed,
and VW German-Israeli grants. The funders had no
role in study design, data collection and analysis,
decision to publish, or preparation of the
manuscript.
Competing interests: The authors have declared
that no competing interests exist.
Abbreviations: Ago, Tag, Argonaute2 tag; Ago2,
Argonaute 2; AU, arbitrary unit; CAG,
cytomegalovirus:chicken actin fusion promoter;
CaMKIIα, calcium/calmodulin dependent protein
kinase II; Cre, causes recombination; DMR,
differentially methylated region; EHSB, Extra High
Salt Buffer; FACS, fluorescence activated cell
sorting; FDR, false discovery rate; FFPE, formalin
fixed paraffin embedded; Flp, flippase; FNF, Frt-
NeoR-Frt; Frt, flippase recognition target; Gad2,
glutamic acid decarboxylase 2; Gad67, glutamic
acid decarboxylase 67; HA, hemagglutinin; HSB,
High Salt Buffer; INTACT, isolation of nuclei tagged
in specific cell types; IP, immunoprecipitation;
IRES, internal ribosome entry site; LDS, lithium
dodecyl sulfate; LFC, Log2 fold change; lncRNA,
long noncoding RNA; LSL, LoxP-STOP-LoxP;
MeDIP, methylated DNA immunoprecipitation;
miRAP, miRNA affinity purification; miRNA,
microRNA; mtDNA, mitochondrial DNA; MTSEA,
methyl thiosulfonate ethylammonium; NeoR,
neomycin resistance; NGS, next generation
sequencing; NLS, nuclear localization signal; Nuc-
Tag, nuclei tag; O/N, overnight; ORF, open reading
frame; PCA, principal component analysis; PCL,
principal cell layer of the hippocampus; PGDB,
Protein G Dynabeads; PSB, Polysome Buffer; PV,
parvalbumin; P2A, Porcine Teschovirus 2A peptide;
RFP, red fluorescent protein; Ribo-Tag, ribosome
tag; RISC; RNA, induced silencing complex;
RNAseq, RNA sequencing; Rpl22, large subunit
ribosomal protein 22; RPL22-HA, large subunit
ribosomal protein 22-hemagglutinin (Ribo-Tag
protein); RPM, reads per million; Rps6, small
subunit ribosomal protein 6; RT, room
temperature; Satb2, special AT-rich sequence-
binding protein 2; scRNAseq, single cell RNAseq;
SILAC, stable isotope labeling with amino acids in
cell culture; TES, transcription end site; TgUPRT,
uracil phosphoribosyltransferase from Toxoplasma
gondii; TK, thymidine kinase; TPM, transcripts per
million; TRAP, translating ribosomes affinity
purification; tRFP, turbo red fluorescent protein;
TSS, transcription start site; TU-Tag, 4-thiouracil
tag; vGluT2, vesicular glutamate transporter 2;
VST, variance stabilizing transformation; WPRE,
Woodchuck Hepatitis Virus Postranscriptional
Response Element; WT, wild-type; 4-TU, 4-
thiouracil.
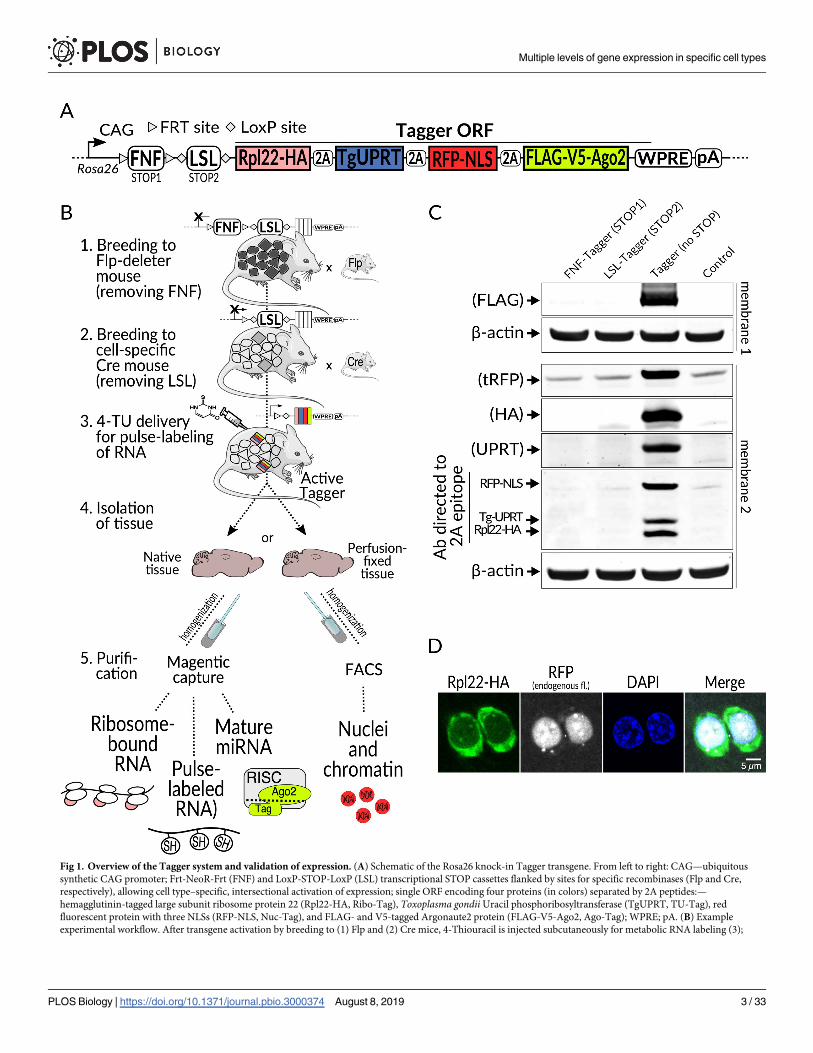
Fig 1. Overview of the Tagger system and validation of expression. (A) Schematic of the Rosa26 knock-in Tagger transgene. From left to right: CAG—ubiquitous
synthetic CAG promoter; Frt-NeoR-Frt (FNF) and LoxP-STOP-LoxP (LSL) transcriptional STOP cassettes flanked by sites for specific recombinases (Flp and Cre,
respectively), allowing cell type–specific, intersectional activation of expression; single ORF encoding four proteins (in colors) separated by 2A peptides:—
hemagglutinin-tagged large subunit ribosome protein 22 (Rpl22-HA, Ribo-Tag), Toxoplasma gondii Uracil phosphoribosyltransferase (TgUPRT, TU-Tag), red
fluorescent protein with three NLSs (RFP-NLS, Nuc-Tag), and FLAG- and V5-tagged Argonaute2 protein (FLAG-V5-Ago2, Ago-Tag); WPRE; pA. (B) Example
experimental workflow. After transgene activation by breeding to (1) Flp and (2) Cre mice, 4-Thiouracil is injected subcutaneously for metabolic RNA labeling (3);
Multiple levels of gene expression in specific cell types
PLOS Biology | https://doi.org/10.1371/journal.pbio.3000374 August 8, 2019 3 / 33

(Fig 1C). In contrast, removal of both led to robust expression in the brain and other organs
(Fig 1C, S2A, S2B and S2C Fig). This demonstrates the functionality of both STOP cassettes
and thus their suitability for intersectional experiments using both recombinases.
Another serious concern was that translation processivity might be impaired. The inclusion
of 2A peptide sequences for co-expression had not been previously employed in mice to
express either four proteins with distinct functions and cellular localization, or such a large col-
lective molecular weight of protein components (approximately 180 kDa in total). A recent
study highlights potential perils and pitfalls with such an approach [23]. However, we did not
detect any immunoblot signals corresponding to unseparated components (Fig 1C). Confocal
microscopy revealed a clear spatial separation of Rpl22-HA (the first component in the open
reading frame [ORF]) and RFP-NLS (the third component) (Fig 1D). Incidentally, in vivo
multiphoton imaging of RFP-NLS showed strong fluorescence restricted to cell nuclei,
highlighting its potential for additional uses (S3A Fig). To further verify that the components
were separated, we co-stained formalin fixed paraffin embedded (FFPE) brain sections with
antibodies against the nuclear component RFP-NLS and either Rpl22-HA or FLAG-V5-Ago2
(the last component), both of which should be mostly cytoplasmic. Indeed, we observed
RFP-NLS protein restricted to the nucleus, whereas Rpl22-HA and FLAG-V5-Ago2 localized
primarily in the cytoplasm (Fig 2A and 2B). Immunoblots probed with an antibody targeting
the residual 2A peptides indicated the proteins were both separated and expressed at similar
levels (Fig 1C, bottom panel). Furthermore, the protein expression levels of Rpl22-HA protein
in ubiquitously activated Tagger and the original RiboTag mice were comparable (S2D Fig).
Importantly, mice activated for ubiquitous expression were viable, fertile, showed no obvious
phenotypic deficits, and lived to at least 24 months. These results indicate that the transgene
expression is tightly controlled, its gene products are synthesized properly, and ubiquitous
expression of the four proteins, including modified variants of Rpl22 and Ago2 that hold cru-
cial cellular functions in their native state, is not overtly toxic.
We next sought to determine if Tagger expression could be directed to specific cell types.
We first established a Tagger line with the FNF STOP cassette already removed (LSL-Tagger)
and then bred it to mice expressing Cre in specific types of neurons. We employed three differ-
ent Cre drivers: one which demonstrates activity in most glutamatergic (excitatory) neurons
throughout the brain, vesicular glutamate transporter 2 (vGluT2)-Cre [24], one to study
GABAergic (inhibitory) neurons, glutamic acid decarboxylase 2 (Gad2)-Cre [25], and one for
a subset of GABAergic neurons, parvalbumin (PV)-Cre [26]. GABAergic neurons are espe-
cially interesting, as they fine-tune excitatory neurons. The Tagger transgene was then acti-
vated by crossing LSL-Tagger mice and Cre mice, yielding vGluT2-Tagger, Gad2-Tagger, and
PV-Tagger mice, respectively. Immunofluorescent stainings of the cell type–specific markers
special AT-rich sequence-binding protein 2 (Satb2), glutamic acid decarboxylase 67 (Gad67),
and PV (specific for glutamatergic, GABAergic, and PV neurons, respectively) revealed a high
specificity of Tagger expression (determined through HA staining of Rpl22-HA and native
alternatively, breeding to Cre and Flp double transgenic mice would enable intersectional activation by both recombinases. Tissue is then isolated (4), homogenized,
and subjected to enrichment of choice (5): affinity purification(s) or FACS of nuclei after optional perfusion-fixation. (C) Immunoblot validation of separation of all
four Tagger components. Top, individual components are detected with antibodies against specific epitopes, labeled on the left. Bottom, detection with a 2A-specific
antibody reveals comparable expression levels for the three components with the residual 2A epitope. Probing was done with the same samples at equal loading
amounts on two different membranes. (D) Immunofluorescence staining of brain cryosection from a vGluT2-Tagger mouse showing separation of tagger components
Rpl22-HA (stained with anti-HA antibody) and RFP-NLS (endogenous fluorescence). The section was counterstained with DAPI. Ago2, Argonaute 2; CAG,
cytomegalovirus:chicken actin fusion promoter; Cre, causes recombination; FACS, fluorescence activated cell sorting; Flp, flippase; FNF, Frt-NeoR-Frt; Frt, flippase
recognition target; LSL, LoxP-STOP-LoxP; NeoR, neomycin resistance; NLS, nuclear localization signal; ORF, open reading frame; pA, polyadenylation signal; RFP, red
fluorescent protein; Rpl22-HA, hemagglutinin-tagged large subunit ribosomal protein 22; tRFP, turbo red fluorescent protein; vGluT2, vesicular glutamate transporter
2; WPRE, Woodchuck Hepatitis Virus Postranscriptional Response Element.
https://doi.org/10.1371/journal.pbio.3000374.g001
Multiple levels of gene expression in specific cell types
PLOS Biology | https://doi.org/10.1371/journal.pbio.3000374 August 8, 2019 4 / 33
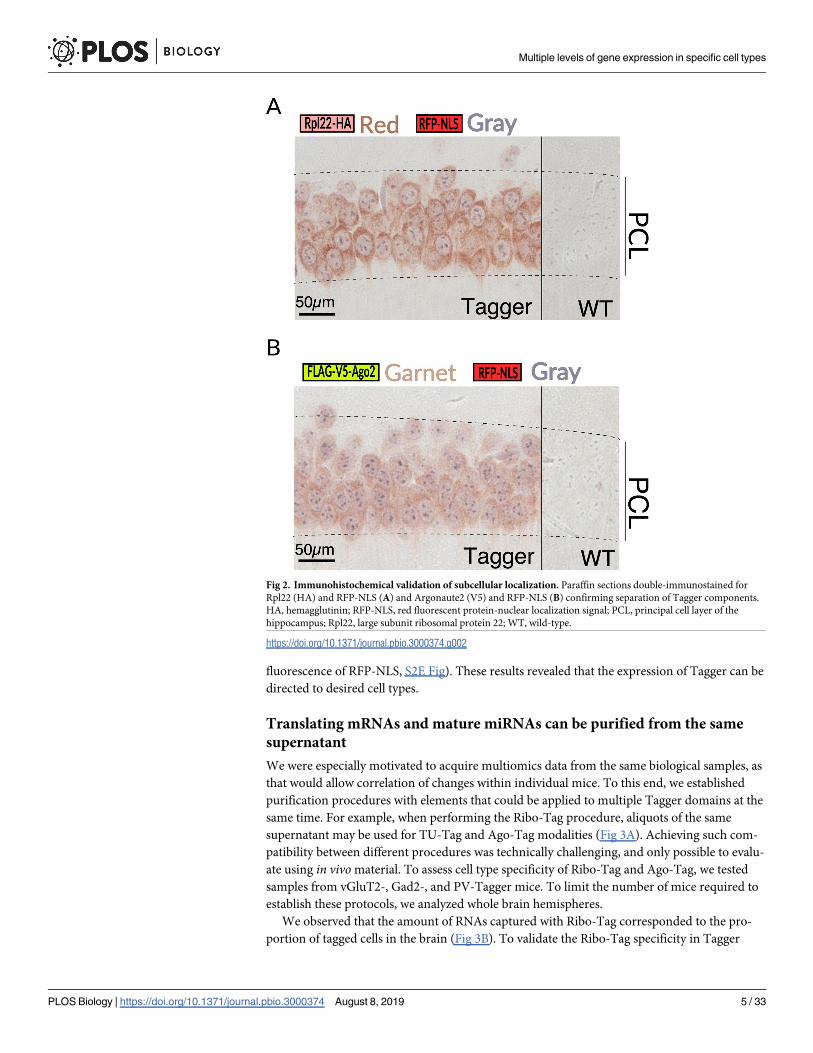
fluorescence of RFP-NLS, S2E Fig). These results revealed that the expression of Tagger can be
directed to desired cell types.
Translating mRNAs and mature miRNAs can be purified from the same
supernatant
We were especially motivated to acquire multiomics data from the same biological samples, as
that would allow correlation of changes within individual mice. To this end, we established
purification procedures with elements that could be applied to multiple Tagger domains at the
same time. For example, when performing the Ribo-Tag procedure, aliquots of the same
supernatant may be used for TU-Tag and Ago-Tag modalities (Fig 3A). Achieving such com-
patibility between different procedures was technically challenging, and only possible to evalu-
ate using in vivo material. To assess cell type specificity of Ribo-Tag and Ago-Tag, we tested
samples from vGluT2-, Gad2-, and PV-Tagger mice. To limit the number of mice required to
establish these protocols, we analyzed whole brain hemispheres.
We observed that the amount of RNAs captured with Ribo-Tag corresponded to the pro-
portion of tagged cells in the brain (Fig 3B). To validate the Ribo-Tag specificity in Tagger
Fig 2. Immunohistochemical validation of subcellular localization. Paraffin sections double-immunostained for
Rpl22 (HA) and RFP-NLS (A) and Argonaute2 (V5) and RFP-NLS (B) confirming separation of Tagger components.
HA, hemagglutinin; RFP-NLS, red fluorescent protein-nuclear localization signal; PCL, principal cell layer of the
hippocampus; Rpl22, large subunit ribosomal protein 22; WT, wild-type.
https://doi.org/10.1371/journal.pbio.3000374.g002
Multiple levels of gene expression in specific cell types
PLOS Biology | https://doi.org/10.1371/journal.pbio.3000374 August 8, 2019 5 / 33

Fig 3. Ribo-Tag. (A) Overview of the procedure. Tissue homogenate, following removal of nuclei and cell debris (S1 supernatant), is split into fractions for purifying
specific classes of nucleic acids. To the fraction for Ribo-Tag, antibodies directed to the HA epitope are added, and the antigen-antibody complexes containing tagged
ribosomes are enriched using protein G dynabeads. Eventually, RNA is released from protein G dynabeads, purified, and subjected to RNAseq. (B) Agilent bioanalyzer
profiles of cell type–specific mRNA. Relative amounts of RNA correspond to the proportion of the analyzed cell population in the brain (color coded), determined by the
Cre driver mouse line that was used (balloon labels, control = no Cre). (C) PCA of the data from three analyzed cell populations and input (S1 supernatant). (D) Heatmap
Multiple levels of gene expression in specific cell types
PLOS Biology | https://doi.org/10.1371/journal.pbio.3000374 August 8, 2019 6 / 33

mice, we performed RNA sequencing (RNAseq) on the enriched mRNAs and the correspond-
ing input supernatants (the latter were used as reference). Principal component analysis (PCA)
showed tight clustering of samples reflecting their cell type of origin (Fig 3C). We then calcu-
lated, using DESeq2 [27], differential gene expression between cell type–specific samples and
total (input) RNA and examined a list of cell type marker mRNAs created from data we
obtained with the original RiboTag mice and largely composed of established cell type markers
(S1 Table). Ribo-Tag data from Tagger mice matched the expected enrichments and depletions
for all genes on this list, indicating that Ribo-Tag purifications perform comparably well in
Tagger as in the original line (Fig 3D).
Having established that the Ribo-Tag component of Tagger yields cell type–specific
mRNAs and thus is expressed in the intended cell types, we analyzed cell type–specific miR-
NAs from vGluT2, Gad2, and PV neurons using the same supernatant (S1 hereafter) as for the
Ribo-Tag method (Fig 4A). To this end, we first determined that the lysis buffer for Ribo-Tag
(Polysome Buffer [PSB]) can be used to immunoprecipitate (IP) RISC-associated miRNAs
using antibodies directed to the FLAG or V5 epitopes on the FLAG-V5-Ago2 component of
the Tagger (S4A Fig). Moreover, anti-FLAG antibody directly coupled to magnetic agarose
performed comparably to tested configurations of antibodies captured with protein G mag-
netic beads, as measured by the magnitude of miRNA peaks on Agilent bioanalyzer 2100 pro-
files (S4A Fig). We also observed that increasing salt concentration has negligible effect on
Ribo-Tag efficiency, and therefore we increased the ionic strength by adding extra 300 mM
NaCl to the original wash buffer [10] (S4B Fig). After establishing the IP conditions, we posi-
tively verified that both, Dicer and endogenous Ago2, co-IP with Ago-Tag and that small sub-
unit ribosomal protein 6 (Rps6) co-IP with Ribo-Tag (S4C Fig). These results indicate that we
captured an assembled RISC and translating ribosomes containing both subunits. We also
detected wild-type (WT) Ago2 and FLAG-V5-Ago2 from HA IPs, suggesting that at least
some of the ribosomes we captured were stalled by RISC (S4C Fig). Thus, Ago-Tag IPs are
robust and the flexibility in antibody-bead configurations may, if needed, enable alternative
purification strategies.
Akin to Ribo-Tag, the amounts of RNA captured with Ago-Tag corresponded to the pro-
portion of cells of origin in the brain (Fig 4B). After performing small RNAseq and analysis
using Oasis 2 [28], the PCA clusters matched with the cell types of origin (Fig 4C). Interest-
ingly, Ago-Tag preparations from vGluT2-, Gad2-, and PV-Tagger samples contained many
fewer non-miRNA reads (0.11%, 0.18%, and 0.37%, respectively) than did the corresponding
total small RNA preparations (3.8%), indicating a 10–30-fold removal of unbound small RNAs
(S2 Table). We quantified miRNA enrichment or depletion levels by comparing the Ago-Tag
samples with the input (total brain cytosolic fraction) using DESeq2 [27], like we did for Ribo-
Tag. Then, we ranked miRNA expression in specific cell types and prepared lists of miRNAs
that were (i) enriched in all, (ii) enriched in only one or (iii) depleted in all three of the ana-
lyzed neuron types (Fig 4D). We found some miRNAs depleted from all neurons, some
enriched in all neurons, and some specifically enriched in neuronal subtypes, such as miR206-
3P for PV, miR139-5p for Gad2, and miR128-3p for vGluT2.
To compare the performance of Ago-Tag with another brain miRNA affinity purification
(miRAP) technology [11], we reanalyzed raw miRAP data using Oasis 2. It is important to
showing relative distribution of Ribo-Tag (Tagger) TPM values for genes for cell type–enriched mRNAs selected based on data obtained with the original RiboTag mouse
[10]. Each column represents one biological replicate. Z-score for each row was calculated to set the input levels to 0: Z = (x–mean(input))/SD(row), where SD is standard
deviation. The complete set of TPM values on which panel D is based can be found in S1 Data. AU, arbitrary unit; Cre, causes recombination; HA, hemagglutinin; PCA,
principal component analysis; RNAseq, RNA sequencing; TPM, transcripts per million.
https://doi.org/10.1371/journal.pbio.3000374.g003
Multiple levels of gene expression in specific cell types
PLOS Biology | https://doi.org/10.1371/journal.pbio.3000374 August 8, 2019 7 / 33

Multiple levels of gene expression in specific cell types
PLOS Biology | https://doi.org/10.1371/journal.pbio.3000374 August 8, 2019 8 / 33

note that He and colleagues analyzed neocortex, while we analyzed the whole brain. For both
data sets, we compared fold changes of cell type–specific miRNAs with respect to correspond-
ing inputs (whole brain miRNAs and neocortical miRNAs in case of Ago-Tag and miRAP,
respectively). Especially due to the latter discrepancy, we expected the Ago-Tag samples to
show fewer differentially expressed miRNAs, as greater cellular heterogeneity of the tissue
would likely obscure the differences between the cell populations in different brain regions.
However, in all studied cell types, Ago-Tag revealed more significant changes as compared
with miRAP (Fig 4E). Enriched and depleted sets of genes revealed by both methods partially
but significantly overlapped (Fig 4F), demonstrating that the specificity and functionality of
Ago-Tag is comparable to that of miRAP.
TU-tagging and purification of thiolated RNA
Incorporation of 4-thiouridinemonophosphate (the active derivative of 4-thiouracil [4-TU])
into nascent RNA is becoming an invaluable technique to study RNA kinetics in cultured cell
experiments, and recently proved critical to distinguish between primary transcriptional
changes from secondary effects in response to manipulation of cancer pathways [29].
We incorporated cell type–specific 4-TU labeling of nascent RNA in mice (TU-tagging)
into the array of Tagger modalities to facilitate studies of transcription kinetics, as well as for
analyses of noncoding RNA networks, examples of which were reported in the mouse brain
[30,31]. However, several challenges have limited the application of TU-Tagging in mice. One
major hurdle is that little is known about 4-TU uptake and removal kinetics in the brain and
therefore optimal labeling times. Another challenge is that, even with optimized labeling peri-
ods, a low signal is expected due to the competition of 4-TU and endogenous (unlabeled) ura-
cil. Moreover, in vivo experiments involve an inherent fraction of non-labeled cells and, thus,
accompany a background signal due to alternative endogenous enzymes also activating 4-TU.
Adding to the low expected signal with the high expected background, the purification chemis-
tries are still imperfect, even for cultured cell experiments. Finally, the most descriptive mouse
TU-Tagging protocols from which to base our pilot experiments were established for brain
endothelial cells [13,14], whereas we aimed to study mature neurons residing on the opposite
side of the blood-brain barrier.
Despite these challenges, we established a foundation protocol for TU-Tagging in Tagger
mice after exploring variations of 4-TU delivery and affinity purification (timing and
sequences of steps, ratios, and concentrations of core components, buffers, etc.). We focused
on nonoverlapping GABAergic and glutamatergic neuronal subpopulations because we
Fig 4. Ago-Tag. (A) Overview of the procedure. Tissue homogenate, following removal of nuclei and cell debris (S1 supernatant), is split into
fractions for purifying specific classes of nucleic acids. The Ago-Tag fraction is then mixed with anti-FLAG epitope magnetic beads to enrich for
Ago-Tag bound to mature miRNAs. The latter are then purified and subjected to small RNAseq. (B) Agilent bioanalyzer profiles of Ago-Tag–
purified miRNA. Relative amounts of RNA correspond to the proportion of the analyzed cell population in the brain (color coded), determined
by the Cre line that was used (balloon labels, control = no Cre). (C) PCA of the data from three analyzed cell populations and input (S1
supernatant). (D) Heatmap showing relative distribution of VST-normalized counts (calculated using DEseq2 package) for 60 miRNAs assigned
to one of five groups: PV enriched, Gad2 enriched, vGluT2 enriched, neuron enriched, and neuron depleted. miRNAs for each group were chosen
on the basis of the rank metric (see Methods), by taking the top 12 genes with |LFC|> 1 and FDR< 0.1 and according to the ranking formula
(left side of respective heatmap). Z-score for each row was calculated as Z = (x–mean(input))/SD(row), where SD is standard deviation. The
complete set of TPM values on which panel D is based can be found in S1 Data. (E) Comparison of distribution of significantly (|LFC|> 1,
FDR< 0.1) changed miRNAs in Ago-Tag and miRAP [11]; numbers in parentheses denote the number of changed miRNAs. (F) Overlap of
significantly enriched (LFC> 1, FDR< 0.1) and significantly depleted (LFC> 1, FDR< 0.1) miRNAs between Ago-Tag data and miRAP [11]
data. Asterisks denote statistically significant overlaps (hypergeometric test, see also S3 Table). Note the lack of statistical significance for
comparisons of data obtained with different Cre drivers (vGluT2-Cre versus CaMKIIα-Cre). Ago2, Argonaute 2; AU, arbitrary unit; CaMKIIα,
calcium/calmodulin dependent protein kinase II; Cre, causes recombination; FDR, false discovery rate; Gad2, glutamic acid decarboxylase 2; LFC,
Log2 fold change; miRAP, miRNA affinity purification; miRNA, microRNA; PCA, principal component analysis; PV, parvalbumin; RNAseq,
RNA sequencing; TPM, transcripts per million; vGluT2, vesicular glutamate transporter 2; VST, variance stabilizing transformation.
https://doi.org/10.1371/journal.pbio.3000374.g004
Multiple levels of gene expression in specific cell types
PLOS Biology | https://doi.org/10.1371/journal.pbio.3000374 August 8, 2019 9 / 33
expected a large set of genes to be differentially expressed for cell markers, and because these
cell types have different electrophysiological properties, common housekeeping mRNAs may
demonstrate different labeling rates between cells. Following a 5-hour labeling period, mice
were humanely killed and their brains removed and flash frozen. To facilitate future experi-
ments combining multiple Tagger components, we started with S1 homogenate fractions as
prepared for Ribo-Tag and Ago-Tag purifications (Fig 5A). Total RNA was purified from S1
fractions using a combination of organic extractions and silica columns. Purified RNA was
then fragmented to reduce signal from sparsely labeled RNA (presumably background label-
ing), then biotinylated and affinity purified with streptavidin-coated magnetic beads (Fig 5A).
Ribosomal RNA constitutes a vast majority of cellular RNA but is not of interest for our pur-
poses, so we established a strategy to remove it using RNaseH digestion [32]. To test for cell
type specificity, we performed RNAseq on the affinity purified RNAs and their related
unbound counterparts.
PCA analysis revealed clustering of samples according to the cell type of origin (Fig 5B). We
observed more variation in the unbound samples, which was later determined to be due to
residual contamination with ribosomal RNA not uniformly removed from all samples. How-
ever, the affinity-purified samples had no significant ribosomal contamination; hence, they
formed tighter clusters. Because the current TU-Tagging method is labor intensive with many
possibilities for an accidental deviation from the protocol, the entire process was repeated with
a new group of mice. Despite being prepared several months later, the second batch was
remarkably similar (S5A Fig). Detailed analysis revealed a batch effect, but the differences in
cell type of origin showed a greater contribution to the variation between replicates than did
the differences between batches (S5B Fig). We then evaluated the relative enrichments and
depletions of mRNAs using the same gene list that was used to validate the Ribo-Tag modality
(S1 Table). Remarkably, all mRNAs matched the trends observed in Ribo-Tag (Fig 5C). We
then further cross-compared TU-Tag with Ribo-Tag by selecting RNAs based on arbitrarily
defined criteria instead of cell type markers. The top 10 RNAs for each of the following four
groups for each modality were selected: (1) enriched in vGluT2 and depleted in Gad2, (2)
enriched in Gad2 and depleted in vGluT2, (3) enriched in both Gad2 and vGluT2, and (4)
depleted in both Gad2 and vGluT2 (see Methods section for details of the selection). RNAs
selected within the TU-Tag modality showed similar trends in the Ribo-Tag domain (Fig 5D),
and the same was the case for the reverse cross-comparison (Fig 5E). We observed some dis-
crepancies between the two domains, some of which may be due to batch effects, but also
because the two labeling methods are expected to capture slightly different pools of mRNAs.
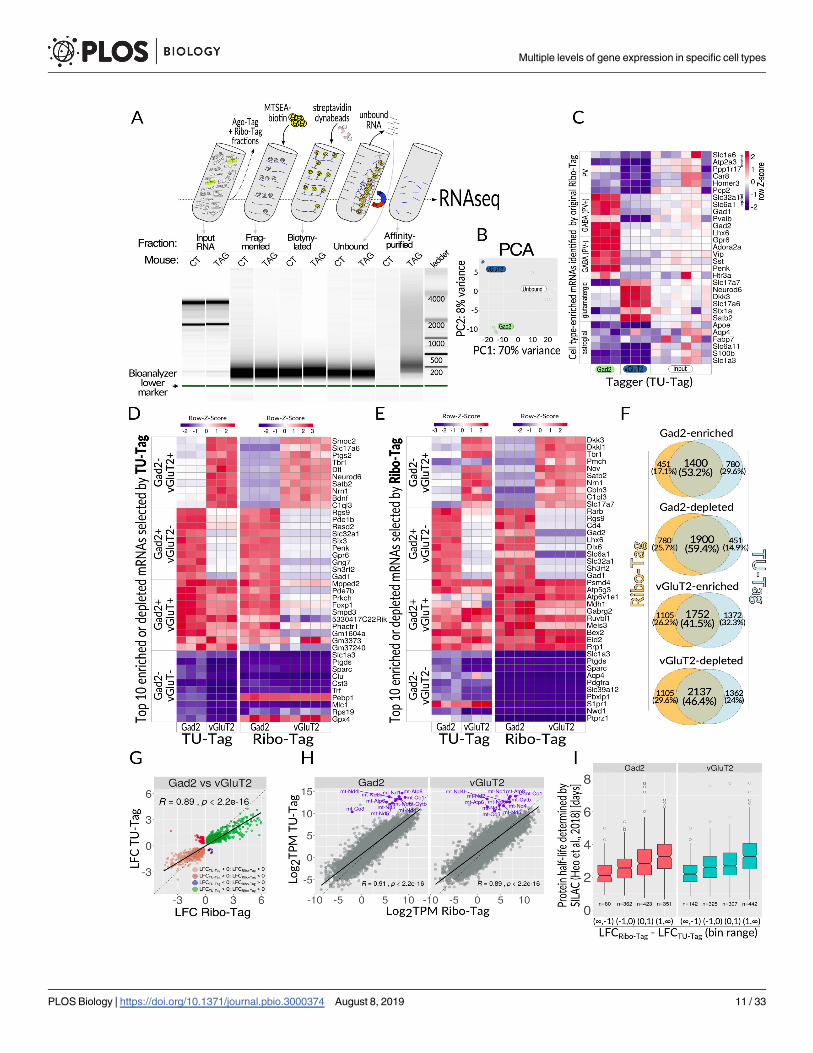
Overall, we found significant overlaps across all RNAs that showed (compared with the refer-
ence samples) (1) enrichments in both domains (Log2 fold change [LFC] > 0 and false discov-
ery rate [FDR] < 0.1, overlap of 53.2% and 41.5% for Gad2 and vGluT2, respectively) and (2)
depletions in both domains (LFC > 0 and FDR< 0.1, overlap of 59.4% and 46.6% for Gad2
and vGluT2, respectively) (Fig 5F). Noteworthy, all four overlaps had incalculably low p-values
when a hypergeometric test was applied. A similar trend was observed when we directly com-
pared both analyzed neuronal types, Gad2 and vGluT2, across both modalities (Fig 5G). In
this case, there was a high correlation between the cell types (R = 0.89), but genes showing the
opposite direction of change between the domains were also detected (Fig 5G). Altogether,
after systemic administration of 4-TU, RNAs in specific brain cell types were labeled specifi-
cally and sufficiently for affinity purification, setting a foundation for future TU-Tagging
experiments in adult mouse brains.
After applying Ribo-Tag data to confirm the robustness of Tagger’s TU-Tag, we wondered
if we could gain additional information by discriminating differences between RNAs captured
by the two methods. This seemed conceivable, as each of those methods labels and captures
Multiple levels of gene expression in specific cell types
PLOS Biology | https://doi.org/10.1371/journal.pbio.3000374 August 8, 2019 10 / 33
Multiple levels of gene expression in specific cell types
PLOS Biology | https://doi.org/10.1371/journal.pbio.3000374 August 8, 2019 11 / 33

RNAs in different ways, and because the target RNAs comprise different fractions of the total
cellular pool. For example, a substantial proportion of mRNAs are not associated with intact
ribosomes but are instead contained in mitochondria or in granules for sequestration or trans-
port. As a result, such RNAs will likely escape capture by Ribo-Tag. Furthermore, ribosome-
bound and ribosome-free transcripts likely differ in synthesis and degradation rates. Finally,
the amount of RNA bound to ribosomes may not directly correspond with the overall tran-
scription rate, e.g., for long-lived mRNAs during an acute transcriptional response. In view of
the above, Ribo-Tag and TU-Tag should mutually complement each other. We strived to
synergize the TU-Tag and Ribo-Tag workflows as much as possible, but essential differences
in sample processing (e.g., RNA fragmentation early in the TU-Tag purification procedure)
were expected to introduce bias. Therefore, we did not directly compare individual Ribo-Tag
and TU-Tag cell type–specific samples but rather calculated differential enrichments within
each modality and used the calculated LFC values for comparisons. It is important to mention
that, due to technical limitations, we performed poly(A)+ RNA enrichment for the Ribo-Tag
materials. Therefore, as histone mRNAs are known to lack poly(A) tails and were underrepre-
sented in our Ribo-Tag samples, we disregarded histone RNAs in the analysis to reduce the
potential bias.
Interestingly, a difference between the modalities was especially prominent for a small, yet
highly expressed pool of genes encoded in mitochondrial DNA (mtDNA). These genes
(encoding components of the electron transport chain) are transcribed and translated in mito-
chondria. Because Rpl22 and the Ribo-Tag component (Rpl22-HA) of Tagger are absent from
mitochondria, mitochondrially encoded mRNAs were barely detected, if at all, in the Ribo-Tag
fractions of vGluT2- and Gad2-Tagger brains (Fig 5H).
Because TU-Tag labels RNA following a pulse of exogenous 4-TU, the extent of labeling
would depend on several factors, such as RNA turnover rate. Even though we had little infor-
mation about dynamics of 4-TU metabolism after subcutaneous administration (especially
about the time until the peak concentration in the brain would be reached and the expected
clearance time), we expected that long-lived and short-lived RNAs might be labeled differently.
Fig 5. TU-Tag. (A) Top, overview of key steps of the procedure. Tissue homogenate, following removal of nuclei and cell debris (S1 supernatant), is
split into fractions for purifying specific classes of nucleic acids. Thiolated RNA from the TU-Tag is fragmented, biotinylated, and affinity purified
using streptavidin-coated dynabeads, and eventually sequenced. Bottom, Bioanalyzer 2100 analysis of the consecutive fractions from the procedure on
top. (B) PCA of the data from two analyzed cell populations (vGluT2 and Gad2 neurons, n = 3 each) and unbound fraction. (C) Heatmap showing
relative distribution of TU-Tag TPM values for cell type–enriched mRNAs selected based on data obtained with the original Ribo Tag mouse. Each
column represents one biological sample. Z-score for each row was calculated to set the input levels to 0: Z = (x–mean(input))/SD(row), where SD is
standard deviation. (D) Ribo-Tag assessment of enrichment and/or depletion of 40 genes chosen based on TU-Tag; top 10 genes for each category were
selected as follows: enriched in vGluT2 and depleted in Gad2 (LFCvGluT2 > 0, LFCGad2 < 0), enriched in Gad2 and depleted in vGluT2 (LFCvGluT2 > 0,
LFCGad2 < 0), enriched in both Gad2 and vGluT2 (LFCvGluT2 > 0, LFCGad2 > 0), depleted in both Gad2 and vGluT2 (LFCvGluT2 > 0, LFCGad2 > 0). For
each category, the top 10 genes were selected on the basis of the rank metric (|rnkGad2|+|rnkvGluT2|); mitochondrially encoded genes were excluded
from the analysis. (E) Similar to panel D, except that the gene selection was done on the basis of Ribo-Tag and then juxtaposed with TU-Tag. (F)
Comparison of the overlaps between Ribo-Tag and TU-Tag modalities with respect to the number and direction of significant enrichments (LFC> 0,
FDR< 0.1) and depletions (LFC< 0, FDR< 0.1). LFC was calculated by comparing with S1 input supernatants for Ribo-Tag and unbound fractions
for TU-Tag affinity purification. All overlaps were deemed highly significant by the hypergeometric test. (G) Direct comparison of TU-Tag and Ribo-
Tag between two tested neuronal types: Gad2 and vGluT2 cells, showing a high correlation of data, albeit some genes display discrepant behavior
between the modalities. (H) Scatterplots of log2-transformed TPM values from TU-Tag and Ribo-Tag modalities plotted against each other. mtDNA
encoded genes were highlighted in blue and labeled with gene symbols. (I) Correlation of RNA turnover inferred from Tagger data with SILAC-
determined protein turnover times [33] for both tested neuronal subtypes. For each cell subtype, the x-axis represents differences between LFCRibo-Tag
and LFCTU-Tag (both calculated with respect to the corresponding S1 and unbound RNA, respectively), binned into four value ranges: (−1, −1), (−1,
0), (0, 1), and (1,1). The y-axis represents the turnover time inferred from SILAC experiments on primary neuronal cultures [33]. RNAs with faster
turnover (as determined by SILAC) tend to have LFCRibo-Tag−LFCTU-Tag lower than RNAs with slower turnover. All differences between groups were
significant (Kruskal-Wallis test with post hoc Dunn test, see S2 Table for detailed test results). The raw data on which panels C, D, E, and I are based
can be found in S1 Data. CT, control; FDR, false discovery rate; Gad2, glutamic acid decarboxylase 2; LFC, Log2 fold change; mtDNA, mitochondrial
DNA; MTSEA,methyl thiosulfonate ethylammonium; PCA, principal component analysis; RNAseq, RNA sequencing; SILAC, stable isotope labeling
with amino acids in cell culture; TAG, Tagger; TPM, transcripts per million; vGluT2, vesicular glutamate transporter 2.
https://doi.org/10.1371/journal.pbio.3000374.g005
Multiple levels of gene expression in specific cell types
PLOS Biology | https://doi.org/10.1371/journal.pbio.3000374 August 8, 2019 12 / 33

If the peak concentration was reached quickly and if the clearance was fast, it might be impos-
sible to detect short-lived RNAs after a certain time postinjection (e.g., 5 hours). On the other
hand, longer retention of 4-TU (and thus a longer effective labeling window) would favor
RNAs with shorter half-lives and result in a higher proportion of such RNAs becoming labeled.
To determine which of the above trends is true, we first assumed that the relationship between
Ribo-Tag and TU-Tag modalities could be used to infer RNA turnover times. As our metric
reflecting the turnover, we have chosen the difference between LFCRibo-Tag and LFCTU-Tag
(both LFCs calculated with respect to the corresponding reference fraction, so S1 and unbound
RNA, respectively). Our second assumption was that the turnover of coding RNAs will be, at
least generally, a good predictor for inferring the turnover of the corresponding encoded pro-
teins, and vice versa. Because our Ribo-Tag and TU-Tag data were from neuronal subtypes, we
compared them with protein turnover rates calculated using stable isotope labeling with
amino acids in cell culture (SILAC) in primary neuronal cells, focusing on transcripts encod-
ing proteins that were quantified by SILAC in the study of Heo and colleagues [33]. We then
divided mRNAs based on our inferred RNA turnover metric (LFCRibo-Tag − LFCTU-Tag) into
four bin ranges: (−1, −1), (−1, 0), (0, 1), and (1,1), and compared mean RNA turnover in
each of the bins with the turnover of corresponding proteins determined by SILAC (Fig 5I).
RNAs encoding proteins with faster turnover times tended to have LFCRibo-Tag − LFCTU-Tag
differences lower than RNAs encoding proteins with slower turnover. Although the turnover
of protein is affected by different mechanisms and would not always reflect the stability and/or
half-life of the encoding RNA, we observed a clear overall trend (Fig 5I), and the differences
between each group and for each cell type were significant (Kruskal-Wallis test with post hoc
Dunn test, see S3 Table for test results). Therefore, in spite of many technical nuances,
TU-Tagging is robust and labels overlapping yet different populations of RNAs than Ribo-
Tag, thereby greatly complementing the latter methodology.
Purification of nuclei from specific cell types
We previously applied region- and neuron-specific analysis of chromatin modifications to
investigate the consolidation and maintenance of memory [34]. In that study, we employed a
universal neuronal marker and could not distinguish between excitatory and inhibitory nuclei,
thereby motivating us to include the Nuc-Tag component in Tagger.
To facilitate fluorescence activated cell sorting (FACS) enrichment of cell type–specific
nuclei, we incorporated RFP-NLS into Tagger mice. We chose mKate2 for the RFP because it
is small (28 kDa) and its native fluorescence is resistant to quenching by formaldehyde fixation
[35], thereby providing compatibility with our chip protocols, typically including formalde-
hyde treatment [34,36]. As endogenous red fluorescence of mKate2 penetrates tissues very
well, it is also a useful in vivo imaging tool [37]. We avoided fusing nuclear proteins to RFP to
achieve nuclear localization because we found that protein fusions with nuclear matrix target-
ing signals or nuclear Lamin B1 either performed poorly or disturbed the nuclear structure,
and because some fusions, such as with histones, can result in toxicity [18,38]. Thus, we
directed RFP to the nucleus by three tandem NLSs only.
Examination of brain slices revealed that RFP-NLS was restricted to the nucleus (Figs 1D,
2A and 2B). Fluorescence was sufficiently strong for deep in vivo multiphoton imaging of the
mouse brain to at least 300 μm (S3A Fig). We then wondered if, in the context of damaged tis-
sue, the transgene would continue to be expressed. Indeed, RFP-NLS fluorescence remained
stable in close proximity to laser-lesioned tissue (S1 Movie, S3B, S3C and S3D Fig), indicating
Tagger ought to be suitable for studies of diseased and damaged tissues. Despite the stable
expression in lesioned tissue, but in line with a previous report [39], RFP-NLS rapidly diffused
Multiple levels of gene expression in specific cell types
PLOS Biology | https://doi.org/10.1371/journal.pbio.3000374 August 8, 2019 13 / 33
out of the nucleus upon cell lysis of unfixed tissues. This happened with several compositions
of lysis buffer but could be prevented through fixation of the brain by transcardial perfusion
with 10% formalin prior to homogenization [39]. Thus, FACS purification of nuclei using the
Nuc-Tag element of Tagger requires formaldehyde fixation prior to homogenization. FACS
analysis of nuclei from pre-fixed brains revealed a high overlap of HA+ and RFP-NLS+ popula-
tions (Fig 6B). Finally, upon FACS of Tagger+ nuclei, the proportion of labeled nuclei matched
the numbers we expected based on their relative abundance in the brain (Fig 6B).
We further boosted the separation of Tagger+ from Tagger− nuclei by supplementing the
fluorescence of RFP in fixed Tagger+ nuclei with HA immunofluorescence labeling, because
ribosomal subunits are assembled there. The proportions of RFP+/HA+ nuclei directly corre-
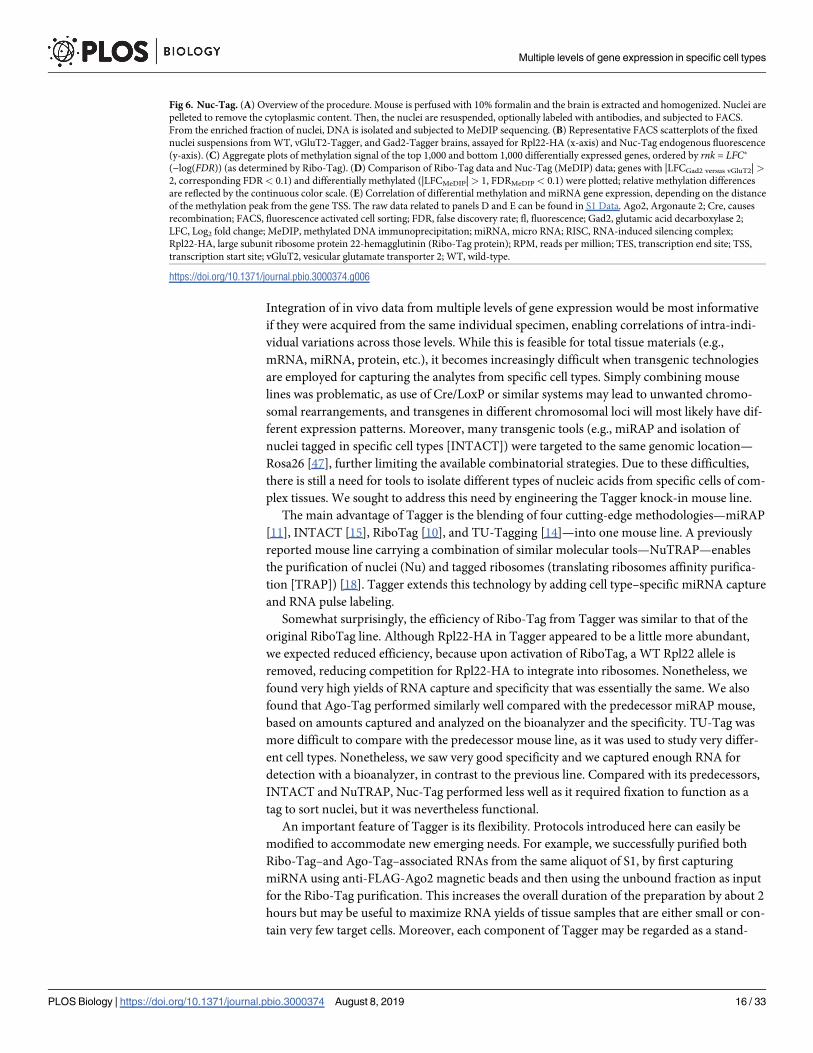
lated with the proportion of targeted cells in the brain (Fig 6B). Regions of methylated DNA
were then immunopurified (MeDIP) and sequenced. To confirm that FACS isolated nuclei
were indeed derived from the cell types of interest, we first looked at aggregate plots of MeDIP
signal on the top 1,000 and bottom 1,000 differentially expressed genes in Gad2 and vGluT2
neurons, as determined by Ribo-Tag. As expected, MeDIP signal was inversely correlated with
the differential expression (Fig 6C). Out of genes that were at least 2-fold higher expressed in
vGluT2 compared with Gad2 cells (LFCvGluT2 versus Gad2 > 1, FDR< 0.05), all were hyper-
methylated in Gad2 cells as compared with input material, with only one methylation peak in
a gene Neuronal differentiation 1 (Neurod1) showing the opposite trend (Fig 6D). Likewise,
most genes that were expressed at least 2-fold higher in Gad2 cells compared with input
(LFCGad2 versus vGluT2 > 1, FDR < 0.05) were hypermethylated in vGluT2 cells (Fig 6D). We
also did a similar comparison using both Ribo-tag and TU-tag data, highlighting differences
between the cell types (Gad2 versus vGluT2) instead of comparing first to the input. Similarly,
the majority of mRNA-level differences matched the expected methylation pattern (S6 Fig).
To complete our evaluation, we also examined correlations of miRNA expression and DNA
methylation between Gad2 and vGluT2 neurons. To this end, we identified methylation peaks
surrounding miRNA precursor genes and calculated how the mean changes of methylation of
these genes correlated with miRNA expression levels. As expected, we observed a negative cor-
relation that increased with decreasing size of the genomic window of interest surrounding the
gene (Fig 6E).
As we expect formaldehyde fixation will impair the remaining components, we also devel-
oped an alternative approach to purify nuclei from unfixed samples. We accomplished this by
immunolabeling Rpl22-HA (S2F Fig) because ribosomal subunits are assembled in the nucleus
and are too large to passively diffuse through nuclear pores, even without fixation [40]. There-
fore, Tagger enables the capture of nuclei and, thus, extraction and analysis of DNA from spe-
cific cell types. Moreover, data can be synergized with the remaining three modalities of the
system.
Discussion
The immense diversity of mammalian cells and their multilayered systems of gene expression
regulation pose a huge challenge for research. This challenge is especially notorious in neuro-
science, because even a small region of the brain is extremely heterogenous [41]. Many brain
functions are poorly understood and most brain diseases are incurable. Alzheimer’s, Parkin-
son’s and most other protein misfolding-associated neurodegenerative diseases are known to
affect specific cell types of the brain [42,43] and are widely reported to affect gene expression
at multiple levels [44–46]. There is, therefore, a long-standing need for better tools to decipher
the relationships between multiple levels of gene expression in specific cell types of complex
tissues. In recent years, omics technologies have become a fundamental part of this toolkit.
Multiple levels of gene expression in specific cell types
PLOS Biology | https://doi.org/10.1371/journal.pbio.3000374 August 8, 2019 14 / 33

Multiple levels of gene expression in specific cell types
PLOS Biology | https://doi.org/10.1371/journal.pbio.3000374 August 8, 2019 15 / 33
Integration of in vivo data from multiple levels of gene expression would be most informative
if they were acquired from the same individual specimen, enabling correlations of intra-indi-
vidual variations across those levels. While this is feasible for total tissue materials (e.g.,
mRNA, miRNA, protein, etc.), it becomes increasingly difficult when transgenic technologies
are employed for capturing the analytes from specific cell types. Simply combining mouse
lines was problematic, as use of Cre/LoxP or similar systems may lead to unwanted chromo-
somal rearrangements, and transgenes in different chromosomal loci will most likely have dif-
ferent expression patterns. Moreover, many transgenic tools (e.g., miRAP and isolation of
nuclei tagged in specific cell types [INTACT]) were targeted to the same genomic location—
Rosa26 [47], further limiting the available combinatorial strategies. Due to these difficulties,
there is still a need for tools to isolate different types of nucleic acids from specific cells of com-
plex tissues. We sought to address this need by engineering the Tagger knock-in mouse line.
The main advantage of Tagger is the blending of four cutting-edge methodologies—miRAP
[11], INTACT [15], RiboTag [10], and TU-Tagging [14]—into one mouse line. A previously
reported mouse line carrying a combination of similar molecular tools—NuTRAP—enables
the purification of nuclei (Nu) and tagged ribosomes (translating ribosomes affinity purifica-
tion [TRAP]) [18]. Tagger extends this technology by adding cell type–specific miRNA capture
and RNA pulse labeling.
Somewhat surprisingly, the efficiency of Ribo-Tag from Tagger was similar to that of the
original RiboTag line. Although Rpl22-HA in Tagger appeared to be a little more abundant,
we expected reduced efficiency, because upon activation of RiboTag, a WT Rpl22 allele is
removed, reducing competition for Rpl22-HA to integrate into ribosomes. Nonetheless, we
found very high yields of RNA capture and specificity that was essentially the same. We also
found that Ago-Tag performed similarly well compared with the predecessor miRAP mouse,
based on amounts captured and analyzed on the bioanalyzer and the specificity. TU-Tag was
more difficult to compare with the predecessor mouse line, as it was used to study very differ-
ent cell types. Nonetheless, we saw very good specificity and we captured enough RNA for
detection with a bioanalyzer, in contrast to the previous line. Compared with its predecessors,
INTACT and NuTRAP, Nuc-Tag performed less well as it required fixation to function as a
tag to sort nuclei, but it was nevertheless functional.
An important feature of Tagger is its flexibility. Protocols introduced here can easily be
modified to accommodate new emerging needs. For example, we successfully purified both
Ribo-Tag–and Ago-Tag–associated RNAs from the same aliquot of S1, by first capturing
miRNA using anti-FLAG-Ago2 magnetic beads and then using the unbound fraction as input
for the Ribo-Tag purification. This increases the overall duration of the preparation by about 2
hours but may be useful to maximize RNA yields of tissue samples that are either small or con-
tain very few target cells. Moreover, each component of Tagger may be regarded as a stand-
Fig 6. Nuc-Tag. (A) Overview of the procedure. Mouse is perfused with 10% formalin and the brain is extracted and homogenized. Nuclei are
pelleted to remove the cytoplasmic content. Then, the nuclei are resuspended, optionally labeled with antibodies, and subjected to FACS.
From the enriched fraction of nuclei, DNA is isolated and subjected to MeDIP sequencing. (B) Representative FACS scatterplots of the fixed
nuclei suspensions from WT, vGluT2-Tagger, and Gad2-Tagger brains, assayed for Rpl22-HA (x-axis) and Nuc-Tag endogenous fluorescence
(y-axis). (C) Aggregate plots of methylation signal of the top 1,000 and bottom 1,000 differentially expressed genes, ordered by rnk = LFC�(−log(FDR)) (as determined by Ribo-Tag). (D) Comparison of Ribo-Tag data and Nuc-Tag (MeDIP) data; genes with |LFCGad2 versus vGluT2|>
2, corresponding FDR< 0.1) and differentially methylated (|LFCMeDIP|> 1, FDRMeDIP < 0.1) were plotted; relative methylation differences
are reflected by the continuous color scale. (E) Correlation of differential methylation and miRNA gene expression, depending on the distance
of the methylation peak from the gene TSS. The raw data related to panels D and E can be found in S1 Data. Ago2, Argonaute 2; Cre, causes
recombination; FACS, fluorescence activated cell sorting; FDR, false discovery rate; fl, fluorescence; Gad2, glutamic acid decarboxylase 2;
LFC, Log2 fold change; MeDIP, methylated DNA immunoprecipitation; miRNA, micro RNA; RISC, RNA-induced silencing complex;
Rpl22-HA, large subunit ribosome protein 22-hemagglutinin (Ribo-Tag protein); RPM, reads per million; TES, transcription end site; TSS,
transcription start site; vGluT2, vesicular glutamate transporter 2; WT, wild-type.
https://doi.org/10.1371/journal.pbio.3000374.g006
Multiple levels of gene expression in specific cell types
PLOS Biology | https://doi.org/10.1371/journal.pbio.3000374 August 8, 2019 16 / 33
alone tool. As the performances of Ribo-Tag, Ago-Tag, and TU-Tag modalities are comparable
with their predecessors, we see Tagger as a viable solution for investigators who aim to embark
on any of these methods, with the option of implementing additional modalities later.
Importantly, by gaining more information from individual mice, Tagger results in a refine-
ment of information obtained from each mouse, potentially leading to a reduction in the total
number of animals needed, in accordance with ethical guidelines for the use of animals in
research. Such a refinement and reduction will be especially beneficial in studies requiring sub-
stantial investments in individual mice, such as experiments involving aging, behavioral train-
ing, or tedious surgical procedures.
Future refinements
Our current work demonstrates that the TU-Tag component of Tagger largely labels RNAs in
the cells of interest, while also providing information complementing Ribo-Tag. For example,
mitochondrially encoded genes were preferentially captured by TU-Tag (Fig 5H). Because
mitochondrial metabolism is compromised in many human diseases [48], including neurode-
generation [49], TU-Tagging may provide a novel tool to measure this impairment in disease
models, which would be missed by Ribo-Tag studies.
Applying new methods may further improve the potential/specificity of TU-Tag. The strat-
egy we employed depletes off-target (nonspecifically labeled) RNAs by fragmenting RNA
before affinity purification. Off-target RNAs have many fewer thiol groups, whereas on-target
(specifically labeled) RNAs have many more thiols. However, a newly developed series of
methods based on direct quantification of the number of thiol groups could conceivably be
applied to Tagger. These methods are based on a chemical conversion of thiolated nucleotides,
similar to that used for bisulfite sequencing of DNA [50,51]. The value of these chemical con-
version methods has already been demonstrated in a study of RNA transcription and decay
kinetics in cell culture [29]. Application of these methods to Tagger would provide at least
three improvements. First, the necessity to fragment RNA would be eliminated, thereby
improving yields. Second, the bias we observed comparing total RNA libraries for TU-Tag-
ging, which required fragmentation, with the unfragmented Ribo-Tag samples, would be elim-
inated. Third, RNA enriched with the biotin-based capture could then be segregated into
categories of highly labeled and therefore on target, or lowly labeled and therefore off target
and filtered out. Any of these would be a great improvement and would enhance studies of tis-
sue samples that are small or carry few cells of interest. Moreover, the capacity to employ mul-
tiple components of the Tagger could be exploited further. For example, mRNA could first be
captured by Ribo-Tag, and then a portion of these mRNAs could be analyzed with a chemical
conversion method to determine which were newly synthesized and potentially determining
cell type–specific kinetics and turnover rates of individual transcripts.
Nuc-Tag is the Tagger component most different from predecessor methods. In both
NuTRAP and INACT, nuclear envelope fusion proteins label cell type–specific nuclei, which
can be purified with affinity purification or FACS [15,18]. To mitigate risks of expression and
gene-targeting problems, Tagger uses an unanchored RFP fused with a triple NLS as a neces-
sary trade-off because the coding sequence for the small (28 kDa) protein better fit into an
already large knock-in construct (S1A Fig). Although Nuc-Tag requires formaldehyde fixation,
the RFP endogenous fluorescence is highly resistant to cross-linking, preserving sufficient sig-
nal for FACS and histology. This design also reduces the risk of interference with nuclear func-
tions, as there is no endogenous protein that might compete with the fusion tag for binding
partners or subnuclear localization. Although the necessity of fixation may be seen as a down-
side, it is partially compensated for by its excellent performance in deep in vivo two-photon
Multiple levels of gene expression in specific cell types
PLOS Biology | https://doi.org/10.1371/journal.pbio.3000374 August 8, 2019 17 / 33
imaging. Furthermore, fixation may prove beneficial to retain other molecules of potential
interest (e.g., nuclear RNA or proteins). Alternatively, it is also possible to isolate unfixed cell
type–specific nuclei with Tagger. This can be accomplished through HA labeling, as Rpl22-HA
(Ribo-Tag) is shuttled to the nucleus, where ribosomal subunits are assembled. The assembled
ribosome complexes are too large to passively diffuse out, and thus Rpl22-HA might be used
as an alternative nuclear tag for the capture of native nuclei (S2F Fig) [40]. In this setup, it
would be possible to purify native nuclei and, in parallel, co-capture Ago-Tag, Ribo-Tag, and
TU-Tag modalities from the same sample.
We also anticipate the combined use of Cre and Flp drivers for the incorporation of inter-
sectional labeling of target cells to be an important refinement. In many cases, this will result
in a very small number of cells being labeled. Although we have not tried to use such sparsely
labeled Tagger samples, we can envision there being new challenges. However, these chal-
lenges should be easily met by dissecting tissues to remove areas lacking positive cells, and pos-
sibly combining such dissected tissues from multiple mice.
Tagger in the context of other methods
A separate group of methods may be viewed as competing with technologies like Tagger.
These methods investigate gene expression in thousands of individual single cells in parallel,
the most notable of which is single cell RNAseq (scRNAseq). An important advantage of
scRNAseq is its applicability to WT samples, including human tissues. Tagger requires expres-
sion of foreign DNA, which is most stably provided by transgenesis and, in its current form,
requires at least one recombinase, currently provided by an additional transgene. Another
advantage of scRNAseq is that there is no cellular heterogeneity to obscure information, as is
the case in Tagger, for which specific populations will necessarily carry some inherent
heterogeneity.
However, scRNAseq technologies are not without their downsides. With scRNAseq, the
types of nucleic acids studied are heterogenous and typically limited. As a result, information
such as whether detected mRNAs are mature or attached to ribosomes remains obscured. Sim-
ilarly, single cell methods for miRNAs and chromatin are seldom studied, mainly for technical
reasons. Another limitation of scRNAseq is the comparatively low coverage of the transcrip-
tome, which results in moderately and lowly expressed genes being undetected [52]. Moreover,
dissociation of samples needed to obtain single cell suspensions comes at the expense of biases
due to material losses (e.g., dendritic or axonal RNAs) and artifactual changes in gene expres-
sion induced by the dissociation procedure. In this context, a major advantage of Tagger is the
instant homogenization of tissue upon dissection or flash freezing of the specimens for later
analysis. Finally, pulse labeling methods such as TU-Tagging would be difficult to implement
for in vivo scRNAseq experiments, because the majority of RNA would be unlabeled and a bio-
chemical enrichment strategy would be needed. Tagger preserves the native states of the ana-
lytes by circumventing the inherent dissociation step in scRNAseq methods.
While many of the scRNAseq limitations are acceptable in studies aimed at elucidating a tis-
sue’s cellular diversity and taxonomy [41], they become problematic when it comes to analyz-
ing functional relationships between cells, in which shifts in expression of moderate and lowly
expressed genes often play key roles [53]. Therefore, we view Tagger and scRNAseq methods
as being complementary. In one case, a good separation of cell types can be obtained at the
expense of mixing of nucleic acid types, whereas in the other case, a good separation of nucleic
acid types can be obtained at the expense of the mixing of related cell types.
In spite of its limitations, Tagger offers unprecedented versatility, with potential for further
development. The modalities of Tagger can be used to extract analytes related to distinct levels
Multiple levels of gene expression in specific cell types
PLOS Biology | https://doi.org/10.1371/journal.pbio.3000374 August 8, 2019 18 / 33
of gene expression. These four components, akin to tools in a Swiss army knife, can be com-
bined as seen fit for individually customized, cell type–specific multiomics experiments. In this
way, the Tagger expands the amount, quality, and completeness of information attained from
every invaluable mouse.
Gene expression data presented in this report can be visualized using a shiny app accessible
at https://shiny.it.liu.se/shiny/TaggerApp. Raw next generation sequencing (NGS) data are
available from NCBI GEO (GSE123422).
Materials and methods
Ethical statement
Ethical permissions for this work were granted by the Landesamt fur Natur, Umwelt und
Verbraucherschutz Nordrhein-Westfalen, 84–02.04.2012.A192, 84–02.04.2017.A016, 84–
02.04.2013.A128, 84–02.04.2017.A098, and 84–02.04.2013.A169. All experimental procedures
were performed in accordance with the internal regulations of the DZNE.
Tagger mouse generation
We expected that the use of a recombinase system in a context of multiple transgenes would
lead to intergenic rearrangements and/or discrepancies in expression patterns of expressed
proteins [8]. These unpredictable and hard to control confounders enforced an alternative
approach—2A peptide [19], also used successfully in the NuTRAP mouse [18]. In contrast to
internal ribosome entry sites (IRESs), which typically result in decreased expression of down-
stream IRES-driven components [54], which we feared would multiply when using multiple
IRESs, 2A peptides efficiently separate multiple proteins with similar stoichiometry and fully
retained functions [19]. We designed a transgene comprising HA-tagged ribosomal protein
L22 (Rpl22-HA, for Ribo-Tag), Uracil phosphoribosyltransferase from T. gondii (TgUPRT, for
TU-Tag), red fluorescent protein with a triple NLS (RFP-NLS, for Nuc-Tag), and FLAG-V5--
tagged Argonaute2 (FLAG-V5-Ago2, for Ago-Tag). This cassette was placed under the control
of the cytomegalovirus:chicken actin fusion promoter (CAG) promoter and two transcription-
terminating STOP cassettes—Cre-dependent (LSL) and Flp-dependent (FNF). In the Tagger
transgene, protein coding cistrons were separated by sequence encoding the Porcine Tescho-
virus 2A peptide (P2A) and flexible linkers (GSGSG) for improved separation (Fig 1A and S1A
Fig). Because all but the terminal proline of the 2A peptide is retained on the C terminus of
upstream proteins, and because the C terminus of Ago2 is critical for its function [55], the con-
struct was designed to avoid a residual 2A peptide on FLAG-V5-Ago2 by placing it in the last
cistron. We had less concern for the remaining three components because C-terminal fusions
are functional [14,37,56]. We targeted the transgene to the Rosa26 locus, including a ubiqui-
tous CAG driver [57] followed by Flp- (FNF) and Cre-dependent (LSL) terminators (STOP
cassettes). The inclusion of two terminators enables transgene activation at the intersection of
cell populations expressing Cre and Flp driven by distinct promoters, to precisely target cells
based on combinations of cell identity markers or activity [22]. R26LK–thymidine kinase
(TK)-Tagger targeting vector and Tagger ORF were generated using molecular cloning and
gene synthesis. In the process, a fragment from Ai3 vector (a gift from Hongkui Zeng, plasmid
#22797, Addgene, Cambridge, MA), FNF cassette from pFNF vector (a gift from Robert Bene-
zra, plasmid #22687, Addgene, Cambridge, MA), and Ago2 sequence (a gift from Thomas
Tuschl, plasmid #10822, Addgene, Cambridge, MA) were used. For cloning of the homology
arms, first a fragment of Rosa26 locus was PCR amplified using genomic DNA of the 129S4
strain as a template and AGCGTGGTGGAGCCGTTCTG and AATGTGAATACACTTGTG
GTC (R26 homology F and R, respectively) primers. The obtained PCR product was cloned
Multiple levels of gene expression in specific cell types
PLOS Biology | https://doi.org/10.1371/journal.pbio.3000374 August 8, 2019 19 / 33
into pSC-A T/A vector (Agilent, Santa Clara, CA) and served as a template for PCR amplifica-
tion of respective homology arms, creating restriction overhangs. The homology junction was
positioned 3 nt upstream of the PAM sequence for the Cas9 sgRNA that subsequently was
used for gene targeting. A codon-optimized TK negative selection cassette was synthesized
(IDT, Coralville, IA) and inserted to generate the R26LK-TK (HTV) targeting vector. The
CMV-Tagger vector (Tagger ORF driven by CMV promoter) is available from Addgene (plas-
mid 129396).
Generation of Tagger knock-in mice and mouse breeding
Tagger expression cassette (in R26LK-TK-Tagger vector, details in S1A Fig) was targeted into
the Rosa26 safe harbor locus in V6.5 ES cells [58] using CRIPSR/Cas9, as described previously
[59]. In brief, 40 μg of HTV linearized with AscI was co-electroporated with 5 μg CRISPR/
Cas9 nickase plasmid pX335 (a gift from Feng Zhang, plasmid #42335, Addgene, Cambridge,
Massachusetts) encoding sgRNA targeting the homology junction. Correct genomic insertion
was verified by PCR across both homology regions (S1B Fig) following PCR screening for the
absence of pBlueScript vector backbone to confirm omega-type recombination, and only a sin-
gle insertion was present (S1C Fig). All PCR screens were repeated on genomic DNA of the
mice (S1B Fig). The targeted ES cells were injected in C57Bl/6NCrl (B6 hereafter) blastocysts
and transferred to pseudopregnant Crl:CD1 foster mothers. Male chimeric offspring were first
bred to B6 females. One chimera was determined to transmit the ES genome to all progeny
and was therefore subsequently bred to 129S4 (S4 hereafter) mice to establish the Tagger sys-
tem in a second genetic background. S4 was chosen because the ES cells are a hybrid of B6 and
S4, and it is our lab’s primary strain. Mice carrying both FNF and LSL cassettes (FL-Tagger)
were bred to Actb-Flpe mice on a B6 background [60] or to ROSA26-Flpo mice on the S4
background (line #007844, Jackson Labs, Bar Harbor, ME) [61]) to remove the FNF cassettes,
creating LSL-Tagger lines. All lines were back-crossed into S4 and B6 backgrounds for a total
of seven generations. Genome-wide analysis of 569 SNPs, 355 of which discriminate between
B6 and S4, indicated the final backgrounds: B6-FL-Tagger or B6.129S4-Gt(ROSA)26Sortm1Jaws
(98.6%), B6-LSL-Tagger or B6.129S4-Gt(ROSA)26Sortm1.1Jaws (97.5%), S4-FL-Tagger or 129S4.
B6-Gt(ROSA)26Sortm1Jaws (95.8%), and S4-LSL-Tagger or 129S4.B6-Gt(ROSA)26Sortm1.1Jaws
(97.8%). An SNP analysis at generation 3 revealed that the Tagger allele is embedded on the B6
chromosome 6. PGK-Cre [62], PV-Cre [26], Gad2-Cre [25], and vGluT2-Ires-Cre [24] mouse
lines were used to activate LSL-Tagger mice, the last 3 congenic for S4. Sequencing data were
acquired from Cre-Tagger mice on a mostly S4 background. The Tagger line with no stop cas-
settes (omni-Tagger or B6.129S4-Gt(ROSA)26Sortm1(Tag).2Jaws) was crossed seven generations
to B6 but not SNP analyzed. Efforts are underway to deposit the mice in a repository. Other-
wise, please email WSJ with the subject heading “Acq-Req-Tagger,” and the contents of the
message should indicate the specific version of Tagger requested. As part of the material trans-
fer agreement, Evrogen, the intellectual property owner of the mKate2 sequence, requires
recipients of Tagger materials to make an additional purchase of an Evrogen-owned plasmid
containing mKate2 sequence. This thwarted efforts to deposit the mouse line prior to publica-
tion of this manuscript. The authors have no financial or other connections with Evrogen.
Immunoblotting. Brain lysates were mixed with 4× lithium dodecyl sulfate (LDS) sample
buffer containing 40 mM DTT (lysates were diluted 1:3, and IP magnetic beads were resus-
pended in diluted sample buffer to obtain 1× final concentration) and denatured at 70˚C for
10 minutes prior to loading on 10% or 4%–12% NuPAGE Novex midi gels (Thermo Fisher,
Waltham, MA). Gels were run using MES [2-(N-morpholino)ethane sulfonic acid] running
buffer at 160 V (110 V for the first 10 minutes) and then were electro-transferred to
Multiple levels of gene expression in specific cell types
PLOS Biology | https://doi.org/10.1371/journal.pbio.3000374 August 8, 2019 20 / 33
nitrocellulose membrane (Bio-Rad, Hercules, CA) and submerged in transfer buffer (20%
methanol, 25 mM Tris-Cl, 0.19 M glycine) using a Criterion transfer tank (BioRad, Hercules,
CA), at 0.7 A for 70 minutes. Membranes were blocked (20–30 minutes at room temperature
[RT]) in 5% powdered milk in PBS-T (PBS with 0.05% Tween-20) and then incubated with
primary antibody diluted in blocking buffer overnight (O/N) at 4˚C. Next, blots were washed
4× with PBS-T and incubated with secondary antibody for 30–60 minutes at RT, followed by
5× PBS-T washes and imaging with the Li-Cor Odyssey imaging system (Li-Cor, Lincoln, NE).
For re-probing, membranes were stripped for 10 minutes with Re-Blot mild or strong solution
(EMD-Millipore, Burlington, MA), followed by extensive washing and re-blocking. Primary
antibodies were as follows: rabbit anti-Dicer1 (dil. 1:1,000, Sigma Aldrich, St. Louis, MO), rab-
bit anti-HA (H6980, dil. 1:1,000, Sigma Aldrich, St. Louis, MO), goat anti-V5 (ab95038, dil.
1:2,000, Abcam, Cambridge, United Kingdom), mouse anti-S6 (#2317, dil. 1:1,000, CST, Lei-
den, the Netherlands), mouse anti-Ago2 (H00027161-M01, dil. 1:1,000, Novus Biologicals,
Centennial, CO), and rabbit anti-β-actin (A2228, dil. 1:10,000, Sigma, St. Louis, MO). Second-
ary antibodies were as follows: donkey anti-rabbit IRDye 680RW (1:10,000, Li-Cor, Lincoln,
NE), donkey anti-mouse IRDye 800CW (dil. 1:20,000, Li-Cor, Lincoln, NE), and donkey anti-
goat IRDye 800CW (1:20,000, Li-Cor, Lincoln, NE).
Immunofluorescence
Mice were humanely killed with CO2 and then transcardially perfused with 10% formalin, and
the brains were postfixed for 2 days at 4˚C with gentle shaking. Forty-micrometer slices were
cut on a cryotome (Leica, Wetzlar, Germany) and stored in cryoprotectant in the freezer until
needed. Slices were washed in PBS, permeabilized for 1 hour at RT in blocking buffer (PBS
with 5% normal goat serum and 0.25% Triton X-100), and then incubated with primary anti-
body solution in probing buffer (approximately the same as blocking buffer but containing
10× less Triton X-100) O/N at 4˚C with gentle agitation. Then, sections were washed 3 × 10
minutes with PBS (DAPI was added during the second wash step to the final concentration of
0.1 μg/mL). After the last wash step, secondary antibody diluted in PBS with 5% normal goat
serum was added for an additional 1 hour of incubation. Finally, slices were washed (3 × 10
minutes) with PBS, each time with gentle agitation, and mounted using Vector hardset mount-
ing medium (Vector Laboratories, Burlingame, CA). For Gad67 staining, Triton X-100 was
not used at any step, and the primary antibody incubation was extended to 2–3 days and per-
formed at RT. Slices were imaged on the confocal microscope LSM 700 (Zeiss, Oberkochen,
Germany) using a 63× oil immersion objective. For images selected for publication, brightness
and contrast were uniformly enhanced using ImageJ. Primary antibodies were as follows: HA-
tag, 1:200 (3F10, Roche, Basel, Switzerland), parvalbumin, 1:200 (NB-120-11427, Novus Bio-
logicals, Centennial, CO); Satb2, 1:200 (ab92446, Abcam, Cambridge, UK); and Gad67, 1:800
(MAB5406, Millipore, Burlington, MA). Secondary antibodies (each used at 1:1,000) were as
follows: FITC goat anti-rabbit (FI-1000, Vector Laboratories, Burlingame, CA), DyLight-649
goat anti-rabbit (DI-1649, Vector Laboratories, Burlingame, CA), and DyLight-488 goat anti-
mouse (DI-2488, Vector Laboratories, Burlingame, CA).
Immunohistochemistry
Mice were humanely killed with CO2 and brains or retinas were carefully removed and immer-
sion fixed with 10% formalin. The brains were postfixed for 2 to 3 days at 4˚C with gentle shak-
ing. Brains were then embedded in paraffin, with each cassette containing both controls and
transgenic samples of interest to ensure identical staining. Cassettes were cut into 4-μm-thick
sections. Sections were dewaxed in xylene and rehydrated in graded dilutions of ethanol (each
Multiple levels of gene expression in specific cell types
PLOS Biology | https://doi.org/10.1371/journal.pbio.3000374 August 8, 2019 21 / 33
5 minutes). Epitope retrieval was performed with a steamer in 0.01 M citrate buffer. Endoge-
nous peroxidase was inactivated with H2O2 treatment (0.3%, 20 minutes). Primary antibodies
made in mice were detected with the Mouse on Mouse Elite Peroxidase Kit and NovaRED or
VIP substrates (PK-2200, SK-4800, and SK-4600, respectively, Vector Laboratories, Burlin-
game, CA), and primaries made in Rabbit were detected with the Vectstain ABC-AP kit and
Vector Black substrate (AK-5001 and SK-5200, respectively, Vector Laboratories, Burlingame,
CA), all used according to the manufacturer’s instructions. Double stains were performed by
processing the Rabbit antibody first, blocking free biotin groups with a blocking kit (SP-2002,
Vector Laboratories, Burlingame, CA), then proceeding with the mouse antibody. Pictures of
sections were made with an AxioCam camera mounted onto a AXIO Observer A1 microscope
with Zen 2012 software (Zeiss, Oberkochen, Germany). Primary antibodies were as follows:
rabbit RFP, 1:500 (R10367, Thermo Fisher, Waltham, MA); mouse V5-tag, 1:200 (R960-25);
and mouse HA-tag, 1:2,000 (HA7, Sigma, St Louis, MO).
Co-capturing of mRNA and mature miRNA
We previously modified our Ribo-Tag protocol to increase its specificity [63]. The procedure
involves preparation of 10% brain homogenate in an isotonic lysis buffer with detergent,
removing nuclei and cell debris by centrifugation to generate a supernatant fraction (hereafter
S1), then IP of intact ribosomes together with bound mRNA [10] (Fig 3A). Deep-frozen brain
tissue was used to prepare 10% (w/w) homogenate in PSB containing 50 mM Tris (pH 7.5),
100 mM KCl, 12 mM MgCl2 and 1% Nonidet P-40, 1 mM DTT, 100 U/mL Ribolock RNase
inhibitor, 100 μg/mL cycloheximide, and 1 tab/5 mL SigmaFast protease inhibitor cocktail
(with EDTA). One hemisphere was used per replicate, and homogenates were prepared in
Potter-Elvehjem homogenizers using a motorized (450 rpm) pestle and then cleared by centri-
fugation (10,000g/10 minutes/4˚C) to remove nuclei and cell debris and obtain the S1 superna-
tant. After removing 50 μL of sample for input RNA isolation, S1 was pre-cleared with Protein
G Dynabeads (PGDBs; Thermo Fisher, Waltham, MA) for 30 minutes at 4˚C on a rotator and
300 μL of S1 was incubated with 5 μg of HA 12CA5 mAb (Roche, Basel, Switzerland) at 4˚C
for 45–60 minutes on a rotator (Ribo-Tag sample), and the remainder of S1 was mixed with
PSB-equilibrated M2 Magnetic beads (Sigma, St. Louis, MO) and left for a 150-minute incuba-
tion in the same conditions (Ago-Tag sample). The Ribo-Tag sample was then transferred to a
prepared equivalent of 37.5 μL total bead suspension PGDB (PSB-equilibrated) and incubated
as above for an additional 100 minutes. Afterwards, both Ribo-Tag and Ago-Tag beads were
washed 3 × 5 minutes in High Salt Buffer (HSB) containing 50 mM Tris (pH 7.5), 300 mM
KCl, 12 mM MgCl2 and 1% Nonidet P-40, 1 mM DTT, 50 U/mL Ribolock RNase inhibitor
(Thermo Fisher, Waltham, MA), 100 μg/mL cycloheximide, and 1 tab/20 mL, and an addi-
tional 3 × 5 minutes in Extra High Salt Buffer (EHSB; identical to HSB but containing addi-
tional 300 mM NaCl). We found that increasing ionic strength, and thereby the stringency, of
the wash buffer did not reduce the yields (S4B Fig). During each wash, beads were rotated
gently at 4˚C. Following removal of the last wash solution, 700 μL Qiazol (Qiagen, Hilden,
Germany) was added and the beads were incubated for 15 minutes at RT with vigorous
(>1,000 rpm) agitation. RNA was extracted from Ago-Tag, Ribo-Tag, and input samples using
miRNeasy Micro kit (Qiagen, Hilden, Germany) and eluted with 14 μL (Ago-Tag) and 28 μL
water (Ribo-Tag and input samples).
TU-tagging
A 1 M solution of 4-TU (Sigma, St. Louis, MO) in DMSO was stored in small aliquots at
−20˚C. Within 30 minutes of subcutaneous injection, 4-TU solution was diluted 1:20 into 50
Multiple levels of gene expression in specific cell types
PLOS Biology | https://doi.org/10.1371/journal.pbio.3000374 August 8, 2019 22 / 33
mM HEPES, pH 8.8, prewarmed to 45˚C. Therefore, the working solution was maintained at
approximately 45˚C until it was loaded into a 1-mL syringe with a 25-gauge needle immedi-
ately prior to injection of 0.5 mL. Mice were humanely killed 5 hours later via CO2 asphyxia-
tion and brains were rapidly removed and frozen on dry ice. TU-Tagged RNA purification
started with S1 produced as done for Ribo-Tag samples. RNA was extracted with a phenol:cho-
loroform method, followed by purification with RNeasy mini columns (Qiagen, Hilden, Ger-
many). Approximately 100 μg of total RNA was fragmented with the fragmentation kit (NEB,
Ipswich, MA) and cleaned with the RNAeasy minelute kit (Qiagen, Hilden, Germany). Frag-
mented RNA was biotinylated as done in [64] using MTSEA-biotin-XX (Biotium, Fremont,
CA), and then free biotin was removed with two washes of chloroform and isopropanol pre-
cipitation. Biotinylated RNA was affinity purified with streptavidin-linked magnetic Dyna-
beads C1 (Thermo Fisher, Waltham, MA) in the manufacturer’s recommended buffers.
Affinity-purified RNA was eluted in binding and wash buffer supplemented with 1% 2-mer-
captoethanol and purified with RNeasy micro columns (Qiagen, Hilden, Germany). Unbound
RNA was purified by isopropanol precipitation. Ribosomal RNA was removed from affinity-
purified and unbound fractions using an RNAse H method described before [32].
Nuclei isolation
Mice were anesthetized and transcardially perfused with 4% PFA [39]. Brains were extracted
from skulls just prior to homogenization, which started 9 minutes post-perfusion. Except fixa-
tion time, all steps were done on ice or at 4˚C. Hemispheres were separated, placed on a Petri
dish filled with PBS, cut into 4–5 pieces with a scalpel, and transferred into a Dounce homoge-
nizer filled with homogenization buffer (2–2.5 mL per hemisphere) containing 120 mM Tris
(pH 7.5), 50 mM sucrose, 20 mM KCl, 5 mM MgCl2, 50 mM NH4Cl, 0.05% Nonidet P40, and
1 mM DTT. Tissue was homogenized by approximately 20 strokes with pestle A (loose) and
then between 40 and 50 strokes (slowly, not to damage nuclei) with pestle B (tight). Homoge-
nate was transferred into a 50-mL falcon tube through a 100-μm strainer, washed with an
additional 1 mL of homogenization buffer, and then distributed into 1.5-mL tubes for centrifu-
gation (400g/5 minutes). Pellets containing nuclei were resuspended in wash buffer (1× DPBS
[with Ca2+/Mg2+], 10 mM Tris [pH 7.5], 5 mM MgCl2, 1 mM DTT) and distributed further
into 1.5-mL tubes for antibody incubation in a wash buffer supplemented with 1% BSA and
3% normal goat serum (the same antibodies were used as in the case of the native procedure).
After 2 hours of incubation, nuclei were washed 3× with the same buffer, but without BSA and
normal goat serum. During each wash, nuclei were very carefully resuspended by gentle pipett-
ing and then centrifuged (400g/4 minutes). When using unconjugated primary antibodies,
nuclei were washed again 3× and incubated for 30 minutes with secondary antibody diluted in
the same buffer. During the last incubation, samples were labeled with DAPI (10–20 ng/mL)
for the last 10 minutes, washed 2–3× and filtered through a 70-μm strainer prior to FACS. If
using only native fluorescence, antibody incubation steps were skipped and the nuclei were
stained with DAPI, washed 2× with homogenization buffer containing 250 mM sucrose, and
then resuspended for FACS in wash buffer supplemented with 1% BSA.
Sequencing
MeDIP sequencing. DNA was isolated from FACS-sorted cell type–specific (Nuc-Tag+)
nuclei using the shearing method with a Bioruptor plus sonication device (cat. B01020001,
Diagenode, Denville, NJ) and purified using SureClean plus (cat. BIO-37048, Bioline,) as
described previously [34]. Samples containing 100 ng of DNA were end-repaired, ligated with
adapters (NEBNext Ultra II DNA Library Prep Kit for Illumina, cat. E7645, NEB, Ipswich,
Multiple levels of gene expression in specific cell types
PLOS Biology | https://doi.org/10.1371/journal.pbio.3000374 August 8, 2019 23 / 33
MA), and cleaned up using Agencourt AMPure XP beads (cat. A63881, Beckman Coulter,
Brea, CA). A total of 2 μL of each adapter ligated sample input (diluted 1:100) was used to esti-
mate the adapter ligation quality by qPCR. In brief, samples were mixed with index (#E7350,
NEB, Ipswich, MA), universal primers, SyBr dye, and 2X NEBNext Ultra II Q5 master mix
containing high fidelity DNA Polymerase (cat. M0544S, NEB, Ipswich, MA), and analyzed by
qPCR. End-repaired and adapter ligated DNA was used for the MeDIP reaction using a Meth-
ylated DNA IP kit (cat. D5101, Zymo Research, Irvine, CA) according to the manufacturer’s
protocol. Methylated DNA IPed samples were further amplified to prepare libraries for
sequencing. In brief, mid-log ct values were calculated for IPed samples using qPCR to deter-
mine the number of amplification cycles. Samples were mixed with the Q5 NEB Next master
mix, Index and Universal primer, and amplified for mid-log ct—2 PCR cycles. The libraries
were purified by SureClean (Bioline, London, UK) precipitation, resuspended in 10 mM Tris
(pH 8), and library sizes were checked using a bioanalyzer 2100 (Agilent, Santa Clara, CA).
Libraries were also checked for MeDIP enrichment by qPCR as described in [34]. Final librar-
ies were sequenced in Hiseq-2000 (Illumina, San Diego, CA) according to the manufacturer’s
protocol.
Ago-Tag RNAseq. For Ago-Tag sequencing, libraries were generated using TruSeq small
RNA library preparation kit (Illumina, San Diego, CA) following the manufacturer’s protocol.
In brief, 30 and 50 adapters were ligated on 1 μg total RNA. Reverse transcription of 6 μL
adapter-ligated RNA was carried out using 1 μL RNA RT primer, 2 μL 5× first strand buffer,
0.5 μL of 12.5 nM dNTP mix, 1 μL 100 mM DTT, 1 μL RNase inhibitor, and 1 μL SuperScript
II reverse transcriptase. DNA was amplified using PCR, and index primer was added. Samples
were pooled together, and cDNA construct was purified on 6% PAGE gel. After washing with
70% ethanol, libraries were resuspended in 10 μL of 10 mM Tris-HCl (pH 8.5). Libraries were
validated using a High sensitivity DNA bioanalyzer (Agilent, Santa Clara, CA) and sequenced
in Hiseq-2000 (Illumina, San Diego, CA).
Ribo-Tag sequencing. For Ribo-Tag sequencing, libraries were prepared using TruSeq
RNA Library Prep Kit v2 (RS-122-2001 and RS-122-2002, Illumina, San Diego, CA) following
the manufacturer protocol. Libraries were validated using Qubit 2.0 Fluorometer (Thermo
Fisher, Waltham, MA) and Bioanalyzer 2100 (Agilent, Santa Clara, CA). Quality-checked
libraries were sequenced in HiSeq2000 (Illumina, San Diego, CA).
TU-Tag RNAseq. RNA-seq libraries of 4-TU labeled samples were prepared using the
ScriptSeq V2 RNA-Seq Library Preparation Kit (cat. SSV21124, Illumina, San Diego, CA) fol-
lowing the manufacturer’s protocol. In brief, cDNA was synthesized using ScriptSeq cDNA
synthesis primer, StarScript AMV reverse transcriptase, and 100 mM DTT. The 30 end was
tagged using Terminal tagging premix and DNA polymerase. cDNA was purified using 1.8×AMPure XP, and libraries were PCR amplified by adding Illumina adapter sequence and an
index in the library. Final libraries were again purified with 1× Agencourt AMPure XP (cat.
A63881, Beckman Coulter, Brea, CA) and libraries were validated using Qubit 2.0 (Thermo
Fisher, Waltham, MA) and High sensitivity DNA bioanalyzer (Agilent, Santa Clara, CA).
Libraries were diluted to 2 nM for sequencing into HiSeq-2500 (Illumina, San Diego, CA).
Data analysis
For RNAseq and TU-tag RNAseq, reads were quality assessed using the FASTQC (v0.10.1)
and aligned to the mouse reference genome (mm10) with Bowtie2 (v2.0.2) using RSEM
(v1.2.29) with default parameters. First, the mouse reference genome was indexed using the
Ensembl annotations (v84) with rsem-prepare-reference from RSEM software. Next, rsem-cal-
culate-expression was used to align the reads and quantify the gene and isoform abundance.
Multiple levels of gene expression in specific cell types
PLOS Biology | https://doi.org/10.1371/journal.pbio.3000374 August 8, 2019 24 / 33
The output of rsem-calculate-expression gives separately the read count and transcripts per
million (TPM) value for each gene and isoform. MeDIP-seq data were analyzed as described
previously [34]. Briefly, reads were aligned to the mouse reference genome (mm10) using
Bowtie (v2.0.2), with default parameters allowing for 2 mismatches using seed alignment. Sub-
sequently, aligned reads were filtered for those that are high quality and either uniquely or
multi-mapped (MAPQ ! = [0, 2, 3, 4]). For the analysis of differentially methylated regions
(DMRs), the R package MEDIPS (v1.16.0) was used with BSgenome = BSgenome.Mmusculus.
UCSC.mm10, extend = 250, shift = 0, uniq = TRUE, window_size = 700, and minRow-
Sum = 35. Methylation was considered significant at FDR< 0.1 using the Benjamini–Hoch-
berg correction for multiple testing and |LFC|> 0.5. sRNA-seq data were analyzed using Oasis
2 [28]. In brief, the FASTQC tool was used for the assessment of raw reads quality. After
adapter trimming (TGGAATTCTCGGGTGCCAAGG), reads were filtered for a minimum
length of 15 and maximum length of 32 bp. Filtered reads were first aligned to mm10 tran-
scripts, including known miRNAs, novel miRNAs, piRNAs, snoRNAs, snRNAs, rRNAs, and
their families using STAR aligner, with no mismatches for reads of length 15–19 nucleotides
and allowing for 1 mismatch for the reads of length 20–32 nucleotides. Expression (counts) of
these sRNAs served as the basis for differential expression analysis with DESeq2 package
(v1.16.1) using the Oasis 2 pipeline. Preprocessed data can be found in S1 Data.
Differential expression, statistical analysis, and data visualization
Differential expression analysis was carried out using gene read counts with DESeq2 package
(v1.16.1) to produce LFC values and corresponding p-values (FDR) applying a Benjamini–
Hochberg correction for multiple testing [65]. The ranking metric for enrichment or depletion
of mRNA was calculated as follows: rnk = LFC�(−log(FDR)). Significance of gene list overlaps
(Venn diagrams in Figs 3F and 4F) was determined with a hypergeometric test (phyper R func-
tion). Significance of the correlation of Tagger data with SILAC protein turnover times from
[33] (Fig 5I) was performed using the Kruskal-Wallis test with post hoc Dunn test (please refer
to S2 Table). Heatmaps were made using TPM values or, in the case of small RNAseq, CPM
values using R pheatmap package. PCA analysis was performed using variance stabilizing
transformation (VST)-transformed normalized count data (calculated using DESeq2 package
[v1.16.1]) and visualized using ggplot2 (v3.1.0). Flow cytometry data were visualized using
FlowJo (v10.4.2). Bioanalyzer plots (Figs 3B, 4B and 5A) were made using Bioanalyzer 2100
Expert Software. Metagene plots were made using deepTools2 web server [66].
Multiphoton imaging
Cranial window surgery was conducted under anesthesia (ketamine/xylazine 0.13/0.01 mg/kg
body weight, i.p.) with a perioperative dose of an analgesic (buprenorphine hydrochloride 0.05
mg/kg body weight, s.c.). Additionally, mice received an immunosuppressive drug (dexameth-
asone 0.2 mg/kg, s.c.) to reduce swelling of the brain during the surgical procedure. Eyes were
covered with ointment (Bepanthen, Beyer, Leverkusen, Germany) to prevent drying. Mice
were head-fixed (MA-6N, Narishige, Tokyo, Japan), and a sufficiently deep anesthesia was
assured by testing the paw pinch withdrawal reflex. A heating pad was used to maintain body
temperature during the surgical procedure. The head was wiped with 70% ethanol using sterile
cotton swabs. Removing a triangular piece of the skin by surgical scissors exposed the skull.
The periosteum was carefully removed with a scalpel and the underlying bone was dried thor-
oughly before it was sealed by applying a layer of dental adhesive (OptiBond FL bottle kit,
Kerr, Rastatt, Germany). A circular piece of the bone above the right somatosensory cortex
was removed by first marking the position by using a biopsy punch (Ø 4 mm, pfm medical),
Multiple levels of gene expression in specific cell types
PLOS Biology | https://doi.org/10.1371/journal.pbio.3000374 August 8, 2019 25 / 33
and, second, carefully drilling along the marked line with a dental drill equipped with a
rounded drill head (H71.104.004, Gebr. Basseler, Lemgo, Germany). After rinsing the brain
surface with sterile PBS, the bone was replaced by a circular cover glass (DR3, thickness #1,
Engelbrecht, Edermunde, Germany), which was adhered to the bone by dental acrylic. A cus-
tom-made fixation adaptor was attached to the skull in a distance to the window to allow for
fixation of the mouse during imaging. The remaining bone was covered with light-curable
flowable composite (GRADIA DIRECT flo, GC, Leuven, Belgium). Imaging was carried out
directly after the cranial window surgery under a prolonged anesthesia using isoflurane (1%,
Actavis, New Jersey, USA). Mice were head-fixed to a custom-made frame and eyes were cov-
ered with ointment. A heating pad was used to maintain body temperature during the imaging
session. Images were acquired at a TrimScope II setup (La Vision Biotech, Bielefeld, Germany)
equipped with a Coherent Cameleon Ultra II two-photon laser (Coherent, Dieburg, Germany)
and a 16× water immersion objective with a numerical aperture of 0.8 (Nikon, Tokio, Japan).
Image acquisition was performed with ImspectorPro (La Vision Biotech, Bielefeld, Germany).
mKate2 was excited at 1100 nm. Fluorescence emission was filtered (BP575-610) and detected
by non-descanned detectors. Before and after the lesion, z-stacks were acquired, starting at the
surface of the cortex (300 μm depth; 3 μm z-spacing; x,y resolution of 0.38 μm/pixel). A laser
lesion (Ø approximately 50 μm) was set in a depth of 180 μm by focusing the full-powered
laser beam on one pixel lasting for 2 seconds. After the imaging session, mice were injected
with a lethal dose of pentobarbital (200 mg/kg body weight, i.p.) and perfused transcardially
with saline solution followed by 4% (w/v) paraformaldehyde in 0.1 M phosphate buffer. Brains
were removed and postfixed in 4% paraformaldehyde for 24 hours.
Supporting information
S1 Fig. Gene targeting and genotyping. (A) Detailed overview of the Tagger transgene and
gene targeting. Arrows correspond to PCR primers used for genotyping. (B, C, D, E) Genotyp-
ing results using primers depicted in A. (B) PCR across homology regions; (C) PCR across the
fragment containing STOP cassettes on DNA from not recombined (FL-Tagger), Flp-recom-
bined (LSL-Tagger), and active Tagger; (D) PCR for the vector backbone (validation that no
vector backbone integrated during gene targeting); (E) routine genotyping assay on homozy-
gous (TAG/TAG) and heterozygous (TAG/+) Tagger; +/+–wild type. Ago2, Argonaute2;
bGHpA, bovine growth hormone polyadenylation signal; CAG, chicken β-actin/CMV en-
hancer promoter element; CMV, cytomegalovirus; FL, FNF+LSL; FLAG, FLAG epitope tag;
Flp, flippase; FNF, FRT-NeoR-FRT STOP cassette; HA, hemagglutinin tag; LSL, LoxP-STO-
P-LoxP cassette; RFP, red fluorescent protein; NC, negative control; NLS, nuclear localization
signal; PC, positive control; P2A, Porcine Teschovirus 2A peptide; RISC, RNA-induced silenc-
ing complex; Rpl22, ribosomal protein 22; TgUPRT, T. gondii uracil phosphoribosyltransfer-
ase; V5, V5 epitope tag; WPRE, Woodchuck Hepatitis Virus Postranscriptional Response
Element; 2A, P2A self-processing peptide.
(PNG)
S2 Fig. Validation of Tagger expression in tissues and cells by multiple methods. (A)
Expression of Tagger in different tissues assessed by immunoblot, with anti-FLAG antibody
detecting the terminal component of the construct (Ago-Tag protein). Expression was
detected in multiple heterozygous (TAG/+) but not WT (+/+) tissues. (B) Expression of Tag-
ger in mouse retina, stained for V5 (Ago-Tag) in light purple. Dark brown tissue to the left is
naturally pigmented epithelial cells. (C) FFPE sections from original Ribo-Tag mice (top) and
Tagger mice (middle) immunostained for Rpl22 (HA); prefix “Omni-” refers to the ubiquitous
activation of the transgenes; FNF-Tagger (bottom) was used as a control. Overall expression
Multiple levels of gene expression in specific cell types
PLOS Biology | https://doi.org/10.1371/journal.pbio.3000374 August 8, 2019 26 / 33
between the two mouse lines was indistinguishable. (D) Immunoblot comparing expression
levels of Rpl22-HA protein in Tagger and in the original RiboTag mice; prefix “Omni-” refers
to the ubiquitous activation of the transgenes. (E) Immunofluorescence verification of expres-
sion specificity, using antibodies directed to cell type marker proteins (parvalbumin, Gad67,
and Satb2 for respectively PV, Gad2, and vGluT2 Taggers. RFP channel is endogenous fluores-
cence. (F) FACS analysis of natively isolated (unfixed) nuclei sorted using anti-HA antibodies
(detecting Ribo-Tag protein). Only the NeuN-positive population was shown. FACS, fluores-
cence activated cell sorting; FFPE, formalin fixed paraffin embedded; FNF, FRT-NeoR-FRT;
Gad2, glutamic acid decarboxylase 2; Gad67, glutamic acid decarboxylase 67; HA, hemaggluti-
nin; NeuN, neuronal nuclei; PV, parvalbumin; RFP, red fluorescent protein; Rpl22, ribosomal
protein 22; Satb2, special AT-rich sequence-binding protein 2; SSC, side scatter; vGluT2, vesic-
ular glutamate transporter 2; WT, wild-type.
(PNG)
S3 Fig. In vivo two-photon imaging. (A) Fluorescence of RFP-NLS expressing nuclei in the
cortex at different depths of an anesthetized mouse. (B) Experimental time line for monitoring
RFP-NLS expression using two-photon microscopy: imaging started directly after the cranial
window surgery, allowing unilateral access to the somatosensory cortex. Expression of
RFP-NLS was monitored immediately before and after a laser lesion for 240 minutes (every 5
minutes for 1 hour, every 10 minutes for 2 hours, and every 20 minutes for 1 hour). (C) Images
depicting RFP-NLS expression of the same population of nuclei before, immediately after (0,
5, 10 minutes), and long after (60, 120, 180, 240 minutes) laser lesion (red circle). Images are
maximum intensity projections (MIPs) of two z-sections with 3-μm z-steps and were acquired
at a depth of 180 μm. White circle surrounds the region of decreased RFP-NLS expression sur-
rounding the lesion, which increased in diameter during the 240 minutes after lesion. (D)
Enlarged excerpt of B (inset at 240 minutes) showing the fate of RFP-expressing nuclei close to
the site of lesion. Most of the nuclei kept their fluorescence (white arrow), while just a few
nuclei showed a compartmentalization (violet arrow). MIP, maximum intensity projection;
RFP-NLS, red fluorescent protein-nuclear localization signal.
(TIF)
S4 Fig. Optimization of combined Ribo-Tag and Ago-Tag procedures. (A) I–III, Agilent
bioanalyzer small RNA analysis of IP done with anti-HA (I), and anti-V5 (II) and anti-FLAG
(III) antibodies. Antibodies directed to Ago-Tag (V5 and FLAG) lead to the retention of miR-
NAs (marked with arrows). The anti-HA antibody leads to much higher levels of other types
of small RNAs included in the ribosomal complexes (small ribosomal RNA, tRNA, residual
pre-miRNA species, etc.) but retains no detectable mature miRNAs. IV, Comparison of Ago-
Tag IP done with anti-FLAG magnetic agarose (solid line trace) and a combination of anti-
FLAG antibody and PGDB (gray filled trace) shows no noticeable difference in performance.
(B) Ribo-Tag IP done with increasing stringency of wash buffer. (C) IP western blot of ribo-
somes and RISC. Rps6 and Ago2 coprecipitating with Rpl22-HA (top blot) and Dicer 1 and
endogenous Ago2 coprecipitating with FLAG-V5-Ago2 (bottom blot). Top and bottom blots
represent two different membranes loaded with equal amounts of the same samples. Ago2,
Argonaute 2; HA, hemagglutinin; IP, immunoprecipitation; miRNA, microRNA; PGDB, Pro-
tein G Dynabeads; RISC, RNA-induced silencing complex; Rpl22, large subunit ribosomal
protein 22; Rps6, small subunit ribosomal protein 6.
(TIF)
S5 Fig. TU-Tag reproducibility. (A) Comparison of two independent purifications using
TU-Tag. Heatmap is of Z-score calculated from TPM values, calculated as follows: Z = (x–
Multiple levels of gene expression in specific cell types
PLOS Biology | https://doi.org/10.1371/journal.pbio.3000374 August 8, 2019 27 / 33

mean(input))/SD(row), where SD is standard deviation. The complete set of TPM values
related to batch 1 in A can be found in S1 Data. (B) The same experimental batches in A com-
pared by PCA. Even though there is a batch effect, the variation between cell types is larger
than the observed variation between batches. PCA, principal component analysis; TPM, tran-
scripts per million.
(TIF)
S6 Fig. Juxtaposition of Ribo-Tag, TU-Tag, and Nuc-Tag. For each method, bars represent
LFC in Gad2 compared with vGluT2 samples. Only genes with |LFC| > 1 and FDR< 0.1 in all
methods were shown. FDR, false discovery rate; Gad2, glutamic acid decarboxylase 2; LFC,
Log2 fold change; vGluT2, vesicular glutamate transporter 2.
(TIF)
S1 Table. Cell type–enriched mRNAs used to validate the Ribo-Tag component of the Tag-
ger. The list was curated on the basis of the data obtained with the original RiboTag line
(named with no hyphen, whereas in Tagger the related name contains a hyphen), and the
obtained enriched genes fulfilling the criteria were post hoc validated for being previously
reported as cell type–specific/marker genes. We sought a list of cell type–enriched or–depleted
genes based on RiboTag data we produced for a separate project. Genes were chosen based on
relative abundance in RNA samples captured from vGlut2-, Gad2-, PV- and Cx43-Cre–acti-
vated RiboTag hemibrains, and the specific criteria mentioned above the table. The result was
that genes must be enriched or depleted in the context of whole brain samples to function as
markers. Many known markers are specific only in certain regions. For example, Calbindin2 is
specific to glutamatergic neurons in the cerebellum but is also expressed in GABAergic neu-
rons in other brain regions, so it does not qualify as a marker in our list. Several of the genes
qualifying as markers were already known markers or have been demonstrated by others to be
cell type specific. This list was only used as a means to examine the efficiency of Tagger. Cre,
causes recombination; Cx43, connexin 43; Gad2, glutamic acid decarboxylase 2; PV, parvalbu-
min; vGlut2, vesicular glutamate transporter 2.
(XLSX)
S2 Table. Small RNAseq mapping statistics. Percentages of Oasis 2 reads mapping [28] to dif-
ferent small RNA biotypes. The between 10- and 30-fold increase in miRNA mappings in Ago-
Tag samples (as compared with input) confirms that these samples are substantially enriched
for miRNAs. miRNA, microRNA; piwiRNA, Piwi interacting RNA; RNAseq, RNA sequencing;
rRNA, ribosomal RNA; snoRNA, small nucleolar RNA; snRNA, small nuclear RNA.
(XLSX)
S3 Table. Results of statistical analysis of data related to Fig 5I. Dunn (1964) Kruskal-Wallis
multiple comparison with p-values adjusted with the Benjamini-Hochberg method. All com-
parisons were significant.
(XLSX)
S4 Table. Resources used in this study.
(XLSX)
S1 Movie. In vivo two-photon imaging of RFP-NLS expression in proximity of laser-
lesioned brain tissue. RFP-NLS, red fluorescent protein-nuclear localization signal.
(AVI)
S1 Data. Raw NGS data. NGS, next generation sequencing.
(XLSX)
Multiple levels of gene expression in specific cell types
PLOS Biology | https://doi.org/10.1371/journal.pbio.3000374 August 8, 2019 28 / 33

Acknowledgments
We are grateful to Michael Cleary for providing UPRT cDNA, to Claudio Monetti for gene tar-
geting advice, to Anna-Lena Schutz and Ting Sun for deep sequencing technical assistance,
and to Alessandro Petese for genotyping and histology work. We also thank Susanne Bauer
and Maria Jonson for critical comments on the manuscript.
We dedicate this work to the memory of Martin Theis and Susan Lindquist, two extraordi-
nary mentors who we miss dearly.
Author Contributions
Conceptualization: Lech Kaczmarczyk, Stefanie Poll, Walker Scot Jackson.
Data curation: Lech Kaczmarczyk, Vikas Bansal, Ashish Rajput, Raza-ur Rahman, Stefanie
Poll.
Formal analysis: Lech Kaczmarczyk, Vikas Bansal, Ashish Rajput, Raza-ur Rahman, Stefanie
Poll, Stefan Bonn, Walker Scot Jackson.
Funding acquisition: Martin Fuhrmann, Stefan Bonn, Walker Scot Jackson.
Investigation: Lech Kaczmarczyk, Vikas Bansal, Ashish Rajput, Raza-ur Rahman, Stefanie
Poll, Walker Scot Jackson.
Methodology: Lech Kaczmarczyk, Vikas Bansal, Wiesław Krzyżak, Joachim Degen, Stefanie
Poll, Martin Fuhrmann, Stefan Bonn, Walker Scot Jackson.
Project administration: Stefan Bonn, Walker Scot Jackson.
Resources: Martin Fuhrmann, Stefan Bonn.
Software: Vikas Bansal, Ashish Rajput, Raza-ur Rahman, Stefan Bonn.
Supervision: Lech Kaczmarczyk, Martin Fuhrmann, Stefan Bonn, Walker Scot Jackson.
Validation: Lech Kaczmarczyk, Walker Scot Jackson.
Visualization: Lech Kaczmarczyk, Vikas Bansal, Stefanie Poll.
Writing – original draft: Lech Kaczmarczyk, Walker Scot Jackson.
Writing – review & editing: Lech Kaczmarczyk, Stefanie Poll, Stefan Bonn, Walker Scot
Jackson.
References1. Levine M, Davidson EH. Gene regulatory networks for development. Proc Natl Acad Sci U S A. 2005;
102(14):4936–42. Epub 2005/03/25. https://doi.org/10.1073/pnas.0408031102 PMID: 15788537;
PubMed Central PMCID: PMCPMC555974.
2. Alberts B. Molecular biology of the cell. Sixth edition. ed. New York, NY: Garland Science, Taylor and
Francis Group; 2015. 1 volume (various pagings) p.
3. Hershey JWB, Sonenberg N, Mathews MB. Principles of Translational Control. Cold Spring Harb Per-
spect Biol. 2018. Epub 2018/07/01. https://doi.org/10.1101/cshperspect.a032607 PMID: 29959195.
4. Selbach M, Schwanhausser B, Thierfelder N, Fang Z, Khanin R, Rajewsky N. Widespread changes in
protein synthesis induced by microRNAs. Nature. 2008; 455(7209):58–63. Epub 2008/08/01. https://
doi.org/10.1038/nature07228 PMID: 18668040.
5. Bartel DP. Metazoan MicroRNAs. Cell. 2018; 173(1):20–51. Epub 2018/03/24. https://doi.org/10.1016/
j.cell.2018.03.006 PMID: 29570994; PubMed Central PMCID: PMCPMC6091663.
6. Andersen RE, Lim DA. Forging our understanding of lncRNAs in the brain. Cell Tissue Res. 2018; 371
(1):55–71. Epub 2017/10/29. https://doi.org/10.1007/s00441-017-2711-z PMID: 29079882.
Multiple levels of gene expression in specific cell types
PLOS Biology | https://doi.org/10.1371/journal.pbio.3000374 August 8, 2019 29 / 33

7. Kung JT, Colognori D, Lee JT. Long noncoding RNAs: past, present, and future. Genetics. 2013; 193
(3):651–69. Epub 2013/03/07. https://doi.org/10.1534/genetics.112.146704 PMID: 23463798; PubMed
Central PMCID: PMCPMC3583990.
8. Kaczmarczyk L, Jackson WS. Astonishing advances in mouse genetic tools for biomedical research.
Swiss Med Wkly. 2015; 145:w14186. Epub 2015/10/30. https://doi.org/10.4414/smw.2015.14186
PMID: 26513700.
9. Doyle JP, Dougherty JD, Heiman M, Schmidt EF, Stevens TR, Ma G, et al. Application of a translational
profiling approach for the comparative analysis of CNS cell types. Cell. 2008; 135(4):749–62. Epub
2008/11/18. https://doi.org/10.1016/j.cell.2008.10.029 PMID: 19013282; PubMed Central PMCID:
PMCPMC2763427.
10. Sanz E, Yang L, Su T, Morris DR, McKnight GS, Amieux PS. Cell-type-specific isolation of ribosome-
associated mRNA from complex tissues. Proc Natl Acad Sci U S A. 2009; 106(33):13939–44. Epub
2009/08/12. https://doi.org/10.1073/pnas.0907143106 PMID: 19666516; PubMed Central PMCID:
PMCPMC2728999.
11. He M, Liu Y, Wang X, Zhang MQ, Hannon GJ, Huang ZJ. Cell-type-based analysis of microRNA profiles
in the mouse brain. Neuron. 2012; 73(1):35–48. Epub 2012/01/17. https://doi.org/10.1016/j.neuron.
2011.11.010 PMID: 22243745; PubMed Central PMCID: PMCPMC3270494.
12. Schaefer A, Im HI, Veno MT, Fowler CD, Min A, Intrator A, et al. Argonaute 2 in dopamine 2 receptor-
expressing neurons regulates cocaine addiction. J Exp Med. 2010; 207(9):1843–51. Epub 2010/07/21.
https://doi.org/10.1084/jem.20100451 PMID: 20643829; PubMed Central PMCID: PMCPMC2931161.
13. Gay L, Karfilis KV, Miller MR, Doe CQ, Stankunas K. Applying thiouracil tagging to mouse transcriptome
analysis. Nat Protoc. 2014; 9(2):410–20. Epub 2014/01/25. https://doi.org/10.1038/nprot.2014.023
PMID: 24457332; PubMed Central PMCID: PMCPMC4112099.
14. Gay L, Miller MR, Ventura PB, Devasthali V, Vue Z, Thompson HL, et al. Mouse TU tagging: a chemi-
cal/genetic intersectional method for purifying cell type-specific nascent RNA. Genes Dev. 2013; 27
(1):98–115. Epub 2013/01/12. https://doi.org/10.1101/gad.205278.112 PMID: 23307870; PubMed Cen-
tral PMCID: PMCPMC3553287.
15. Mo A, Mukamel EA, Davis FP, Luo C, Henry GL, Picard S, et al. Epigenomic Signatures of Neuronal
Diversity in the Mammalian Brain. Neuron. 2015; 86(6):1369–84. Epub 2015/06/19. https://doi.org/10.
1016/j.neuron.2015.05.018 PMID: 26087164; PubMed Central PMCID: PMCPMC4499463.
16. Mellen M, Ayata P, Dewell S, Kriaucionis S, Heintz N. MeCP2 binds to 5hmC enriched within active
genes and accessible chromatin in the nervous system. Cell. 2012; 151(7):1417–30. Epub 2012/12/25.
https://doi.org/10.1016/j.cell.2012.11.022 PMID: 23260135; PubMed Central PMCID:
PMCPMC3653293.
17. Jiang Y, Matevossian A, Huang HS, Straubhaar J, Akbarian S. Isolation of neuronal chromatin from
brain tissue. BMC Neurosci. 2008; 9:42. Epub 2008/04/30. https://doi.org/10.1186/1471-2202-9-42
PMID: 18442397; PubMed Central PMCID: PMCPMC2377267.
18. Roh HC, Tsai LT, Lyubetskaya A, Tenen D, Kumari M, Rosen ED. Simultaneous Transcriptional and
Epigenomic Profiling from Specific Cell Types within Heterogeneous Tissues In Vivo. Cell Rep. 2017;
18(4):1048–61. Epub 2017/01/26. https://doi.org/10.1016/j.celrep.2016.12.087 PMID: 28122230;
PubMed Central PMCID: PMCPMC5291126.
19. Szymczak AL, Workman CJ, Wang Y, Vignali KM, Dilioglou S, Vanin EF, et al. Correction of multi-gene
deficiency in vivo using a single ’self-cleaving’ 2A peptide-based retroviral vector. Nat Biotechnol. 2004;
22(5):589–94. Epub 2004/04/06. https://doi.org/10.1038/nbt957 PMID: 15064769.
20. Kim JH, Lee SR, Li LH, Park HJ, Park JH, Lee KY, et al. High cleavage efficiency of a 2A peptide derived
from porcine teschovirus-1 in human cell lines, zebrafish and mice. PLoS ONE. 2011; 6(4):e18556.
Epub 2011/05/24. https://doi.org/10.1371/journal.pone.0018556 PMID: 21602908; PubMed Central
PMCID: PMCPMC3084703.
21. Madisen L, Zwingman TA, Sunkin SM, Oh SW, Zariwala HA, Gu H, et al. A robust and high-throughput
Cre reporting and characterization system for the whole mouse brain. Nat Neurosci. 2010; 13(1):133–
40. Epub 2009/12/22. https://doi.org/10.1038/nn.2467 PMID: 20023653; PubMed Central PMCID:
PMCPMC2840225.
22. Madisen L, Garner AR, Shimaoka D, Chuong AS, Klapoetke NC, Li L, et al. Transgenic mice for inter-
sectional targeting of neural sensors and effectors with high specificity and performance. Neuron. 2015;
85(5):942–58. Epub 2015/03/06. https://doi.org/10.1016/j.neuron.2015.02.022 PMID: 25741722;
PubMed Central PMCID: PMCPMC4365051.
23. Liu Z, Chen O, Wall JBJ, Zheng M, Zhou Y, Wang L, et al. Systematic comparison of 2A peptides for
cloning multi-genes in a polycistronic vector. Sci Rep. 2017; 7(1):2193. Epub 2017/05/21. https://doi.
org/10.1038/s41598-017-02460-2 PMID: 28526819; PubMed Central PMCID: PMCPMC5438344.
Multiple levels of gene expression in specific cell types
PLOS Biology | https://doi.org/10.1371/journal.pbio.3000374 August 8, 2019 30 / 33
24. Vong L, Ye C, Yang Z, Choi B, Chua S Jr., Lowell BB. Leptin action on GABAergic neurons prevents
obesity and reduces inhibitory tone to POMC neurons. Neuron. 2011; 71(1):142–54. Epub 2011/07/13.
https://doi.org/10.1016/j.neuron.2011.05.028 PMID: 21745644; PubMed Central PMCID:
PMCPMC3134797.
25. Taniguchi H, He M, Wu P, Kim S, Paik R, Sugino K, et al. A resource of Cre driver lines for genetic tar-
geting of GABAergic neurons in cerebral cortex. Neuron. 2011; 71(6):995–1013. Epub 2011/09/29.
https://doi.org/10.1016/j.neuron.2011.07.026 PMID: 21943598; PubMed Central PMCID:
PMCPMC3779648.
26. Hippenmeyer S, Vrieseling E, Sigrist M, Portmann T, Laengle C, Ladle DR, et al. A developmental
switch in the response of DRG neurons to ETS transcription factor signaling. PLoS Biol. 2005; 3(5):
e159. Epub 2005/04/20. https://doi.org/10.1371/journal.pbio.0030159 PMID: 15836427; PubMed Cen-
tral PMCID: PMCPMC1084331.
27. Love MI, Huber W, Anders S. Moderated estimation of fold change and dispersion for RNA-seq data
with DESeq2. Genome Biol. 2014; 15(12):550. Epub 2014/12/18. https://doi.org/10.1186/s13059-014-
0550-8 PMID: 25516281; PubMed Central PMCID: PMCPMC4302049.
28. Rahman RU, Gautam A, Bethune J, Sattar A, Fiosins M, Magruder DS, et al. Oasis 2: improved online
analysis of small RNA-seq data. BMC Bioinformatics. 2018; 19(1):54. Epub 2018/02/16. https://doi.org/
10.1186/s12859-018-2047-z PMID: 29444641; PubMed Central PMCID: PMCPMC5813365.
29. Muhar M, Ebert A, Neumann T, Umkehrer C, Jude J, Wieshofer C, et al. SLAM-seq defines direct gene-
regulatory functions of the BRD4-MYC axis. Science. 2018; 360(6390):800–5. Epub 2018/04/07.
https://doi.org/10.1126/science.aao2793 PMID: 29622725.
30. Piwecka M, Glazar P, Hernandez-Miranda LR, Memczak S, Wolf SA, Rybak-Wolf A, et al. Loss of a
mammalian circular RNA locus causes miRNA deregulation and affects brain function. Science. 2017;
357(6357). Epub 2017/08/12. https://doi.org/10.1126/science.aam8526 PMID: 28798046.
31. Kleaveland B, Shi CY, Stefano J, Bartel DP. A Network of Noncoding Regulatory RNAs Acts in the
Mammalian Brain. Cell. 2018; 174(2):350–62 e17. Epub 2018/06/12. https://doi.org/10.1016/j.cell.
2018.05.022 PMID: 29887379.
32. Adiconis X, Borges-Rivera D, Satija R, DeLuca DS, Busby MA, Berlin AM, et al. Comparative analysis
of RNA sequencing methods for degraded or low-input samples. Nat Methods. 2013; 10(7):623–9.
Epub 2013/05/21. https://doi.org/10.1038/nmeth.2483 PMID: 23685885; PubMed Central PMCID:
PMCPMC3821180.
33. Heo S, Diering GH, Na CH, Nirujogi RS, Bachman JL, Pandey A, et al. Identification of long-lived synap-
tic proteins by proteomic analysis of synaptosome protein turnover. Proc Natl Acad Sci U S A. 2018;
115(16):E3827–E36. Epub 2018/04/04. https://doi.org/10.1073/pnas.1720956115 PMID: 29610302;
PubMed Central PMCID: PMCPMC5910858.
34. Halder R, Hennion M, Vidal RO, Shomroni O, Rahman RU, Rajput A, et al. DNA methylation changes in
plasticity genes accompany the formation and maintenance of memory. Nat Neurosci. 2016; 19
(1):102–10. Epub 2015/12/15. https://doi.org/10.1038/nn.4194 PMID: 26656643.
35. Susaki EA, Tainaka K, Perrin D, Kishino F, Tawara T, Watanabe TM, et al. Whole-brain imaging with
single-cell resolution using chemical cocktails and computational analysis. Cell. 2014; 157(3):726–39.
Epub 2014/04/22. https://doi.org/10.1016/j.cell.2014.03.042 PMID: 24746791.
36. Bonn S, Zinzen RP, Perez-Gonzalez A, Riddell A, Gavin AC, Furlong EE. Cell type-specific chromatin
immunoprecipitation from multicellular complex samples using BiTS-ChIP. Nat Protoc. 2012; 7(5):978–
94. Epub 2012/04/28. https://doi.org/10.1038/nprot.2012.049 PMID: 22538849.
37. Shcherbo D, Murphy CS, Ermakova GV, Solovieva EA, Chepurnykh TV, Shcheglov AS, et al. Far-red
fluorescent tags for protein imaging in living tissues. Biochem J. 2009; 418(3):567–74. Epub 2009/01/
16. https://doi.org/10.1042/BJ20081949 PMID: 19143658; PubMed Central PMCID:
PMCPMC2893397.
38. Ito S, Magalska A, Alcaraz-Iborra M, Lopez-Atalaya JP, Rovira V, Contreras-Moreira B, et al. Loss of
neuronal 3D chromatin organization causes transcriptional and behavioural deficits related to serotoner-
gic dysfunction. Nat Commun. 2014; 5:4450. Epub 2014/07/19. https://doi.org/10.1038/ncomms5450
PMID: 25034090.
39. Marion-Poll L, Montalban E, Munier A, Herve D, Girault JA. Fluorescence-activated sorting of fixed
nuclei: a general method for studying nuclei from specific cell populations that preserves post-transla-
tional modifications. Eur J Neurosci. 2014; 39(7):1234–44. Epub 2014/04/10. https://doi.org/10.1111/
ejn.12506 PMID: 24713002.
40. Timney BL, Raveh B, Mironska R, Trivedi JM, Kim SJ, Russel D, et al. Simple rules for passive diffusion
through the nuclear pore complex. J Cell Biol. 2016; 215(1):57–76. Epub 2016/10/05. https://doi.org/10.
1083/jcb.201601004 PMID: 27697925; PubMed Central PMCID: PMCPMC5057280.
Multiple levels of gene expression in specific cell types
PLOS Biology | https://doi.org/10.1371/journal.pbio.3000374 August 8, 2019 31 / 33

41. Tasic B, Menon V, Nguyen TN, Kim TK, Jarsky T, Yao Z, et al. Adult mouse cortical cell taxonomy
revealed by single cell transcriptomics. Nat Neurosci. 2016; 19(2):335–46. Epub 2016/01/05. https://
doi.org/10.1038/nn.4216 PMID: 26727548; PubMed Central PMCID: PMCPMC4985242.
42. Fu H, Hardy J, Duff KE. Selective vulnerability in neurodegenerative diseases. Nat Neurosci. 2018; 21
(10):1350–8. Epub 2018/09/27. https://doi.org/10.1038/s41593-018-0221-2 PMID: 30250262; PubMed
Central PMCID: PMCPMC6360529.
43. Jackson WS. Selective vulnerability to neurodegenerative disease: the curious case of Prion Protein.
Dis Model Mech. 2014; 7(1):21–9. Epub 2014/01/08. https://doi.org/10.1242/dmm.012146 PMID:
24396151; PubMed Central PMCID: PMCPMC3882045.
44. Lee TI, Young RA. Transcriptional regulation and its misregulation in disease. Cell. 2013; 152(6):1237–
51. Epub 2013/03/19. https://doi.org/10.1016/j.cell.2013.02.014 PMID: 23498934; PubMed Central
PMCID: PMCPMC3640494.
45. Kapur M, Monaghan CE, Ackerman SL. Regulation of mRNA Translation in Neurons-A Matter of Life
and Death. Neuron. 2017; 96(3):616–37. Epub 2017/11/03. https://doi.org/10.1016/j.neuron.2017.09.
057 PMID: 29096076; PubMed Central PMCID: PMCPMC5693308.
46. Sharma S, Lu HC. microRNAs in Neurodegeneration: Current Findings and Potential Impacts. J Alzhei-
mers Dis Parkinsonism. 2018; 8(1). Epub 2018/06/05. https://doi.org/10.4172/2161-0460.1000420
PMID: 29862137; PubMed Central PMCID: PMCPMC5976447.
47. Friedrich G, Soriano P. Promoter traps in embryonic stem cells: a genetic screen to identify and mutate
developmental genes in mice. Genes Dev. 1991; 5(9):1513–23. Epub 1991/09/01. https://doi.org/10.
1101/gad.5.9.1513 PMID: 1653172.
48. Taylor RW, Turnbull DM. Mitochondrial DNA mutations in human disease. Nat Rev Genet. 2005; 6
(5):389–402. Epub 2005/04/30. https://doi.org/10.1038/nrg1606 PMID: 15861210; PubMed Central
PMCID: PMCPMC1762815.
49. Golpich M, Amini E, Mohamed Z, Azman Ali R, Mohamed Ibrahim N, Ahmadiani A. Mitochondrial Dys-
function and Biogenesis in Neurodegenerative diseases: Pathogenesis and Treatment. CNS Neurosci
Ther. 2017; 23(1):5–22. Epub 2016/11/23. https://doi.org/10.1111/cns.12655 PMID: 27873462.
50. Herzog VA, Reichholf B, Neumann T, Rescheneder P, Bhat P, Burkard TR, et al. Thiol-linked alkylation
of RNA to assess expression dynamics. Nat Methods. 2017; 14(12):1198–204. Epub 2017/09/26.
https://doi.org/10.1038/nmeth.4435 PMID: 28945705; PubMed Central PMCID: PMCPMC5712218.
51. Schofield JA, Duffy EE, Kiefer L, Sullivan MC, Simon MD. TimeLapse-seq: adding a temporal dimen-
sion to RNA sequencing through nucleoside recoding. Nat Methods. 2018; 15(3):221–5. Epub 2018/01/
23. https://doi.org/10.1038/nmeth.4582 PMID: 29355846; PubMed Central PMCID:
PMCPMC5831505.
52. Ziegenhain C, Vieth B, Parekh S, Reinius B, Guillaumet-Adkins A, Smets M, et al. Comparative Analysis
of Single-Cell RNA Sequencing Methods. Mol Cell. 2017; 65(4):631–43 e4. Epub 2017/02/19. https://
doi.org/10.1016/j.molcel.2017.01.023 PMID: 28212749.
53. Magger O, Waldman YY, Ruppin E, Sharan R. Enhancing the prioritization of disease-causing genes
through tissue specific protein interaction networks. PLoS Comput Biol. 2012; 8(9):e1002690. Epub
2012/10/03. https://doi.org/10.1371/journal.pcbi.1002690 PMID: 23028288; PubMed Central PMCID:
PMCPMC3459874.
54. Mizuguchi H, Xu Z, Ishii-Watabe A, Uchida E, Hayakawa T. IRES-dependent second gene expression
is significantly lower than cap-dependent first gene expression in a bicistronic vector. Mol Ther. 2000; 1
(4):376–82. Epub 2000/08/10. https://doi.org/10.1006/mthe.2000.0050 PMID: 10933956.
55. Lian SL, Li S, Abadal GX, Pauley BA, Fritzler MJ, Chan EK. The C-terminal half of human Ago2 binds to
multiple GW-rich regions of GW182 and requires GW182 to mediate silencing. RNA. 2009; 15(5):804–
13. Epub 2009/03/28. https://doi.org/10.1261/rna.1229409 PMID: 19324964; PubMed Central PMCID:
PMCPMC2673069.
56. Meister G, Landthaler M, Patkaniowska A, Dorsett Y, Teng G, Tuschl T. Human Argonaute2 mediates
RNA cleavage targeted by miRNAs and siRNAs. Mol Cell. 2004; 15(2):185–97. Epub 2004/07/21.
https://doi.org/10.1016/j.molcel.2004.07.007 PMID: 15260970.
57. Niwa H, Yamamura K, Miyazaki J. Efficient selection for high-expression transfectants with a novel
eukaryotic vector. Gene. 1991; 108(2):193–9. Epub 1991/12/15. https://doi.org/10.1016/0378-1119(91)
90434-d PMID: 1660837.
58. Eggan K, Rode A, Jentsch I, Samuel C, Hennek T, Tintrup H, et al. Male and female mice derived from
the same embryonic stem cell clone by tetraploid embryo complementation. Nat Biotechnol. 2002; 20
(5):455–9. Epub 2002/05/01. https://doi.org/10.1038/nbt0502-455 PMID: 11981557.
59. Kaczmarczyk L, Mende Y, Zevnik B, Jackson WS. Manipulating the Prion Protein Gene Sequence and
Expression Levels with CRISPR/Cas9. PLoS ONE. 2016; 11(4):e0154604. Epub 2016/04/30. https://
doi.org/10.1371/journal.pone.0154604 PMID: 27128441; PubMed Central PMCID: PMCPMC4851410.
Multiple levels of gene expression in specific cell types
PLOS Biology | https://doi.org/10.1371/journal.pbio.3000374 August 8, 2019 32 / 33
60. Rodriguez CI, Buchholz F, Galloway J, Sequerra R, Kasper J, Ayala R, et al. High-efficiency deleter
mice show that FLPe is an alternative to Cre-loxP. Nat Genet. 2000; 25(2):139–40. Epub 2000/06/03.
https://doi.org/10.1038/75973 PMID: 10835623.
61. Raymond CS, Soriano P. High-efficiency FLP and PhiC31 site-specific recombination in mammalian
cells. PLoS ONE. 2007; 2(1):e162. Epub 2007/01/18. https://doi.org/10.1371/journal.pone.0000162
PMID: 17225864; PubMed Central PMCID: PMCPMC1764711.
62. Lallemand Y, Luria V, Haffner-Krausz R, Lonai P. Maternally expressed PGK-Cre transgene as a tool
for early and uniform activation of the Cre site-specific recombinase. Transgenic Res. 1998; 7(2):105–
12. Epub 1998/06/03. PMID: 9608738.
63. Xie K, Ryan DP, Pearson BL, Henzel KS, Neff F, Vidal RO, et al. Epigenetic alterations in longevity reg-
ulators, reduced life span, and exacerbated aging-related pathology in old father offspring mice. Proc
Natl Acad Sci U S A. 2018; 115(10):E2348–E57. Epub 2018/02/23. https://doi.org/10.1073/pnas.
1707337115 PMID: 29467291; PubMed Central PMCID: PMCPMC5877957.
64. Duffy EE, Simon MD. Enriching s(4) U-RNA Using Methane Thiosulfonate (MTS) Chemistry. Curr Pro-
toc Chem Biol. 2016; 8(4):234–50. Epub 2016/12/08. https://doi.org/10.1002/cpch.12 PMID: 27925666;
PubMed Central PMCID: PMCPMC5161349.
65. Xiao Y, Hsiao TH, Suresh U, Chen HI, Wu X, Wolf SE, et al. A novel significance score for gene selec-
tion and ranking. Bioinformatics. 2014; 30(6):801–7. Epub 2012/02/11. https://doi.org/10.1093/
bioinformatics/btr671 PMID: 22321699; PubMed Central PMCID: PMCPMC3957066.
66. Ramirez F, Ryan DP, Gruning B, Bhardwaj V, Kilpert F, Richter AS, et al. deepTools2: a next generation
web server for deep-sequencing data analysis. Nucleic Acids Res. 2016; 44(W1):W160–5. Epub 2016/
04/16. https://doi.org/10.1093/nar/gkw257 PMID: 27079975; PubMed Central PMCID:
PMCPMC4987876.
Multiple levels of gene expression in specific cell types
PLOS Biology | https://doi.org/10.1371/journal.pbio.3000374 August 8, 2019 33 / 33